Article

Performance Evaluation of Federated Learning for Residential Energy Forecasting

Department of Information Engineering, University of Pisa, Largo Lucio Lazzarino, 1, 56122 Pisa, Italy
*
Author to whom correspondence should be addressed.
IoT 2022, 3(3), 381-397; https://doi.org/10.3390/iot3030021
Submission received: 30 July 2022 / Revised: 31 August 2022 / Accepted: 13 September 2022 / Published: 19 September 2022
(This article belongs to the Special Issue Advanced Quality of Service Approaches in Edge Computing)

Abstract

:
Short-term energy-consumption forecasting plays an important role in the planning of energy production, transportation and distribution. With the widespread adoption of decentralised self-generating energy systems in residential communities, short-term load forecasting is expected to be performed in a distributed manner to preserve privacy and ensure timely feedback to perform reconfiguration of the distribution network. In this context, edge computing is expected to be an enabling technology to ensure decentralized data collection, management, processing and delivery. At the same time, federated learning is an emerging paradigm that fits naturally in such an edge-computing environment, providing an AI-powered and privacy-preserving solution for time-series forecasting. In this paper, we present a performance evaluation of different federated-learning configurations resulting in different privacy levels to the forecast residential energy consumption with data collected by real smart meters. To this aim, different experiments are run using Flower (a popular federated learning framework) and real energy consumption data. Our results allow us to demonstrate the feasibility of such an approach and to study the trade-off between data privacy and the accuracy of the prediction, which characterizes the quality of service of the system for the final users.

1. Introduction

Short-term energy-consumption forecasting will represent a crucial functionality for the management of the future energy grid infrastructure. An accurate energy demand prediction is essential to accurately plan energy production and transportation, which is crucial for the grid management, especially in the future energy infrastructure characterized by a large share of renewable energy sources with variable production [1].
An accurate energy-consumption forecast for the next 48 h for households, offices and industrial plants, could be used to increase the power system stability by minimizing the peaks of demand: an inactivation system, e.g., by dynamically varying the energy price, can be introduced to foster the usage of energy demanding appliances/industrial equipment when the most renewable energy is being generated, and an automated management system for electric vehicles can be introduced to schedule their charge only in periods with low-energy consumption.
Energy consumption prediction requires the analysis of both real-time and historical consumption data. The collection of energy consumption readings in real time is usually performed by smart meters, i.e., connected power meters that can communicate their readings to a cloud platform, for instance. On the cloud platform, a machine-learning (ML) service could analyse the data and predict future energy consumption as was already demonstrated to be effective in [2]. Energy consumption data, however, is sensitive data as it can disclose sensitive and personal information that could be used maliciously. Household energy consumption data could reveal periods in which nobody is at home, while warehouse energy consumption could disclose additional information about production quantities or production processes.
For this reason, a cloud-based solution where data is continuously offloaded to an external system through an internet connection is not desirable as it exposes personal data to external threats and attacks. In order to implement future energy management systems, we have the need for energy forecast solutions that preserve privacy while still providing the prediction information that is crucial for energy production configuration or appliance optimization. Towards this direction, recently, two computing paradigms have been introduced: edge computing and federated learning.
Edge computing is a novel computing architecture that goes beyond the centralized cloud-based architecture by installing an intermediate computing layer, the fog/edge-computing layer [3]. Fog/edge-computing nodes are installed in the proximity of (or co-located with) the cyberphysical systems to support the deployment of applications and data analysis services that have latency and privacy requirements. Privacy, in particular, is preserved with Fog/Edge computing as sensitive data can be analysed on Fog/Edge nodes, i.e., in systems placed on the same infrastructure of the data owners, thus, allowing the implementation of data analysis processes that do not require transmission to external systems. For instance, an ML based predictor could be deployed at the edge to analyse energy consumption data and predict future demand from a single household.
ML solutions, however, still require a training phase that is usually performed in a cloud-based environment, which can provide storage and computing capabilities to analyse large historical data. In order to avoid this practice, data security can be further enforced by adopting federated learning (FL) [4,5], a novel ML technique that trains models across multiple decentralized edge devices. With FL, each edge device can train on a local dataset and transmit to a centralized server only the trained model and not the data. The centralized server can exploit the different trained models from the edge devices to create a global model with higher confidence, which eventually can be transmitted back to each edge device for data analysis.
In this paper, we investigate the possibility of adopting FL for residential energy forecasting. The goal is to derive an approach that can enforce data protection by using FL and edge computing, while it still guarantees the proper quality of service. A good quality of prediction from the model is a crucial non-functional requirement, essential to ensure the precision of the operations of other services for grid management and an energy production plan. In this work, we first train a long short-term memory (LSTM) neural network using a dataset with energy consumption data from real smart meters in a residential area.
Subsequently, we perform a set of experiments to compare the centralized and federated approaches to analyse the accuracy of the forecasting in both the configurations. Different edge-computing/federated-learning configurations with varying levels of privacy are considered. The results of our experiments, obtained using Flower, a popular framework to test federated-learning solutions and real energy consumption data, highlighted the feasibility of using an approach based on federated learning, as it does not result in a significant reduction in the accuracy of the prediction w.r.t. a centralized approach.
The experiments considering different federated-learning configurations with different privacy levels showed only a small reduction of accuracy among the different configurations, with each one, however, resulting in a different level of privacy. Our results also highlighted a small overhead in terms of the network communication for the federated-learning solution, thus, confirming the feasibility of its adoption with any wired and wireless wide-area communication technology.
To summarize, the contributions of the paper are twofold:
  • The feasibility of exploiting federated learning for energy forecast prediction is assessed via a realistic set of experiments that compare the performance of federated learning against a centralized approach.
  • Multiple edge-computing/federated-learning architectures with different privacy levels are evaluated to measure the overhead of each configuration and the provided level of accuracy.
Our experimental investigation is achieved by means of four research questions that are addressed in our experiments: two research questions, RQ1 and RQ2, that aim at assessing the performance of an LSTM model in a centralized (RQ1) and federated (RQ2) architecture, respectively, and two research questions, RQ3 and RQ4, that aim to assess the performance penalty (RQ3) and the issues (RQ4) in adopting a federated approach in the considered use case.
The paper is structured as follows: In Section 2, we overview the related work. In Section 3, we provide a short introduction to the technical background. In Section 4, we report the methodology that we used in our experiments, while in Section 5, we offer a report of the results obtained by our experiments. Finally, in Section 6, we draw our conclusions.

2. Related Work

Recently, several works have been proposed in the literature for energy forecasting, exploiting different heterogeneous techniques [6]. Auto Regressive Integrated Moving Average (ARIMA) models represent the first major family of techniques to model time series for future prediction. Recurrent neural networks—in particular LSTM networks—represent the second major family of approaches and have been demonstrated to be effective to analyse historical data and predict future demand in the short-term.
Focusing on power consumption forecasting, Wang et al. [7] demonstrated that LSTM models can outperform ARIMA models by up to a 22% reduction in terms of the root mean square error (RMSE), by using a dataset composed of 20,000 users from one supply station over one year. Mpawenimana et al. [8] performed a comparison of ARIMA and LSTM models on the IHEPCD dataset (https://archive.ics.uci.edu/ml/datasets/individual+household+electric+power+consumption, accessed on 5 July 2022), composed of a single user over a period of four years. The IHEPCD dataset contains around 1.25 % of missing values; thus, different replacement strategies have been implemented. For any replacement strategy, the LSTM model outperforms the ARIMA model in terms of the RMSE.
The majority of such works, however, adopt a centralized approach for data collection and analysis, e.g., [9,10,11]. For instance, [10] is one of the first works to propose an LSTM-based algorithm to predict energy consumption [10] in the context of individual residential households. The authors compared multiple benchmarks using a real-world dataset. The comparison showed that better results could be achieved by using an LSTM rather than other types of networks. This is achieved due to the ability of LSTMs to learn long-term temporal connections.
A centralized approach requires all the data to be offloaded to a centralized system, thus, representing a significant security issue that can be critical in some cases depending on the scope of the data [12]. Such solutions, however, do not consider data privacy at all; nonetheless, this aspect is widely investigated in the context of IoT. Multiple privacy-preserving solutions have been proposed, for instance, in [13], a privacy-preserving approach to prevent the disclosure of data produced by IoT devices based on techniques, such as k-anonymity and t-closeness is proposed.
A privacy-preserving approach by design is federated learning, which has been adopted in the context of smart buildings to implement a wide range of functionalities related with energy consumption and production prediction. For instance, in [14], a federated-learning approach to predict the energy demand of charging stations was proposed to optimize the electric vehicle charging network. In [15], the authors proposed a federated-learning-based solution for anomaly detection in the energy consumption of smart buildings.
Only a few works proposed distributed solutions for residential energy prediction based on federated learning. In [16], a federated-learning approach for the load forecasting of Smart Meter data was proposed. Specifically, the authors assessed two federated-learning strategies—namely, FedSGD and FedAVG. The model adopted was an LSTM, as it has been demonstrated in the literature to provide good results in energy prediction. The two FL methods are compared with central training and individual LSTM models, i.e., an LSTM model trained for each Smart Meter without using FL.
The experiments showed that the two federated-learning strategies adopted achieve an higher level of accuracy w.r.t. the central model and the individual LSTMs considering one hour forecasting. The proposed approach also considered a dynamic environment where some Smart Meters join the federation after the training is complete and use the already trained model for load forecasting. The results demonstrated that, even in this scenario, FedAVG and FedSGD can result in high accuracy.
With respect to [16], in this work, we aim at assessing the performance of FL for energy prediction, considering different edge-computing/federated-learning configurations resulting in different privacy levels. Compared with other works, we not only assess the resulting prediction quality of federated learning against the centralized approach but also also evaluate different distributed configurations, as they can be suitable to accommodate the heterogeneous deployments of the power grid.

3. Technical Background

In this section, we offer an overview of the technical background. Specifically, we first introduce the concept of federated learning (FL) in Section 3.1, and then we present the long short-term memory model in Section 3.2.

3.1. Federated Learning

In a centralized architecture for energy monitoring and forecast, local data from the users is continuously offloaded to a central server, e.g., a cloud-based system. These data are used to train a forecast model and to create a global model. This approach does not preserve the privacy of the users, as they need to share their personal data. An example of a centralized architecture for energy monitoring and forecast is presented in Figure 1: each household is equipped with a smart meter to collect data on energy consumption, periodically the local data is offloaded to a centralized server that collects all the data on a centralized data repository that is used to train a global model for energy prediction. After the training phase, such model is then used to predict the energy demand of each household based on the local data periodically provided by each smart meter.
A approach to overcome such a limitation is federated learning, FL for short, that introduced a new approach to train models from data distributed in different edge devices without requiring their transmission to an external system. Each client stores sensitive data locally and trains a local model, the model is shared globally in order to improve the precision of all the clients. A centralized server for sharing the models across the clients is still required; however, it does not receive and process any sensitive data from the clients.
In Figure 2, the overall architecture and workflow of a FL system is depicted. The overall process starts with a global model common to all the clients. The learning process is performed over time through different rounds, each one characterized by the following steps:
  • The server selects a subset of the clients (or all) that participate in the next training round.
  • The server distributes the current global model weights to the selected clients. In addition, the server provides the instructions on how the training should be performed (e.g., number of local epochs).
  • The selected clients receive the model weights, configure its local model with those weights and train it on their local data set, according to the instructions received. When the training is concluded, each client sends back the updated model weights to the server.
  • The server receives all the updated models and aggregates them. Subsequently, the old global model is replaced with the new aggregated weights.
Figure 2. Federated-learning architecture schema.
Iot 03 00021 g002
Steps 2–4 are repeated for more than one round, as typically FL algorithms require several rounds to converge. At the end of each round, the clients assess the performance of the model via some metrics, which are also transmitted to the server. Through these metrics, the server obtains a global view on the performance of the distributed training and decides when the process should be stopped.
A crucial step in the distributed training process is how the weights are aggregated by the central server across different rounds. The aggregation can be performed adopting multiple policies, the most widely-adopted are Federated Stochastic Gradient Descent (FedSDG for short) and the Federated Averaging (FedAvg for short).
FedSDG is an aggregation procedure in which each client performs a single step of the Stochastic Gradient Descent (SGD) at every round, subsequently, it sends the local model weights to the server. The server averages the weights received on the basis of the number of training examples used by each client.
FedAvg adopts a similar process, with some differences in how each client behaves at each round. Specifically, the client runs multiple local epochs using its local data to train the model implementing a single SGD step. This results in two main advantages: less interactions between the server and the clients are needed, and the global model training converges more rapidly than does FedSGD [17].

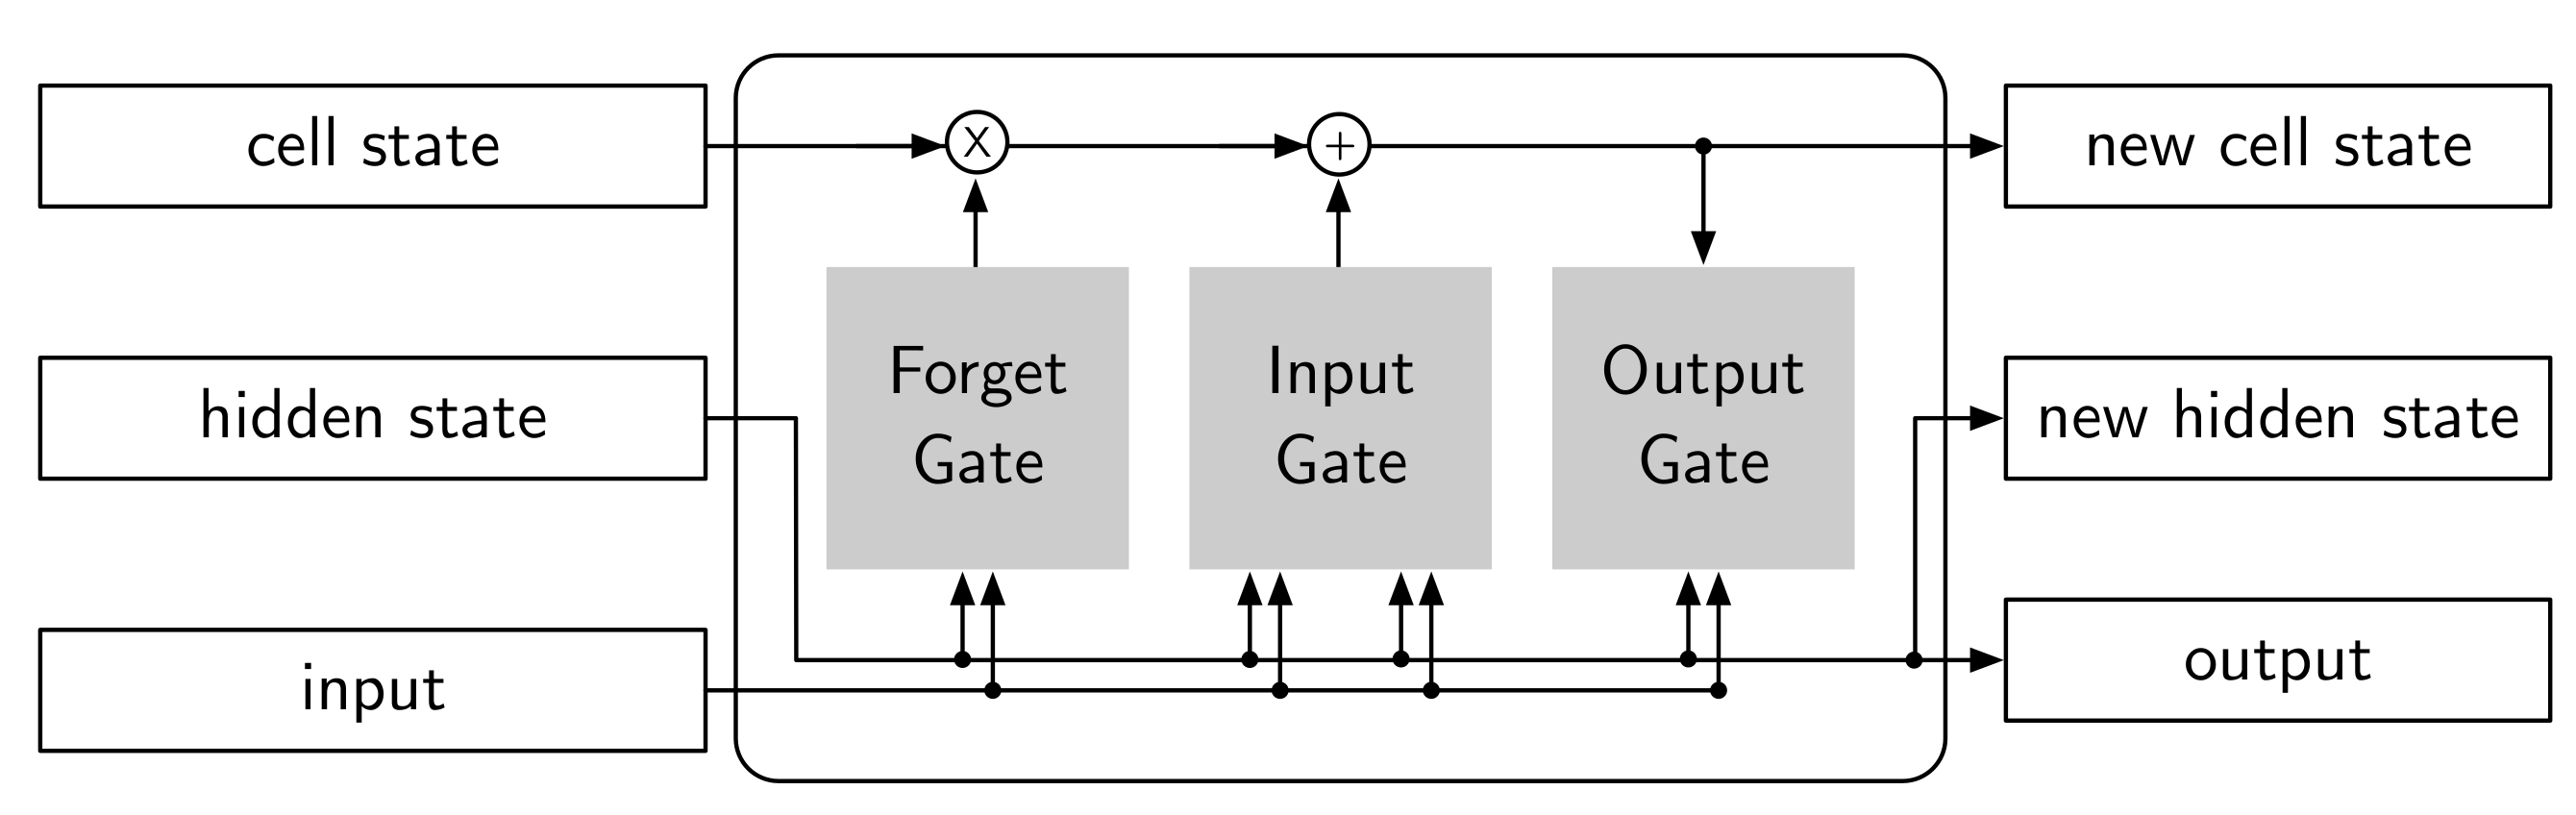
3.2. Long Short-Term Memory Network

Long short-term memory network (LSTMs) are a type of recurrent neural network specifically designed to mitigate the problem of vanishing/exploding gradients. This issue is caused by the back-propagating effect that can occur during training, as the gradients go through continuous matrix multiplications during the back-propagation process due to the chain rule, which can cause the gradient to shrink exponentially (vanish) or to blow up exponentially (explode). An overly small gradient prevents the weights from being updated and learning; on the other side, overly large gradients result in a model that is unstable. As a consequence, classical recurrent neural networks cannot work with longer sequences, as they are characterized by short-term memory.
LSTMs, instead, have a more complex structure: for each step, an LSTM cell requires three different inputs, specifically the current input data, the short-term memory from the previous cell and the long-term memory. The short-term memory is also referred to as the hidden state, while the long-term memory is also known as the cell state. The cell uses gates to decide if the information should be kept or discarded. The role of such gates is to selectively remove any irrelevant information. To this aim, the gates should be trained accurately to identify what is useful and what is not. These gates are called the Input Gate, the Forget Gate and the Output Gate; see Figure 3.
Let us see what these gates are:
  • Input Gate: decides the new information that will be stored in the long-term memory.
  • Forget Gate: decides which information from the long-term memory should be kept or discarded.
  • Output Gate: regulates the flow of information to the rest of the network.
Figure 3. LSTM cell structure.
Iot 03 00021 g003
Each LSTM cell receives as input the hidden state of the previous cell and the current input (note that the input gate receives both input twice). Hence, each LSTM cell is characterised by eight weights and four biases to be learned.

4. Dataset and Methodology
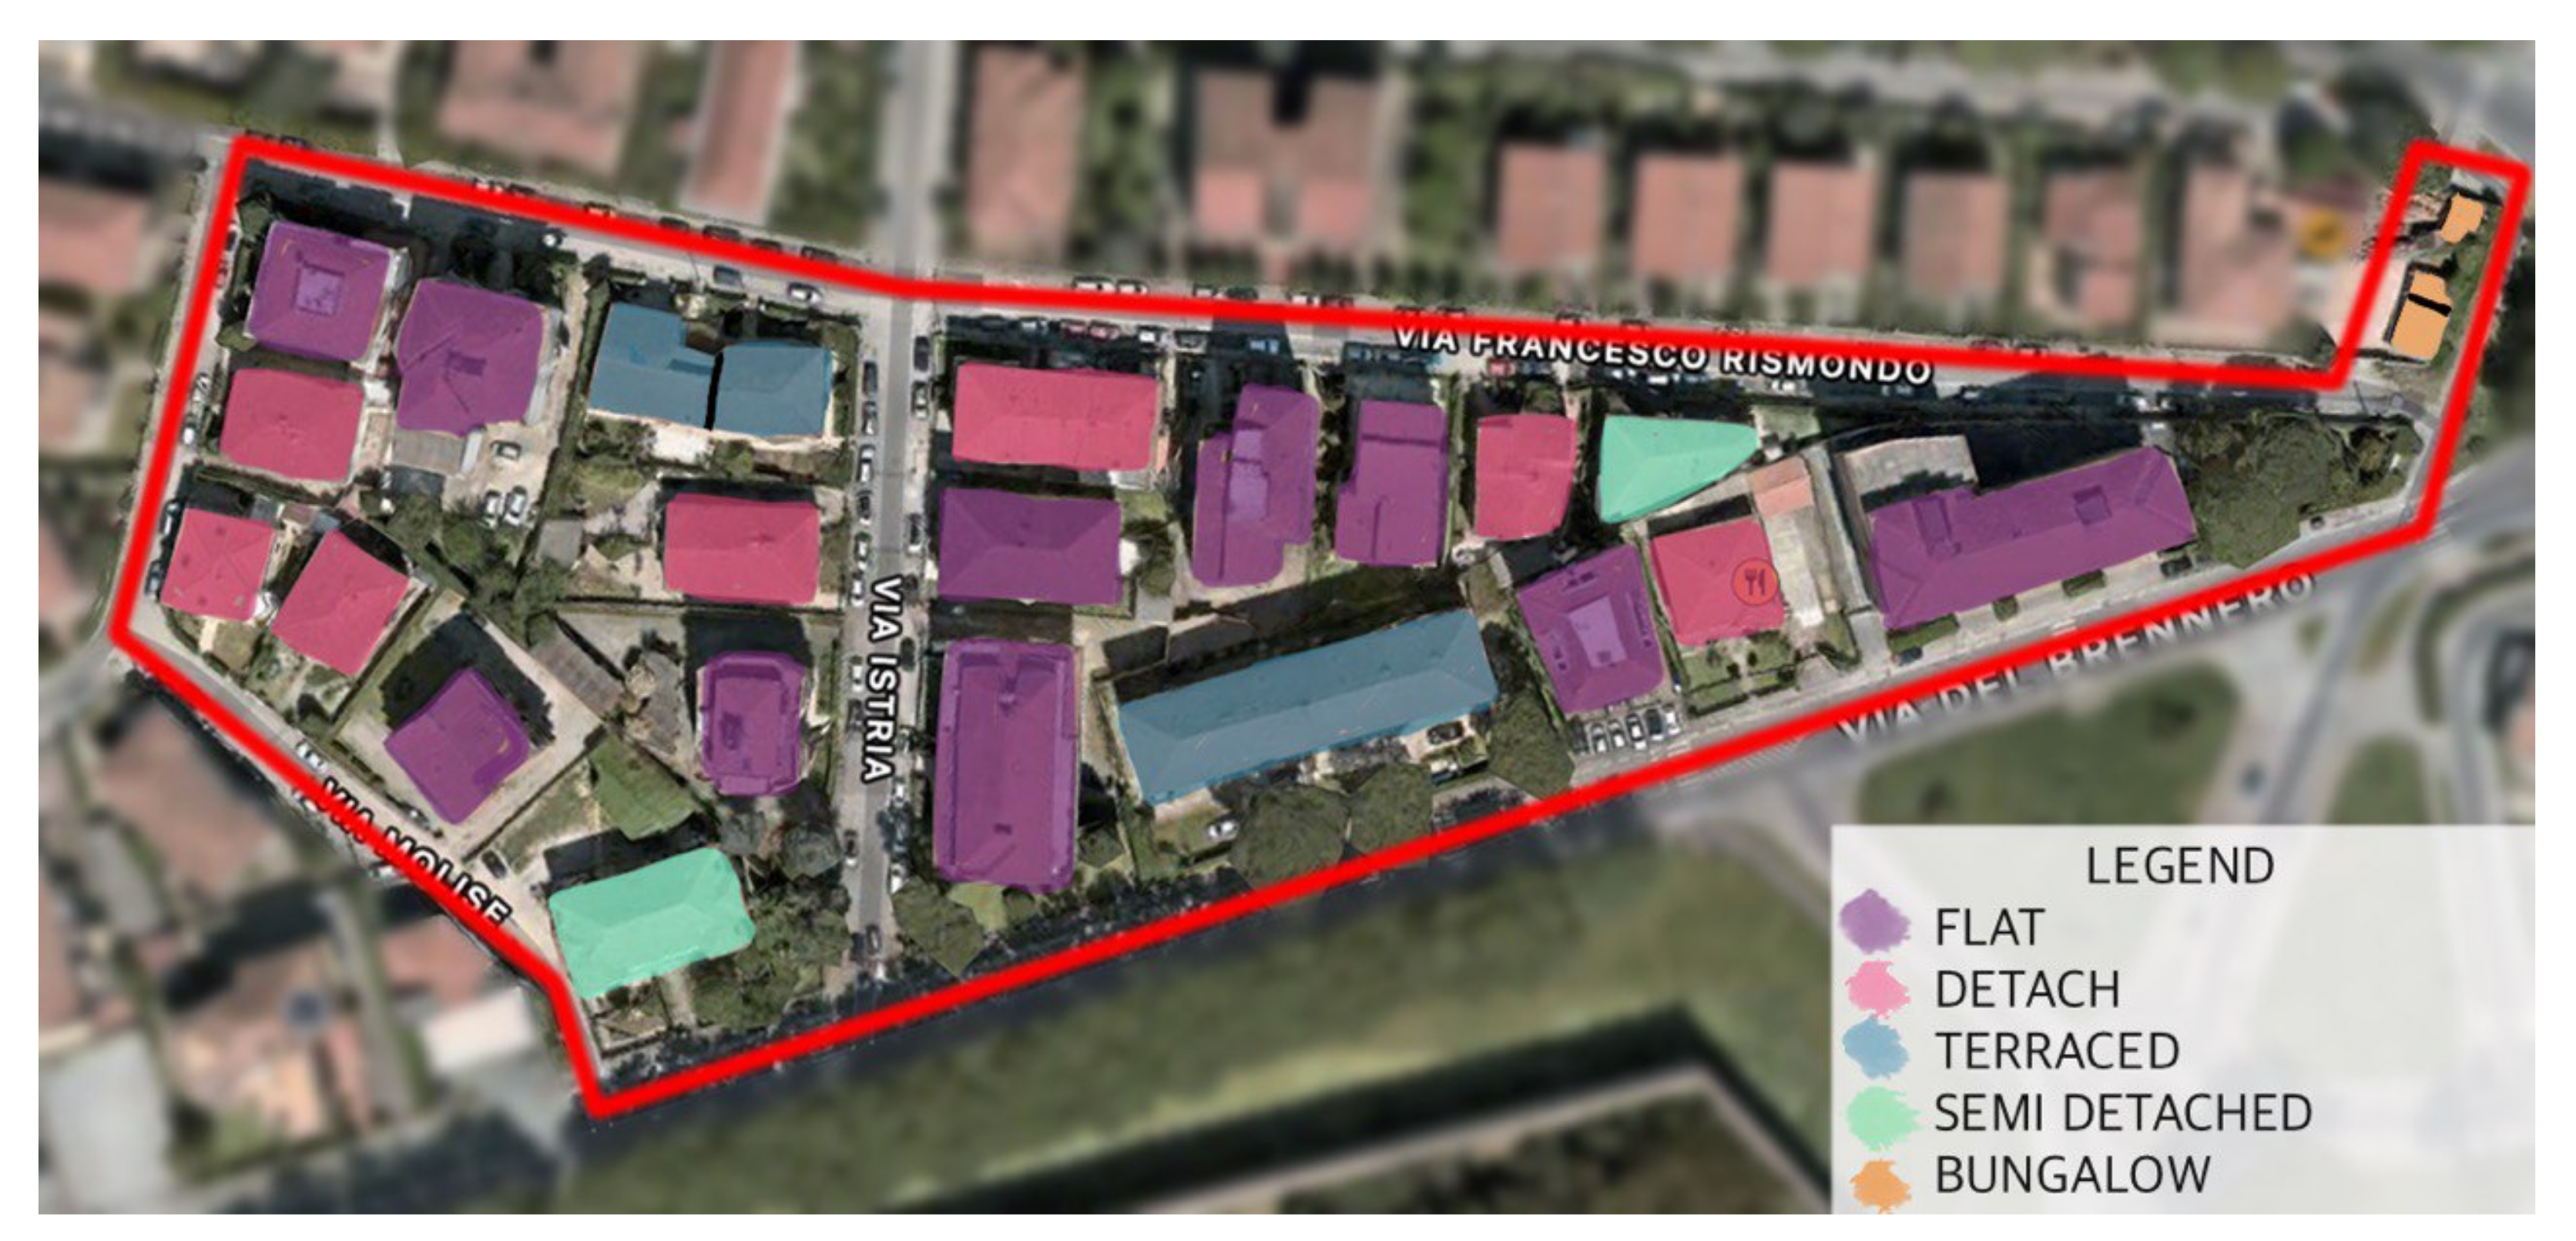
In this section, we present the dataset used in our experiments and the methodology adopted. We start by presenting the details on the dataset used in our experiments in Section 4.1, and then we present the configuration of the LSTM model used for the energy prediction in Section 4.2. We conclude the section by introducing the Flower framework used in our experiments in Section 4.3.

4.1. Dataset

In this work, the dataset made available for the FUZZ-IEEE competition on Explainable Energy Prediction [18] is used. The dataset contains historical half-hourly energy readings for 3248 Smart Meters from the first January 2017 to the 31st December 2017, expressed in kWh. Each smart meter has associated the type of housing that can be one of the following five types:
  • Bungalow: a small house or cottage that is either single-story or has a second story built into a sloping roof.
  • Detached House: a stand-alone residential structure that does not share outside walls with another house or building.
  • Flat: a set of rooms for living, usually on one floor and part of a larger building. A flat usually includes bedrooms, a kitchen and a bathroom.
  • Terraced House: a house built as part of a continuous row in a uniform style.
  • Semi Detached House: a single family duplex dwelling house that shares one common wall with the next house.
The dataset was initially analysed in order to assess its quality and highlight anomalies in the data. Our assessment highlighted that many traces report null values for an extensive period of time; consequently, such traces were excluded from the dataset in order to keep the quality of the dataset high.
Only 4 months out of 12 months available are taken into consideration in order to analyse the months with the highest amount of data, i.e., from June to September, and to ensure that there was less impact from the weather fluctuations and seasons. Moreover, to reduce the dataset size while preserving the seasonality patterns and reducing the forecasting frequency, the data samples were aggregated to obtain a trace with a coarser granularity of 1 h, thereby, resulting in 2928 data samples per smart meter. Finally, the data, thus, processed were used to produce six different datasets as reported in Table 1.
Finally, the traces for each of the six datasets were divided into three groups, each one used for training, validation and test, respectively, using a stratified K sampling procedure. Specifically, the 70% of the data was used as the training set, and the remaining 30% was used as the test set.The training smart meters were further partitioned with the same procedure: 80% was used for actual training, while the remaining 20% was used for validation and hyperparameter tuning.

4.2. Neural Network Setup

This section aims at describing how the LSTM hyperparameters were chosen in the federated architecture. The differences between the models adopted in the centralized architecture and in the federated architecture are also highlighted.
In our experiments, we trained an LSTM model with an input layer with 24 neurons, one hidden LSTM layer and one output layer. The time series were processed in batches of 1024 elements. For regularization purposes, we also employed a dropout strategy by setting the dropout rate to 0.2 . The training of the LSTM was performed by minimizing the squared error, i.e., adopting the minimum squared error (MSE) loss, until the learning. The learning rate was set to 10 3 , and training was terminated after a maximum of 50 epochs, or when the validation loss did not improve across five training epochs (early stopping condition), with an absolute tolerance of 10 4 . Federated learning was performed by locally training the models for three epochs and by performing model averaging for a maximum of 50 rounds.
The number of neurons in the hidden layer was calibrated with a grid search on the values { 10 , 20 , 30 , 40 , 50 } , by selecting the value producing the smallest MSE loss on the validation dataset. The results of the hyperparameter optimisation, for each dwelling type, are reported in Table 2.
To summarise, the training parameters adopted are reported in Table 3.

4.3. Flower

Flower is an open-source framework for rapid deployment and experimentation of FL solutions [19]. The framework offers the following main advantages: it takes into account client heterogeneity (computing, memory and communication resources), and it scales with the number of clients. Rapid deployment is guaranteed by the high-level abstraction, which allows researchers to rapidly implement and experiment multiple solutions, thereby, exploiting the functionalities of the framework that implements the basic functionalities of FL solutions. The framework, in particular, allows to experiments on both distributed cloud servers or simulating the complete system on a single machine.
One of its key feature is that it is both language- and ML-framework-agnostic. This means that the tools offered by Flower are independent from the ML framework solution adopted and the language, i.e., PyTorch, TensorFlow, etc. Flower provides basic building blocks that are designed to be customized, thus, allowing developers to implement custom FL solutions, whose parameters can be changed on a per-experiment basis.
The framework is composed of three main components: a client, a server and a strategy. The client and the server implement the basic functionalities of the clients and a server in a FL solution, implementing local and global logic, respectively. The strategy, instead, is an abstraction introduced in Flower that implements the overall training/evaluation functions that run on the clients and the server.
The strategy simplifies the implementation of the FL algorithm, as the framework already offers popular FL solutions. For instance, via the strategy implementation it can be decided how to aggregate the parameters of the model on the server and how to select the clients that will participate to the FL process. A user can decide whether to implement a custom strategy, or use an existing one. The framework includes popular FL algorithms, such as FedAvg [17] and FedYogi [20].
The server is responsible for connection handling, client life cycle management, performing rounds of federated learning (that can be customized), distributed and/or centralized validation, implement the weight update aggregation strategy, metric collection and error handling. The server controls the clients by gRPC, a modern open-source high-performance Remote Procedure Call (RPC) framework.
Another advantage of Flower is the Virtual Client Engine (VCE). VCE is a tool that enables the deployment of virtualized Flower clients that run on the same machine. By exploiting VCE, large experiments can be run in a short time to test solutions on a large scale. Flower VCE handles the execution of virtual clients in a resource-aware manner, ensuring that the hardware is properly utilized. VCE is used in our experiments to emulate a large number of clients.

5. Results

In this section, the results of our experiments are presented. We first start by introducing the different experimental scenarios considered in Section 5.1, followed by a presentation of the research questions under investigation in Section 5.2, while in Section 5.3, we present and analyse the results obtained.

5.1. Experimental Scenarios

In order to assess the performance of the prediction with different configurations the following scenarios are considered: a centralized scenario, in which a central server collects all the data and perform the LSTM model training and three distributed scenarios, where the smart meters are connected to edge servers organized with different topologies. Each edge node is in charge of the local LSTM model training, which is periodically transmitted to a central server that runs the federated learning workflow. A more detailed description of the scenarios considered in our experiments is provided in the following.
Each scenario results in a different level of data privacy, as the server(s) performing the training of the energy prediction model(s) are deployed with different configurations, each one using a different set of users among which data is shared, thus, resulting in a different privacy level range.

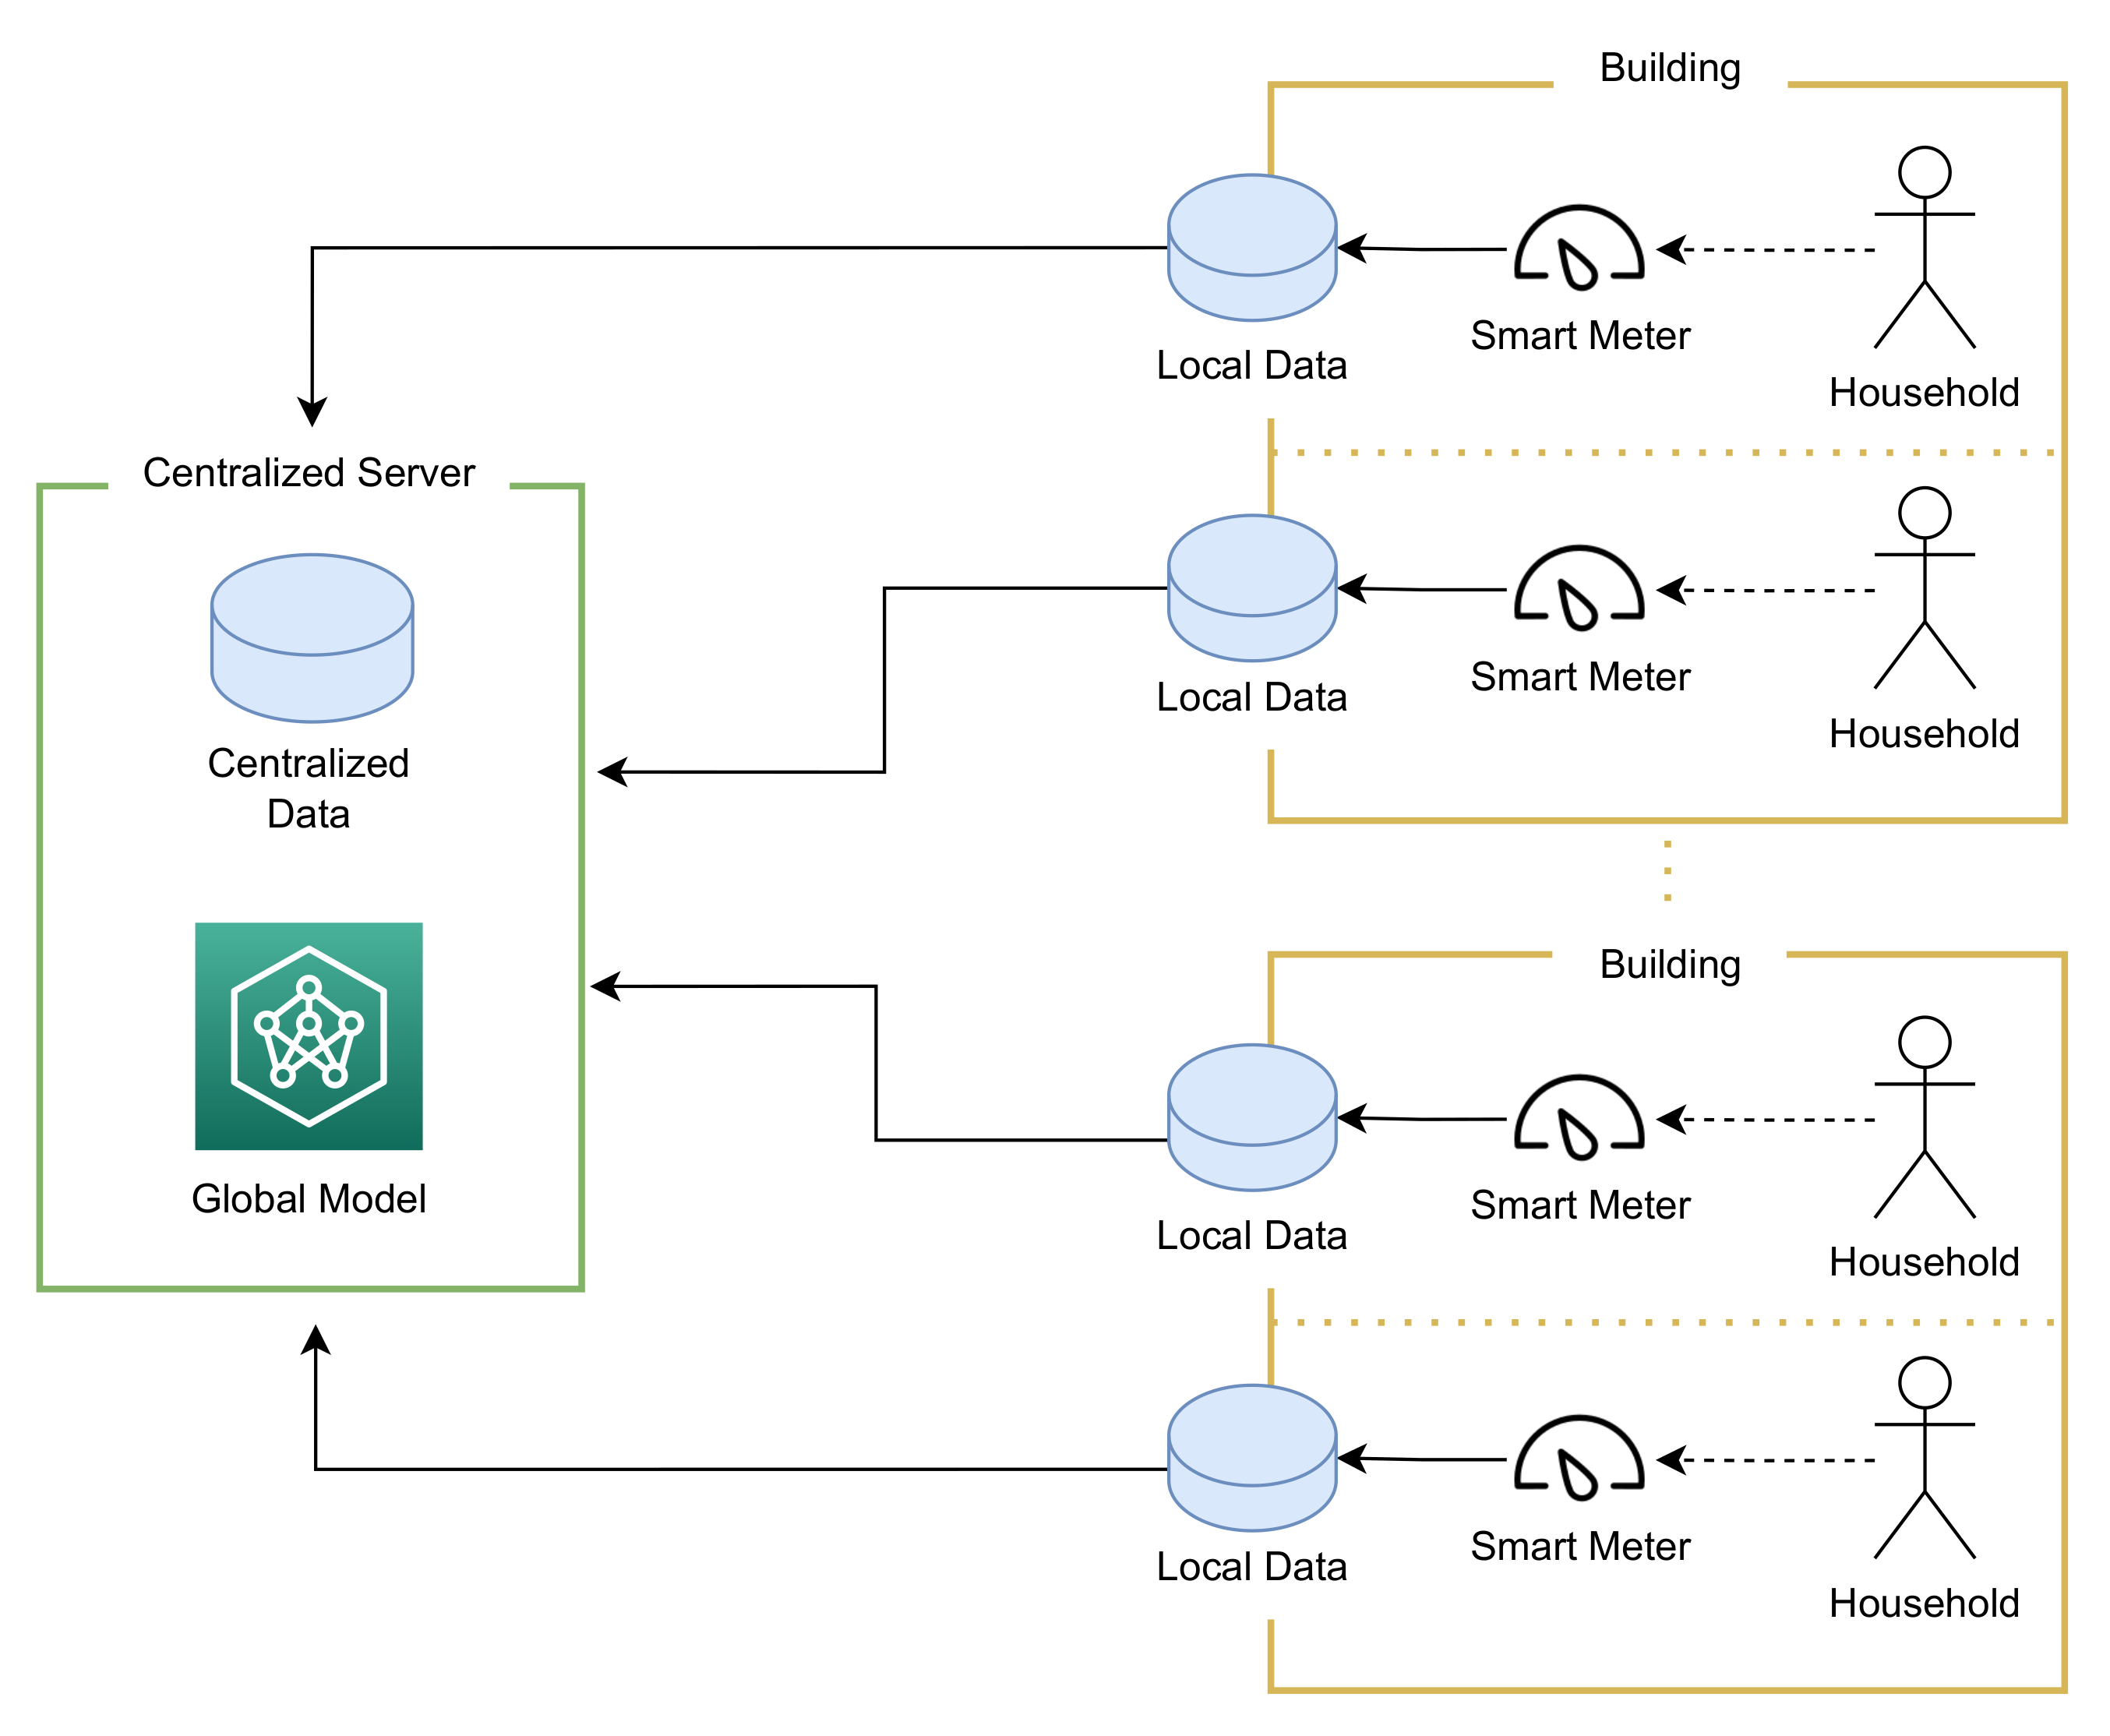
5.1.1. Scenario 0: Centralized Server

This scenario does not employ edge nodes or federated learning; instead, all the smart meters offload their energy consumption data to a centralized server, e.g., a cloud service, that trains the models for energy prediction. In our experiments, five different models, one for each housing type, were trained, thus, to aim at a fine-grained energy prediction for each dwelling type. This scenario is the least privacy-preserving one, as all smart meters share their data to a third party in order to perform energy prediction.

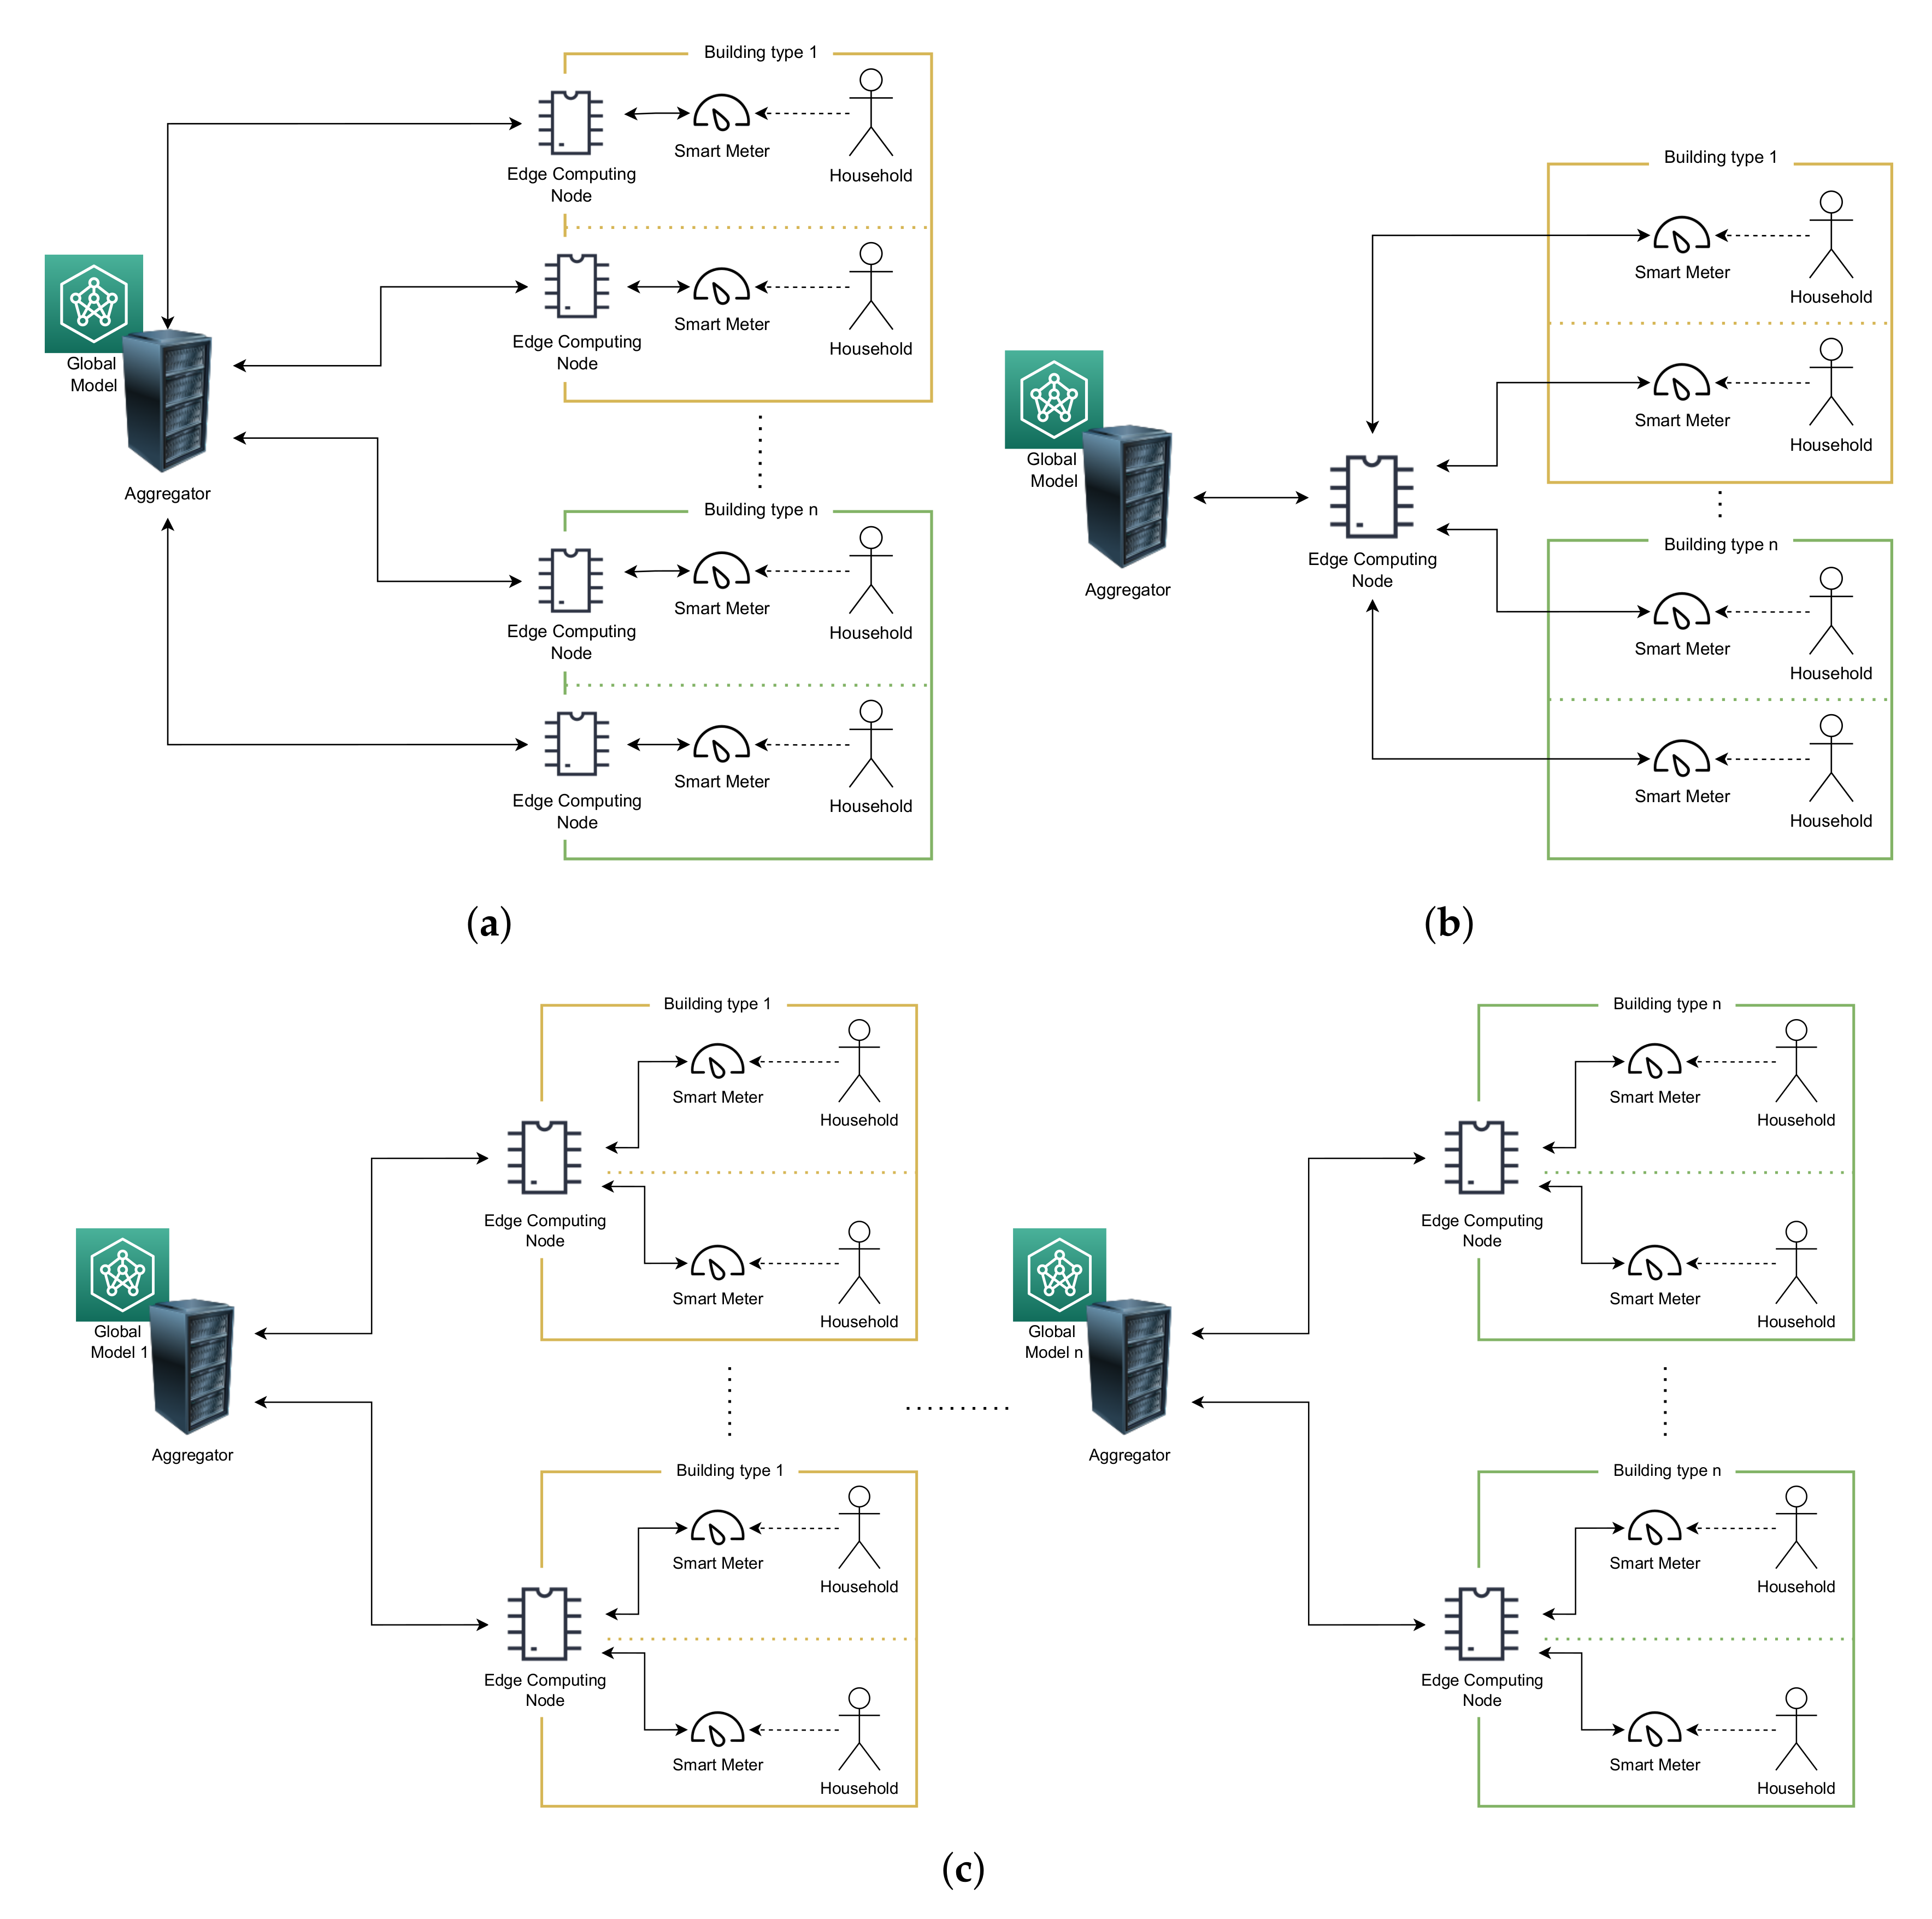
5.1.2. Scenario 1: One Edge-Computing Node per Household

This scenario assumes that one edge-computing node is installed in each household to collect and analyse energy consumption data from a single smart meter. The edge nodes, together with a central server, employ federated learning to train the energy prediction models, while still ensuring privacy. This configuration offers the highest privacy level, as data is not shared as it is analysed in the local edge-computing node, while only the model is shared to improve the forecast performance through federated learning.
As presented in Figure 4a, in this scenario each smart meter offloads its data to a dedicated edge-computing node that trains a local model. The edge node communicates its local model to a centralized server that trains one or more energy prediction models based on the models provided by each edge node, following the federated learning workflow. In this case, five different models are trained via federated learning, one for each housing type.

5.1.3. Scenario 2: One Edge-Computing Node per Neighbourhood

This scenario assumes that one edge-computing node is installed for each neighbourhood. The smart meters of the houses transmit their data to an edge node that performs the local training and prediction for the neighbourhood. This configuration offers a trade-off between Scenario 0 and Scenario 1, in terms of privacy on the one hand and cost reduction on the other hand. In fact, data is shared only on a neighbourhood basis, thus, providing a certain level of privacy, while edge nodes are not installed on each house but are deployed on each neighbourhood. As presented in Figure 4b, in this scenario, the smart meters of a certain neighbourhood offloads their data to a single edge node deployed in the area, the edge node trains one or more local models, which are periodically transmitted to a centralized server that collects the model of the whole grid to train one or more global models, which are subsequently provided to the edge nodes to improve the accuracy. Furthermore, in this case, the edge node trains five different models, one for each housing type, in a collaborative manner across different neighbourhoods via federated learning. For our experiments, a neighbourhood is assumed to include up to 45 households, independently of the dwelling type.

5.1.4. Scenario 3: One Edge-Computing Node per Building

In this scenario, one edge node is deployed per building. The smart meters of the apartment of a building send their data to the edge node of the building for training and forecast. In this case, the number of smart meters connected to an edge node varies significantly, as it depends on the configuration and type of the building. This scenario can be considered a further trade-off between privacy preservation and cost reduction between Scenario 1 and 2, as it can offer more privacy than Scenario 2, although with a higher number of edge nodes to be deployed. As presented in Figure 4c, in this scenario, each smart meter offloads its data to the edge node installed in the building. The latter trains one or more local models that are transmitted to one or more central servers for the computation of the global models.
In order to create this scenario, a real use case was considered, the “Porta a Lucca” neighbourhood in the city of Pisa, a mixed area that includes both offices and residential buildings as reported in Figure 5. Specifically, the map was used to empirically estimate the distribution of households per dwelling type. The different dwelling types present the following household distribution:
  • Flat: from 6 to 22 households.
  • Detached house: from two to four households.
  • Terraced house: from 3 to 12 households.
  • Semi-detached house: from three to four households.
  • Bungalows house: from one to three households.
Two different configurations are considered in this scenario:
  • Scenario 3.1—average household density: for each building in the map, the number of households corresponds to the average number of household depending on the dwelling type.
  • Scenario 3.2—random household density: for each building in the map, the number of households is sampled uniformly at random depending on the dwelling type.
Figure 5. “Porta a Lucca” Neighbourhood in Pisa.
Iot 03 00021 g005

5.2. Research Questions

In the following section, we present a detailed analysis of the experiments performed. The goal is to address the following research questions (RQs):
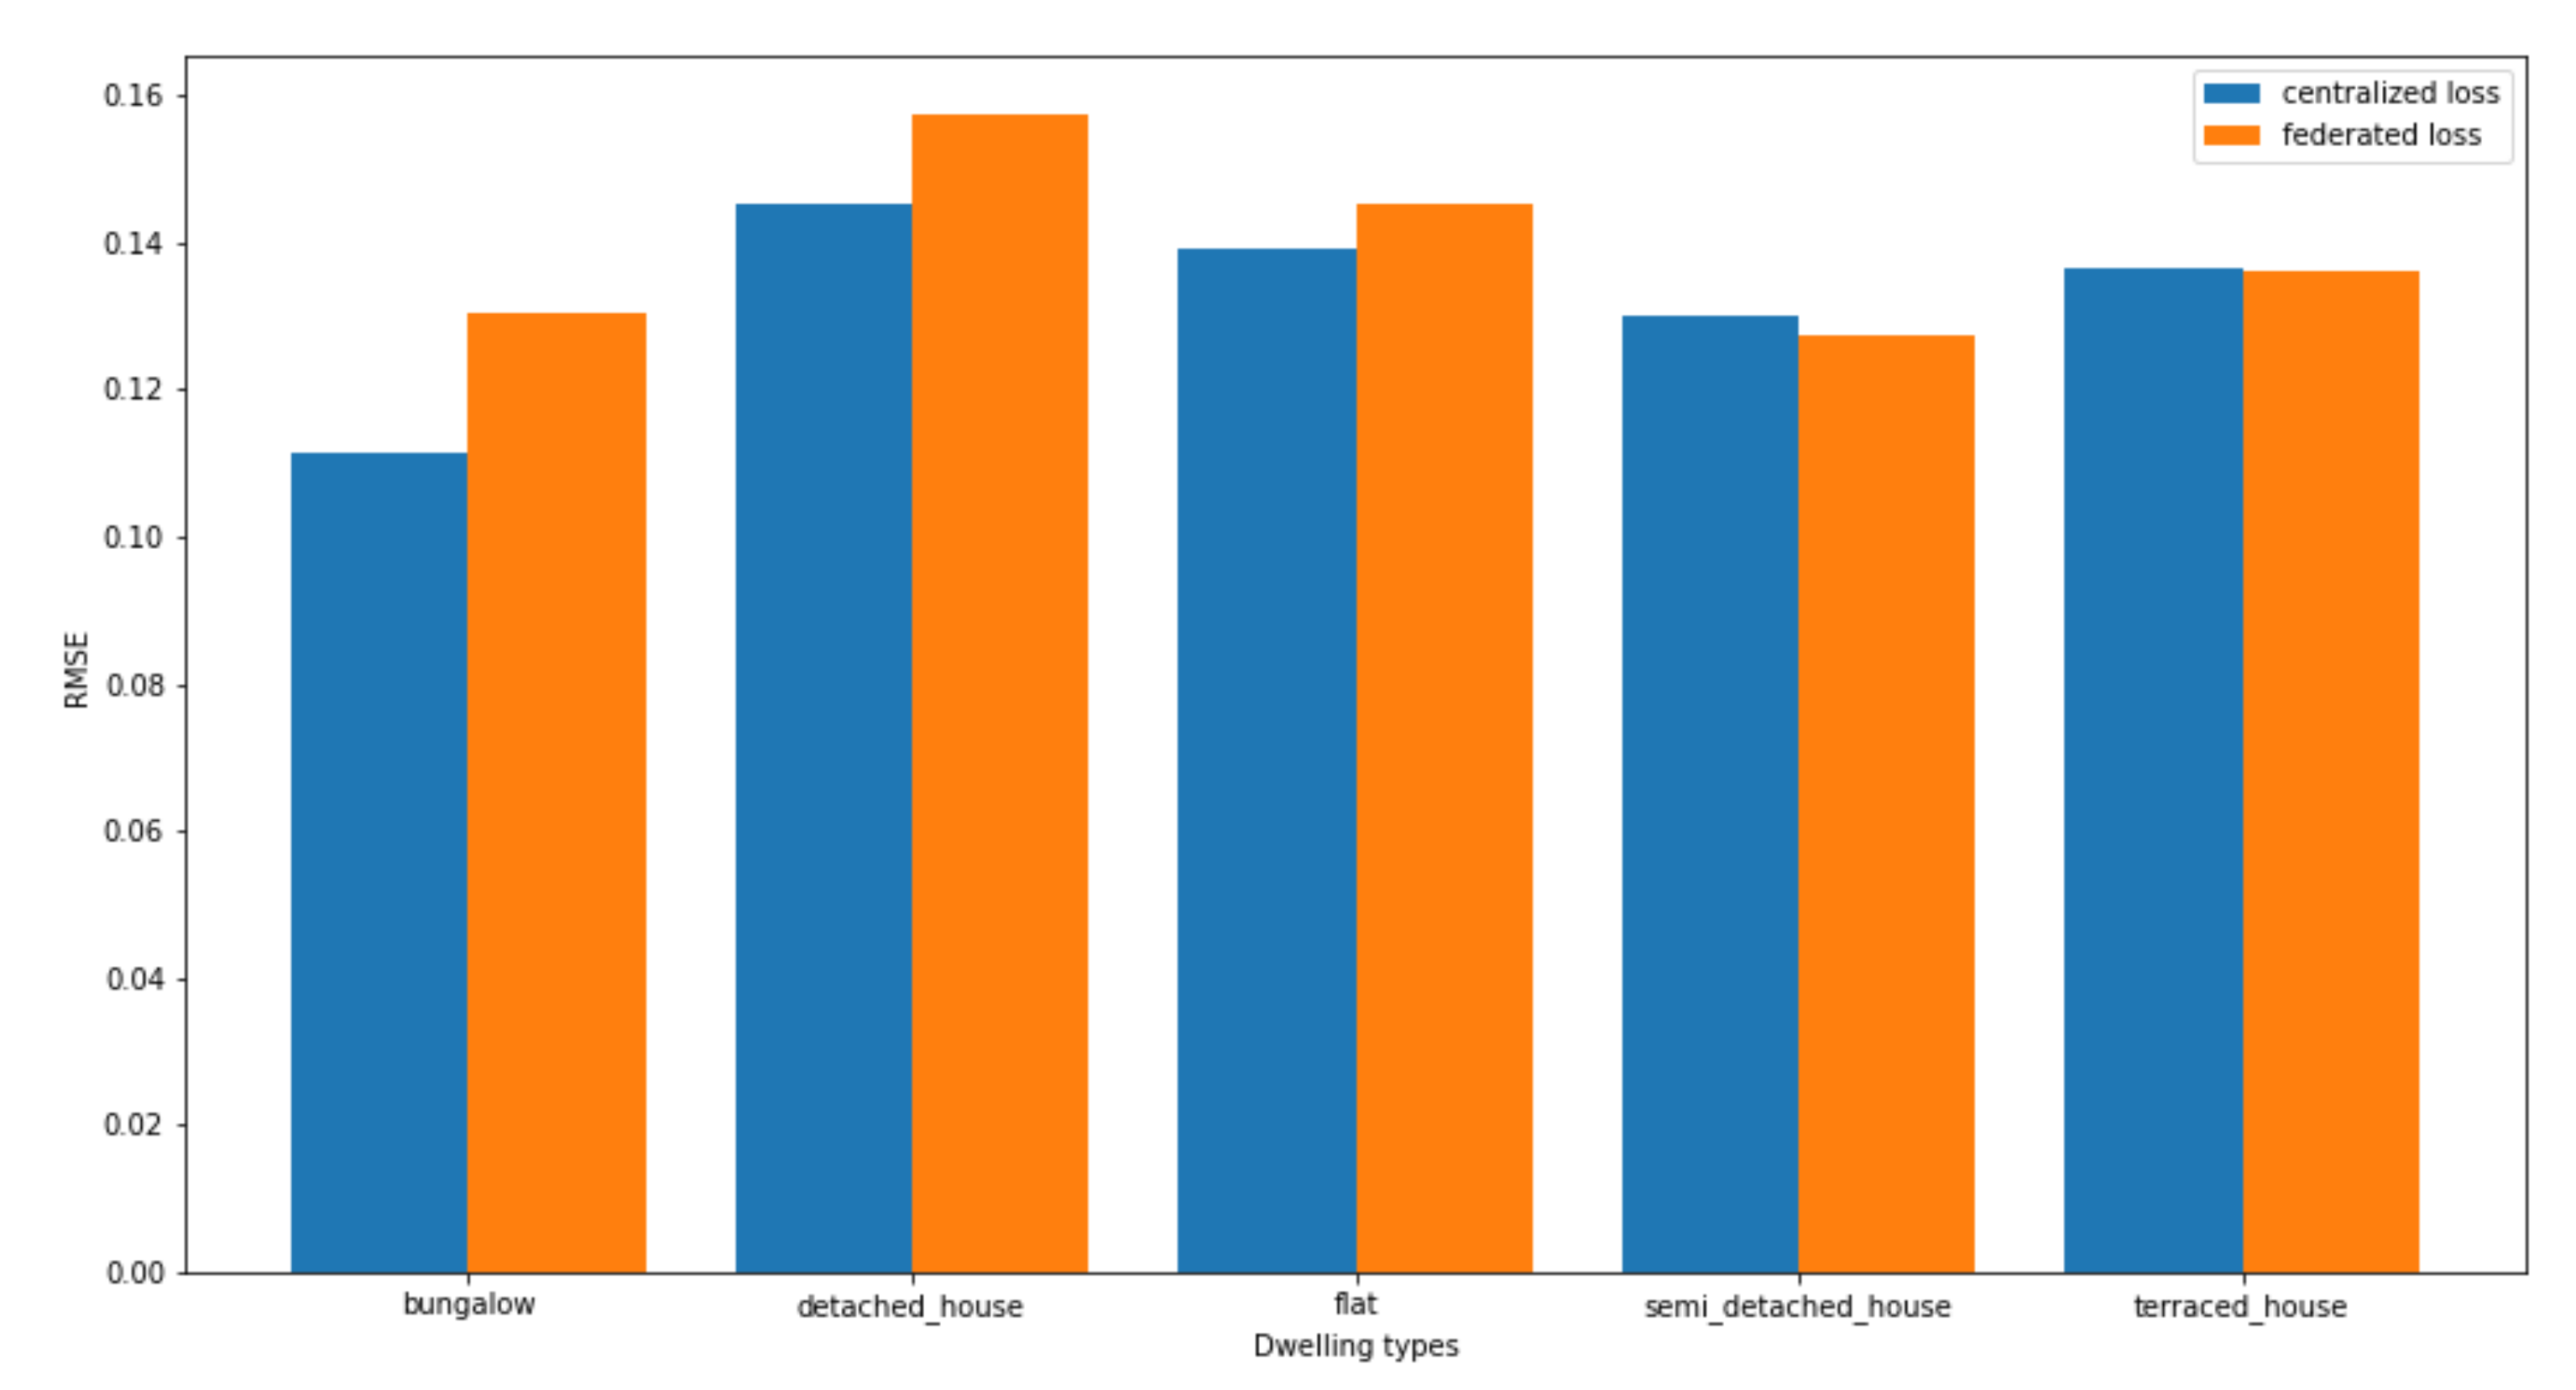
  • RQ1: What are the performance of the LSTM model(s) trained on a cloud server w.r.t. the LSTM model(s) trained on edge servers with federated learning considering different configurations?
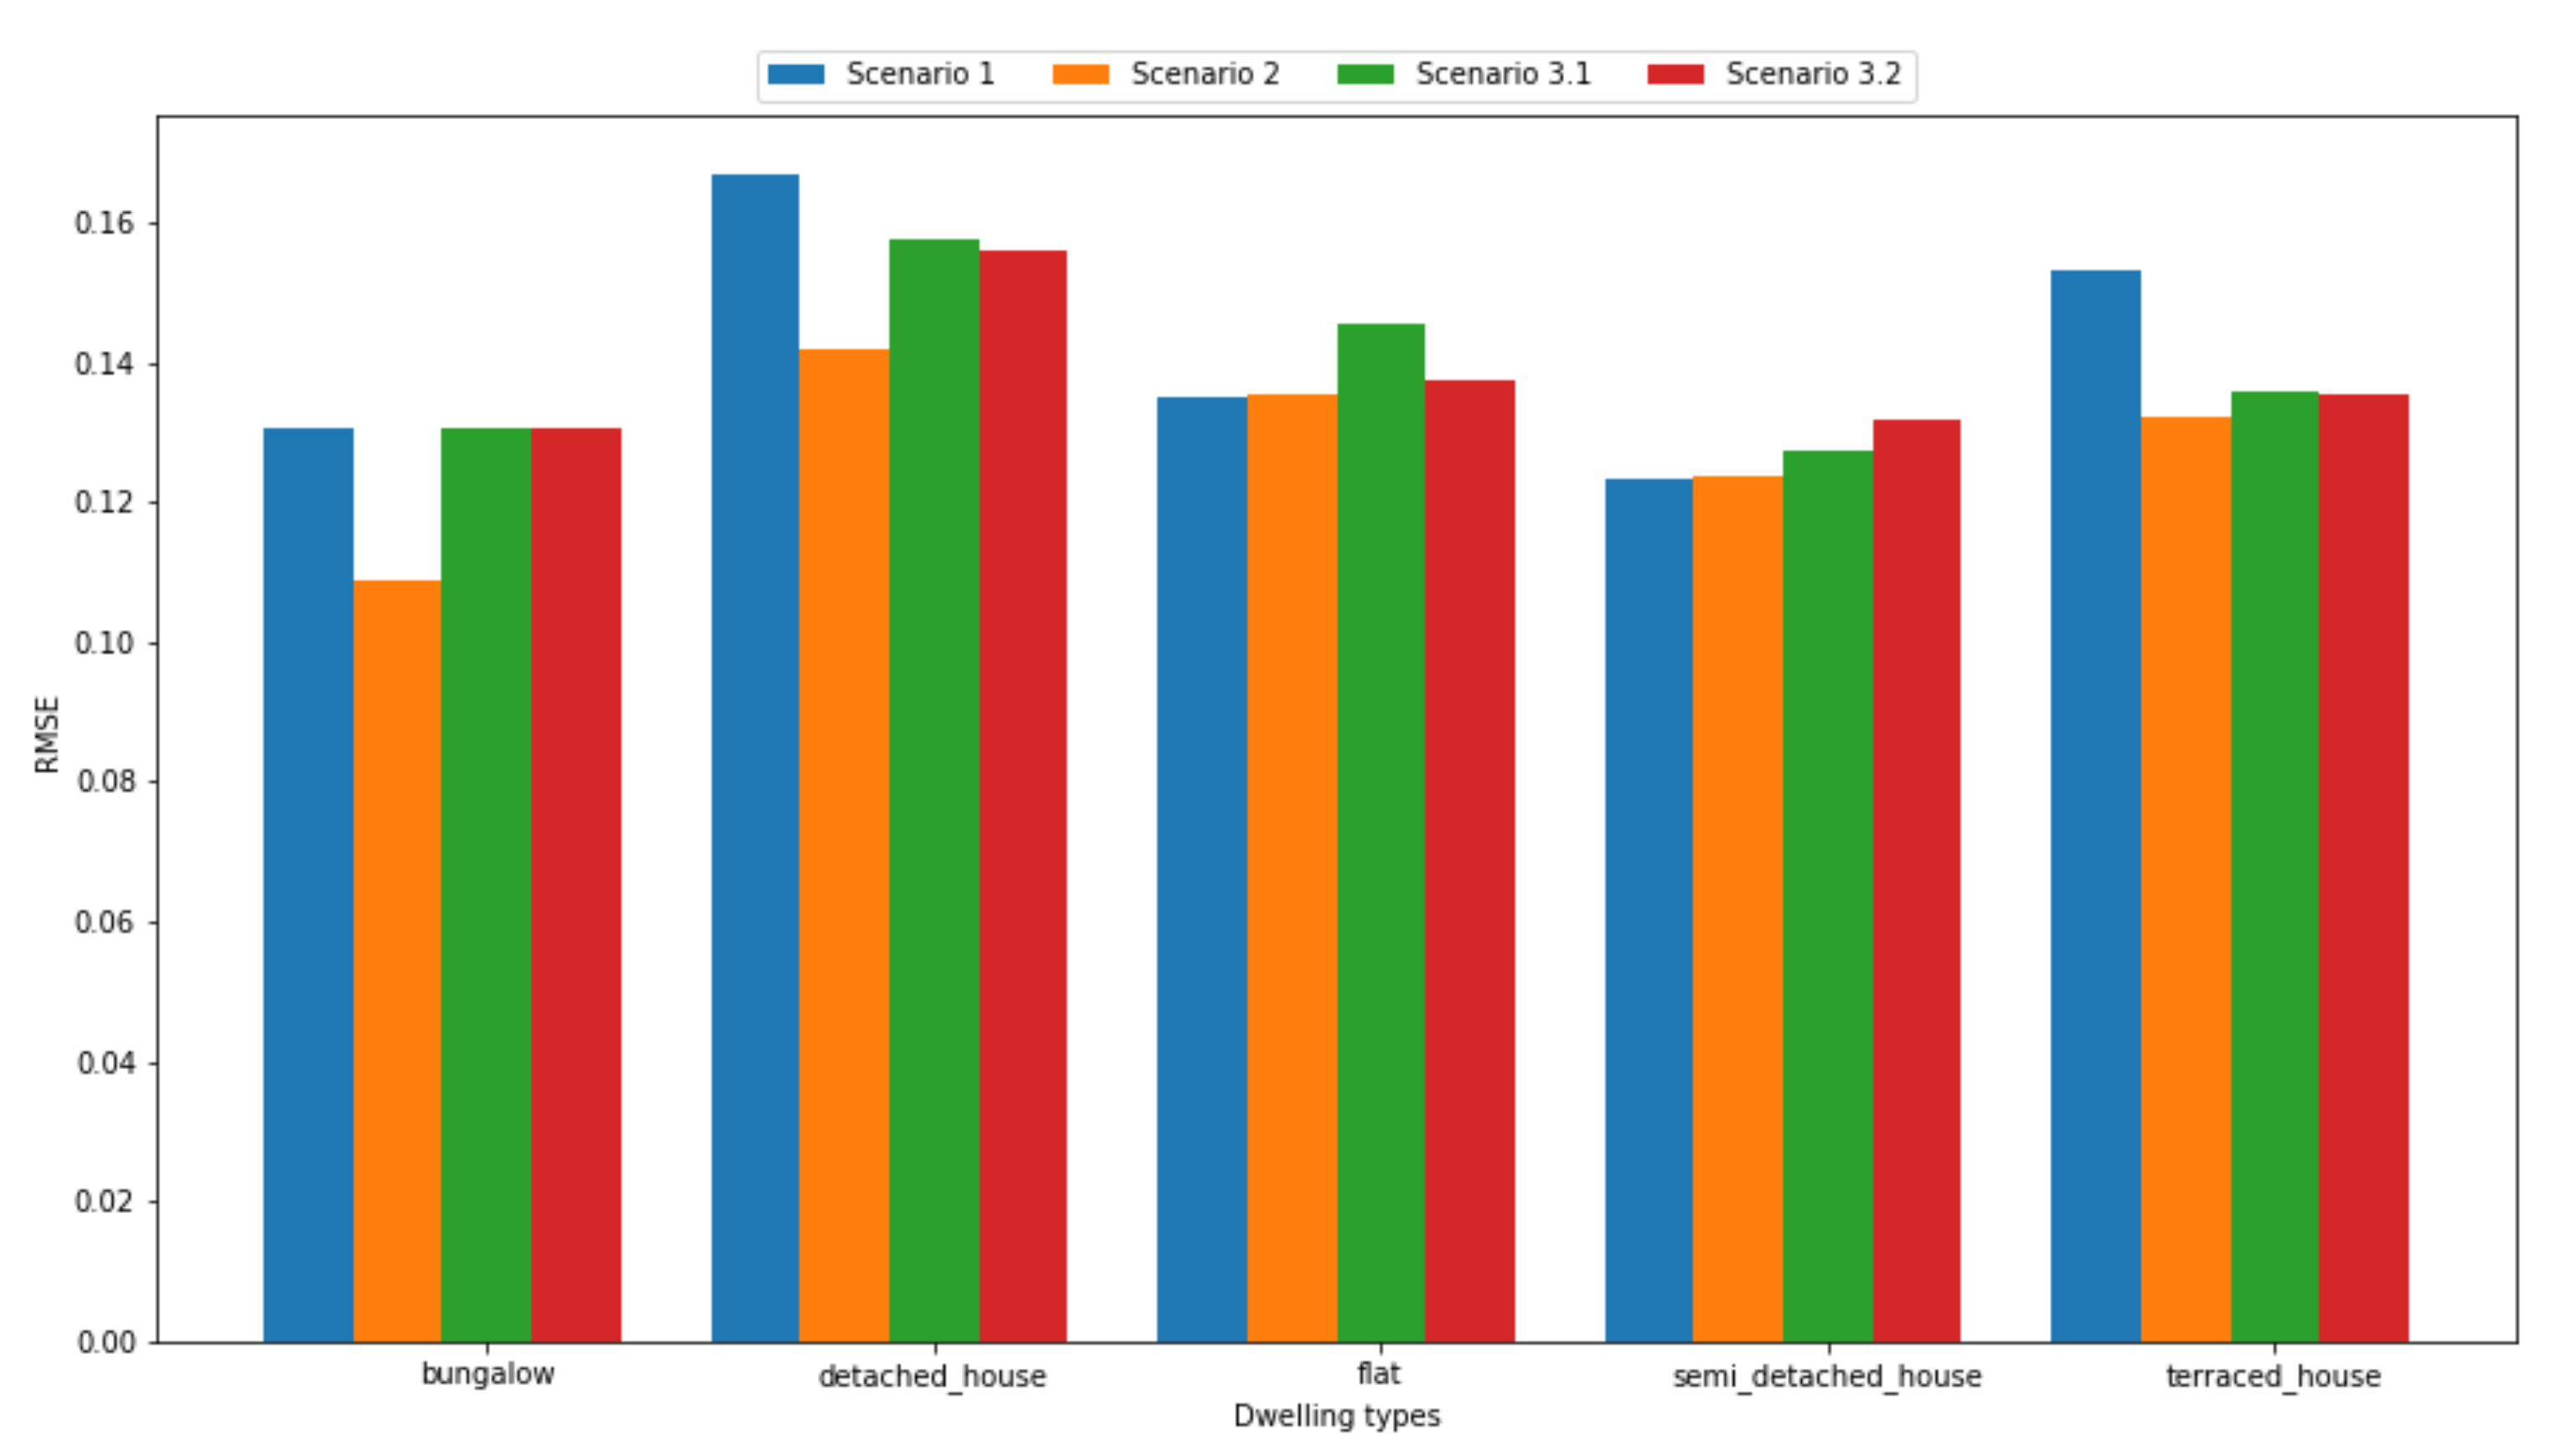
  • RQ2: What are the performance of the LSTM models learned with federated learning by varying the reference scenario and/or the dwelling type?
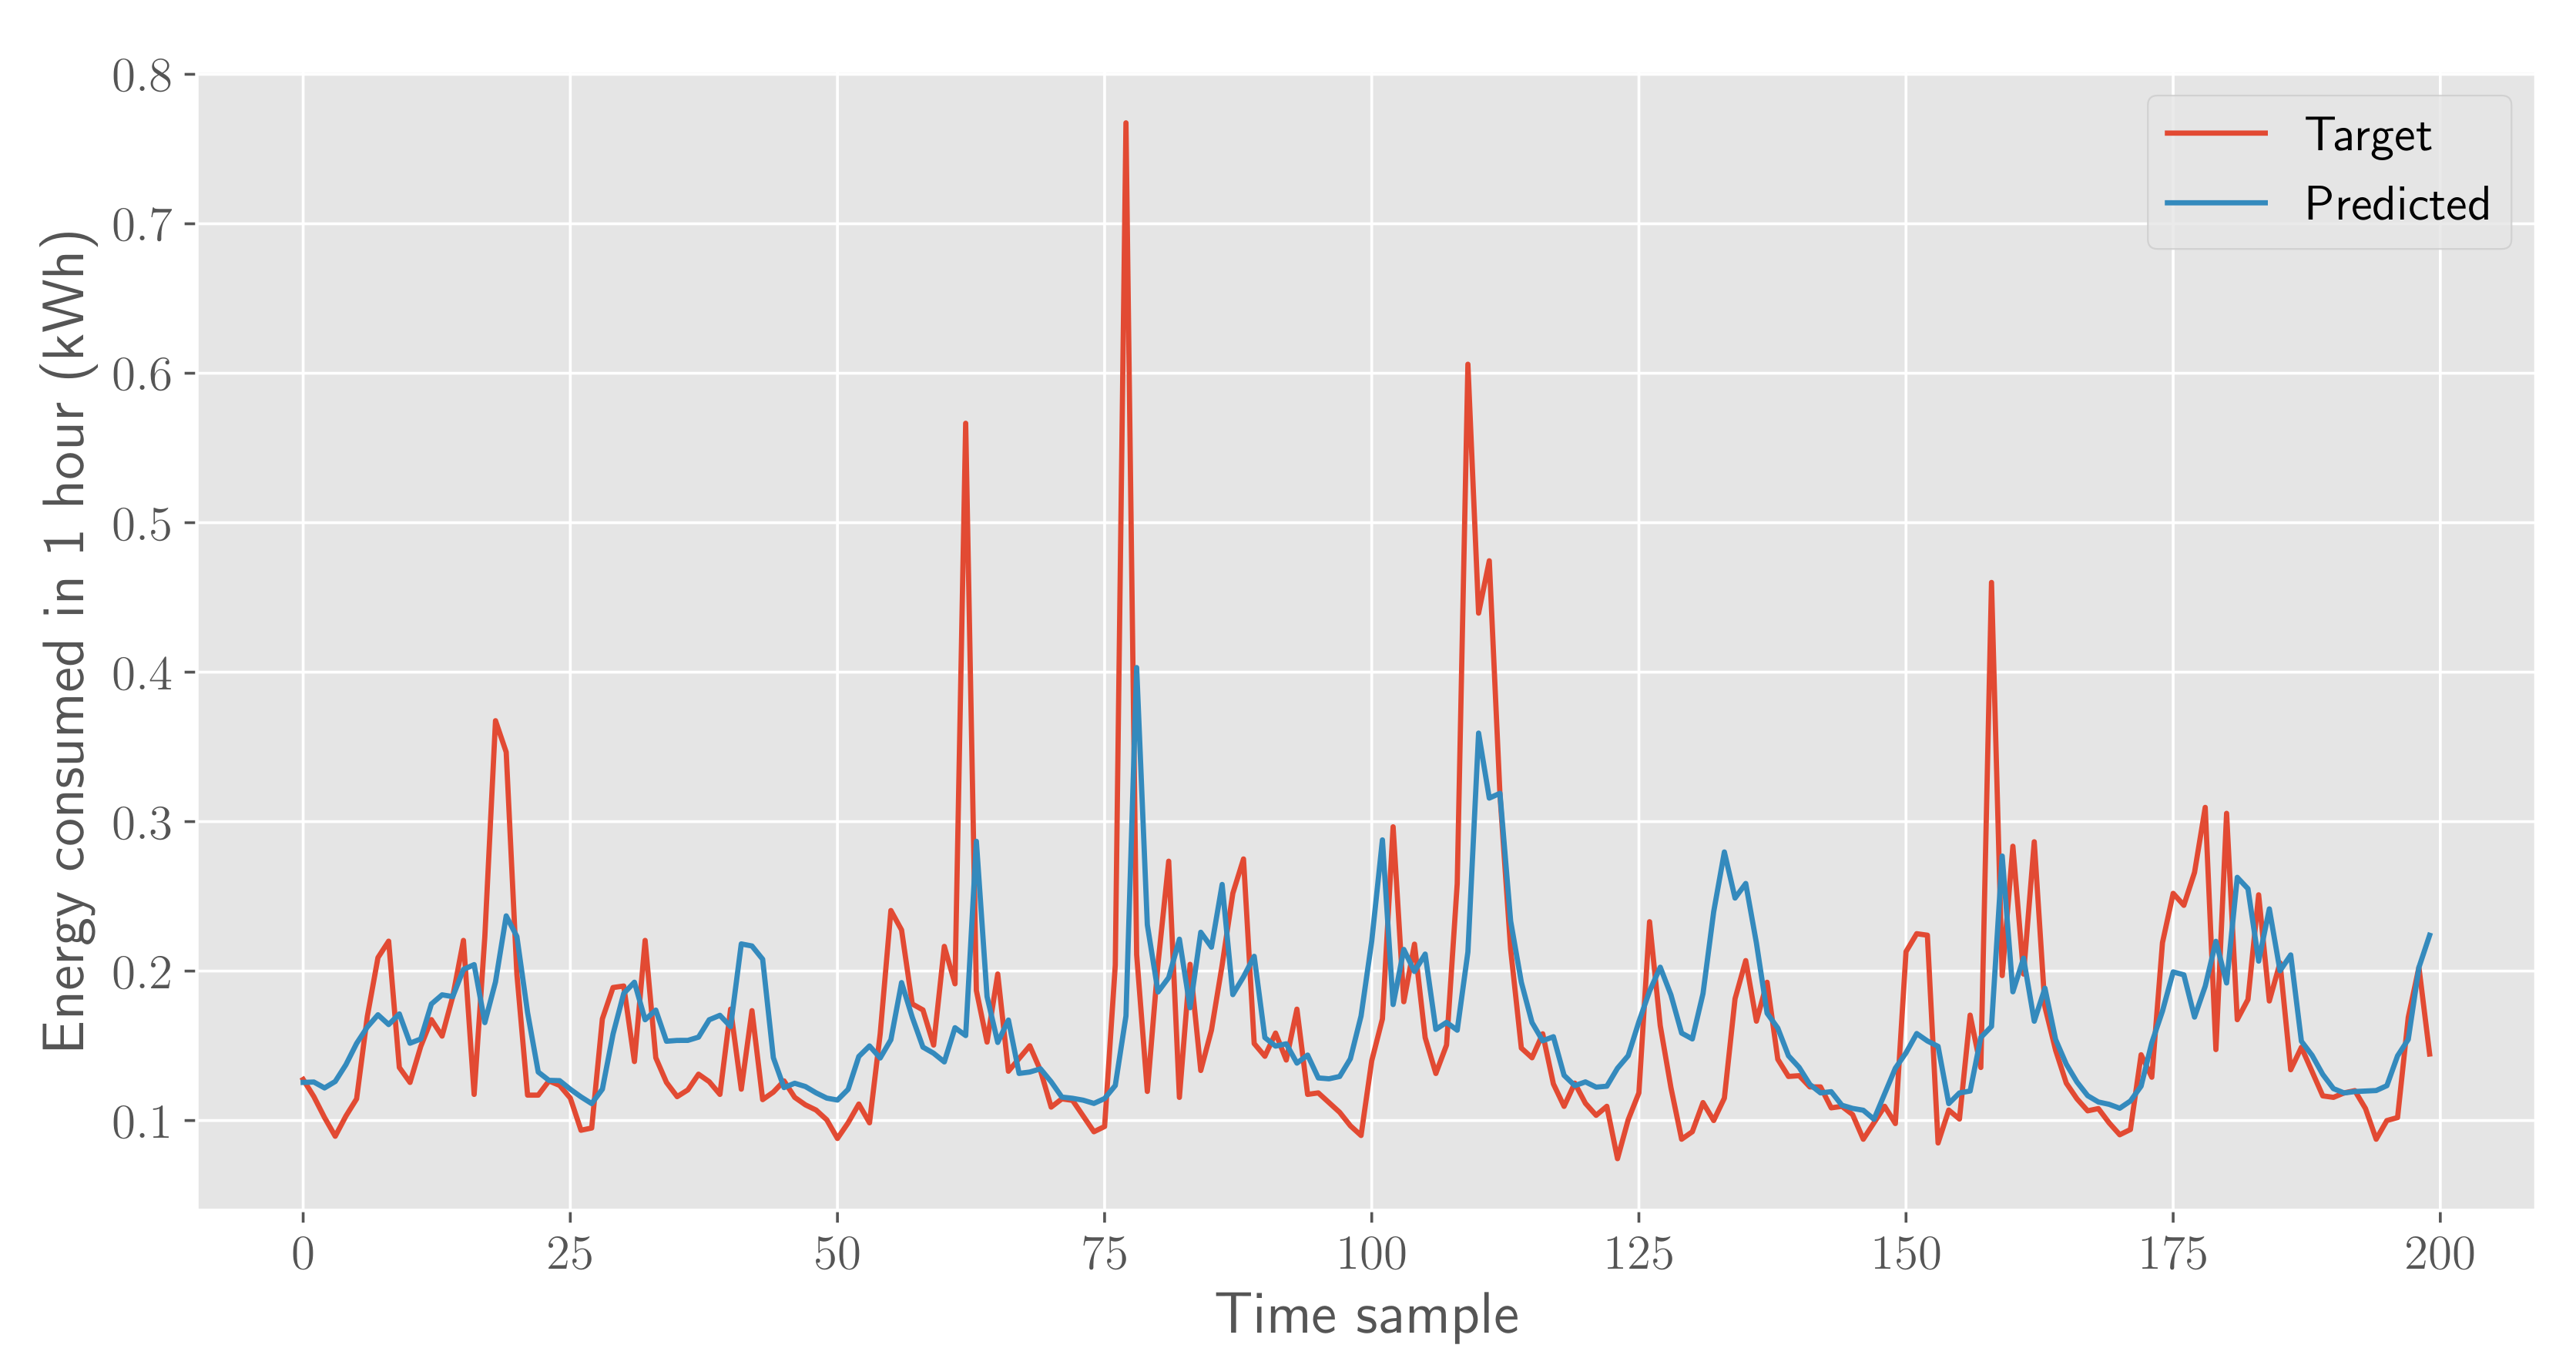
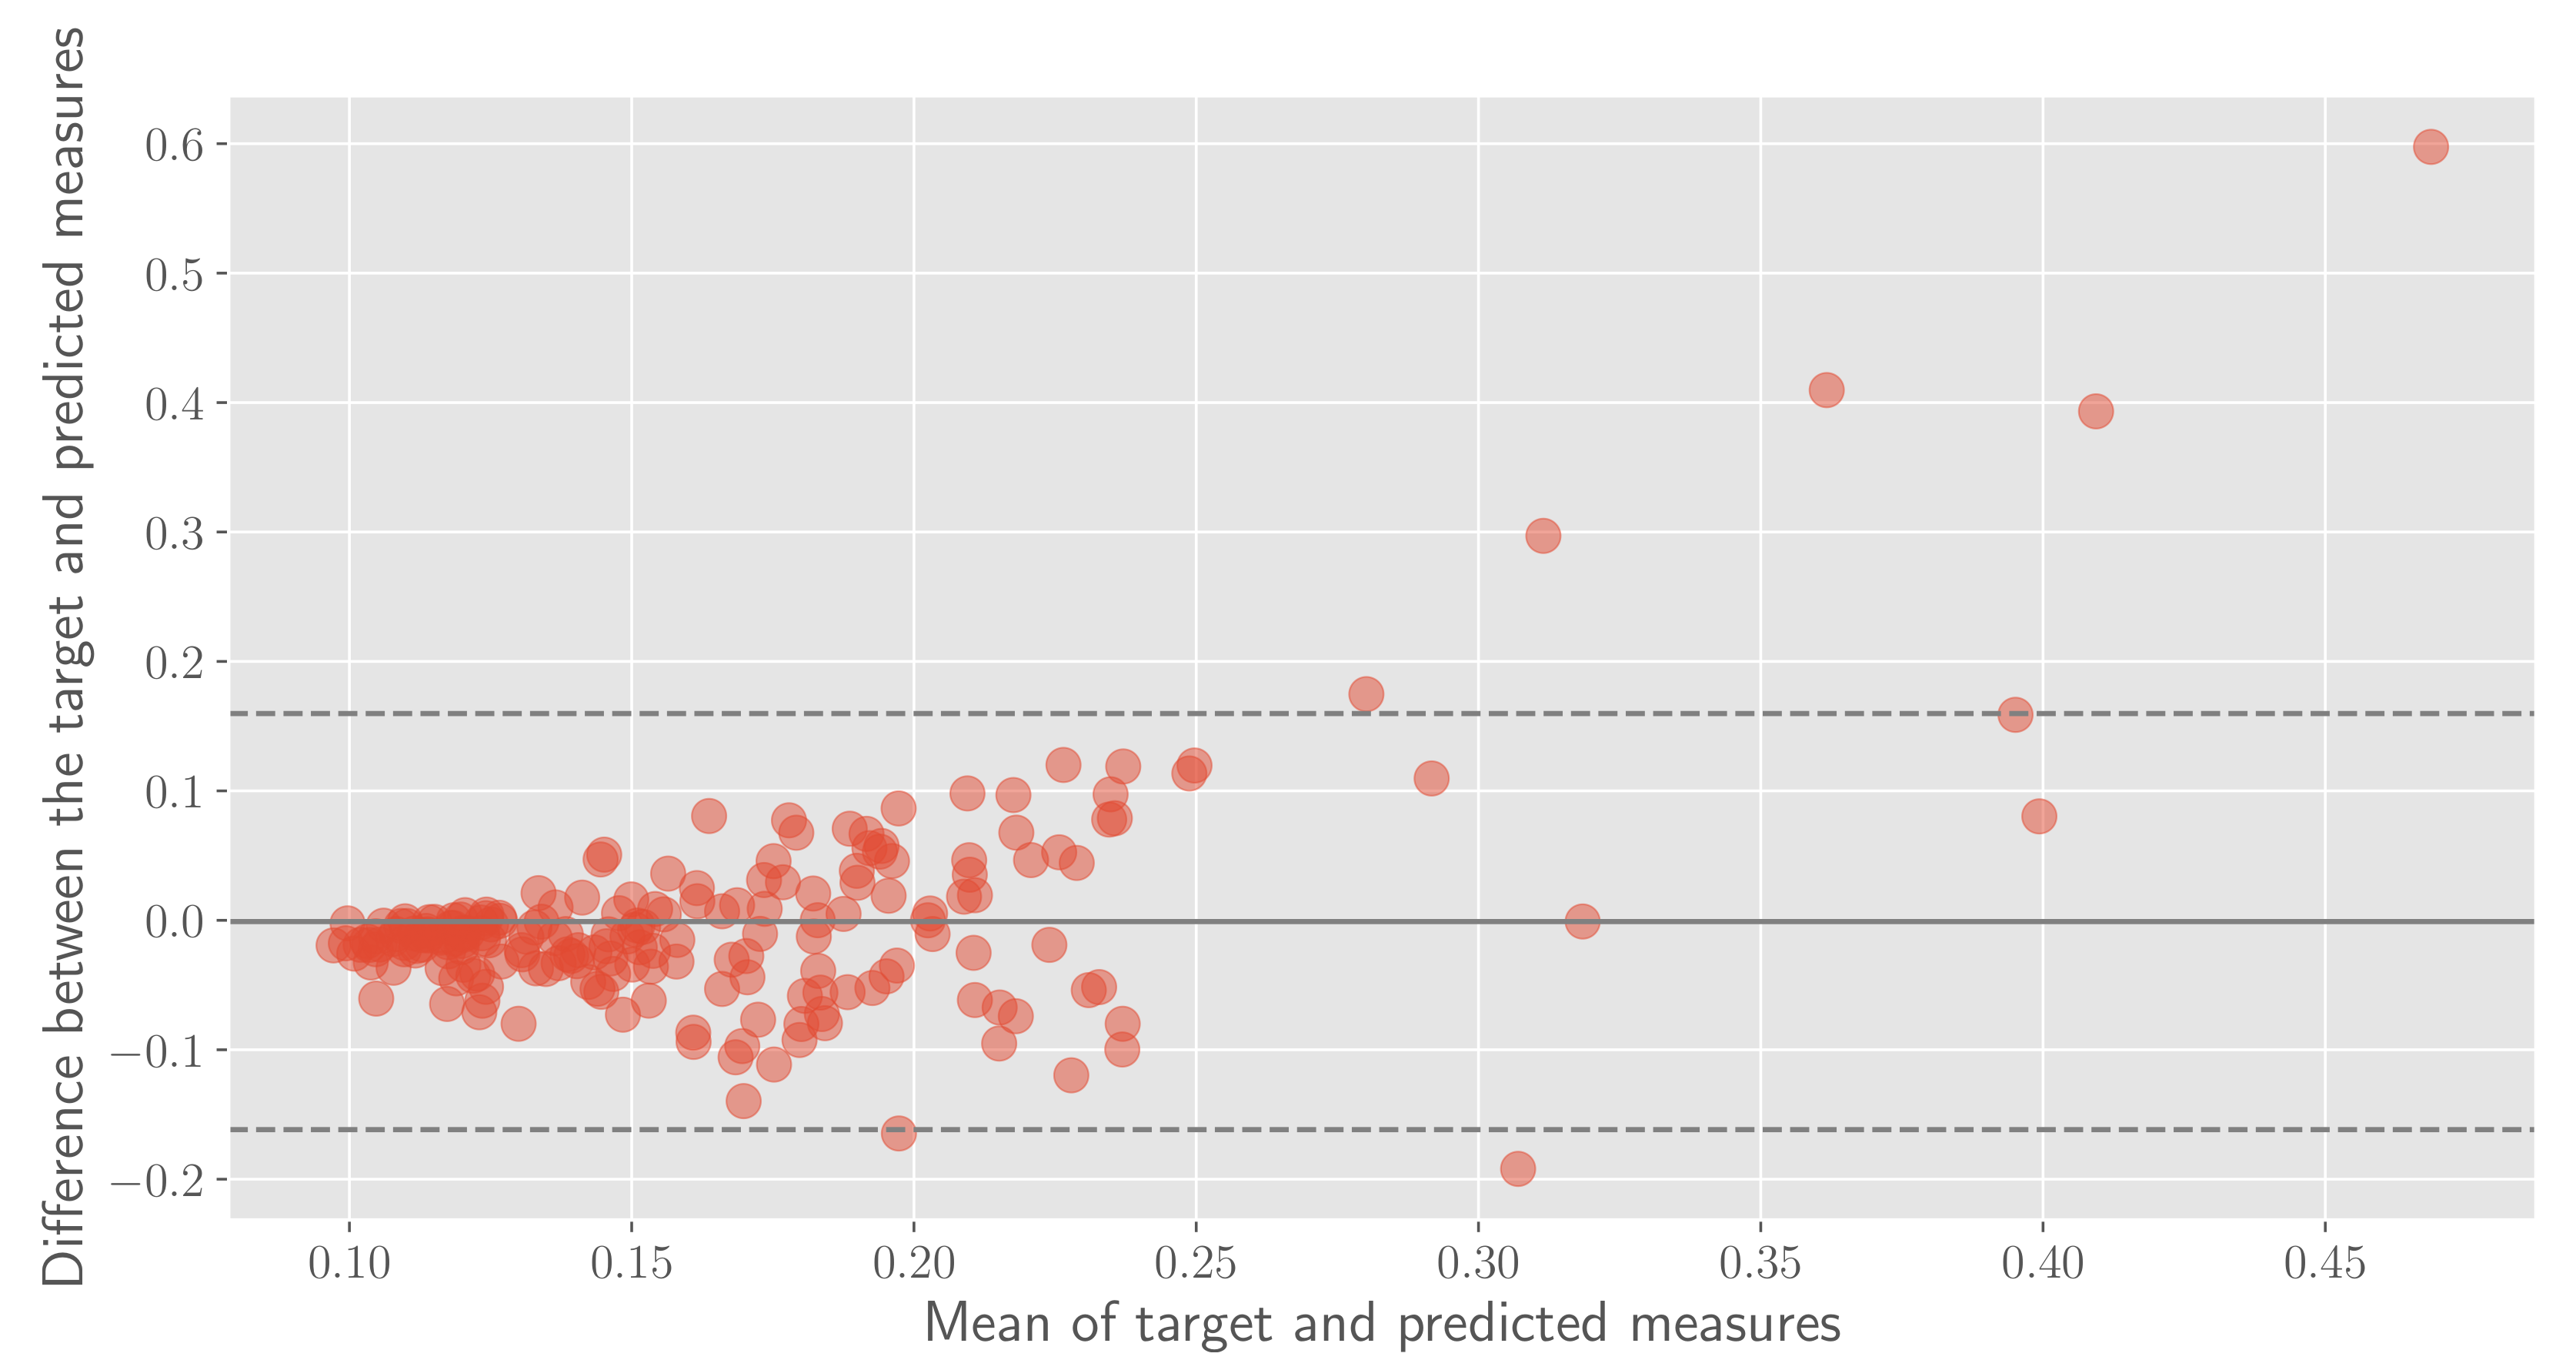
  • RQ3: Do we have evidence of the most difficult data sample to predict?
  • RQ4: What is the impact of federated learning in the training process, in terms of both time and network overhead?
The performance of LSTM models is measured in terms of the root mean squared error (RMSE) between the actual and predicted values across the test set. When time is measured, each experiment is repeated five times in order to ensure statistically sound results for each dataset and scenario, and the average of the measured values is reported.

5.3. Results Analysis

To address RQ1, we need to report the RMSE measured on the test set when the LSTM model is trained on a cloud server with all data available for each dwelling, as in Scenario 0, and the RMSE measured on the train set when the LSTM models are trained in a federated learning setting. We select Scenario 3.2 for assessing the federated-learning performance, because it is the more realistic scenario, considering that it was modelled using a real map of a neighbourhood in the city of Pisa. Figure 6 reports the measured performance considering different dwelling types.
In general, the performance obtained in the centralised scenario is better than the performance of the federated-learning scenario. The maximum performance gap is reported with the bungalow dwelling type, which results in a corresponding degradation of 15 % . This can be explained by the fact that, in the federated learning setting, the local LSTM model trained in bungalow dwellings receive the training data from a single smart meter, with a corresponding lower accuracy. On the other hand, flat and terraced house dwellings host the largest number of households, resulting in small or negligible performance losses.
To answer RQ1, we conclude that, as expected, the performance, measured in terms of the test RMSE, for the LSTM models for residential energy forecasting trained in a centralized server are better then the performance of the LSTM models trained in a federated learning setting. The performance degradation can range between 15% and 0%, depending on the size of the training dataset available at each training server.
To address RQ2, we report, in Figure 7, the RMSE values measured on the test set for the different federated-learning scenarios: (1) one edge-computing node per household (Scenario 1), (2) one edge-computing node per neighbourhood (Scenario 2) and (3) one edge-computing node per building (Scenarios 3.1 and 3.2).
As we can see, the best scenario corresponds to one edge-computing node per neighbourhood, since the RMSE is the smallest in all cases. This happens because every edge-computing node uses a larger amount of data for training its local model w.r.t. the other scenarios. This allows the local model to better learn the energy consumption patterns and therefore to better predict the future consumption. Similarly, the worst scenario corresponds to one edge-computing node per household.
This occurs because the edge-computing nodes use only the training data available from a single smart meter; therefore, the training of the local models leverage only a limited amount of data. In the one edge-computing node per building scenarios, instead, the performance lies in the middle between the two previous cases, and there are no significant differences between the average and randomly selected cases.
To conclude regarding RQ2, the performance, measured in terms of the test RMSE, of the LSTM models for residential energy forecasting trained in different federated-learning scenarios are better when the data available to each edge-computing node are large; however, in a realistic setting, the performance reduction is less than 10 % .
In order to obtain insight regarding the prediction accuracy, in the following, we report the trace of the real energy consumption versus the predicted value in a single case over time. Figure 8 shows the actual and predicted traces for a semi-detached house, limited to the first 200 samples. The same data is reported in Figure 9 as a Bland–Altman plot. As we can see, the trained LSTM network predicts better the smaller values than large values. Small consumption values are the most frequent values across all traces. Since the LSTM network aims at learning the recurring patterns of the data, it is reasonable to obtain better predictions for more common small values.
At the same time, the LSTM network finds it more difficult to predict the peaks of energy consumption in the correct way. In fact, in Figure 9, we see that, for peak values, i.e., when the mean of the target and predicted measures is large, the difference between the target and predicted values diverges from the null value. In particular, since the reported difference is positive in most cases, the LSTM model tends to predict lower values than the actual ones in the case of peaks.
To conclude regarding RQ3, the trained LSTM network successfully captures the common patterns in the energy-consumption traces while performing worse when predicting the peaks of consumption.
In order to address RQ4 in the following, we analyse the aggregation time and the network overhead in one of the FL configurations. For the sake of brevity, we show the results only for the Scenario 3.1, as the others confirm the same results. The aggregation time is defined as the time between the reception of all the parameters from the clients at the server and the completion of the aggregation process. This provides an estimate of the overhead of the aggregation process at the server for a single round. The network overhead, instead, is defined as the overall amount of data transmitted between the clients and the server for the whole experiment.
In Table 4, the average aggregation time for one federated round is reported along with the standard deviation and confidence intervals in order to assess the variability of the aggregation time over different rounds. As it can be seen, the overall aggregation time is low, i.e., always below 100 ms. The standard deviation is small as well, thus, confirming that the aggregation time does not change significantly from one run to another.
In Table 5, we report the network overhead for both the centralized and federated configurations. As expected, the federated configuration results in a noticeably higher overhead in terms of the data transmitted between the smart meters and the server (in the centralized scenario) and between the clients and the server (in the federated scenario). This can be explained considering that, in the centralized scenario, all the data is transmitted to the server, while, in the federated scenario, the models are transmitted from each client to the server—once for each round executed during the experiment. Although the federated solution results in a higher network overhead, it is important to notice that the overall data can be transferred easily via any of the wide-area network technologies available today.

5.4. Results Summary

To summarize the results from our experiments, we conclude the following:
  • Centralized vs. Federated. In terms of the accuracy, the centralized solution results in better predictions than any federated configuration. This loss of performance is due to the partitioning of the overall dataset among the different edge-computing nodes. Consequently, a centralized solution results in a better accuracy, however, at the cost of a lower level of privacy.
  • Different federated configurations. Different federated configurations with different privacy levels result in different levels of accuracy depending on how the overall data is partitioned across different edge-computing nodes. Generally, the higher the level of privacy, the lower the accuracy. This is due to the fact that increasing the level of privacy, e.g., by installing one edge node per household, means reducing the amount of data available for the model training. The federated approach can help in mitigating this loss, which is, however, still noticeable in our results. If we compare the loss of accuracy in absolute terms, however, we can notice that the loss is not very significant, and consequently the adoption of a federated approach is still feasible.
  • Overhead. Although a federated-learning solution results in a higher network overhead, the overall data transmitted in the network is low, and it can be supported by any wide area network technology with a small cost.

6. Conclusions

In this paper, we presented a study of a residential energy forecasting based on federated learning and edge computing in order to preserve the privacy of energy consumption data. The proposed approach was assessed via a real set of experiments in different configurations with different privacy levels against the traditional centralized approach.
Our results showed that the federated-learning approach resulted in a lower accuracy; the loss, however, was limited. Moreover, the results obtained from the scenarios with different edge-computing configurations highlighted that increased privacy is usually traded with a reduced accuracy in the overall prediction. In terms of the overhead, in particular for communication, the federated-learning solutions resulted in a higher data transfer, which can, however, be easily supported by the wireless/wired communication technologies available today.
As future work, we plan to run a set of experiments using real devices and investigate solutions to further reduce the accuracy loss of the federated-learning solutions highlighted by our results. Moreover, we plan to assess the robustness of federated learning for our scenarios with asynchronous model updates and heterogeneous power meters. Finally, to assess the impact of the neighbourhood sizes, we plan to implement different sampling strategies and dimensions to generate the household clusters under investigation.

Author Contributions

Conceptualization, N.T. and C.V.; methodology, N.T. and C.V.; software, E.P.; validation, E.P., investigation, E.P., N.T. and C.V.; resources, N.T. and C.V.; data curation, E.P.; writing—original draft preparation, N.T. and C.V.; writing—review and editing, N.T. and C.V.; visualization, E.P.; supervision, N.T. and C.V.; project administration, N.T. and C.V.; funding acquisition, N.T. and C.V. All authors have read and agreed to the published version of the manuscript.

Funding

Work supported by the Italian Ministry of Education and Research (MIUR) in the framework of the CrossLab project (Department of Excellence) and by the University of Pisa in the framework of the project AUTENS, Sustainable Energy Autharky.

Data Availability Statement

The data used for this paper is already publicly available: “FUZZ-IEEE Competition on Explainable Energy Prediction”.

Conflicts of Interest

Authors have no conflict of interest.

References

  1. Ahmad, T.; Zhang, H.; Yan, B. A review on renewable energy and electricity requirement forecasting models for smart grid and buildings. Sustain. Cities Soc. 2020, 55, 102052. [Google Scholar] [CrossRef]
  2. Podgorelec, V.; Karakatič, S.; Fister, I.; Brezočnik, L.; Pečnik, Š.; Vrbančič, G. Digital Transformation Using Artificial Intelligence and Machine Learning: An Electrical Energy Consumption Case. In International Conference “New Technologies, Development and Applications”; Springer: Berlin/Heidelberg, Germany, 2022; pp. 498–504. [Google Scholar]
  3. Khan, W.Z.; Ahmed, E.; Hakak, S.; Yaqoob, I.; Ahmed, A. Edge computing: A survey. Future Gener. Comput. Syst. 2019, 97, 219–235. [Google Scholar] [CrossRef]
  4. McMahan, B.; Moore, E.; Ramage, D.; Hampson, S.; Arcas, B.A. Communication-Efficient Learning of Deep Networks from Decentralized Data. In Proceedings of the20th International Conference on Artificial Intelligence and Statistics, Fort Lauderdale, FL, USA, 20–22 April 2017. [Google Scholar]
  5. Kairouz, P.; McMahan, H.B.; Avent, B.; Bellet, A.; Bennis, M.; Bhagoji, A.N.; Bonawitz, K.; Charles, Z.; Cormode, G.; Cummings, R.; et al. Advances and Open Problems in Federated Learning. arXiv 2019, arXiv:abs/1912.04977. [Google Scholar]
  6. Gassar, A.A.A.; Cha, S.H. Energy prediction techniques for large-scale buildings towards a sustainable built environment: A review. Energy Build. 2020, 224, 110238. [Google Scholar] [CrossRef]
  7. Wang, X.; Zhao, T.; Liu, H.; He, R. Power Consumption Predicting and Anomaly Detection Based on Long Short-Term Memory Neural Network. In Proceedings of the 2019 IEEE fourth International Conference on Cloud Computing and Big Data Analysis (ICCCBDA), Chengdu, China, 12–15 April 2019; pp. 487–491. [Google Scholar] [CrossRef]
  8. Mpawenimana, I.; Pegatoquet, A.; Roy, V.; Rodriguez, L.; Belleudy, C. A comparative study of LSTM and ARIMA for energy load prediction with enhanced data preprocessing. In Proceedings of the 2020 IEEE Sensors Applications Symposium (SAS), Kuala Lumpur, Malaysia, 9–11 March 2020; pp. 1–6. [Google Scholar] [CrossRef]
  9. Kim, T.Y.; Cho, S.B. Predicting residential energy consumption using CNN-LSTM neural networks. Energy 2019, 182, 72–81. [Google Scholar] [CrossRef]
  10. Kong, W.; Dong, Z.Y.; Jia, Y.; Hill, D.J.; Xu, Y.; Zhang, Y. Short-Term Residential Load Forecasting Based on LSTM Recurrent Neural Network. IEEE Trans. Smart Grid 2019, 10, 841–851. [Google Scholar] [CrossRef]
  11. Tovar, M.; Robles, M.; Rashid, F. PV Power Prediction, Using CNN-LSTM Hybrid Neural Network Model. Case of Study: Temixco-Morelos, México. Energies 2020, 13, 6512. [Google Scholar] [CrossRef]
  12. Cauteruccio, F.; Cinelli, L.; Fortino, G.; Savaglio, C.; Terracina, G.; Ursino, D.; Virgili, L. An approach to compute the scope of a social object in a Multi-IoT scenario. Pervasive Mob. Comput. 2020, 67, 101223. [Google Scholar] [CrossRef]
  13. Nicolazzo, S.; Nocera, A.; Ursino, D.; Virgili, L. A privacy-preserving approach to prevent feature disclosure in an IoT scenario. Future Gener. Comput. Syst. 2020, 105, 502–519. [Google Scholar] [CrossRef]
  14. Saputra, Y.M.; Hoang, D.T.; Nguyen, D.N.; Dutkiewicz, E.; Mueck, M.D.; Srikanteswara, S. Energy Demand Prediction with Federated Learning for Electric Vehicle Networks. In Proceedings of the 2019 IEEE Global Communications Conference (GLOBECOM), Waikoloa, HI, USA, 9–13 December 2019; pp. 1–6. [Google Scholar] [CrossRef]
  15. Sater, R.A.; Hamza, A.B. A Federated Learning Approach to Anomaly Detection in Smart Buildings. ACM Trans. Internet Things 2021, 2, 1–23. [Google Scholar] [CrossRef]
  16. Fekri, M.N.; Grolinger, K.; Mir, S. Distributed Load Forecasting Using Smart Meter Data: Federated Learning With Recurrent Neural Networks. Int. J. Electr. Power Energy Syst. 2022, 137, 107669. [Google Scholar] [CrossRef]
  17. McMahan, B.; Moore, E.; Ramage, D.; Hampson, S.; Arcas, B.A. Communication-Efficient Learning of Deep Networks from Decentralized Data. arXiv 2016, arXiv:1602.05629. [Google Scholar]
  18. Triguero, I. FUZZ-IEEE Competition on Explainable Energy Prediction. 2020. Available online: https://ieee-dataport.org/competitions/fuzz-ieee-competition-explainable-energy-prediction (accessed on 5 July 2022).
  19. Beutel, D.J.; Topal, T.; Mathur, A.; Qiu, X.; Parcollet, T.; Lane, N.D. Flower: A Friendly Federated Learning Research Framework. arXiv 2020, arXiv:2007.14390. [Google Scholar]
  20. Reddi, S.; Charles, Z.; Zaheer, M.; Garrett, Z.; Rush, K.; Konečný, J.; Kumar, S.; McMahan, H.B. Adaptive Federated Optimization. arXiv 2020, arXiv:2003.00295. [Google Scholar] [CrossRef]
Figure 1. Centralized architecture schema.
Iot 03 00021 g001
Figure 4. Federated-learning scenarios. (a) Scenario 1: One edge-computing node per household. (b) Scenario 2: One edge-computing node per neighbourhood. (c) Scenario 3: One edge-computing node per building.
Iot 03 00021 g004
Figure 6. The forecasting performance comparison between centralized and federated scenarios.
Iot 03 00021 g006
Figure 7. Forecasting performance comparison between all the scenarios.
Iot 03 00021 g007
Figure 8. The actual and predicted traces for a semi-detached house, limited to the first 200 samples.
Iot 03 00021 g008
Figure 9. Blend–Altman plot of the actual and predicted traces for a semi-detached house, limited to the first 200 samples.
Iot 03 00021 g009
Table 1. The number of smart meters for each dataset.
Housing TypeNumber of Smart MetersDistribution
Bungalow14117%
Detached House16019%
Flat385%
Semi Detached32139%
Terraced House16120%
All821100%
Table 2. LSTM hidden layer size for each dataset calibrated on the validation dataset.
Housing TypeHidden Layer Size
Bungalow20
Detached House40
Flat40
Semi Detached50
Terraced House40
All30
Table 3. Summary of the training parameters.
Parameter NameValue
Number of centralized epochs50
Number of federated epochs3
Number of federated rounds50
Learning rate 10 3
Drop out0.2
Early stop threshold5
Early stop tolerance 10 4
Table 4. The mean aggregation time of one round. Scenario 3.2. Confidence level = 95%.
DatasetMean Aggr. Time (s)Std. Dev.Confidence Interval
Bungalow0.12370.0307[0.1149 0.1325]
Flat0.00310.0004[0.003 0.0032]
Semi Detached House0.08540.0651[0.0667 0.1040 ]
Detached House0.04190.0037[0.0409 0.0430 ]
Terraced House0.01530.0022[0.0147 0.0159]
Table 5. The network overhead in centralized and federated scenarios (Scenario 3.2).
DatasetCentralized Overhead (MB)Federated Overhead (MB)
Flat3.1555.38
Detached House3.5779.20
Bungalow0.844.65
Semi Detached House7.17207.06
Terraced House3.6016.26
Publisher’s Note: MDPI stays neutral with regard to jurisdictional claims in published maps and institutional affiliations.

