Polarization and Consensus in a Voter Model under Time-Fluctuating Influences


Department of Applied Mathematics, School of Mathematics, University of Leeds, Leeds LS2 9JT, UK
Physics 2023, 5(2), 517-536; https://doi.org/10.3390/physics5020037
Submission received: 14 March 2023
/
Revised: 7 April 2023
/
Accepted: 13 April 2023
/
Published: 8 May 2023
(This article belongs to the Special Issue In Honor of Professor Serge Galam for His 70th Birthday and Forty Years of Sociophysics)
Abstract
:We study the effect of time-fluctuating social influences on the formation of polarization and consensus in a three-party community consisting of two types of voters (“leftists” and “rightists”) holding extreme opinions, and moderate agents acting as “centrists”. The former are incompatible and do not interact, while centrists hold an intermediate opinion and can interact with extreme voters. When a centrist and a leftist/rightist interact, they can become either both centrists or both leftists/rightists. The population eventually either reaches consensus with one of the three opinions, or a polarization state consisting of a frozen mixture of leftists and rightists. As a main novelty, here agents interact subject to time-fluctuating external influences favouring in turn the spread of leftist and rightist opinions, or the rise of centrism. The fate of the population is determined under various scenarios, and it is shown how the rate of change of external influences can drastically affect the polarization and consensus probabilities, as well as the mean time to reach the final state.
Keywords:
sociophysics; voter models; stochastic processes; polarization; consensus; mean exit time; fluctuations; noise1. Introduction
The relevance of parsimonious individual-based models to describe social phenomena at micro and macro levels has a long history [1,2,3]. In the last few decades, “sociophysics” has grown as a research field that aims at studying collective social behaviour, such as the spread of opinions or the dynamics of cultural diversity, using models and methods from statistical physics [3,4,5,6,7,8,9,10,11,12,13,14]. Typical questions in sociophysics concern the conditions under which consensus, or long-term opinion diversity, emerges in a population of agents (“voters”) whose states (“opinions”) change as they interact.
The voter model (VM) [15], closely related to the Ising model [16], has been commonly used to describe how consensus ensues from the interactions between neighbouring voters. In fact, while the classical two-state VM is arguably the simplest and most popular model of opinion dynamics, it rests on a number of oversimplifying assumptions: voters are endowed with only two possible states, they are blind to any external stimuli, have zero self-confidence and are all identical. In reality, members of social communities respond differently to stimuli, as they can interact in groups [1,17,18,19], and are usually characterised by multiple attributes [20,21,22,23,24]. In light of this, many generalizations of the VM have been proposed: for instance, “zealotry” was introduced in various forms to endow voters with different levels of self-confidence [25,26,27,28,29,30,31,32,33,34,35,36], while group-size influence is notably captured in the nonlinear q-voter model [37] and its variants [38,39,40,41,42,43,44,45,46]. It has also been noted that in many cases only some of the attributes characterising agents are actually compatible for social interactions [20,24,47,48,49,50,51]. It was thus suggested that agents whose opinions are too different would not interact, while voters holding close opinions can interact and attain a global consensus. This motivated the study of multi-state VMs, such as the constrained three-state voter model (3CVM) of Refs. [52,53,54], which is a discrete version of the bounded-compromise model [47,48,49,50,51]. In the 3CVM, incompatible “leftist” and “rightist” voters can only interact with “centrists”, and the final outcome is either consensus with one of the three parties, or a polarized state consisting of mixture of leftists and rightists. In the latter case, the population is stuck in a frozen state of “polarization” in which leftists and rightists hold uncompromising opinions.
In addition to interactions among agents, external stimuli or influences, especially social media and news sources, play an increasingly important role in shaping the social environment that in turn affects the collective social behaviour [1,55,56,57,58,59,60,61]. Yet, with some recent remarkable exceptions [62,63,64,65], the role of social influences is still rarely modelled in sociophysics. Actually, sources of news play both a crucial, yet complex and multifaceted, role in influencing public social behaviour. They are typically characterised by opposing viewpoints, or agenda, that often change over time and can in turn favour consensus or polarization. It is also worth noting that voter-like models subject to a time-periodic external field have recently been studied in the context of economic networks [66,67].
How do the opinions of a social community evolve in a volatile and time-fluctuating environment? Inspired by this question, here, we introduce a generalization of the constrained three-state voter model [52,53,54] in the presence of binary time-fluctuating external influences. In the same vein as in population dynamics [68,69,70,71,72,73,74,75,76,77,78,79,80,81], for the sake of simplicity, we assume that the media influences endlessly switch from favouring the spread of polarization to promoting centrism, and vice versa. The goal of this work is to determine the fate of the population under various scenarios, and in particular to study how the time variation of the external influences affects the probability to reach polarization or a consensus, as well as the mean time for the population to settle in its final state.
The plan of the paper is as follows: The general formulation of the model is introduced in the next Section. Section 3 is dedicated to a thorough study of the polarization and consensus probabilities. Section 4 focuses on the study of the mean exit time. Section 5 is dedicated to a discussion of the results and to the conclusions. Technical details, including useful results in the absence of external influences, and possible generalizations and applications are discussed in three Appendices.
2. Three-State Constrained Voter Model under Binary Time-Fluctuating Influences
We consider a well-mixed population of N individuals consisting of “rightists”, or R-voters, “leftists”, or L-voters, and “centrists”, or C-voters, with . In the voter model language [7,8,9,13,15], R and L represent extreme opinions, while C-voters hold an intermediate opinion. In the three-state constrained voter model (3CVM) [53,54], an agent selected at random tries to interact with one of its neighbours, that is any other randomly picked voter, at each microscopic update attempt. When the two agents hold the same opinion or if it is a pair of leftist–rightist ( or ), nothing happens. However, if the pair is a centrist C and an L or an R voter ( or ), the initial agent adopts the opinion of the neighbour with a probability that depends on the external influences whose effect is encoded into the random variable that fluctuates with the time t; see below in this Section and Figure 1. Hence, while the interactions between L and R voters and centrists C now change in time with , L and R remain incompatible and the system’s final state is, as in the static 3CVM, either a consensus state or a state of polarization consisting of a frozen mixture of leftists and rightists [53,54]; see below in this Section.
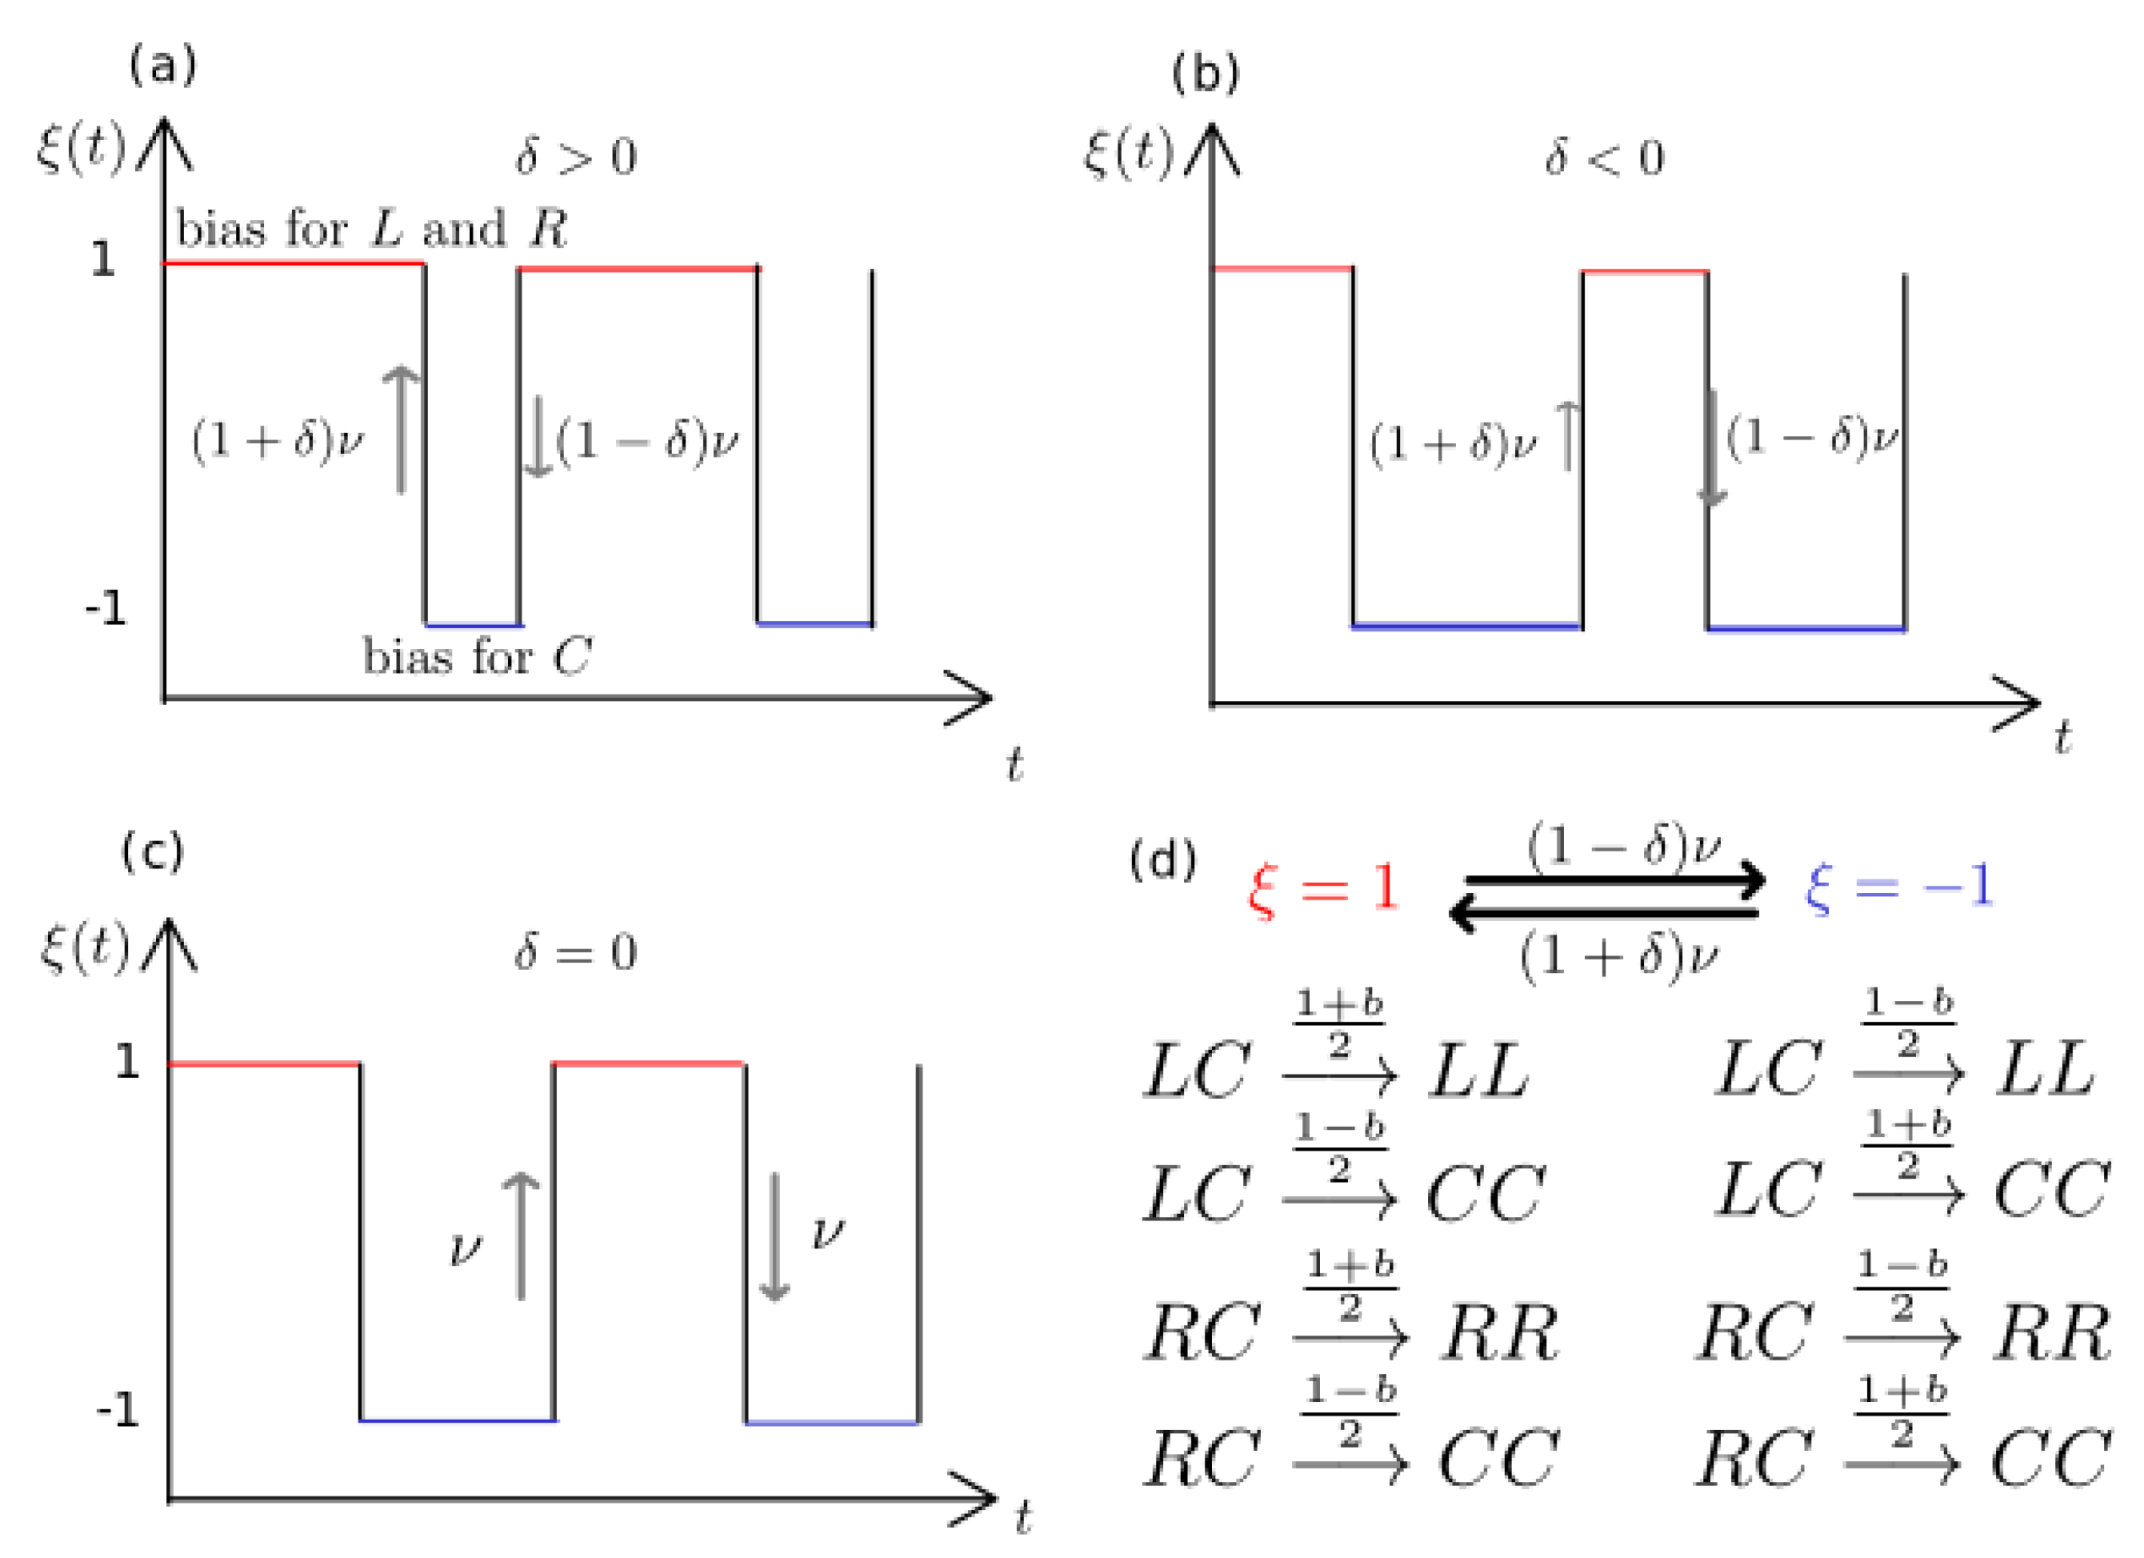
The main novel ingredient of this study is the modelling of time-fluctuating social influences by means of the coloured dichotomous (telegraph) noise [72,73,74]; see Figure 1. The process simply encodes all the complex effects of social environment and external influences in the endless random switching between two states: here, corresponds to external influences favouring L and R opinions (spread of polarization), whereas favours centrism C (compromise between L and R). Here, the dichotomous noise is always at stationarity, and switches from to according to
with a rate , where is the average switching rate [77], and denotes the switching asymmetry. Accordingly, the average time spent in state before switching to is (symmetric switching occurs when ), see Figure 1a–c. At stationarity, with probability [72,73,74], and its (ensemble-)average is
while its autocorrelation is .
The 3CVM switching dynamics is therefore defined by the four reactions: and , corresponding to the spread of extreme opinions at rate , and and , with centrists replacing L and R voters at rate . Here, denotes the social influences bias favouring polarization when and centrism in the social environment . The 3CVM switching dynamics can thus be schematically described by the following reactions occurring at each time increment:
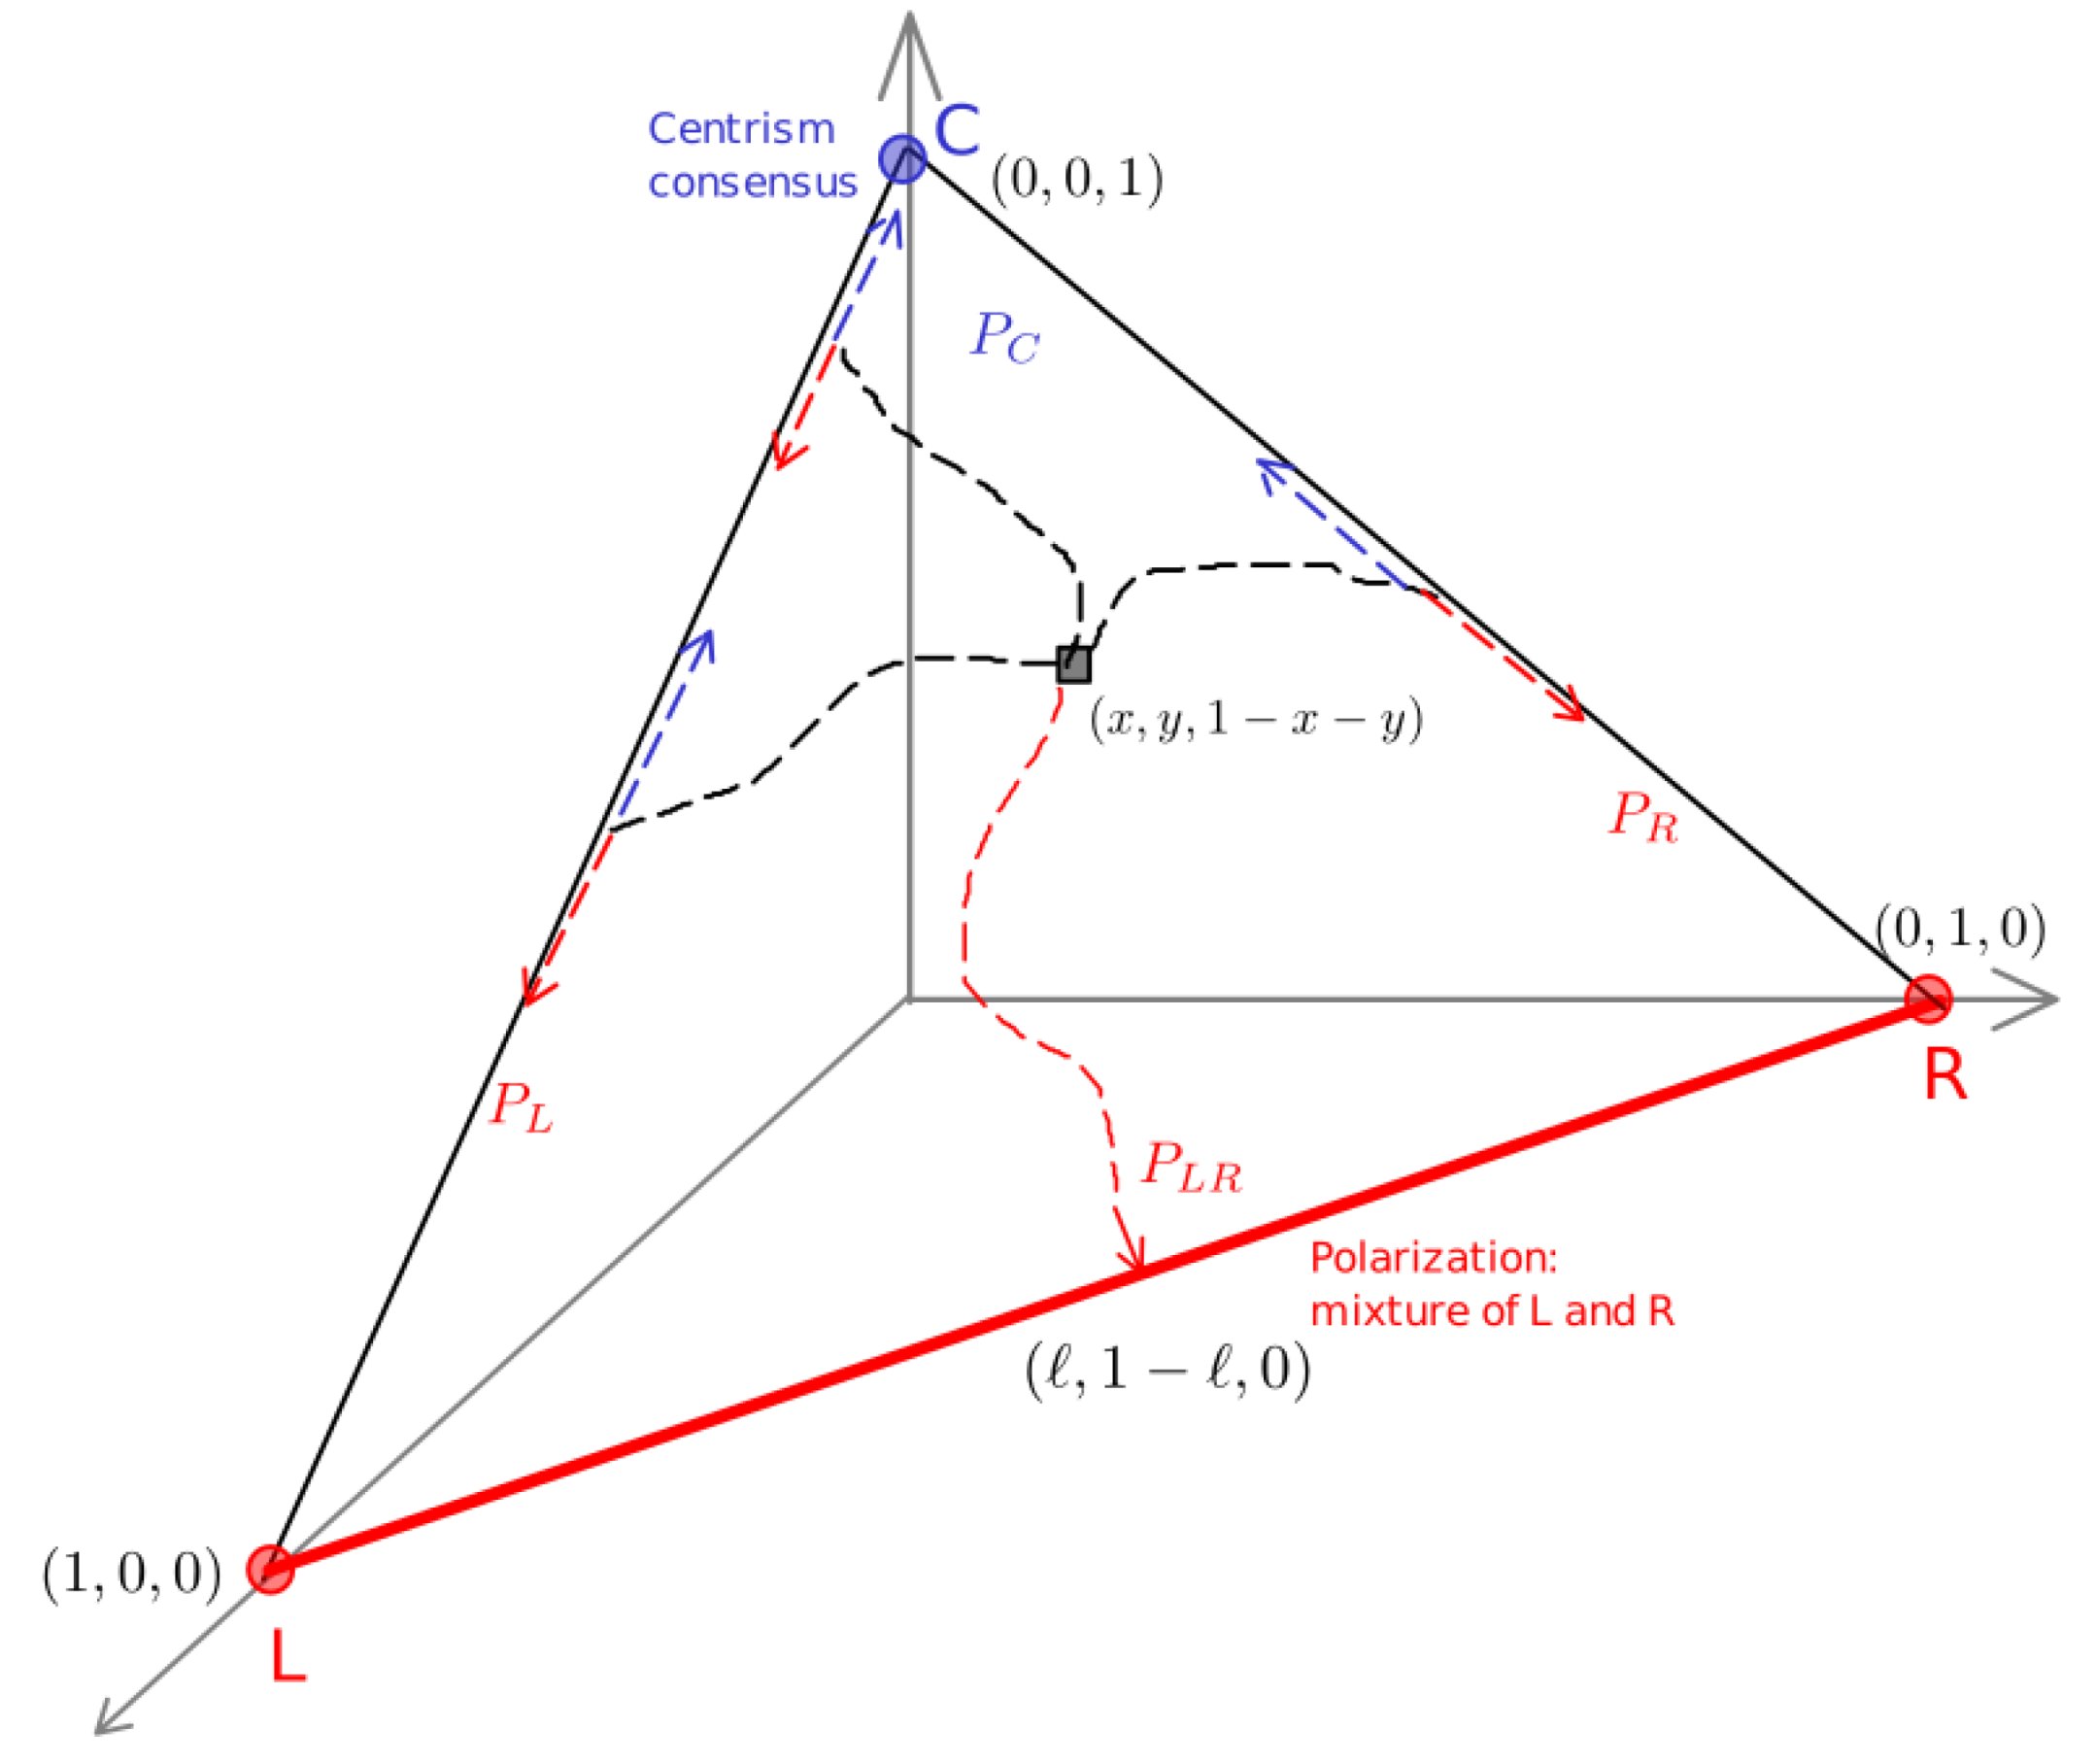
![Physics 05 00037 g002]() where and the rates endlessly fluctuates according to Equation (1). The dynamics of the switching 3CVM is therefore the Markov chain defined by the transition rates (A1) and master Equation (A2) and (A3) [82]; see Appendix A.1. The 3CVM switching dynamics is characterised by three consensus/absorbing states (all-L), (all-R), , (all-C), and by the polarization state (pol-) where , ; see Figure 2. As in the absence of external influences, the final state of the population is therefore guaranteed to be either one of the consensus/absorbing states or pol- [53,54].
where and the rates endlessly fluctuates according to Equation (1). The dynamics of the switching 3CVM is therefore the Markov chain defined by the transition rates (A1) and master Equation (A2) and (A3) [82]; see Appendix A.1. The 3CVM switching dynamics is characterised by three consensus/absorbing states (all-L), (all-R), , (all-C), and by the polarization state (pol-) where , ; see Figure 2. As in the absence of external influences, the final state of the population is therefore guaranteed to be either one of the consensus/absorbing states or pol- [53,54].
Figure 2.
Illustration of the 3CVM dynamics in the simplex . Circles show the consensus (absorbing) states all-L, all-R, and all-C, and the initial condition is . The thick line indicates polarization state (pol-) consisting of a frozen mixture of L and R voters made up of a fraction of L-voters coexisting with an incompatible fraction of R-voters. Dashed lines are typical trajectories: the dynamics ceases when the line pol- is reached (polarization with probability ), or when there is consensus by reaching one of absorbing states all-L, all-R or all-C (with respective probabilities and ). Once a trajectory reaches the line or , the evolution is restricted on , until there is a consensus. As varies, the dynamics favours in turn the spread of L and R () or that of C (). See text for details.

It is worth noting that the approach considered here bears some similarities with the two-party model of Refs. [62,63]. However, there are also important differences: first, in the 3CVM, the polarization state corresponds to a frozen mixture (while it is an active state in Refs. [62,63]). Moreover, external influences are here assumed to fluctuate endlessly in time, rather than by establishing a certain number of connections with voters. It is also interesting to notice that the effect of an exogenous time-varying influence has recently been studied in the context of economic networks [66,67]. The ensuing dynamics derived also from an Ising-like (voter-like) model subject to a time-dependent external field [66,67] has been shown to lead to rich dynamics characterized by hysteresis [83], which is not a phenomemon exhibited by the 3CVM switching dynamics. This stems from the fact that Equation (A4) differ from those governing the mean-field dynamics in Refs. [66,67] for not having any non-noisy linear terms, and for the exogenous time dependence being stochastic (via the multiplicative dichotomous noise ) rather than periodic.
3. Final State: Polarization and Consensus Probabilities
In its final state, the population is either in the polarized state pol-, or in one of its three absorbing/consensus states (all-L, all-R or all-C); see Figure 2. Here, denotes the probability to end up in the polarized final state pol-. The probabilities to reach the absorbing/consensus states all-C, all-L, and all-R are, respectively, denoted by and . The density of voters of each type is and , and initially the population consists of densities of and C voters, respectively.
In the absence of environmental switching, the probabilities of ending in any of the absorbing/consensus or polarization states were found to depend non-trivially on the parameter and [53,54]; see Appendix B. Here, we are interested in finding how and , as well as the final densities depend on under various scenarios. We consider the same initial density of L and R voters, i.e., , which suffices for the purposes of this study and simplifies the analysis. (Only in Appendix C, an example with is briefly considered.) By symmetry, implies , i.e., the probability of L and R consensus is the same. When it occurs, polarization consists of a fraction of L and R voters; see Figure 2. We thus have: , and therefore focus on studying and as functions of for different values of and z, treated as parameters, from which we obtain also the final densities: ; see Appendix A.2.
3.1. Final State in the Regimes and
The polarization and consensus probabilities can be computed analytically in the regimes and . For this, we take advantage of the results obtained in the absence of external influences for the polarization probability , and the probabilities of and R consensus, respectively, denoted here by , and . In the absence of external influences, these quantities have been obtained in Refs. [53,54] and are summarized in Appendix B.1.
3.1.1. Polarization and Consensus Probabilities in the Regime
When , we can assume that there are no switches before attaining polarization or consensus. In this case, is a quenched random variable, and the kinetics is the superposition, with probability , of the 3CVM dynamics in the stationary environment . As a result, the polarization probability when , , is the superposition of , obtained in a static external state , with probability :
which is readily obtained from Equation (A5) or (A7). Similarly, the consensus probabilities when , are obtained from (A5), with Equations (A6) and (A8), and :
3.1.2. Polarization and Consensus Probabilities in the Regime
When , so many switches occur before polarization or consensus that self-averages [71,72,75,76,77,78]. In this case, is an annealed random variable that can be replaced by its average: . The switching dynamics of the 3CVM with is thus the same as in Ref. [54], with . In the limit , the polarization probability, , is therefore obtained from Equation (A5) or (A7) according to
Similarly, the consensus probabilities under high , , are obtained from Equations (A6) and (A7):
Since when and when and [54] (see Appendix B.1), the focus here is on the regime where the small influences bias affects a large but finite number of voters, i.e., and , with . This allows us to highlight the effect of the external influences.
3.2. Polarization and Consensus Probabilities When
When , most of the time is spent in the external state , where influences favour polarization (pol-); see Figure 1 and Figure 2.
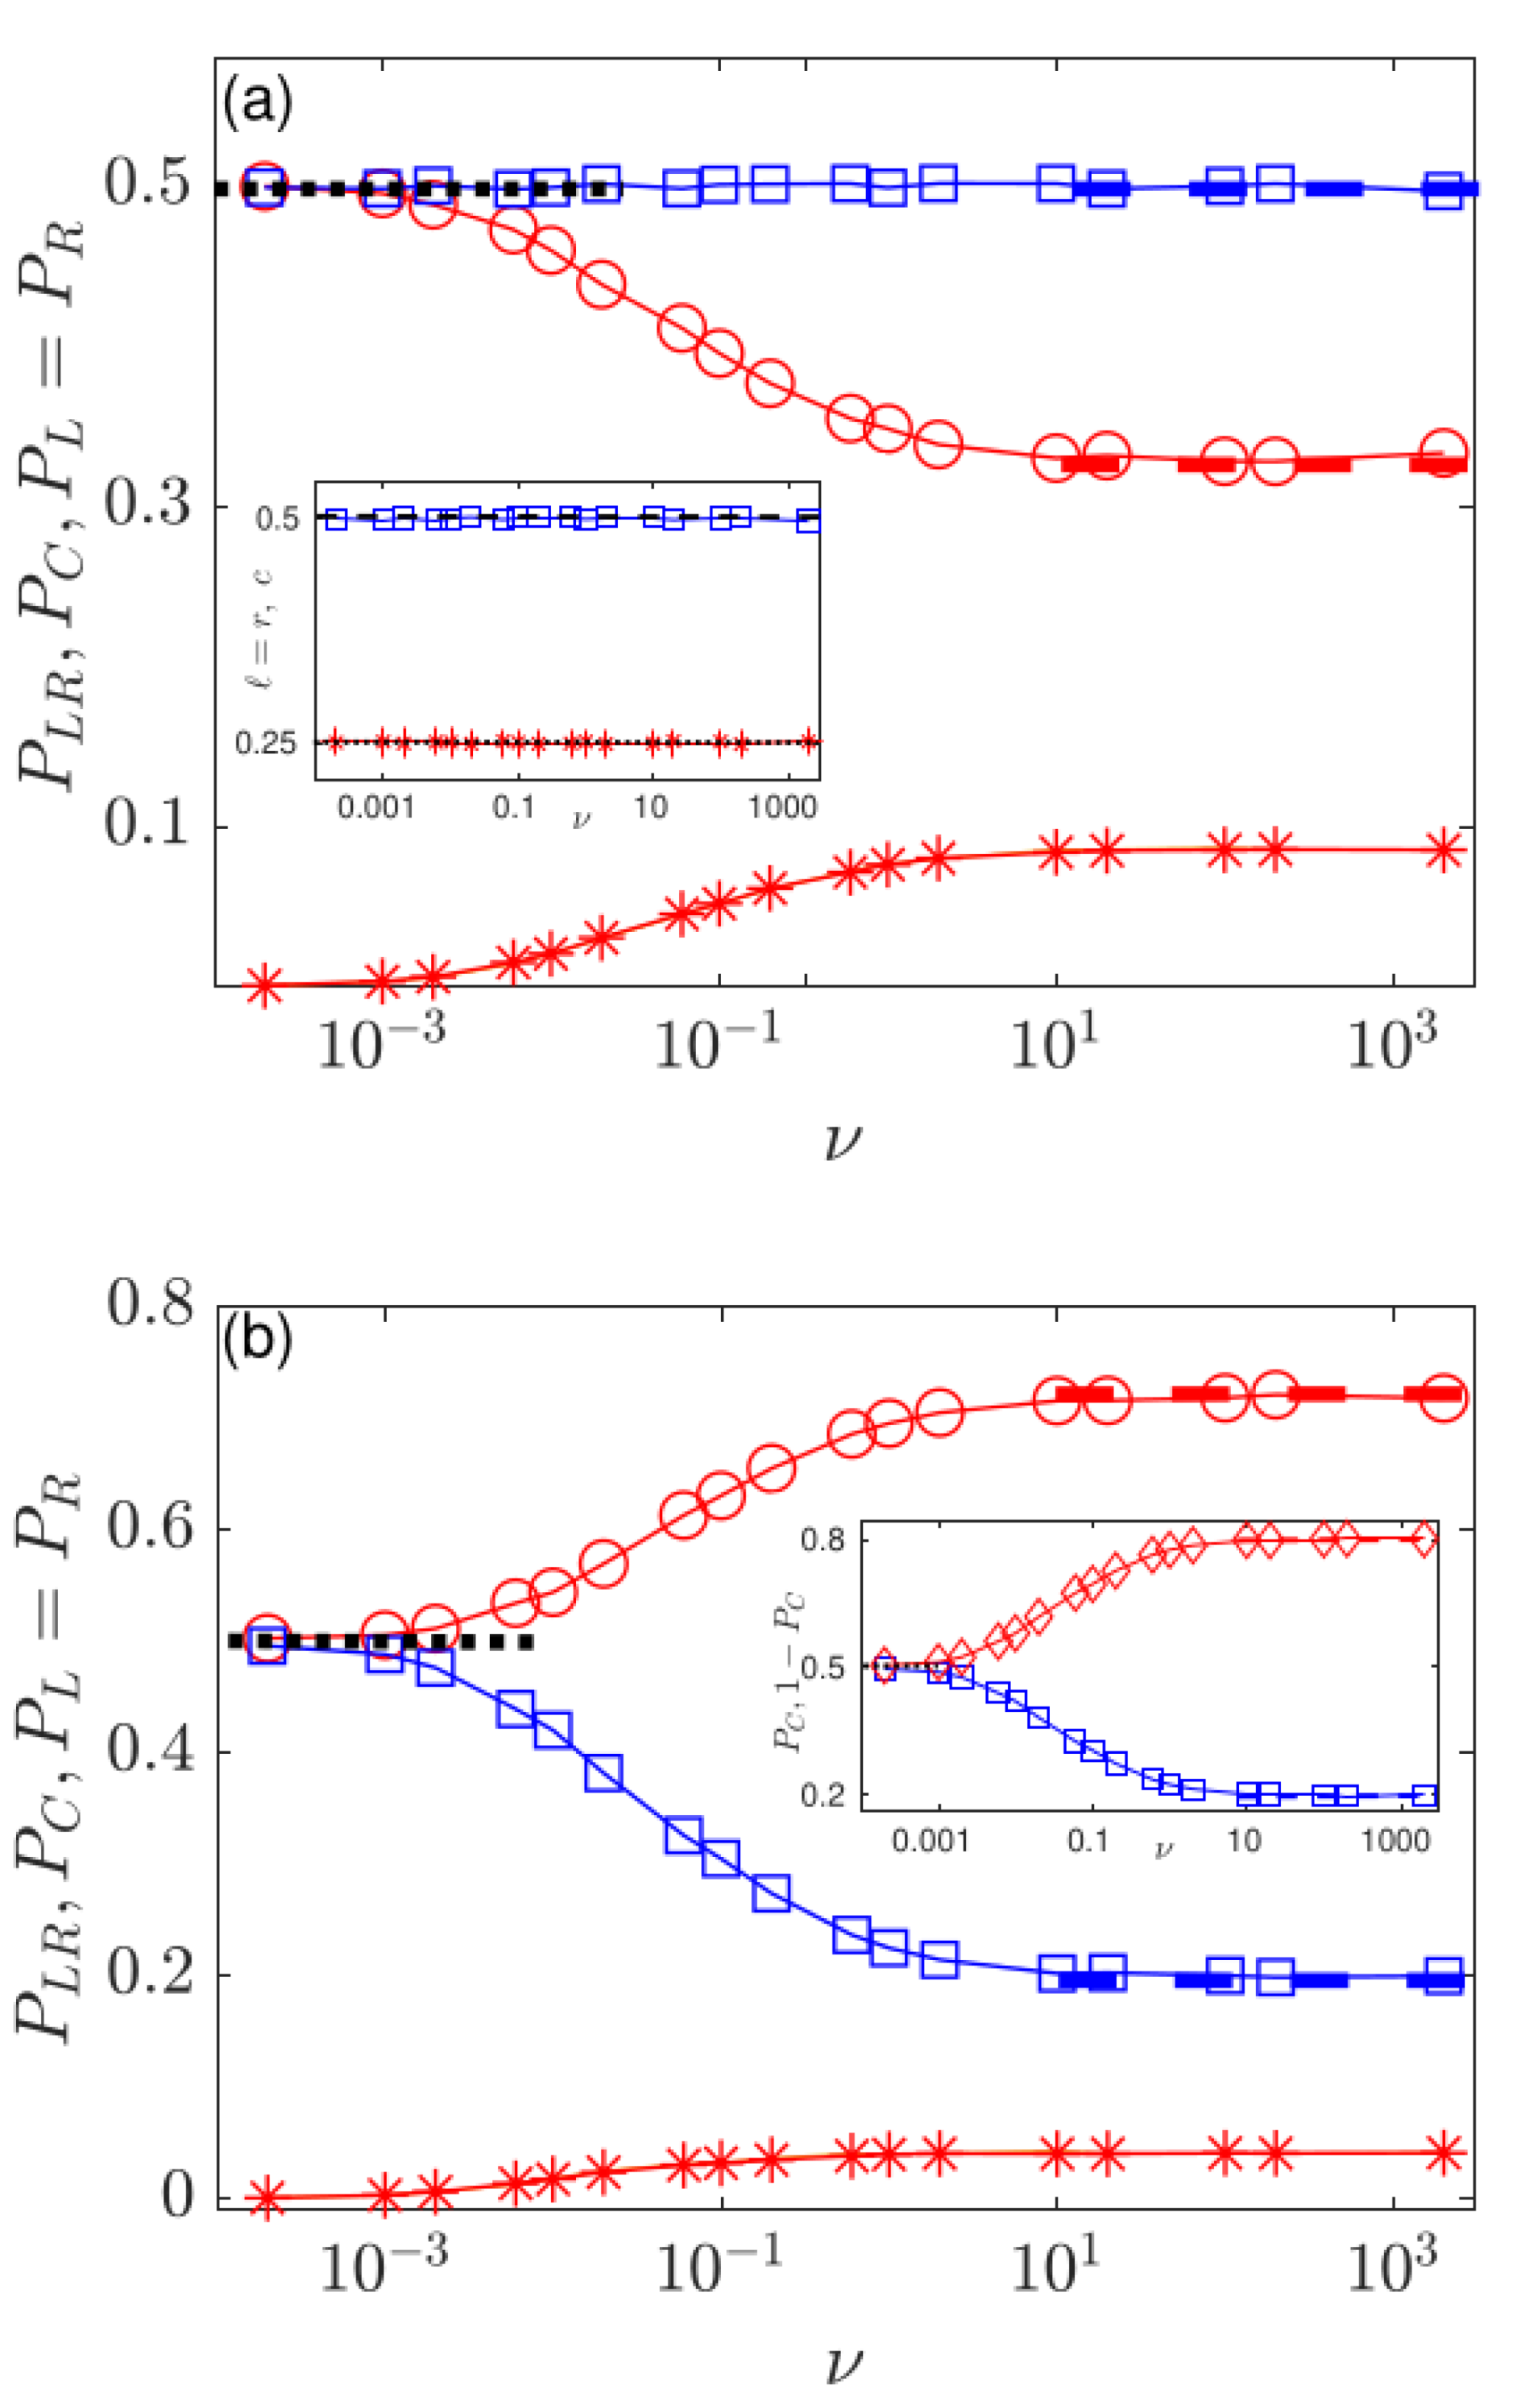
In fact, as shown in Figure 3a, when z is not too close to 1, for all values of . In this case, increases with over a large range of values (for ), with when and when , whereas is a decreasing function of , with when and when ; see Figure 3a. The fact that and vary little with , and are quite close to and , indicates that the analytical predictions for and not only apply to the limits , but are also valid approximations of and in the regimes of low and high switching rate (see also Section 4 below). We can also notice in Figure 3a, that exhibits a weak non-monotonic behaviour, with a “dip” for . In this setting, the final fraction of L and R voters, given by (see Appendix A.2), is an increasing function of , while the final density of centrists, , decreases with ; see inset in Figure 3a.
When there is a small initial fraction of L and R voters, with z close to 1, centrism can prevail over a large range of values of : for , see Figure 3b. The probability thus decreases with , while can have a non-monotonic behaviour as in Figure 3b where it exhibits a “bump” for . In this case, centrists hold the majority opinion over an intermediate range of : , i.e., when ; see inset in Figure 3b.
In Figure 3, the predictions (3), (4), (6) and (7) for and are in good agreement with simulation data when and , respectively. The results reported in Figure 3 show that when the main effects of the switching external influences is to tame the bias favouring polarization. and can thus increase or decrease with , and even have a local extremum at a nontrivial switching rate. We explain this by solving, at fixed , and for and with Equations (3), (4), (6) and (7):
Using (A5) and (A6), these equations are solved for and . When , while when . Similarly, when and for . In the examples of Figure 3, and , and therefore in Figure 3a and in Figure 3b, which agrees with and reported in Figure 3a, and with in Figure 3b.
The extrema of and in Figure 3 at can be explained heuristically (and similarly for those in Figure 4, while there are no extrema in Figure 5; see below). In fact, when , the population remains in the initial external state until polarization or consensus occurs. When and , polarization occurs with a probability close to 1 if and close to 0 otherwise, and we have . We argue that decreases with when this rate is raised from to . For the sake of argument, we focus on the switching rate for which there is one external switch before reaching the final state. As discussed in Section 4.2 below, we have (see the inset in Figure 6b), with , and the population settles in its final state after a time . Hence, if , the final state is polarization if pol- is reached in a time , when still . This occurs approximately with a probability . On the other hand, if , the final state is polarization if pol- is reached after the external switch, when , i.e., for , and this occurs with an approximate probability . Hence, we estimate
which explains that decreases with when . When is increased further above b, increases with and approaches . This explains qualitatively the non-monotonic behaviour of in Figure 3a, with a dip at , and , while the rough estimate, with (see Figure 6a), gives . Similarly, in Figure 3b, , which results in a “bump” in at some .
3.3. Polarization and Consensus Probabilities When
When , most time is spent in the external state , where influences favour centrist consensus. Hence, when and z is not too close to 0, centrism prevails over the other opinions: for all values of ; see Figure 4a. In this case, we find: when , while and when . In Figure 4a, increases with from to 1, while, decreases from to 0 as is raised. This results in a final state consisting of a majority of C voters, whose final density c increases from to 1, and a minority of L and R voters, whose final density decreases with from to 0; see the inset in Figure 4a. However, while all-C is the most likely final state, there is a finite probability of polarization at low and intermediate switching rate.
When and the initial population consists mainly of L and R voters (), polarization is the most likely final state, with for ; see Figure 4b. Centrists thus generally hold the minority opinion when , while C is the majority opinion () only under low switching rate; see inset in Figure 4b. In the limiting regimes and , and , respectively, approach the values of . Here, again Equation (9) can be used to determine the initial density , such that if and otherwise, and such that if and otherwise. In the example of Figure 4, . As for , in the regime of intermediate switching, as for , and can exhibit bumps and a dip, see Figure 4b where and have modest extrema around .
3.4. Polarization and Consensus Probabilities under Symmetric Switching ()
When , social switching is symmetric, and the same average amount of time is spent in . External influences thus favour centrism () and polarization () in turn (see Figure 1c) and all realizations start in either of the external states with the same probability .
In the regime where , the final state is reached with a probability close to from either external state . When , polarization is almost certain, whereas there is centrist consensus with probability 1 when . Hence, and when . Under low switching rate, , a small number switches can occur prior reaching the final state, but switching being symmetric, the net effect mostly cancels out and when , as in Figure 5a,b.
When , there are many switches before reaching the final state (see Section 4.2 below). This results in the self-averaging of , yielding . Hence, when polarization and centrist consensus occur with probabilities:
where we have used Equations (6) and (7) with (A7).
We can determine when these probabilities increase with by solving Equation (9). When , we find and . When and hence increase with when and , respectively; see Figure 5. In the case , is a decreasing function of and C is generally the minority opinion (); see the inset in Figure 5b. As shown in Figure 5a, when then , and we find that the probability of centrist consensus remains essentially constant: . When and , the final densities of voters are and ; see the inset in Figure 5a.
4. Mean Exit Time
The mean exit time (MET), here denoted by , is the average time to reach one of three absorbing/consensus states (all-L, all-R, all-C) or the polarization line (pol-). The MET hence complements the information provided by the polarization and consensus probabilities, and is therefore of great interest. Here, we study how the MET varies with for different given values of and z.
4.1. Mean Exit Time in the Regimes and
The MET is obtained analytically in the regimes and in terms of , its counterpart in the absence of external influences, as discussed in Appendix B.2.
4.1.1. MET in the Regime
When , there are no switches before reaching the final state. The MET, , can thus be obtained by averaging over the stationary distribution of . Since with probability , in this regime the MET reads:
and its scaling are thus readily obtained from Equations (A10) and (A11). From the symmetry , we have for (the unwieldy expression of is given in Ref. [54]). From Figure 6, we find that the predictions of Equation (10) are in good agreement with simulation results when in all scenarios , and ).
4.1.2. MET in the Regime
When , many external influences switches occur before the population reaches its final state. This leads to the self-averaging of , which can therefore be replaced by its average: . Hence, under high switching rate, the influences bias is rescaled according to , yielding , at fixed N. When the MET, , therefore satisfies Equation (A10) with s substituted by , and thus
In this regime, the MET follows readily from the solution of (A10), and its scaling is obtained from Equation (A11). Using the symmetry of , we have , which boils down to when . Furthermore, when , we obtain , which is independent of the influences bias b. In Figure 6, the predictions of Equation (11) are in close to perfect agreement with the simulation results for in all scenarios (, and ).
4.2. Mean Exit Time as Function of the Switching Rate
We now consider the dependence of the MET under arbitrary .
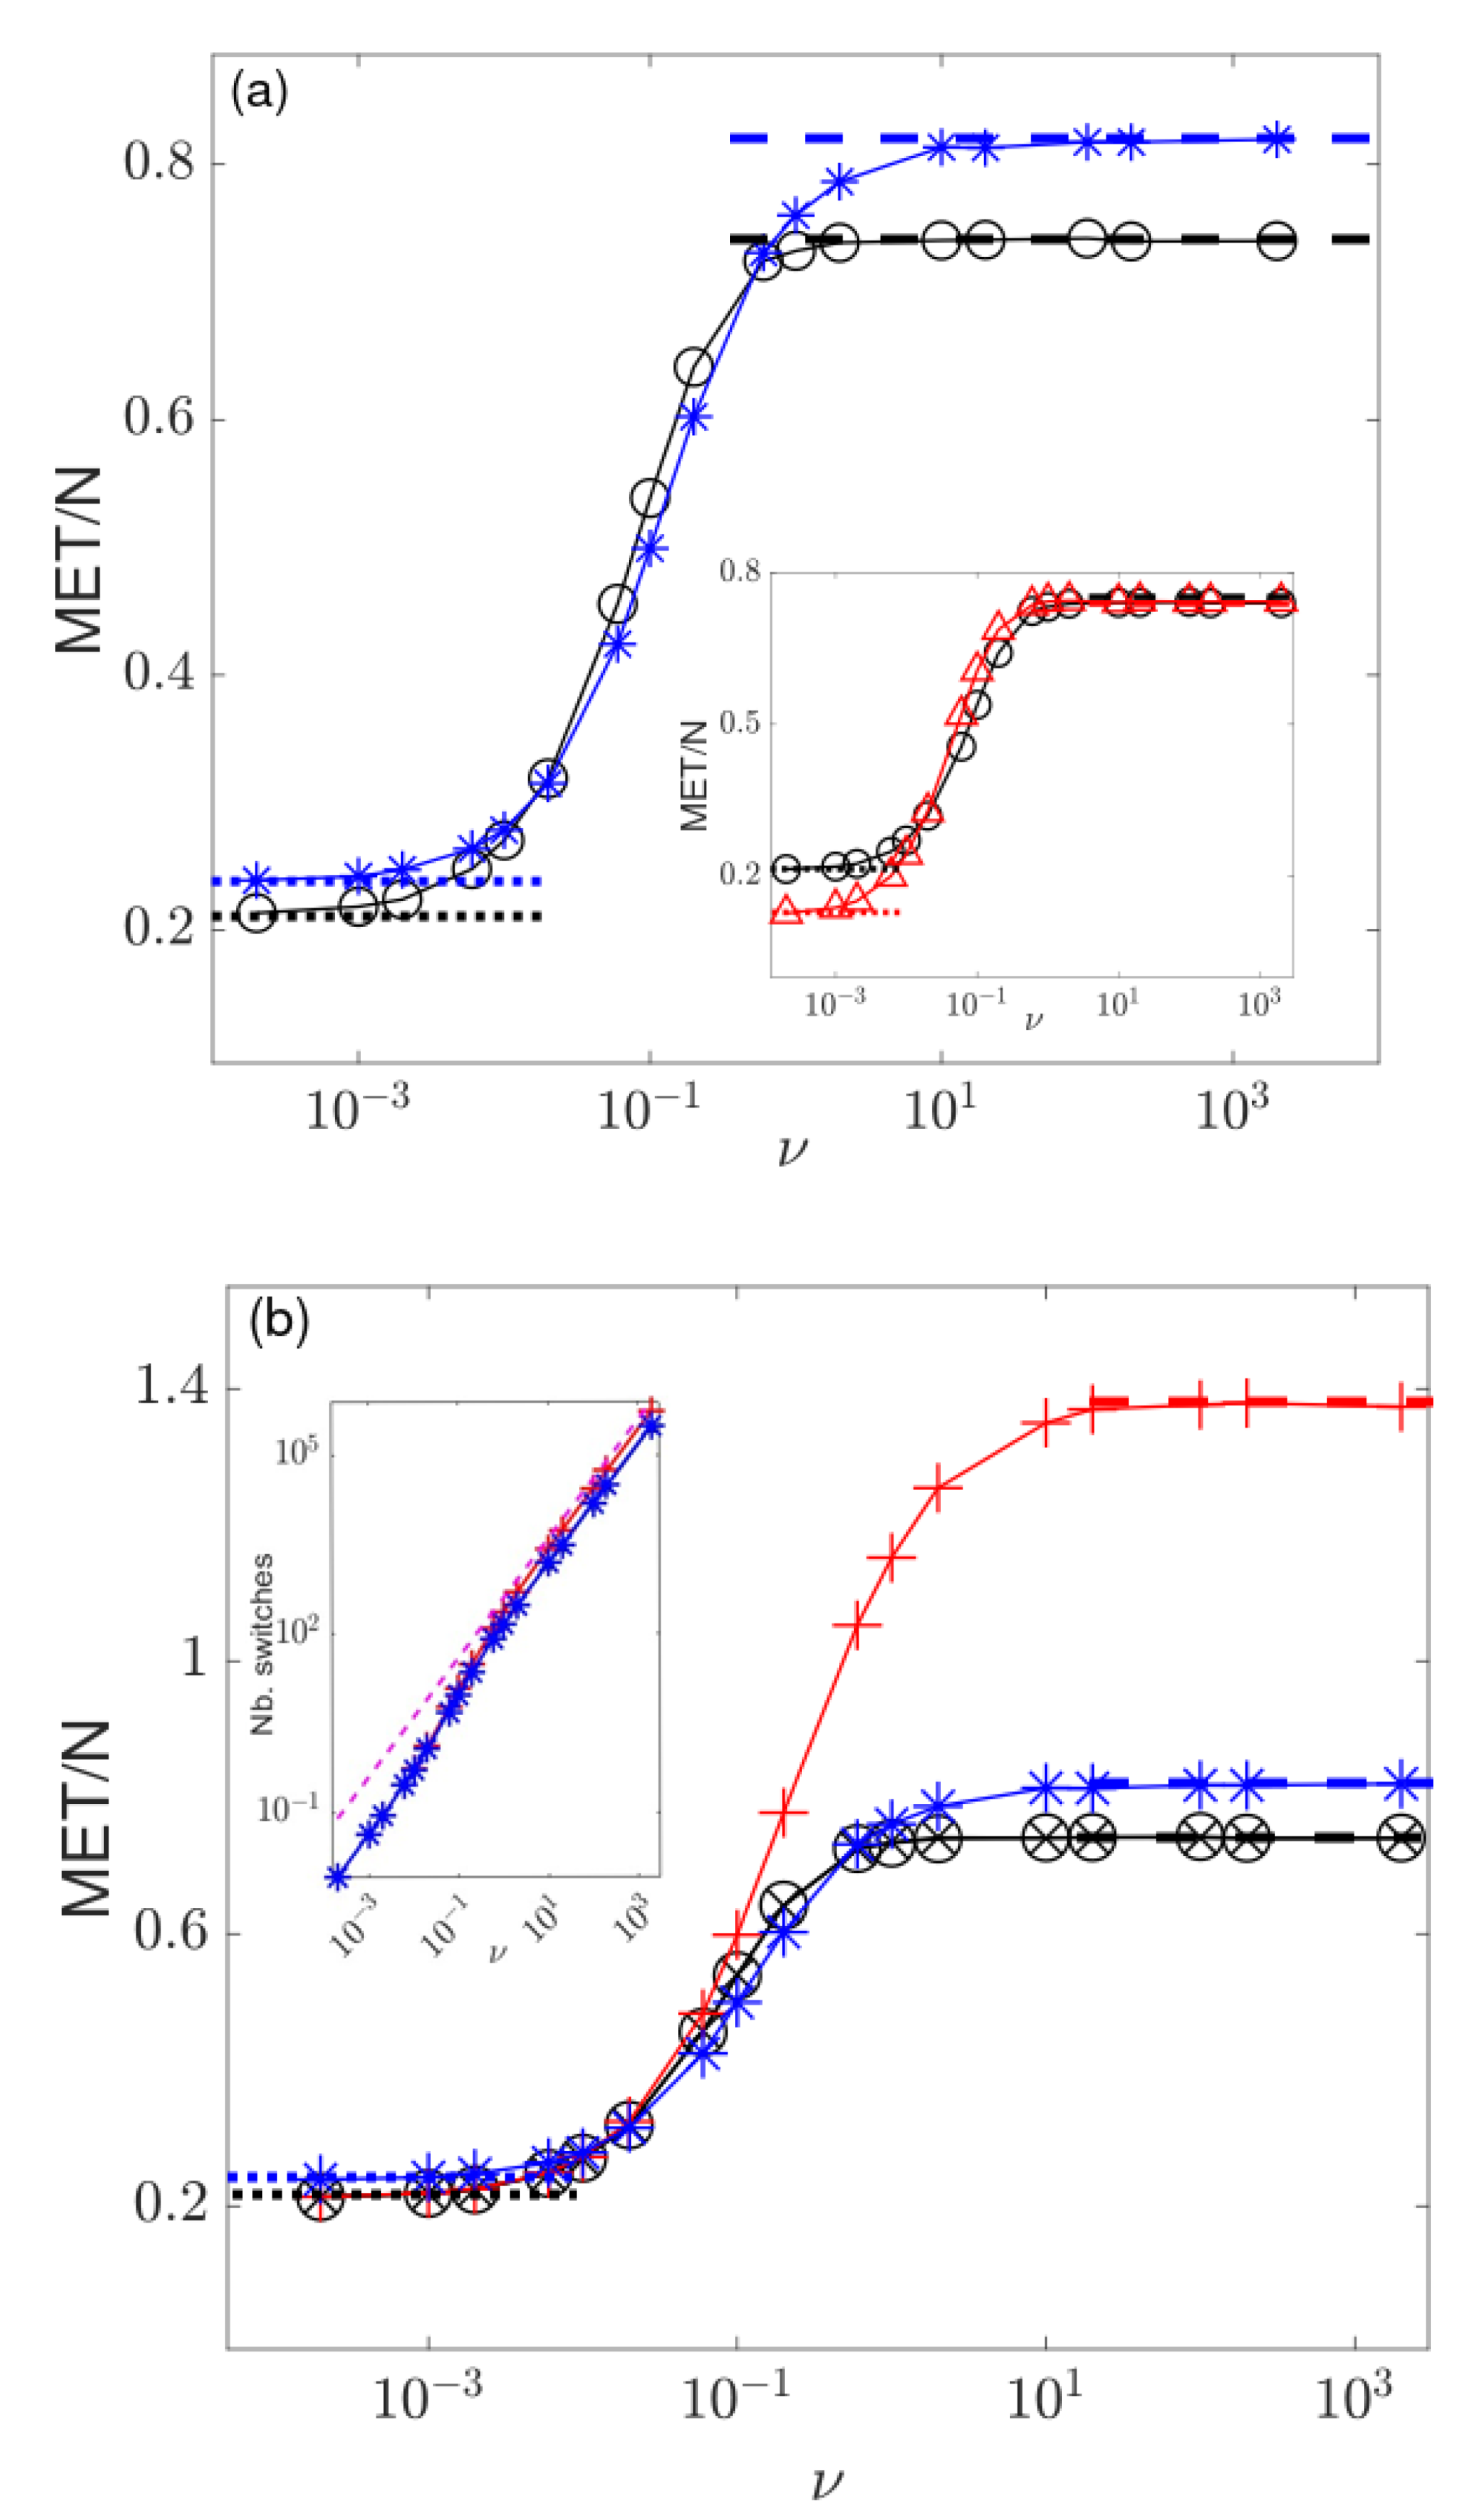
When the switching rate is low, , it is unlikely that there are any switches before reaching the final states, and thus ; see Equation (10). When , , and z is not too close to 0 and 1, then (see Equation (A11)), and the average number of switches in this regime prior to reaching the final state is ; see Figure 6a,b. Hence, when there are on average switches before reaching the final state.
Under high , the system experiences a large number of switches causing the self-average of (with ). In this regime, ; see Equation (11), with . In this case, the average number of switches before reaching the final state is .
We can therefore revisit and characterise the three switching regimes:
- (i) when , the system is in the regime of “low switching rate” and the final state can possibly be reached without experiencing any switches;
- (ii) when , the population is in a regime of “intermediate switching rate”, where there are typically switches before reaching the final state;
- (iii) when , the system is in the regime of “high switching rate”, where the external noise self-averages, and the number of switches before reaching the final state is and hence grows linearly with , where ; see inset in Figure 6b.
When the switching rate is raised across the above regimes, from to , the MET changes its scaling behaviour. In regime (i), the MET scales as and therefore when , while in regime (iii) the MET scales as , and therefore is a scaling function of the initial fraction z. In the intermediate regime (ii), when , the MET increases steeply with and interpolates between and as sweeps from regimes (ii) into (iii). This picture is confirmed by the results shown in Figure 6a,b.
Figure 6a,b, illustrates that the initial fraction z has only a marginal effect on the MET in the limiting regimes and , which is well captured by Equations (10) and (11). Figure 6b shows that, as predicted by Equation (11), the MET at fixed is maximum when , with ; see Appendix B.2. The inset in Figure 6a illustrates that the MET scales linearly with N in the regime (iii), while N has a marginal effect on in the regimes (i) and (ii): When , we find as in Ref. [54]. When , we find that decreases with N in agreement with . The inset of Figure 6b confirms that when , the average number of switches exhibits the same linear scaling with for different parameter sets.
Here, time-varying external influences are therefore responsible for a drastic change in the MET scaling: the MET scales as under low switching rate, while it grows and scales linearly with N under high switching rate. When , reaching the final state thus takes much longer under than .
5. Conclusions
Motivated by the evolution of opinions in a volatile social environment shaped by time-fluctuating external influences, arising, e.g., from news or social media, we have introduced a constrained three-state voter model subject to randomly binary time-fluctuating (switching) external influences. The voters of this population can hold either incompatible leftist or rightist opinions, or behave as centrists. The changing external influences (social environment) is modelled by a dichotomous random process that favours in turn the rise of polarization or the spread of centrism. The fate of this population is either to reach a consensus with leftists, rightists, or centrists, or to achieve polarization, which consists of a frozen state comprised of only non-interacting leftists and rightists. By combining analytical and computational means, we have investigated the effect of the time-fluctuating external influences on the population’s final state under various scenarios. In particular, we have studied how the rate of switching, as well as the switching asymmetry and initial population composition, affect the fate of this population.
Focusing on the interesting case of a small influences bias affecting a finite, yet large, number of voters, we have shown that the consensus and polarization probabilities can vary greatly with the rate of change of the external influences: these probabilities can either increase or decrease with the rate of external variations, and can also exhibit extrema. Remarkably, when there is a large initial majority of voters holding the opinions opposed by the external influences, the majority can resist the influences: the opinions supported by the majority of agents and opposed by the influences are the most likely to prevail over a range of parameters characterising the external variations. When this occurs, the population settles in a final state in which a majority of voters holds the opinions opposed by the external influences, see Figure 3b and Figure 4b. The study has also shown that time-switching influences are responsible for a drastic change in the scaling of the mean time to reach final state: the mean exit time is generally much bigger under high switching rate, when it scales linearly with population size, than under low switching rate.
The goal of this paper is to study how time-varying external influences may affect the social dynamics of an idealized population. It can be anticipated that the model analysed here is too simple to realistically capture the various complex effects of social and news media, and other time-varying external stimuli, on opinion dynamics. It is however natural to ask how this model can be generalized to become more realistic, and which kind of practical information it could then possibly provide. These points are addressed in Appendix C, where a potential application is briefly discussed. In fact, while the direct applications of the current model are admittedly limited, it is expected to still be useful since it sheds light on nontrivial effects that exogenous time-fluctuating influences can have on opinion dynamics. Hence, this work can be envisaged as a step towards more realistic modelling approaches to this challenging interdisciplinary problem.
Funding
This research received no external funding.
Data Availability Statement
Conflicts of Interest
The author declares no conflict of interest.
Appendix A. Master Equation and Mean-Field Limit When N→∞
In this Appendix, we discuss the master equation (ME) governing the model’s dynamics, and then its description in the mean-field limit when .
Appendix A.1. Master Equation
The 3CVM switching dynamics in a finite population is a Markov chain defined by the transition rates:
such that and . The associated ME gives the probability to have , and voters in the population in the external state at time t [82], and here reads:
where and are shift operators such that , and whenever or are outside . and are coupled, and the last lines on the right-hand-side of (A2) and (A3) account for the random external switching. We notice that when and , corresponding to the three absorbing states all-R (), all-L (), all-C (, ), and to the polarization state pol- (, ); see Figure 2. The multivariate ME (A2) and (A3) can be simulated exactly by standard methods, such as the Gillespie algorithm [85].
Appendix A.2. Mean-Field Limit When N→∞
In the mean-field limit where and demographic can be ignored, the equation of motion of the densities are [54,82]:
where is used, and the time dependence is omitted. Here, the mean-field limit means that the dynamics is aptly described by Equation (A4) where is a randomly switching multiplicative noise, see Equation (1). Equation (A4) are thus two coupled stochastic differential equations that have three absorbing steady states: associated respectively with the consensus states all-L, all-R and all-C. Equations (A4) also admit the line of steady states , with , associated with state of polarization pol-; see Figure 2. Equations (A4) conserve the ratio , which implies that the final densities satisfy and when .
It is useful to relate this result with the final densities in a finite population, in the case where . When , the final densities of R and L voters are (as in the absence of external influences [53,54]). The first term comes from the probability of ending in L or R consensus (with ). The second term arises from the fact that, when , the polarization state consists of half L and R voters. Since and , we find , and the final density of C voters is: .
When , Equations (A4) hold and predict that the densities approach polarization when and centrist consensus when on a timescale . Hence, when , the probability of L and R consensus vanish, , and the final densities thus satisfy and .
Appendix B. Polarization, Consensus Probabilities, and Mean Exit Time in the Absence of Time-Varying Influences
In this Appendix, we reproduce the results obtained in Refs. [53,54] for the polarization and consensus probabilities in the absence of external influences, and used in Section 3.1 and Section 4.1.
Appendix B.1. Polarization and Consensus Probabilities in the Absence of Time-Varying Influences
In the realm of the diffusion theory [68,69,82], when , and , the polarization probability, here, denoted by is [54]:
where denotes the modified Bessel function of first kind and order k, and we used the property of the associated Legendre polynomials, (with the convention ). When and , Equation (A5) can be approximated by ; see Ref. [54]. This simplified expression is particularly useful to approximate when ; see Equation (6).
In the realm of the diffusion theory, when , , the C-consensus probability, here denoted by , is [54]:
When , one has: and . In the considered examples, when and z is not too close to 0 or 1, polarization and centrist consensus are almost certain, i.e., if and when [54].
When , and , the probabilities and become [53]:
When , the probability to end up in an L or R consensus is thus
while there is the same average final fraction ℓ and r of voters of type L and R, given by
Expressions (A8) and (A9) hold both when with Equations (A5) and (A6), and when with Equations (A7).
Appendix B.2. Mean Exit Time in the Absence of Time-Varying Influences
Appendix C. Possible Generalizations and Applications of the Model
This Appendix is dedicated to a brief discussion of some possible generalizations and applications of the 3CVM with switching dynamics.
It is often hard to map complex real social systems onto idealized theoretical models: these commonly suffer from a number of limitations that make their use for the practical characterization of social behaviour difficult. The 3CVM with switching dynamics is no exception, and among its limitations, we can list the following: (i) it is doomed to end up in either consensus or -polarization, but never admits the long-lived coexistence of the three opinions; (ii) the present model formulation assumes that all agents interact with all others on a complete graph (rather than on a complex dynamic network); (iii) as most classical voter models, all agents are identical in the 3CVM (there are no “zealots”); (iv) interactions are pairwise (no group pressure); (v) in many applications, there are more than three possible opinions/parties.
Since the 3CVM can be generalized to overcome the limitations (i)–(v) at the expense of its mathematical tractability, it is useful to discuss a possible application. The main challenge for this is to find data against which to calibrate the parameters and characterising the external time-varying influences. In this context, the formulation of the 3CVM suggests to test its use to describe the distribution of opinions in the readership of a newspaper such as The Guardian in the UK whose political backing of the Labour, Liberal (Lib Dem) and Conservative parties has changed on various occasions in the last 78 years.
We have used the dataset [87] referring to the 18 general elections held in the UK between 1945 and 2010 to try and estimate the parameters and for a population corresponding to a random sample of the readership of The Guardian (whose circulation between 1945 and 2021 has varied between and ). If we use the average time between each general election as unit of time, and notice that The Guardian’s political orientation changed 8 times between 1945 and 2010, in 1950, 1951, 1955, 1959, 1974, 1979, 2005, 2010. The average switching rate can thus be estimated as . By treating the backing of the Labour or Conservative party as being in the influences state , and representing the backing of the Lib Dem party by , we can estimate that on average . Note that here the change from backing jointly two parties (e.g., Labour and Lib Dem) to supporting only one of those parties (e.g., Liberal Party) is considered as a “switch” (and the joint Labour/Liberal and Conservative/Liberal support is treated as an influence state ). The parameter b could in principle be estimated from the approach to the “final state” occurring on a timescale , see Equation (A4). In this context, it is a difficult task to assess on what timescale consensus or polarization may occur, if ever. Here, for the sake of argument, we set . With and assuming an initial population consisting of and of labour and conservative supporters, respectively, and of Lib Dem backers, the model predicts a final state consisting of and of Labour and Conservative supporters, respectively, and of Lib Dem backers in a random sample of size . For a larger sample of size and the same above parameters, the model predicts a final state comprised of and of Labour and Conservative supporters, and only a small fraction of backing the Lib Dem party. These figures, suggesting the slow evolution towards quasi polarization of The Guardian’s readership as N increases, with a raise of support for the Labour party, do not seem absurd but are not realistic as they underestimate the Lib Dem vote. Moreover, the 3CVM ignores entirely the existence of a small but non-negligible fraction of voters backing other parties (such as the Green party). A more realistic model would take into account more than three parties, and mechanisms ensuring the maintenance of long-lived coexistence of all opinions.
References
- Granovetter, M. Threshold models of collective behavior. Am. J. Sociol. 1978, 83, 1420–1443. Available online: https://www.jstor.org/stable/2778111 (accessed on 9 April 2023).
- Schelling, T.C. Micromotives and Macrobehaviour; W. W. Norton & Company, Inc.: New York, NY, USA, 1978. [Google Scholar]
- Galam, S.; Gefen, Y.; Shapir, Y. Sociophysics: A new approach of sociological collective behaviour: I. Mean-behaviour description of a strike. Math. J. Sociol. 1982, 9, 1–13. [Google Scholar] [CrossRef]
- Galam, S. Majority rule, hierarchical structures, and democratic totalitarianism: A statistical approach. J. Math. Psychol. 1986, 30, 426–434. [Google Scholar] [CrossRef]
- Galam, S. Social paradoxes of majority rule voting and renormalization group. J. Stat. Phys. 1990, 61, 943–951. [Google Scholar] [CrossRef]
- Galam, S.; Moscovici, S. Towards a theory of collective phenomena: Consensus and attitude changes in groups. Eur. J. Soc. Psychol. 1991, 21, 49–74. [Google Scholar] [CrossRef]
- Castellano, C.; Fortunato, S.; Loreto, V. Statistical physics of social dynamics. Rev. Mod. Phys. 2009, 81, 591–646. [Google Scholar] [CrossRef]
- Galam, S. Sociophysics. A Physicist’s Modeling of Psycho-Political Phenomena; Springer Science+Business Media, LLC: New York, NY, USA, 2012. [Google Scholar] [CrossRef]
- Sen, P.; Chakrabarti, B. K. Sociophysics: An Introduction; Oxford University Press: New York, NY, USA, 2014. [Google Scholar]
- Perc, M.; Jordan, J.J.; Rand, D.G.; Wang, Z.; Boccaletti, S.; Szolnoki, A. Statistical physics of human cooperation. Phys. Rep. 2017, 687, 1–51. [Google Scholar] [CrossRef]
- Schweitzer, F. Sociophysics. Phys. Today 2018, 71, 40–46. [Google Scholar] [CrossRef]
- Jedrzejewski, A.; Sznajd-Weron, K. Statistical physics of opinion formation: Is it a SPOOF? C. R. Phys. 2019, 20, 244–261. [Google Scholar] [CrossRef]
- Redner, S. Reality-inspired voter models: A mini-review. C. R. Phys. 2019, 20, 275–292. [Google Scholar] [CrossRef]
- Li, Z.; Chen, X.; Yang, H.-X.; Szolnoki, A. Game-theoretical approach for opinion dynamics on social networks. Chaos 2022, 32, 73117. [Google Scholar] [CrossRef]
- Liggett, T.M. Interacting Particle Systems; Springer: Berlin/Heidelberg, Germany, 2005. [Google Scholar] [CrossRef]
- Glauber, R.J. Time-dependent statistics of the Ising model. J. Math. Phys. 1963, 4, 294–307. [Google Scholar] [CrossRef]
- Asch, S.E. Opinions and social pressure. Sci. Am. 1955, 193, 31–35. Available online: https://www.jstor.org/stable/24943779 (accessed on 9 April 2023).
- Milgram, S.; Bickman, L.; Berkowitz, L. Note on the drawing power of crowds of different size. J. Personal. Soc. Psychol. 1969, 13, 79–82. [Google Scholar] [CrossRef]
- Lattané, B. The psychology of social impact. Am. Psychol. 1981, 36, 343–356. [Google Scholar] [CrossRef]
- Axelrod, R. The dissemination of culture: A model with local convergence and global olarization. J. Confl. Resolut. 1997, 41, 203–226. [Google Scholar] [CrossRef]
- Axelrod, R. The Complexity of Cooperation: Agent-Based Models of Competition and Collaboration; Princeton University Press: Princeton, NJ, USA, 1997. [Google Scholar] [CrossRef]
- Castellano, C.; Marsili, M.; Vespignani, A. Nonequilibrium phase transition in a model for social influence. Phys. Rev. Lett. 2000, 85, 3536–3539. [Google Scholar] [CrossRef]
- Klemm, K.; Eguiluz, V.M.; Toral, R.; San Miguel, M. Global culture: A noise-induced transition in finite systems. Phys. Rev. E 2003, 67, 045101. [Google Scholar] [CrossRef]
- McPherson, J.M.; Smith-Lovin, L. Homophily in voluntary organizations: Status distance and the composition of face-to-face groups. Am. Sociol. Rev. 1987, 52, 370–379. [Google Scholar] [CrossRef]
- Mobilia, M. Does a single zealot affect an infinite group of voters? Phys. Rev. Lett. 2003, 91, 028701. [Google Scholar] [CrossRef]
- Mobilia, M.; Georgiev, I.T. Voting and catalytic processes with inhomogeneities. Phys. Rev. E 2005, 71, 046102. [Google Scholar] [CrossRef] [PubMed]
- Mobilia, M.; Petersen, A.; Redner, S. On the role of zealotry in the voter model. J. Stat. Mech. 2007, 2007, P08029. [Google Scholar] [CrossRef]
- Mobilia, M. Commitment versus persuasion in the three-party constrained voter model. J. Stat. Phys. 2013, 151, 69–91. [Google Scholar] [CrossRef]
- Mobilia, M. Nonlinear q-voter model with inflexible zealots. Phys. Rev. E 2015, 92, 012803. [Google Scholar] [CrossRef] [PubMed]
- Galam, S.; Jacobs, F. The role of inflexible minorities in the breaking of democratic opinion dynamics. Phys. A 2007, 381, 366–376. [Google Scholar] [CrossRef]
- Sznajd-Weron, K.; Tabiszewski, M.; Timpanaro, A.M. Phase transition in the Sznajd model with independence. EPL (Europhys. Lett.) 2011, 96, 48002. [Google Scholar] [CrossRef]
- Acemoglu, D.; Como, G.; Fagnani, F.; Ozdaglar, A. Opinion fluctuations and disagreement in social networks. Math. Op. Res. 2013, 38, 1–27. [Google Scholar] [CrossRef]
- Nyczka, P.; Sznajd-Weron, K. Anticonformity or independence?—Insights from statistical physics. J. Stat Phys. 2013, 151, 174–202. [Google Scholar] [CrossRef]
- Masuda, N. Opinion control in complex networks. New J. Phys. 2015, 17, 033031. [Google Scholar] [CrossRef]
- Li, X.; Mobilia, M.; Rucklidge, A.M.; Zia, R.K.P. How does homophily shape the topology of a dynamic network? Phys. Rev. E 2021, 104, 044311. [Google Scholar] [CrossRef]
- Li, X.; Mobilia, M.; Rucklidge, A.M.; Zia, R.K.P. Effects of homophily and heterophily on preferred-degree networks: Mean-field analysis and overwhelming transition. J. Stat. Mech. 2022, 013402. [Google Scholar] [CrossRef]
- Castellano, C.; Muñoz, M.A.; Pastor-Satorras, R. Nonlinear q-voter model. Phys. Rev. E 2009, 80, 041129. [Google Scholar] [CrossRef]
- Sznajd-Weron, K.; Sznajd, J. Opinion evolution in closed community. Int. J. Mod. Phys. C 2000, 11, 1157–1165. [Google Scholar] [CrossRef]
- Slanina, F.; Lavicka, H. Analytical results for the Sznajd model of opinion formation. Eur. Phys. J. B 2003, 35, 279–288. [Google Scholar] [CrossRef]
- Nyczka, P.; Sznajd-Weron, K.; Cislo, J. Opinion dynamics as a movement in a bistable potential. Phys. A 2012, 391, 317–327. [Google Scholar] [CrossRef]
- Lambiotte, R.; Redner, S. Dynamics of non-conservative voters. EPL (Europhys. Lett.) 2008, 82, 18007. [Google Scholar] [CrossRef]
- Slanina, F.; Sznajd-Weron, K.; Przybyla, P. Some new results on one-dimensional outflow dynamics. EPL (Europhys. Lett.) 2008, 82, 18006. [Google Scholar] [CrossRef]
- Galam, S.; Martins, A.C.R. Pitfalls driven by the sole use of local updates in dynamical systems. EPL (Europhys. Lett.) 2011, 95, 48005. [Google Scholar] [CrossRef]
- Timpanaro, A.M.; Prado, C.P.C. Exit probability of the one-dimensional q-voter model: Analytical results and simulations for large networks. Phys. Rev. E 2014, 89, 052808. [Google Scholar] [CrossRef]
- Mellor, A.; Mobilia, M.; Zia, R.K.P. Characterization of the nonequilibrium steady state of a heterogeneous nonlinear q-voter model with zealotry. EPL (Europhys. Lett.) 2016, 113, 48001. [Google Scholar] [CrossRef]
- Mellor, A.; Mobilia, M.; Zia, R.K.P. Heterogeneous out-of-equilibrium nonlinear q-voter model with zealotry. Phys. Rev. E 2017, 95, 012104. [Google Scholar] [CrossRef]
- Deffuant, G.; Neau, D.; Amblard, F.; Weisbuch, G. Mixing Beliefs among Interacting Agents. Adv. Complex Syst. 2000, 3, 87–98. [Google Scholar] [CrossRef]
- Hegselmann, R.; Krause, U. Opinion dynamics and bounded confidence models, analysis, and simulation. J. Artif. Soc. Soc. Simul. 2002, 5, 2. Available online: https://www.jasss.org/5/3/2.html (accessed on 9 April 2023).
- Weisbuch, G.; Deffuant, G.; Amblard, F.; Nadal, J.P. Meet, discuss, and segregate! Complexity 2002, 7, 55–63. [Google Scholar] [CrossRef]
- Ben-Naim, E.; Krapivsky, P.L.; Redner, S. Bifurcations and patterns in compromise processes. Phys. D 2003, 183, 190. [Google Scholar] [CrossRef]
- Slanina, F. Dynamical phase transitions in Hegselmann-Krause model of opinion dynamics and consensus. Eur. Phys. J. B 2011, 79, 99–106. [Google Scholar] [CrossRef]
- Vazquez, F.; Krapivsky, P.L.; Redner, S. Freezing and slow evolution in a constrained opinion dynamics model. J. Phys. A Math. Gen. 2003, 36, L61–L68. [Google Scholar] [CrossRef]
- Vazquez, F.; Redner, S. Ultimate fate of constrained voters. J. Phys. A Math. Gen. 2004, 37, 8479–8494. [Google Scholar] [CrossRef]
- Mobilia, M. Fixation and polarization in a three-species opinion dynamics model. EPL (Europhys. Lett.) 2011, 95, 50002. [Google Scholar] [CrossRef]
- DellaVigna, S.; Kaplan, E. The Fox News effect: Media bias and voting. Quart. J. Econ. 2007, 122, 1187–1234. [Google Scholar] [CrossRef]
- Gerber, A.S.; Karlan, D.; Bergan, D. Does the media matter? A field experiment measuring the effect of newspapers on voting behavior and political opinions. Am. Econ. J. Appl. Econ. 2009, 1, 35–52. [Google Scholar] [CrossRef]
- Yang, J.; Leskovec, J. Patterns of temporal variation in online media. In Proceedings of the Fourth ACM International Conference on Web Search and Data Mining, Hong Kong, China, 9–12 February 2011; King, I., Nejdi, W., Li, H., Eds.; Association for Computing Machinery: New York, NY, USA, 2011; pp. 177–186. [Google Scholar] [CrossRef]
- Wettstein, M.; Wirth, W. Media effects: How media influence voters. Swiss Polit. Sci. Rev. 2017, 23, 262–269. [Google Scholar] [CrossRef]
- Holbrook, T.M. Altered States: Changing Populations, Changing Parties, and the Transformation of the American Political Landscape; Oxford University Press: New York, NY, USA, 2016. [Google Scholar] [CrossRef]
- Dewenter, R.; Linder, M.; Thomas, T. Can media drive the electorate? The impact of media coverage on voting intentions. Eur. J. Polit. Econ. 2019, 58, 245–261. [Google Scholar] [CrossRef]
- Kaviani, M.S.; Li, L.; Maleki, H. Media, partisan ideology, and corporate social responsibility. SSRN 2021, 3658502. [Google Scholar] [CrossRef]
- Bhat, D.; Redner, S. Nonuniversal opinion dynamics driven by opposing external influences. Phys. Rev. E 2019, 100, 050301. [Google Scholar] [CrossRef]
- Bhat, D.; Redner, S. Polarization and consensus by opposing external sources. J. Stat. Mech. 2020, 2020, 013402. [Google Scholar] [CrossRef]
- Lorenz-Spreen, P.; Mørch Mønsted, B.; Hövel, P.; Lehmann, S. Accelerating dynamics of collective attention. Nat. Commun. 2019, 10, 1759. [Google Scholar] [CrossRef]
- Helfmann, L.; Djurdjevac Conrad, N.; Lorenz-Spreen, P.; Schütte, C. Modelling opinion dynamics under the impact of influencer and media strategies. arXiv 2023, arXiv:2301.13661. [Google Scholar] [CrossRef]
- Hosseiny, A.; Bahrami, M.; Palestrini, A.; Gallegati, M. Metastable features of economic networks and responses to exogenous shocks. PLoS ONE 2016, 11, 1–22. [Google Scholar] [CrossRef]
- Hosseiny, A.; Absalan, M.; Sherafati, M.; Gallegati, M. Hysteresis of economic networks in an XY model. Phys. A 2019, 513, 644–652. [Google Scholar] [CrossRef]
- Crow, J.F.; Kimura, M. An Introduction to Population Genetics Theory; The Blackburn Press: Caldwell, NJ, USA, 1970; Available online: https://archive.org/details/an-introduction-to-population-genetics-theory-pdfdrive (accessed on 9 April 2023).
- Ewens, W.J. Mathematical Population Genetics. Volume 1: Theoretical Introduction; Springer Science+Business Media New York: New York, NY, USA, 2004. [Google Scholar] [CrossRef]
- Assaf, M.; Mobilia, M.; Roberts, E. Cooperation dilemma in finite populations under fluctuating environments. Phys. Rev. Lett. 2013, 111, 238101. [Google Scholar] [CrossRef] [PubMed]
- West, R.; Mobilia, M.; Rucklidge, A.M. Survival behavior in the cyclic Lotka-Volterra model with a randomly switching reaction rate. Phys. Rev. E. 2018, 97, 022406. [Google Scholar] [CrossRef] [PubMed]
- Horsthemke, W.; Lefever, R. Noise-Induced Transitions: Theory and Applications in Physics, Chemistry, and Biology; Springer: Berlin/Heidelberg, Germany, 2006. [Google Scholar] [CrossRef]
- Bena, I. Dichotomous noise: Exact results for out-of-equilibrium systems. Int. J. Mod. Phys. B 2006, 20, 2825–2888. [Google Scholar] [CrossRef]
- Ridolfi, L.; D’Odorico, P.; Laio, F. Noise-Induced Phenomena in the Environmental Sciences; Cambridge University Press: Cambridge, UK, 2011. [Google Scholar] [CrossRef]
- Wienand, K.; Frey, E.; Mobilia, M. Evolution of a fluctuating population in a randomly switching environment. Phys. Rev. Lett. 2017, 119, 158301. [Google Scholar] [CrossRef] [PubMed]
- Wienand, K.; Frey, E.; Mobilia. Eco-evolutionary dynamics of a population with randomly switching carrying capacity. J. R. Soc. Interface 2018, 15, 20180343. [Google Scholar] [CrossRef]
- Taitelbaum, A.; West, R.; Assaf, M.; Mobilia, M. Population dynamics in a changing environment: Random versus periodic switching. Phys. Rev. Lett. 2020, 125, 048105. [Google Scholar] [CrossRef]
- Taitelbaum, A.; West, R.; Mobilia, M.; Assaf, M. Evolutionary dynamics in a varying environment: Continuous versus discrete noise. Phys. Rev. Res. 2023, 5, L022004. [Google Scholar] [CrossRef]
- Kalyuzhny, M.; Kadmon, R.; Shnerb, N.M. A neutral theory with environmental stochasticity explains static and dynamic properties of ecological communities. Ecol. Lett. 2015, 18, 572–580. [Google Scholar] [CrossRef]
- Hufton, P.-G.; Lin, Y.-T.; Galla, T.; McKane, A.J. Intrinsic noise in systems with switching environments. Phys. Rev. E 2016, 93, 052119. [Google Scholar] [CrossRef]
- Hidalgo, J.; Suweis, S.; Maritan, A. Species coexistence in a neutral dynamics with environmental noise. J. Theor. Biol. 2017, 413, 1–10. [Google Scholar] [CrossRef]
- Gardiner, C. Stochastic Methods: A Handbook for the Natural and Social Sciences; Springer: Berlin/Heidelberg, Germany, 2009. [Google Scholar]
- Chakrabarti, B.K.; Acharyya, M. Dynamic transitions and hysteresis. Rev. Mod. Phys. 1999, 71, 847–859. [Google Scholar] [CrossRef]
- Mobilia, M. SimData_Figs3to6; University of Leeds: Leeds, UK, 2023. [Google Scholar] [CrossRef]
- Gillespie, D.T. A general method for numerically simulating the stochastic time evolution of coupled chemical reactions. J. Comput. Phys. 1976, 22, 403–434. [Google Scholar] [CrossRef]
- Blythe, R.A.; McKane, A.J. Stochastic models of evolution in genetics, ecology and linguistics. J. Stat. Mech. 2007, 2007, P07018. [Google Scholar] [CrossRef]
- The Guardian. Datablog. Newspaper Support in UK General Elections [Dataset]. 2010. Available online: https://www.theguardian.com/news/datablog/2010/may/04/general-election-newspaper-support (accessed on 9 April 2023).
Figure 1.
Illustration of the 3CVM under binary social switching at rate (where is the average switching rate and the switching asymmetry). (a) versus time t when : most time is spent in social state favouring polarization. (b) versus t when : most time is spent in social state favouring centrism. (c) versus t when : switching is symmetric and the same average time is spent in . (d) When there is a bias favouring the spread of L (leftists) and R (rightists): and are the reactions with the highest rate, (where b denotes the social influences bias). The social environment favours the spread of centrism: the reactions and have the highest rate, , under . See text for details. In (a)–(c), initially .

Figure 3.
(circles), (squares), and (stars), versus for and different initial conditions. Here and in the other figures, symbols are from simulations (averaged over samples). Thick dashed lines are eyeguides showing (red) and (blue), and thick dotted lines are eyeguides showing (red) and (blue), given by Equations (4), (3), (6) and (7). (a) Initial condition: and . Inset: final densities (-voters, stars) and c (centrists, squares) versus . The dashed lines show (red) and (blue) from Equation (8), and the dotted lines show (red) and (blue) from Equation (5). (b) Initial condition: and . Inset: (squares) and (diamonds) versus : centrism is the majority opinion in the range of intermediate switching rate, , where . The dashed lines show (red) and (blue), and the dotted lines show (red) and (blue). In all panels and insets: . See text for more details.

Figure 4.
(circles), (squares), and (stars) versus for , and different initial conditions. Symbols are results from simulations (averaged over samples). Thick dashed and dotted lines are as in Figure 3. (a) Initial condition: and . Inset: final densities (-voters, stars) and c (centrists, squares) versus . (b) Initial condition: and . Inset: (squares) and (diamonds) versus : centrists hold the majority opinion in the range of low switching rate () where . In all panels and insets: . See text for more details.

Figure 5.
(circles) (squares), (stars) versus for , and different initial conditions under symmetric switching. Symbols are results from simulations (averaged over samples). Thick dashed and dotted lines are as in Figure 3. (a) Initial condition: and . Inset: final densities (-voters, stars) and c (centrists, squares) versus . In the special case , . (b) Initial condition: and . Inset: (squares) and (diamonds) versus : under , centrists hold the minority opinion when . In all panels and insets: . See text for more details.

Figure 6.
Scaled mean exit time (MET) versus : for different and z. Symbols are from simulations (averaged over samples). Dotted and dashed lines show and from Equations (10) and (11), respectively. (a) , with (black circles) and (blue stars). Inset: for (red triangles) and (black circles). MET scales as when and when . (b) , with (black circles), (black crosses), (blue stars), and (red pluses). Inset: average number of switches before reaching the final state versus for the same parameters. Dashed line is an eyeguide of the slope . See text for details.

Disclaimer/Publisher’s Note: The statements, opinions and data contained in all publications are solely those of the individual author(s) and contributor(s) and not of MDPI and/or the editor(s). MDPI and/or the editor(s) disclaim responsibility for any injury to people or property resulting from any ideas, methods, instructions or products referred to in the content. |
© 2023 by the author. Licensee MDPI, Basel, Switzerland. This article is an open access article distributed under the terms and conditions of the Creative Commons Attribution (CC BY) license (https://creativecommons.org/licenses/by/4.0/).
Share and Cite
MDPI and ACS Style
Mobilia, M. Polarization and Consensus in a Voter Model under Time-Fluctuating Influences. Physics 2023, 5, 517-536. https://doi.org/10.3390/physics5020037
AMA Style
Mobilia M. Polarization and Consensus in a Voter Model under Time-Fluctuating Influences. Physics. 2023; 5(2):517-536. https://doi.org/10.3390/physics5020037
Chicago/Turabian StyleMobilia, Mauro. 2023. "Polarization and Consensus in a Voter Model under Time-Fluctuating Influences" Physics 5, no. 2: 517-536. https://doi.org/10.3390/physics5020037