Communication

Feasibility Study of Hypernucleus Production at NICA/MPD

Joint Institute for Nuclear Research, Joliot-Curie 6, 141980 Dubna, Russia
*
Author to whom correspondence should be addressed.
Physics 2023, 5(2), 391-397; https://doi.org/10.3390/physics5020028
Submission received: 15 February 2023 / Revised: 24 March 2023 / Accepted: 27 March 2023 / Published: 11 April 2023
(This article belongs to the Special Issue From Heavy Ions to Astroparticle Physics)

Abstract

:
The NICA (Nuclotron-based Ion Collider fAcility) project at the Joint Institute for Nuclear Research (JINR, Dubna, Russia) is aimed at the construction of a new accelerator complex for heavy ions and polarized particles. Heavy-ion collisions at NICA are planned to be studied in the region of the highest net-baryon density, which favors the formation of bound nuclear systems with strangeness hypernuclei. The multipurpose detector (MPD) at NICA is designed to reconstruct interactions of relativistic nuclei in a high-multiplicity environment. In this paper, we report the feasibility study results for the reconstruction of Λ 3 H, Λ 4 H and Λ 4 He in Bi+Bi collisions at the nucleon-nucleon center-of-mass energy, s N N = 9.2 GeV.

1. Introduction

Heavy-ion collisions offer a unique method to create hot and dense nuclear matter in the laboratory. If the temperature in the medium exceeds 150 MeV, quark and gluon degrees of freedom appear, and quark-gluon plasma (QGP) can be formed. The deconfinement phase transition is also possible at densities of a few times the normal nuclear density. The production of strange quarks relative to non-strange ones changes in the partonic reactions; thus, the strangeness production was proposed as a QGP signature [1]. Moreover, it was suggested that the nature of the matter, which is created in heavy-ion interactions, can be characterized via baryon-strangeness correlations inside the medium [2,3]. Hypernuclei are bound systems of nucleons and Λ s; thus, their production rates are sensitive to the initial hyperon–baryon phase–space correlation [4]. Furthermore, to understand the basic properties of neutron stars, a good knowledge of the dense matter equation of state is crucial. Due to the large density in the core of a neutron star, strange degrees of freedom (hyperons) are expected to appear [5,6] The presence of hyperons and their role on the properties of neutron stars depend strongly on the in-medium hyperon–nucleon potential. Hypernuclei offer a unique opportunity to elucidate strong interactions involving hyperons. For instance, precise measurements of hypernucleus lifetimes can provide valuable information on the hyperon–nucleon interaction strength (for recent results on the hypernucleus lifetimes; see [7,8]).
The NICA (Nuclotron-based Ion Collider fAcility) project [9] is aimed at the construction of a new accelerator complex for heavy ions and polarized particles at the Joint Institute for Nuclear Research (JINR) in Dubna, Russia. The NICA complex will be capable of providing ion beams (from protons to bismuth ions) in the energy range from 4 to 11 GeV (in the nucleon–nucleon center-of-mass system) at the nominal luminosity of L = 10 27 cm 2 s 1 . The NICA offers a unique possibility to study the properties of strongly interacting matter in the region of high net-baryon density. In particular, precise measurements of hypernuclei, including their yields, lifetimes, and binding energies are among the key objectives of the NICA physics program. The benefit is that statistical thermal models predict the highest production rates of (hyper)nuclei in the NICA energy range [10].
The main goal of this paper is to perform a feasibility study aimed at testing the MPD’s performance in the reconstruction of hypernuclei in heavy-ion collisions.

2. The MPD at the NICA Complex

The multipurpose detector (MPD) is the main experimental setup for the study of heavy-ion collisions at the NICA collider [11]. It comprises (see Figure 1) a set of subdetectors within a superconducting solenoid, which provides a homogeneous axial magnetic field of 0.56 T. The inner tracker system (IT) surrounds the beam pipe and consists of 6 layers of silicon pixel detectors. Its main goal is to allow very precise tracking in the high-track occupancy region near the primary interaction vertex as well as accurate reconstruction of the decay vertices of short-lived particles. Three-dimensional tracking in the MPD experiment is performed with a time-projection chamber (TPC). The TPC is a cylinder of 3.4 m long and 2.8 m in diameter. Its active gas volume, which is separated in two equal parts by a cathode membrane in the center, is filled with a mixture of argon and methane gases. The ionized electrons drift towards the end plates under the applied uniform electric field. Each end plate consists of a multiwire proportional chamber with a cathode pad readout. The TPC has the pseudorapidity coverage | η | < 1.3. Tracks with the maximal radial length have 53 measurements on the trajectory, and it was found that a relative momentum resolution of 3% can be achieved within the transverse momentum interval up to 2 GeV/c, where c denotes the speed of light. In addition to its tracking capability, the TPC provides ionization loss measurements in the gas with a resolution of the order of 8%. The MPD phase-space coverage in the forward region is achieved with the forward end cap tracker (ECT). The ECT is situated behind the TPC end plates and is made of several layers of cathode-pad chambers (CPC). The time-of-flight (TOF) system, which is made of multi-gap resistive-plate chambers (MRPC), is situated after the TPC. It covers the pseudorapidity range | η | < 1.4 and has an intrinsic time resolution of 60 ps. Exploiting the time-of-flight information allows powerful discrimination between pions, kaons, protons, and light nuclei in the momentum range 0.1–4 GeV/c. The goal of the electromagnetic calorimeter (ECAL) is the detection of electrons and photons. It also allows the detection of neutral mesons via their decay in two photons. The ECAL is made of sampling (lead+scintillator) modules with a light readout with silicon photomultipliers. Two arrays of the forward hadronic calorimeter (FHCAL) are used to perform event centrality selection. Two arms of Cherenkov counters of the forward detector (FD) are meant to provide an online trigger and start timing for the TOF detector.

3. Reconstruction of Hypernuclei in the MPD Experiment

The NICA complex is planned to operate with beams of bismuth ions during the start-up period. The NICA operation time will be divided between accelerator studies, beam commissioning, and data collection for physics. During this period, beam collisions will be performed at 9.2 GeV (4.6 GeV per beam) with a reduced value of the luminosity of 5 · 10 25 cm 2 s 1 . The MPD team has defined a plan to collect 40–50 million of Bi+Bi collisions per week during the first year of NICA operation. In this study, we use a similar amount of simulated events. As an input for our feasibility study, we use the parton-hadron-quantum-molecular dynamics (PHQMD) microscopic model [12]. This event generator uses an n-body transport approach, which describes heavy-ion collisions, including the formation of bound systems containing strangeness. As reported in Ref. [13], PHQMD reproduces the existing experimental data on hadron and (hyper)nucleus production in a broad collision energy range and over a wide phase-space region. We use a set of 4 · 10 7 Bi+Bi collisions at s N N = 9.2 GeV. In order to have sufficient statistics of Λ 4 H and Λ 4 H e nuclei in the analysis, their yields in the model are enriched by a factor of 40. All produced particles from the model are propagated through the MPD detector with the GEANT program which simulates interactions in the material. All the simulated energy deposits are transformed into the detector response (space points) using realistic description of physics processes in the MPD detector elements. The produced space points are then reconstructed by system-specific cluster-finding procedures. For example, a TPC cluster is a collection of registered charges in several neighboring space and time bins (the bin size is 5 mm in the direction perpendicular to the beam axis and 100 ns in the time direction). The reconstructed clusters are then combined into tracks using the Kalman filter approach [14]. To find the main collision vertex, all the reconstructed tracks are extrapolated toward the detector center. By extrapolating tracks from the MPD center to the surface of the TOF detector, one can find the matches of TPC tracks with the hits in the TOF system, and for all matched cases, the mass squared (divided by the magnitude of the particle’s charge) can be calculated as
m 2 / q 2 = ( p / q ) 2 c 2 t 2 l 2 1 ,
where l denotes the track length, p the total momentum, q the magnitude of the particle’s charge, and t the time-of-flight.
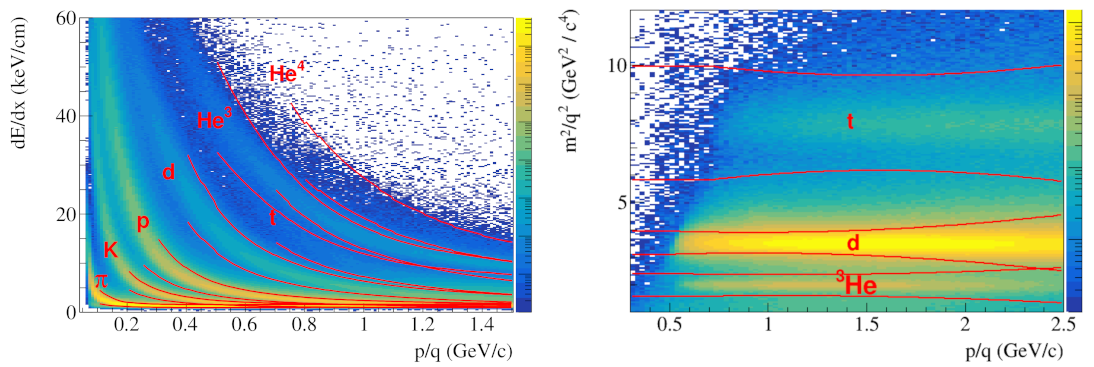
Identification of charged hadrons and light nuclei in the analysis relies on the combination of the information on the ionization energy loss, d E / d x (the energy deposited by charged particles in layers of thickness d x ) in the TPC gas and the mass-squared from the TOF. The information under interest ( d E / d x or m 2 ) is compared to the expectation for a given species. For the case of the ionization loss, the expected value is taken from the Bethe–Bloch distribution, while for the case of mass-squared, the ‘measured’ value is compared to the particle’s rest mass. In Figure 2, the specific energy loss and mass-squared for hadrons and light nuclei from Bi+Bi collisions are shown as a function of rigidity, p / q . The red lines indicate the ± 3 σ boundaries from the expected positions used to separate particles of different types; here, σ denotes the corresponding resolution. It should be noted that momentum reconstruction relies on the assumption that all particles are singly charged. Thus, for double-charged nuclei ( 3 He and 4 He), the reconstructed momentum is two times less than the actual one, and the calculated mass-squared is less then the nominal value by a factor of 4. In this case, 4 He and deuteron candidates have the same m 2 , and discrimination between these two species is achieved using only the ionization loss information. Once a helium candidate is selected within the expected boundaries, the correct momentum information can be obtained from the refit procedure using the proper value for the electric charge of the candidate.
Hypertritons are reconstructed through the topological decay, Λ 3 H 3 He+ π . Once a pair of tracks identified as 3 He and a negatively charged pion are selected, the distance of closest approach (DCA) between the candidates is defined, thus determining the decay point of the hypertriton candidate. However, if the DCA value is larger than a given threshold, the pair is rejected. For the successive candidates, each daughter track is propagated back to the main vertex, requiring it to have a minimum DCA to the primary vertex to avoid selecting primary particles as daughters. Using the values of the reconstructed momentum components of the tracks, the momentum and the invariant mass of the hypertriton candidate are calculated. Further selection regards the direction of the reconstructed momentum vector of the candidate, which is required to point to the main vertex position by applying a cut in the cosine of the pointing angle. The analysis of reconstructed invariant mass distributions is performed in bins of transverse momentum, p T = p x 2 + p y 2 of 0.5 GeV/c width, where p x ( p y ) are the particle momentum components in x (
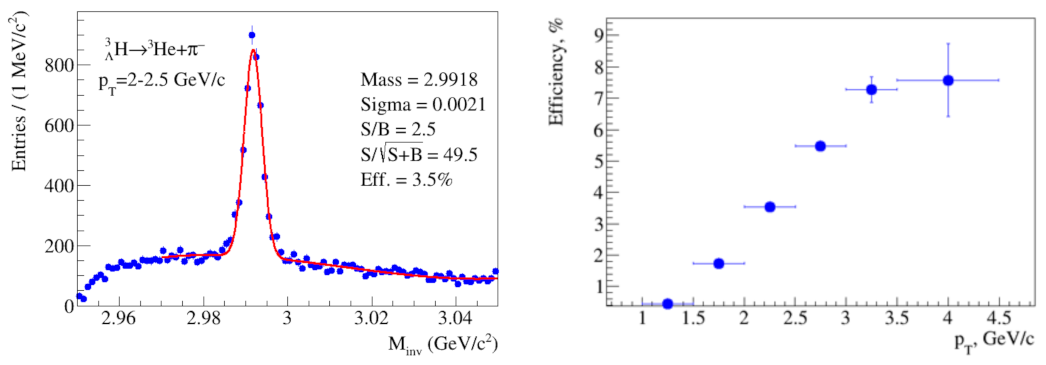
y) direction. An example distribution for p T = 2.0–2.5 GeV/c is shown in Figure 3 (left). Blue symbols indicate the reconstructed data. The shown invariant mass distribution can be described (fitted) by a sum of a Gaussian and a polynomial. The Gaussian corresponds to the signal peak, while the polynomial represents the background (uncorrelated combinations of candidates which passed selection criteria) in a certain range around the mass peak. The resulting fit is plotted in Figure 3 (left) by the red line. One can also indicate the signal parameters (mass and sigma) as well as the signal-to-background ratio ( S / B ) and significance ( S / S + B ). The raw signal is extracted by summing the bin content of the histogram over the 4 σ region around the nominal peak position. The amount of the combinatorial background, which is estimated from the fit, is subtracted from the bin-counted signal. The extracted signal value in each p T -bin is then corrected by applying the efficiency coefficient. This overall efficiency was obtained from the Monte Carlo data and includes the detector acceptance, the branching ratio, the reconstruction efficiency of the daughter particles, the particle identification efficiency of daughters, as well as the efficiencies of topological cuts applied in the secondary vertex reconstruction procedure. Figure 3 (right) shows the overall reconstruction efficiency for hypertritons as a function of p T .
A fully corrected invariant transverse momentum spectrum of hypertritons from Bi+Bi collisions is plotted in Figure 4. The reconstructed points, which are shown by red symbols, are compared to the initial distribution from the model (blue symbols). As can be seen, both spectra agree within the errors.
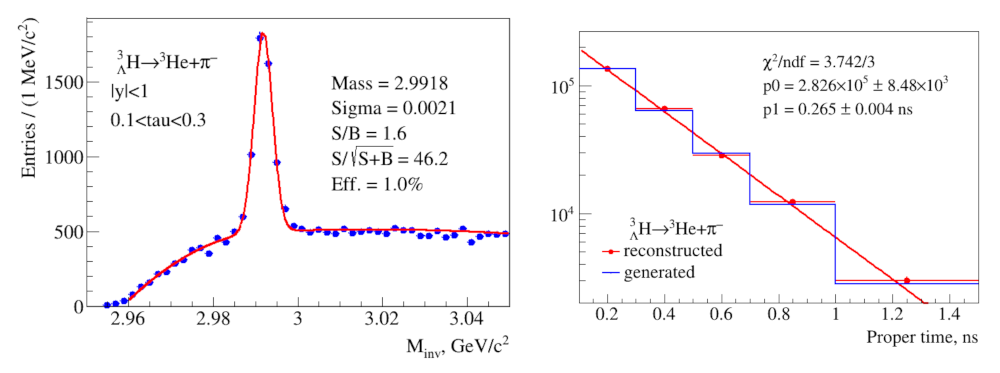
Hypertritons are unstable particles; thus, one expects that the yields of the hypertritons in proper time intervals drop off exponentially with the lifetime as a slope parameter. In order to extract the value of the lifetime τ 0 , one has to test the yields against the equation,
N ( τ ) = N ( 0 ) exp τ τ 0 = N ( 0 ) exp M L c p τ 0 ,
where τ = t / γ is the proper time, the factor γ = 1 / 1 ( v / c ) 2 , v is the velocity, L is the decay distance, p is the particle momentum, and M = 2.991 GeV/ c 2 is the hypertriton rest mass.
We extract the hypertriton signal in several bins for the proper time interval [0.1–1.5] ns. An example invariant mass distributions for τ = [ 0.1 , 0.3 ] ns is plotted in Figure 5 (left). The signal in each bin is then corrected by the overall efficiency, and the final distribution is plotted in Figure 5 (right). The distribution is fitted by Equation (2), and the result of the fit is shown by a solid line. The extracted lifetime parameter (‘p1’ in Figure 5) is obtained to be 265 ± 4 ps, which is quite close to the theoretical (model) value of 263 ps.
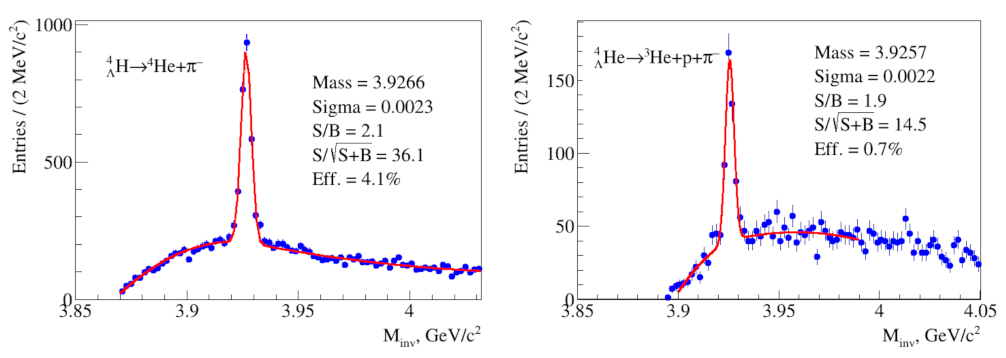
Heavier hypernuclei are reconstructed through the decay,
Λ 4 H 4 H e + π
for Λ 4 H nuclei and through the decay mode,
Λ 4 H 3 H e + p + π
for Λ 4 He.
This analysis was performed in the full MPD phase-space (without subdivision into p T or proper time intervals) with the goal to obtain an estimate of the overall MPD efficiency for these hypernucleus species. Figure 6 shows invariant mass distributions for Λ 4 H (left) and for Λ 4 He (right). As can be seen, the efficiency for Λ 4 He is lower because the three-body topology is much more complicated than the two-body one. Finally, one can estimate the number of registered MPD events for Λ 3 H during the first running year of the NICA complex (when the collider luminosity is expected to be 5 · 10 25 cm 2 c 1 ), taking into account the results obtained in this study for the reconstruction of hypernuclei. Exploiting the MPD reconstruction efficiency and model predictions for Λ 3 H, one expects to register about 10 3 hypertritons per one week of data taking. Since the production rates of heavier hypernuclei ( Λ 4 H and Λ 4 He) are much lower, the real study of their production starts once the NICA collider achieves its nominal luminosity of 10 27 cm 2 c 1 .

4. Summary

In this paper, we present the results of the evaluation of the MPD setup performance in reconstructing hypernuclei in heavy-ion collisions. The assessment procedure was performed by means of Monte Carlo simulation of Bi+Bi collisions from the PHQMD model. The yield of hypertritons is obtained in the transverse momentum interval, p T = (1.0–4.5) GeV/c and over a proper time range of 0.1–1.5 ns. In addition, the MPD’s efficiency for the reconstruction of Λ 4 H and Λ 4 He hypernuclei is estimated. An approximate estimate for the number of the reconstructed hypertritons during the first data-taking period at NICA is made.

Author Contributions

Conceptualization, writing—original draft, V.K. (Vadim Kolesnikov); methodology, V.K. (Vadim Kolesnikov) and A.Z.; formal analysis, A.M., V.V. and A.Z.; writing—review and editing, V.K. (Vadim Kolesnikov) and V.V.; software, V.K. (Viktar Kireyeu) and A.Z.; visualization, A.M. and V.V.; supervision, V.K. (Vadim Kolesnikov). All authors have read and agreed to the published version of the manuscript.

Funding

This research received no external funding.

Data Availability Statement

Data are available upon request.

Conflicts of Interest

The authors declare no conflict of interest.

References

  1. Rafelski, J. Discovery of quark-gluon-plasma: Strangeness diaries. Eur. Phys. J. Spec. Top. 2020, 229, 1–140. [Google Scholar] [CrossRef] [Green Version]
  2. Koch, V.; Majumder, A.; Randrup, J. Baryon-strangeness correlations: A diagnostic of strongly interacting matter. Phys. Rev. Lett. 2005, 95, 182301. [Google Scholar] [CrossRef] [PubMed] [Green Version]
  3. Wang, D.; Zhang, S.; Ma, Y. System size dependence of baryon-strangeness correlation in relativistic heavy ion collisions from a multiphase transport model. Phys. Rev. C 2021, 103, 024901. [Google Scholar] [CrossRef]
  4. Zhang, S.; Chen, J.H.; Crawford, H.; Keane, D.; Ma, Y.G.; Xu, Z.B. Searching for onset deconfinement via hypernuclei baryon-strangeness correlations. Phys. Lett. B. 2010, 684, 224–227. [Google Scholar] [CrossRef] [Green Version]
  5. Lattimer, J.M.; Prakash, M. The physics of neutron stars. Science 2004, 304, 536–542. [Google Scholar] [CrossRef] [PubMed] [Green Version]
  6. Tolos, L.; Fabbietti, L. Strangeness in nuclei and neutron stars. Prog. Part. Nucl. Phys. 2020, 112, 103770. [Google Scholar] [CrossRef] [Green Version]
  7. Acharya, S.; et al.; [ALICE Collaboration]. Λ3H and Λ ¯3 H¯ lifetime measurement in Pb–Pb collisions at sNN=5.02 TeV via two-body decay. Phys. Lett. B. 2019, 797, 134905. [Google Scholar] [CrossRef]
  8. Abdallah, M.S.; et al.; [STAR Collaboration]. Measurements of Λ3H and Λ4H lifetimes and yields in Au+Au collisions in the high baryon density region. Phys. Rev. Lett. 2022, 128, 202301. [Google Scholar] [CrossRef] [PubMed]
  9. Kekelidze, V.D.; Lednicky, R.; Matveev, V.A.; Meshkov, I.N.; Sorin, A.S.; Trubnikov, G.V. Three stages of the NICA accelerator complex. Eur. Phys. J. A 2016, 52, 211. [Google Scholar] [CrossRef]
  10. Steinheimer, J.; Gudima, K.; Botvina, A.; Mishustin, I.; Bleicher, M.; Stöcker, H. Hypernuclei, dibaryon and antinuclei production in high energy heavy ion collisions: Thermal production vs. coalescence. Phys. Lett. B 2012, 714, 85–91. [Google Scholar] [CrossRef] [Green Version]
  11. Abgaryan, V.; et al.; [MPD Collaboration]. Status and initial physics performance studies of the MPD experiment at NICA. Eur. Phys. J. A 2022, 58, 140. [Google Scholar] [CrossRef]
  12. Aichelin, J.; Bratkovskaya, E.; Le Fèvre, A.; Kireyeu, V.; Kolesnikov, V.; Leifels, Y.; Voronyuk, V.; Coci, G. Parton-hadron-quantum-molecular dynamics: A novel microscopic n-body transport approach for heavy-ion collisions, dynamical cluster formation, and hypernuclei production. Phys. Rev. C 2020, 101, 044905. [Google Scholar] [CrossRef]
  13. Gläßel, S.; Kireyeu, V.; Voronyuk, V.; Aichelin, J.; Blume, C.; Bratkovskaya, E.; Coci, G.; Kolesnikov, V.; Winn, M. Cluster and hypercluster production in relativistic heavy-ion collisions within the parton-hadron-quantum-molecular-dynamics approach. Phys. Rev. C 2022, 105, 014908. [Google Scholar] [CrossRef]
  14. Gertsenberger, K.; Merts, S.; Rogachevsky, O.; Zinchenko, A. Simulation and analysis software for the NICA experiments. Eur. Phys. J. A 2016, 52, 214. [Google Scholar] [CrossRef]
Figure 1. A schematic view of the MPD setup at NICA. See text for details.
Physics 05 00028 g001
Figure 2. Specific energy loss, d E / d x , in the TPC gas (left) and mass-squared (divided by q 2 ) distributions as a function of rigidity, p/q, (right) in Bi+Bi collisions. Red lines indicate the 3 σ selection bands. See text for details.
Physics 05 00028 g002
Figure 3. Left: invariant mass distribution for ( 3 He, π ) pairs in the transverse momentum interval p T = 2.0 2.5 GeV/c. Blue symbols indicate the reconstructed data, while the red line shows a fit to a sum of a Gaussian and a polynomial. Right: the overall reconstruction efficiency for hypertritons in transverse momentum intervals.
Physics 05 00028 g003
Figure 4. A reconstructed transverse momentum spectrum of hypertritons (red triangles) together with the initial p T -distribution from the model (blue squares).
Physics 05 00028 g004
Figure 5. Left: invariant mass spectrum of ( 3 He, π ) pairs in the proper time interval 0.1–0.3 ns. Right: proper time distribution of hypertritons with the fit (2) to extract the lifetime parameter (solid line). The reconstructed data are shown by solid symbols, and the blue histogram shows the model predictions. The ’pl’ denotes the lifetime parameter.
Physics 05 00028 g005
Figure 6. Invariant mass distribution for ( 4 He, π ) pairs (left) and for the combination of 3 He, proton, and π (right). The blue symbols indicate the reconstructed data, while the red line shows a fit by a sum function of a Gaussian and a polynomial.
Physics 05 00028 g006
Disclaimer/Publisher’s Note: The statements, opinions and data contained in all publications are solely those of the individual author(s) and contributor(s) and not of MDPI and/or the editor(s). MDPI and/or the editor(s) disclaim responsibility for any injury to people or property resulting from any ideas, methods, instructions or products referred to in the content.

