1. Introduction
Geothermal fields contain boiling or degassing thermal spots and geysers, which can exhibit cyclic discharge associated with hot water fountains that can reach tens of meters in height [
1]. A common understanding of geysers is that they consist of a conduit, a reservoir with a water supply, and a heat source [
2,
3]. However, the details of the conduit system, including dimensions, rooting depth, and possible interference with sedimentation processes, are generally unknown.
Geysers and thermal spots often occur in clusters, and about 1000 geysers have been reported worldwide [
4], associated with thermal spots that form bubbling springs and mud pools. A few selected sites, such as Yellowstone (USA), Haukadalur (Iceland), El Tatio (Chile) and Geyser Valley (Kamchatka), host most of these clustered systems. Geysers and thermal spots are analogous to erupting volcanoes [
5,
6,
7], both geometrically (a cone at the surface connected to a tubular conduit and reservoir system at depth) and dynamically (rising and pressurised gas bubbles drive periodic eruptions). For some selected geysers, regular eruption intervals have been studied in detail and complemented by experimental simulations [
7,
8,
9,
10,
11,
12,
13]. However, the sporadic appearance of geysers and thermal spots, and their disappearance and covering by sediment, has been much less studied. Some systems may be dormant for years and become completely obscured, while others may reactivate. As this study shows, geysers and thermal spots hidden under sediment can suddenly become active again.
Geysers and thermal spots are generally driven by the hot fluid rising through a complex and heterogeneous rock mass, often controlled by structural zones. The hidden structure, conduit geometry and bubble traps or reservoirs have a major influence on the eruption dynamics [
14], temperature gradient [
15] and eruption height of geysers [
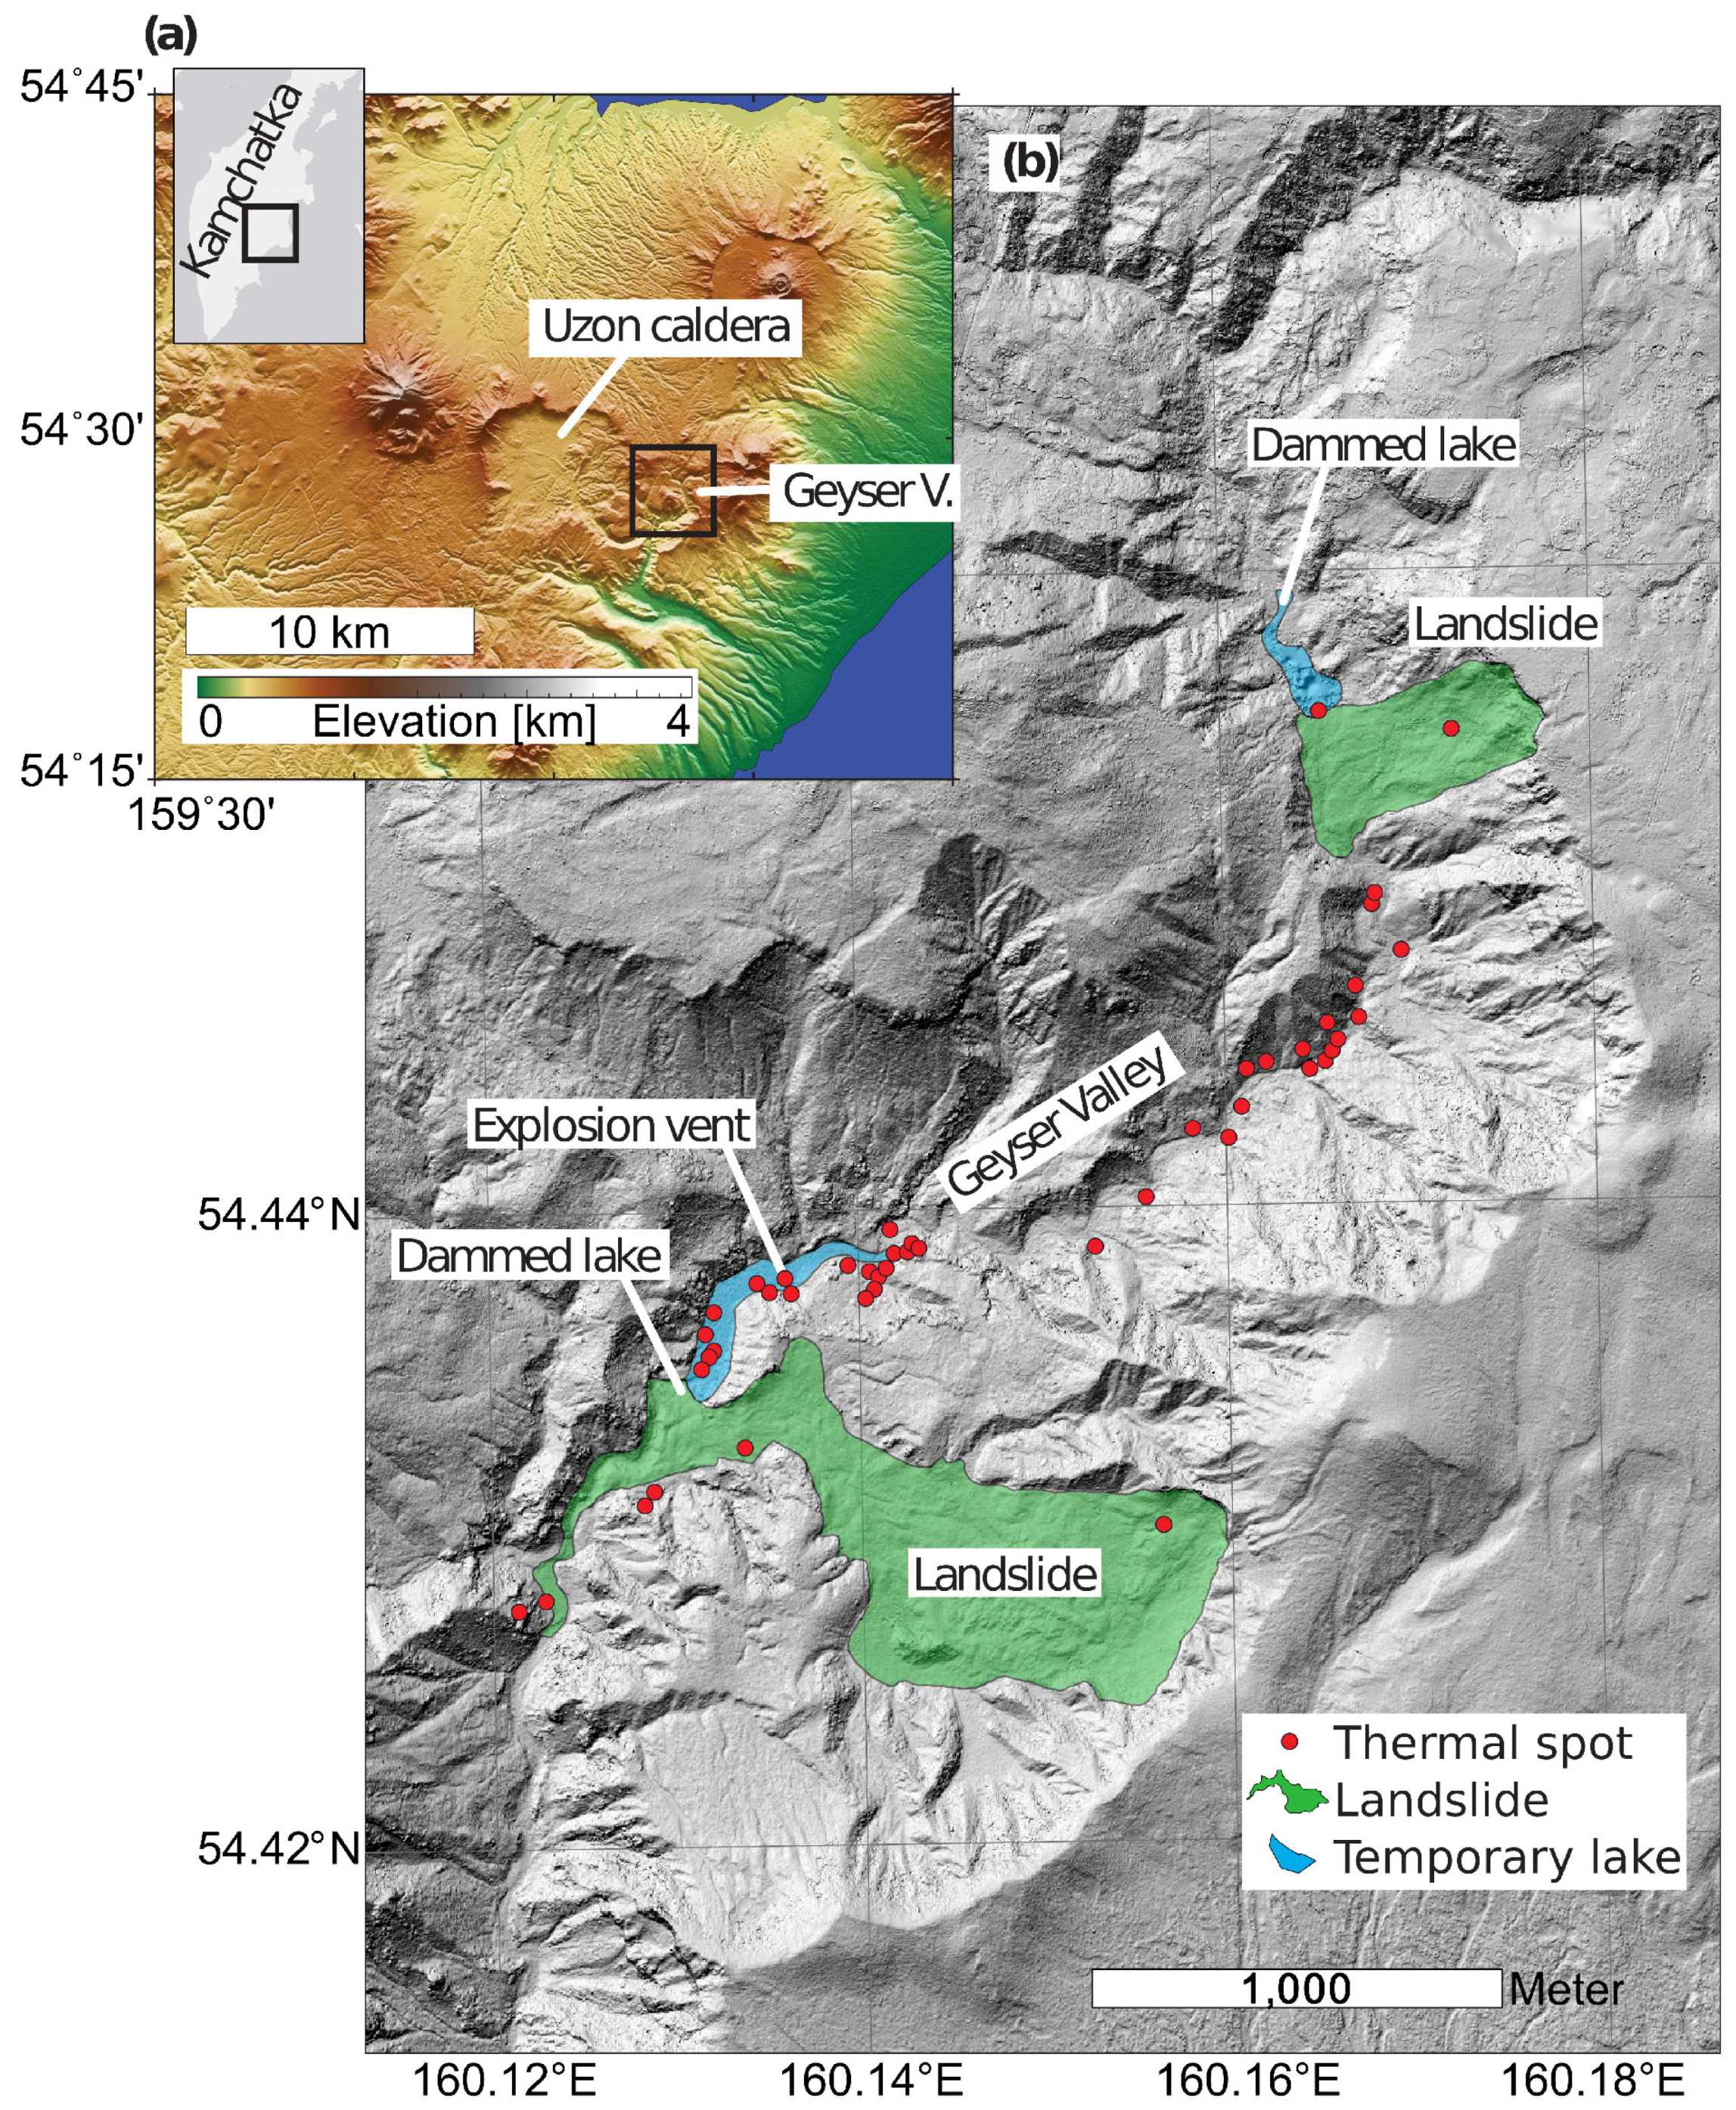
16]. However, the details of these structures at depth are not well studied worldwide. In addition, thermal spots can change continuously or abruptly during geological erosion, landslides, precipitation and flooding. In this paper we describe a unique (and not so rare) case of the sudden appearance of a new thermal spot in a geyser field. Using repeated drone measurements, a new vent was found in a geothermal area with characteristics consistent with explosive initiation. The study area is located in Geyser Valley, a tourist site in Kamchatka, Far East Russia (
Figure 1). As the new vent is close to footpaths and a tourist viewing platform, the occurrence of such explosions can endanger visitors and infrastructure and therefore requires closer monitoring.
Study Area
The geysers, pools, and thermal spots in the Geyser Valley are some of the most scenic geothermal sites of Kamchatka. The Geyser Valley is a UNESCO World Heritage Site, covering an area of approximately 1000 × 200 m
2 and extending along Geysernaya River (
Figure 1). The area lies to the east of the Uzon caldera, which is known to be a site of active magma intrusion and surface deformation [
17]. The Geysernaya River basin is flanked by steep slopes up to 400 m high, which is why rockfalls and landslides are frequent. The geysers were only discovered in 1941 [
18] and have remained poorly studied due to their remote location, accessible only by helicopter.
The Geyser Valley is the second-largest geyser field in the world, with more than 70 named geysers and thermal spots [
19]. The valley has been identified as a site of multiple hazards, such as rockfalls, landslides, sudden floods, and geothermal explosions, which can occur suddenly [
20]. In recent years, for unknown reasons, the frequency and magnitude of these hazards has increased.
On 3 June 2007, a large landslide mobilised 22.6 million m
3 of material from the south-eastern flank. The landslide mass stopped very close to the building of the Kronotsky Reserve Information Centre. The mobilised material was deposited in the deep part of the valley, creating a river dam and leading to the formation of a large temporary lake. Due to the blockage of the Geysernaya River, the new lake became up to 950 m long, 122 m wide, and up to 27 m deep, with a volume of about 125,000 m
3 [
21]. A number of thermal features disappeared (
Figure 1), including 10 of the geysers [
19]. Following the draining of the lake, another major landslide occurred on 4 January 2014. This time the landslide was located 2 km to the north, again sliding from the eastern flank into the Geysernaya River valley and again leading to the formation of a lake. The volume of collapsing mass from this second landslide was estimated to be around 2.2–2.7 million m
3 of material [
22]. The 2014 landslide again covered geysers and several thermal spots [
19].
After the two most recent landslides, in 2007 and 2014, when mobilised material dammed the river and covered active geysers, it was speculated that these covered geothermal features might reactivate. Some geysers were buried by the coarse-grained deposits of the landslides and the associated mudflows and some were flooded by the two newly formed lakes [
19,
23]. The landslides also changed the hydrogeological situation of the adjacent areas, where some geysers started to change their activity [
24]. The effects of the landslides are still ongoing, and because the hydrogeological situation of the area is unstable, erosion and redeposition of clastic material is imminent.
Geysers can be monitored by using geophysical, geochemical, and other instruments, such as underwater cameras. The two most powerful geysers are Velikan and Bolshoy, both of which are fed by an identified cavity allowing episodic boiling and eruptions [
25]. The erupted volumes and eruption fountain heights are on the order of 20 m
3 and 25 m at Velikan (before 2007), and of 15 m
3 and 15 m at Bolshoy, respectively [
25]. The area is annually visited by about 4000 tourists during the short summer season (
Figure 2), so it is important to describe and understand the location of the new geothermal explosion.
2. Materials and Methods
First, a helicopter flight and a photogrammetric survey carried out in 1996 and 2014, respectively, bookend the period of the major landslides and lake damming. Second, the 2018 satellite images acquired by the tri-stereo Pleiades sensors allow the generation of a metre-scale dataset. Third, our drone measurements in 2018 and 2019 have been used for centimetre-scale optical and thermal observations. Fourth, our direct field inspections of the new explosion site in 2019 provide the field views and close-up photographs of the explosion site. The acquisition dates, data volume, spatial resolution, and other characteristics of the datasets are presented in
Table 1, and more details on the data and processing steps are provided in the following sections.
2.1. Aerial Photogrammetry Survey with Helicopter
On 13 August 1996, the Institute of Volcanology and Seismology in Kamchatka took analogue aerial photographs from a Mi-8 helicopter (1250 m flying altitude) using an AFA-TE-140 aerial camera (focal length 139.5 mm; frame size 18 × 18 cm). On 14 September 2014, after the landslide, members of the Kronotsky State Natural Biosphere Reserve conducted another aerial photo survey by taking digital aerial photographs from a Mi-8 helicopter (825 m flying height) with a standard Canon EOS 5D Mark III camera (focal length 24 mm; image size 5760 × 3840 px).
We used this dataset and processed the data in Agisoft Metashape software (v. 1.7.0). We followed the processing procedure in Metashape and chose the high accuracy camera alignment and high quality of the dense cloud construction (see processing parameters in
Table 1). The dense clouds were further referenced using the 2018 Pleiades dataset (see below) by manually selecting prominent control points (markers) identified as having the same features both in the aerial and Pleiades data. Through this process, the reference errors were significantly reduced and were estimated to be between 0.2 m and 0.5 m, which we consider sufficient for the purposes of this study. We note that the referencing is relative to each other, whereas absolute positioning would require ground control point measurements. As a result of the processing and referencing, we obtained the 1996 and 2014 point clouds, digital elevation models (DEMs), and orthophoto mosaics, which we displayed using a WGS84 coordinate system, UTM zone 57.
2.2. Pleiades Satellite Data and Processing
The Pleiades constellation consists of two identical satellites, Pleiades-1A and Pleiades-1B, which were launched in December 2011 and December 2012, respectively. Both satellites are fly in synchronous orbits at an altitude of 694 km at an inclination of 98.2°, with a 180° offset from each other, providing a daily revisit interval [
26]. The Pleiades satellites are designed for VHR panchromatic (PA) and multispectral (XS) optical observations. Tri-stereo acquisitions are realised by three camera orientations, forward, nadir, and backward (F-N-B), allowing advanced photogrammetric processing. The baseline/height ratios vary between 0.1 and 0.5 with corresponding stereo angles from 6° to 28° [
27]. The sensors are capable of collecting both panchromatic and multispectral images with nominal resolutions of 0.5 m and 3 m, respectively. We used the tri-stereo triplet (F-N-B) of the Pleiades images acquired on 27 September 2018. These data are of high quality with excellent geolocation and minimal local distortion, so we also used them as a reference for our other photogrammetric models derived from helicopter or drone photographs. Image orientation was based on the 20 Rational Polynomial Coefficients (RPCs) that are available as an auxiliary file to the satellite image data. The RPCs are derived from the knowledge of the parameters of the imaging geometry and allow a ground point to be related to the image point [
28]. The RPCs are based on image orientation, which is realised from a combination of GPS, star sensors, and orbits, thus including instantaneous attitude, orbital information, and the expected digital elevation of the imaged area. According to AIRBUS DS, the accuracy of the direct sensor orientation is 8.5 m for Pleiades 1A and 1.6 m for the Pleiades 1B.
For the processing of the Pleiades data (
Figure 3), we used the Agisoft Metashape software tools and a similar methodology to that used for the aerial imagery data previously described. The workflow, as applied to this research, starts with satellite image triangulation and dense image matching, followed by 3D reconstruction, point cloud densification, and digital elevation model (DEM) interpolation. With the processed Pleiades images, we obtained a very high-resolution georeferenced DEM.
Table 1 shows the details of the tie points matching, dense point cloud construction and final DEM generation.
2.3. Drone Surveying and Processing
In June 2018 and September 2019, we conducted drone surveys in the Geyser Valley. Our drone flights were conducted during daylight hours in order to acquire high quality photographs with at least 70% image overlap. We also conducted nighttime drone flights in order to acquire high quality thermal infrared imagery using a thermal camera (FLIR TC640, FLIR System, Inc., Wilsonville, OR, USA). For both, we used a DJI Phantom 4Pro, and we conducted several aerial surveys of the valley and, in particular, of the explosion site (
Figure 2c). Due to the poor weather conditions in the early morning, we had a very short time to fly the thermal UAS before sunrise. The best time to fly an UAS with a thermal camera attached was at 4:00 am local time.
The flight mission altitude was 100 m above ground in 2019 and 300 m in 2018 for both optical (
Figure 4) and thermal infrared flights (
Figure 5). Optical imagery was acquired at 2 frames per second and thermal imagery was acquired at 8 frames per second.
The FLIR thermal camera has an image array of 640 × 512 pixels with a focal length of 9 mm. It is capable of capturing long-wave radiation in the 7.5–13.5 µm range at 14 bits. The camera was connected to a Teax frame grabber and a GPS geotagging system [
15]. The calibrated brightness temperature range was defined as 0–250 °C, as it was assumed that this range would cover the expected temperature field in the geyser valley.
The thermal data depend on object and environmental properties, which in this case are mainly the object’s emissivity, distance, solar reflectance, viewing angle, and the presence of gases and water vapour in the electromagnetic radiation path. For a comprehensive overview of these environmental effects, we refer to previous work [
29]. Properties must be taken into account to improve the results [
30]; we assumed a constant emissivity of 0.95, common for volcanic environments, and a constant altitude. Other environmental effects that may affect the temperature brightness, such as atmospheric attenuation, were taken into account using the radiometric correction theme in the ThermoViewer software (Teax Technology, vs. 3.0.7), a transmissivity of 0.7, an ambient and path temperature of 10 °C, and a humidity of 50%. We then exported the thermal images at a sampling rate of 1 Hz (one image per second). We used the Agisoft Metashape software to generate the thermal orthophoto, following the same steps as for the optical images.
In Agisoft Metashape (v. 1.7.0), the first step was to import the images into the software. Due to the sharp elevation changes in this area (valley-mountain), we had to increase the overlap to 85%. Therefore, we obtained a large number of photos for a small area (442 photos in 2018 and 552 photos in 2019). The second step was photo alignment and tie point matching (461,961 tie points in 2018 and 832,952 tie points in 2019), and the third step was depth mapping and dense point cloud generation. We used an aggressive method for this, as it allowed us to generate more points in the area of dense vegetation. Agisoft Metashape software was used to extract 574,312,627 dense points for the 2018 dataset and 999,561,322 dense points for the 2019 dataset. The fourth step was to clean the point cloud and reduce the noise. The DEM was then generated with a resolution of 21.1 cm/pixel for the 2018 dataset and 10.4 cm/pixel for the 2019 dataset. The fifth step was to generate an orthomosaic on the basis of the DEM. The final processing step was to correct the georeferencing of the orthomosaic, which we did by aligning it to the Pleiades orthomosaic in ArcMap 10.6.1. Finally, we generated UAS orthomosaics of 10.5 cm/pix in 2018 and 5.2 cm/pix in 2019 (
Figure 4).
During the processing, we lacked the availability of ground control points (GCPs) that were independently measured by a GNSS system. Therefore, we used the Pleiades 1B tri-stereo data as our reference and co-aligned all orthomosaics and points as relative to them. The resulting absolute error can be 1.6 m (AIRBUS DE) or more, but the relative position error is in the order of decimetres. The most challenging part of this processing is the georeferencing of the FLIR thermal orthomosaic. This is because at low temperature sites where there is a lack of contrast in the thermal images, we do not have enough objects for manual referencing. We therefore use the thermal expression of hot discharge regions, such as the geysers and hot pools, as relative ground control points that are visible in both optical and thermal infrared data.
2.4. Field Observations
In June 2018, we visited the geyser valley to observe the Bolshoy geyser and the geothermal anomalies around it. In September 2019, we visited the valley again and investigated the new explosion site near Bolshoy geyser (
Figure 2c). We made field observations, estimated the height of the crater rim, measured the crater diameter with a meter, and took ground control points with a handheld GPS. We also used a handheld thermometer (PT 100 device) to measure the temperature of the water and rocks, and took infrared measurements with the FLIR 640 camera. We also collected detailed close-up photographs, which allowed us to capture the features of a section that cut through the crater rim of the explosion site, revealing several layers of ejected debris.
2.5. Analysis in GIS
After processing all UAS and FLIR photos in the Agisoft Metashape software, we obtained a geotiff geospatial dataset. We use the UTM zone 57 coordinate system in ArcGIS v. 10.6.1 for the accurate analysis and comparison of the data. After co-alignment, we were able to refine the data alignment by including other objects such as tourist buildings, footpaths and a helicopter platform.
Once we had all the data in one coordinate system, we used the optical and thermal infrared data sets to create a profile line across the explosion site.
The photogrammetric data was further analysed using Principal Component Analysis (PCA), a powerful statistical tool. PCA analysis can reveal information that is not accessible to the naked eye [
31] and has been used in remote sensing for a variety of purposes. Applied to volcanoes, PCA analysis has been used to map the degree of hydrothermal alteration and identify hidden structural zones relevant to flank instability [
32]. PCA is highly efficient at visualising even small colour variations in an image dataset, i.e., by reorganising the original image pixel array along the perpendicular axes of their highest variance/covariance. This results in a reduction in dimensionality from three optical channels, namely R_G_B, to single principal components. A mathematical derivation and historical review of PCA is presented in [
33]. In this study, we used PCA in the classification toolbox in ArcGIS to define the different components of optical images collected at the site in 2019 and compared them with thermal images from the same date. The results will improve the visual identification of stratigraphic layers compared to thermal infrared data.
3. Results
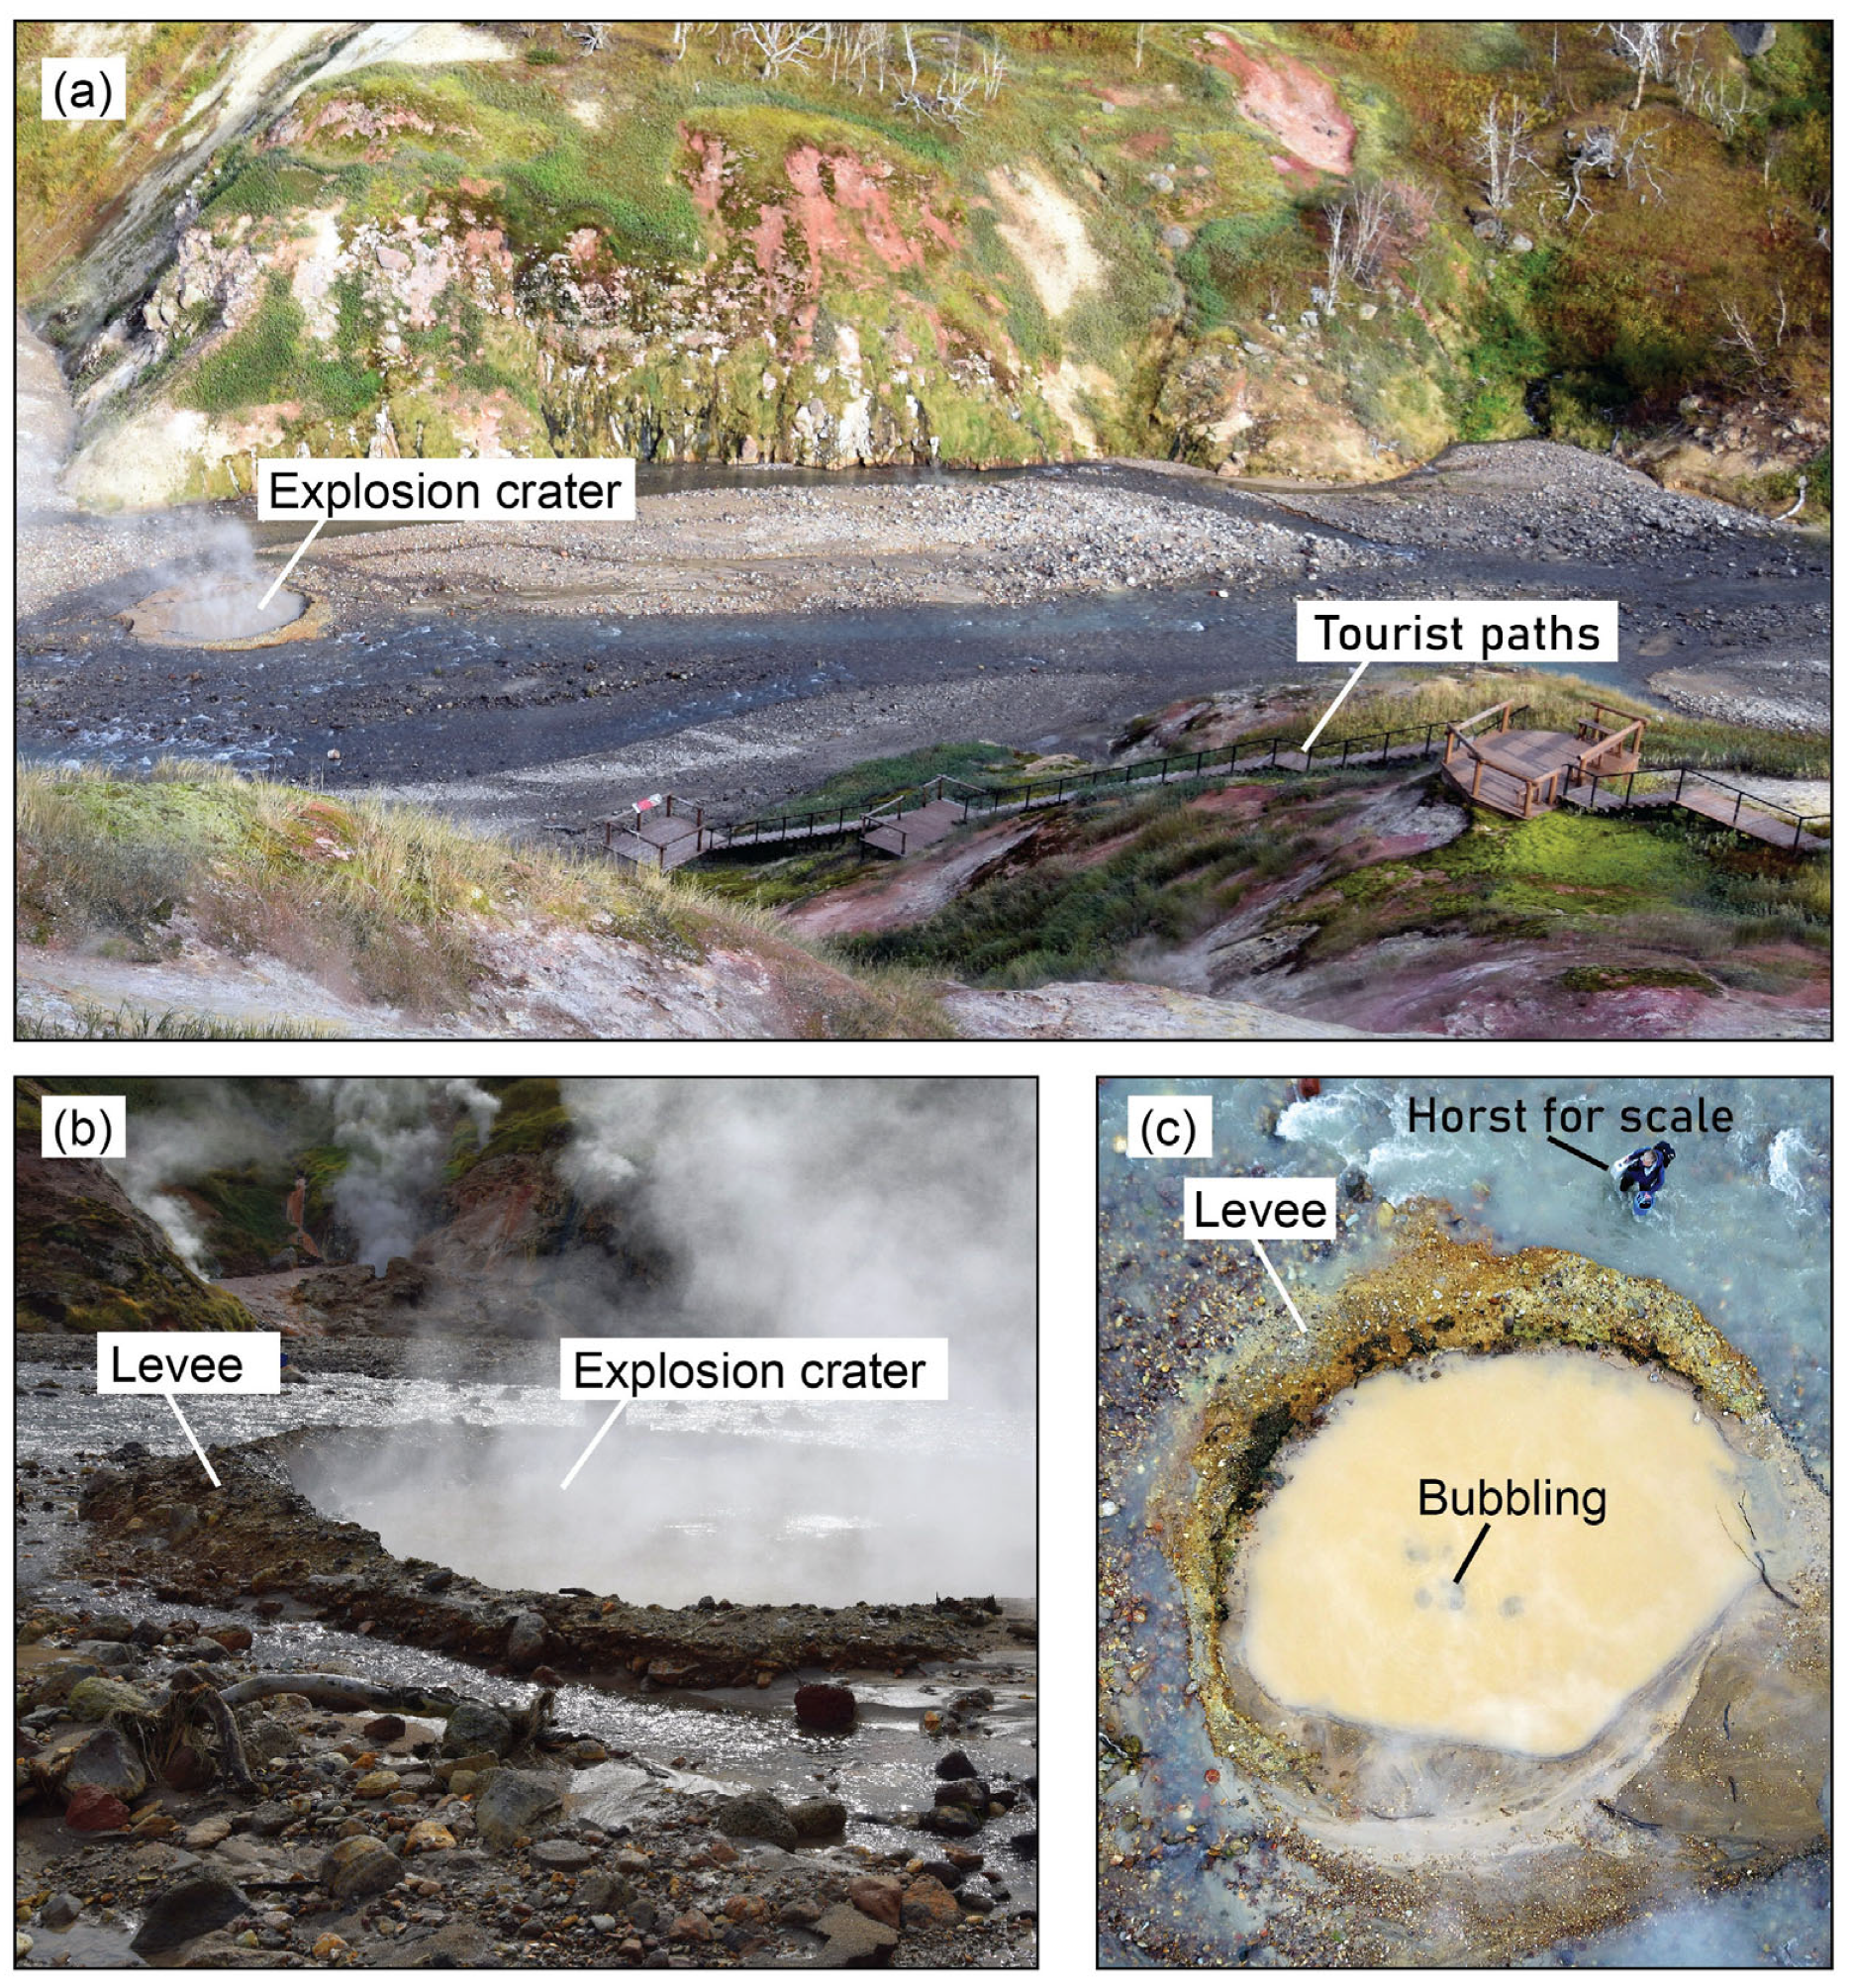
Visual inspection of the area of interest shows that the surface previously covered by the former (temporary) lake was relatively dry in 2018, except for a small river or stream about 12 m wide and less than 1 m deep. The field visit shows the presence of a new crater located very close to one of the most visited tourist trails in Geyser Valley (
Figure 2a). Close inspection also reveals that the crater is surrounded by an elevated rim (
Figure 2b). Intense and episodic bubbling of hot water and steam was observed in the crater (
Figure 2c). The 2019 dataset shows the explosion site in the middle of the riverbed, at a location where the depth of the dammed lake was a maximum of 10 m.
Photogrammetric processing of the available data (helicopter imagery, Pleiades tri-stereo data, drone optical and thermal infrared data) provides us with DEMs and orthomosaics of varying quality and resolution (see
Table 1). The Pleiades data provide a large coverage dataset sampled at 1 m resolution, showing the extent of landslides, the Geyser Valley as a whole, and the location of geysers along the river. These data were also used as a reference dataset. The 1996 helicopter imagery at 0.5 m resolution provides a view of the valley long before the region was affected by landslides and flooding. The drone data provided an even higher resolution digital elevation model or orthomosaic.
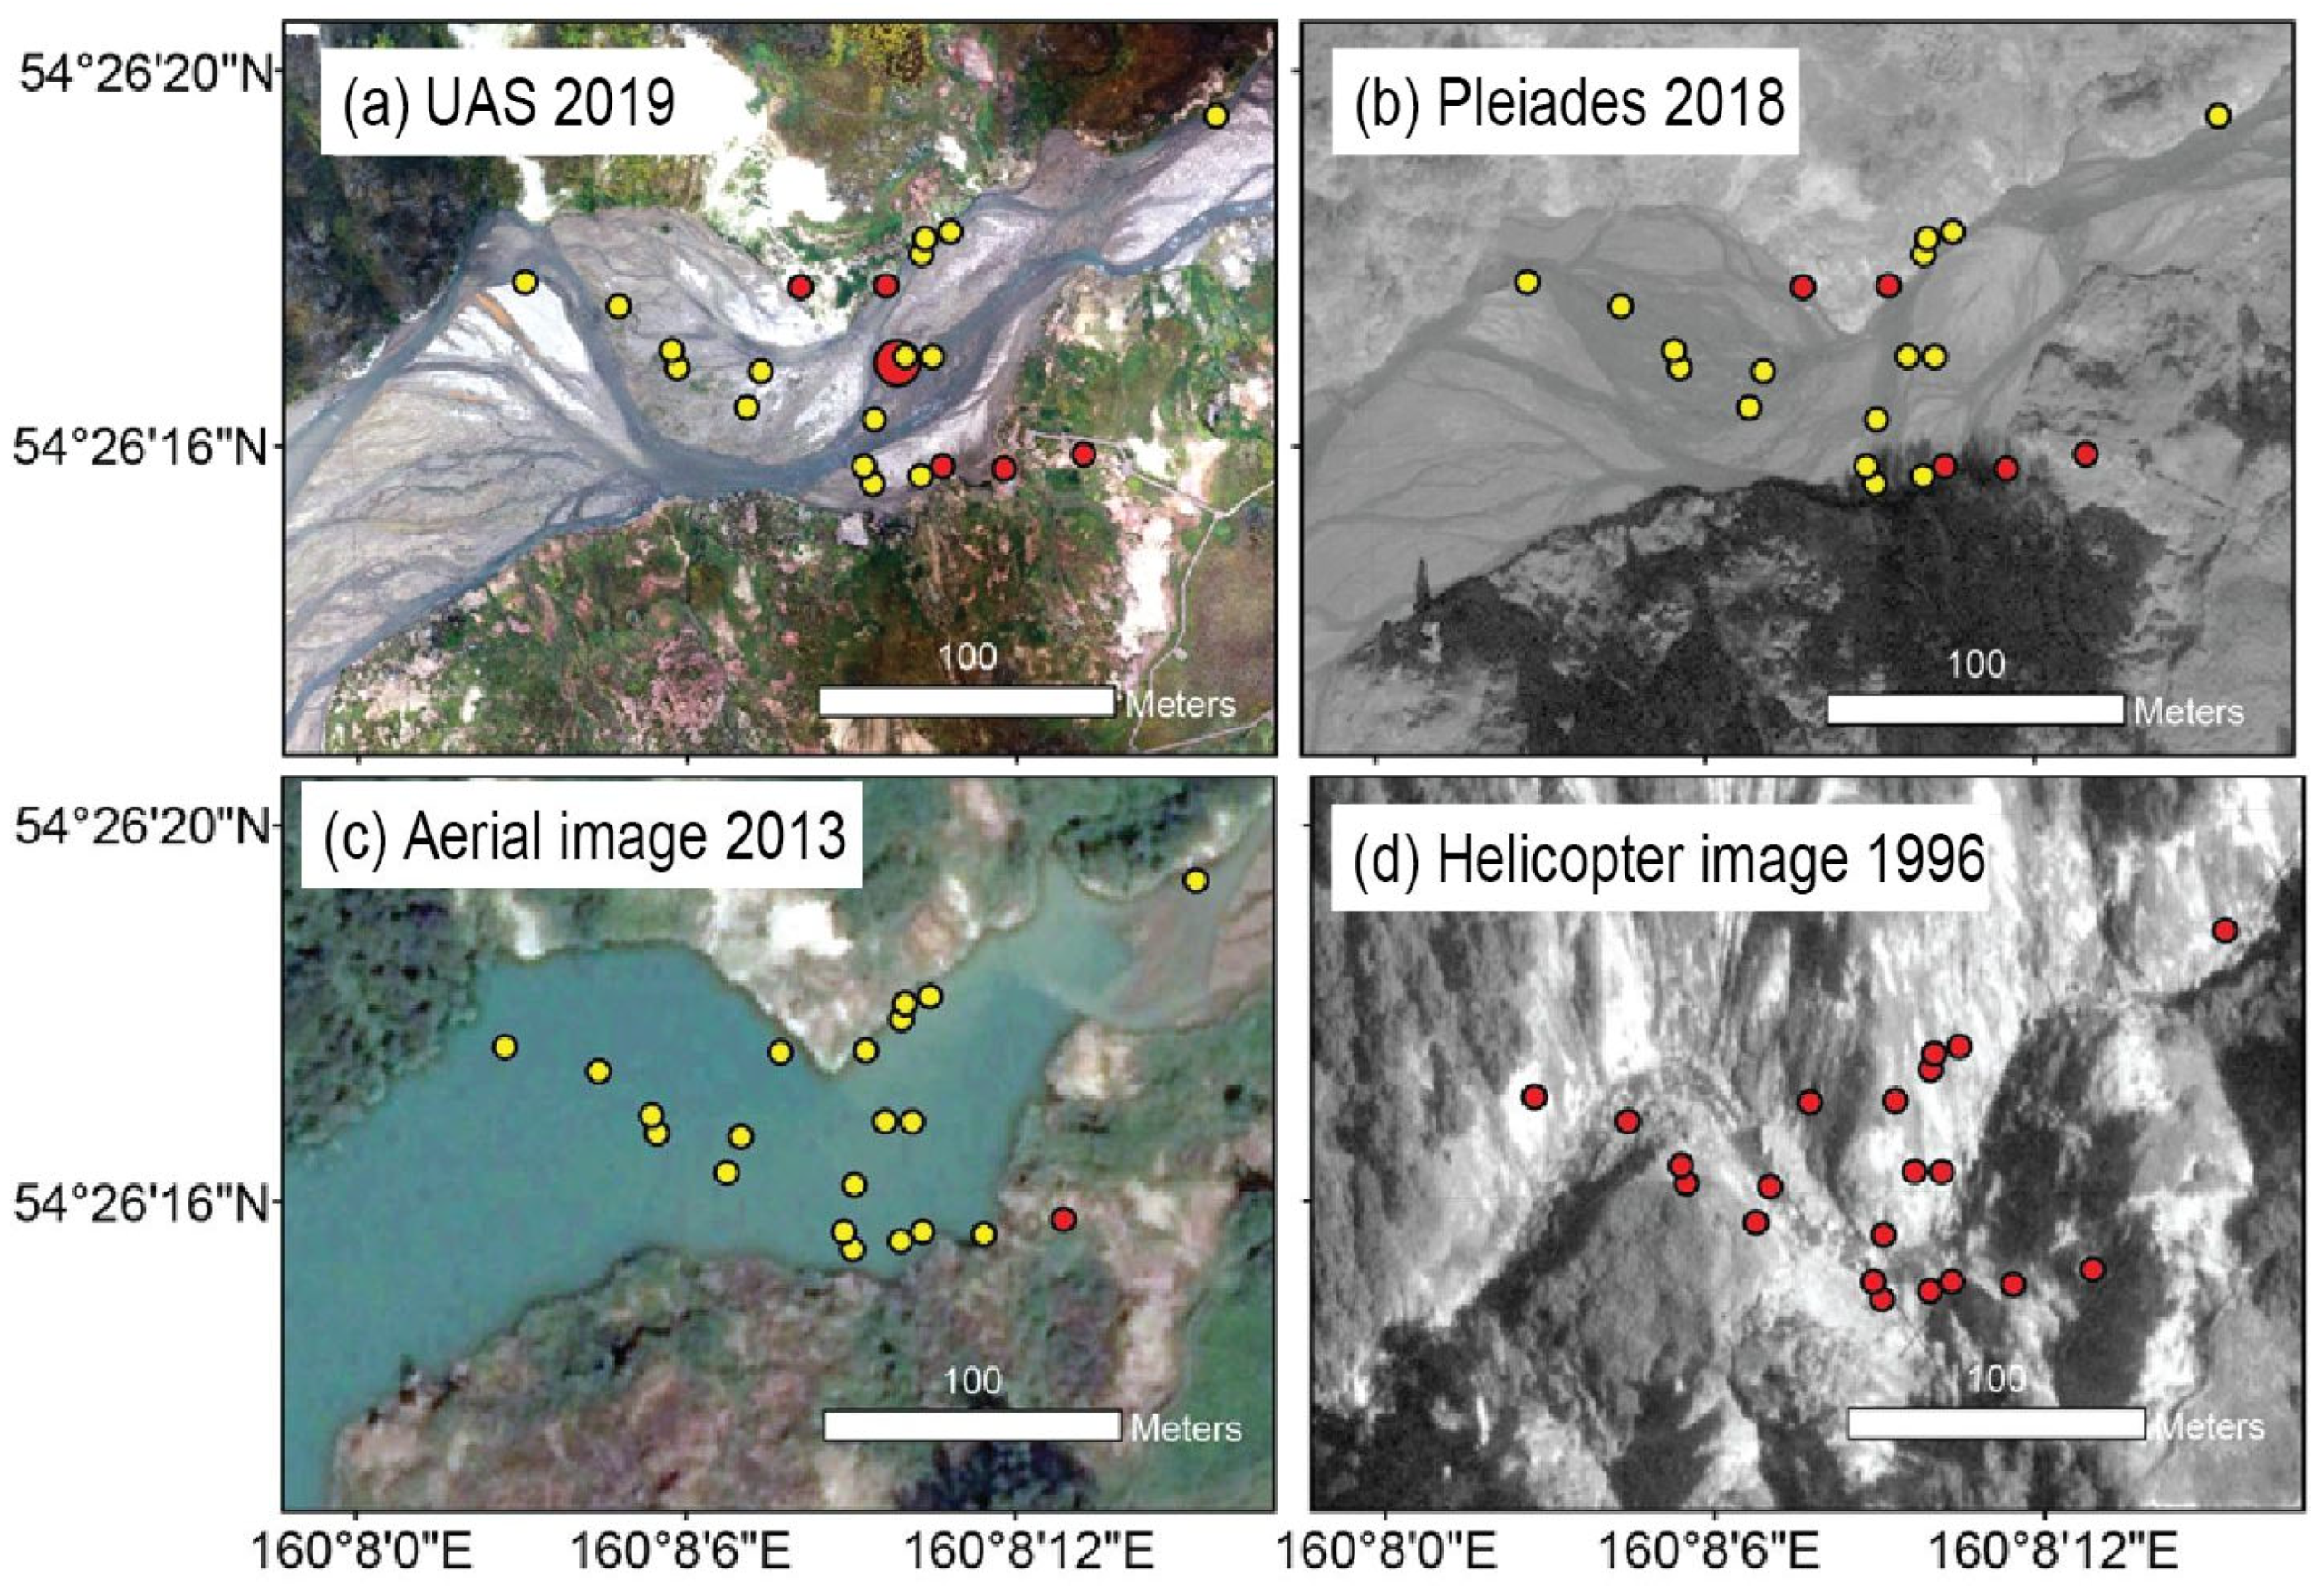
Comparison of the remote sensing images acquired over the 20 years (1996–2019) shows the profound changes in the area. In the 1996 helicopter image data, a deep valley with the presence of a group of small geysers and thermal spots called Malaya Pechka (Small Stove) (
Figure 3a) is visible. After the 2007 landslide and river dam, a lake covered this group and other geysers (
Figure 3b), with an estimated 20 thermal spots being covered by sediment and water. Malaya Pechka was not visible in the Pleiades satellite data, nor in the optical and thermal data acquired by our drone in 2018 and by aerial photography in 2014 (
Figure 5). The drone data confirm that the sedimentary terraces have developed in the riverbed do not show the visual characteristics of hidden geysers or thermal features.
A closer comparison of the 2018 and 2019 data shows that the river flows have changed: in the 2018 dataset, the river has split into two or even three main flows at this location, forming two lens-shaped granular sedimentary terraces in the centre of the riverbed. Pronounced steam can be visually observed at two thermal spots identified in the dry southern flank of the riverbed (
Figure 4a). The thermal orthomosaic clearly shows this location, but also shows the low brightness temperature of the riverbed, with no evidence of a thermal anomaly (
Figure 4b). The 2019 optical dataset, in turn, shows a main river channel on the southern flank of the riverbed, as well as two smaller streams (
Figure 4c). Thus, the location of water flow has changed, as has the area of material accumulation and terrace formation. In the centre of the riverbed, a turquoise-green circular structure is visible in 2019, representing a small lake-filled crater surrounded by darker debris. This more recent thermal orthomosaic shows more detail of the riverbed, including thermal spots and geysers (
Figure 4d). Due to a lower flight altitude and clearer skies, the 2019 thermal images are of higher quality and resolution than the 2018 data (although exactly the same cameras and settings were used). In the 2019 thermal orthomap we can now see the details of the river and individual streams. In addition, a greater number of thermal spots were found on the southern slope of the river, such as around Bolshoy Geyser, but also on the northern slope of the river, with the strongest expression at the bend in the slope where river erosion takes place on the flanks. In addition, isolated thermal spots are visible higher up the slopes, mainly to the south, but also some to the north. The highest temperature brightness (at a boiling point of ~96 °C) is identified at the new crater location (
Figure 4d).
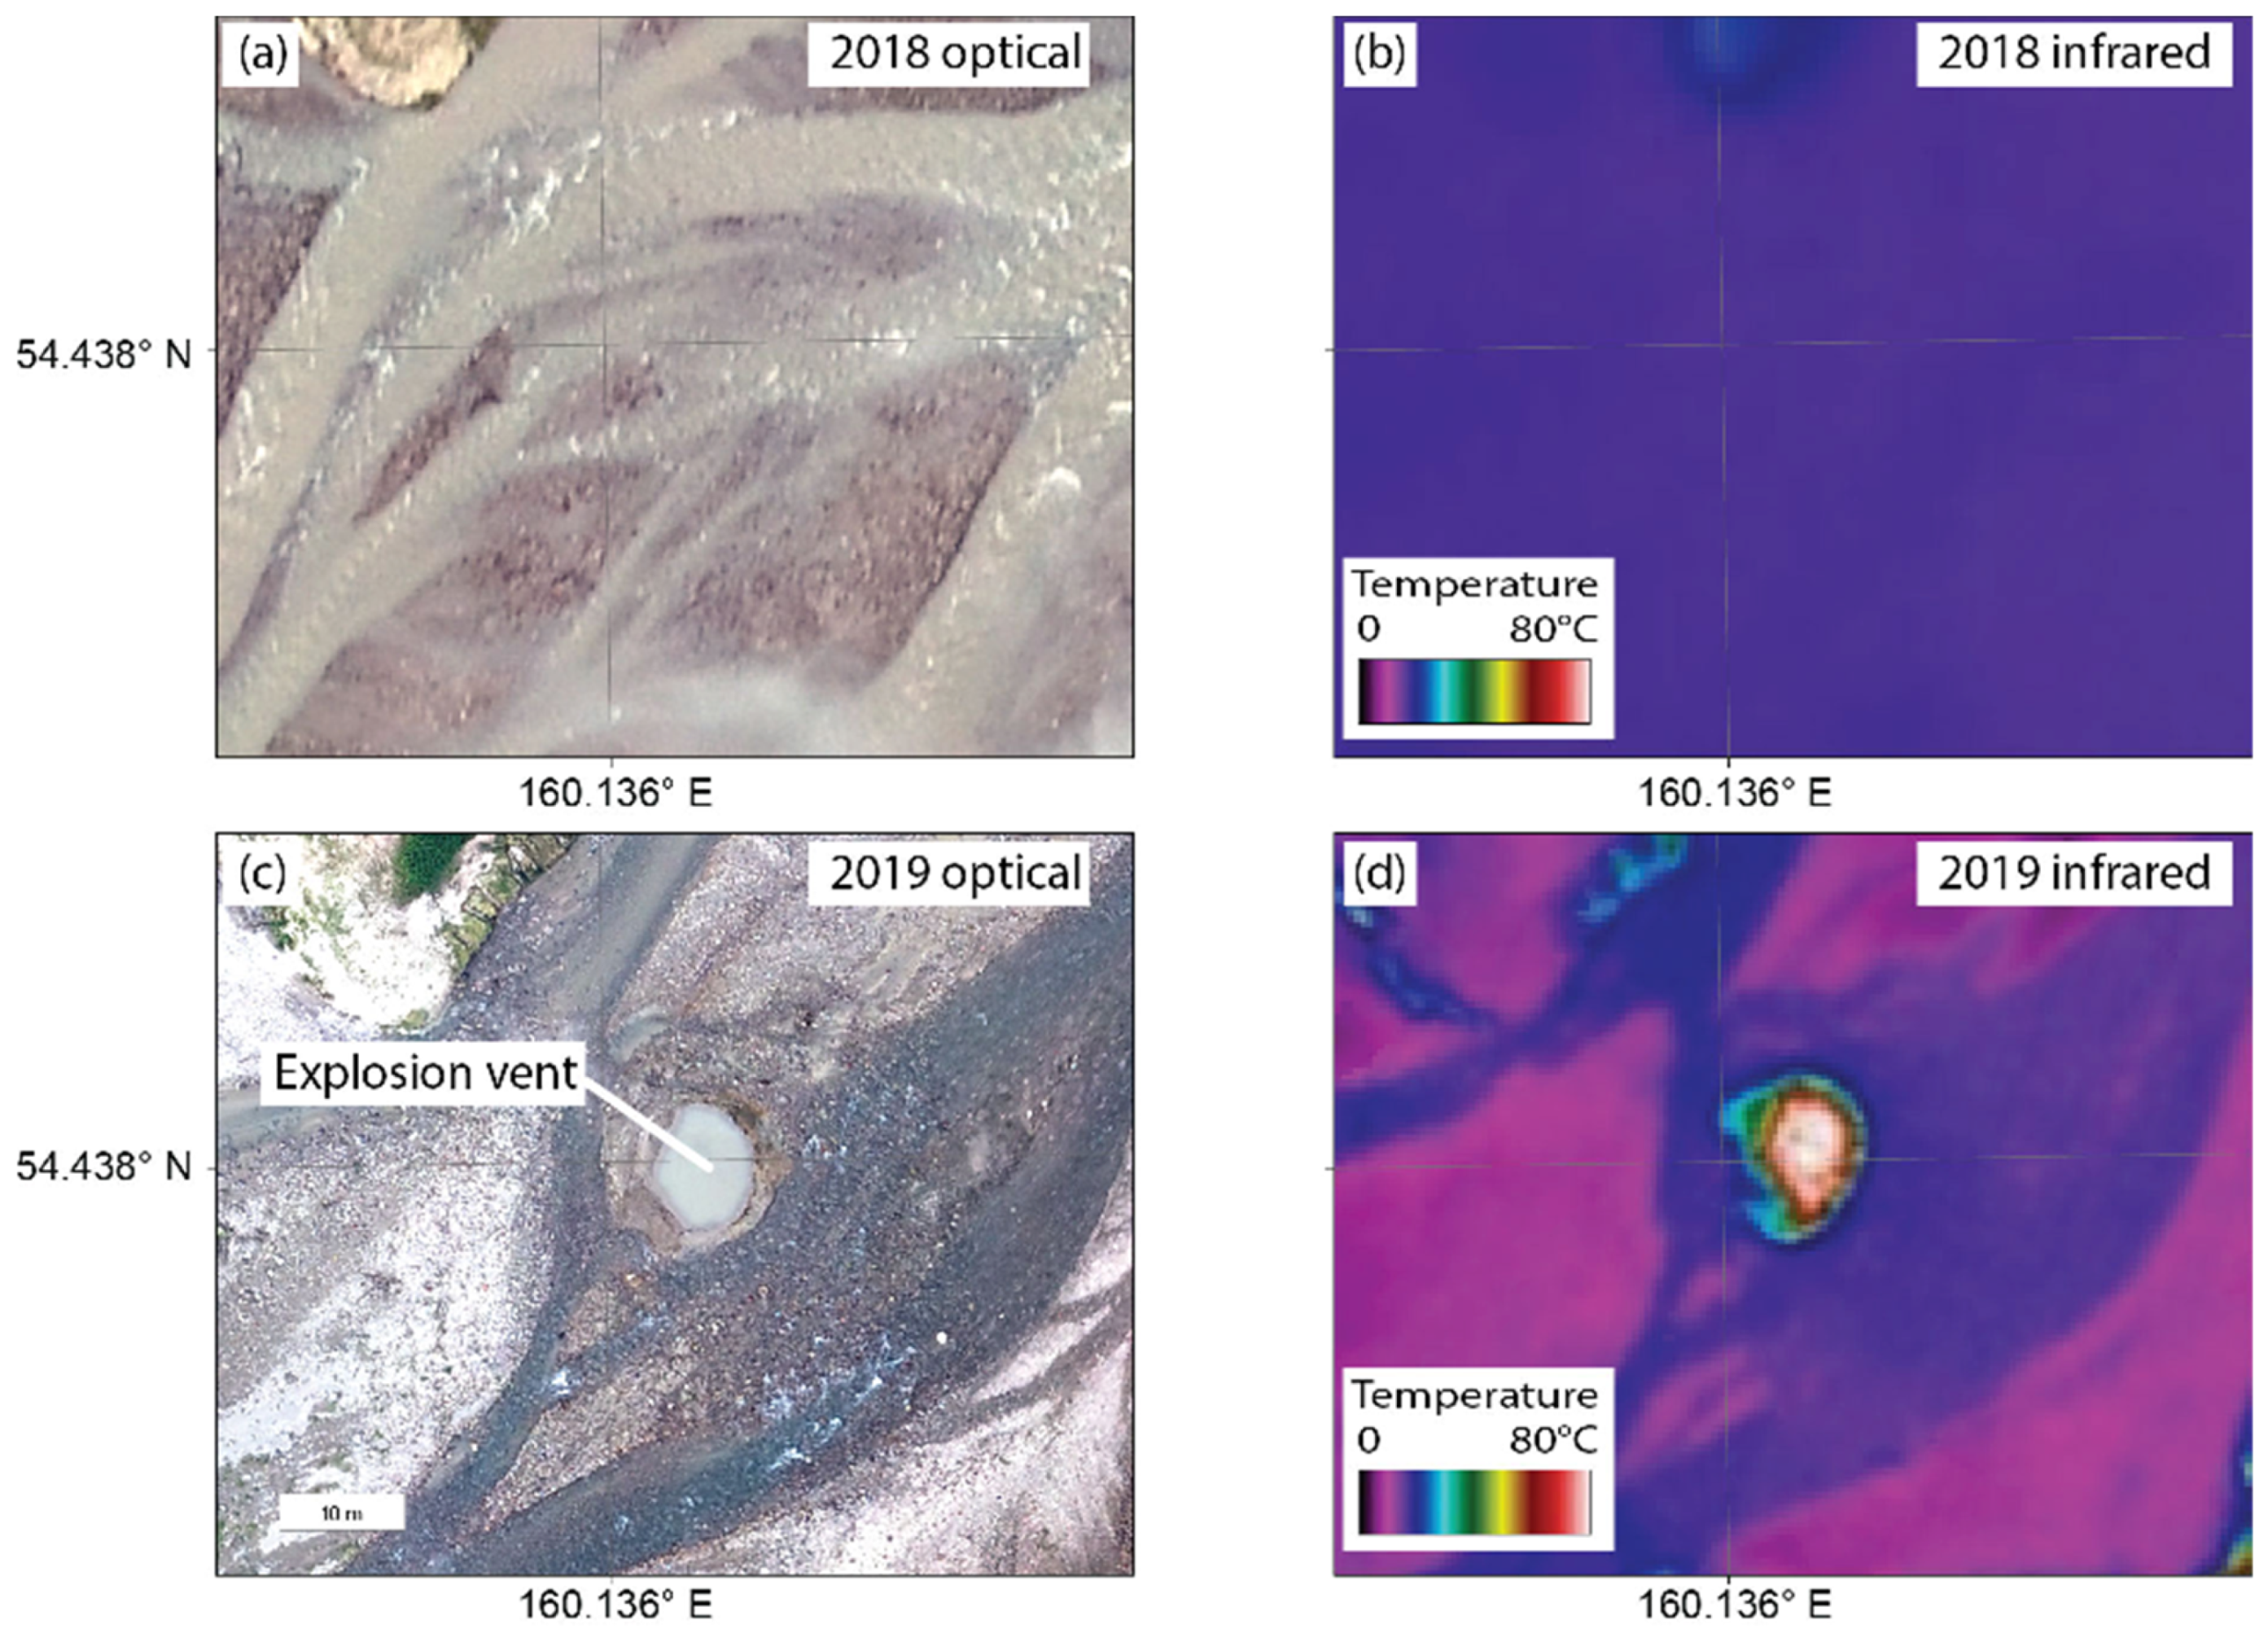
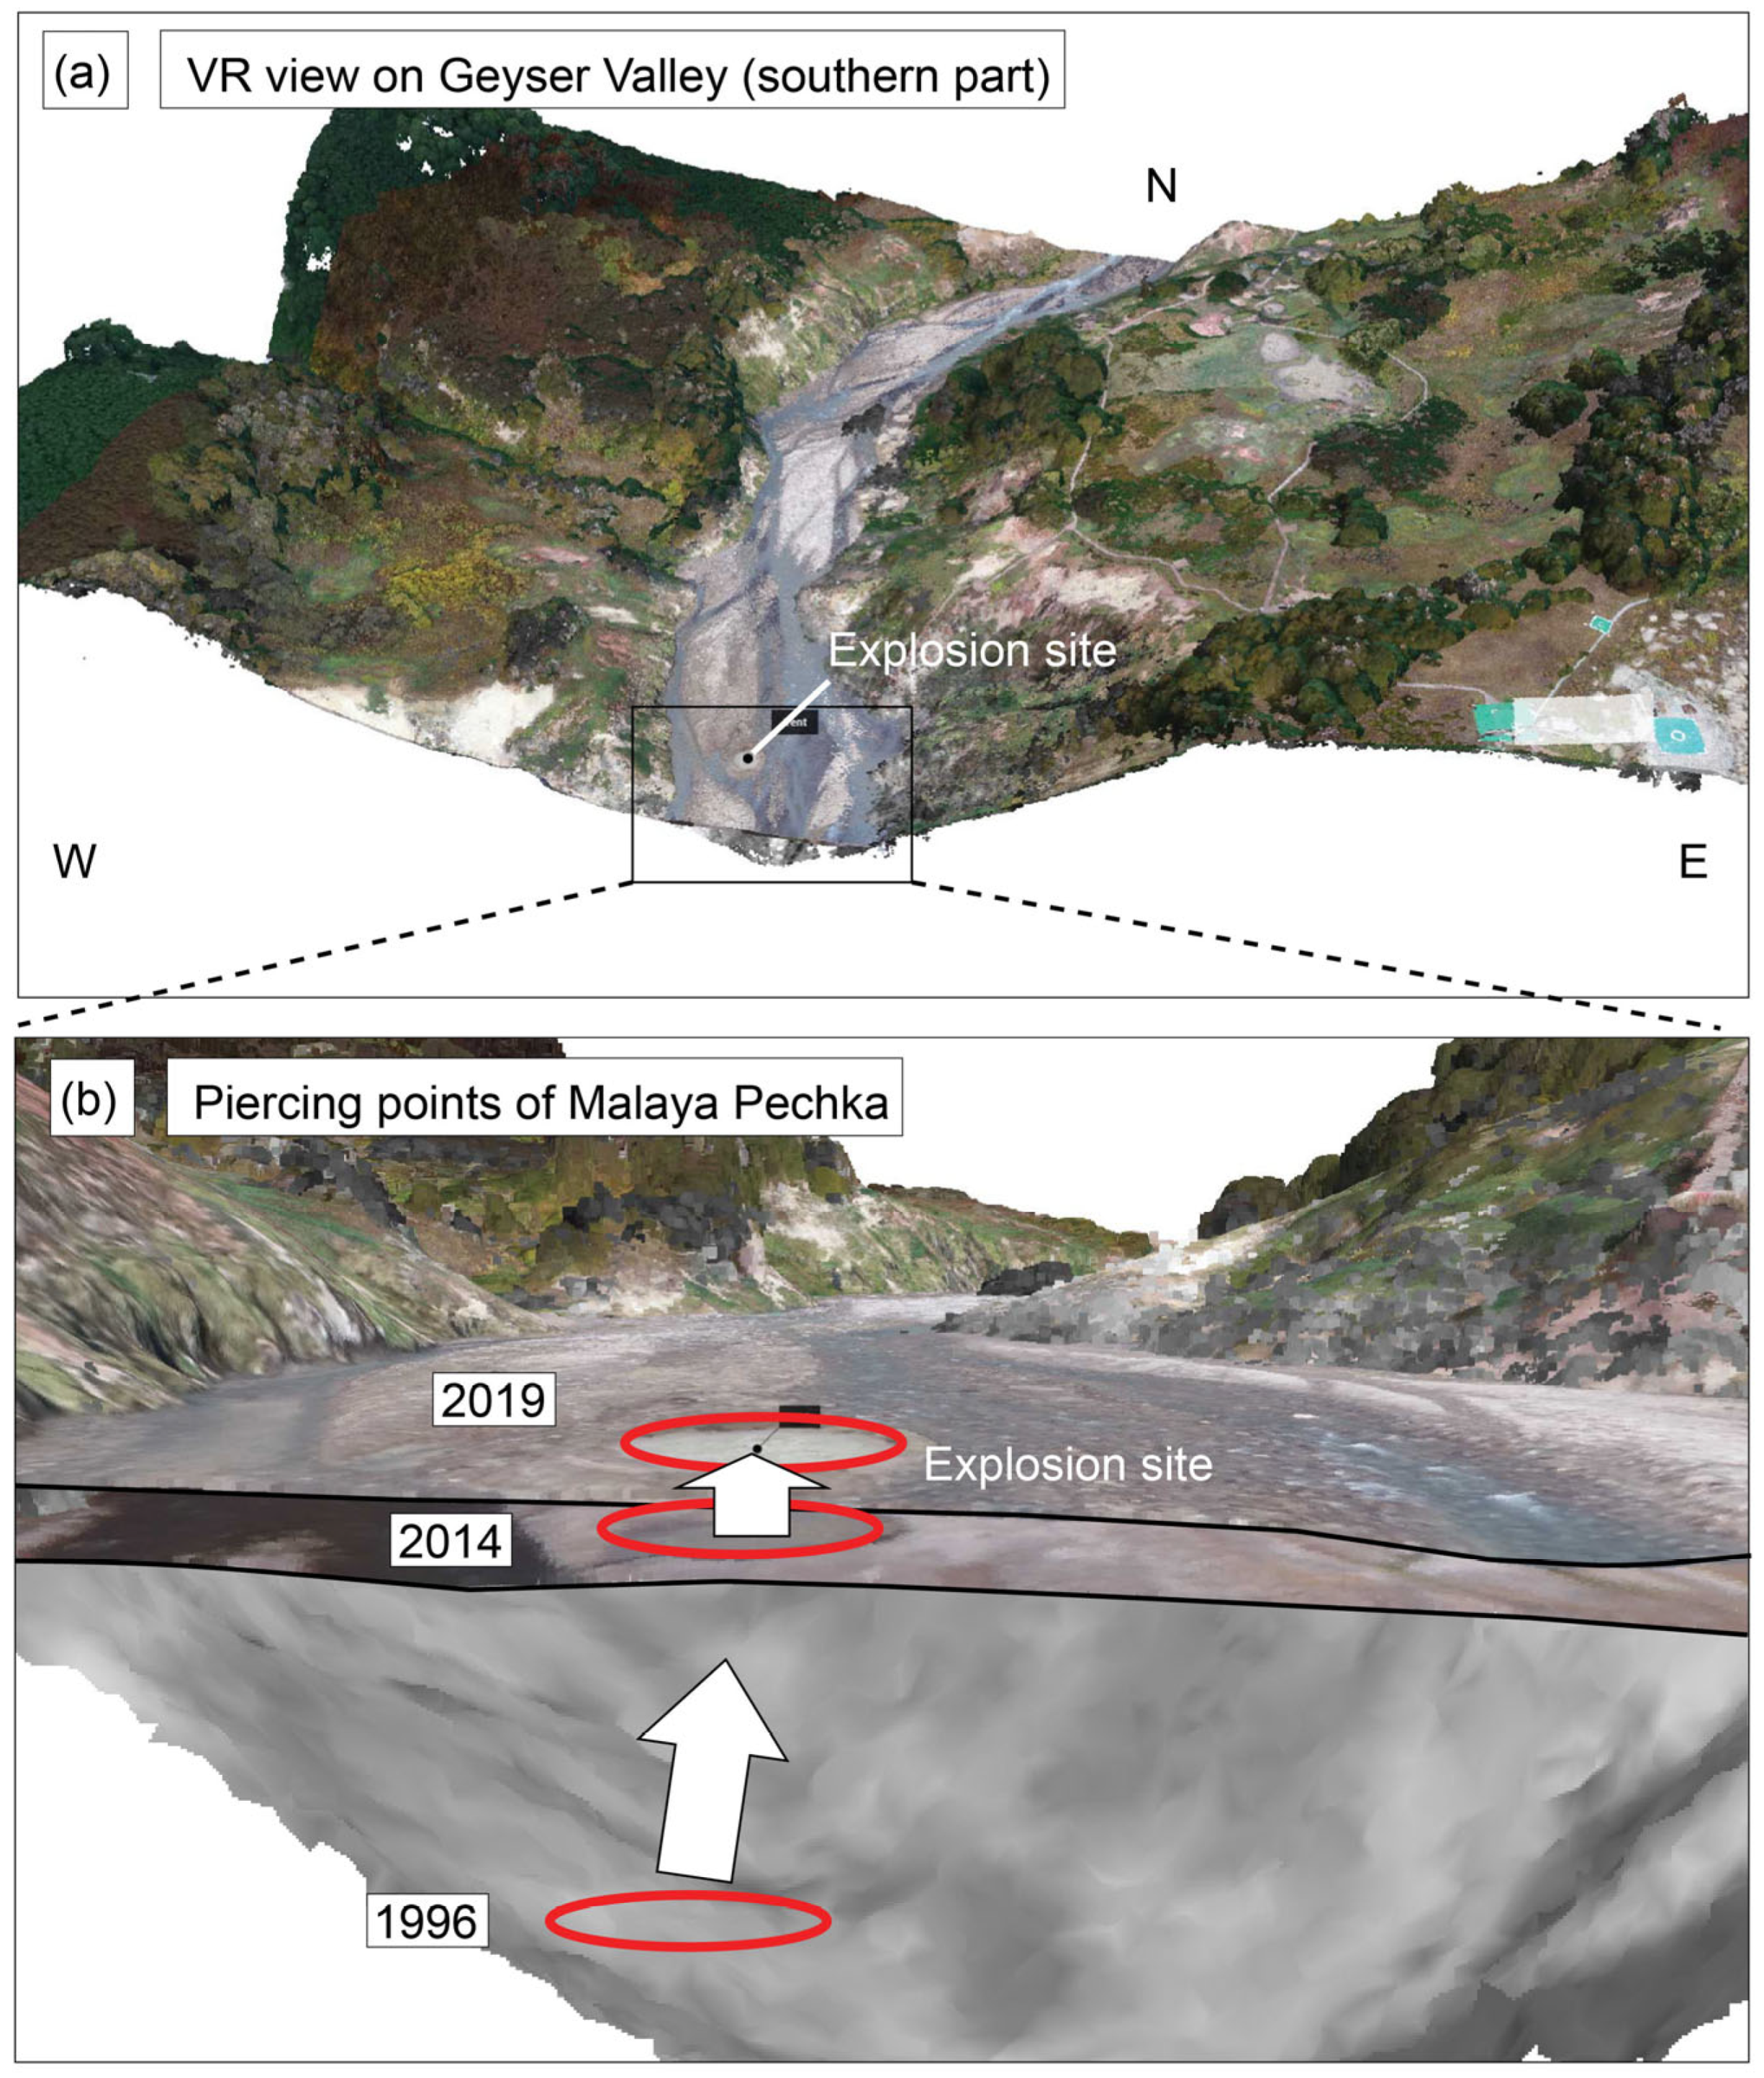
A view of the explosion site is shown in
Figure 5. Images before and after comparison shows that the water level has changed; in 2019 the explosion site is located in an area that was submerged a year earlier. The crater is elliptical in shape, with a north-south orientation (aspect ratio 1.3) and steeper slopes to the northeast and gentler slopes to the southwest. The optical image reveals an aureole of material deposition, with granular angular blocks disturbing the otherwise smooth riverbed appearance. Thermal maps show that the water surface of the explosion vent is close to boiling temperature, with steeper thermal gradients to the east and gentler gradients to the west. To the south and west the water probably drains into the river.
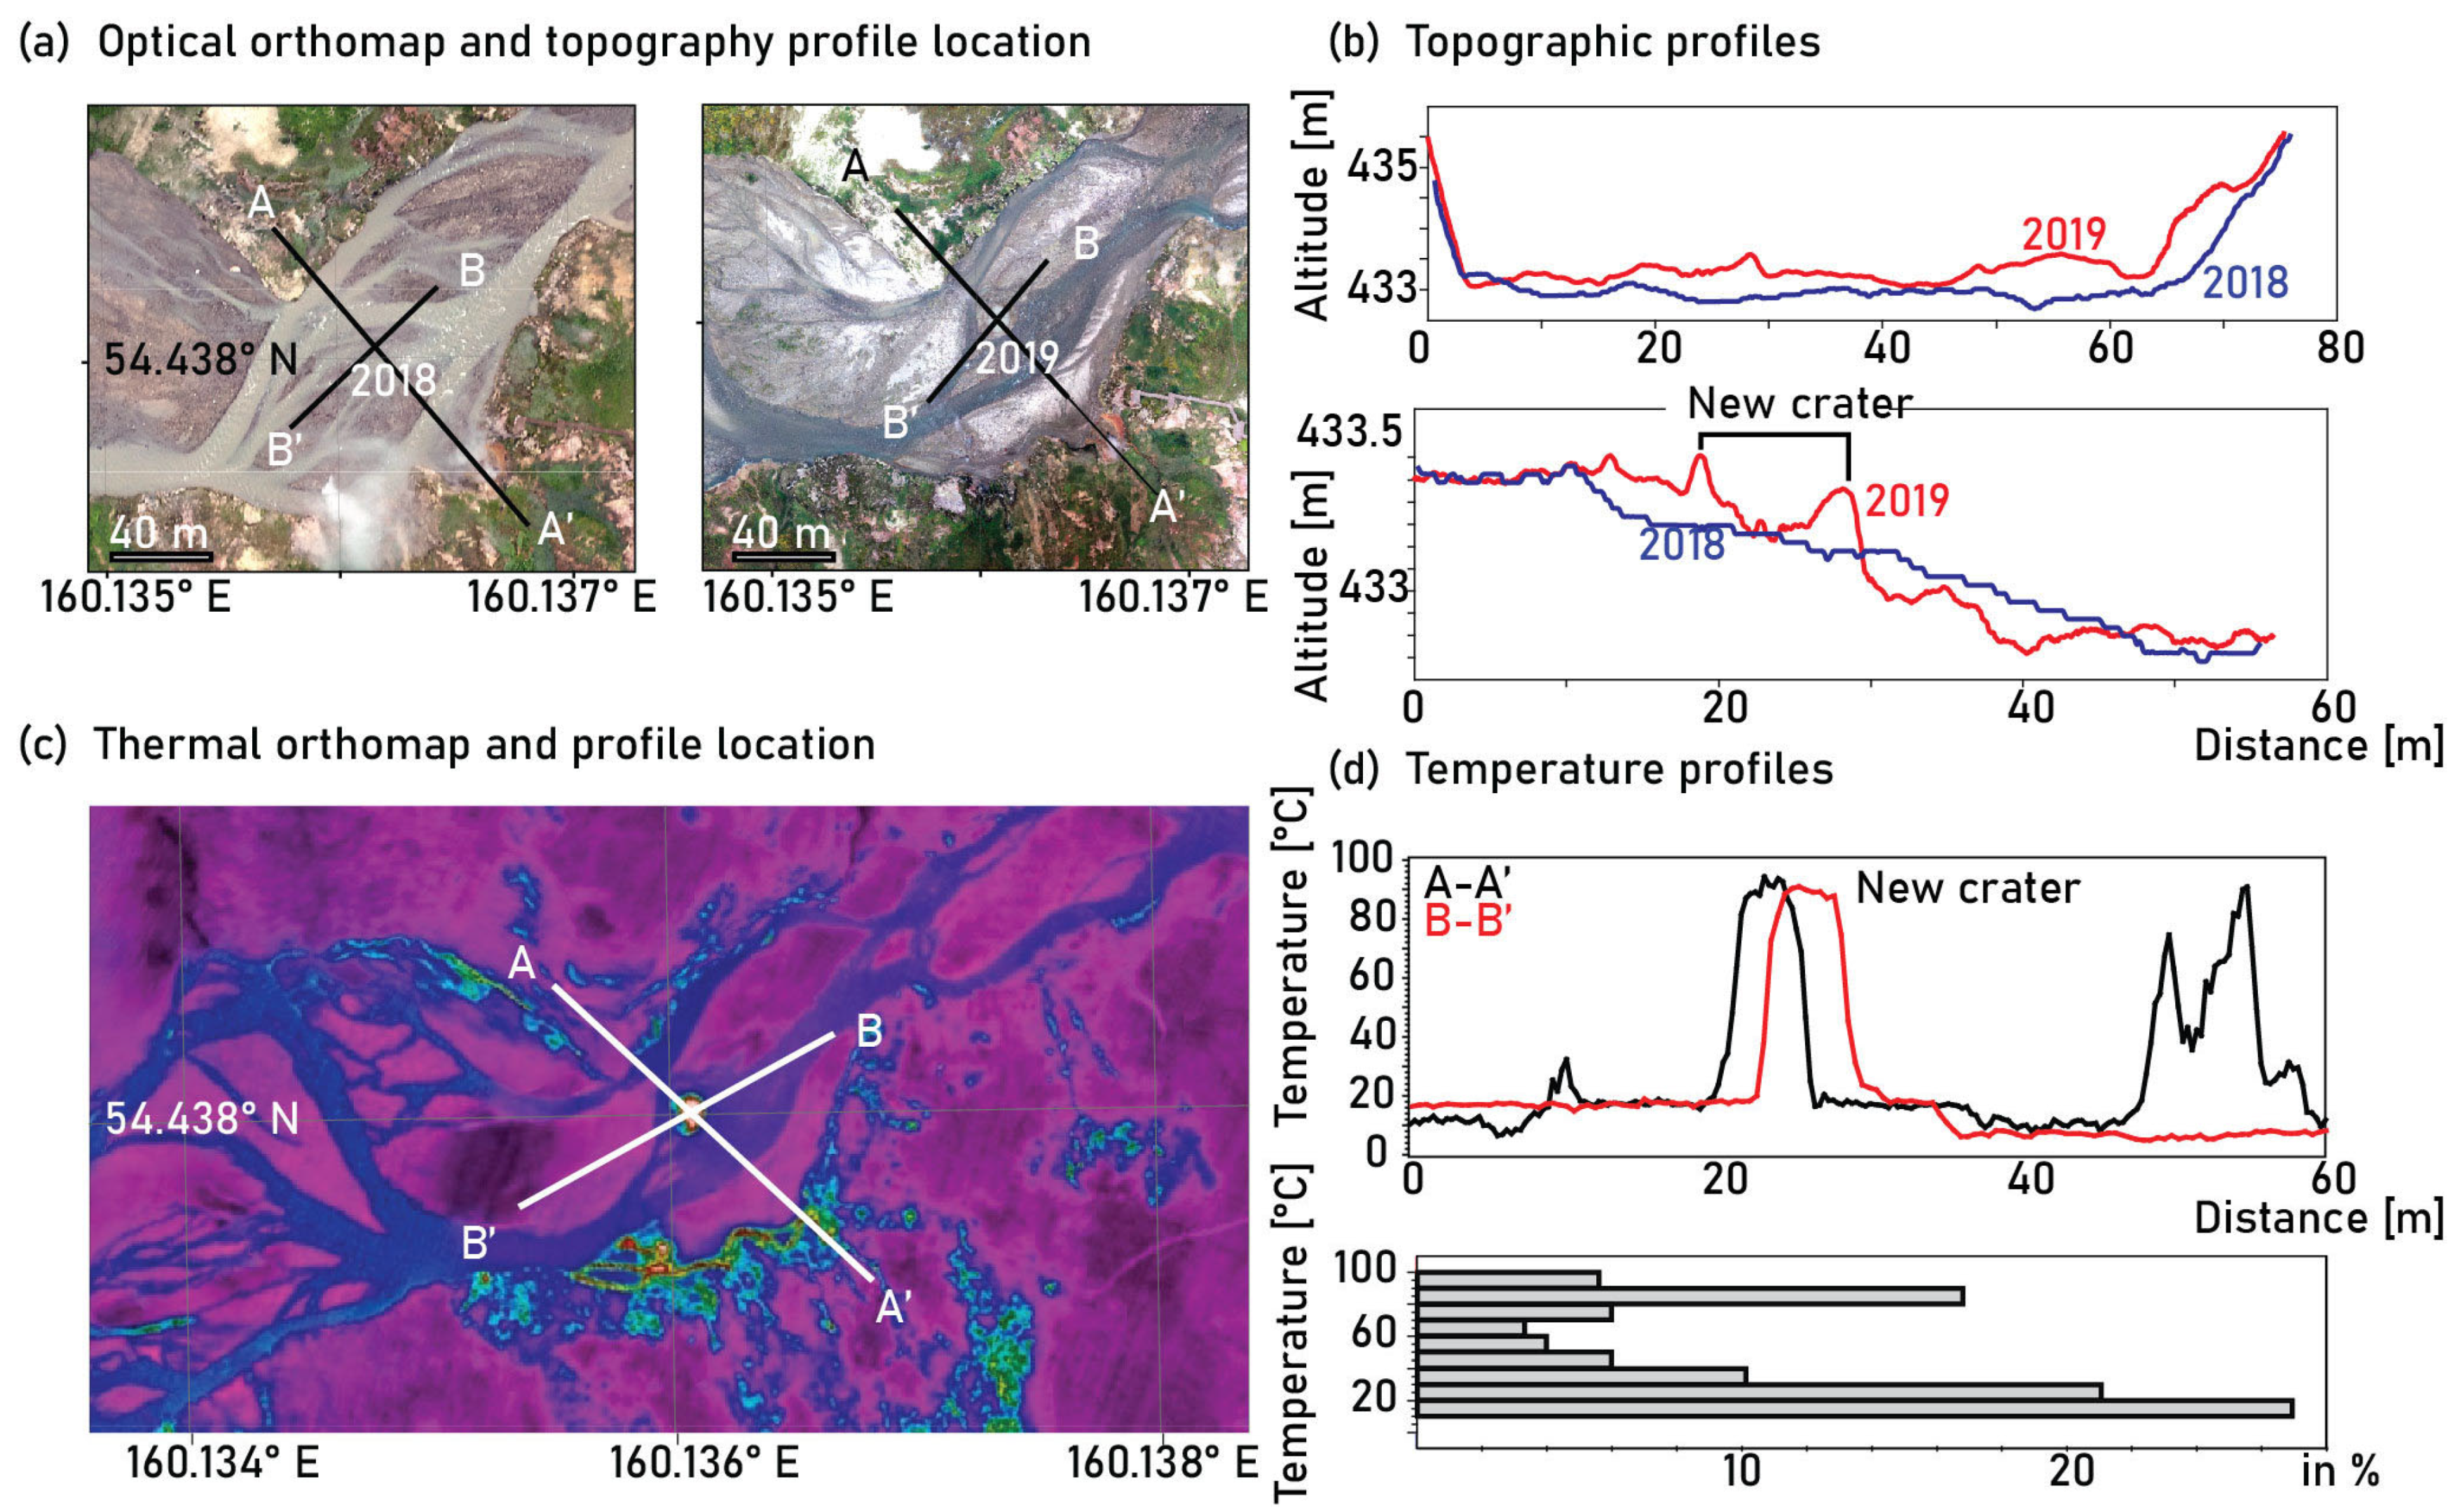
We also constructed digital elevation models from the two drone surveys, which allow comparison of the topography before and after the explosion (
Figure 6). The digital elevation models constructed from the 2018 and 2019 datasets have a resolution of 21 and 10 cm, respectively. Profiles along the NW-SE traverse (A-A′ in
Figure 6a) and along the NE-SW traverse (B-B′ in
Figure 6a) illustrate the general accumulation of new material in the section, averaging 0.4 m in section A-A′. However, the crater is not expressed in the 2018 profile. At the 2019 image the strongest morphology is seen on the NE and SW crater rims, as shown in section B-B′, with pronounced crater rim crests on either side, but little material loss in the crater centre. The minimal material loss in the centre of the crater is probably due to the water level, as this is the lowest possible elevation identified by the photogrammetric technique (
Figure 6b). Comparison of the profiles (
Figure 6c) with the isotherms (
Figure 6d) shows an almost constant thermal expression within the water-filled crater, suggesting a well-mixed convection system at ~96 °C. These data also show that the thermal spots located at the southern-eastern edge of the valley (Bolshoy geyser to the south) reach a temperature brightness of almost the same at ~95 °C. Most of the selected thermal pixels along the A-A’ profile show a temperature brightness at 16–20 °C (background temperature), but a clear spike is seen at 85 °C (
Figure 6d).
Finally, we re-examined the ground-based field photographs, which provided a better understanding of the causes of the high thermal contrasts seen in the nadir drone data. A field image taken from the excavated rim of the explosion crater shows a highly stratified sedimentary sequence, with brownish to dark greyish layers at the centimetre and decimetre scales (
Figure 7a). To better visualise these subtle colour contrasts, we performed the PCA in
Figure 7b, which shows a sharp transition between the layers and local near-surface fractures. This PCA view can be compared to a handheld FLIR thermal infrared image, showing that the mid-grey layer is the one with high brightness temperatures (in fact, close to boiling), while the brownish layers are quite cold. This is further highlighted in the temperature profiles which show the thermally constricted anomalies, suggesting a strong lithological control on the boiling water reservoirs. It can be speculated that the sealing of these boiling water reservoirs, together with the unloading and temperature rise, may culminate in a geothermal explosion, as discussed below.
A profile of the topographic data shows the extent of sedimentation and burial (
Figure 8). A comparison of the explosion site with earlier topographic data suggests that the explosion site was previously a thermal pool, first covered by a lake and later by up to 20 m of clastic sediment (re)deposited by the river system. The depth of the lake and the height of the clastic sediment are approximately the same, so the outlines of the lake and the sedimentary cover (
Figure 3) on the map are comparable. Geothermal fluids now flow through this 20 m thick sedimentary cover.
4. Discussion
This study describes the use of remote sensing photogrammetric data to analyse the location and geometry of a new geothermal explosion crater in the Geyser Valley, Kamchatka. Using the archives of helicopter aerial and satellite data, as well as new drone-based photogrammetric data, we were able to create a database to study the morphological changes, dimensions, and temperature contrasts associated with this crater. By comparing the drone data with the database of airborne photographs taken over 20 years ago, we found that the site of this geothermal explosion was in fact the location of previous thermal vents called Malaya Pechka. Landslides, river damming, a temporary lake over 20 m deep [
24], and intensive sedimentation by mudflows covered this vent for over a decade, and it propagated upward and is now uncovered again, with important implications for geothermal explosion hazards in general, as discussed below.
4.1. Proximity of the Explosion to Tourists
Geysers are well-constrained geothermal sites that periodically erupt water fountains of similar height and dynamics [
34], and typically emit only non-destructive water/gas eruptions. Occasionally, however, steam-driven explosions can occur, releasing a fluid overpressure that can become hazardous if the pressure release becomes sealed or the pathways change. Explosions of geothermal reservoirs have caused major devastation at geothermal sites around the world, such as in the Norris Geyser Basin in Yellowstone National Park in 1989, when Porkchop Geyser exploded, leaving a crater and apron of rock debris 5 m high [
35]. Other explosions occurred in the 1880s and 1890s, when the Excelsior Geyser in the Midway Geyser ejected large blocks up to 15 m [
35]. There is no evidence of frequent large explosions in the Geyser Valley of Kamchatka, possibly due to the absence of visitors during the winter months. The new explosion site is only 25 m from the well-known Bolshoy geyser, which is currently the largest geyser in the Geyser Valley [
20]. It is close to hiking trails and within 250 m of the helicopter platform and campsites. This explosion site was just a small thermal spot surrounded by several boiling springs, but in 2007 it was covered by a thick layer of debris. After 12 years, a geothermal explosion occurred and a thermal spot appeared in its place.
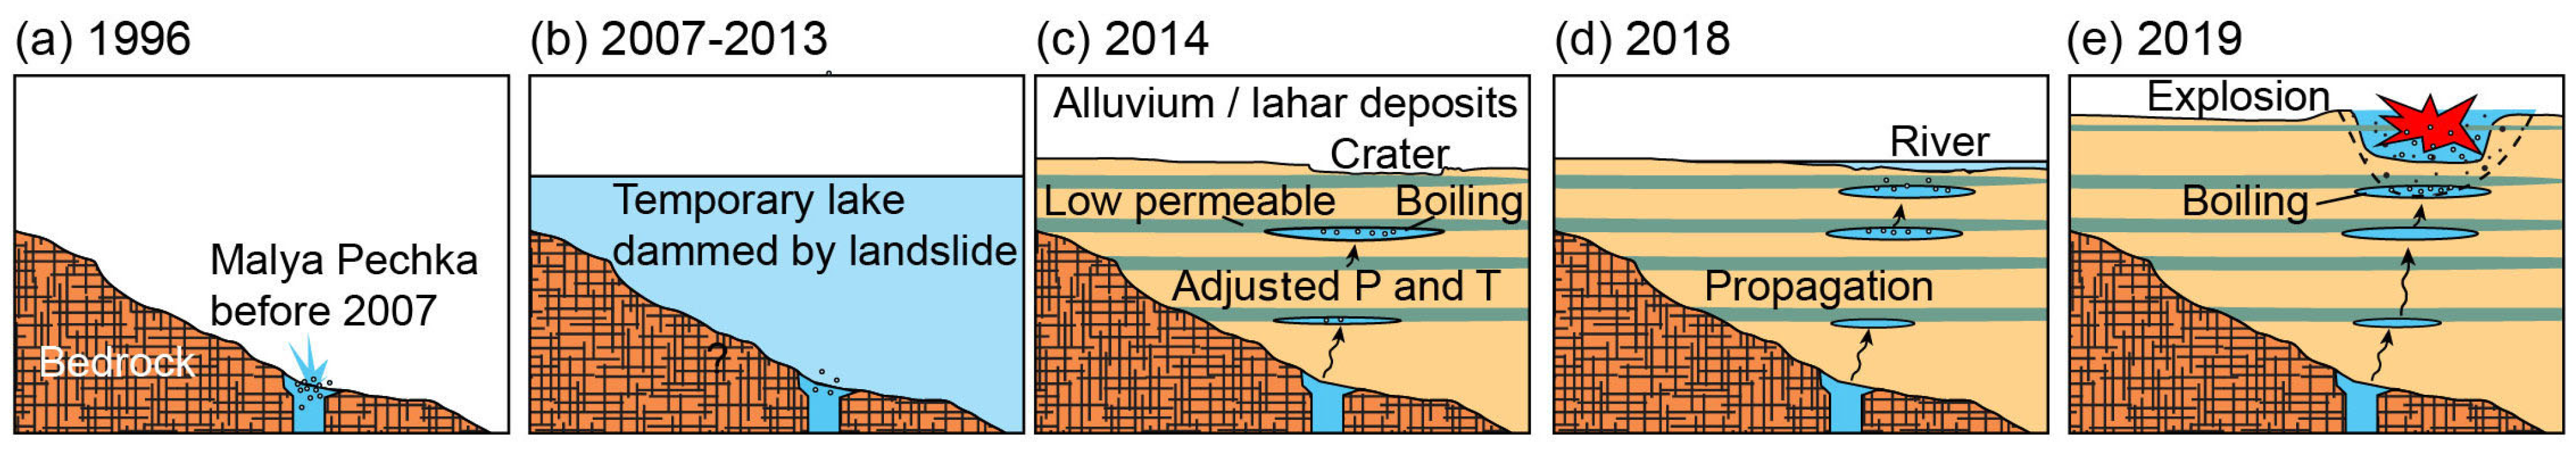
4.2. Temporal Evolution and Conceptual Model
Based on the observations made and presented in this paper, we developed a conceptual model summarised in
Figure 9. In 1996, the Malaya Pechka was a small site of periodic fluid discharge in a steep V-shaped river valley (
Figure 9a). It produced a series of small outflows of boiling water and steam. After the large landslide in 2007, the geyser site was hidden under a temporary lake at a depth of about 10 m (
Figure 9b). In 2014, the rapid erosion of the dam began and the valley became a major sediment accumulation site during periods of intense rainfall and snowmelt. Correspondingly, the formerly V-shaped valley changed its morphology to develop a flat riverbed composed of alternating coarse and fine-grained fluvially redeposited clastic material up to 20 m thick [
22]. Drone data acquired in 2018 show no evidence of thermal water discharge, and no craters are visible. We speculate that the succession of erosion and accumulation resulted in alternating permeability structures (
Figure 9d). As sedimentary layers accumulated as 20 m-thick deposits on top of the original Malaya Pechka, the vent was deeply buried under an estimated 780 tonnes of gravel and clay (5 m diameter and 20 m high sediment) [
36], equivalent to ~200 kPa hydrostatic pressure or ~400 kPa lithostatic pressure (assuming a bulk density of the sediment of 2000 kg/m
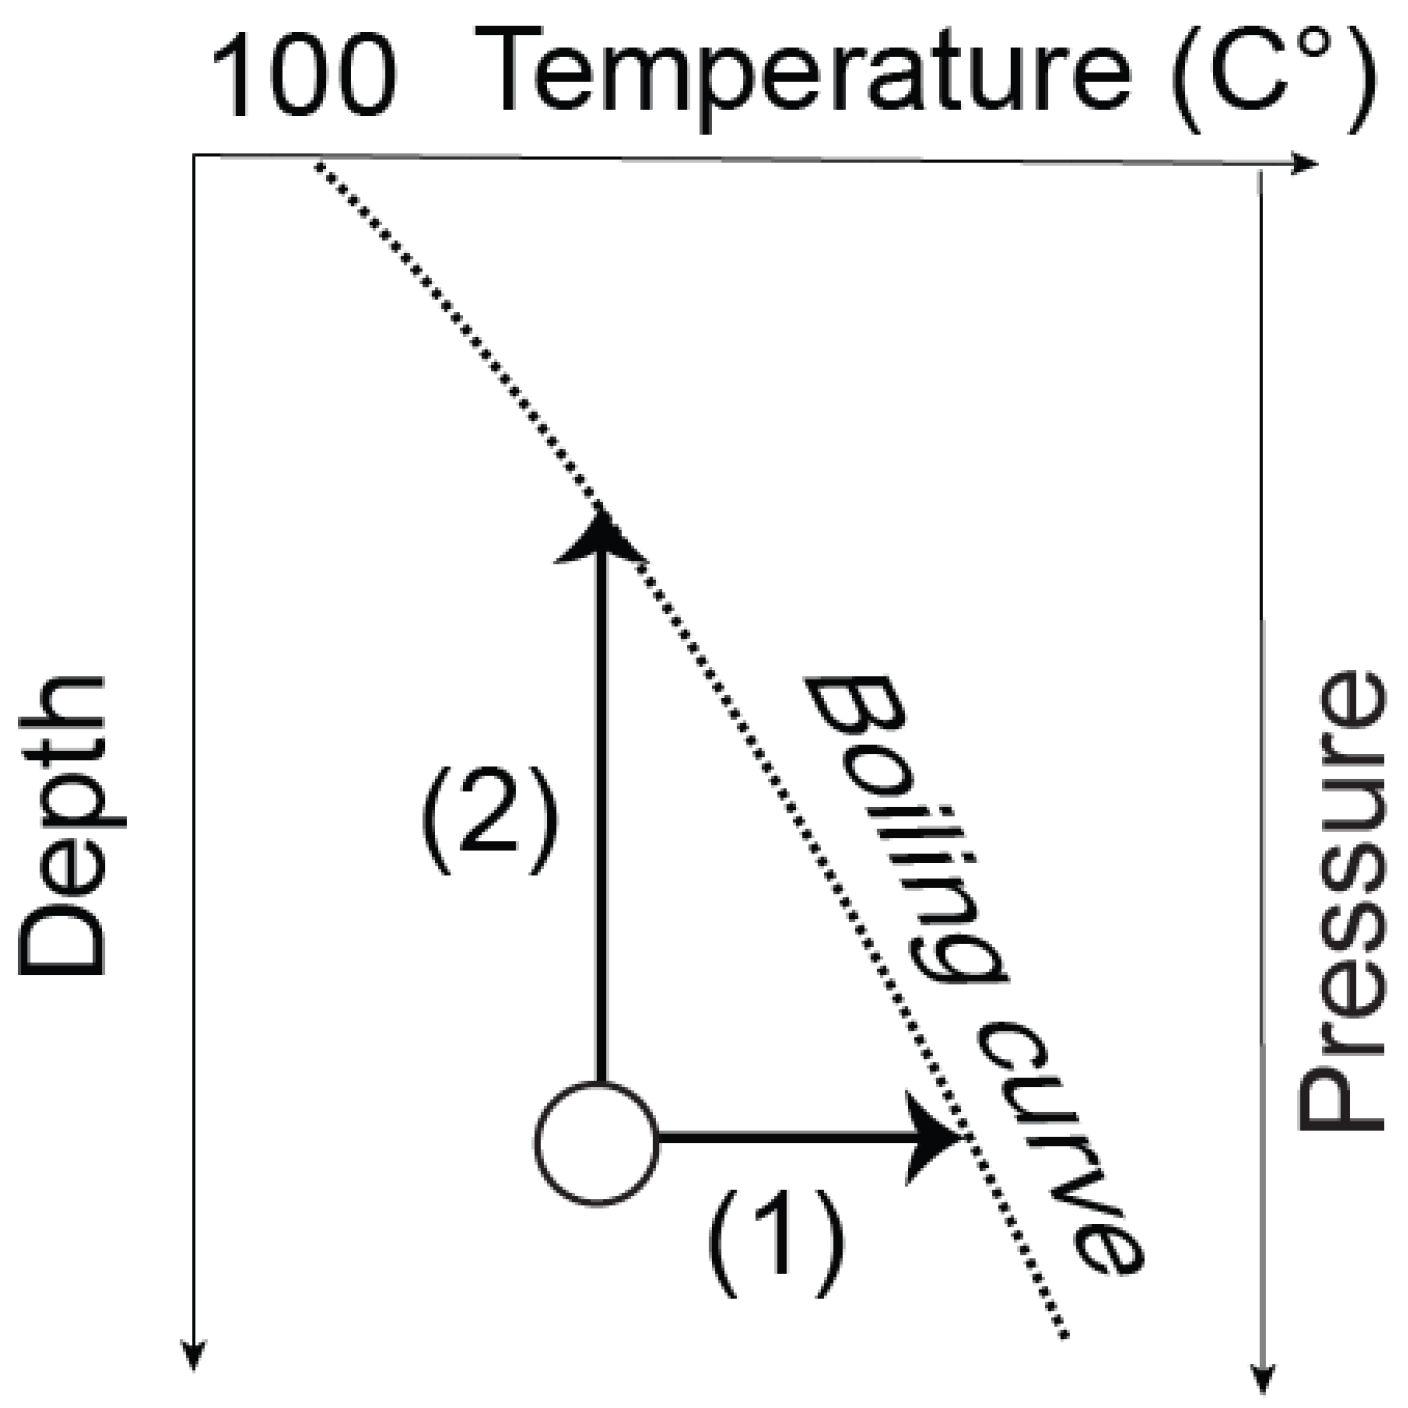
3). Two processes may then have occurred: first, a gradual heating of the covered deposits from below, and/or second, a gradual lowering of the sedimentary cover or groundwater table associated with the gradual erosion of the dam composed of 2014 landslide deposits. Gradual upward heating may occur by conduction or fluid rise through the permeable space in the coarse-grained layers, creating small layers of hot geothermal fluids. If impermeable layers prevent further heat transfer, the water could reach boiling point and an explosion could occur (scenario (1) in
Figure 10). We speculate that a number of new pockets of thermal water have accumulated within the sediment, and the boiling point is re-established at a shallower depth. Alternatively (or in addition), lowering of the overburden may have caused pockets of thermal water to become oversaturated with steam, leading to an explosion (scenario (2) in
Figure 10). The interplay between overburden pressure and heating to the boiling point is therefore critical to understanding how the water reached the boiling point (
Figure 10) and expanded rapidly, triggering the geothermal explosion.
In 2019, we identified the explosion crater, which is surrounded by debris and contains a small thermal lake with steady to episodic bubbling activity in its centre (
Figure 9e). Comparison of the data shows that the location of the explosion crater has shifted slightly towards the centre of the valley, possibly due to the tilted or heterogeneous permeability or fluid pathways of the clastic deposits. Our analysis of the images (using PCA) and comparison of the thermal data shows that permeability and temperature are heterogeneously distributed across discrete sedimentary layers.
Although we have gathered important information, we note that the observations of the geysers in GV are incomplete and mostly limited to a field visit in the summer months and the free visibility from satellites. Nevertheless, we were able to observe the interesting evolution of the new thermal spot. The exact timing of the 2018–2019 Malaya Pechka explosions is unknown, but according to eyewitness reports from local rangers, the explosions occur shortly after snowmelt episodes in spring 2019 and when the water level in the river is low. This knowledge, combined with the hidden presence of older and buried geysers, can be used to define areas of potential explosion hazard.
4.3. Stability of Hot Springs and Geysers
A stable hot spring or geyser may be controlled by the invariant location and geometry of a permeable conduit or fracture system that allows the ascent and transfer of thermal fluids. In addition, the stress field and its variations can affect the stability of geysers. According to our measurements, loading and sedimentation, and erosion and unloading, may have played an effective role in the formation of the explosion crater at a former geyser site, implying its stable position.
The location and stability of hot springs and geysers can also be used to indirectly monitor crustal faults and structures. By studying the location and distribution of hot springs and geysers, it is possible to identify preferred fluid pathways at significant depths and in shallow crustal structures [
6]. In Yellowstone National Park, for example, airborne thermal camera measurements revealed that hot springs are aligned along a north–south structural trend [
37]. Tectonic earthquakes and volcanic unrest can alter such thermal springs [
38], possibly in association with permeability variations in the conduit or fracture system through which the hot waters migrates. Recent studies also suggest that the interaction of the hot fluids with the rocks leads to hydrothermal alteration, which can change strength and reduce permeability [
39]. Closure of permeable pathways can lead to pressure build-up and steam-driven explosions [
39]. Our work in the Geyser Valley suggests that the addition of new (sedimentary) material can also strongly influence the fluid pathways and activity of hot springs or geysers. After the large landslide of 3 June 2007, at least twenty-three thermal spots were buried by sediment, including five well known geysers (Pervenetz, Troinoy, Conus, Maly, and Bolshoy). Almost seven years later, on 3 January 2014, the same eastern flank collapsed again into the Geyser Valley, burying another ten geysers further south [
40]. This has resulted in the burial of a large number of previously permeable zones, leaving us to speculate whether fluid pathways will remain closed or explosively or non-explosivelyagain in the future. As precursory activity, such as increased thermal and fluid flow expressions, may herald explosions, such sites need to be monitored closely.


 ,
, 


