

GIS-Based Assessment of Fire Effects on Flash Flood Hazard: The Case of the Summer 2021 Forest Fires in Greece

 ,
,  ,
, 
 ,
,  ,
,  and
and
Abstract
:1. Introduction
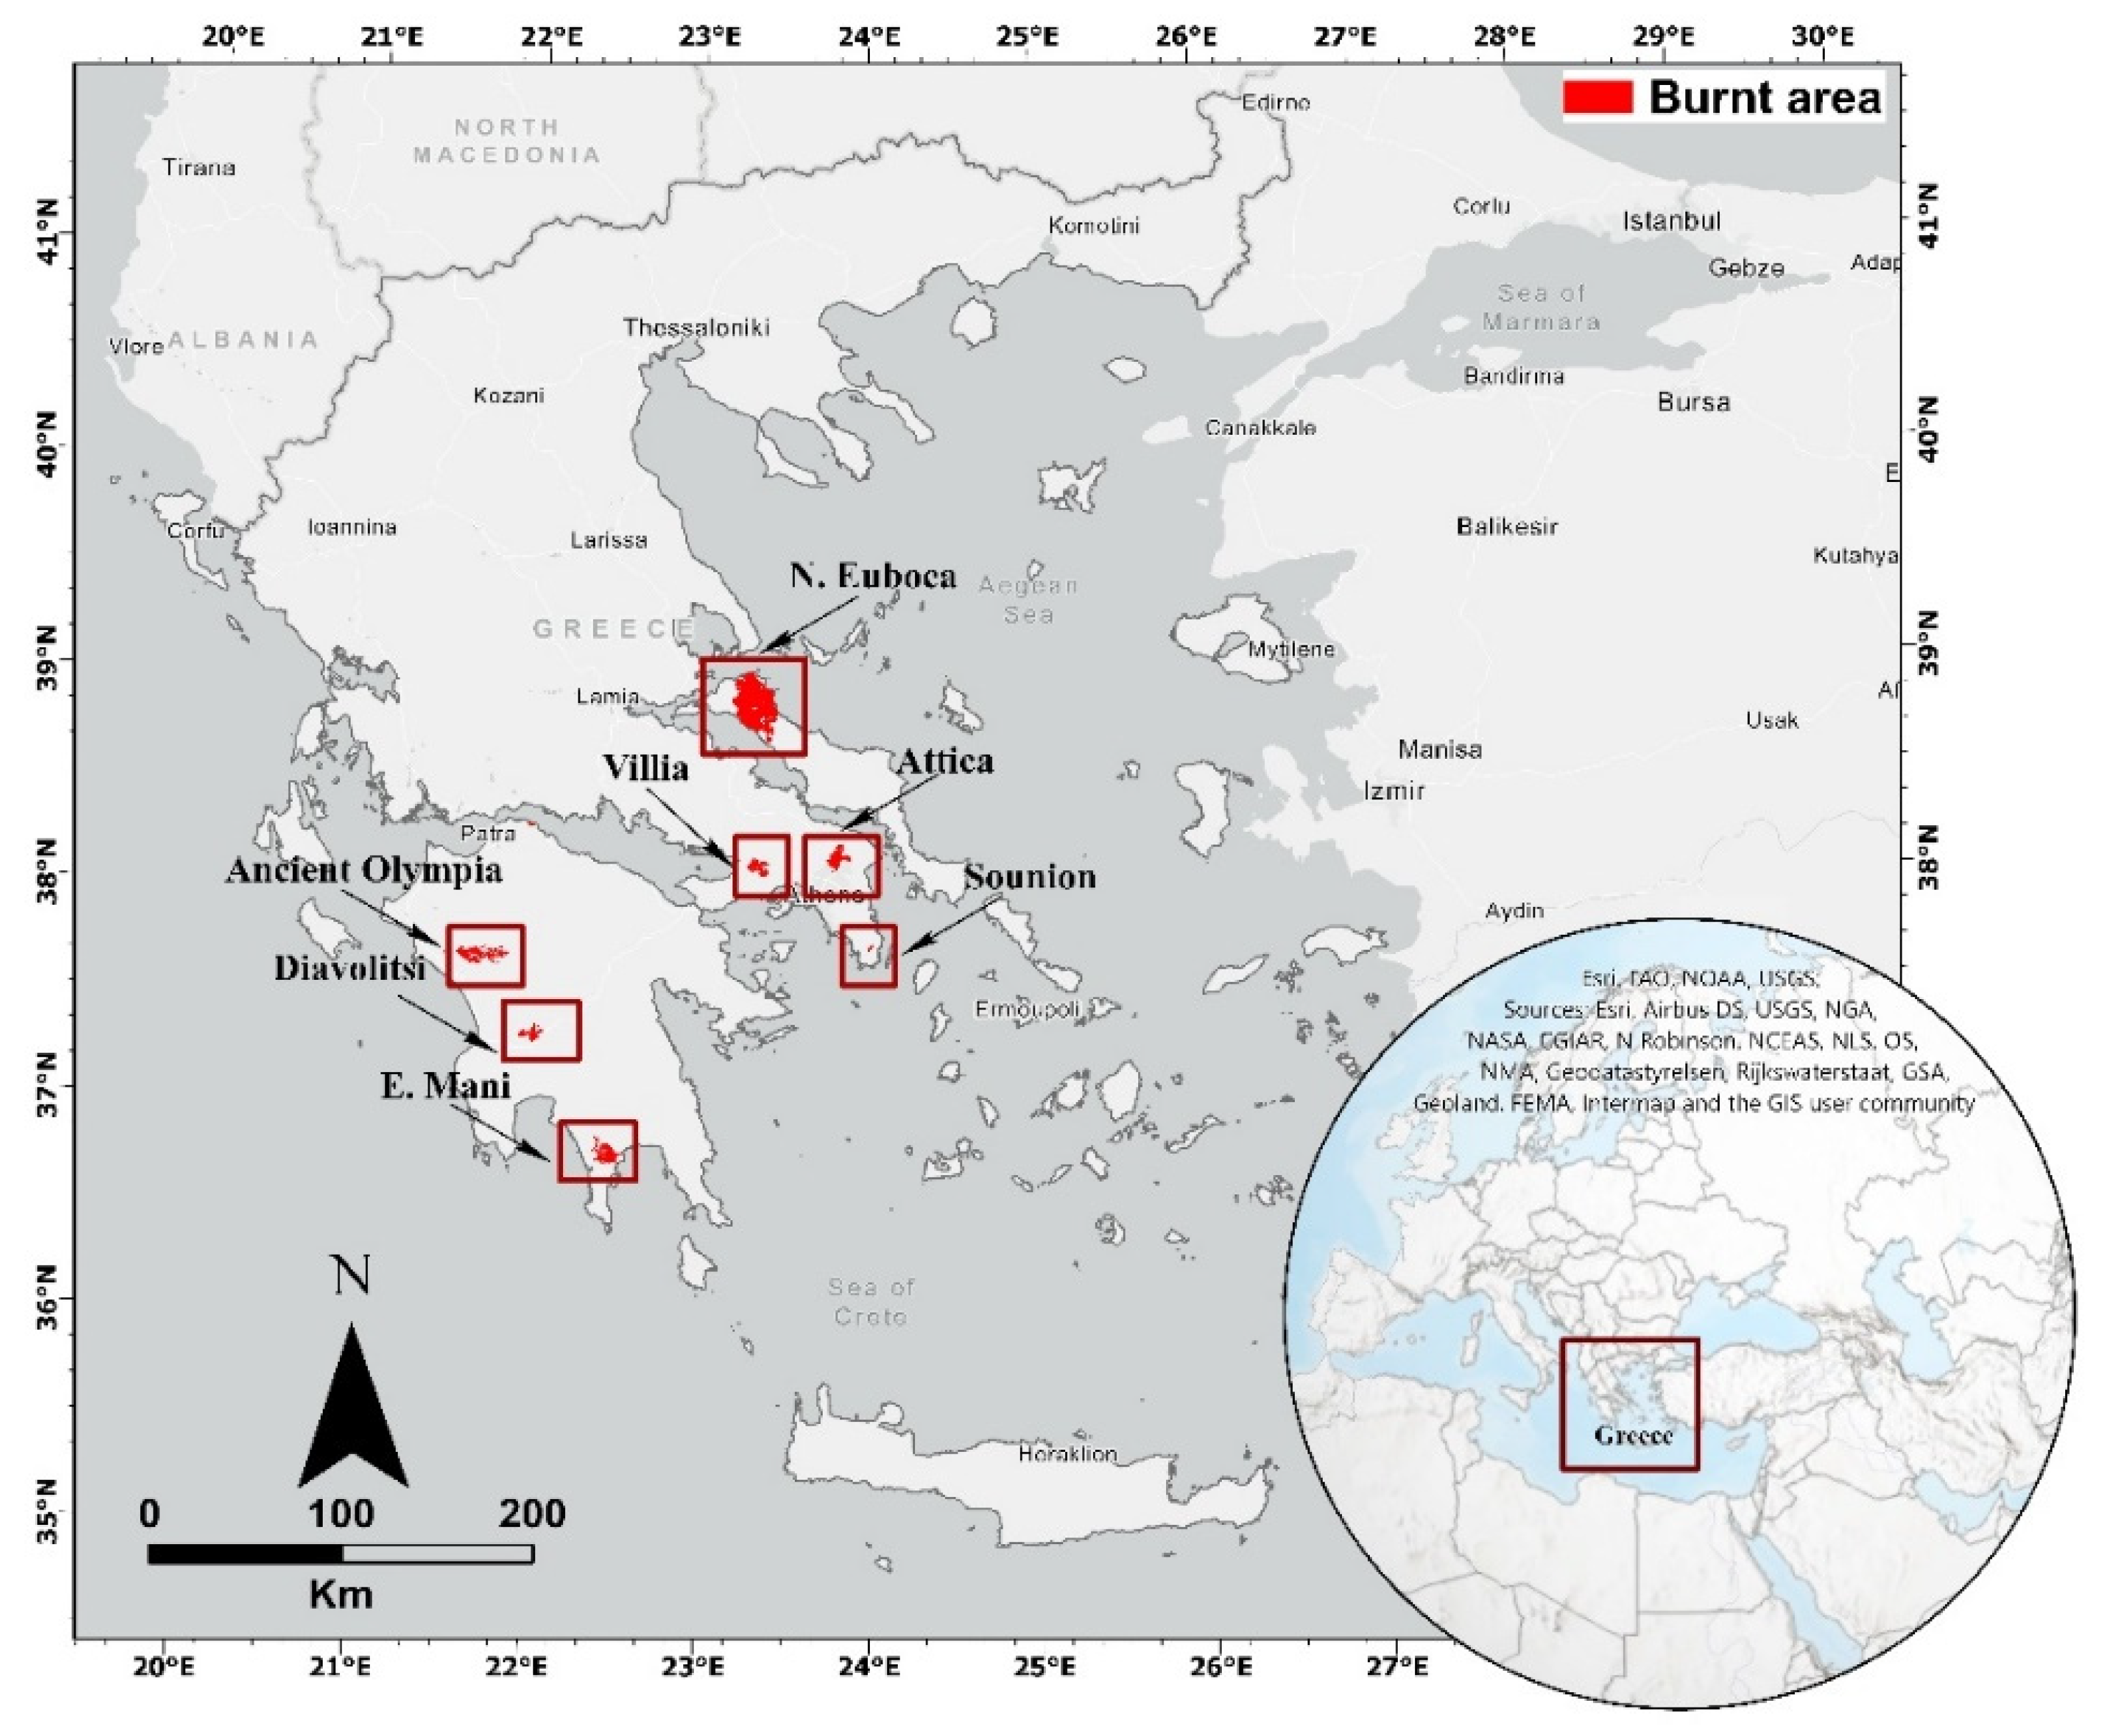
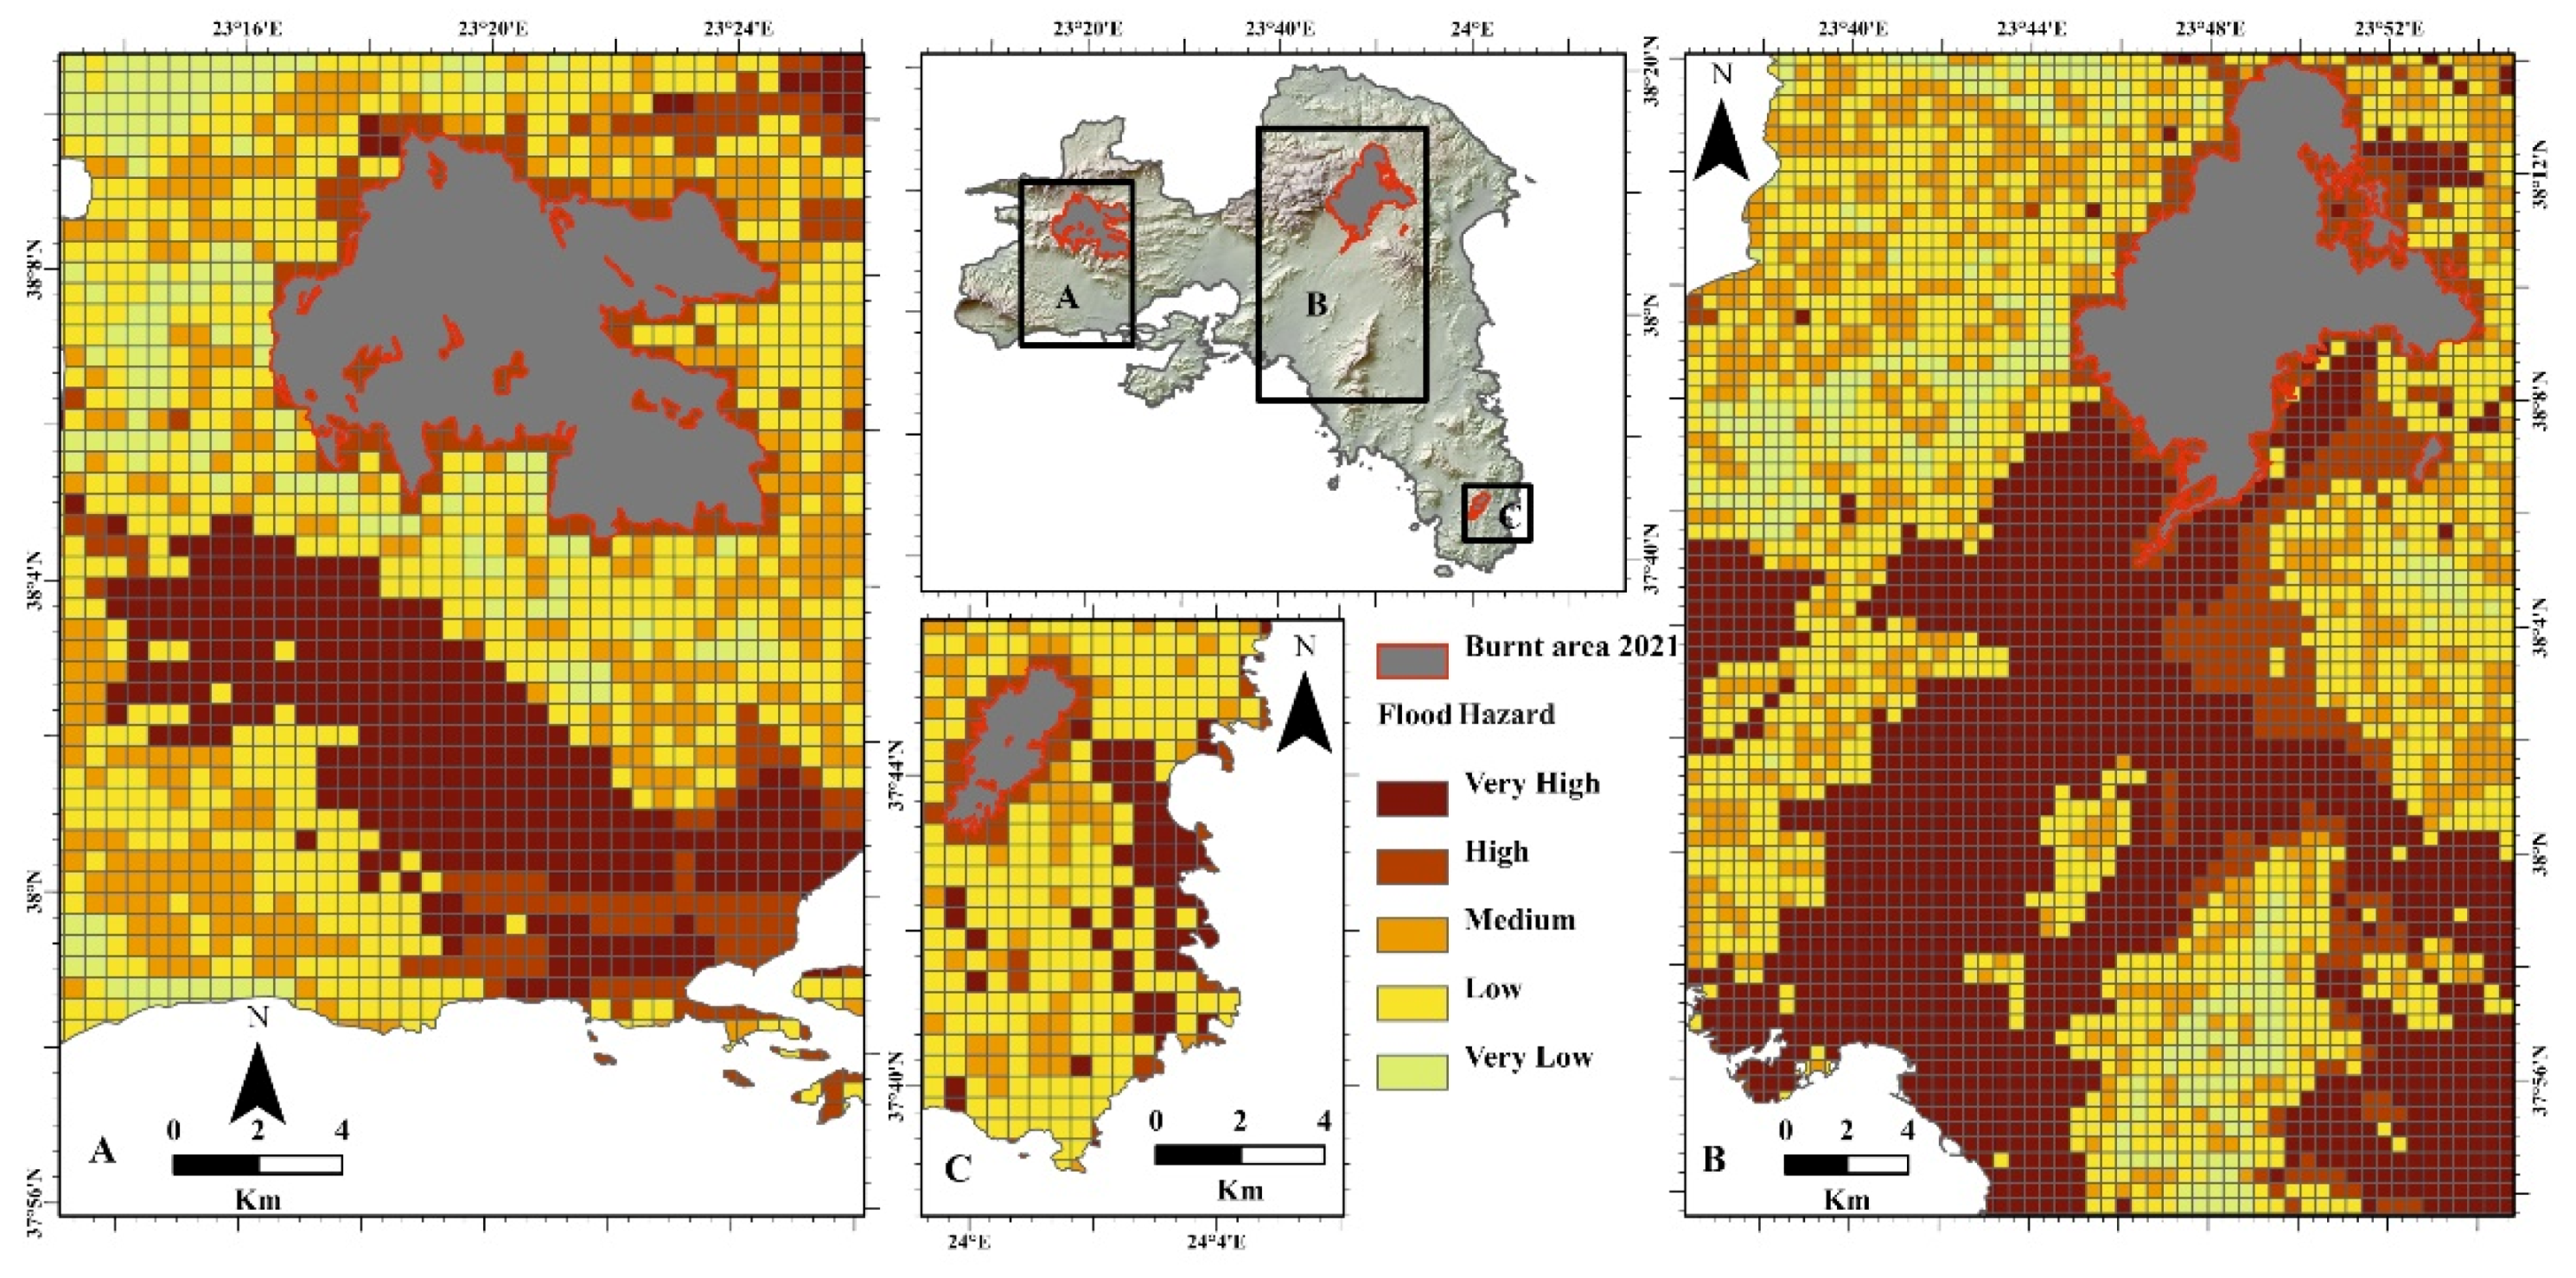
2. Study Areas
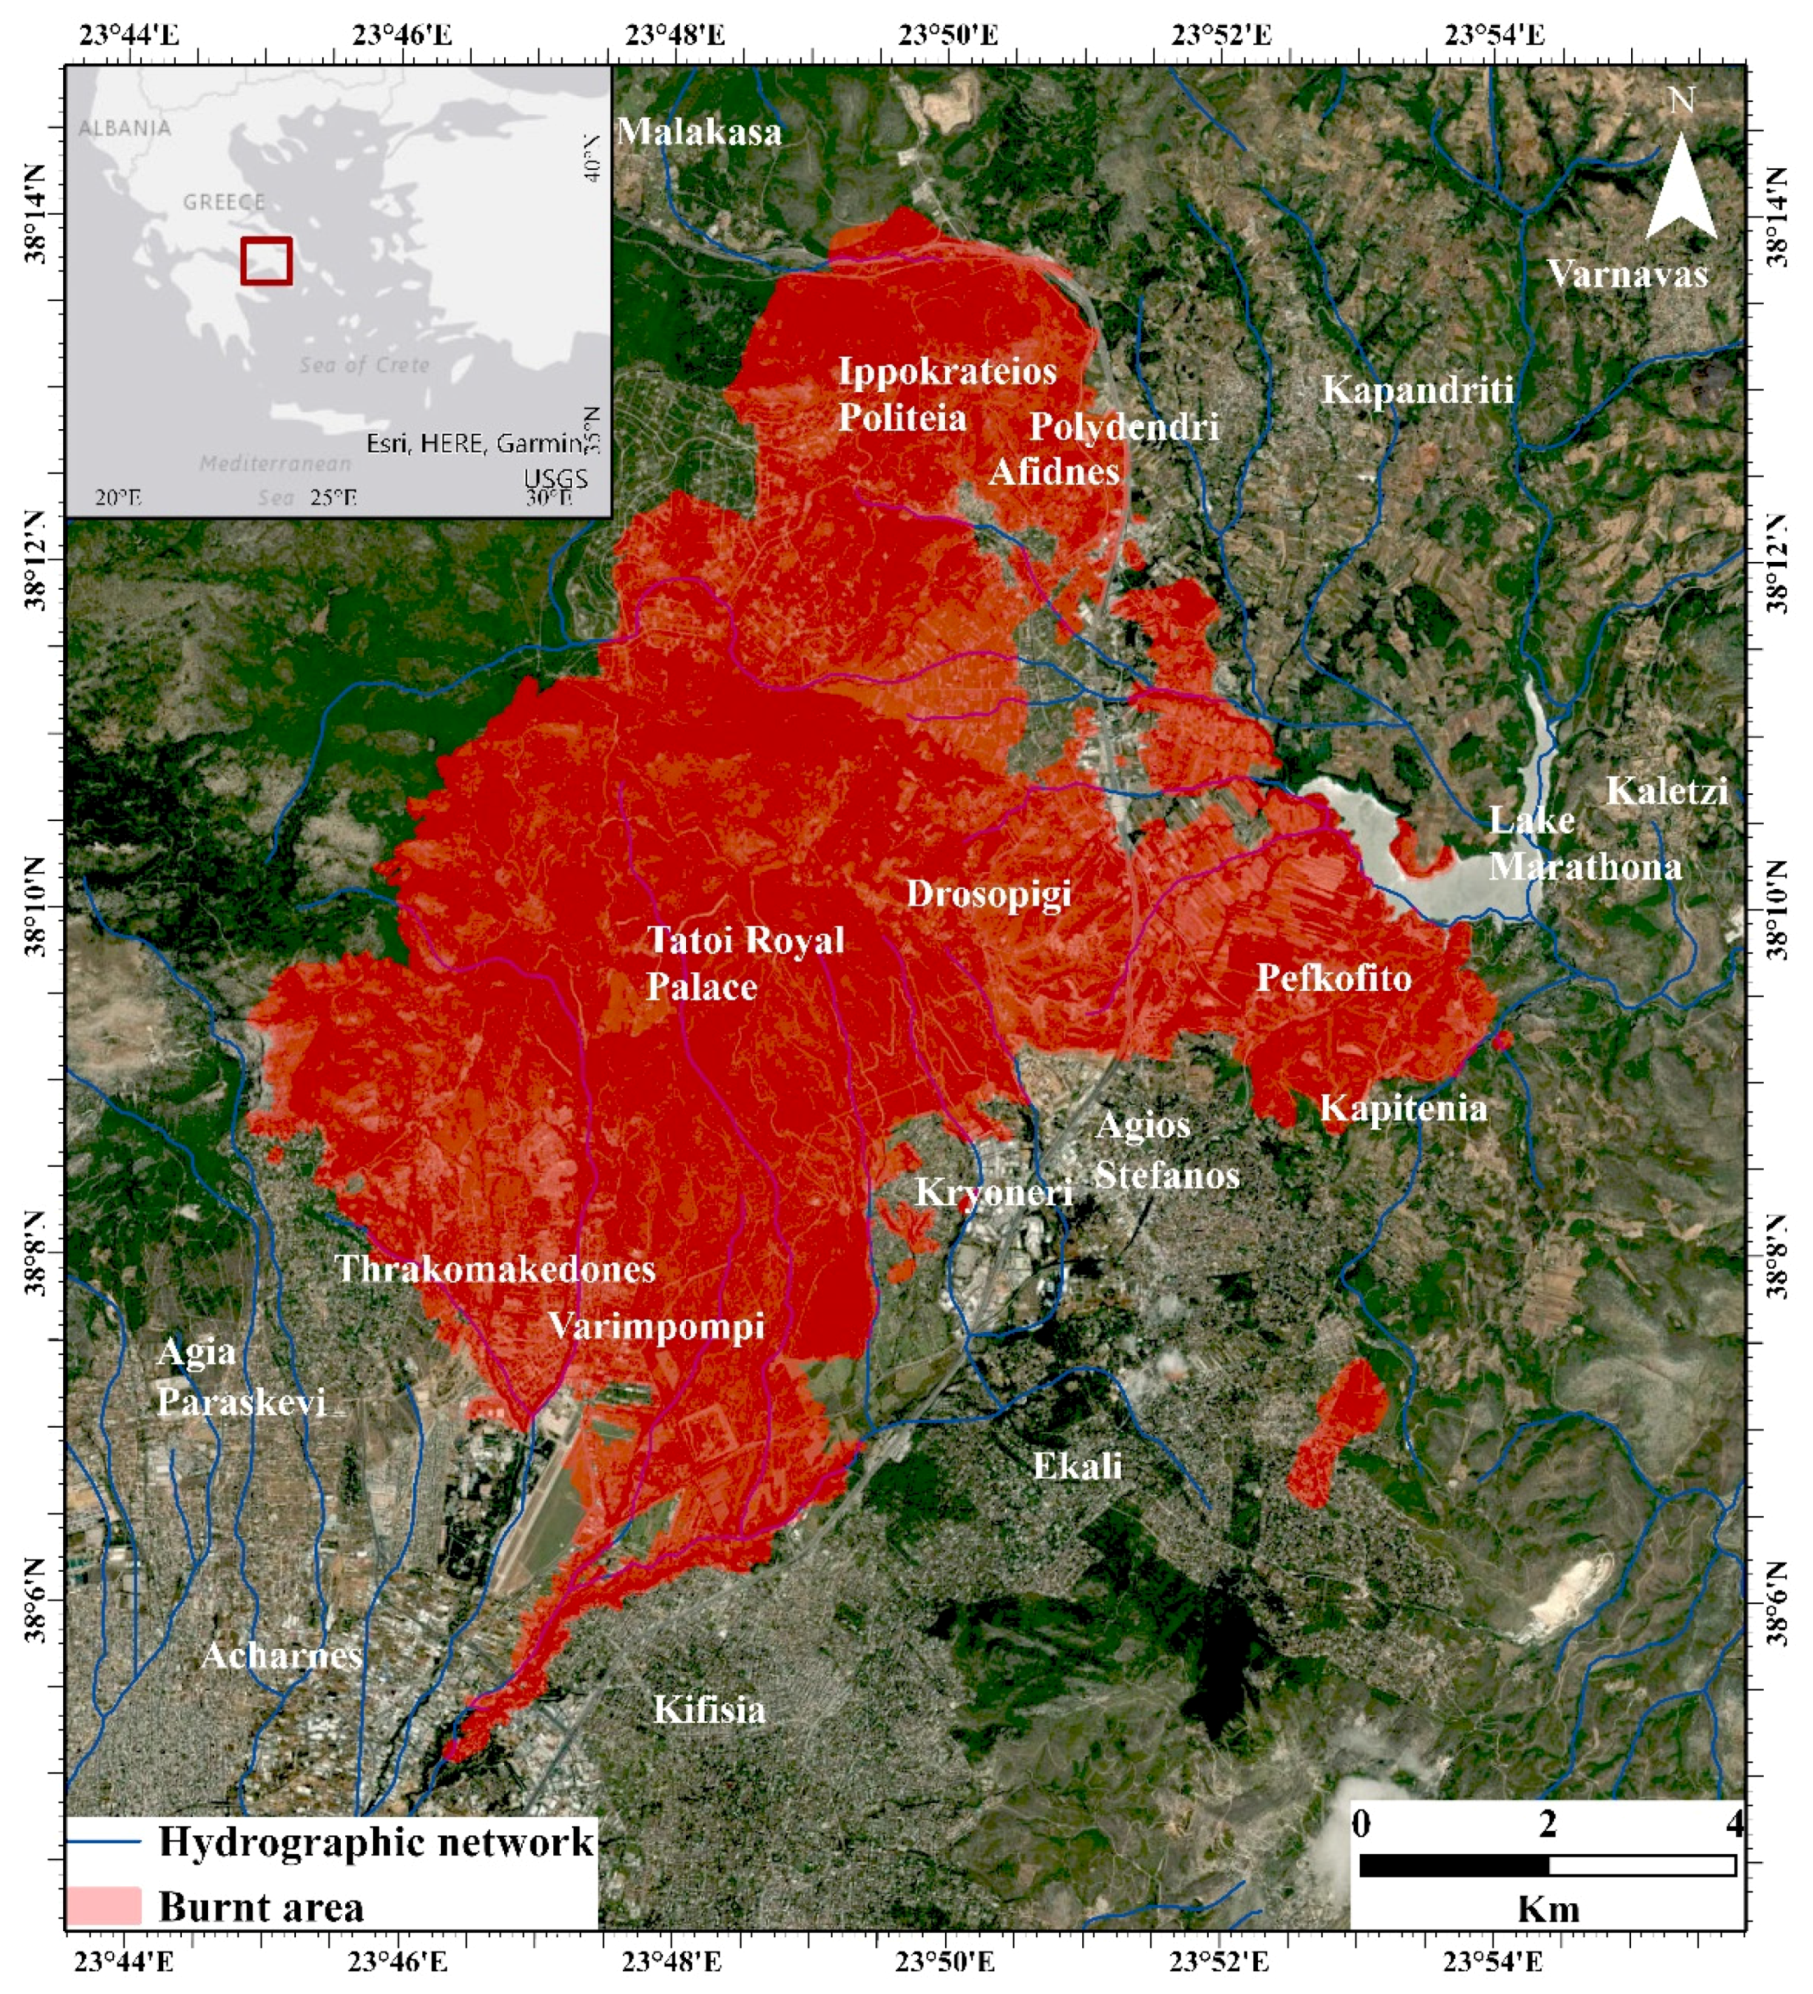
2.1. Attica
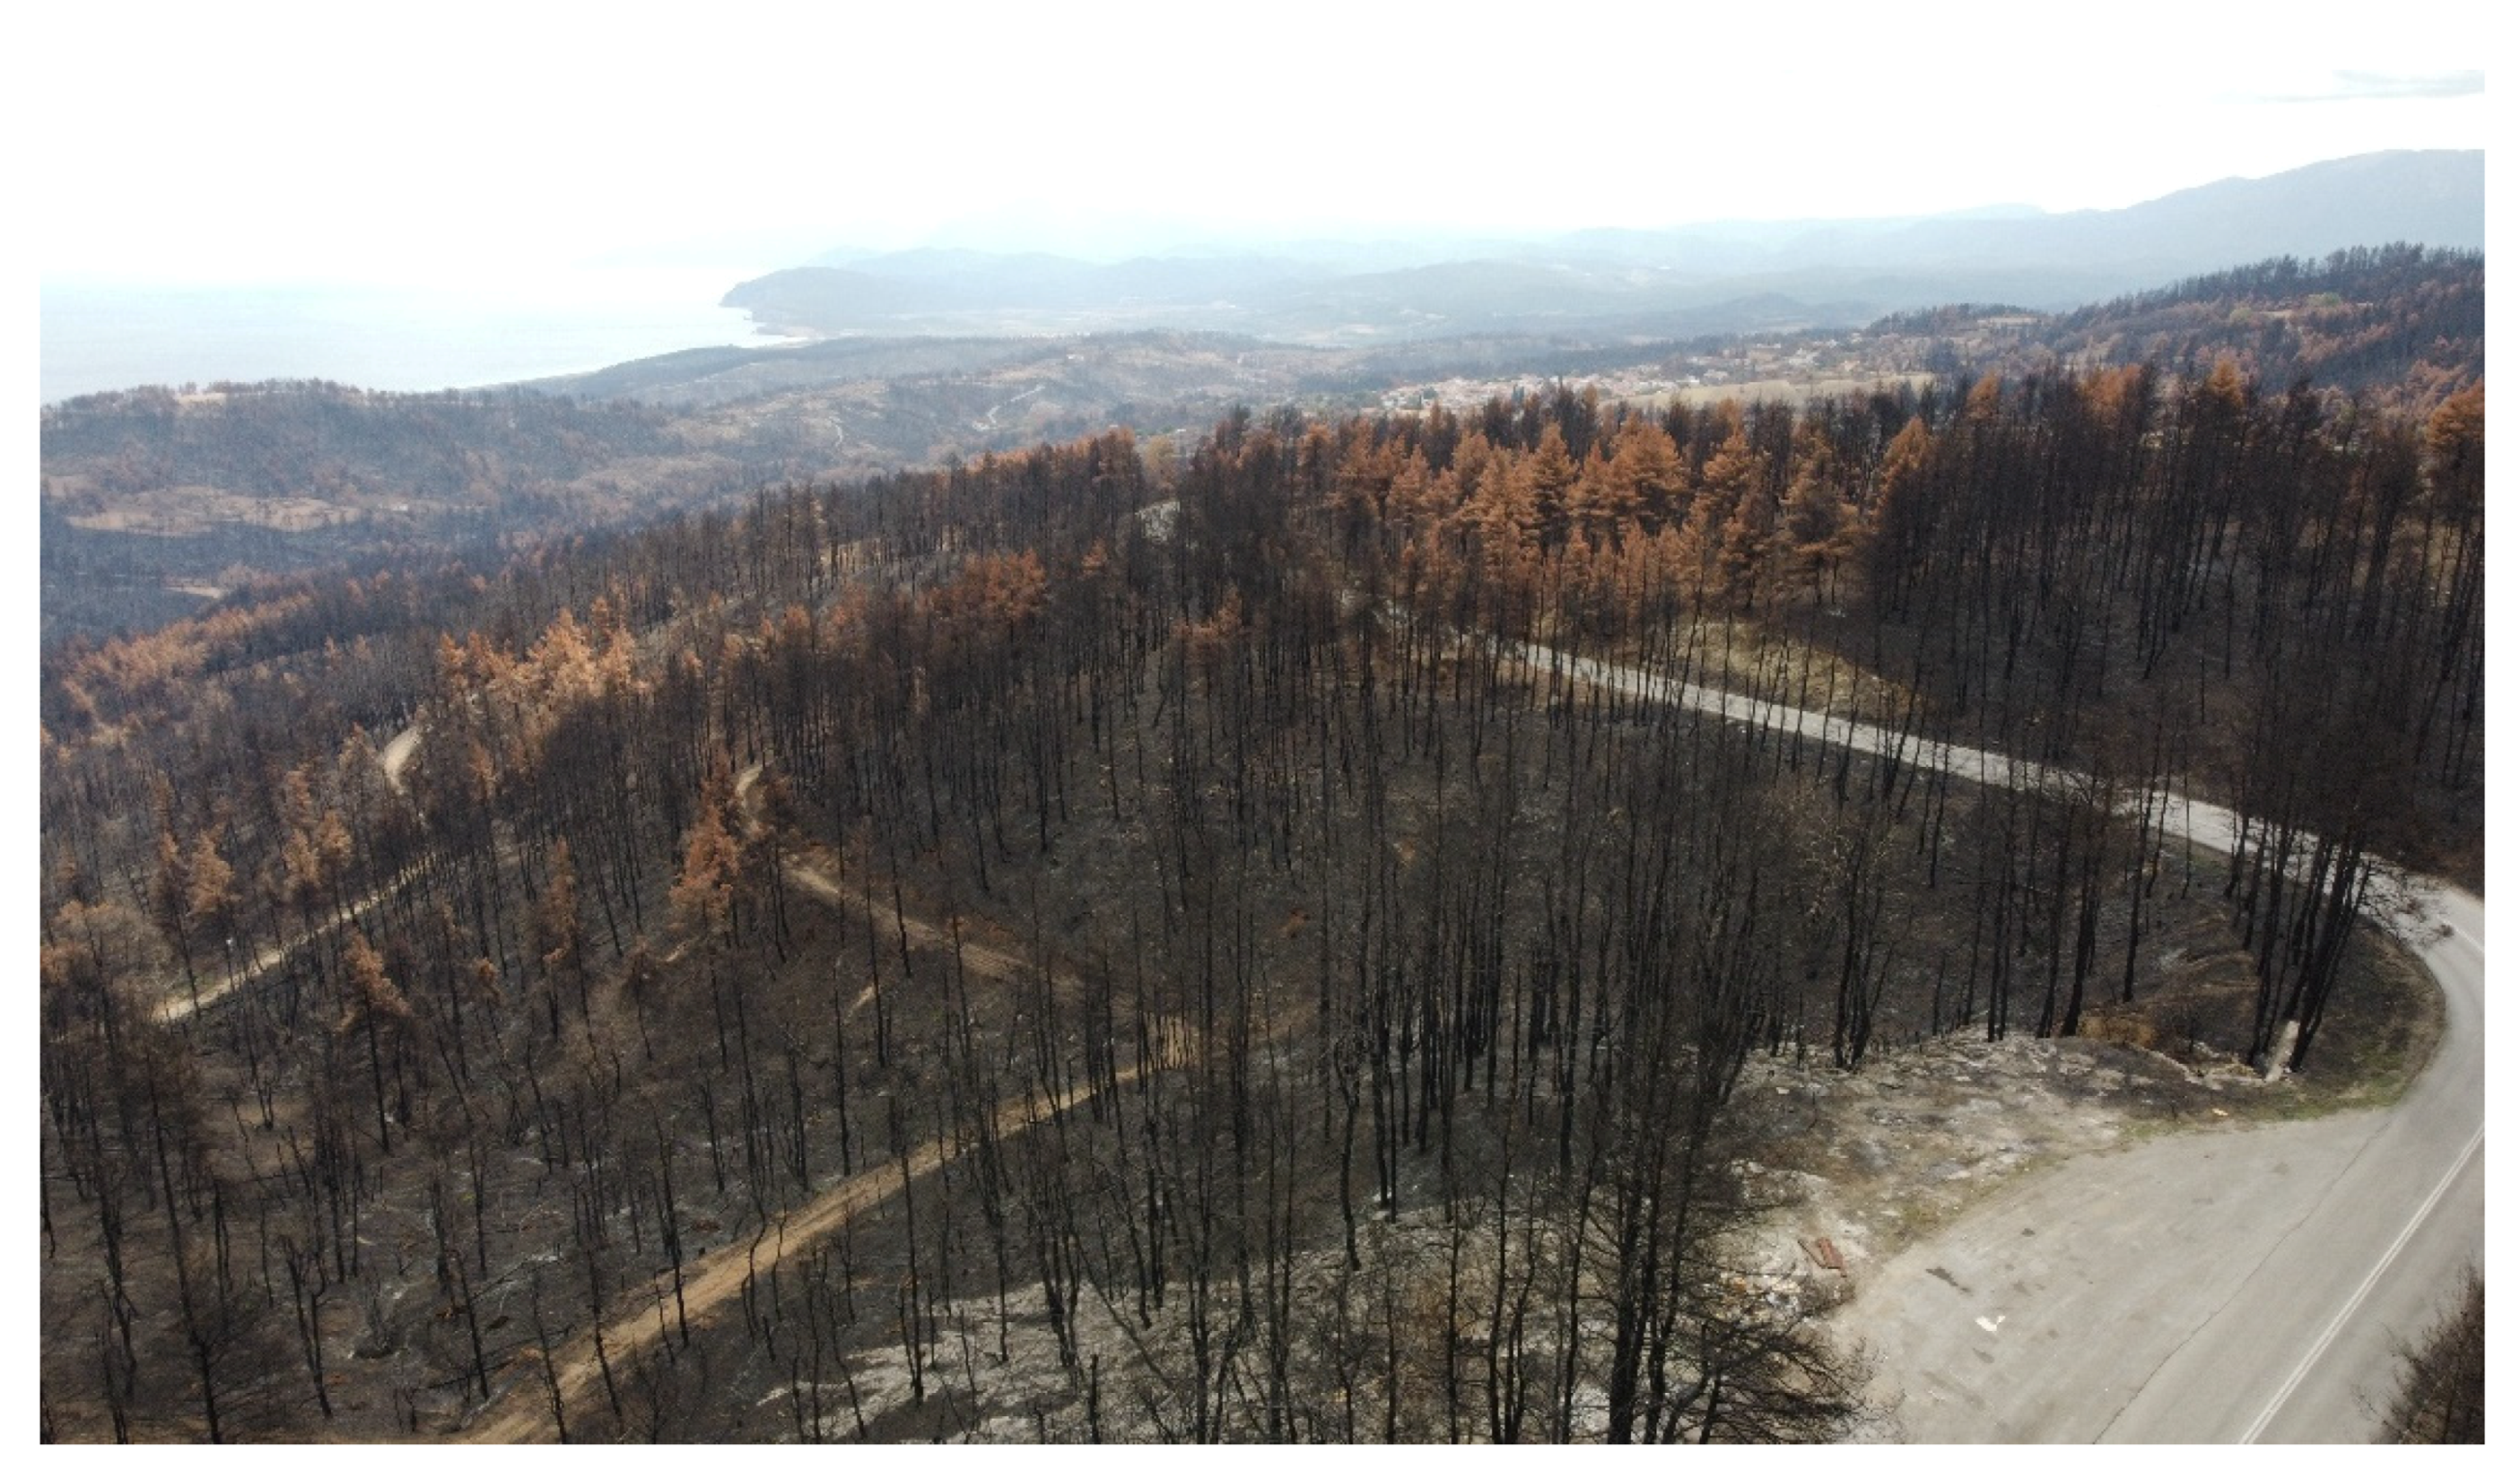
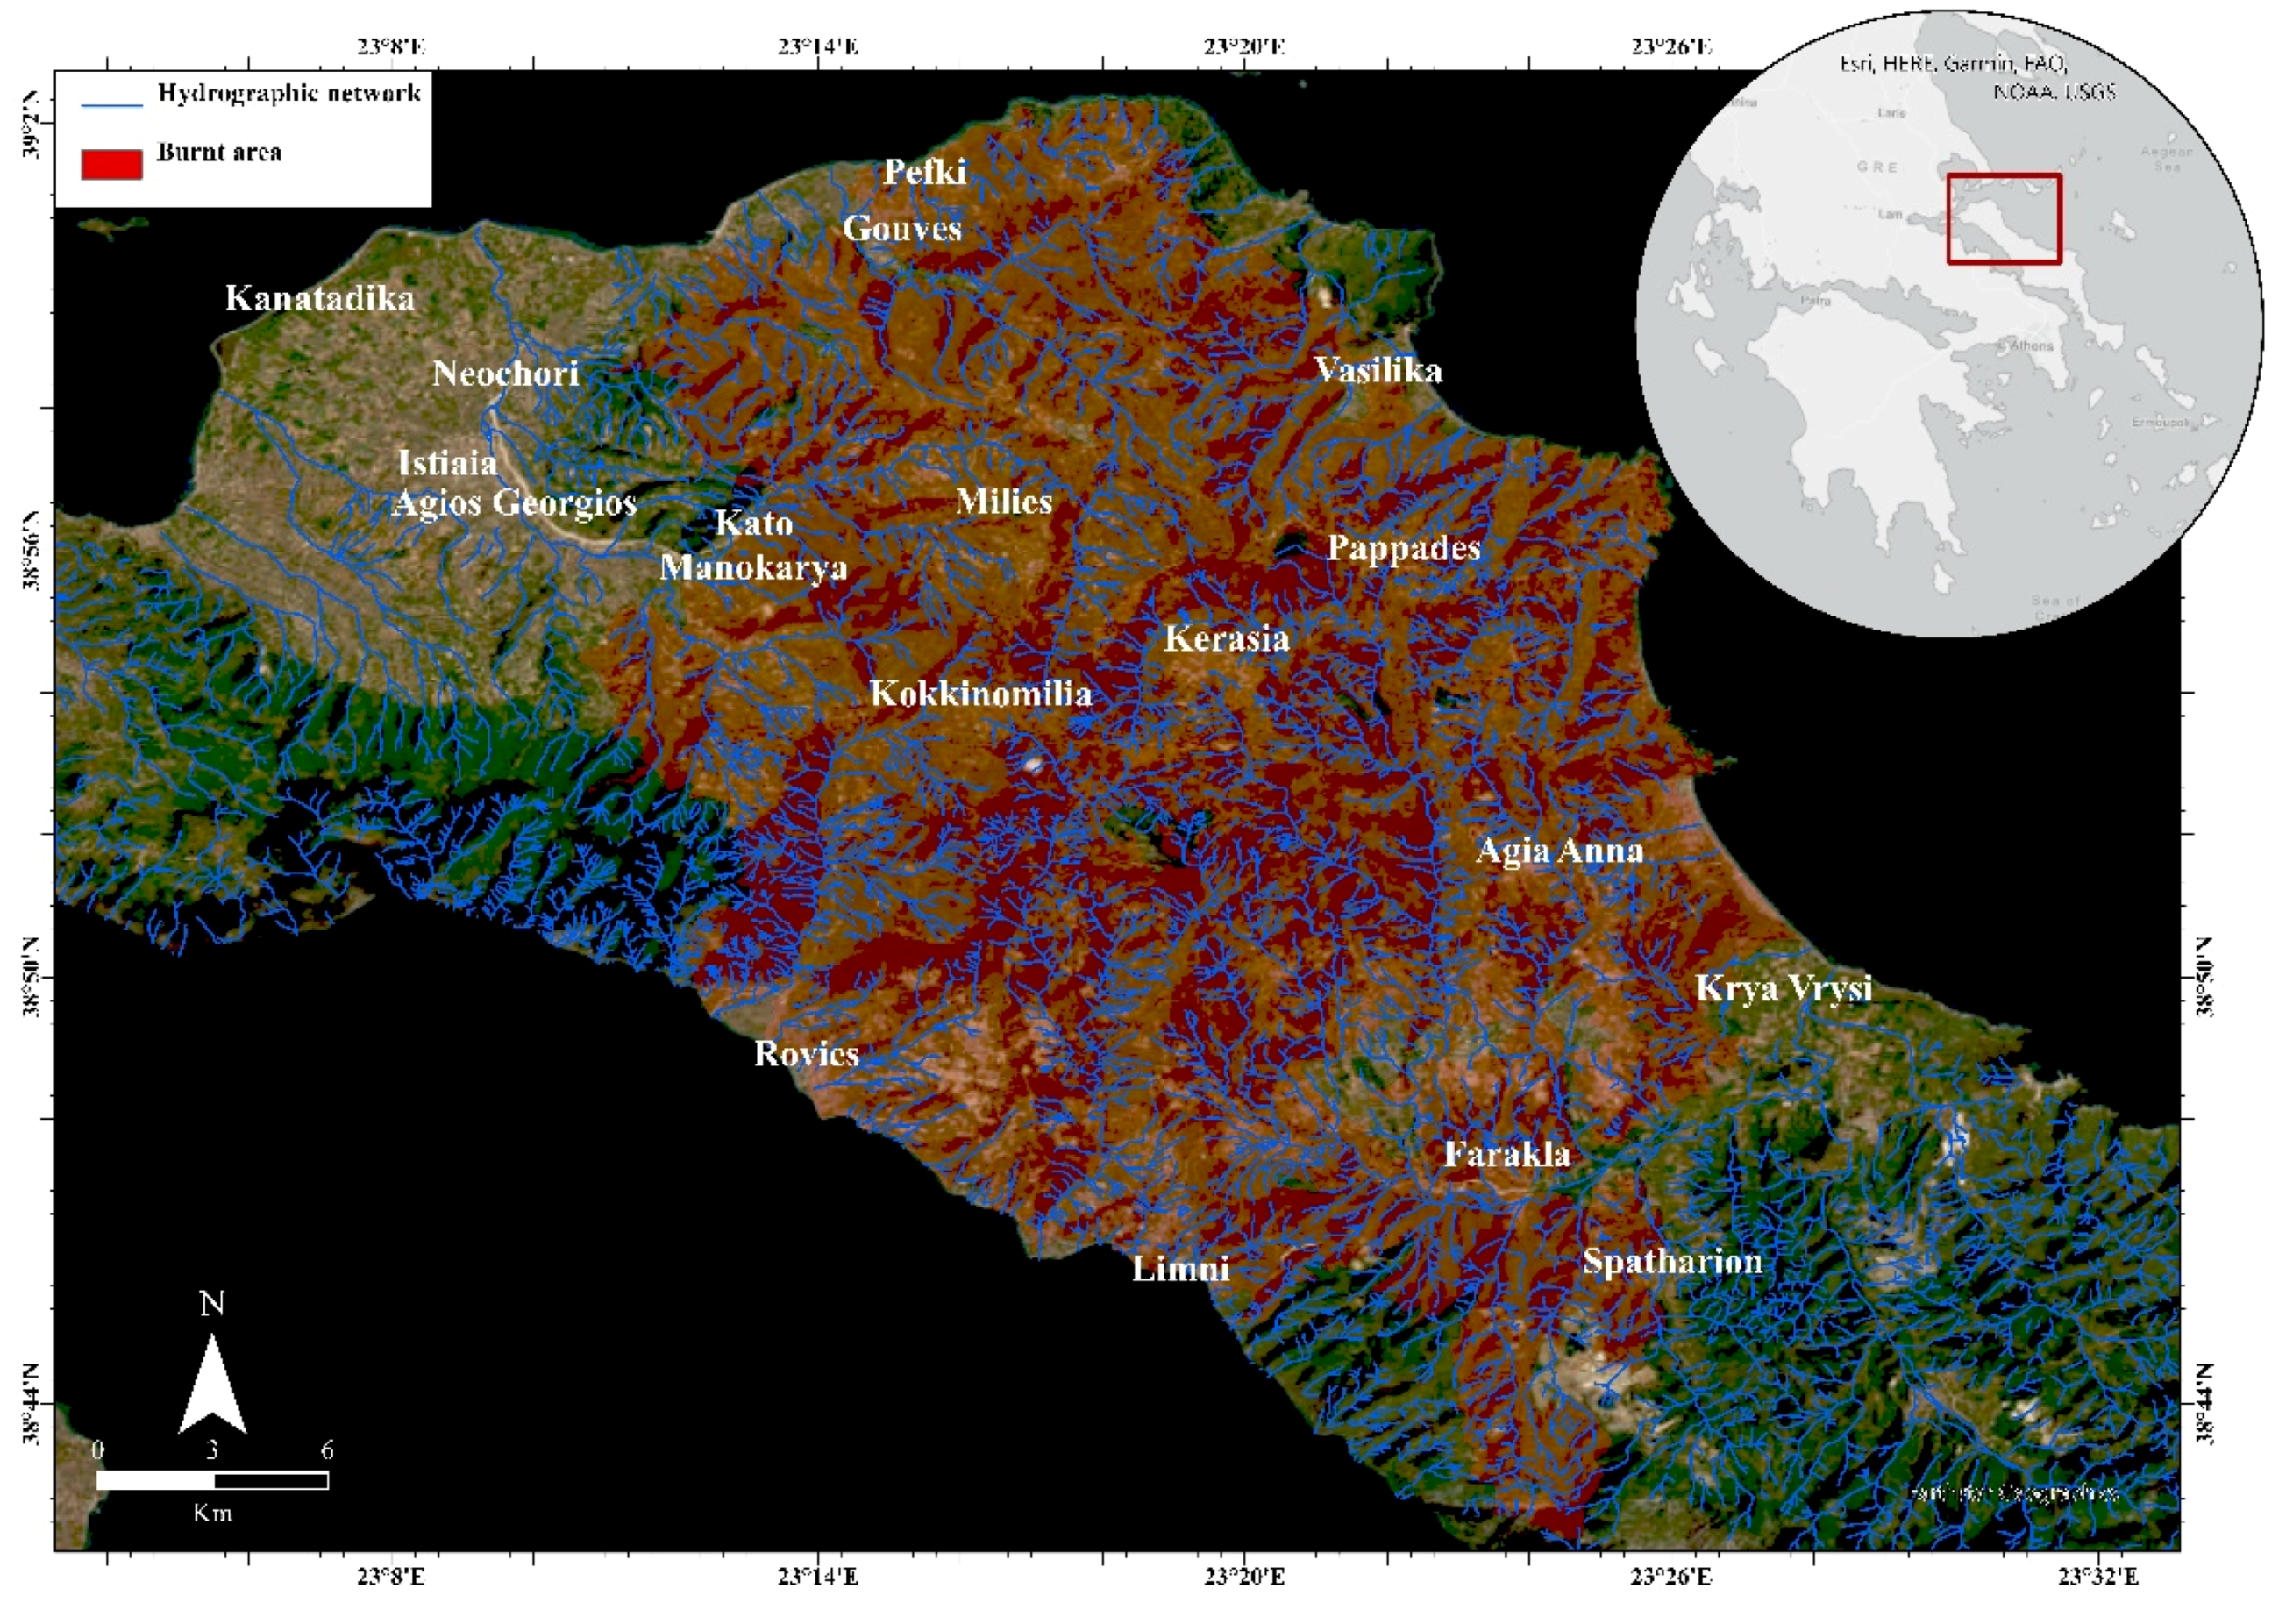
2.2. Northern Euboea
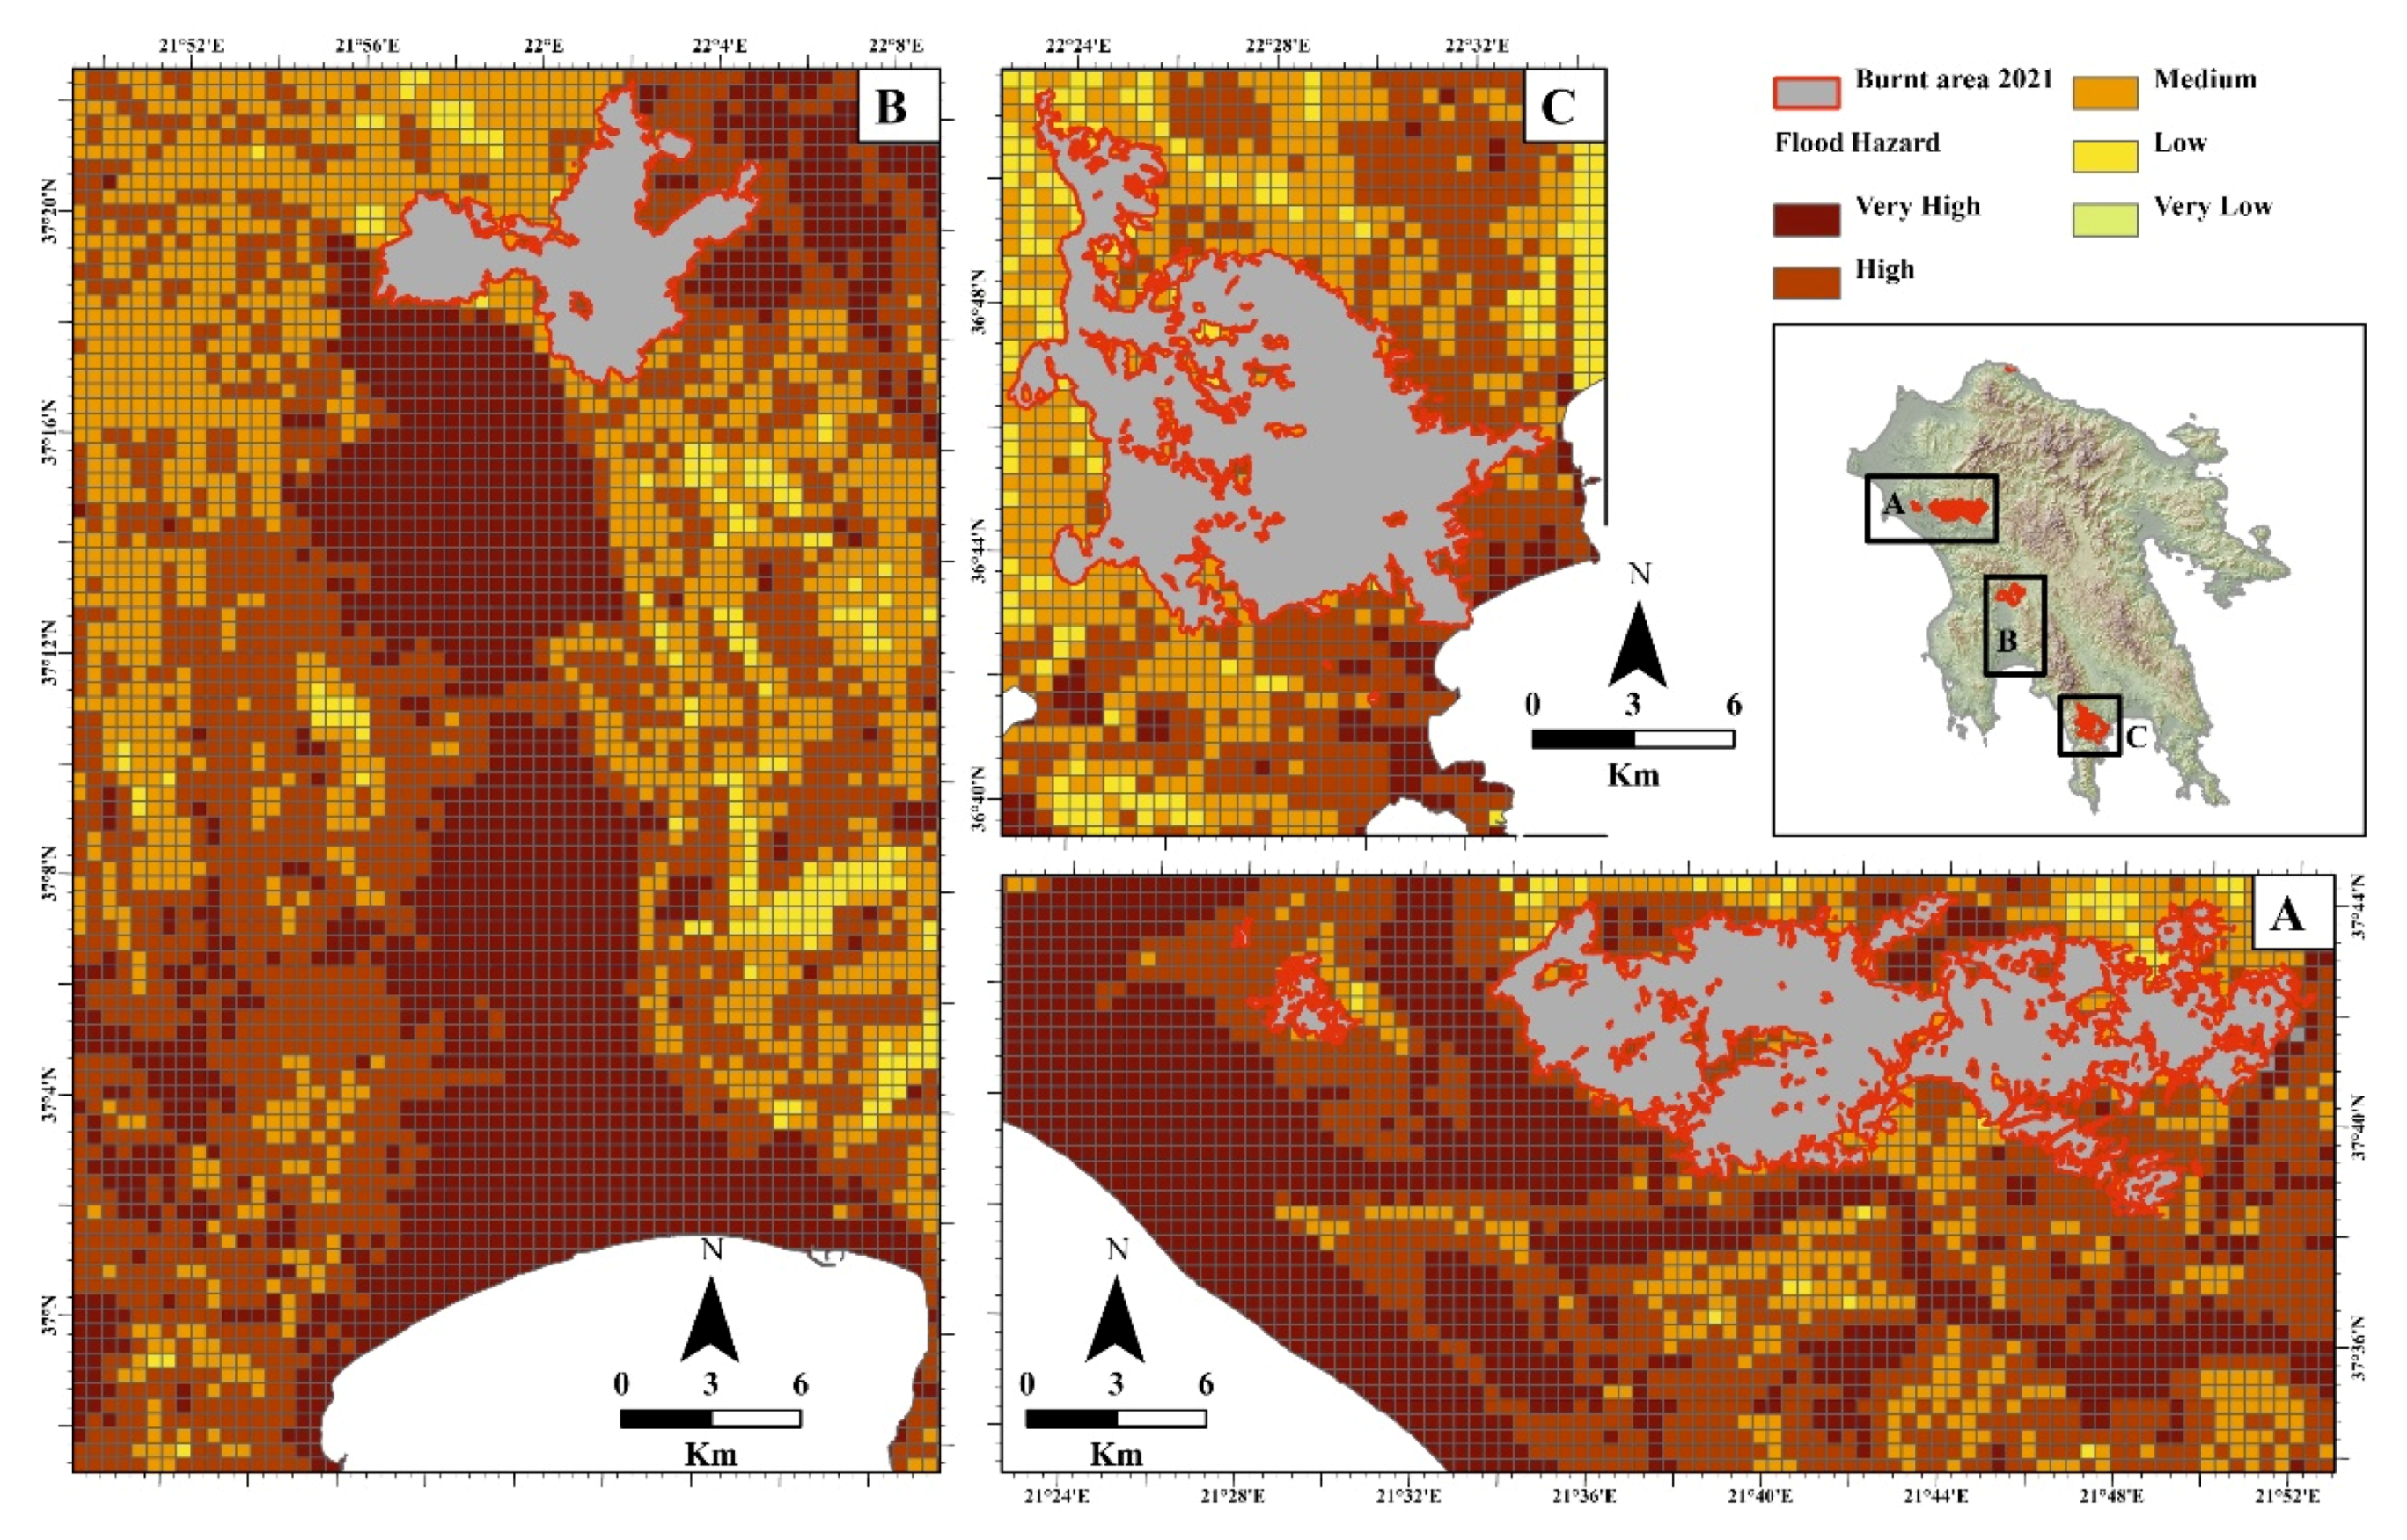
2.3. The Peloponnese
3. Materials and Methods
4. Results and Discussion
5. Conclusions
Author Contributions
Funding
Data Availability Statement
Conflicts of Interest
References
- Ahmadalipour, A.; Moradkhani, H. A data-driven analysis of flash flood hazard, fatalities, and damages over the CONUS during 1996–2017. J. Hydrol. 2019, 578, 124106. [Google Scholar] [CrossRef]
- Jonkman, S.N. Global Perspectives on Loss of Human Life Caused by Floods. Nat. Hazards 2005, 34, 151–175. [Google Scholar] [CrossRef]
- Barredo, J.I. Major flood disasters in Europe: 1950–2005. Nat. Hazards 2007, 42, 125–148. [Google Scholar] [CrossRef]
- Barredo, J.I. Normalised flood losses in Europe: 1970–2006. Nat. Hazards Earth Syst. Sci. 2009, 9, 97–104. [Google Scholar] [CrossRef]
- Flack, D.L.A.; Skinner, C.J.; Hawkness-Smith, L.; O’Donnell, G.; Thompson, R.J.; Waller, J.A.; Chen, A.S.; Moloney, J.; Largeron, C.; Xia, X.; et al. Recommendations for Improving Integration in National End-to-End Flood Forecasting Systems: An Overview of the FFIR (Flooding From Intense Rainfall) Programme. Water 2019, 11, 725. [Google Scholar] [CrossRef] [Green Version]
- Hosseinzadehtalaei, P.; Tabari, H.; Willems, P. Satellite-based data driven quantification of pluvial floods over Europe under future climatic and socioeconomic changes. Sci. Total Environ. 2020, 721, 137688. [Google Scholar] [CrossRef] [PubMed]
- Khajehei, S.; Ahmadalipour, A.; Shao, W.; Moradkhani, H. A Place-based Assessment of Flash Flood Hazard and Vulnerability in the Contiguous United States. Sci. Rep. 2020, 10, 448. [Google Scholar] [CrossRef] [Green Version]
- Merz, B.; Kreibich, H.; Schwarze, R.; Thieken, A. Review article “Assessment of economic flood damage”. Nat. Hazards Earth Syst. Sci. 2010, 10, 1697–1724. [Google Scholar] [CrossRef]
- Kundzewicz, Z.W.; Pin’skwar, I.; Brakenridge, G.R. Changes in river flood hazard in Europe: A review. Hydrol. Res. 2018, 49, 294–302. [Google Scholar] [CrossRef]
- Kundzewicz, Z.W.; Pińskwar, I.; Brakenridge, G.R. Large floods in Europe, 1985–2009. Hydrol. Sci. J. 2013, 58, 1–7. [Google Scholar] [CrossRef]
- Gaume, E.; Bain, V.; Bernardara, P.; Newinger, O.; Barbuc, M.; Bateman, A.; Blaškovičová, L.; Blöschl, G.; Borga, M.; Dumitrescu, A.; et al. A compilation of data on European flash floods. J. Hydrol. 2009, 367, 70–78. [Google Scholar] [CrossRef] [Green Version]
- Perrin, J.L.; Tournoud, M.G. Hydrological processes controlling flow generation in a small Mediterranean catchment under karstic influence. Hydrol. Sci. J. 2010, 54, 1125–1140. [Google Scholar] [CrossRef]
- Wilson, E.M. Engineering Hydrology, 4th ed.; MacMillan Press Ltd.: London, UK, 1990. [Google Scholar]
- Smith, K.; Ward, R. Floods: Physical Processes and Human Impacts; John Wiley & Sons Ltd.: London, UK, 1998. [Google Scholar]
- Ward, R.C. Principles of Hydrology, 4th ed.; McGraw-Hill: London, UK, 2000. [Google Scholar]
- Bull, L.J.; Kirkby, M.J.; Shannon, J.; Hooke, J.M. The impact of rainstorms on floods in ephemeral channels in southeast Spain. Catena 2000, 38, 191–209. [Google Scholar] [CrossRef]
- Camarasa Belmonte, A.M.; Segura Beltrán, F. Flood events in Mediterranean ephemeral streams (ramblas) in Valencia region, Spain. Catena 2001, 45, 229–249. [Google Scholar] [CrossRef] [Green Version]
- Lana, X.; Martínez, M.D.; Serra, C.; Burgueño, A. Spatial and temporal variability of the daily rainfall regime in Catalonia (northeastern Spain), 1950–2000. Int. J. Climatol. A J. R. Meteorol. Soc. 2004, 24, 613–641. [Google Scholar] [CrossRef]
- Diakakis, M. Flood Hazard Assessment with the Use of Modeling Techniques; National and Kapodistrian University of Athens: Athens, Greece, 2012. [Google Scholar]
- Petropoulos, G.P.; Kontoes, C.; Keramitsoglou, I. Burnt area delineation from a uni-temporal perspective based on Landsat TM imagery classification using Support Vector Machines. Int. J. Appl. Earth Obs. Geoinf. 2011, 13, 70–80. [Google Scholar] [CrossRef]
- Chuvieco, E.; Congalton, R. Mapping and inventory of forest fires from digital processing of TM data. Geocarto Int. 1988, 3, 41–53. [Google Scholar] [CrossRef]
- Barbero, M.; Loisel, R.; Quézel, P.; Richardson, D.; Romane, F. Pines of the Mediterranean basin. In Ecology and Biogeography of Pinus; Richardson, D.M., Ed.; Cambridge University Press: Cambridge, UK, 1998; pp. 153–170. [Google Scholar]
- Mitsopoulos, I.; Trapatsas, P.; Xanthopoulos, G. SYPYDA: A software tool for fire management in Mediterranean pine forests of Greece. Comput. Electron. Agric. 2016, 121, 195–199. [Google Scholar] [CrossRef]
- Kozlowski, T.T.; Ahlrren, C.E. Fire and Ecosystems; Academic Press: New York, NY, USA, 1974. [Google Scholar]
- De la Rosa, J.M.; González-Pérez, J.A.; González-Vázquez, R.; Knicker, H.; López-Capel, E.; Manning, D.A.C.; González-Vila, F.J. Use of pyrolysis/GC–MS combined with thermal analysis to monitor C and N changes in soil organic matter from a Mediterranean fire affected forest. Catena 2008, 74, 296–303. [Google Scholar] [CrossRef]
- Athanasakis, G.; Psomiadis, E.; Chatziantoniou, A. High-resolution Earth observation data and spatial analysis for burn severity evaluation and post-fire effects assessment in the Island of Chios, Greece. Proc. SPIE 2017, 10428, 104281. [Google Scholar]
- Werth, P.; Potter, B.; Clements, C.; Finney, M.; Goodrick, S.; Alexander, M.; Cruz, M.; Forthofer, J.; McAllister, S. Synthesis of Knowledge of Extreme Fire Behavior: Volume I for Fire Managers; U.S. Department of Agriculture, Forest Service, Pacific Northwest Research Station: Portland, OR, USA, 2011.
- Vieira, D.C.S.; Serpa, D.; Nunes, J.P.C.; Prats, S.A.; Neves, R.; Keizer, J.J. Predicting the effectiveness of different mulching techniques in reducing post-fire runoff and erosion at plot scale with the RUSLE, MMF and PESERA models. Environ. Res. 2018, 165, 365–378. [Google Scholar] [CrossRef] [PubMed]
- Founda, D.; Giannakopoulos, C. The exceptionally hot summer of 2007 in Athens, Greece—A typical summer in the future climate? Glob. Planet. Change 2009, 67, 227–236. [Google Scholar] [CrossRef]
- Neary, D.G.; Ryan, K.C.; DeBano, L.F. Wildland Fire in Ecosystems: Effects of Fire on Soils and Water; U.S. Department of Agriculture, Forest Service, Rocky Mountain Research Station: Fort Collins, CO, USA, 2005.
- Cerdà, A.; Robichaud, P. Fire Effects on Soils and Restoration Strategies. Land Reconstruction and Management Series; Science Publishers: Enfield, NH, USA, 2009. [Google Scholar]
- Robichaud, P.R.; Wagenbrenner, J.W.; Brown, R.E.; Wohlgemuth, P.M.; Beyers, J.L. Evaluating the effectiveness of contour-felled log erosion barriers as a post-fire runoff and erosion mitigation treatment in the western United States. Int. J. Wildl. Fire 2008, 17, 255–273. [Google Scholar] [CrossRef]
- Fox, D.M.; Laaroussi, Y.; Malkinson, L.D.; Maselli, F.; Andrieu, J.; Bottai, L.; Wittenberg, L. POSTFIRE: A model to map forest fire burn scar and estimate runoff and soil erosion risks. Remote Sens. Appl. Soc. Environ. 2016, 4, 83–91. [Google Scholar] [CrossRef]
- Batelis, S.-C.; Nalbantis, I. Potential Effects of Forest Fires on Streamflow in the Enipeas River Basin, Thessaly, Greece. Environ. Process. 2014, 1, 73–85. [Google Scholar] [CrossRef] [Green Version]
- Venkatesh, K.; Preethi, K.; Ramesh, H. Evaluating the effects of forest fire on water balance using fire susceptibility maps. Ecol. Indic. 2020, 110, 105856. [Google Scholar] [CrossRef]
- Mallinis, G.; Maris, F.; Kalinderis, I.; Koutsias, N. Assessment of Post-fire Soil Erosion Risk in Fire-Affected Watersheds Using Remote Sensing and GIS. GIScience Remote Sens. 2009, 46, 388–410. [Google Scholar] [CrossRef]
- Varela, M.E.; Benito, E.; Keizer, J.J. Wildfire effects on soil erodibility of woodlands in NW Spain. Land Degrad. Dev. 2010, 21, 75–82. [Google Scholar] [CrossRef]
- Moody, J.A.; Shakesby, R.A.; Robichaud, P.R.; Cannon, S.H.; Martin, D.A. Current research issues related to post-wildfire runoff and erosion processes. Earth-Sci. Rev. 2013, 122, 10–37. [Google Scholar] [CrossRef]
- Baloutsos, G.; Oikonomou, A.; Kaoukis, K. Flood Hazard in Drainage Basins after a Fire. Analysis of the Problem and Direct Measurements for Reducing the Impact; National Foundation of Agricultural Research, Institute of Mediterranean Forest Ecosystems and Woodland Product Tech-nology: Athens, Greece, 2007. [Google Scholar]
- White, W.D.; Wells, S.G. Forest-fire devegetation and drainage basin adjustment in mountainous terrain. In Adjustment of the Fluvial System; Rhodes, D.D., Williams, G.P., Eds.; Allen and Unwin: New York, NY, USA, 1982; pp. 199–223. [Google Scholar]
- Certini, G. Effects of fire on properties of forest soils: A review. Oecologia 2005, 143, 1–10. [Google Scholar] [CrossRef]
- Chartres, C.J.; Mücher, H.J. The effects of fire on the surface properties and seed germination in two shallow monoliths from a rangeland soil subjected to simulated raindrop impact and water erosion. Earth Surf. Process. Landf. 1989, 14, 407–417. [Google Scholar] [CrossRef]
- Jordan, P.; Turner, K.; Nicol, D.; Boyer, D. Developing a risk analysis procedure for post-wildfire mass movement and flooding in British Columbia. In Proceedings of the Specialty Conference on Disaster Mitigation, Calgary, AB, Canada, May 2006; Available online: http://www.for.gov.bc.ca/hfd/pubs/rsi/fsp/Misc/Misc071.pdf (accessed on 15 May 2022).
- Areu-Rangel, O.S.; Bonasia, R.; Di Traglia, F.; Del Soldato, M.; Casagli, N. Flood Susceptibility and Sediment Transport Analysis of Stromboli Island after the 3 July 2019 Paroxysmal Explosion. Sustainability 2020, 12, 3268. [Google Scholar] [CrossRef] [Green Version]
- Diakakis, M. Effects on flood hazard in Marathon plain from the 2009 wildfire in Attica, Greece. In Advances in the Research of Aquatic Environment; Lambrakis, N., Stournaras, G., Katsanou, K., Eds.; Springer: Berlin/Heidelberg, Germany, 2011; Volume 1, pp. 155–162. ISBN 978-3-642-19902-8. [Google Scholar]
- Evelpidou, N.; Tzouxanioti, M.; Gavalas, T.; Spyrou, E.; Saitis, G.; Petropoulos, A.; Karkani, A. Assessment of Fire Effects on Surface Runoff Erosion Susceptibility: The Case of the Summer 2021 Forest Fires in Greece. Land 2022, 11, 21. [Google Scholar] [CrossRef]
- Karkani, A.; Evelpidou, N.; Tzouxanioti, M.; Petropoulos, A.; Santangelo, N.; Maroukian, H.; Spyrou, E.; Lakidi, L.; Piacentini, T. Flash Flood Susceptibility Evaluation in Human-Affected Areas Using Geomorphological Methods—The Case of 9 August 2020, Euboea, Greece. A GIS-Based Approach. GeoHazards 2021, 2, 366–382. [Google Scholar] [CrossRef]
- van Wagtendonk, J.W.; Root, R.R.; Key, C.H. Comparison of AVIRIS and Landsat ETM+ detection capabilities for burn severity. Remote Sens. Environ. 2004, 92, 397–408. [Google Scholar] [CrossRef]
- Lekkas, E.; Parcharidis, I.; Arianoutsou, M.; Lozios, S.; Mavroulis, S.; Spyrou, N.-I.; Antoniou, V.; Nastos, P.; Mavrouli, M.; Speis, P.; et al. The July–August 2021 Wildfires in Greece. Newsl. Environ. Disaster Cris. Manag. Strateg. 2021, 25. Available online: https://edcm.edu.gr/images/docs/newsletters/Newsletter_25_2021_July_August_Wildfires_in_Greece.pdf (accessed on 15 May 2022).
- EEA Corine Land Cover (CLC). 2018. Available online: https://land.copernicus.eu/pan-european/corine-land-cover/clc2018 (accessed on 21 November 2021).
- CORINE Corine Land Cover 2018. Available online: https://land.copernicus.eu/pan-european/corine-land-cover (accessed on 15 May 2022).
- Arend, J.L. Infiltration rates of forest soils in the Missouri Ozarks as affected by woods burning and litter removal. J. For. 1941, 39, 726–728. [Google Scholar]
- Papathanasiou, C.; Makropoulos, C.; Mimikou, M. Hydrological modelling for flood forecasting: Calibrating the post-fire initial conditions. J. Hydrol. 2015, 529, 1838–1850. [Google Scholar] [CrossRef]
- Stoof, C.R.; Vervoort, R.W.; Iwema, J.; van den Elsen, E.; Ferreira, A.J.D.; Ritsema, C.J. Hydrological response of a small catchment burned by experimental fire. Hydrol. Earth Syst. Sci. 2012, 16, 267–285. [Google Scholar] [CrossRef] [Green Version]
- Yalcin, G.; Akyurek, Z. Analyzing Flood Vulnerable Areas with Multicriteria Evaluation; Middle East Technical University: Ankara, Turkey, 2002. [Google Scholar]
- Mousavi, S.M.; Roostaei, S.; Rostamzadeh, H. Estimation of flood land use/land cover mapping by regional modelling of flood hazard at sub-basin level case study: Marand basin. Geomat. Nat. Hazards Risk 2019, 10, 1155–1175. [Google Scholar] [CrossRef] [Green Version]
- Sönmez, O.; Bizimana, H. Flood hazard risk evaluation using fuzzy logic and weightage-based combination methods in geographic information system. Sci. Iran. 2021, 27, 517–528. [Google Scholar] [CrossRef] [Green Version]
- Bhat, M.S.; Alam, A.; Ahmad, S.; Farooq, H.; Ahmad, B. Flood hazard assessment of upper Jhelum basin using morphometric parameters. Environ. Earth Sci. 2019, 78, 54. [Google Scholar] [CrossRef]
- Lóczy, D.; Kis, É.; Schweitzer, F. Local flood hazards assessed from channel morphometry along the Tisza River in Hungary. Geomorphology 2009, 113, 200–209. [Google Scholar] [CrossRef]
- Farhan, Y.; Anaba, O. Flash Flood Risk Estimation of Wadi Yutum (Southern Jordan) Watershed Using GIS Based Morphometric Analysis and Remote Sensing Techniques. Open J. Mod. Hydrol. 2016, 06, 79–100. [Google Scholar] [CrossRef] [Green Version]
- Cosandey, C.; Andréassian, V.; Martin, C.; Didon-Lescot, J.F.; Lavabre, J.; Folton, N.; Mathys, N.; Richard, D. The hydrological impact of the mediterranean forest: A review of French research. J. Hydrol. 2005, 301, 235–249. [Google Scholar] [CrossRef] [Green Version]
- Theochari, A.-P.; Baltas, E. Holistic hydrological approach to the fire event on August 2021 in Evia, Greece. Euro-Mediterr. J. Environ. Integr. 2022, 7, 287–298. [Google Scholar] [CrossRef]
- Diakakis, M.; Nikolopoulos, E.I.; Mavroulis, S.; Vassilakis, E.; Korakaki, E. Observational evidence on the effects of mega-fires on the frequency of hydrogeomorphic hazards. The case of the Peloponnese fires of 2007 in Greece. Sci. Total Environ. 2017, 592, 262–276. [Google Scholar] [CrossRef]
- Alonistioti, D.; Papathanasiou, C.; Kasella, A.; Makropoulos, C.; Mimikou, M. Assessing the impact of forest fires on the hydrological response of urban catchments: The case of the eastern Attica region. In Proceedings of the 12th International Conference of Environmental Science and Technology, Rhodes, Greece, 8–10 October 2011; pp. 8–10. [Google Scholar]


| Burned Area | ||||
|---|---|---|---|---|
| High | Low | |||
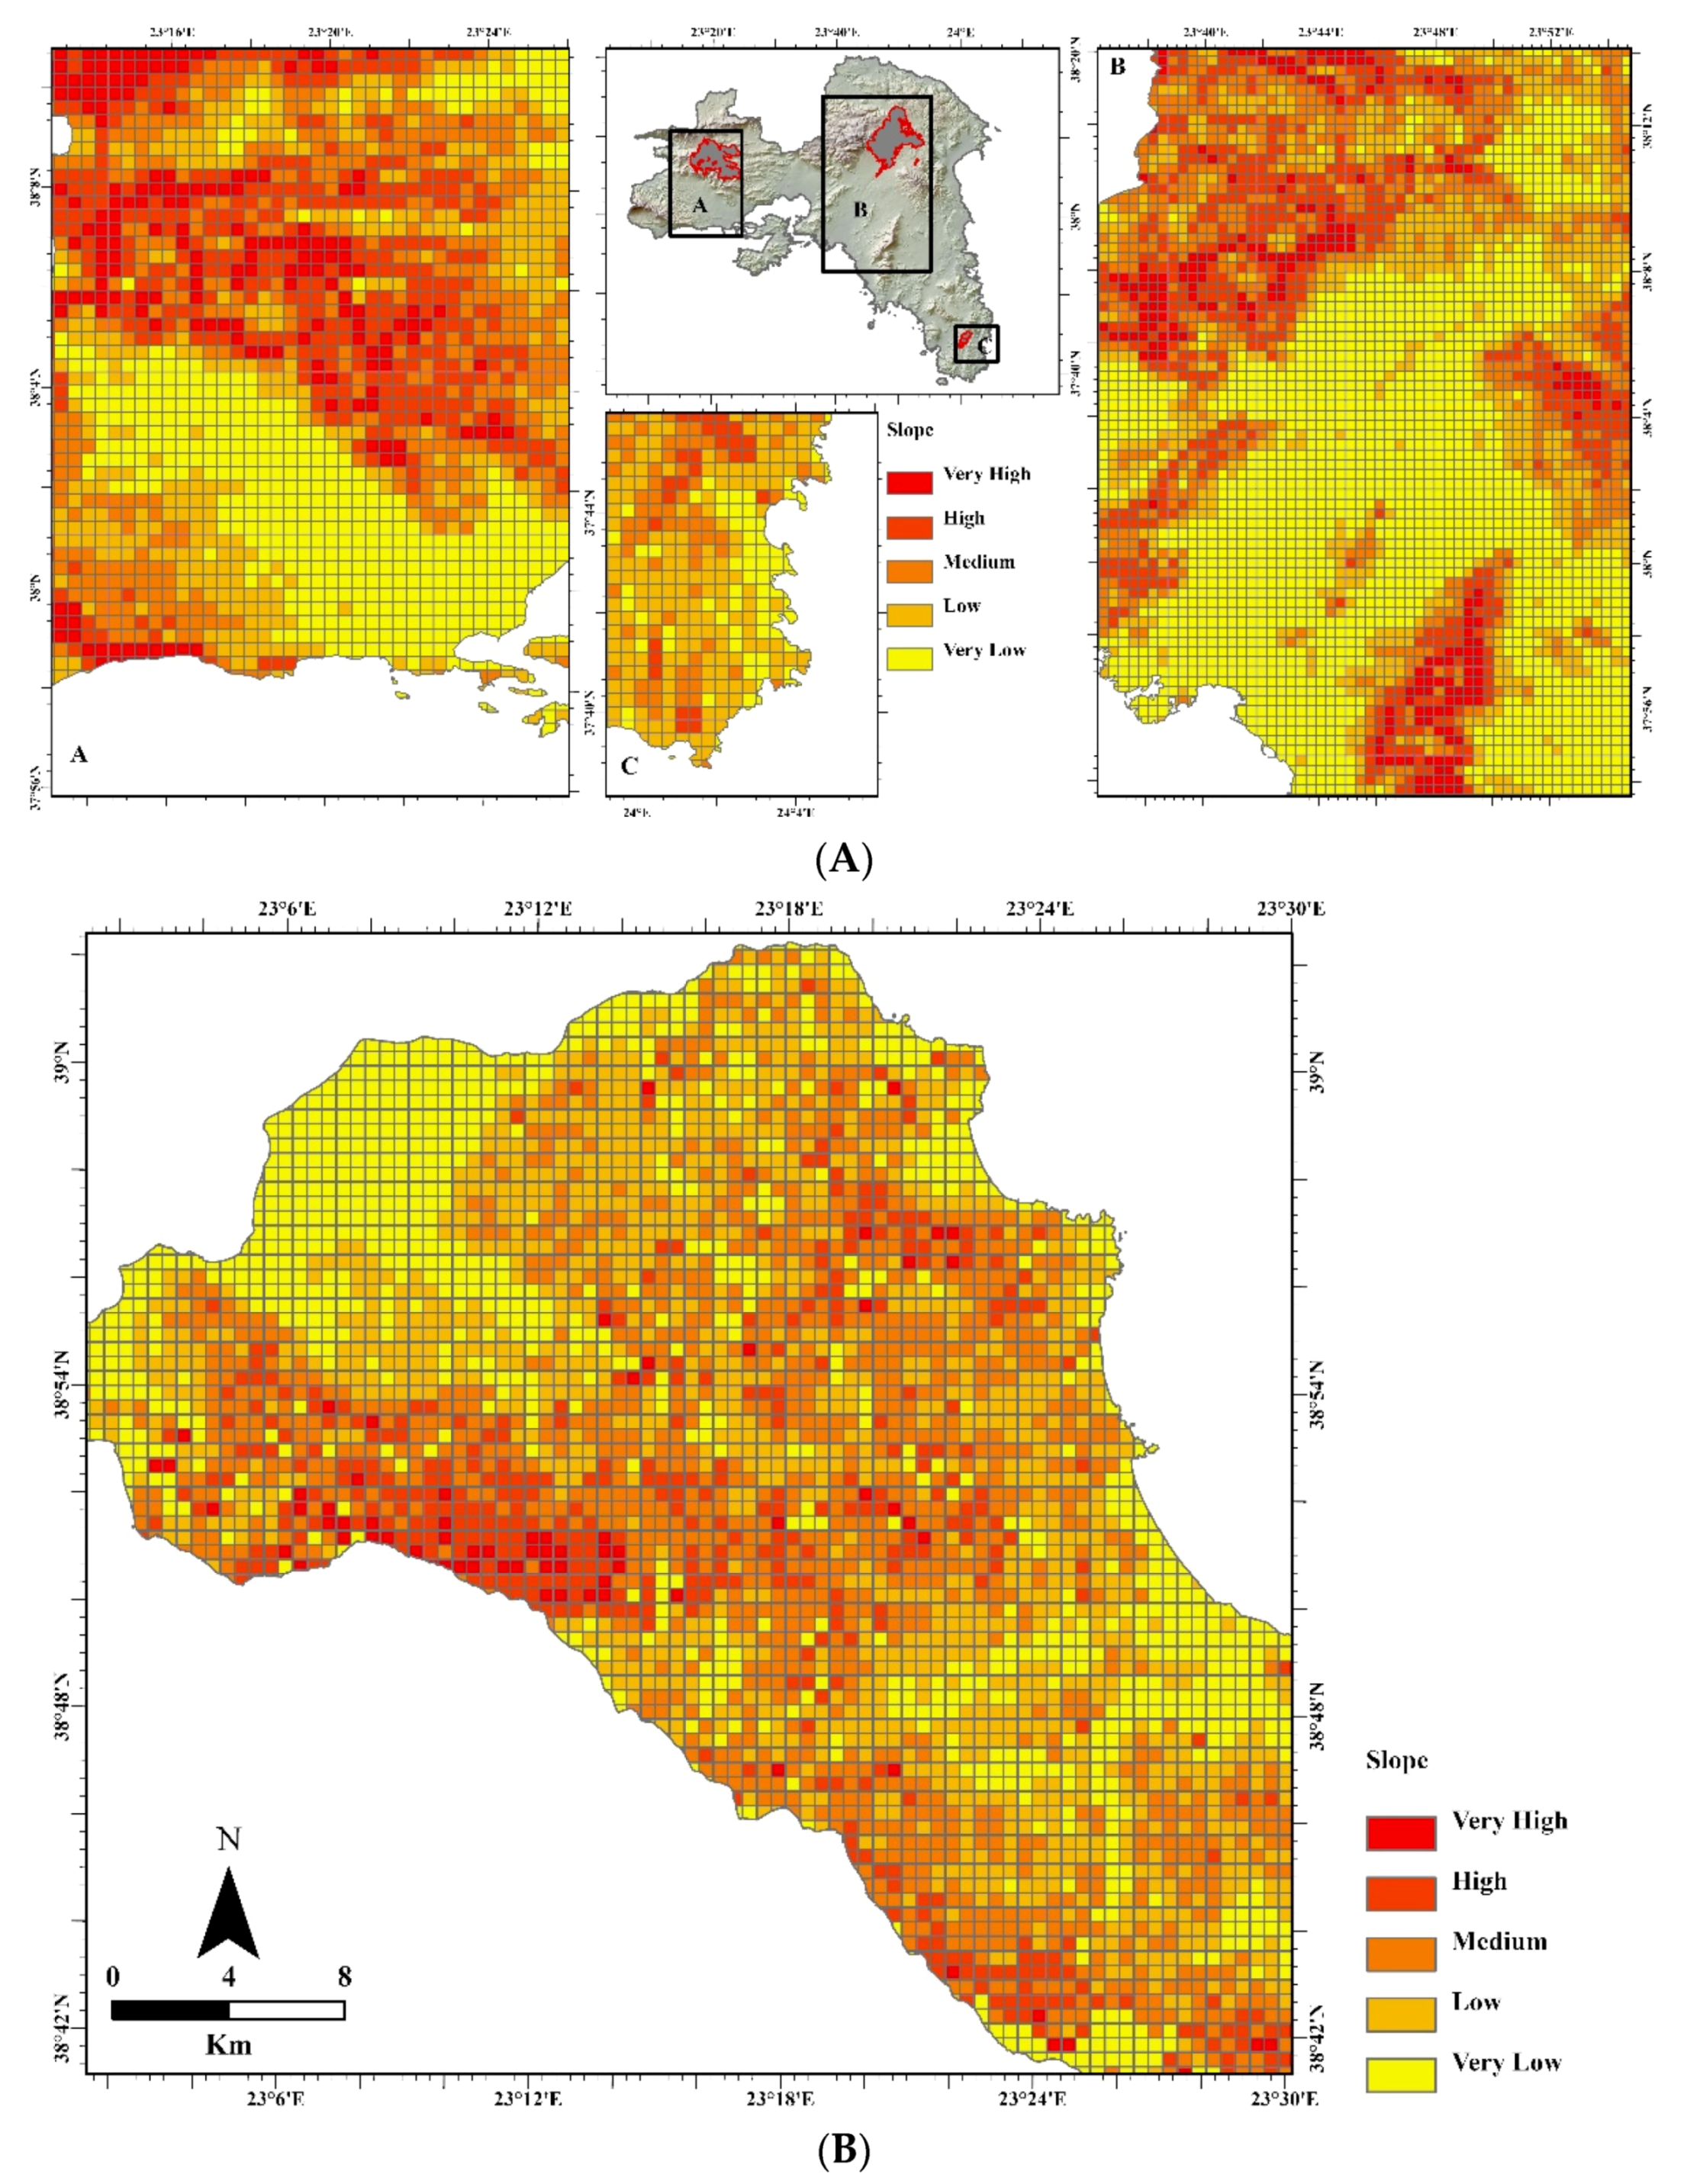
| Parameters | Slope | Very Low–Very High | Low | Medium |
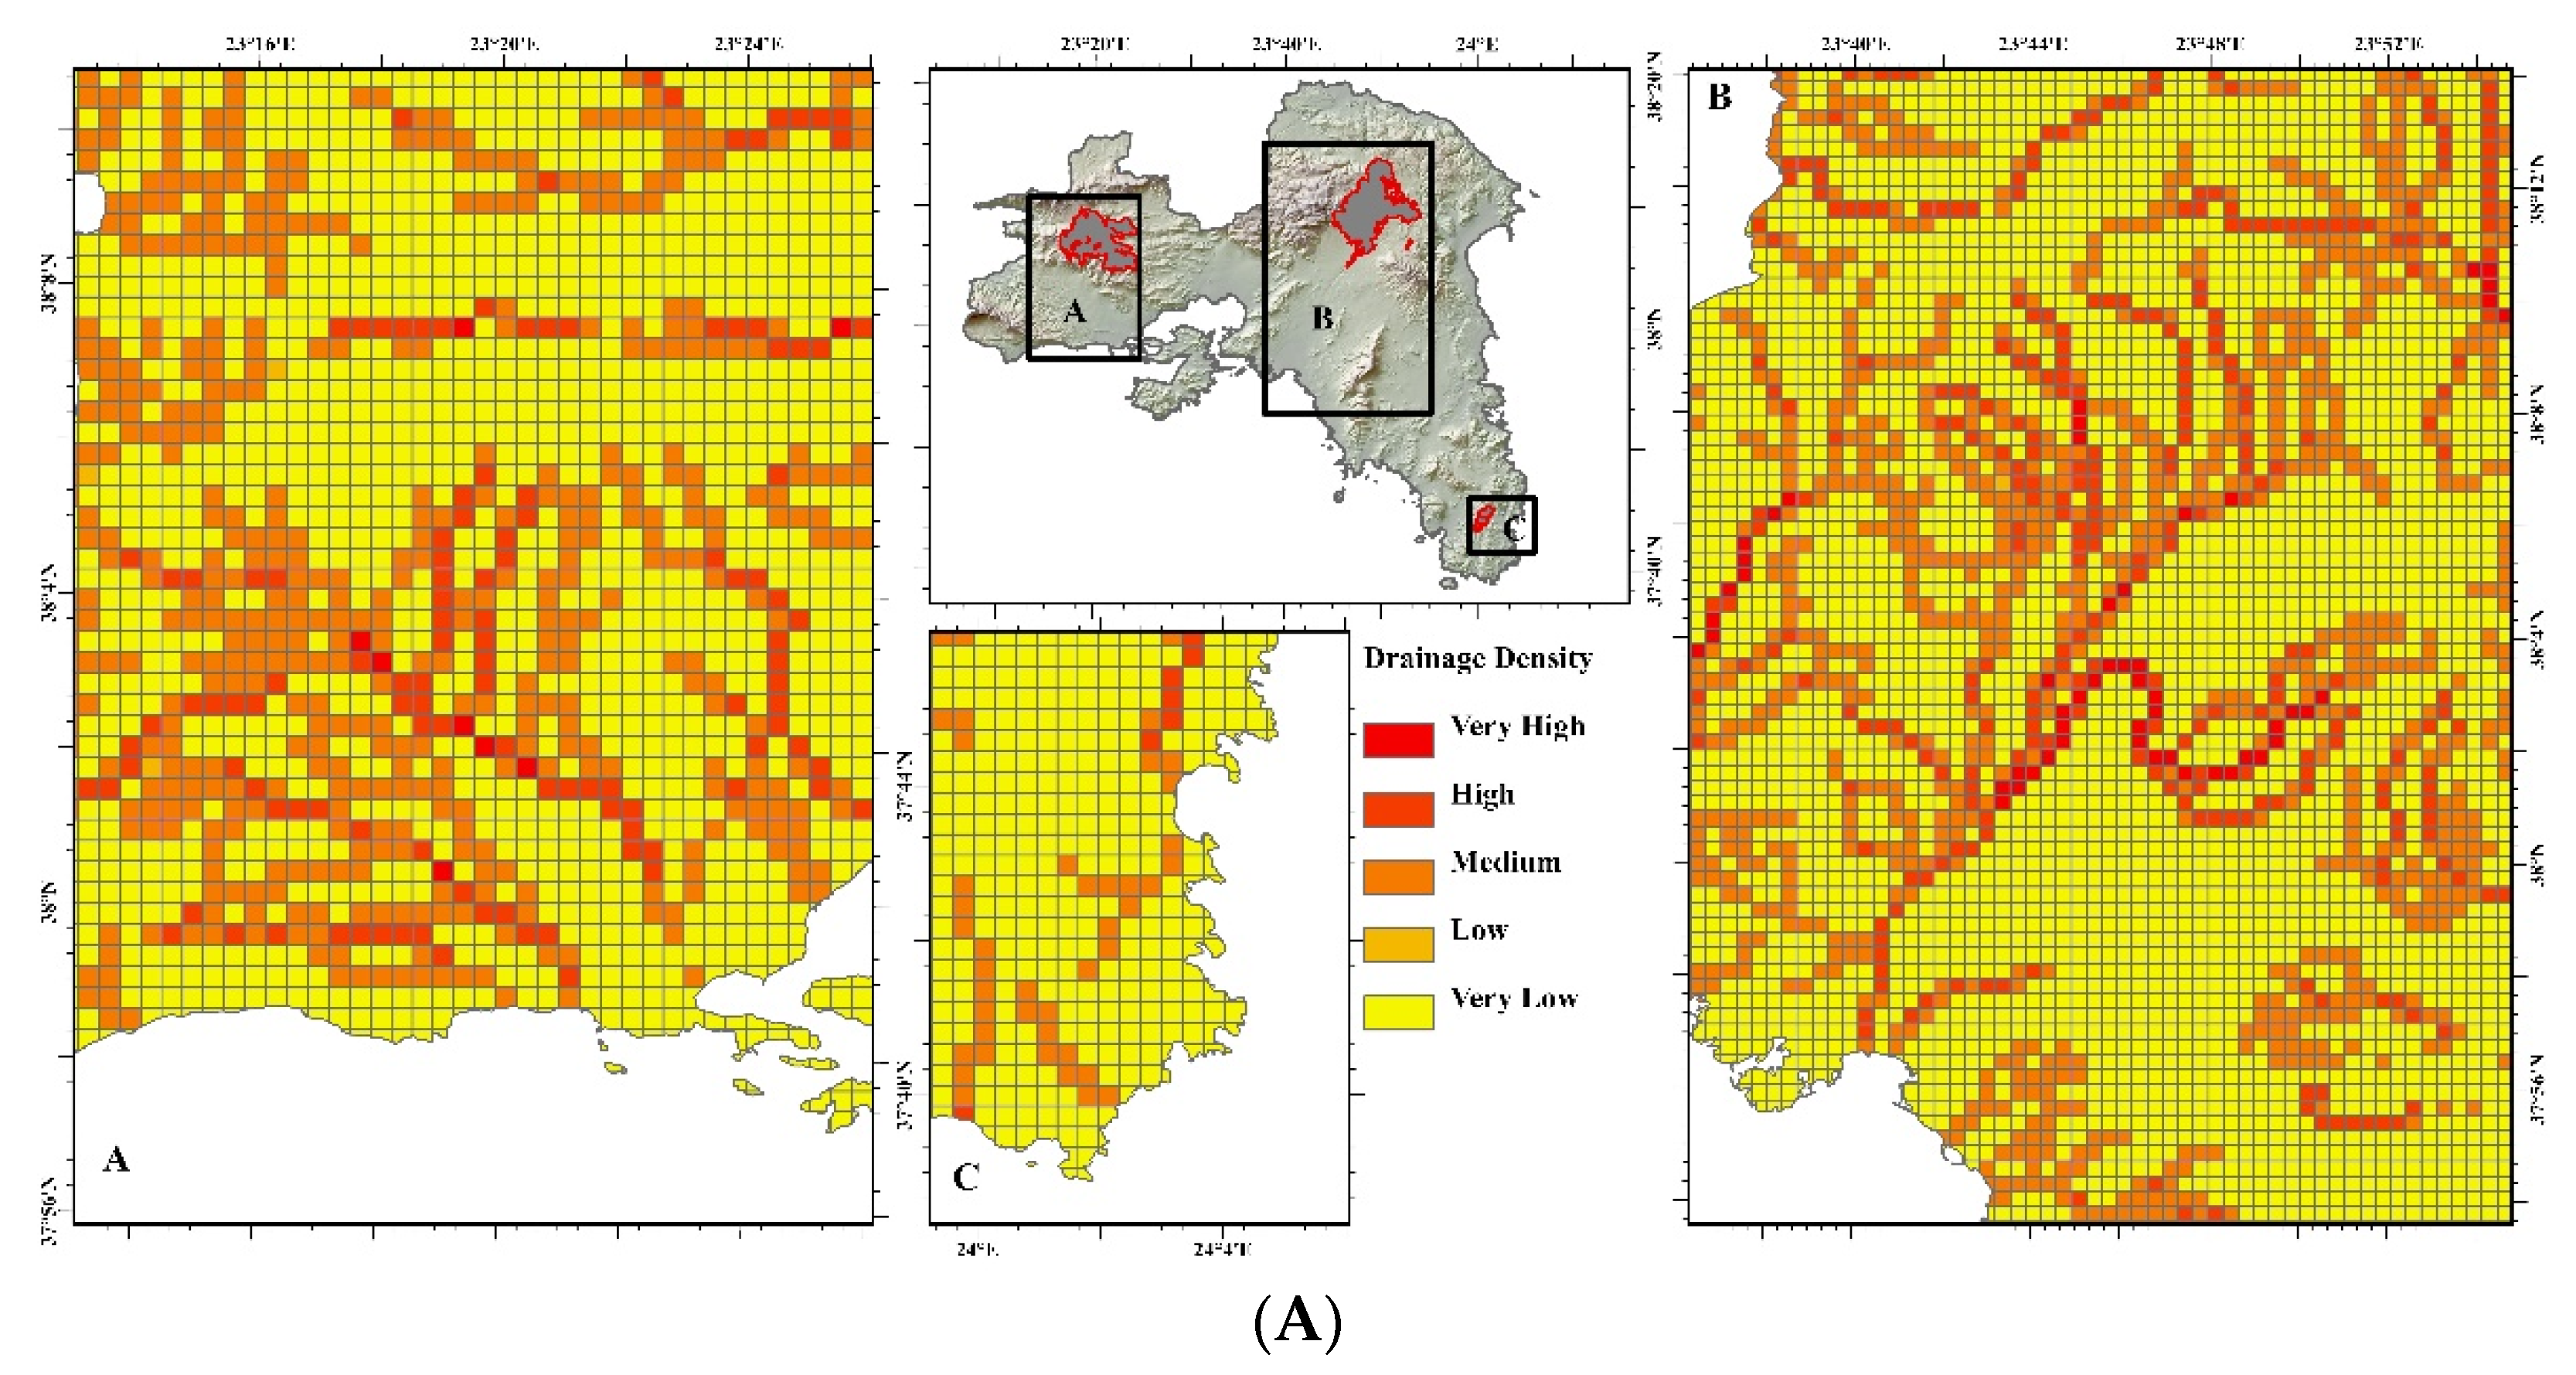
| Drainage density | Very Low–Very High | Medium | High | |
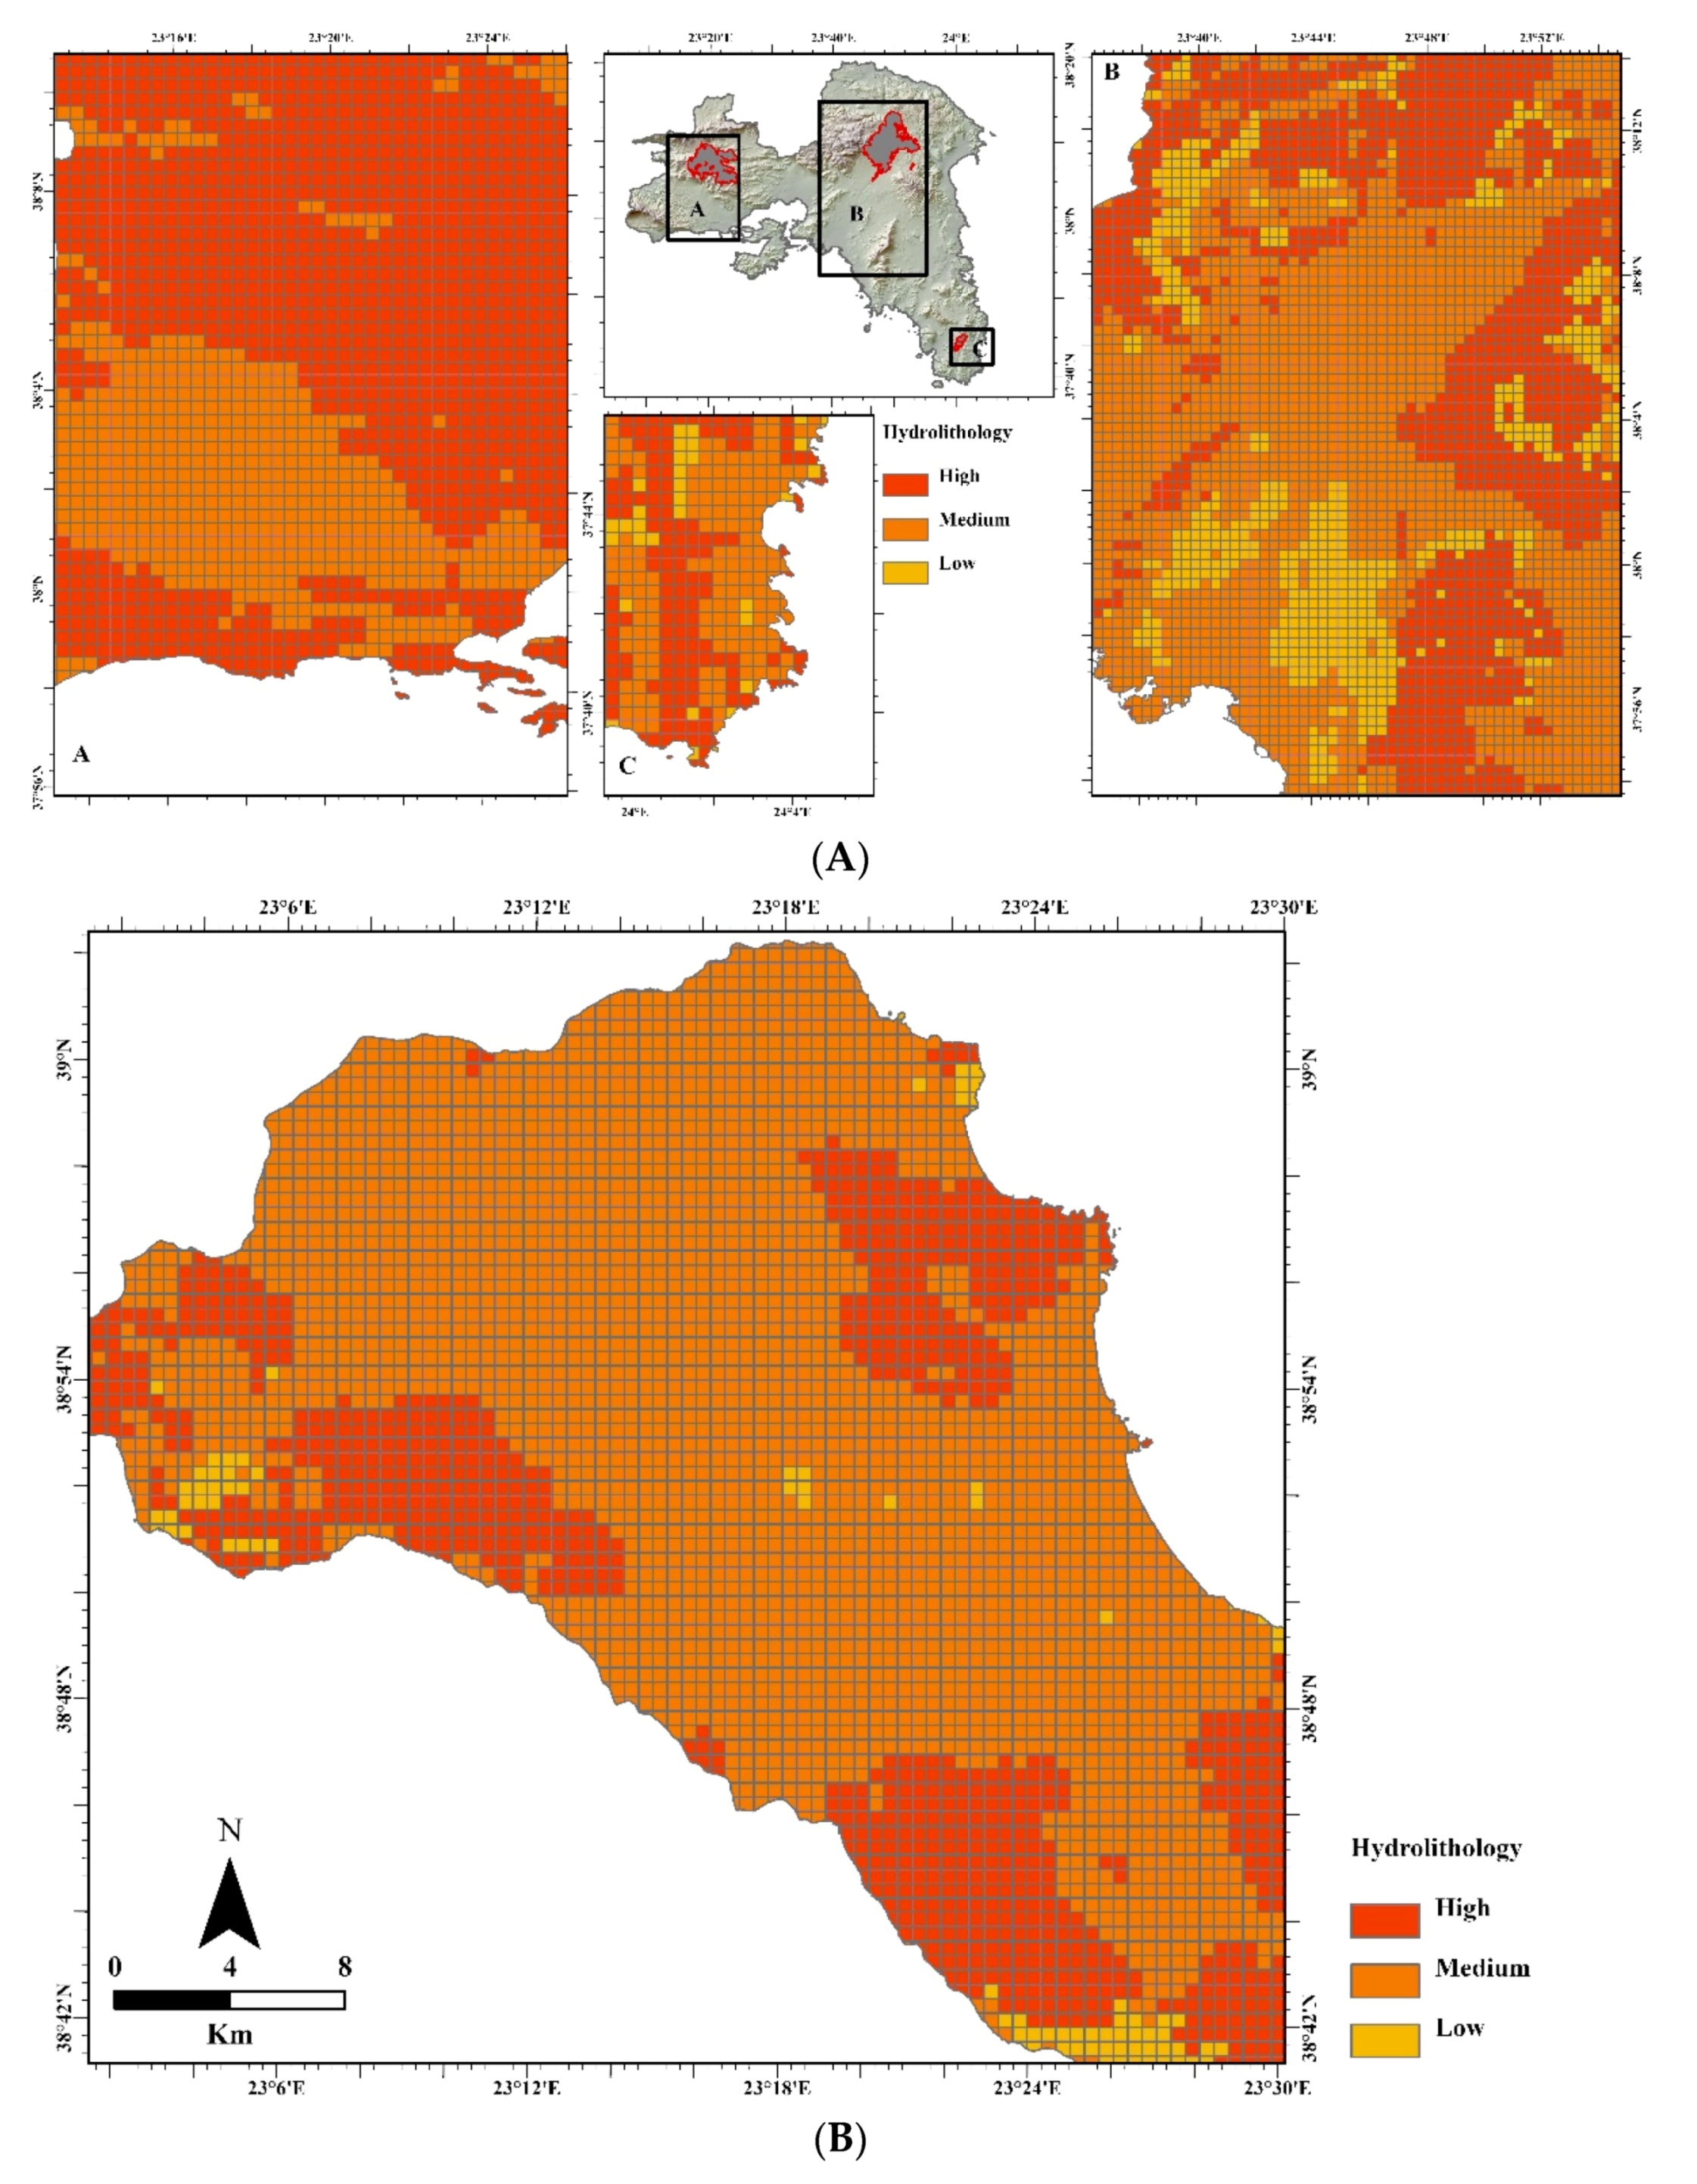
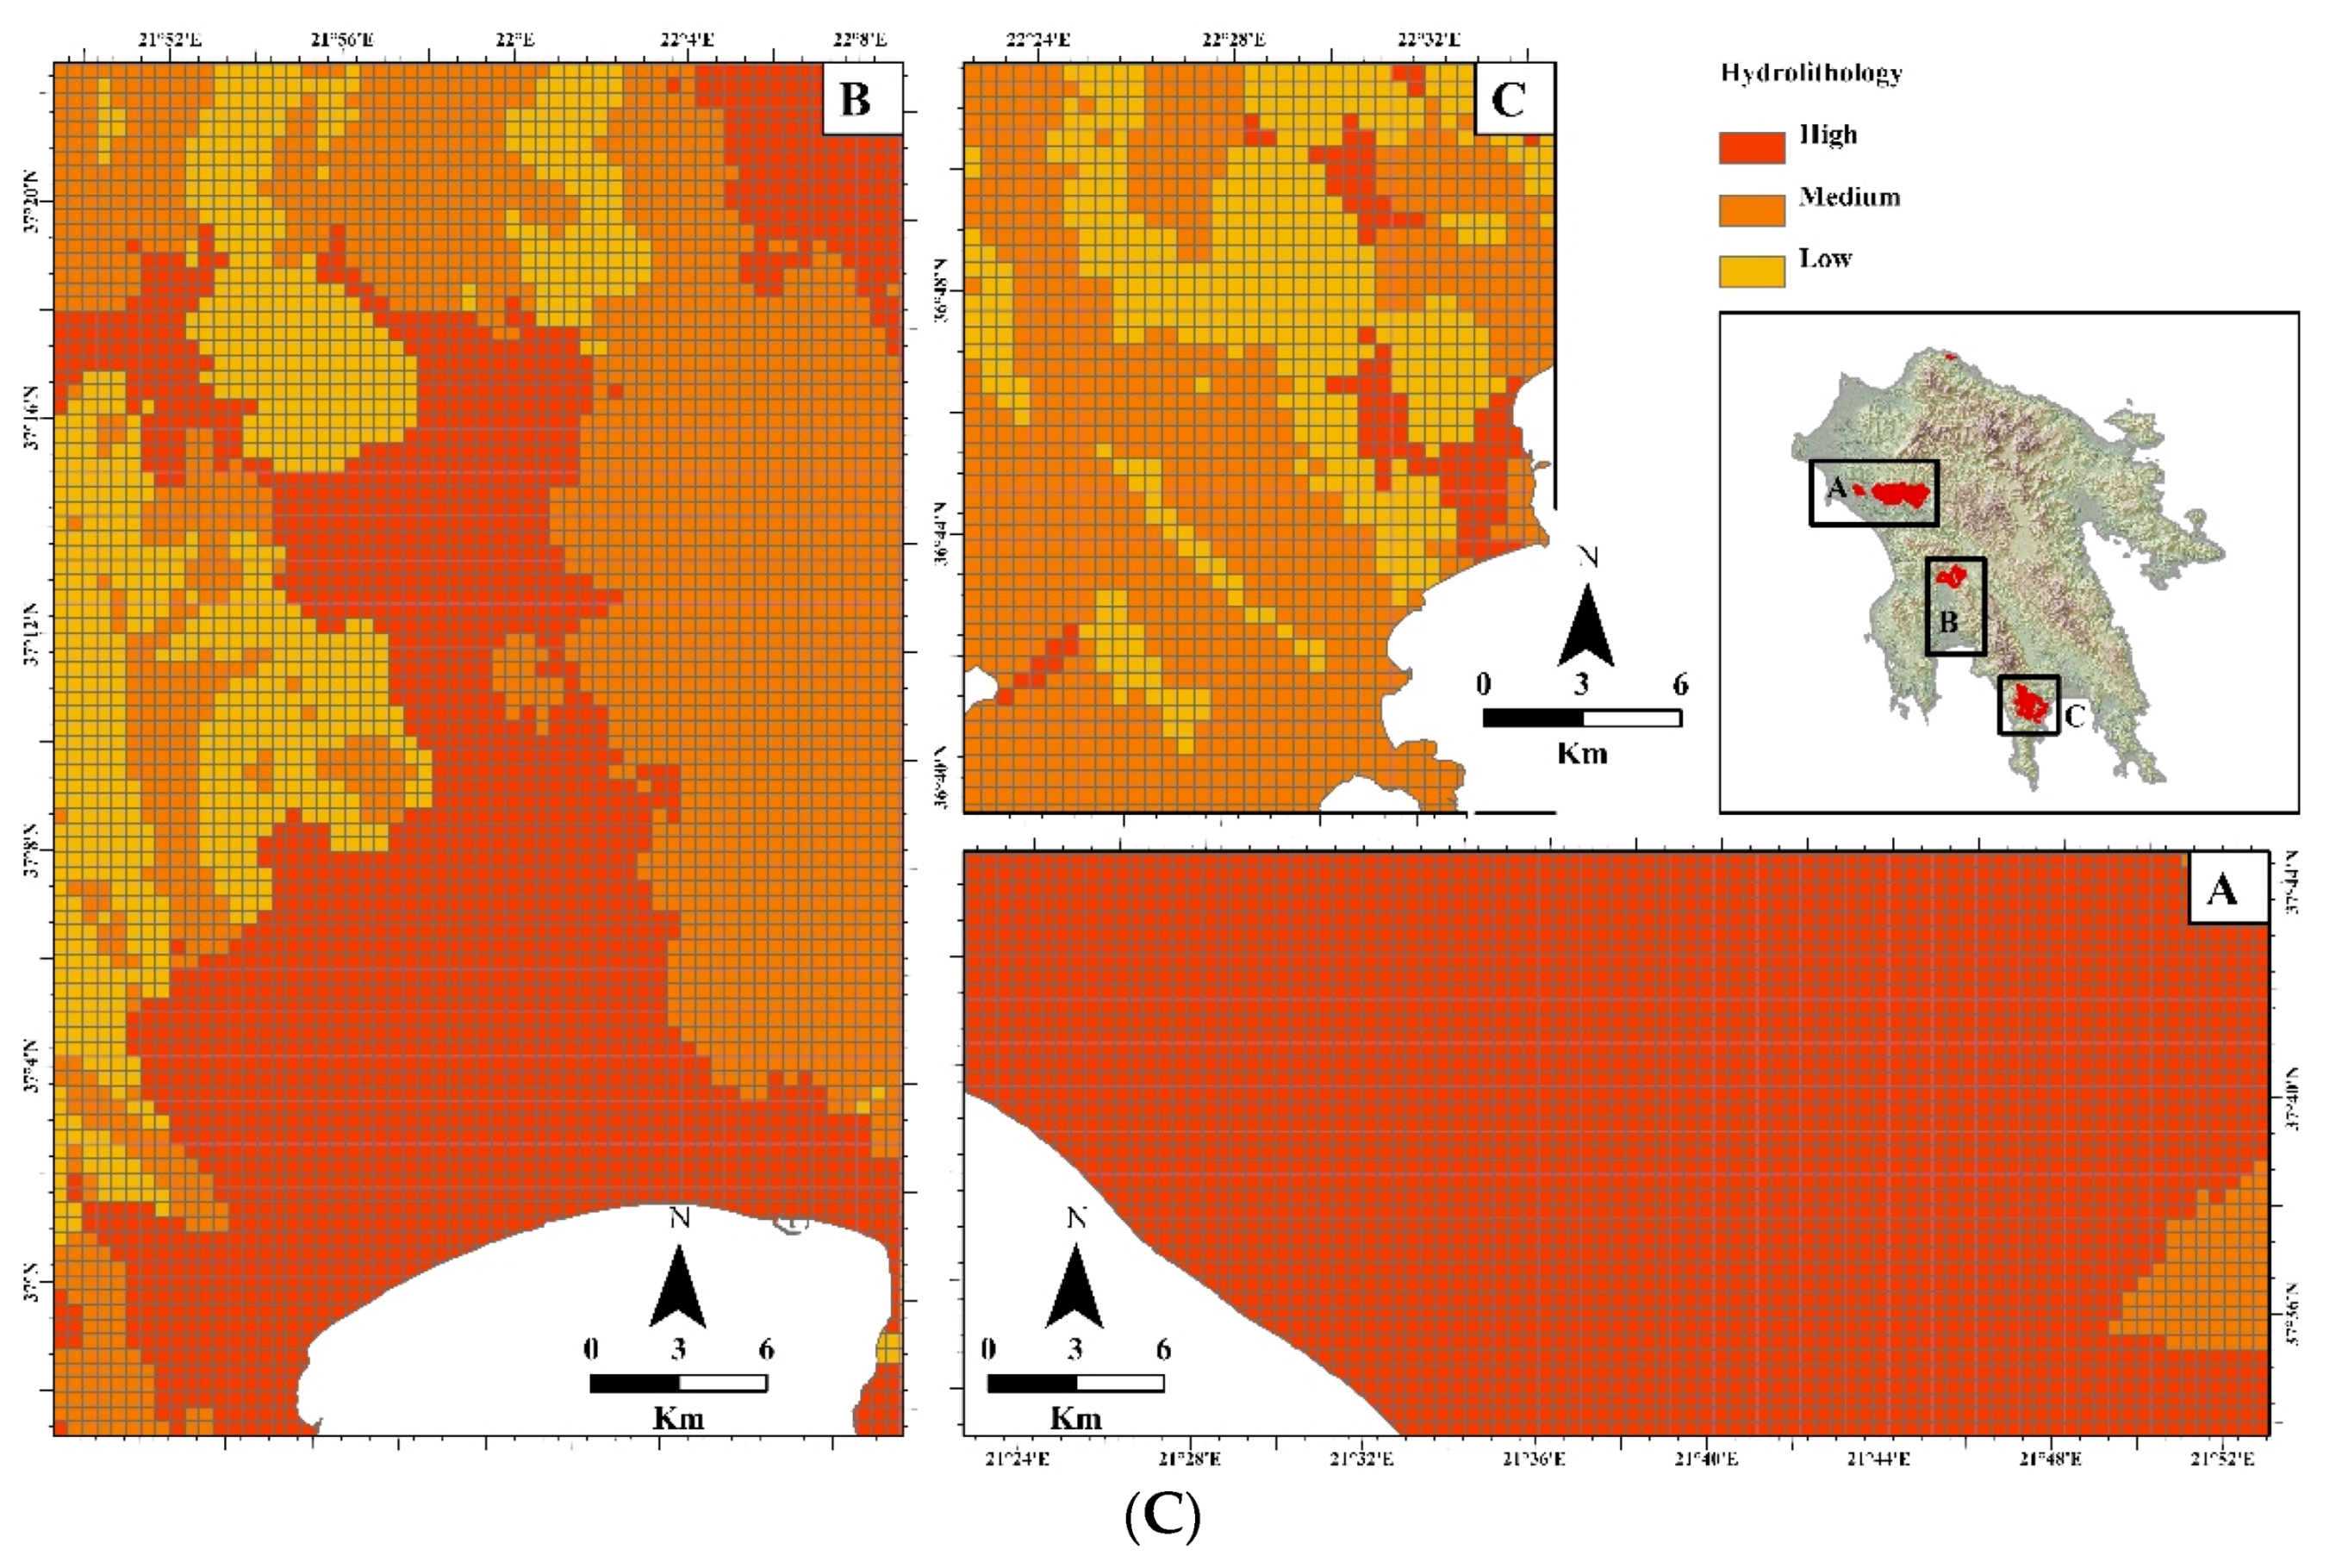
| Hydrolithology | Low–High | High | Very High | |
Disclaimer/Publisher’s Note: The statements, opinions and data contained in all publications are solely those of the individual author(s) and contributor(s) and not of MDPI and/or the editor(s). MDPI and/or the editor(s) disclaim responsibility for any injury to people or property resulting from any ideas, methods, instructions or products referred to in the content. |
© 2022 by the authors. Licensee MDPI, Basel, Switzerland. This article is an open access article distributed under the terms and conditions of the Creative Commons Attribution (CC BY) license (https://creativecommons.org/licenses/by/4.0/).
Share and Cite
Evelpidou, N.; Tzouxanioti, M.; Spyrou, E.; Petropoulos, A.; Karkani, A.; Saitis, G.; Margaritis, M. GIS-Based Assessment of Fire Effects on Flash Flood Hazard: The Case of the Summer 2021 Forest Fires in Greece. GeoHazards 2023, 4, 1-22. https://doi.org/10.3390/geohazards4010001
Evelpidou N, Tzouxanioti M, Spyrou E, Petropoulos A, Karkani A, Saitis G, Margaritis M. GIS-Based Assessment of Fire Effects on Flash Flood Hazard: The Case of the Summer 2021 Forest Fires in Greece. GeoHazards. 2023; 4(1):1-22. https://doi.org/10.3390/geohazards4010001
Chicago/Turabian StyleEvelpidou, Niki, Maria Tzouxanioti, Evangelos Spyrou, Alexandros Petropoulos, Anna Karkani, Giannis Saitis, and Markos Margaritis. 2023. "GIS-Based Assessment of Fire Effects on Flash Flood Hazard: The Case of the Summer 2021 Forest Fires in Greece" GeoHazards 4, no. 1: 1-22. https://doi.org/10.3390/geohazards4010001