
GIS-Based Landslide Susceptibility Modelling in Urbanized Areas: A Case Study of the Tri-City Area of Poland


Abstract
:1. Introduction
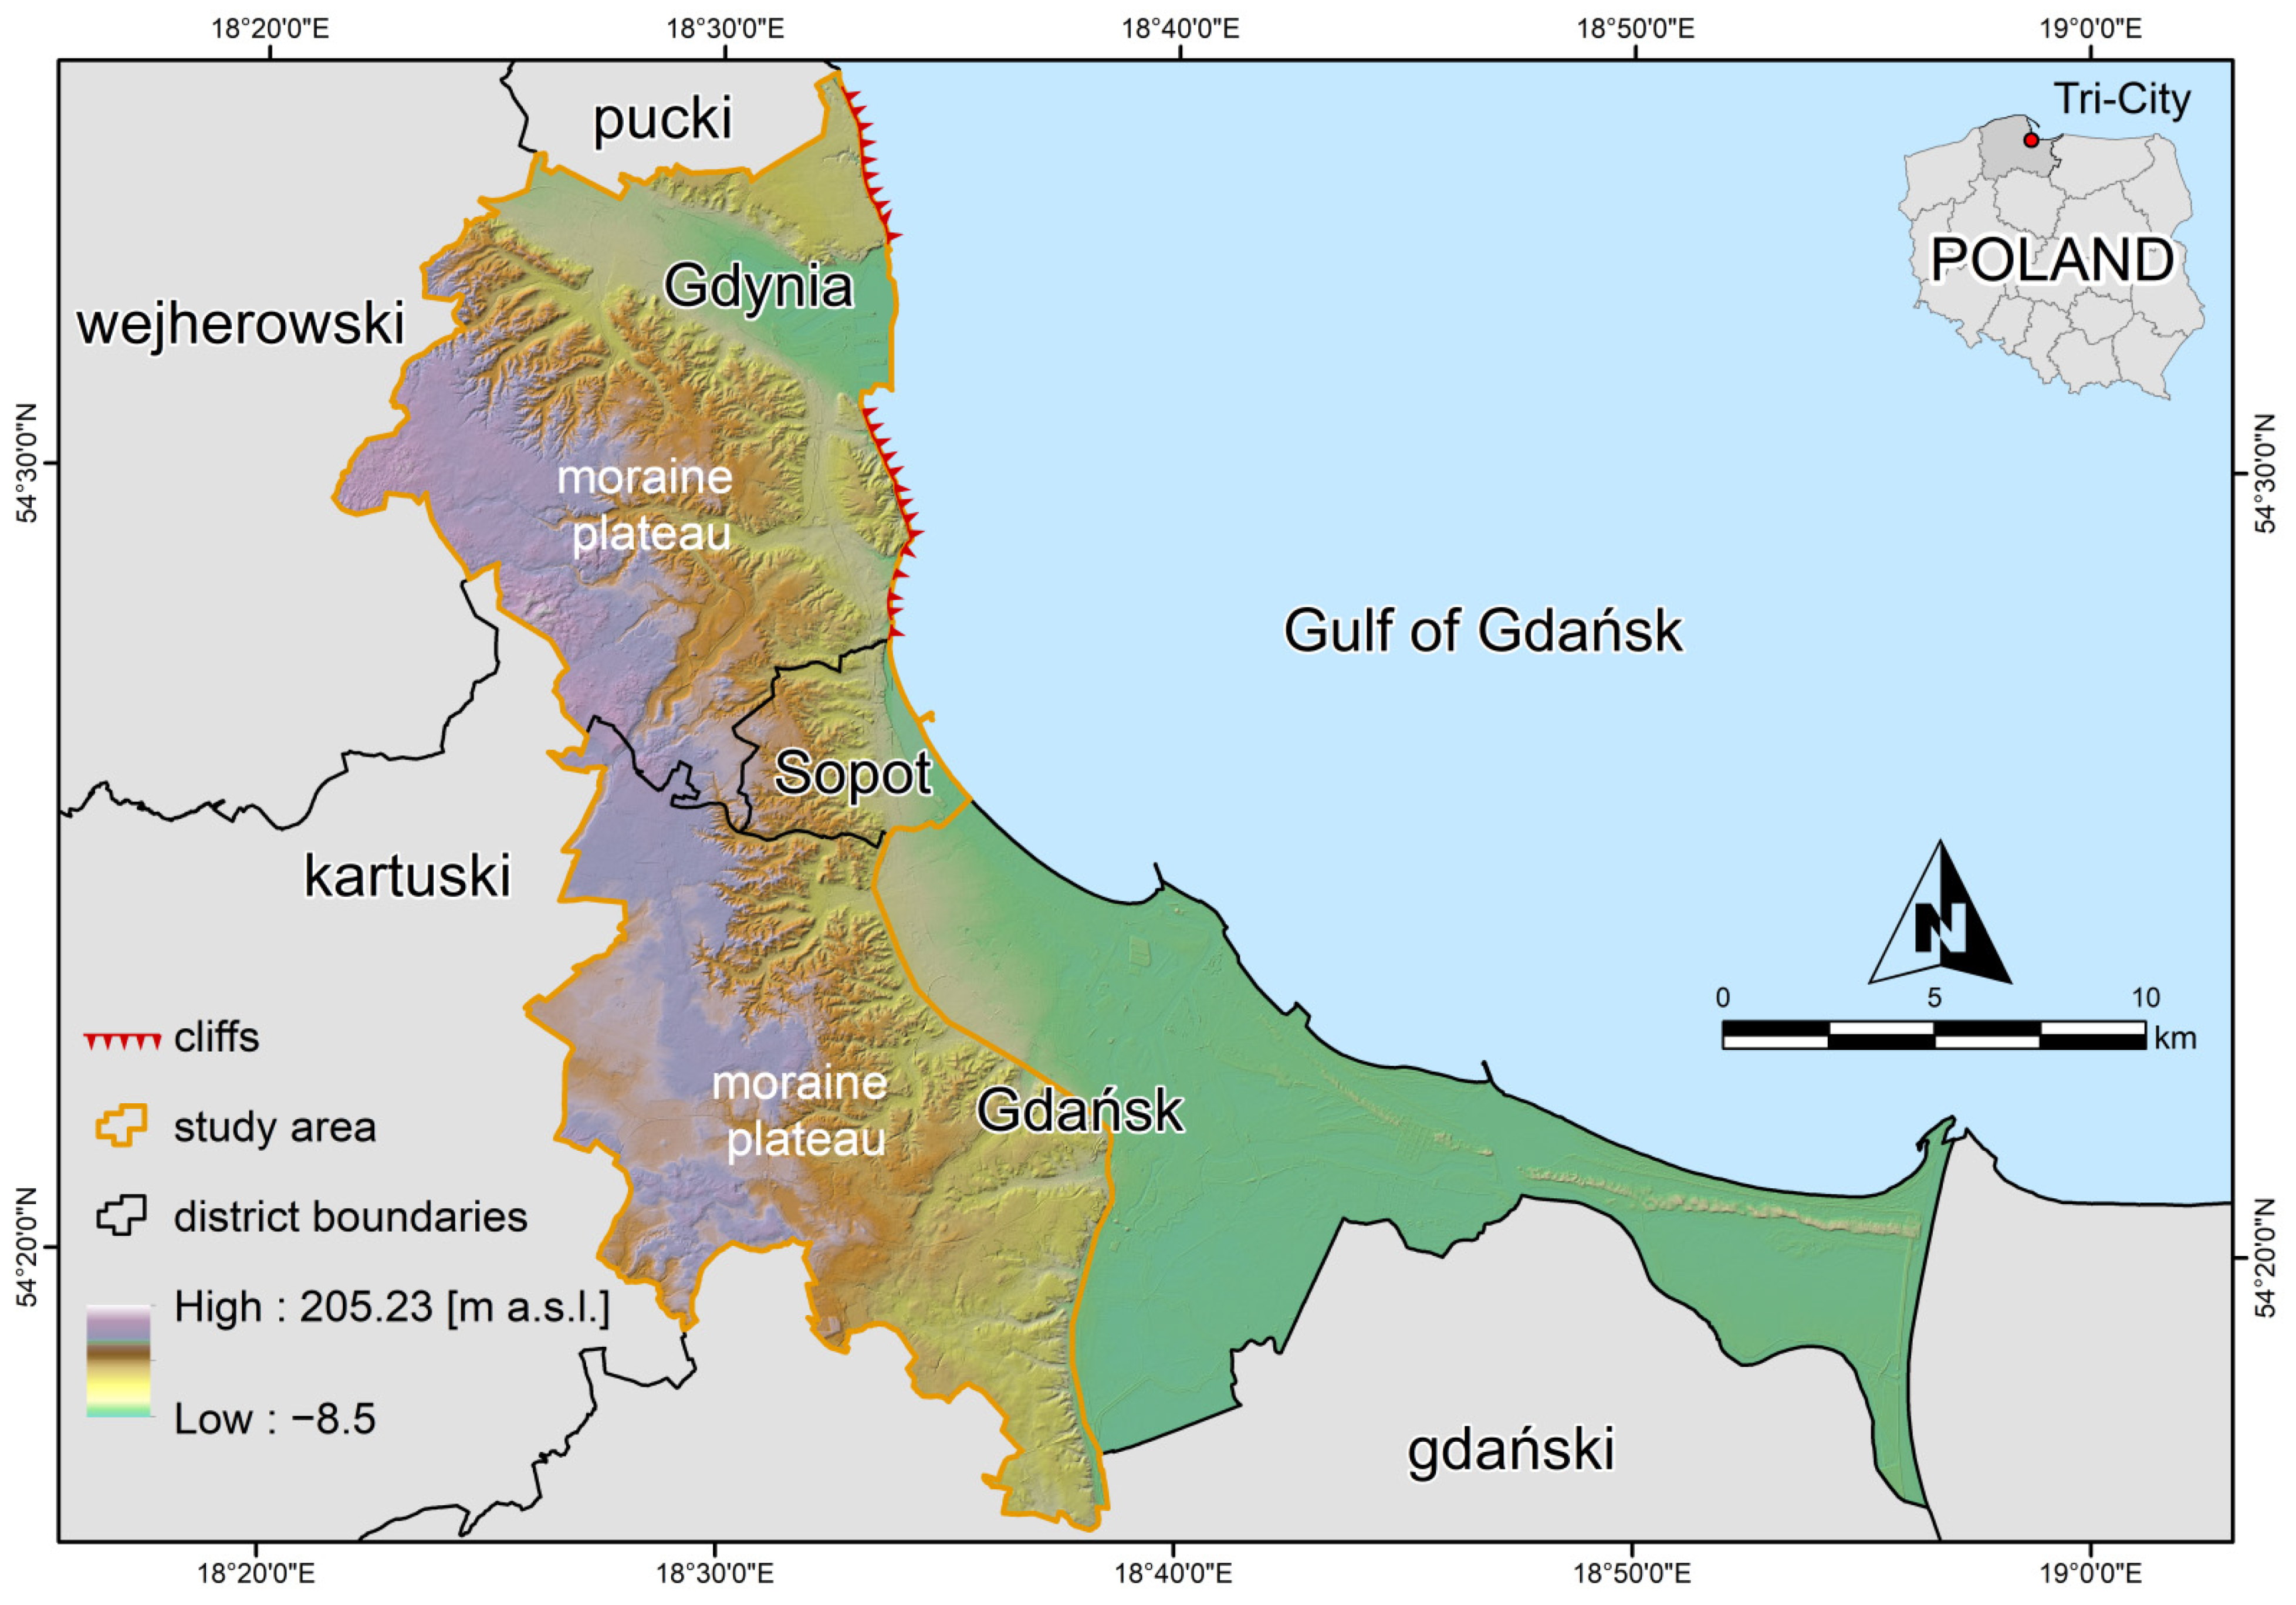
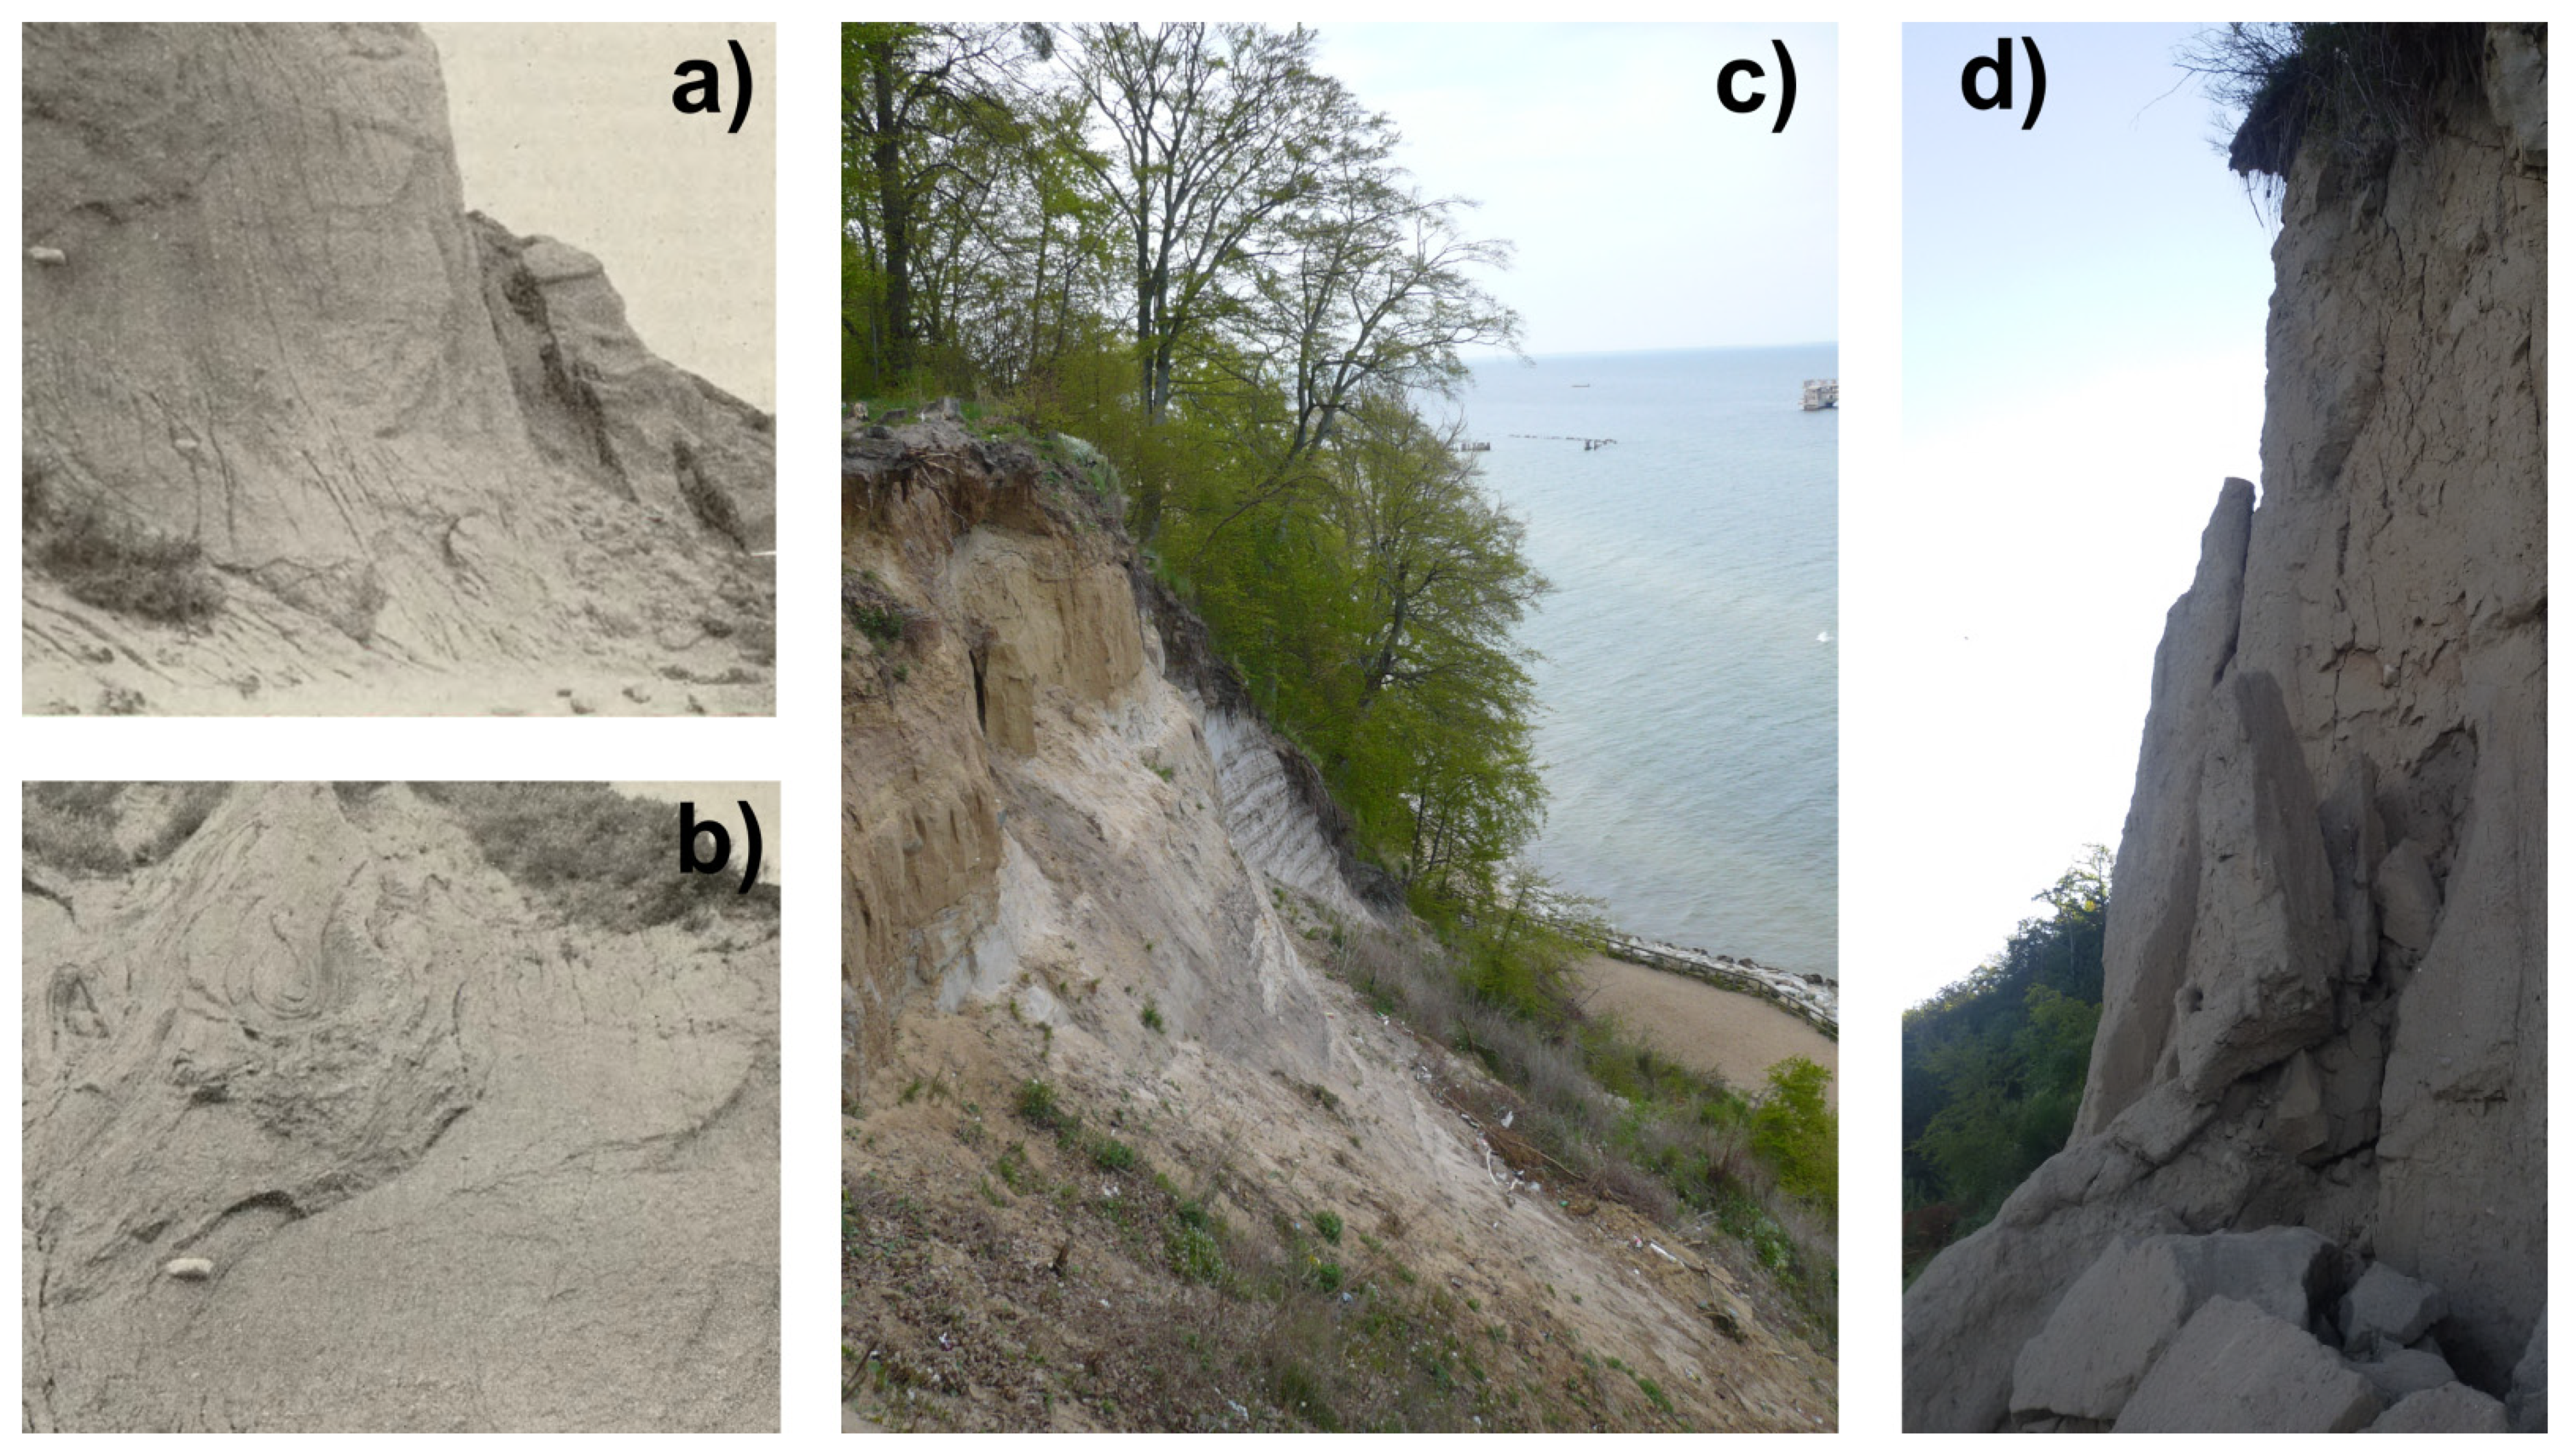
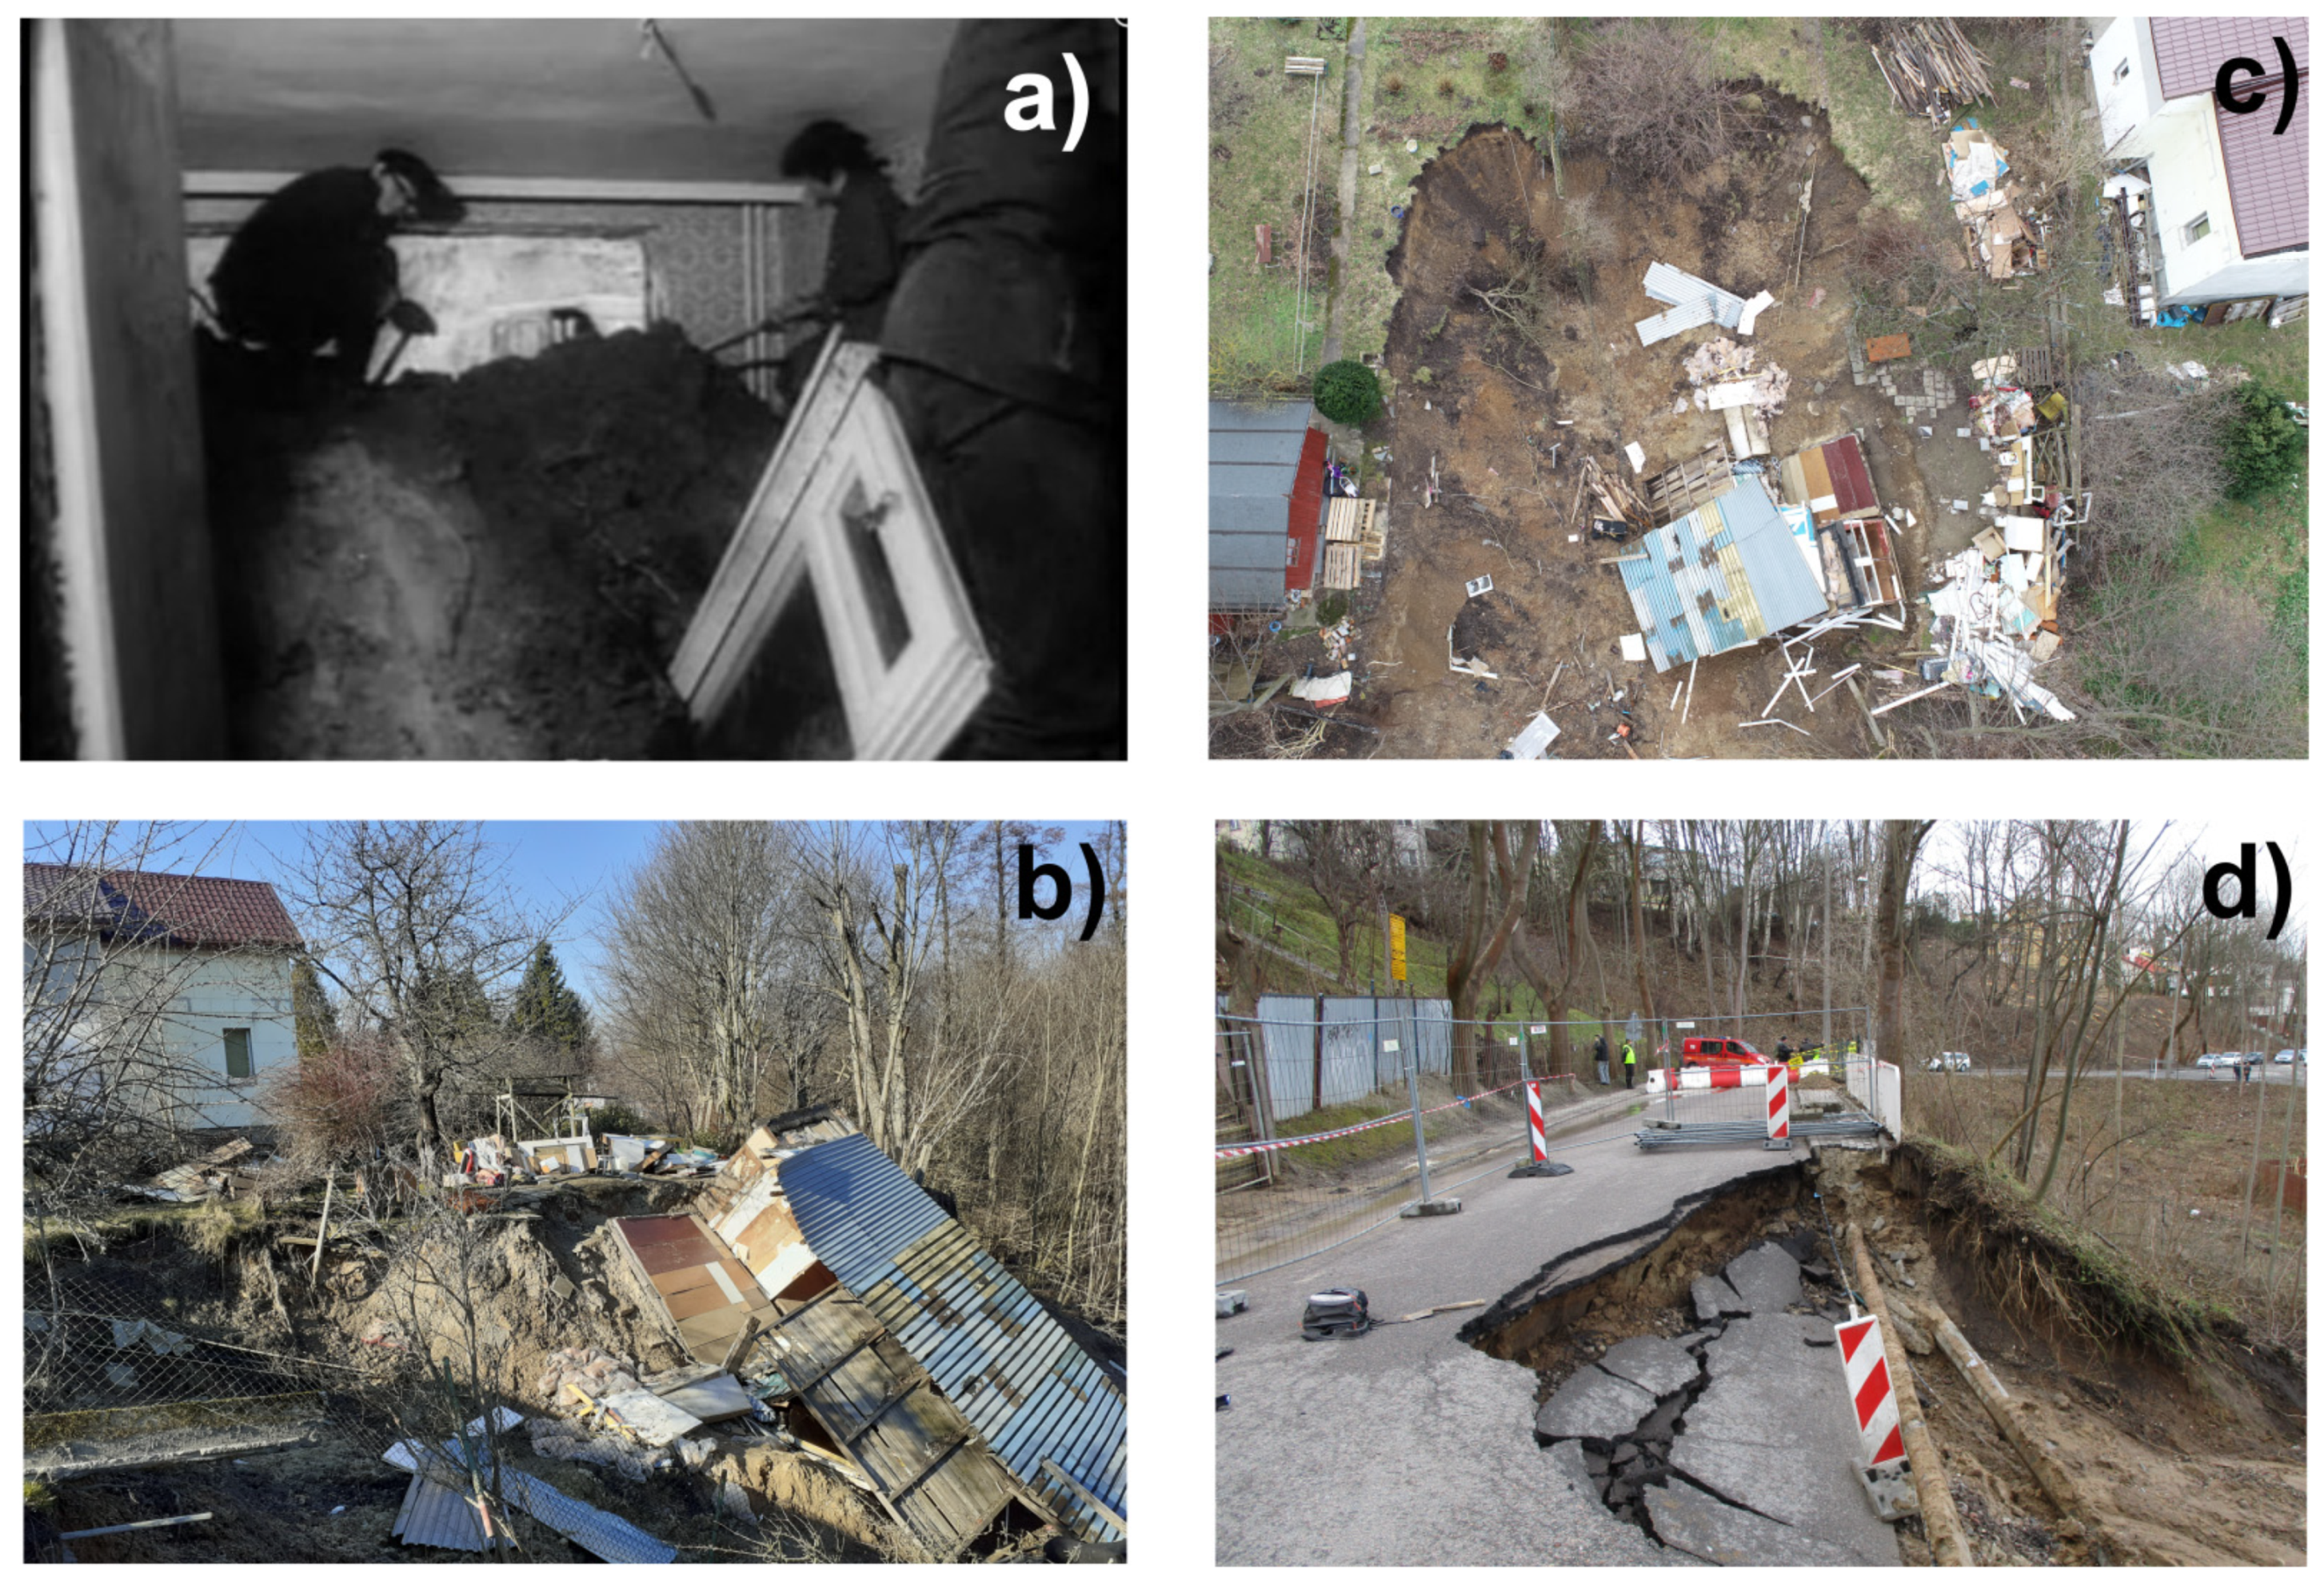
2. Location and General Features of the Study Area
3. Input Data
4. Research Methodology
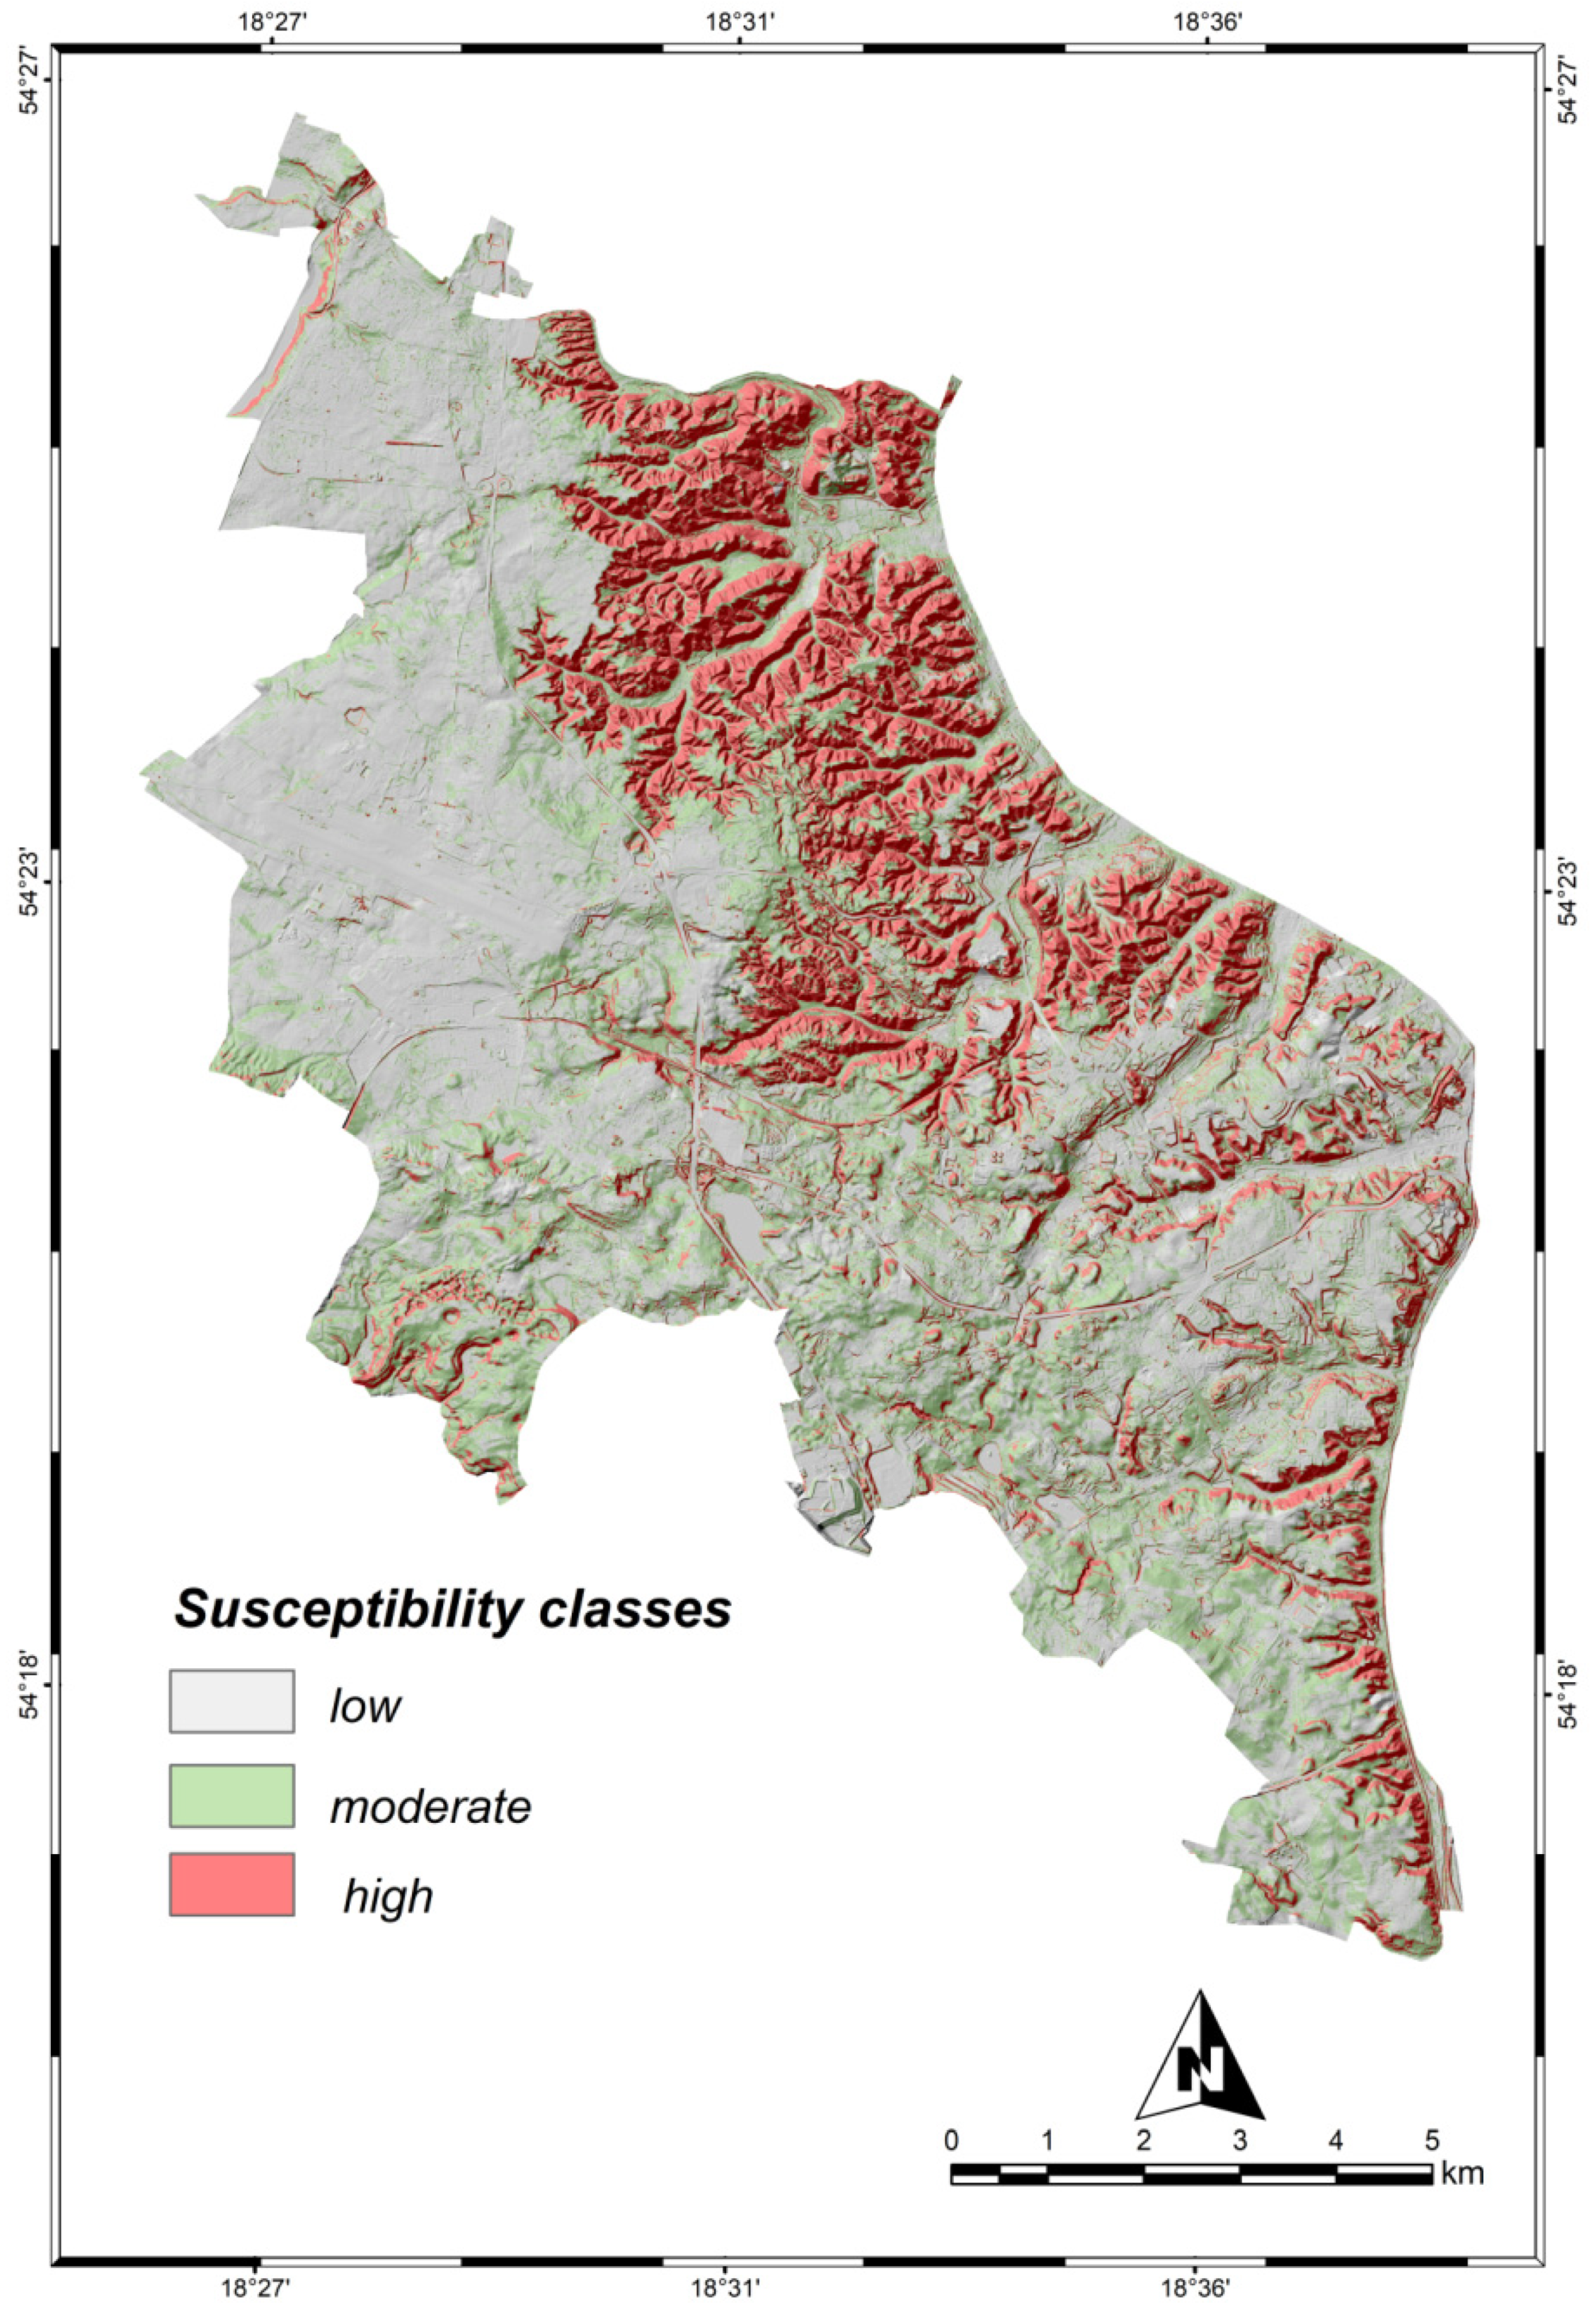
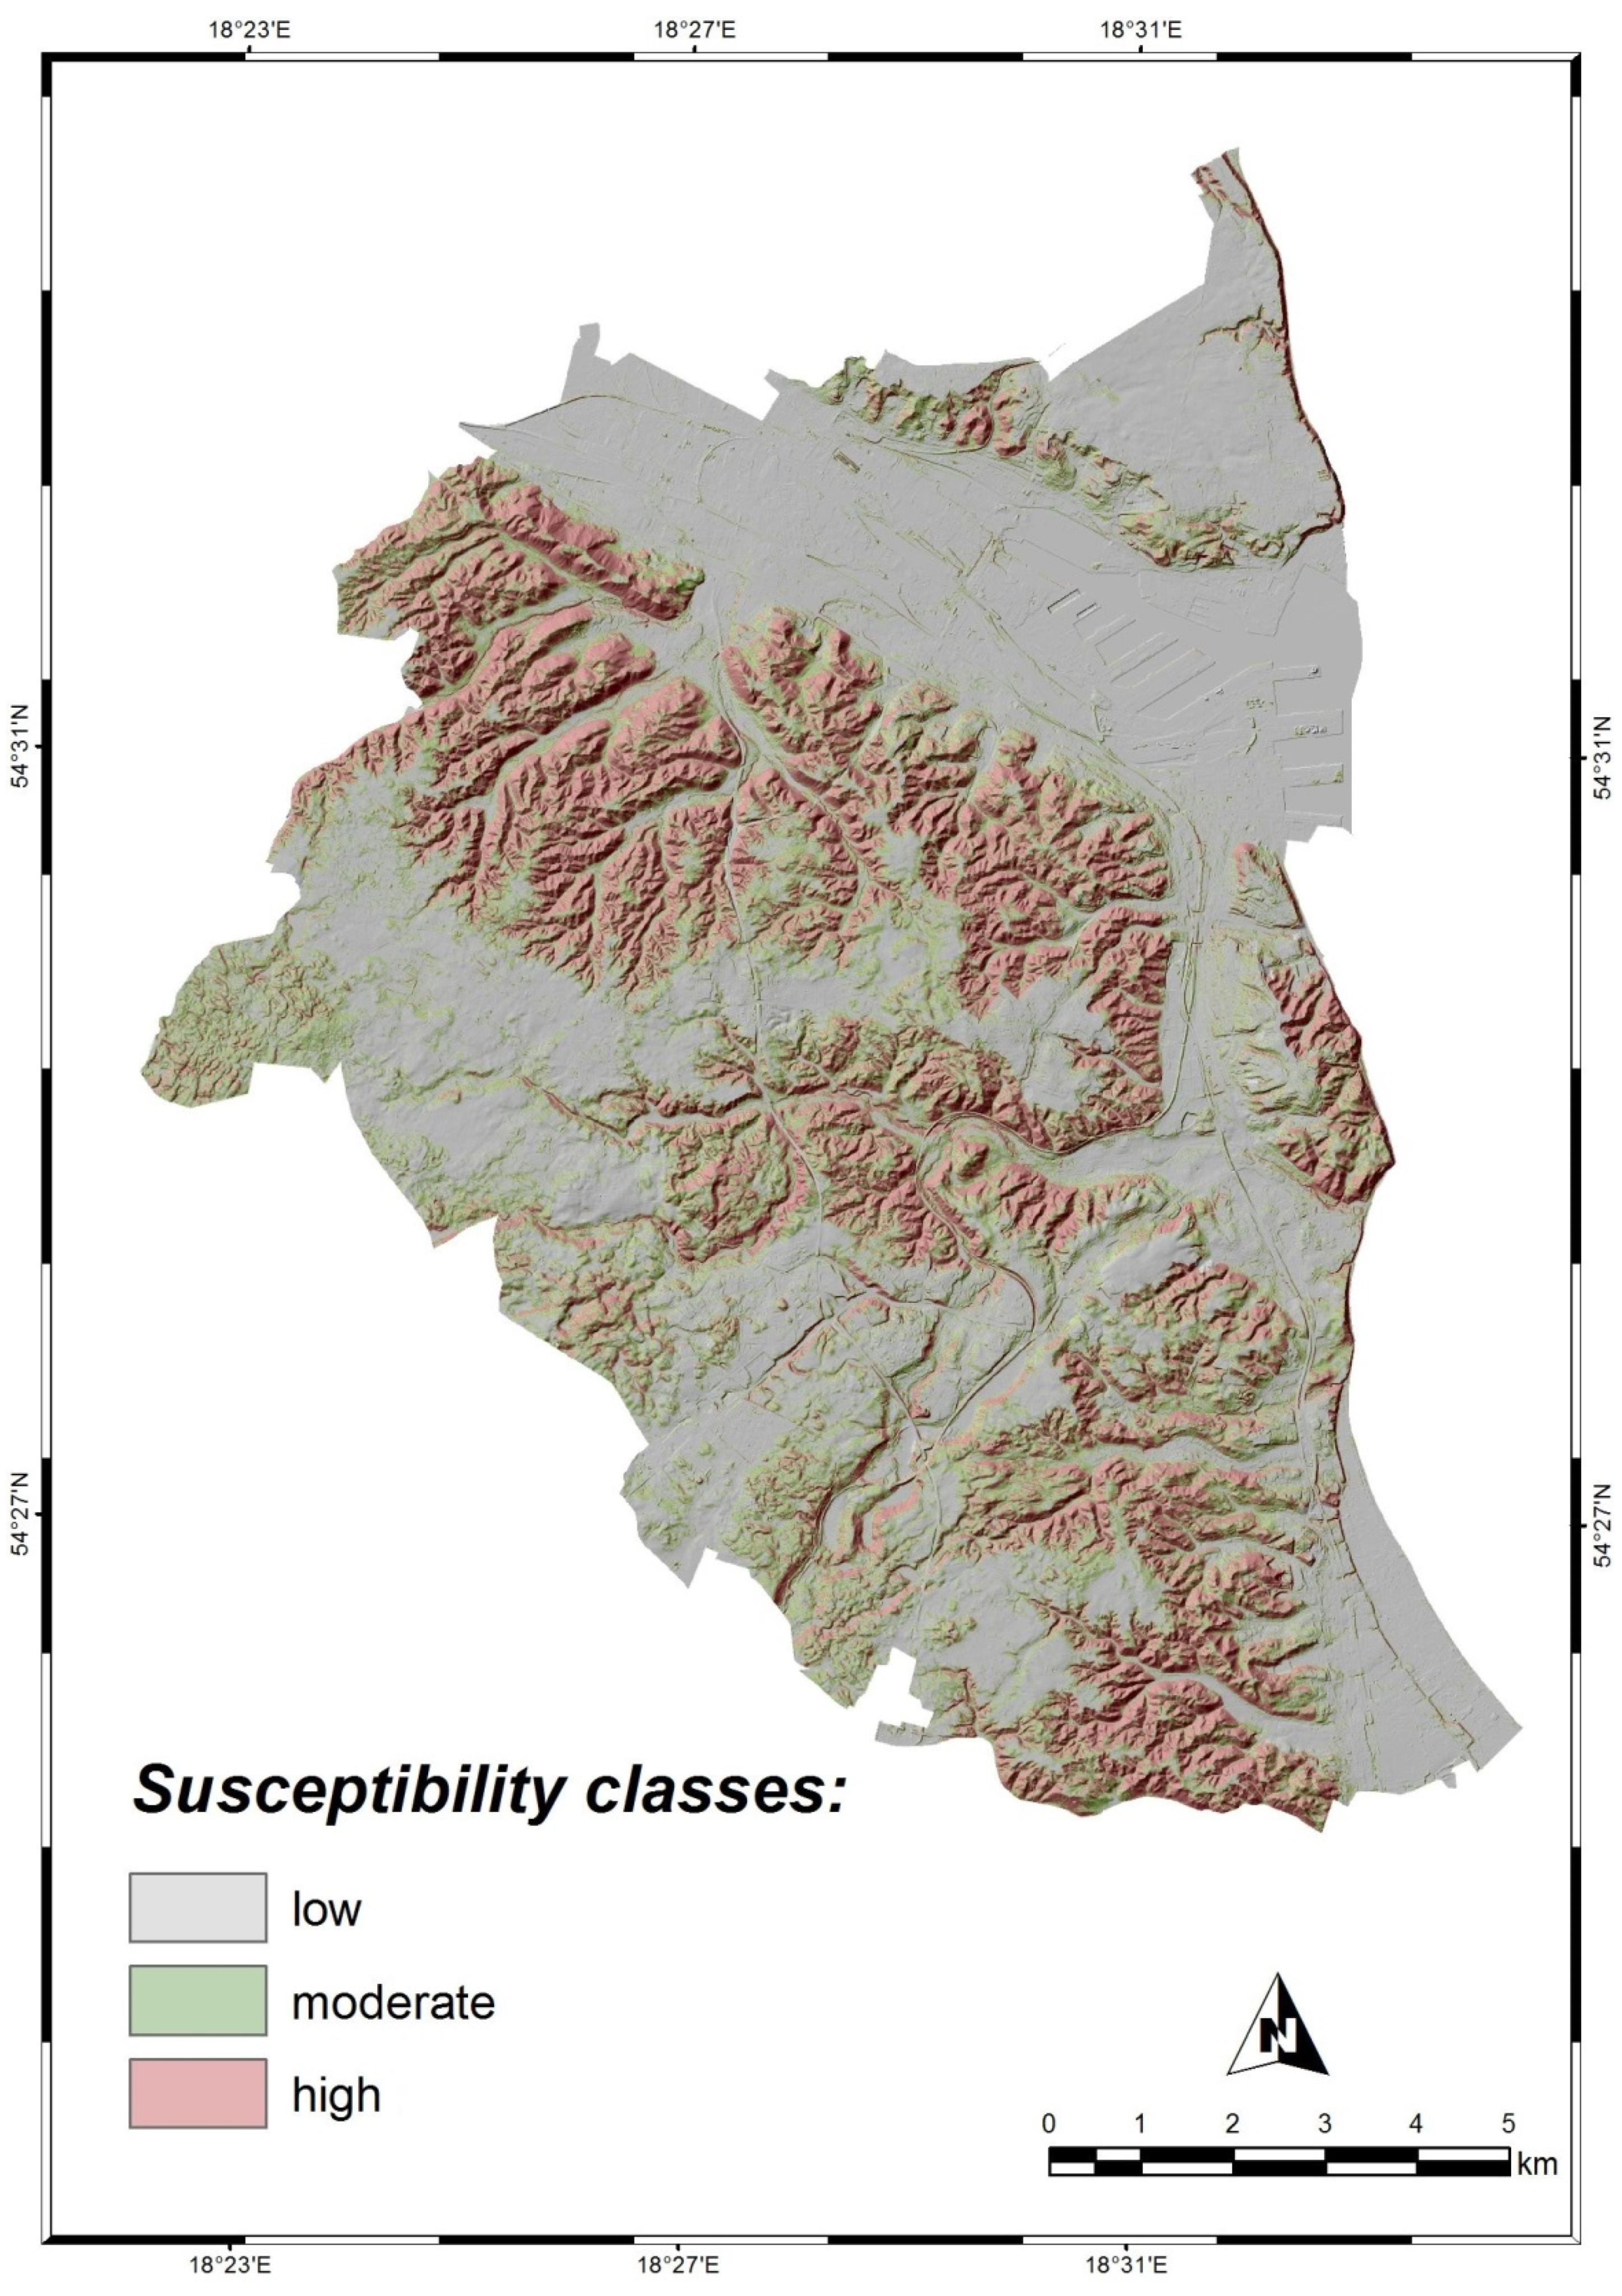
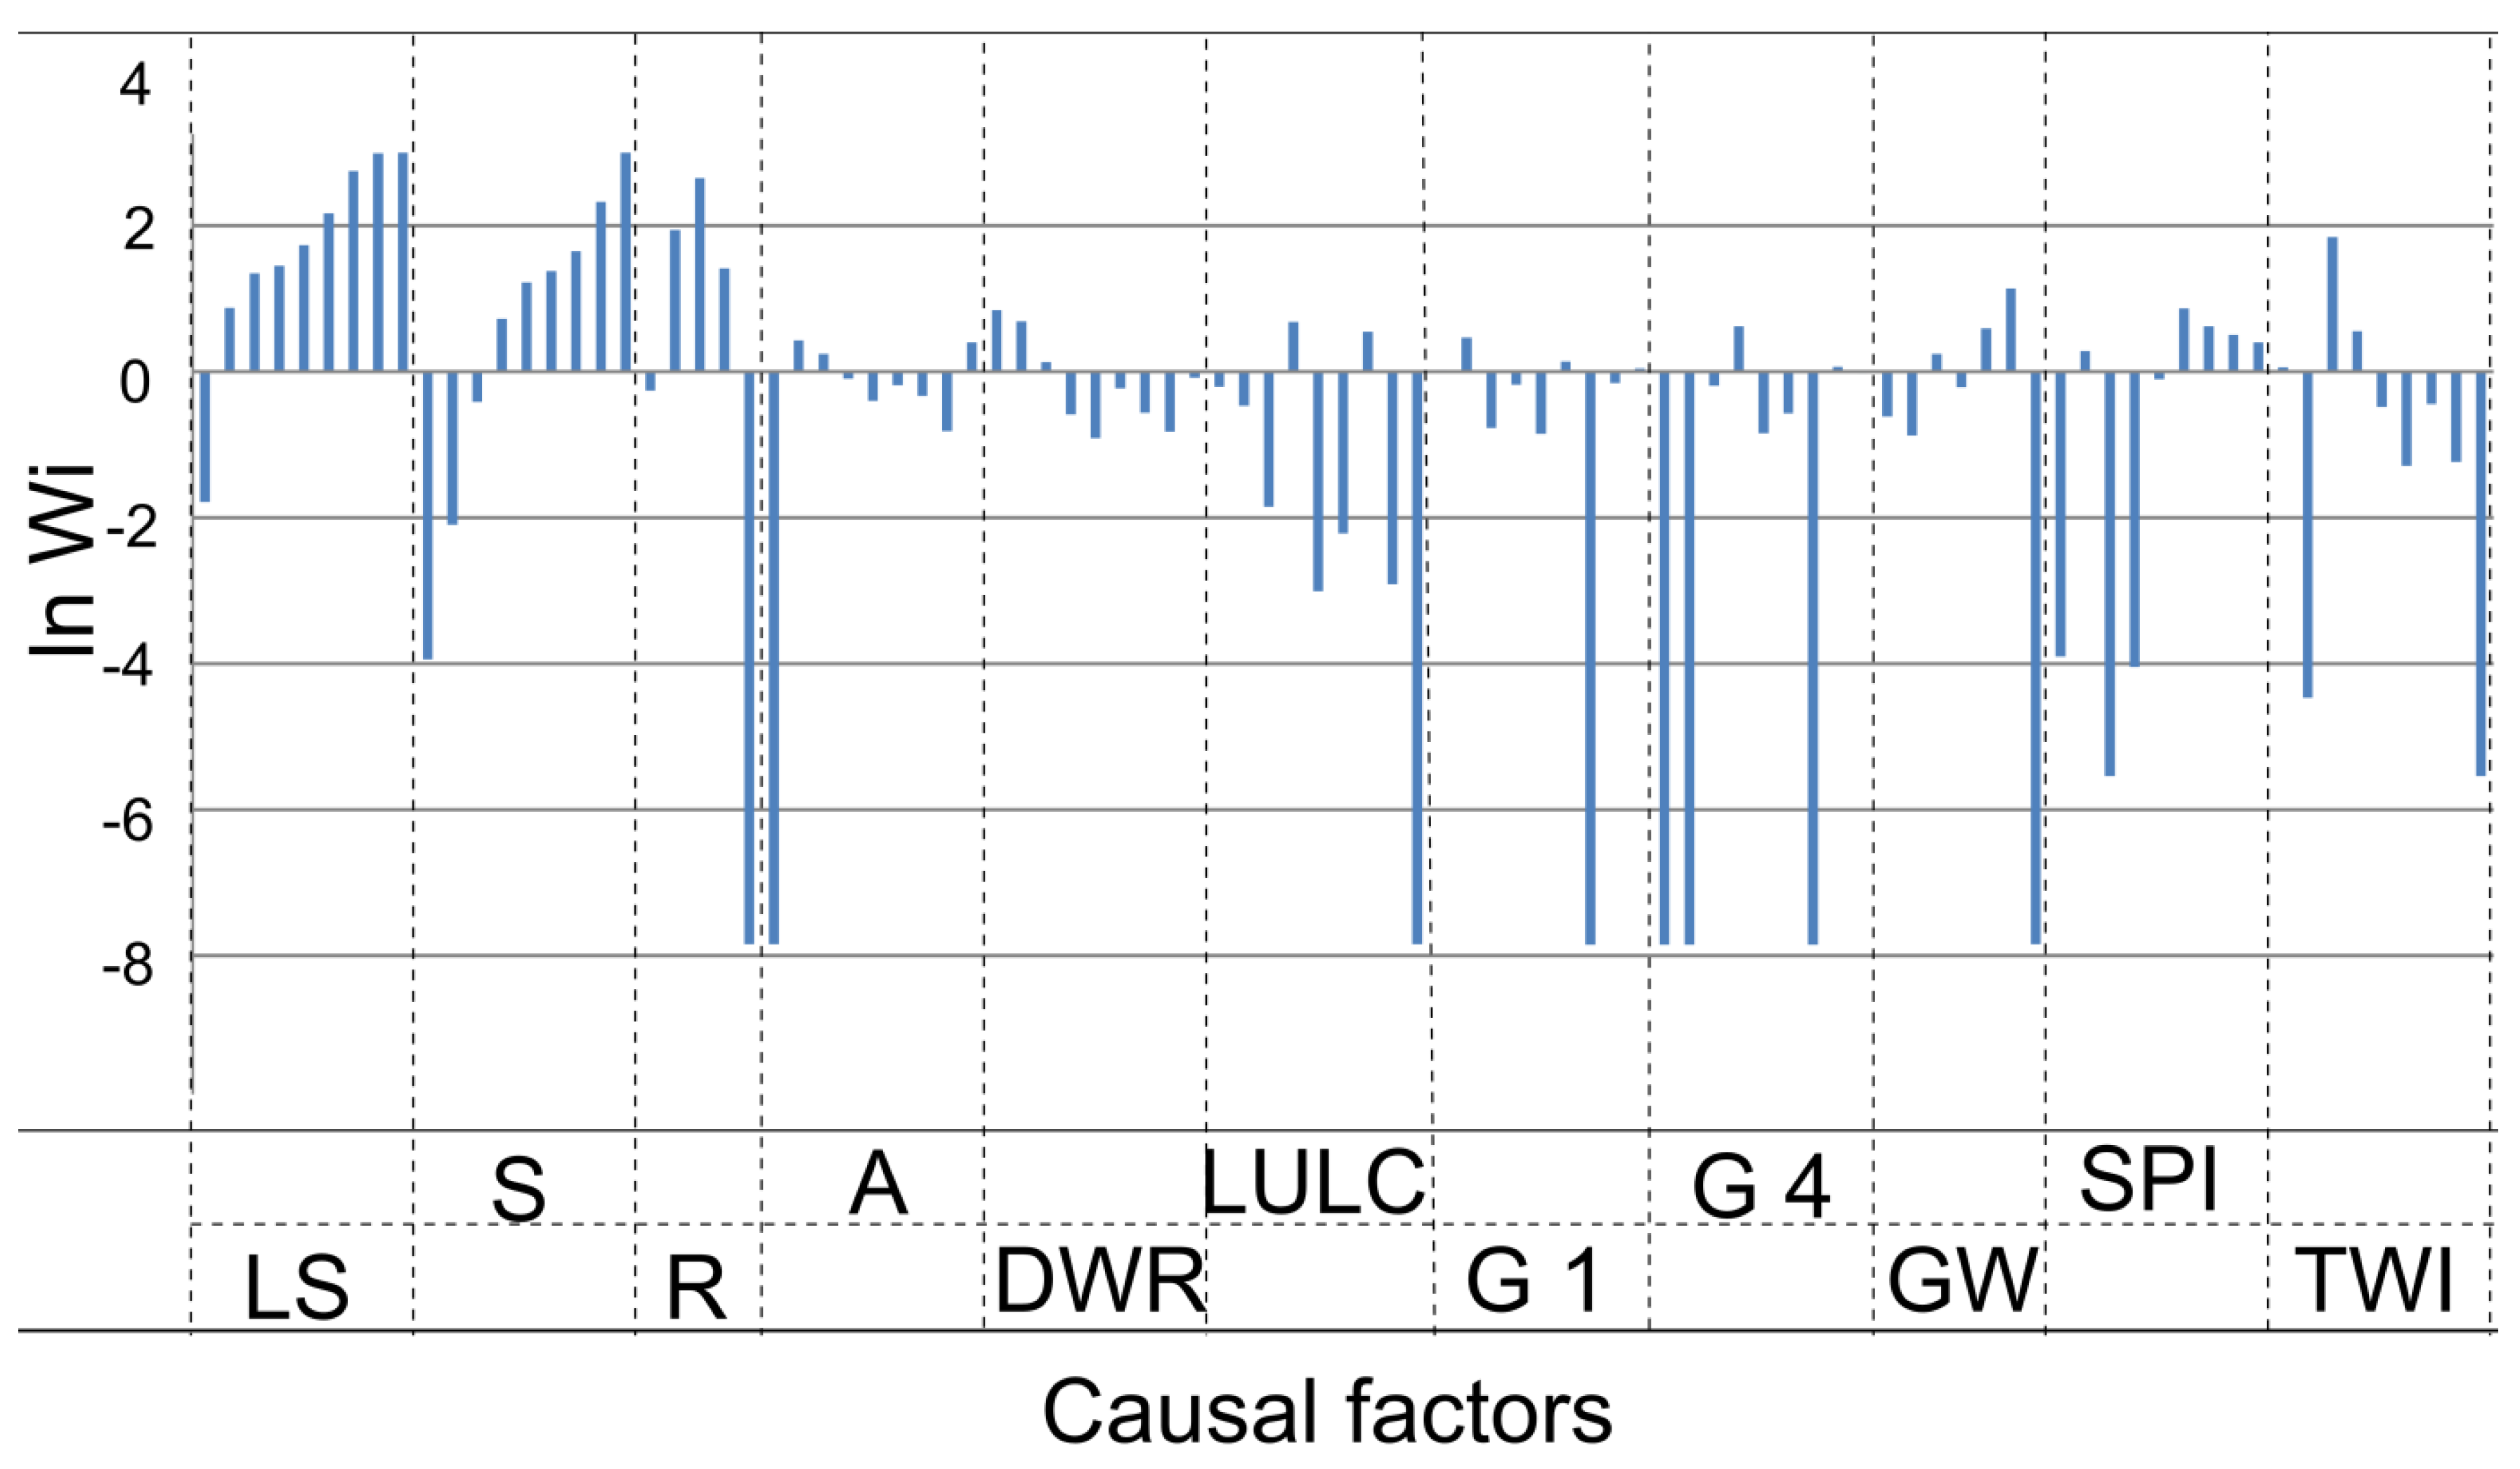
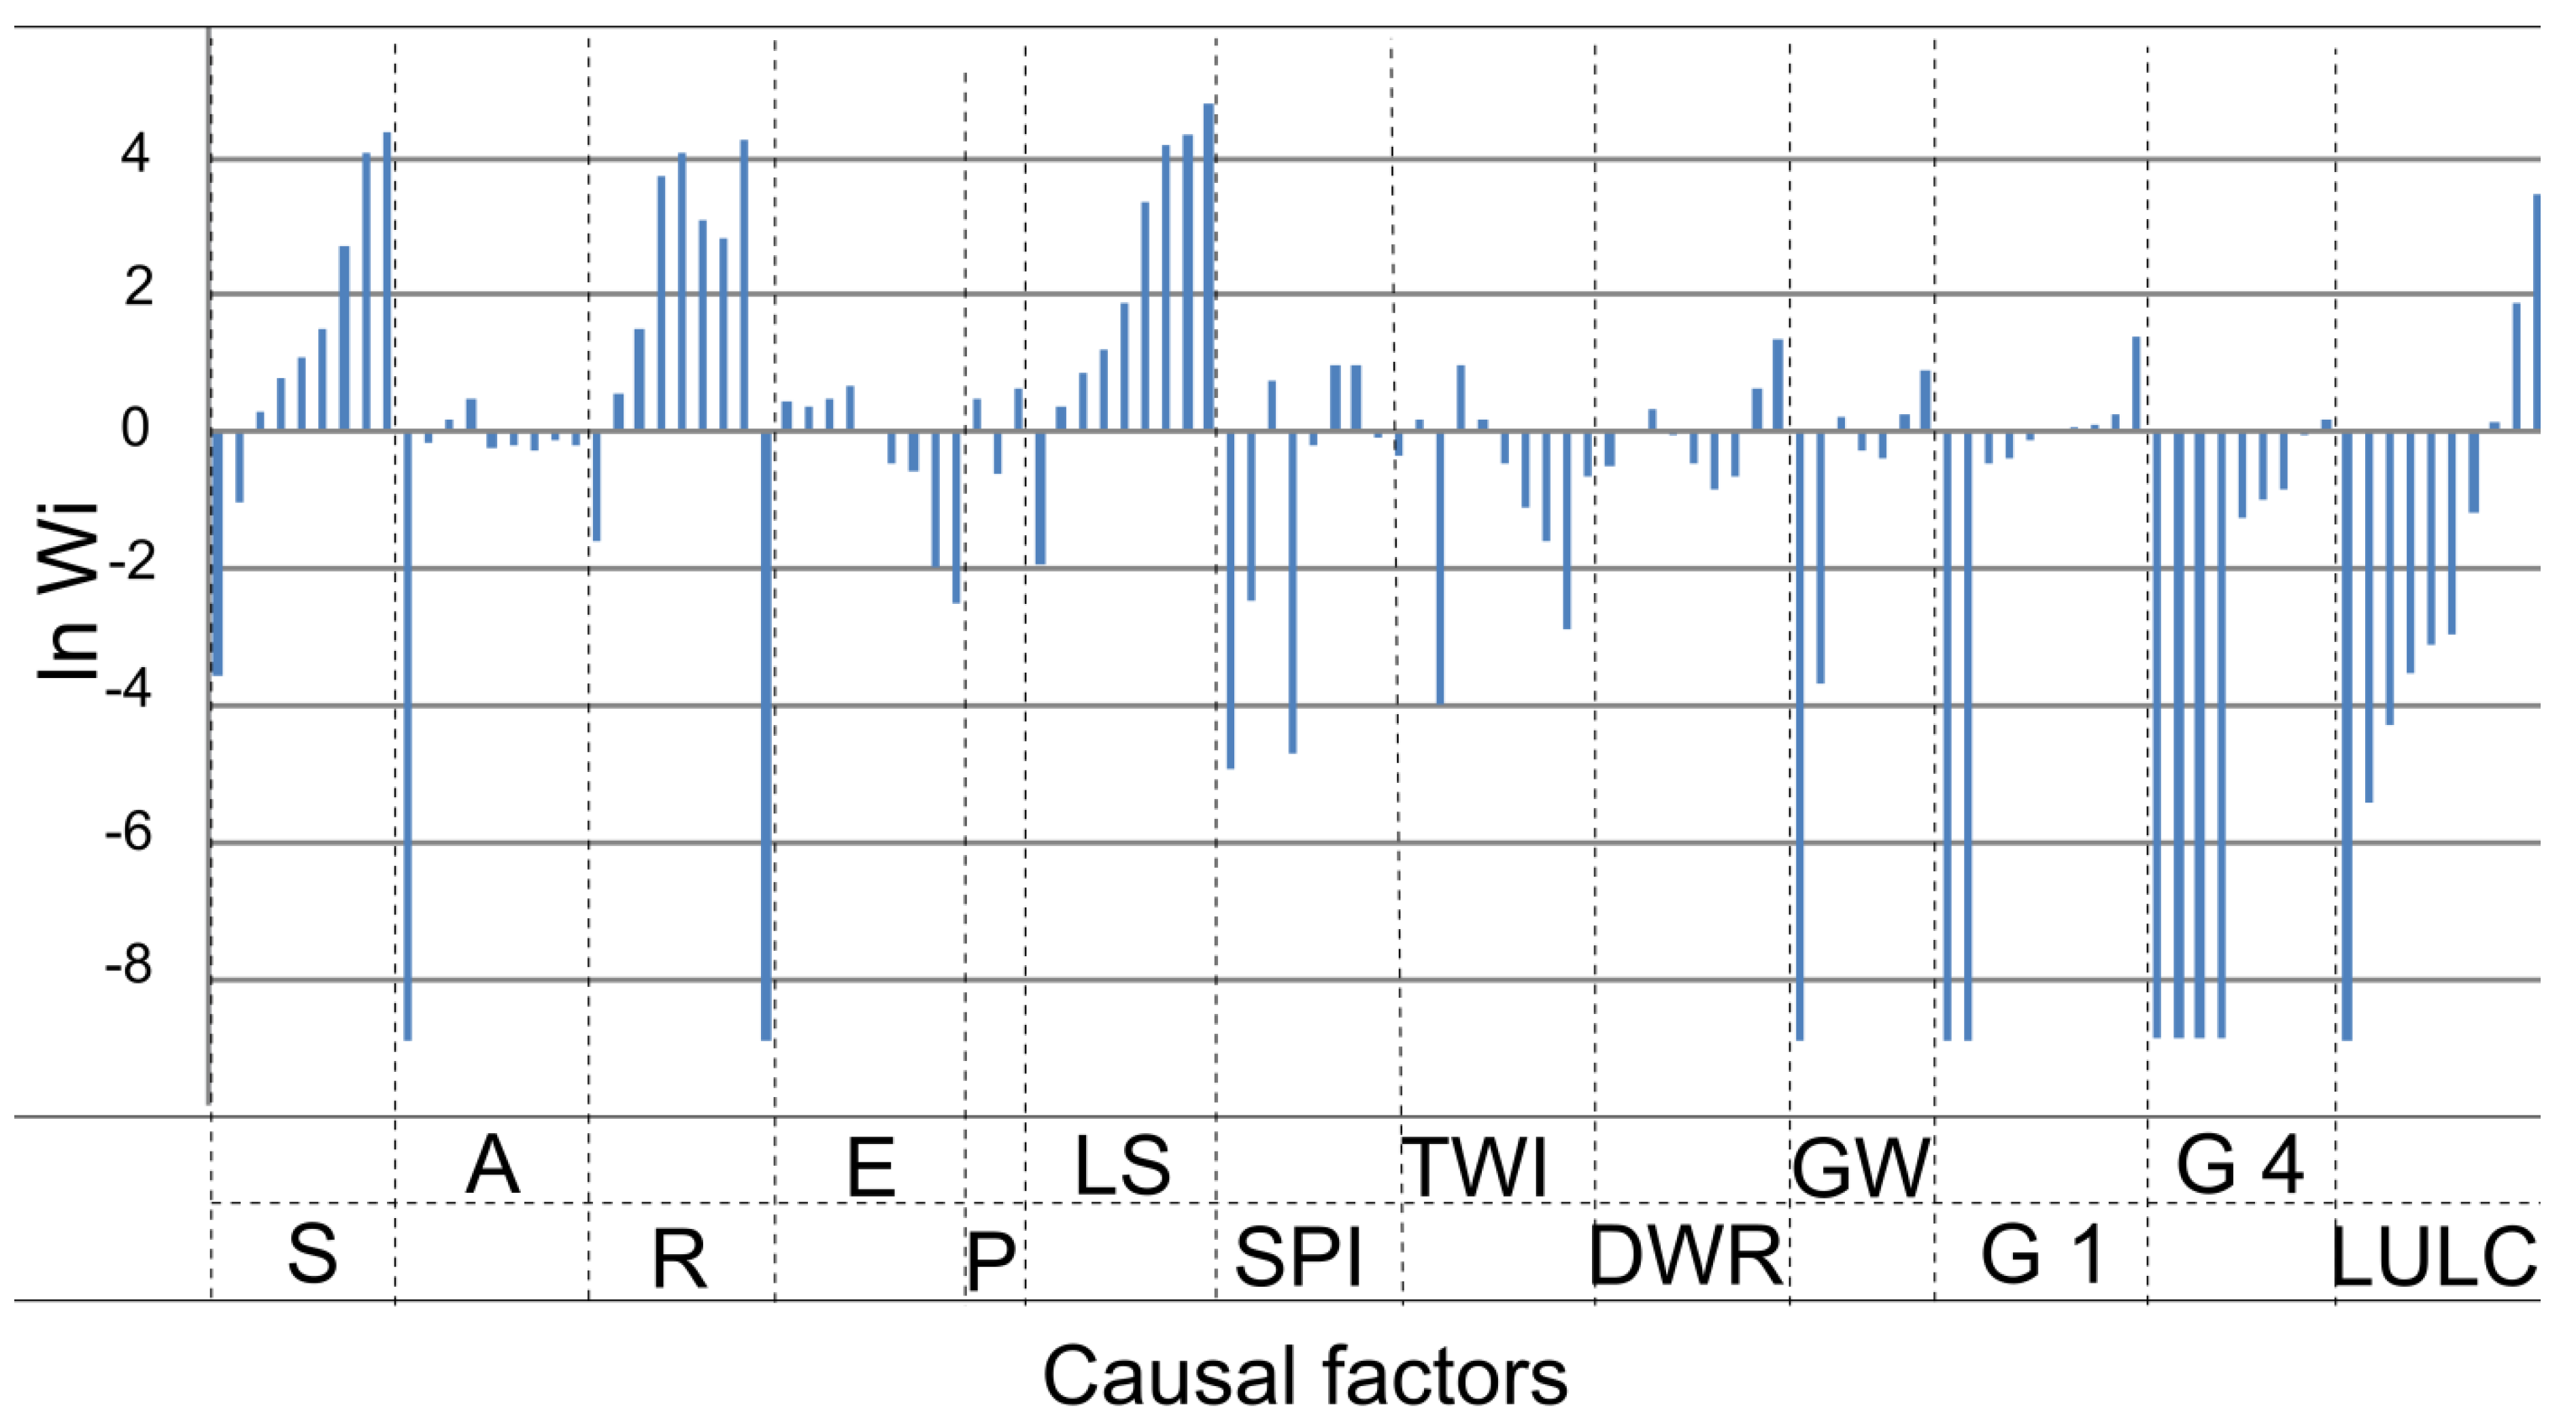
5. Results
6. Discussion
7. Conclusions
Funding
Data Availability Statement
Acknowledgments
Conflicts of Interest
References
- Jurys, L.; Uścinowicz, G.; Małka, A.; Szarafin, T.; Zaleszkiewicz, L.; Pączek, U.; Frydel, J.; Kawęcka, J.; Przeździecki, P. Identyfikacja zagrożen wywołanych ruchami masowymi w przestrzeni zurbanizowanej na przykładzie map osuwisk Gdanska i Gdyni. Gór. Odkryw. 2014, 2–3, 116–126, (In Polish with English summary). [Google Scholar]
- Frydel, J.; Mil, L.; Jurys, L.; Maszloch, E.; Tobojko, L.; Karwacki, K. Protokół Obserwacji z Monitoringu 3 Osuwisk Zlokalizowanych w Gdansku Przy ul. Malczewskiego, ul. Oginskiego oraz ul. Stromej, PGI NRI; National Geological Archives: Gdansk, Poland, 2021. [Google Scholar]
- Jurys, L.; Frydel, J.; Kaulbarsz, D.; Małka, A.; Pączek, U.; Szarafin, T.; Woźniak, T.; Zaleszkiewicz, L. Rejestr Osuwisk i Terenów Zagrożonych Ruchami Masowymi Ziemi w Skali 1:10 000 dla Terenu Miasta Gdanska. Register of Landslides and Areas Prone to Mass Movements with a Scale of 1: 10,000 for the City of Gdansk. 2011. Available online: https://download.cloudgdansk.pl/gdansk-pl/d/20121143147/rejestr-osuwisk-i-terenow-zagrozonych-ruchami-masowymi-ziemi-dla-terenu-miasta-gdanska.pdf (accessed on 23 August 2022). (In Polish).
- Jurys, L.; Małka, A.; Pączek, U.; Szarafin, T. Rejestr Osuwisk i Terenów Zagrożonych Ruchami Masowymi Ziemi w Skali 1:10,000 dla Terenu Miasta Gdyni. Register of Landslides and Areas Prone to Mass Movements with a Scale of 1: 10,000 for the City of Gdynia. 2012. Available online: http://geoportal.pgi.gov.pl/ (accessed on 23 August 2022). (In Polish)
- Szarafin, T.; Małka, A.; Jurys, L.; Frydel, J. Map of Landslides and Risk Areas for the City of Gdynia, in Scale 1:10,000. PGI–NRI. 2015. Available online: http://osuwiska.pgi.gov.pl/ (accessed on 23 August 2022). (In Polish)
- Małka, A. Modelowanie podatności osuwiskowej z zastosowaniem metody indeksowej i wysokorozdzielczych danych z lotniczego skaningu laserowego (LIDAR) na obszarze Gdanska. Przegląd Geol. 2015, 63, 301–311, (In Polish with English summary). [Google Scholar]
- Małka, A. Landslide Susceptibility Mapping in Urbanised Areas using Geographic Information System–Based Statistical Models: A Case Study of Gdynia, Poland. Nat. Hazards 2021, 107, 639–674. [Google Scholar] [CrossRef]
- Sultana, N.; Tan, S. Landslide mitigation strategies in southeast Bangladesh: Lessons learned from the institutional responses. Int. J. Disaster Risk Reduct. 2021, 62, 102402. [Google Scholar] [CrossRef]
- Stefanidis, S.; Chatzichristaki, C.; Stefanidis, P. An ArcGIS toolbox for estimation and mapping soil erosion. J. Environ. Prot. Ecol. 2021, 22, 689–696. [Google Scholar]
- Naghibi, S.A.; Hashemi, H.; Pradhan, B. APG: A novel python-based ArcGIS toolbox to generate absence-datasets for geospatial studies. Geosci. Front. 2021, 12, 101232. [Google Scholar] [CrossRef]
- Fell, R.; Corominas, J.; Bonnard, C.; Cascini, L.; Leroi, E.; Savage, W.Z. Guidelines for landslide susceptibility, hazard and risk zoning for land use planning. Eng. Geol. 2008, 102, 85–98. [Google Scholar] [CrossRef] [Green Version]
- Fell, R.; Corominas, J.; Bonnard, C.; Cascini, L.; Leroi, E.; Savage, W.Z. Commentary. Guidelines for landslide susceptibility, hazard and risk zoning for land use planning. Eng. Geol. 2008, 102, 99–111. [Google Scholar] [CrossRef] [Green Version]
- Corominas, J.; van Westen, C.; Frattini, P.; Cascini, L.; Malet, J.P.; Fotopoulou, S.; Catani, F.; van den Eeckhaut, M.; Mavrouli, O.; Agliardi, F.; et al. Recommendations for the quantitative analysis of landslide risk. Bull. Eng. Geol. Environ. 2014, 73, 209–263. [Google Scholar] [CrossRef] [Green Version]
- Van Westen, C.J.; Ranwers, N.; Terlin, M.T.J.; Soeters, R. Prediction of the occurrence of slope instability phenomena through GIS-based hazard zonation. Geol. Rundsch. 1997, 86, 404–414. [Google Scholar] [CrossRef]
- Van Westen, C.J.; Seijmonsbergen, A.C.; Montavani, F. Comparing Landslide Hazard Maps. Nat. Hazards 1999, 20, 137–158. [Google Scholar] [CrossRef]
- Huabin, W.; Gangjun, L.; Weiya, X.; Gonghui, W. GIS-based landslide hazard assessment: An overview. Prog. Phys. Geogr. 2005, 29, 548–567. [Google Scholar] [CrossRef]
- Sarkar, S.; Kanungo, D.P.; Patra, A.K.; Kumar, P. GIS Based Spatial Data analysis for Landslide Susceptibility Mapping. J. Mt. Sci. 2008, 5, 52–62. [Google Scholar] [CrossRef]
- Pourghasemi, H.R.; Moradi, H.R.; Fatemi Aghda, S.M. Landslide susceptibility mapping by binary logistic regression, analytical hierarchy process, and statistical index models and assessment of their performances. Nat. Hazards 2013, 69, 749–779. [Google Scholar] [CrossRef]
- Reichenbach, P.; Rossi, M.; Malamud, B.; Mihir, M.; Guzzetti, F. A review of statistically-based landslide susceptibility models. Earth-Sci. Rev. 2018, 180, 60–91. [Google Scholar] [CrossRef]
- Mrozek, T.; Poli, S.; Sterlacchini, S.; Zabuski, L. Landslide susceptibility assessment. A case study from the Beskid Niski Mts., Carpathians, Poland. Polish Geol. Inst. Sp. Pap. 2004, 15, 13–18. [Google Scholar]
- Kaminski, M. Mapa podatności osuwiskowej w skali regionalnej—Przykład z Doliny Sanu na Pogórzu Dynowskim. Biul. Panstwowego Inst. Geol. 2012, 452, 109–118. [Google Scholar]
- Długosz, M. Podatność Stoków na Osuwanie w Polskich Karpatach Fliszowych; Pr. Geogr. 230; IGiPZ PAN: Warszawa, Poland, 2011; pp. 1–112. [Google Scholar]
- Mrozek, T. Zagrożenie i ryzyko osuwiskowe w rejonie Szymbarku (Beskid Niski). Pr. Panstwowego Inst. Geol. 2013, 199, 5–40. (In Polish) [Google Scholar]
- Mrozek, T.; Laskowicz, I. Landslide risk reduction in Poland: From landslide inventory to improved mitigation and landuse practice in endangered areas. In Landslide Science for a Safer Geoenvironment; Methods of Landslide Studies; Sassa, K., Canuti, P., Yin, Y., Eds.; Springer: Cham, Switzerland, 2014; Volume 2, pp. 765–771. [Google Scholar]
- European Commission. Thematic Strategy for Soil Protection; COM(2006)231 final; Commission of the 17 European Communities: Brussels, Belgium, 2006. [Google Scholar]
- European Commission. A Community Approach on the Prevention of Natural and Man-Made Disasters; COM(2009) 82 final; European Commission: Brussels, Belgium, 2009. [Google Scholar]
- European Commission. New EU Forest Strategy for 2030; COM(2021)572 final; Commission of the 17 European Communities: Brussels, Belgium, 2021. [Google Scholar]
- Yalcin, A. GIS-based landslide susceptibility mapping using analytical hierarchy process and bivariate statistics in Ardesen (Turkey): Comparisons of results and confirmations. Catena 2008, 72, 1–12. [Google Scholar] [CrossRef]
- Magliulo, P.; Di Lisio, A.; Russo, F.; Zelando, A. Geomorphology and landslide susceptibility assessment using GIS and bivariate statistics: A case study in southern Italy. Nat. Hazards 2008, 47, 411–435. [Google Scholar] [CrossRef]
- Wang, Q.; Li, W.; Wu, Y.; Pei, Y.; Xie, P. Application of statistical index and index of entropy methods to landslide susceptibility assessment in Gongliu (Xinjiang, China). Environ. Earth Sci. 2016, 75, 599. [Google Scholar] [CrossRef]
- Liu, J.; Duan, Z. Quantitative assessment of landslide susceptibility comparing statistical index, index of entropy, and weights of evidence in the Shangnan Area, China. Entropy 2018, 20, 868. [Google Scholar] [CrossRef] [PubMed] [Green Version]
- Małka, A. Podatność i ryzyko osuwiskowe w obszarach rzeźby młodoglacjalnej, przeobrażonej antropogenicznie, na terenie Gdyni (Landslide Susceptibility and Risk in the Anthropogenically Transformed Postglacial Areas in Gdynia). Ph.D. Thesis, PIG-PIB, Warszawa, Poland, 2018. [Google Scholar] [CrossRef]
- De Smith, M.J.; Goodchild, M.F.; Longley, P.A. Geospatial Analysis: A Comprehensive Guide to Principles, Techniques and Software Tools, 6th ed.; Amazon Italia Logistica S.r.l.: Turin, Italy, 2018. [Google Scholar]
- Wang, Q.; Wang, Y.; Niu, R.; Peng, L. Integration of Information Theory, K-Means Cluster Analysis and the Logistic Regression Model for Landslide Susceptibility Mapping in the Three Gorges Area, China. Remote Sens. 2017, 9, 938. [Google Scholar] [CrossRef] [Green Version]
- Fang, Z.; Wang, Y.; Duan, G.; Peng, L. Landslide Susceptbiity Mapping Using Rotation Forest Ensemble Technique with Different Decision Trees in the Three Gorges Reservoir Area, China. Remote Sens. 2021, 13, 238. [Google Scholar] [CrossRef]
- Szpakowski, W.; Szydłowski, M. Probable rainfall in Gdansk in view of climate change. Acta Sci. Pol. Formatio Circumiectus 2018, 18, 175–183. [Google Scholar] [CrossRef]
- Miętus, M.; Filipiak, J. The patterns of thermal conditions in the area of the southern coast of the Gdansk (N Poland). In Proceedings of the Fifth International Conference on Urban Climate, Łódź, Poland, 1–5 September 2003. [Google Scholar]
- Schrötter, F.L. Karte von Ost-Preussen nebst Preussisch Litthauen und West-Preussen nebst dem Netzdistrict aufgenommen unter Leitung des Königl. Preuss. Staats Ministers Frey Herrn von Schroetteer in den Jahren von 1796 bis 1802; Berlin State Library: Berlin, Germany, 1806. [Google Scholar]
- Falckenstein. Topographische Karte, Maßstab 1:25 000, Blatt Danzig; Berlin State Library: Berlin, Germany, 1837. [Google Scholar]
- Lattre. Topographische Karte, Maßstab 1:25 000, Blatt Oliva; Berlin State Library: Berlin, Germany, 1862. [Google Scholar]
- Kwoczynska, B. Analysis of land use changes in the Tri-City metropolitan area based on the multi-temporal classification of LANDSAT and RAPIDEYE imagery. GLL Geomat. Landmanagement Landsc. 2021, 2, 101–119. [Google Scholar] [CrossRef]
- Mojski, J.E. Ziemie Polskie w Czwartorzędzie; Zarys morfogenezy; PGI–NRI: Warszawa, Poland, 2005. (In Polish) [Google Scholar]
- Woźniak, P.P. Development of morphology and sedimentary profiles on Kashubian Coastline during the Vistulian glaciation—An outline of main problems. In Evolution of Sedimentary Environments in Pobrzeże Kaszubskie Region; Sokołowski, R.J., Ed.; Uniwersytet Gdanski: Gdynia, Poland, 2014; pp. 17–26. (In Polish) [Google Scholar]
- Kondracki, J. Geografia Regionalna Polski; PWN: Warszawa, Poland, 1998. [Google Scholar]
- Sonntag, P. Geologischer Führer Durch Die Danziger Gegend; Verlag und Druck von A. W. Kafemann G.m.b.H.: Danzig, 1910. [Google Scholar]
- Uścinowicz, S. Relative sea level changes, glacio-isostatic rebound and shoreline displacement in the southern Baltic. Pol. Geol. Inst. Spec. Pap. 2003, 10, 5–79. [Google Scholar]
- Gałka, M.; Holger-Knorr, K.; Miotk-Szpiganowicz, G.; Moskalewicz, D.; Sz, U.; Witak, M.; Woźniak, P. Environmental setting of the stone age settlement complex at the Rzucewo site. In Stone Age Settlement Complex in Rzucewo, Site 1, Puck Commune; Król, D., Ed.; Muzeum Archeologiczne w Gdansku: Gdansk, Poland, 2018; pp. 14–39. (In Polish) [Google Scholar]
- Małka, A. Mass movements in the area of Gdynia documented on old maps and in archival materials. Przegląd Geol. 2019, 67, 308–319. Available online: https://link.springer.com/article/10.1007/s11069-021-04599-8 (accessed on 8 January 2020). (In Polish with English summary).
- Zawadzka-Kahlau, E. Tendencje Rozwojowe Polskich Brzegów Południowego Bałtyku; GTN: Gdansk, Poland, 1999. [Google Scholar]
- Wyrzkowski, T. Map of Recent Vertical Movement of the Earth Crust on the Territory of Poland 1:2500000; Inst. Geod. i Kart.: Warszawa, Poland, 1985. [Google Scholar]
- Pikies, R.; Zaleszkiewicz, L. Szczegółowa Mapa Geologiczna Polski w skali 1:50 000, Ark. Gdynia (55)—Reambulacja; PIG–PIB: Warszawa, Poland, 2013. [Google Scholar]
- Mojski, J.E. Szczegółowa Mapa Geologiczna Polski 1:50 000, Ark. Gdansk (27); Wyd Geolog: Warszawa, Poland, 1977. [Google Scholar]
- Mojski, J.E. Szczegółowa Mapa Geologiczna Polski 1:50 000, Ark. Gdynia (16); Wyd Geolog: Warszawa, Poland, 1978. [Google Scholar]
- Frankowski, Z.; Zachowicz, J.; Gałkowski, P.; Jaros, M.; Majer, K.; Pasieczna, A.; Lis, J.; Mil, L.; Jurys, L.; Lidzbarski, M.; et al. Baza Danych Geologiczno-Inżynierskich Wraz z Opracowaniem Atlasu Geologiczno-Inżynierskiego Aglomeracji Trójmiejskiej Gdansk—Sopot—Gdynia. Geological and Engineering Atlas of the Tri-City of Gdansk-Sopot-Gdynia Urban Area. PGI NRI. National Geological Archives. Warszawa. 2007. Available online: http://geoportal.pgi.gov.pl/atlasy_gi/atlasy/trojmiasto (accessed on 8 January 2020). (In Polish)
- Lohani, B.; Ghosh, S. Airborne LiDAR technology: A review of data collection and processing systems. Proc. Natl. Acad. Sci. India Sect. A 2017, 87, 567–579. [Google Scholar] [CrossRef]
- Urban Atlas–PL006L–Gdansk. European Environment Agency (EEA). Copenhagen. 2010. Available online: http://www.eea.europa.eu/data-and-maps/data/urban-atlas (accessed on 23 August 2022).
- Wu, W.; Sidle, R.C. A distributed slope stability model for steep forested basins. Water Resour. Res. 1995, 31, 2097–2110. [Google Scholar] [CrossRef]
- Van Westen, C.J.; Castellanos, E.; Kuriakose, S.L. Spatial data for landslide susceptibility, hazard, and vulnerability assessment: An overview. Eng. Geol. 2008, 102, 112–131. [Google Scholar] [CrossRef]
- Wilson, J.P.; Gallant, J.C. Terrain Analysis: Principles and Applications; Wiley: New York, NY, USA, 2000. [Google Scholar]
- Moore, I.D.; Grayson, R.B.; Ladson, A.R. Digital terrain modelling: A review of hydrogical, geomorphological, and biological applications. Hydrol. Process. 1991, 5, 3–30. [Google Scholar] [CrossRef]
- Sharma, A.K.; Gardner, T.; Begbie, D. Approaches to Water Sensitive Urban Design; Woodhead Publishing: Cambridge, UK, 2019. [Google Scholar] [CrossRef]
- Dai, F.C.; Lee, C.F.; Ngai, Y.Y. Landslide risk assessment and management: An overview. Eng. Geol. 2002, 64, 65–87. [Google Scholar] [CrossRef]
- Cordy, G.E. NBMG Open File Report 87–5. Geology and Earthquake Hazards. Reno NE Quadrangle. University of Nevada Reno. Nevada Bureau of Mines and Geology. 1987. Available online: https://citeseerx.ist.psu.edu/viewdoc/download?doi=10.1.1.214.4577&rep=rep1&type=pdf (accessed on 23 August 2022).
- Goetz, J.N.; Guthrie, R.H.; Brenning, A. Integrating physical and empirical landslide susceptibility models using generalized additive models. Geomorphology 2011, 129, 376–386. [Google Scholar] [CrossRef]
- Grabowski, D.; Marciniec, P.; Mrozek, T.; Nescieruk, P.; Rączkowski, W.; Wojcik, A.; Zimnal, Z. Instrukcja Opracowania Mapy Osuwisk i Terenów Zagrożonych Ruchami Masowymi w Skali 1:10,000; PGI NRI: Warszawa, Poland, 2008. (In Polish) [Google Scholar]
- Jenks, G.F. The Data Model Concept in Statistical Mapping. Int. Yearb. Cartogr. 1967, 7, 186–190. [Google Scholar]
- Veerappan, R.; Negi, A.; Siddan, A. Landslide susceptibility mapping and comparison using frequency ratio and analytical hierarchy process in part of NH-58, Uttarakhand, India. In Advancing Culture of Living with Landslides; Mikos, M., Tiwari, B., Yin, Y., Sassa, K., Eds.; Springer: Cham, Switzerland, 2017; Volume 2. [Google Scholar] [CrossRef]
- Arabameri, A.; Saha, S.; Roy, J.; Chen, W.; Blaschke, T.; Tien Bui, D. Landslide Susceptibility Evaluation and Management Using Different Machine Learning Methods in The Gallicash River Watershed, Iran. Remote Sens. 2020, 12, 475. [Google Scholar] [CrossRef]
- Marciniec, P.; Zimnal, Z.; Wojciechowski, T.; Perski, Z.; Rączkowski, W.; Laskowicz, I.; Nieścieruk, P.; Grabowski, D.; Kułak, M.; Wójcik, A. Osuwiska w Polsce—Od rejestracji do prognozy, czyli 13 lat projektu SOPO. Landslides in Poland: From registration to forecast, 13 years of the LCS project. Prz. Geol. 2019, 67, 291–297. (In Polish) [Google Scholar]
- Szukalski, J. Środowisko Geograficzne Trójmiasta (Gdansk–Sopot–Gdynia); UG. Skrypty Uczelniane: Gdansk, Poland, 1974. [Google Scholar]
- Parriaux, A.; Bonnard, C.; Tacher, L. Rutschungen: Hydrogeologie und Sanierungsmethoden durch Drainage. Leitfaden; BUWAL: Bern, Switzerland, 2010. [Google Scholar]
- Wojciechowski, T. Geologiczna analiza osuwisk z wykorzystaniem satelitarnej interferometrii radarowej na przykładzie rejonu Nowego Sącza. Ph.D. Thesis, Biblioteka Wydz, Nauk o Ziemi UŚ, Sosnowiec, Poland, 2009. [Google Scholar]
- Bober, L. Regiony osuwiskowe w polskich Karpatach Fliszowych i ich związek z budową geologiczną regionu. Biul. Inst. Geol. 1984, 340, 115–158. [Google Scholar]
- Burdziej, J.; Kunz, M. Estimation of resolution influence and methods of acquiring high-altitude data on the accuracy of numeric terrain models and models of slopes and aspects. Arch. Fotogram. Kartogr. i Teledetekcji 2006, 16, 111–123, (In Polish with English summary). [Google Scholar]


| Digital Data | Source | Websites |
|---|---|---|
| Landslide inventory | Polish Geological Institute, National Research Institute (Jurys et al., 2011, 2012) [3,4] | https://geologia.pgi.gov.pl (accessed on 23 August 2022) |
| Digital elevation model | National Geodetic and Cartographic Resources | https://www.gov.pl/web/gugik (accessed on 23 August 2022) |
| Topographic object database | National Geodetic and Cartographic Resources | https://www.gov.pl/web/gugik (accessed on 23 August 2022) |
| Digital engineering geological data | Polish Geological Institute, National Research Institute (Frankowski et al., 2007) [54] | https://geologia.pgi.gov.pl (accessed on 23 August 2022) |
| Urban atlas | European Environment Agency (60. Urban Atlas–PL006L–Gdansk 2010) [56] | https://land.copernicus.eu/local/urban-atlas (accessed on 23 August 2022) |
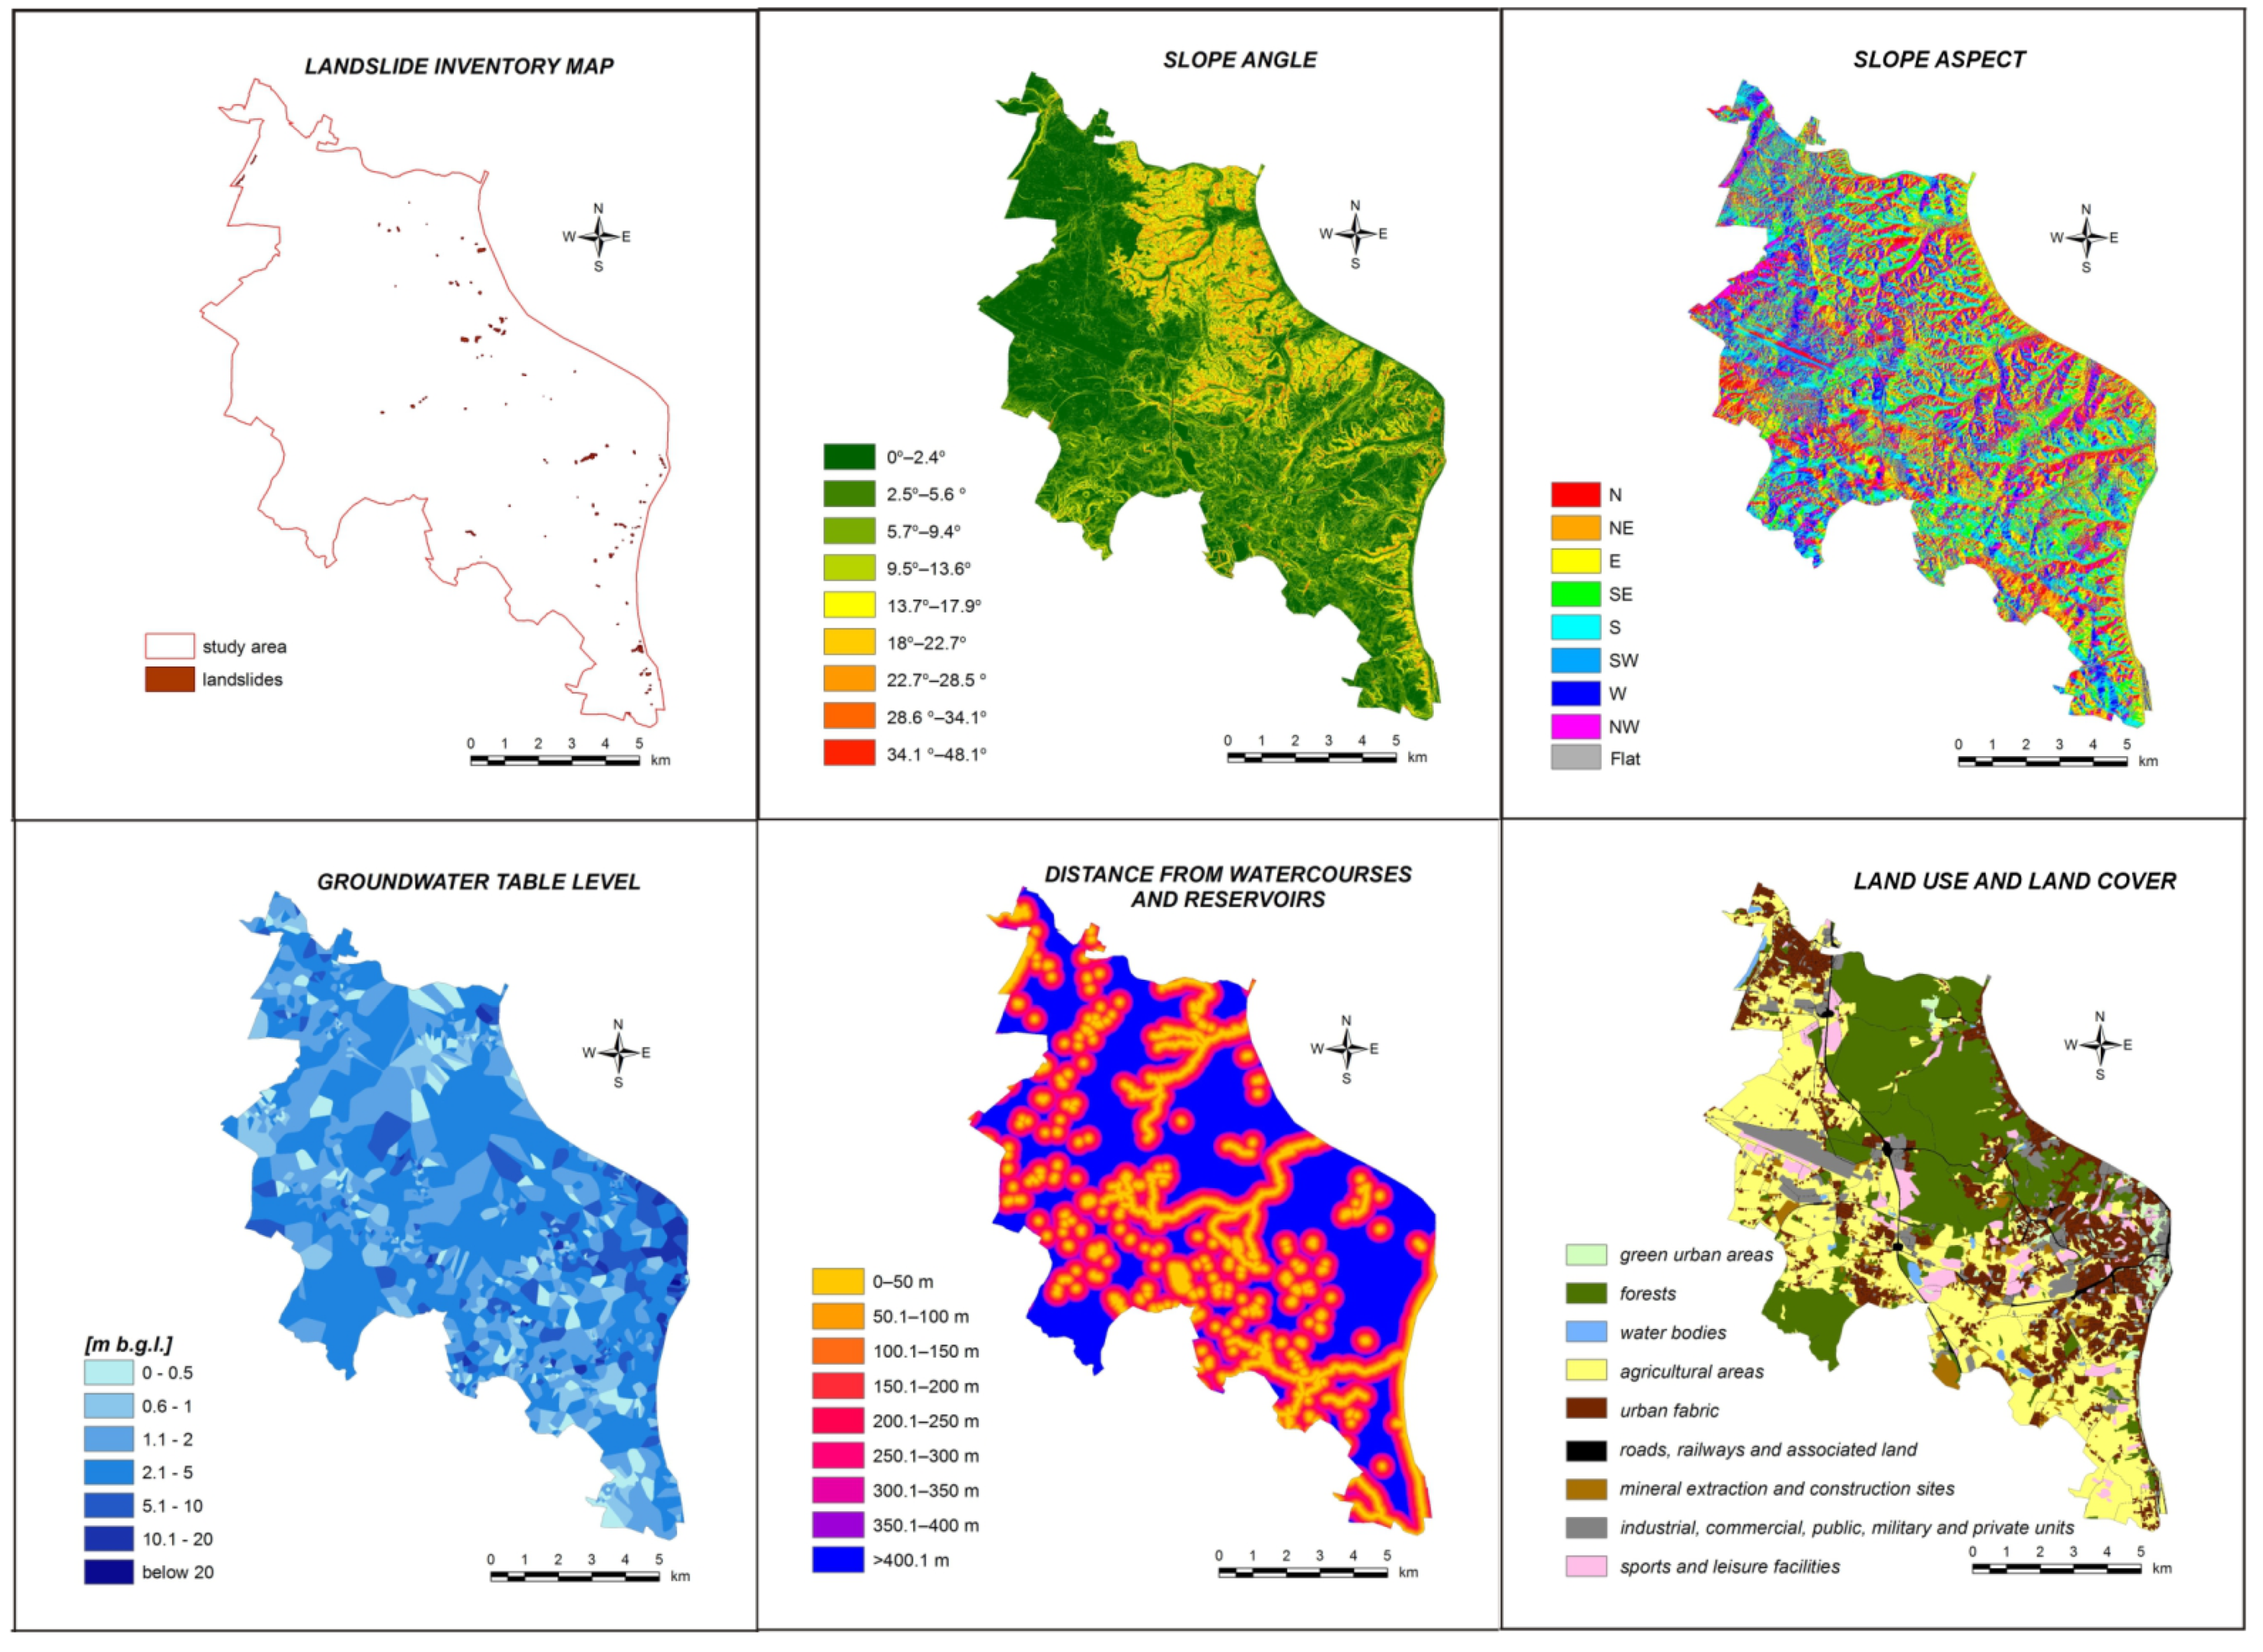
| No | Variable | Data Source | Influence on Shallow Landslide Mechanisms |
|---|---|---|---|
| 1 | slope angle (S) | DEM | Slope angle controls the balance of resisting and destabilizing forces acting on a slope [57]. |
| 2 | slope aspect (A) | DEM | Slope aspect has an influence on solar radiation intensity, which controls the local temperature and evaporation [58]. The slope aspect also affects soil moisture, rainfall intensity, and vegetation density on the hillsides [29]. |
| 3 | topographic wetness index (TWI) | DEM | TWI describes the influence of topography on the spatial distribution and extent of saturation areas [59]. |
| 4 | stream power index (SPI) | DEM | SPI is a measure of the erosive force of water runoff [60]. |
| 5 | the sediment transport capacity index (LS) | DEM | The LS index stands for sediment transport capacity, predicts the location of erosion, and shows the spatial distribution of potential soil losses [59]. |
| 6 | relief energy (R) | DEM | Relief describes the gradients of the terrain and controls mass movements [6,7] |
| 7 | land use and land cover (LULC) | Urban atlas | LULC is associated with urbanization processes. Urbanization results in permanent changes to the landscape, the spread of an urban environment, and an increase in anthropogenic activities [61]. |
| 8 | distance from watercourses and reservoirs (DWR) | Topographic object database | River erosion and sea abrasion as well as drainage density determine the likelihood of a landslide in young morainic areas [6,7]. Close river proximity induces instability at the foot of a slope due to the concentration of groundwater flow; further, river and sea undercutting also have a destabilizing effect [19]. |
| 9 | ground type at a depth of 1 m b.g.l. (G 1) | Digital engineering geological data | Influence on the weathering of the bedrock and the resulting soils [62] |
| 10 | ground type at a depth of 4 m b.g.l. (G 4) | Digital engineering geological data | Deep geological structure has an impact on landslides in young glacial areas as it illustrates changes in permeability of sediments and potential slip zones [7]. |
| 11 | groundwater table level (GW) | Digital engineering geological data | Well-sorted, fine-grained deposits in which the groundwater table is within 3 m may be subject to possible severe liquefaction [63]. |
| 12 | elevation (E) * | DEM | Elevation relates to landslides trigger, i.e., heavy rainfall [7] |
| 13 | profile curvature (P) * | DEM | Divergent or convergent curvature has an influence on the water run-off concentration [64] |
| Gdynia | Gdansk | ||||||||||
|---|---|---|---|---|---|---|---|---|---|---|---|
| Causal Factor | Class | Ln Wi | Percentage of Landslide Pixels a | Percentage of Class Pixels b | Frequency Ratio (a/b) | Causal Factor | Class | Ln Wi | Percentage of Landslide Pixels a | Percentage of Class Pixels b | Frequency Ratio (a/b) |
| [–] | [%] | [%] | [–] | [–] | [%] | [%] | [–] | ||||
| Slope angle [°] | 0–3 | −3.57 | 1.34 | 47.67 | 0.03 | Slope angle [°] | 0–2.4° | −3.94 | 0.74 | 37.29 | 0.02 |
| 3–8 | −1.03 | 7.36 | 20.66 | 0.36 | 2.5–5.6° | −2.10 | 3.18 | 25.84 | 0.12 | ||
| 8–14 | 0.29 | 18.80 | 14.11 | 1.33 | 5.7–9.4° | −0.42 | 8.67 | 13.20 | 0.66 | ||
| 14–19 | 0.80 | 19.99 | 8.96 | 2.23 | 9.5–13.6° | 0.72 | 16.57 | 8.04 | 2.06 | ||
| 19–23 | 1.08 | 14.50 | 4.93 | 2.94 | 13.7–17.9° | 1.22 | 20.49 | 6.04 | 3.39 | ||
| 23–28 | 1.52 | 12.67 | 2.77 | 4.58 | 18–22.7° | 1.38 | 20.25 | 5.10 | 3.97 | ||
| 28–34 | 2.72 | 9.82 | 0.65 | 15.22 | 22.7–28.5° | 1.65 | 18.06 | 3.48 | 5.19 | ||
| 34–41 | 4.06 | 11.55 | 0.20 | 58.18 | 28.6–34.1° | 2.32 | 8.21 | 0.80 | 10.20 | ||
| 41–63 | 4.36 | 3.97 | 0.05 | 78.60 | 34.1–48.1° | 2.99 | 3.83 | 0.19 | 20.03 | ||
| Slope aspect | NW | −0.19 | 9.05 | 10.99 | 0.82 | Slope aspect | NW | 0.40 | 16.17 | 10.86 | 1.49 |
| W | −0.11 | 7.98 | 8.94 | 0.89 | W | −0.82 | 4.44 | 10.09 | 0.44 | ||
| S | −0.20 | 9.44 | 11.54 | 0.82 | S | −0.19 | 10.83 | 13.08 | 0.83 | ||
| SE | −0.23 | 10.83 | 13.63 | 0.79 | SE | −0.40 | 9.01 | 13.41 | 0.67 | ||
| SW | −0.28 | 6.91 | 9.15 | 0.76 | SW | −0.33 | 7.72 | 10.74 | 0.72 | ||
| E | 0.49 | 23.72 | 14.58 | 1.63 | E | −0.10 | 12.59 | 13.87 | 0.91 | ||
| N | −0.17 | 12.58 | 14.94 | 0.84 | N | 0.43 | 21.30 | 13.85 | 1.54 | ||
| NE | 0.18 | 19.48 | 16.23 | 1.20 | NE | 0.24 | 17.90 | 14.09 | 1.27 | ||
| flat | −8.88 | 0.00 | 0.00 | 0.00 | flat | −7.84 | 0.00 | 0.00 | 0.00 | ||
| Distance from watercourses and reservoirs [m] | 0–50 | 1.37 | 25.57 | 6.51 | 3.93 | Distance from watercourses and reservoirs [m] | 0–50 m | 0.84 | 19.69 | 8.49 | 2.32 |
| 50–100 | 0.63 | 12.86 | 6.86 | 1.87 | 50.1–100 m | 0.69 | 17.04 | 8.57 | 1.99 | ||
| 100–150 | −0.67 | 3.65 | 7.17 | 0.51 | 100.1–150 m | 0.13 | 10.46 | 9.20 | 1.14 | ||
| 150–200 | −0.85 | 3.14 | 7.35 | 0.43 | 150.1–200 m | −0.59 | 5.15 | 9.32 | 0.55 | ||
| 200–250 | −0.45 | 4.61 | 7.25 | 0.64 | 200.1–250 m | −0.91 | 3.61 | 9.00 | 0.40 | ||
| 250–300 | −0.02 | 6.79 | 6.93 | 0.98 | 250.1–300 m | −0.23 | 6.57 | 8.30 | 0.79 | ||
| 300–350 | 0.34 | 9.15 | 6.52 | 1.40 | 300.1–350 m | −0.57 | 4.32 | 7.59 | 0.57 | ||
| 350–400 | 0.03 | 6.30 | 6.11 | 1.03 | 350.1–400 m | −0.82 | 2.93 | 6.65 | 0.44 | ||
| >400 | −0.49 | 27.74 | 45.23 | 0.61 | >400.1 m | −0.08 | 30.19 | 32.89 | 0.92 | ||
| Groundwater table level [m] | 0–0.5 | 0.88 | 14.53 | 6.02 | 2.41 | Groundwater table level [m] | 0–0.5 m | −0.62 | 3.06 | 5.64 | 0.54 |
| 0.5–1 | 0.27 | 32.58 | 24.94 | 1.31 | 0.5–1 m | −0.87 | 3.83 | 9.15 | 0.42 | ||
| 1–2 | −0.40 | 5.75 | 8.54 | 0.67 | 1–2 m | 0.24 | 34.88 | 27.38 | 1.27 | ||
| 2–5 | −0.28 | 40.14 | 53.11 | 0.76 | 2–5 | −0.21 | 38.95 | 48.22 | 0.81 | ||
| 5–10 | 0.21 | 6.95 | 5.65 | 1.23 | 5–10 m | 0.59 | 14.66 | 8.11 | 1.81 | ||
| 10–20 | −3.68 | 0.04 | 1.48 | 0.03 | 10–20 m | 1.14 | 4.63 | 1.47 | 3.14 | ||
| below 20 | −8.88 | 0.00 | 0.25 | 0.00 | below 20 m | −7.84 | 0.00 | 0.03 | 0.00 | ||
| Land use and land cover | industrial and military units | −3.51 | 0.29 | 9.54 | 0.03 | Land use and land cover | industrial and military units | −1.85 | 1.23 | 7.89 | 0.16 |
| urban fabric | −1.20 | 4.69 | 15.58 | 0.30 | urban fabric | −0.47 | 9.66 | 15.42 | 0.63 | ||
| roads, railways and associated land | −3.10 | 0.27 | 6.03 | 0.05 | roads, railways and associated land | −2.22 | 0.46 | 4.32 | 0.11 | ||
| mineral extraction and construction sites | −5.40 | 0.00 | 0.59 | 0.00 | mineral extraction and construction sites | −3.01 | 0.15 | 2.97 | 0.05 | ||
| green urban areas | 1.88 | 9.22 | 1.41 | 6.55 | green urban areas | 0.55 | 2.96 | 1.72 | 1.72 | ||
| sports and leisure facilities | −4.27 | 0.04 | 2.86 | 0.01 | sports and leisure facilities | −2.91 | 0.25 | 4.67 | 0.05 | ||
| agricultural areas | −2.95 | 0.67 | 12.85 | 0.05 | agricultural areas | −0.21 | 26.30 | 32.56 | 0.81 | ||
| forests | 0.13 | 57.41 | 50.16 | 1.14 | forests | 0.68 | 58.92 | 29.78 | 1.98 | ||
| water bodies | −8.88 | 0.00 | 0.03 | 0.00 | water bodies | −7.84 | 0.00 | 0.71 | 0.00 | ||
| coastal zone | 3.46 | 27.39 | 0.86 | 31.98 | |||||||
Publisher’s Note: MDPI stays neutral with regard to jurisdictional claims in published maps and institutional affiliations. |
© 2022 by the author. Licensee MDPI, Basel, Switzerland. This article is an open access article distributed under the terms and conditions of the Creative Commons Attribution (CC BY) license (https://creativecommons.org/licenses/by/4.0/).
Share and Cite
Malka, A. GIS-Based Landslide Susceptibility Modelling in Urbanized Areas: A Case Study of the Tri-City Area of Poland. GeoHazards 2022, 3, 508-528. https://doi.org/10.3390/geohazards3040026
Malka A. GIS-Based Landslide Susceptibility Modelling in Urbanized Areas: A Case Study of the Tri-City Area of Poland. GeoHazards. 2022; 3(4):508-528. https://doi.org/10.3390/geohazards3040026
Chicago/Turabian StyleMalka, Anna. 2022. "GIS-Based Landslide Susceptibility Modelling in Urbanized Areas: A Case Study of the Tri-City Area of Poland" GeoHazards 3, no. 4: 508-528. https://doi.org/10.3390/geohazards3040026