1. Introduction
Fischer–Tropsch synthesis (FTS) makes it possible to obtain various fractions of synthetic hydrocarbons from a mixture of CO and H2, also known as synthesis gas. Fuel fractions, synthetic oils or paraffins can be produced by this method depending on the catalyst and conditions of synthesis. The main reaction of synthesis is the interaction of CO and H2, which can be displayed as follows:
FTS technologies fall into two types according to the literature: (a) high-temperature FTS aka HTFT, which is carried out at a temperature of 320–360 °C in the presence of an iron catalyst; and (b) low-temperature FTS aka LTFT, which is realized at 200–260 °C in the presence of an iron or cobalt catalyst. In the HTFT reactors circulating or fluidized-bed catalysts are used; whereas, LTFT employs fixed-bed reactors or slurry reactors or microchannel reactors [
1,
2]. It is more preferable in industry to use fixed-bed reactors as they are easier to operate and can be scaled from a single tube up to industrial multi-tube reactors. In such reactors, granular catalysts with a pellet size of at least 1 mm are used. This provides a minimum pressure drop in long narrow reaction tubes and at the same time a sufficient density of the catalyst bed [
3].
The access of reactants to the active surface is usually difficult in granular catalysts due to diffusion limitations inside the granule caused by the slow transport of components or reaction products [
4,
5]. Because of these pore diffusion limitations, conversion and selectivity for C
5+ hydrocarbons are significantly reduced. The effect of diffusion restrictions on the conversion and composition of products was manifested instructively in [
6], where a Ru/TiO
2 catalyst in the form of both small (0.11–0.18 mm) and relatively large (0.85–1.7 mm) granules was tested under the same FTS conditions. The experiment demonstrated that during 50 h of synthesis in the presence of large granules, the conversion decreased by 20 percent, and the selectivity for methane increased by 10 percent over the same period of time. At the same time, in the experiment with small granules, these indicators changed insignificantly.
Kinetic studies are of great importance for understanding the mechanism of reactions and obtaining empirical equations of the reaction rate depending on synthesis conditions, as they can be used for the development and application of industrial catalysts and modeling of industrial reactors [
7]. Over the decades of FTS research, a large number of kinetic models have been proposed [
8,
9,
10], which were thoroughly analyzed in [
11]. They depend on the type of catalyst and operating conditions, so there is no universal kinetic model describing synthesis gas consumption and product distribution [
12]. Thus, the main problem in describing the kinetics of FTS is the complexity of the mechanism and the large number of compounds participating in the process [
13].
The results of kinetic studies of the FTS are usually equations describing the dependence of the reaction rate on the synthesis conditions. Such dependences are revealed either empirically on the basis of experimental data [
14,
15], or theoretically on the basis of the proposed reaction mechanism [
12].
The mechanism of the FTS reaction generally consists of the following stages:
adsorption of reactants (CO and H2) on the surface of the catalyst;
activation (formation of active particles);
growth of the hydrocarbon chain;
chain termination;
desorption of products from the catalyst surface.
The nucleation of a hydrocarbon chain begins with the simultaneous chemisorption of carbon monoxide and hydrogen on the surface of the catalyst. Carbon monoxide is connected by a carbon atom to the metal center—as a result the C–O bond is weakened and the interaction of CO and H2 with the formation of a primary complex is facilitated. At the next stage, a further step-by-step addition of a surface compound carrying one carbon atom occurs, and the hydrocarbon chain is lengthened. Chain termination occurs as a result of desorption, hydrogenation, or interaction of the growing chain with synthesis products. Hypotheses about the mechanisms of sorption of the reactants on the active surface, weakening and hydrogenation of the C–O bond, the structure of formed active particles on the catalyst surface and other aspects are the basis for possible equations of reaction rate.
In most works, the equations of the reaction rate of hydrocarbon formation are derived on the basis of the Langmuir–Hinshelwood–Hugen–Watson adsorption theory and are successfully applied to cobalt and iron catalysts [
12,
14,
15].
To conduct such studies, it is necessary to create conditions for the reaction to occur in the kinetic region, in which the chemical reaction itself is the limiting stage and the supply of reacting substances and the removal of products proceed much faster. Diffusion limitations on one of the reactants lead to the incomplete involvement of catalyst granules in synthesis and the distortion of activity and selectivity. In order to conduct kinetic studies, it is necessary to remove any diffusion limitations. Therefore, studies are usually carried out with small (less than 0.2 mm) catalyst particles [
13]. In such cases, the catalyst is usually diluted ~10 times by an inert backfill (for example, quartz), or the undiluted catalyst occupies a small part of the reactor, and the majority of the reactor is occupied by an inert backfill. This makes it possible to overcome diffusion limitations and avoid temperature gradient in the catalyst layer. Thus, a discrepancy occurs between the granular nature of real FTS catalysts for industrial reactors and the kinetic study results, which can be received for diluted powders only. In this work we were able to create a granular catalyst suitable for operation in the kinetic region without additional grinding or dilution.
2. Materials and Methods
2.1. Catalyst Preparation
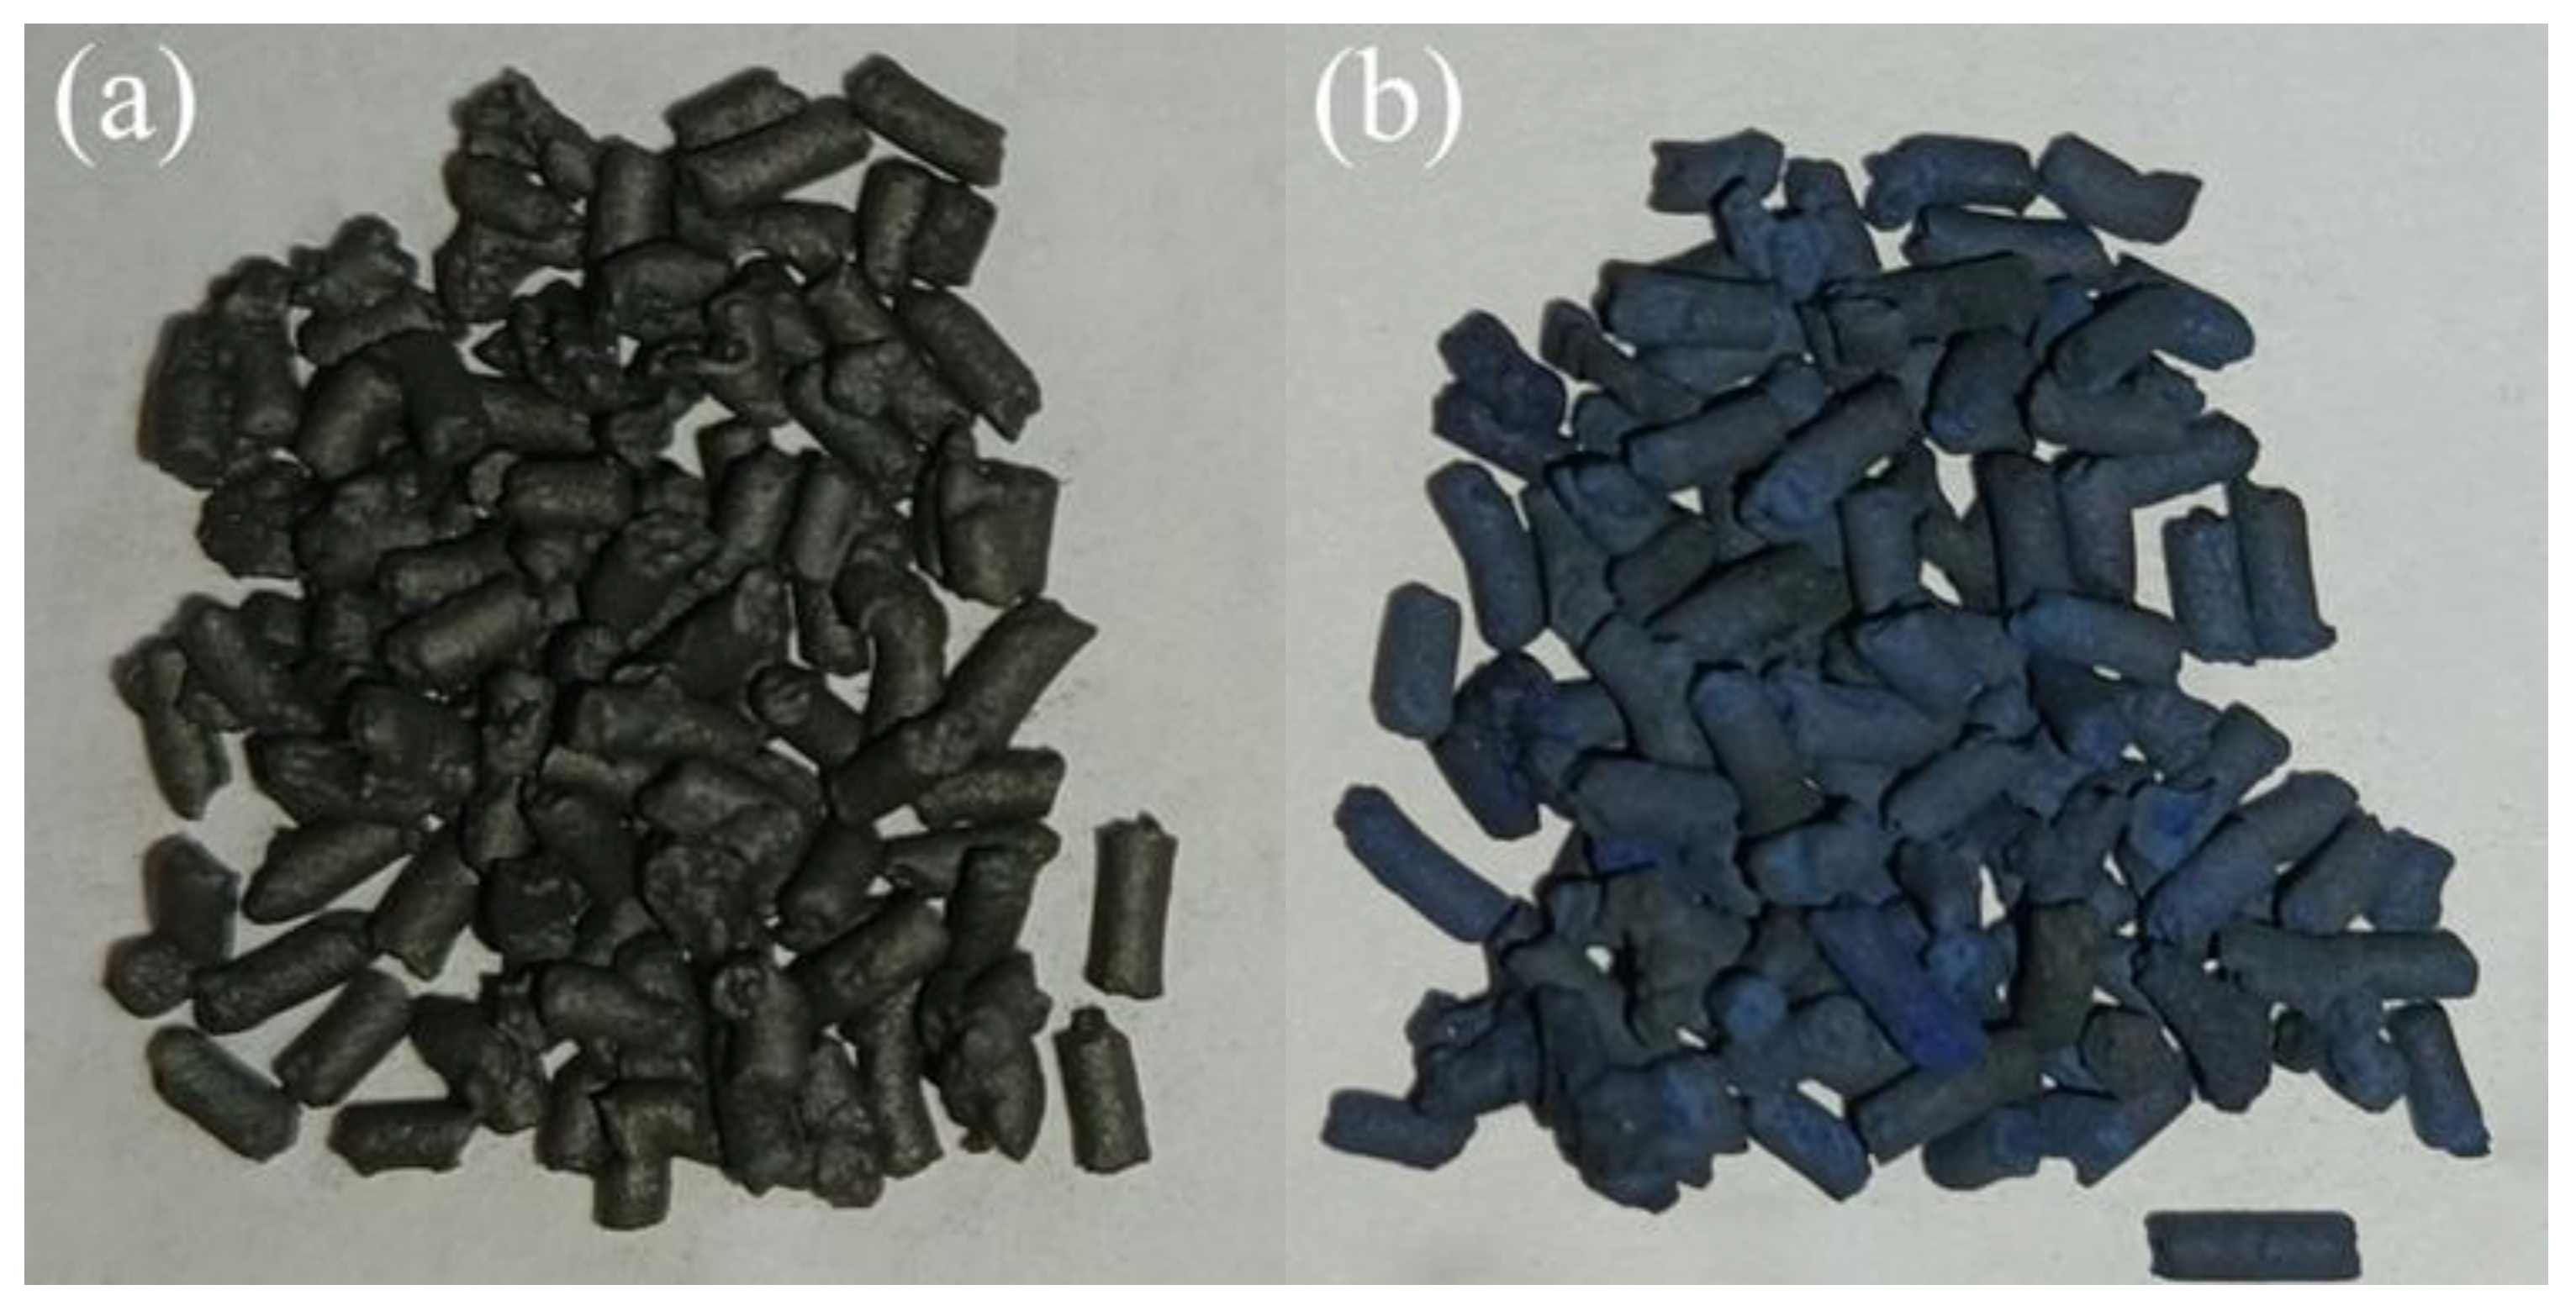
Catalyst granules suitable for kinetic studies were prepared on the basis of industrial INFRA S2 pelletized catalyst support. Support composition is 30 wt.% of zeolite HBeta (ZEOLYST), 50 wt.% of binder boehmite (SASOL), 20 wt.% of exfoliated graphite (TRG, LLC UNIHIMTEK). The graphite forms an intragranular graphitic network serving simultaneously as a heat-conductive medium. Co was introduced by impregnation with an aqueous solution of cobalt nitrate, followed by drying and calcination. The size of ready-to-test catalyst granules was 1.5 mm diameter to 2 mm length. The method of preparation, purpose and characteristics of INFRA S2 catalyst are described in detail in [
16]. The granulated catalyst suitable for determining kinetic parameters was obtained as a result of several consecutive thermal treatments: (a) in the hydrogen atmosphere at 0.1 MPa and 380 °C for 2 h (GHSV = 3000 h
−1) producing Co/Co
3O
4 clusters from initial Co
3O
4 clusters; (b) in the synthesis gas atmosphere at 2 MPa and 170–260 °C for 100 h (GHSV = 300–3000 h
−1) producing FTS-active Co-containing sites [
17]; (c) high-temperature oxidizing heat treatment in the atmosphere of nitrogen-air mixture with ratio 10:1 (flow rate 3.6 l/h) at 0.1 MPa and ~750 °C for 2 h producing CoAl
2O
4 spinel from boehmite-derived alumina and cobalt oxide of cobalt-containing sites. After thermal treatments, the black color of the catalyst changed to blue, which is characteristic of spinel (
Figure 1). Hereinafter, this catalyst is referred to as B in this paper.
2.2. FTS Technique
To collect data sufficient to determine the activation energy, FTS was performed in continuous mode in a stainless-steel reactor with an inner diameter of 10 mm. Granules of catalyst B were loaded into the reactor in an amount of 8.3 g thus forming a fixed pelletized bed with a volume of 13 cm3. The height of the catalyst bed was 176 mm. For comparison, an industrial INFRA S2 catalyst (hereinafter referred to as S2) with a weight of 8.8 g and a volume of 13 cm3 was loaded into reactor with same dimensions. Both samples were activated in a hydrogen stream (GHSV = 3000 h−1) at 400 °C and 0.1 MPa for 1 h. After activation, the catalysts were heated in a synthesis gas flow at 2 MPa from 170 °C to 237 °C with 3–10 °C stepwise increase every 24 h. Synthesis gas (H2/CO = 2.10–2.15 mol.) containing 2.5 vol. % N2 as an internal reference and methane in the amount of ~1 vol. %, was fed with a rate of 300 h−1 with increasing catalyst temperature until the maximum yield of C5+ hydrocarbons was reached. Then, the space velocity was incrementally increased to 3000 h−1 with temperature optimization to achieve the highest yield of C5+ hydrocarbons at each step. The temperature and space velocity ranges for both catalysts were the same for the sake of a correct comparative analysis. To determine the activation energy, the FTS indicators were recorded with varying parameters, namely: (a) temperatures in the range of 237–243 °C at 3000 h−1 and 2 MPa; (b) space velocity in the range of 1000–3000 h−1 at 243 °C and 2 MPa; (c) pressure in the range from 2 MPa to 1 MPa at 243 °C and 1000 h−1.
The main parameter of the FTS primary reaction rate (1) is the molar activity of the catalyst, which is calculated by the formula:
where
A—catalyst activity in
CO conversion, μmol
CO/(s·g
Co);
n(COcons)—amount of reacted (consumed) CO, mol;
τ—time, s;
m(Co0)—the mass of elemental cobalt in the catalyst, g.
The rate of the FTS primary reaction (1) was described based on the Arrhenius equation in integral form:
where
A—catalyst activity in
CO conversion, μmol
CO/(s·g
Co);
A0—preexponential factor, μmolCO/(s·gCo);
EA—energy of activation, kJ/mol
R—universal gas constant, J/(mol·K);
T—temperature, K.
The activation energy was determined from the graph
—the dependence of the activity obtained experimentally on temperature—by the tangent of inclination angle of the straight line according to the formula:
where
—angle of inclination on the graph
EA—energy of activation, kJ/mol
Pre-exponential factor A0 was determined by the size of the segment cut off by the straight line at the intersection with the ordinate axis on the graph .
The reaction order was calculated by the Van’ t Hoff method based on two activity values and two corresponding concentration values. Because the concentrations of reactants are proportional to the total synthesis pressure, the following formula was used for the calculations [
18]:
where
A1—catalyst activity at pressure
P1, μmol
CO/(s·g
Co);
A2—catalyst activity at pressure P2, μmolCO/(s·gCo);
P—synthesis pressure.
2.3. Analysis of Synthesis Products
The composition of gaseous and liquid products was determined by chromatography. The analysis of the initial mixture and gaseous products (CH4, CO2, C2–C4 hydrocarbons) was conducted by gas adsorption chromatography in temperature-programmable mode (60–200 °C, heating rate—10 °C/min), using a thermal conductivity detector and helium as a carrier gas (flow rate 20 mL/min). A column of 3 m × 3 mm with CaA molecular sieves was used to separate CO and CH4 and a HayeSep-packed column (3 m × 3 mm) was employed to separate CO2 and C2–C4 hydrocarbons.
The composition of liquid C5+ hydrocarbons was determined by gas-liquid chromatography using a flame ionization detector, helium as a gas carrier (flow rate 30 mL/min), a 50 m capillary column, DB-Petro stationary phase, and a temperature programming mode (50–270 °C, heating rate 4 °C/min).
The probability of carbon chain growth (
α) was calculated from the Flory equation:
where
Wn—mass fraction of a hydrocarbon with number of carbon atoms
n.
2.4. Characterization of catalyst samples
Structural analysis of catalysts B and S2 was performed using a JEM-2010 transmission electron microscope equipped with EDS systems. The accelerating voltage of 160 kV was used. Samples for analysis were crushed, mixed with ethanol, and applied to a sample holder.
Co content was determined by extraction of cobalt from the catalyst samples with further spectrophotometric analysis of the extract. Total cobalt content and the content of active cobalt were determined separately. Metallic cobalt and its oxides are active in FTS, but spinel is inactive. To determine the content of active cobalt, 30 mL of a 5% nitric acid solution and 20 mL of a 4% hydrochloric acid solution were added to 0.2 g (±0.0002 g) of the crushed catalyst and heated for 4–5 h at 100 °C. This technique allows active cobalt to convert into a dissolved form, but the spinel CoAl2O4 does not dissolve. The resulting solution after filtration and dilution was placed in a PromEcoLab PE-5300V spectrophotometer to measure the light absorption of the complex of cobalt with nitroso-R-salt at a wavelength of 525 nm.
To determine the total cobalt content, 0.2 g (±0.0002 g) of ground catalyst was moistened with 1–2 mL of distilled water, then 7–8 drops of 95% sulfuric acid and 10–15 mL of 46% hydrofluoric acid were added and heated at 100 °C to a dry residue within 4–6 h. The dry residue was dissolved in 15 mL of 20% hydrochloric acid by heating to 100 °C for 2 h. Then 30 mL of distilled water was added, mixed and filtered. The dissolved portion was transferred into a 100 mL volumetric flask. The precipitate on the filter and the walls of the beaker were washed 2–3 times with dilute 0.4% hot hydrochloric acid and then with distilled water until the pinkish color on the filter disappeared. This technique makes it possible to transfer all cobalt (including that contained in the CoAl2O4 spinel) into the solution. The obtained solution was marked as stock solution “M”. Then, 2 mL of solution “M” was diluted 50 times and the resulting solution was marked as “P” and used for analysis. Then, the light absorption of the complex of cobalt with nitroso-R-salt was measured at a wavelength of 400 nm.
For each sample at least 2 parallel measurements were made. A series of standard solutions with a known content of the analyte (5 × 10⁻⁶, 10 × 10−6, 15 × 10−6, 20 × 10−6, 25 × 10−6 and 30 × 10−6 g in terms of CoO) were prepared on the day of measurement of the samples. A calibration graph of the solution optical density dependence on the cobalt oxide concentration was plotted and used to determine the content of cobalt (in terms of CoO oxide) in the samples.
The mass fraction of cobalt oxide (
X) in % is calculated by the formula:
where
c—the amount of cobalt oxide found according to the calibration graph, g;
a—mass of dissolved catalyst, g;
V1—volume of analyzed solution, mL;
V—dilution volume of the catalyst, mL;
P—dilution volume of the working solution “P”, mL;
r—volume of stock solution “M”, mL.
The mass fraction of cobalt (
Y) in % is calculated by the formula:
where
X—mass fraction of cobalt oxide CoO, %;
M1—molecular weight of cobalt oxide CoO, g/mol;
M2—molecular weight of cobalt, g/mol.
3. Results and Discussion
3.1. Characterization of the Catalysts
Both the S2 and B catalysts were investigated by X-ray diffraction and by transmission electron microscopy (TEM) with localized EDS. It is necessary to note that X-ray diffraction would not be very informative in this case because it is very difficult to distinguish the diffraction peaks of Co3O4 from those of CoAl2O4. For the S2 catalyst, however, the diffraction profile analysis allowed the calculation of the Co3O4 crystallite size of 17 nm.
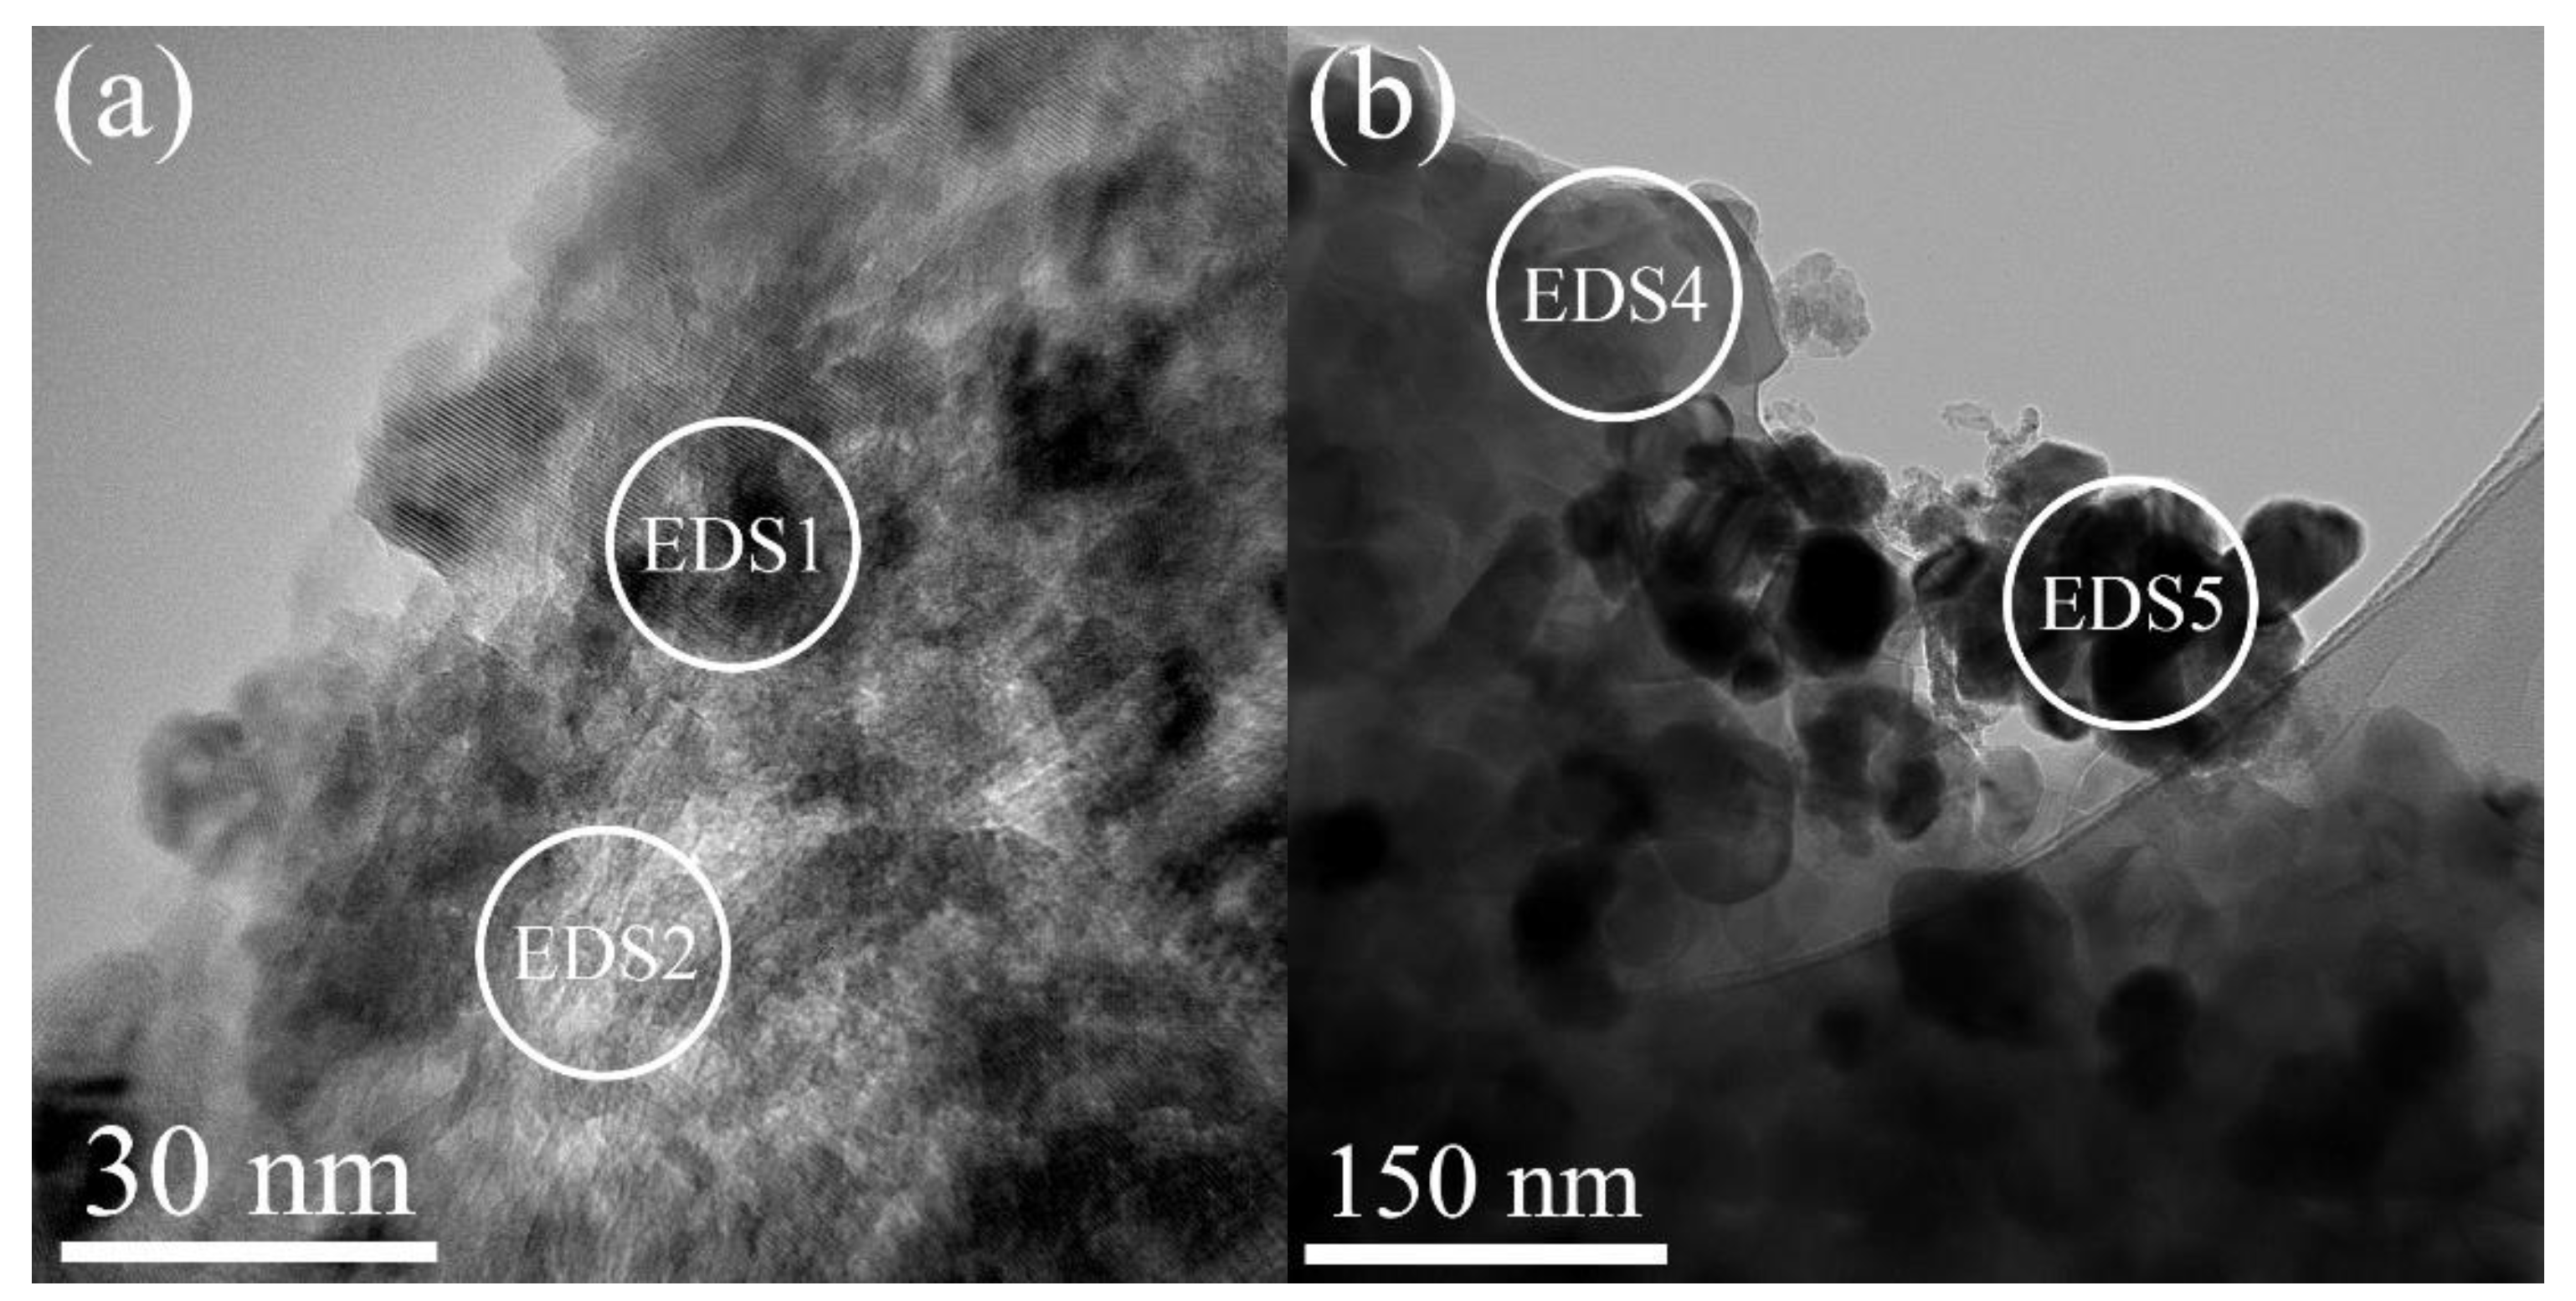
TEM images of the investigated catalysts are shown in
Figure 2. The darker areas in the images (localized spots EDS1 and EDS5) correspond to cobalt-rich clusters. As EDS analysis reveals in
Table 1, the EDS1 spot in catalyst S2 contains Co
3O
4; whereas, the EDS5 dark spot in catalyst B represents primarily Co metal clusters. Lighter local areas are characterized by varying Co/Al ratios and also by the presence of Si, which suggests that these areas represent mostly zeolite in the case of S2 and a mixture of the zeolite with CoAl
2O
4 spinel in the case of the B catalyst. The size of the cobalt-rich clusters measured by TEM is different for S2 (10–30 nm, which is consistent with the X-ray diffraction-produced crystallite size of 17 nm mentioned above) and B (50–150 nm) catalysts. This difference can be expected since B-catalyst clusters were formed by sintering the S2-catalyst clusters with each other. Indeed, the B-catalyst formation route and the results of experimental investigation suggest the following sequence of cluster transformations: the Co/Co
3O
4 clusters formed after step (a) go through dismutation during step (c), namely, the Co
3O
4 part forms spinel through interaction with alumina binder, and the Co parts are sintered together forming larger metallic crystals, as observed in
Figure 2b.
These conclusions are supported by the results of chemical analysis. The content of active Co in the S2 catalyst is the same as the total Co content. In contrast, the B catalyst contains that same amount of total Co but only 6.3% weight of active cobalt. This means that the remaining 13.7% was immobilized in inactive spinel. It is necessary to notice that the pore volume by water sorption (transportation pores) did not change significantly after thermal treatment, i.e., 0.47 to 0.50 cc/g. By contrast, the pore volume by N2 adsorption decreased by two times, from 0.22 to 0.12 cc/g. This can be explained by the sintering of aluminum oxide with cobalt oxides into spinel.
Thus, the results of the catalysts’ characterization show that the newly formed B catalyst can be described as a catalyst with a special structure of the active surface, where Co clusters are isolated from each other due to the environment of inactive spinel CoAl2O4, and inter-site transport is provided by an extensive intragranular graphitic network serving simultaneously as a heat-conductive medium. As a result, one can expect that FTS in the presence of the B catalyst will proceed in the kinetic region.
3.2. Catalytic Testing
For determining catalytic parameters in FTS, catalysts B and S2 were tested according to the procedure described above. No deactivation was observed during the testing.
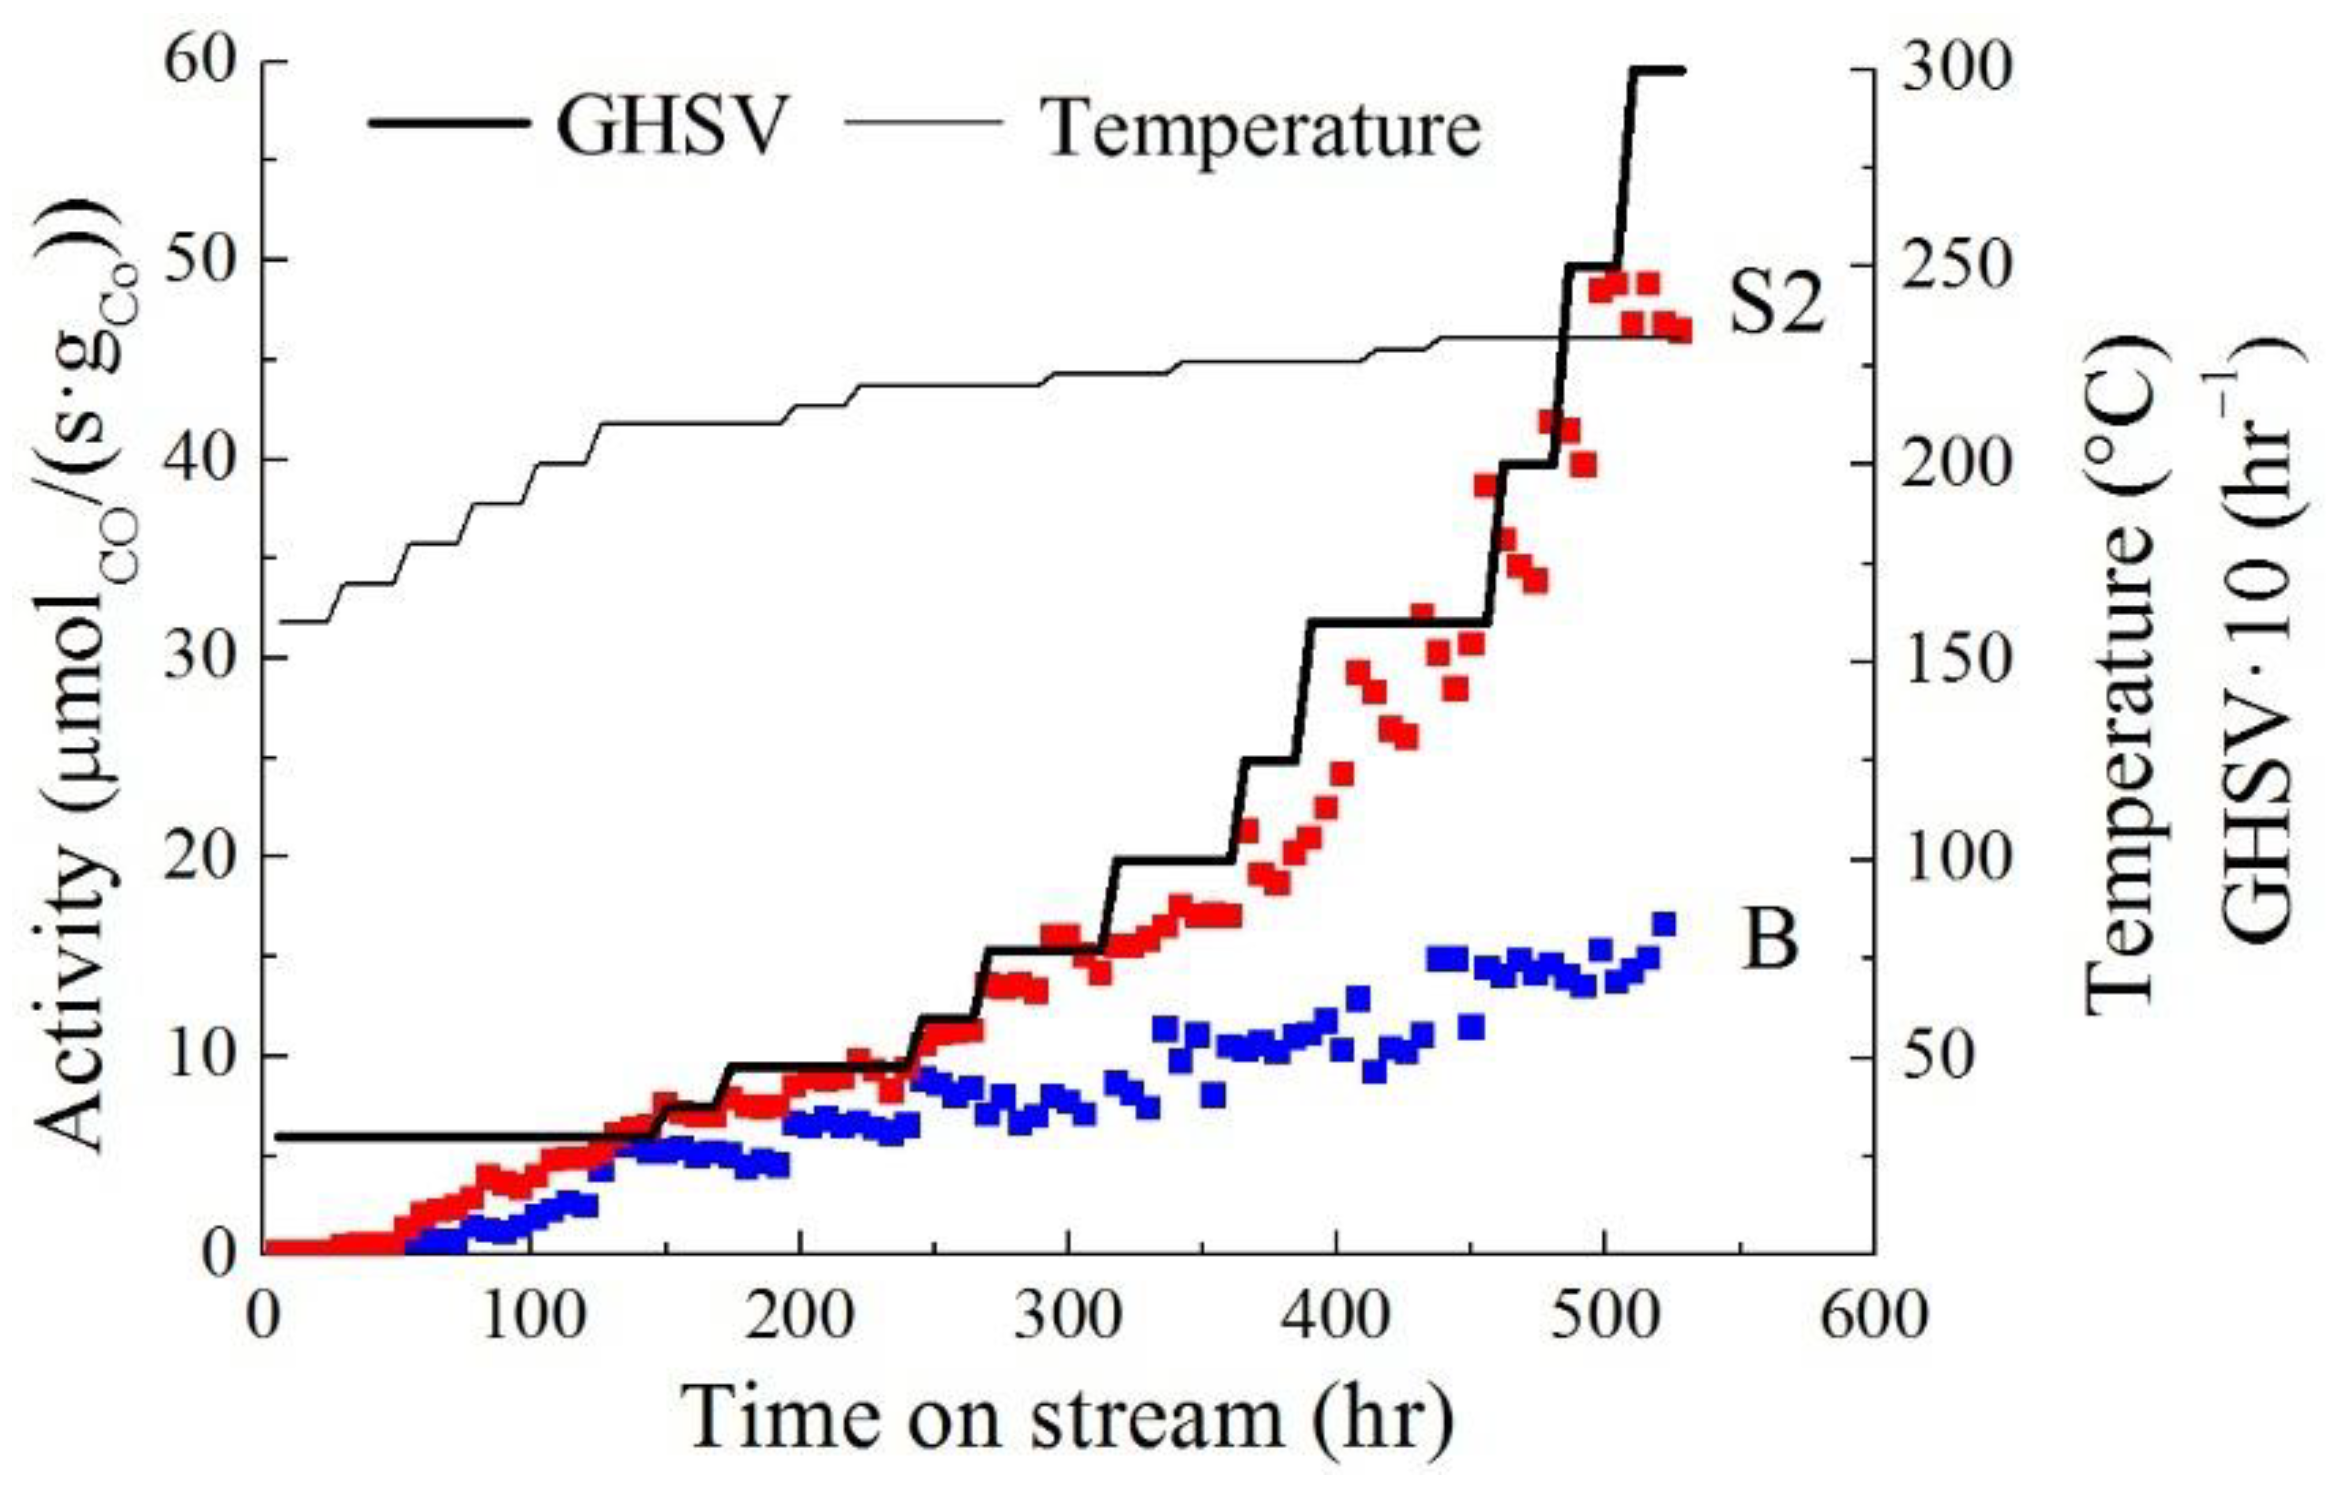
Figure 3 shows the activity of both catalysts over the entire testing range. The activity was calculated by taking into account the cobalt content determined by the method described above: 6.3 wt.% in catalyst B, 20 wt.% in catalyst S2. The graph shows that both catalysts are active in the FTS. At a temperature range of 170–215 °C and GHSV of 300–600 h
−1, the activity of the two catalysts is comparable, but with a further increase in the temperature and velocity of the source gas, the activity of catalyst B (blue dots) lags significantly behind the activity of the reference catalyst S2 (orange dots). At 3000 h
−1, the highest activity of catalyst B was 19 μmol
CO/(s·g
Co); whereas, the activity of S2 was three times higher—60 μmol
CO/(s·g
Co), which is correlated with the three times higher content of active cobalt in catalyst S2 than in catalyst B. The activity of the reference S2 catalyst only keeps growing with a GHSV increase beyond 600 h
−1. We explain this observation by involving new active centers into FTS due to overcoming diffusion limitations at higher GHSV. As for the B catalyst, access to all active sites is already open even at a lower GHSV.
Table 2 shows some other FTS catalytic parameters obtained by testing catalysts S2 and B. Comparison of the above data demonstrates that the conversion of CO in the presence of catalyst B is 4–11 times lower than in the presence of S2, and the difference increases with increasing synthesis gas supply rate. This also indicates that 6.3 wt.% content of active metal concentrated in enlarged sintered clusters is not enough to maintain the same degree of CO conversion as S2 shows. In the entire range of synthesis conditions both catalysts manifest comparable selectivity to C
5+ hydrocarbons, but catalyst B has higher selectivity to methane. The yield of C
5+ hydrocarbons, as well as the CO conversion, depended more on the content of the active metal than on the selectivity: in the presence of catalyst B, it decreased from 22 to 9 g/m
3 with an increase in the synthesis gas rate from 300 to 3000 h
−1, and for S2 it decreased from 93 to 71 g/m
3.
Analysis of the synthesis products obtained at 220 °C, 1000 h
−1 and 2 MPa showed that the cobalt content in both catalysts did not significantly affect the final composition of hydrocarbons, at least under those synthesis conditions (
Table 3).
3.3. Determination of Kinetic Parameters
Understanding the Catalyst Operation Region
The S2 catalyst manifests diffusion-burdened behavior typical for granulated FTS catalysts as was shown in our earlier works [
16,
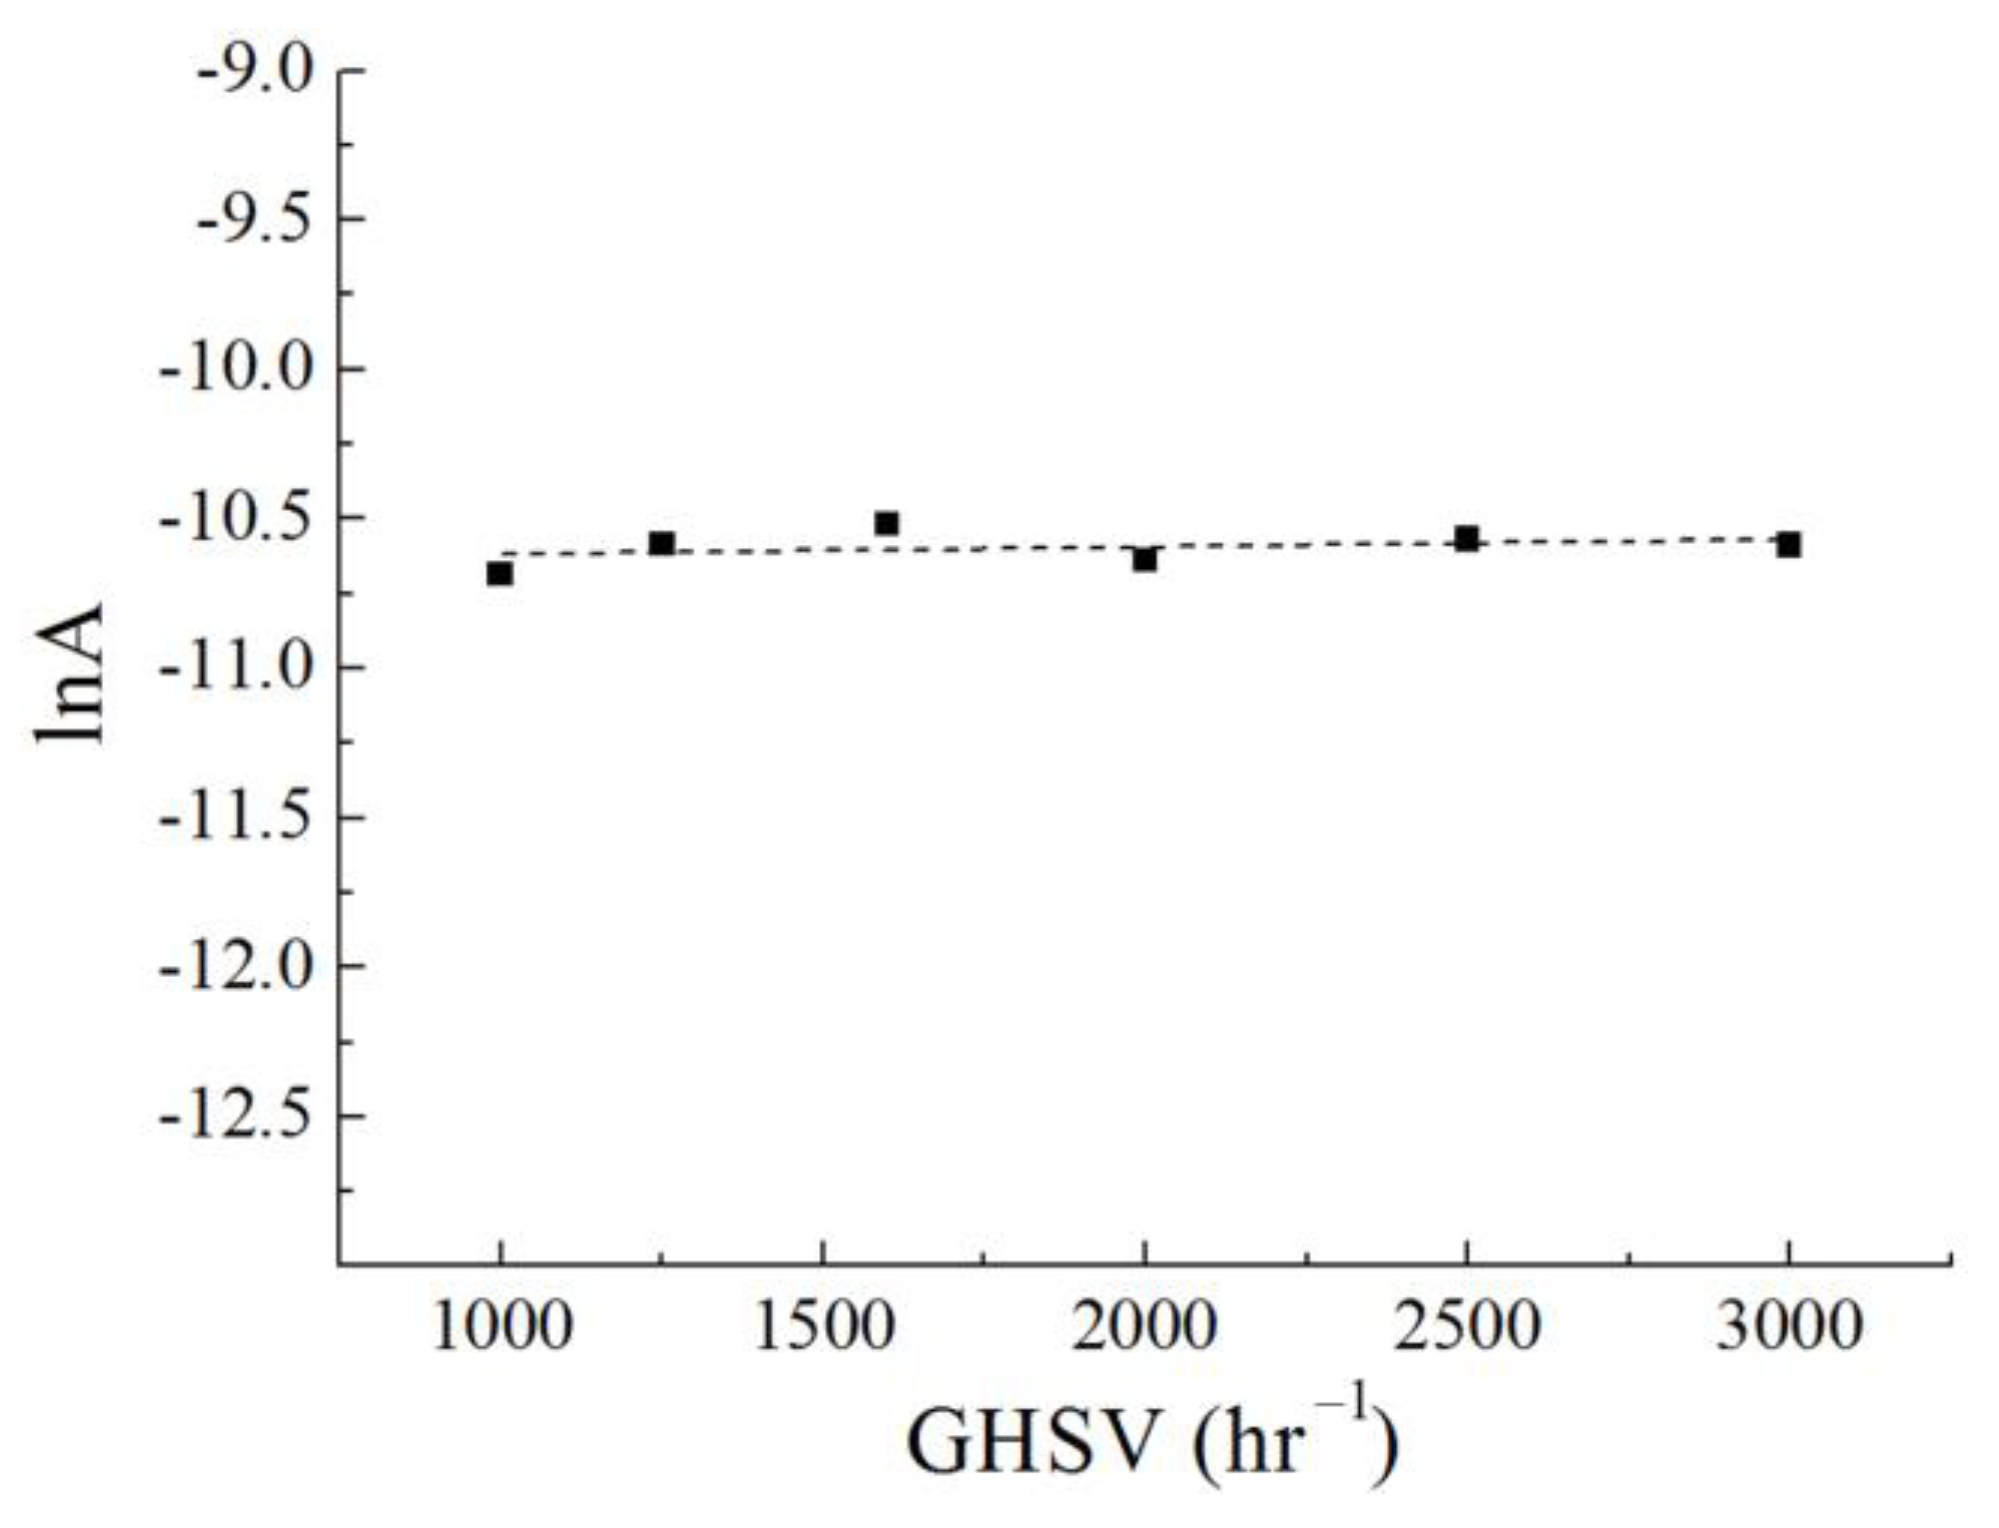
19]. The B catalyst deserves a devoted study due to its unusual structure. To determine the region of catalyst operation—kinetic or diffusion—a series of experiments were carried out under isothermal conditions (at 243 °C and 2 MPa) in the presence of catalyst B. Because an increase in the gas supply rate reduces diffusion restrictions, the volume rate of the synthesis gas was increased from 1000 to 3000 h
−1. Based on the obtained experimental data, the dependence of catalyst B activity versus synthesis gas velocity was plotted (
Figure 4).
The graph in
Figure 4 shows that the activity of the studied catalyst did not change with an increase in synthesis gas consumption from 1000 to 3000 h
−1, which means that the reaction proceeds in the kinetic region. Calculation of Weisz–Prater and Mears criteria confirmed that both internal and external diffusion transfer effects can be neglected—see details in
Supplementary Table S1. This makes it possible to determine some kinetic parameters of the FTS in the presence of an undiluted granular catalyst.
Determining the Apparent Activation Energy
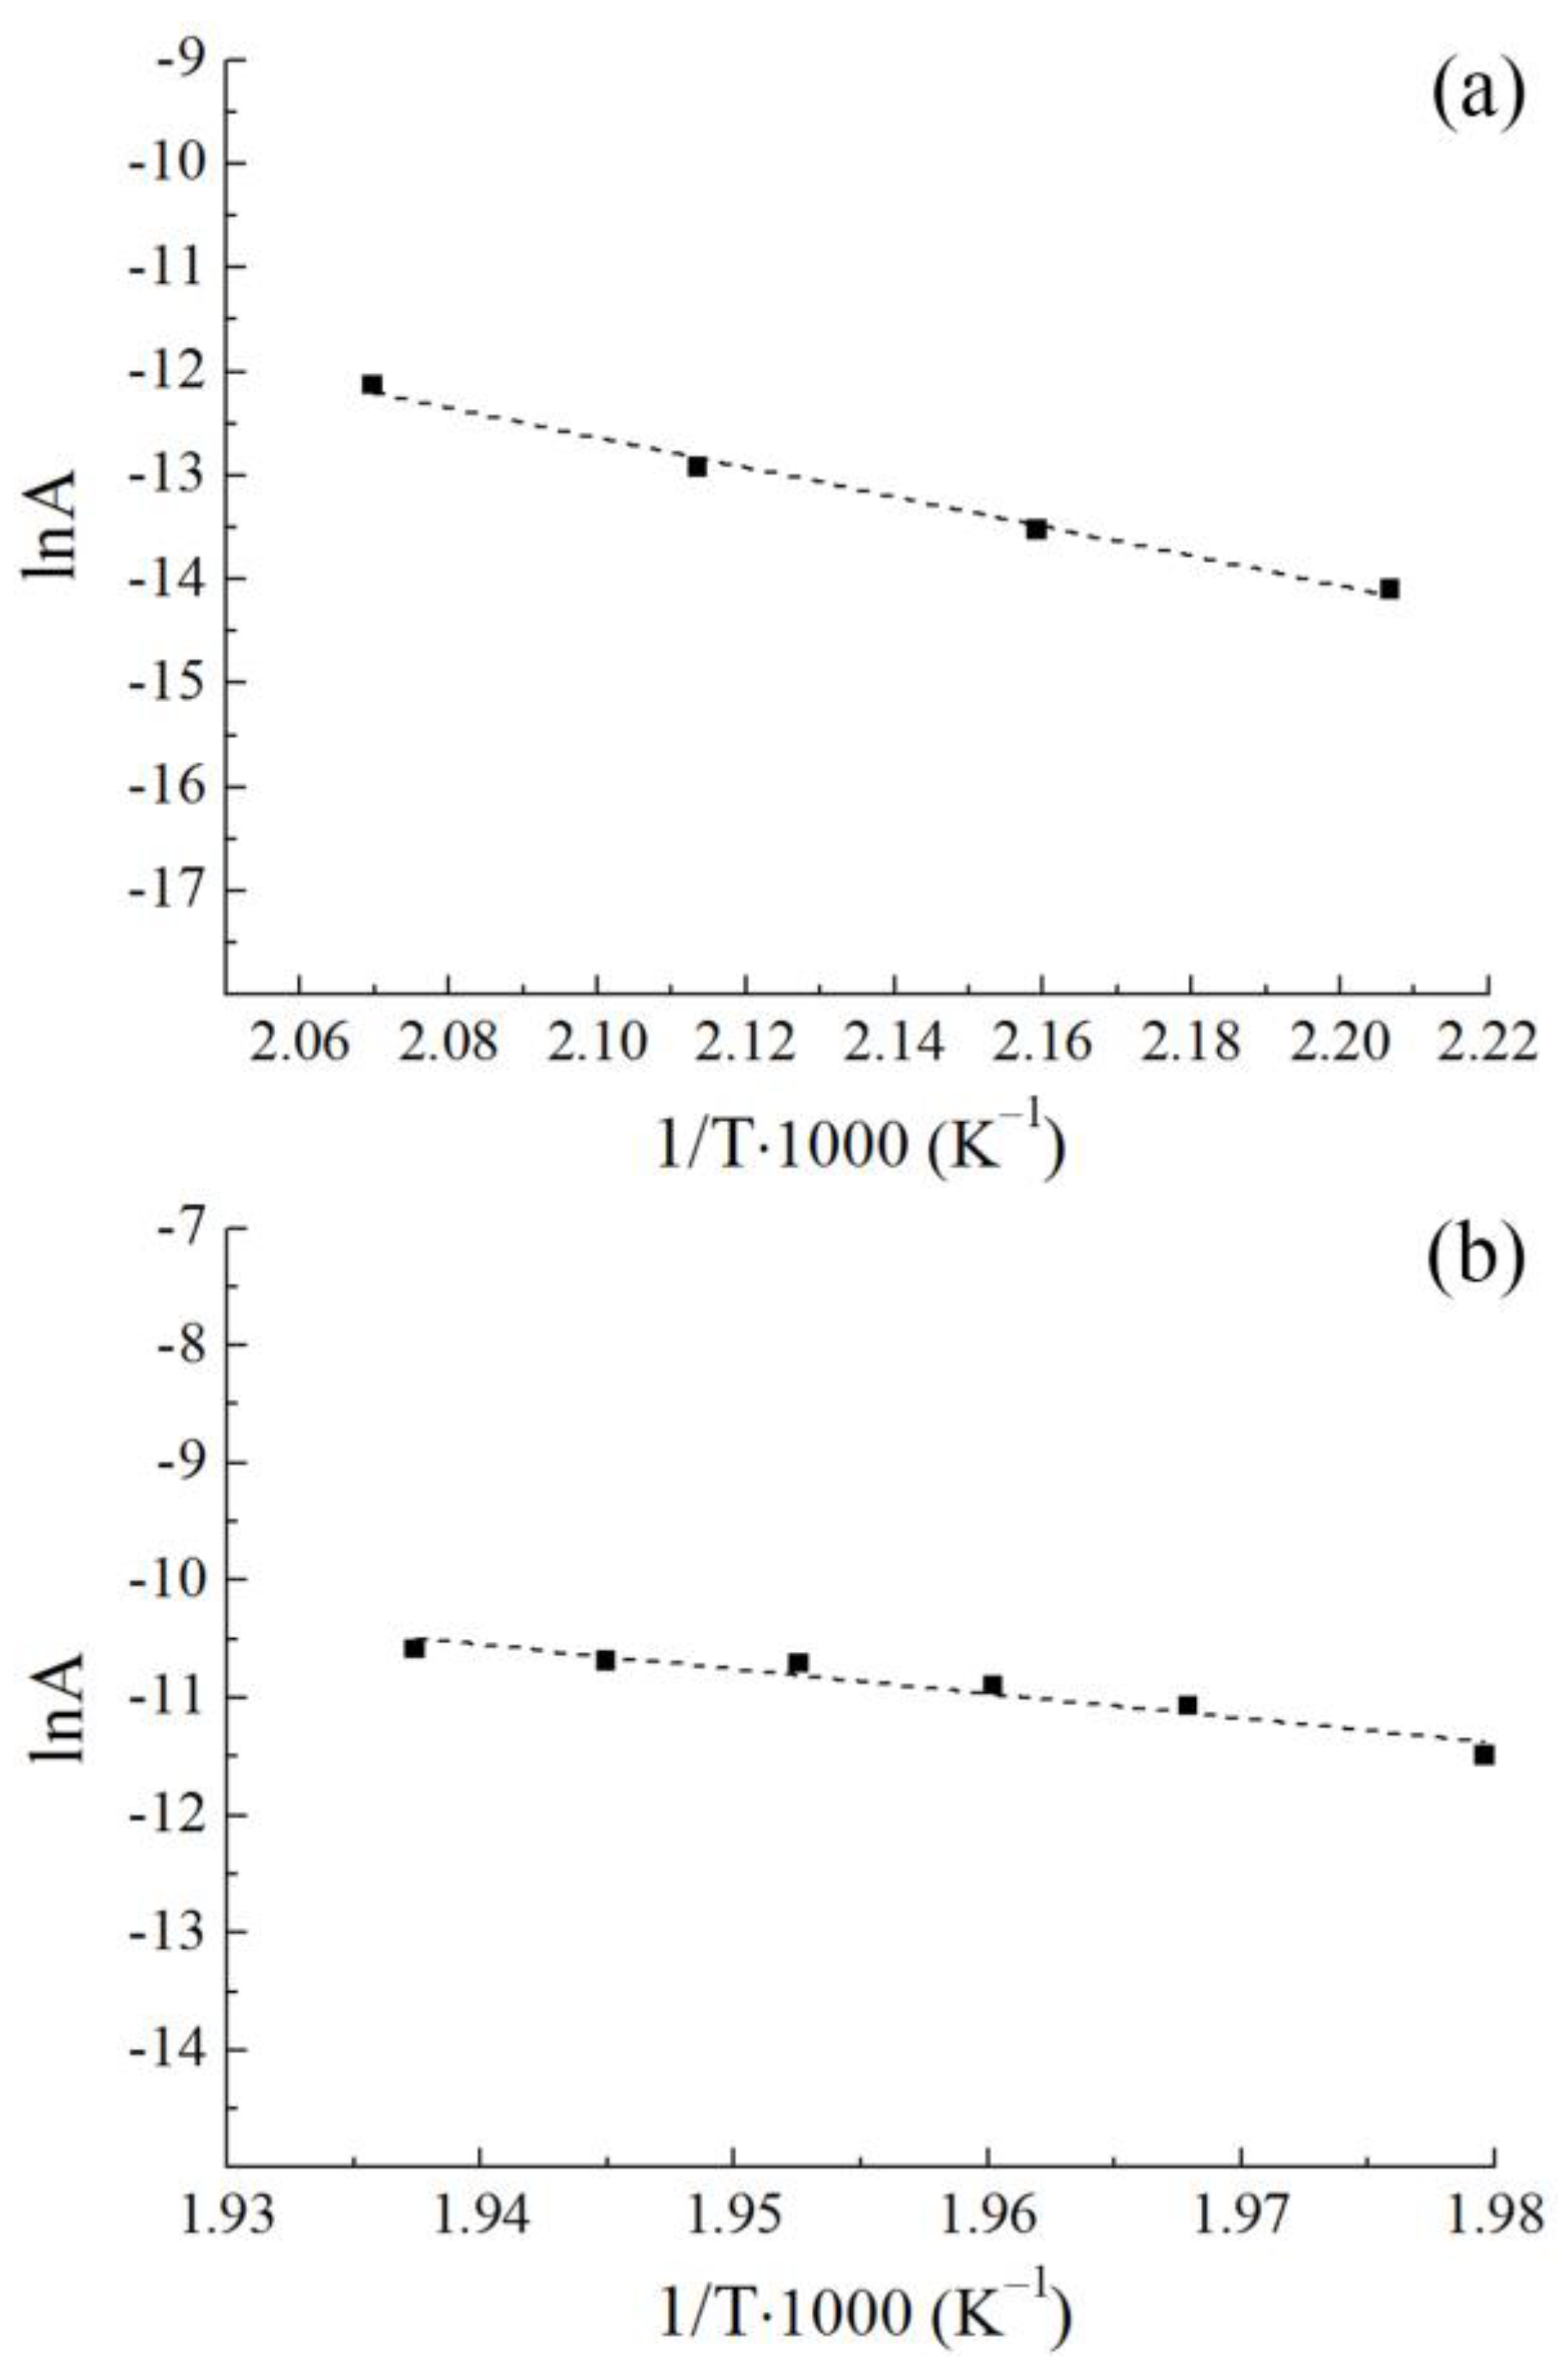
To determine the apparent activation energy, the effect of the synthesis temperature in the range of 170–243 °C on the activity of catalyst B was studied. Based on the data obtained, graphs were plotted in Arrhenius coordinates (lnA–1/T) and the values of the apparent activation energy were calculated (
Table 4,
Figure 5). Analysis of the results revealed that the activation energy depends on temperature: there are two temperature ranges characterized by different values.
The graph in
Figure 5a shows the linear dependence of activity on temperature in the range of 180–210 °C, which is described by the equation:
Activation energy for 180–210 °C temperature range is calculated from the tangent of inclination angle:
and the pre-exponential factor:
.
Figure 5b demonstrates that the dependence of activity on temperature in the range of 232–243 °C is linear as well, and is described by the equation:
Activation energy for the temperature range 232–243 °C is calculated from the tangent of inclination angle:
The pre-exponential factor is calculated using:
Thus, in the temperature range of 180–210 °C, the activation energy of FTS is 118.2 kJ/mol, and in the temperature range of 232–243 °C, the activation energy is 173.6 kJ/mol. Probably, this difference is explained by the contribution of acidic sites in zeolite, which are active in the transformations of hydrocarbons: as shown in [
20], below 210 °C their activity is almost not exhibited and at 232–243 °C it is already significant. It can be assumed that zeolite influences the mechanism of the FTS reaction, which contributes to an increase in the energy barrier.
The activation energy of FTS observed in the literature data varies in quite a wide range—from 30 to 130 kJ/mol [
10,
15,
19,
21]. Thus, the activation energy of FTS, determined in the presence of a granular catalyst without diluting the layer with an inert material, falls within the range of the literature data obtained in the presence of powdered catalysts, at least in the low-temperature range in which the active sites of the zeolite contained in the granular catalyst do not show activity.
Reaction Order Determination
To determine the reaction order of CO and H
2 in the presence of catalyst B, the synthesis pressure was varied in the range of 1–2 MPa under conditions of 243 °C and 1000 h
−1. The obtained data are presented in
Table 5.
Reaction order was calculated using the Van ‘t Hoff method, based on two values of the reaction rate and concentration:
Thus, the reaction order of CO and H
2 on the surface of the granular catalyst—~0.5—corresponds to the literature data obtained for powdered catalysts, for which the reaction order varies from 0 to 1 [
21].
3.4. Composition of Liquid Hydrocarbons
During the testing of catalyst B, samples of C
5+ hydrocarbons were regularly taken to obtain the data used for the calculations of kinetic parameters. The composition of these products, depending on the synthesis conditions, is given in
Table 6. From the data presented, it is observed that a rising temperature leads to an increase in the content of alkenes, probably due to the contribution of secondary transformations of hydrocarbons at the acid sites of zeolite [
22,
23]. At the same time, the proportion of C
19+ hydrocarbons and the probability of chain growth decrease.
Variation of the synthesis gas feed rate in the range of 1000–3000 h
−1 had a negligible effect on the composition of C
5+ hydrocarbons; however, reducing feed rate leads to a slightly greater content of C
5–C
10 hydrocarbons (
Table 6). This is probably due to a smaller bypass of these products through the collector without condensation. Reducing synthesis pressure causes a decrease in the contribution of secondary cracking products due to isomerization products [
24] and a decrease in the probability of chain growth, which is also consistent with literature data [
1,
2].
4. Conclusions
Therefore, the developed method of consecutive thermal treatments allowed the creation of a granular catalyst with a special structure of the active surface, in which the sites active in FTS are isolated from each other due to the environment of inactive spinel CoAl2O4, and inter-site transport is provided by an extensive intragranular graphitic network serving simultaneously as a heat-conductive medium. As a result, the FTS proceeded in the kinetic region. This catalyst contains 6.3 wt.% of cobalt in the form which is active in FTS; whereas, the reference granular prototype S2 contains 20 wt.%. The activity of the catalyst in FTS was three times lower than that in S2, fully correlating with the content of cobalt in the active form. Despite the fact that kinetic studies of catalysts in granular form are difficult due to the influence of external and internal diffusion, we were able to carry out synthesis in the kinetic region in the presence of a granular catalyst and determine the activation energy and reaction order of CO and H2. It was found that the reaction kinetics obey the Arrhenius equation, and the activation energy depends on temperature: in the range of 180–210 °C it is 118.2 kJ/mol, and in the range of 232–243 °C it is 173.6 kJ/mol. This is due to the activity of zeolite, which is inactive below 210 °C and is active in the secondary transformations of FTS products at a higher temperature.


