Article

UV/VIS-Spectroscopic Inline Measurement for the Detection of Fouling Processes during the Polymerization of N-Vinylpyrrolidone

1
Center for Mass Spectrometry and Optical Spectroscopy (CeMOS), University of Applied Science Mannheim, 68163 Mannheim, Germany
2
Institute of Chemical Process Engineering (ICVT), University of Stuttgart, 70199 Stuttgart, Germany
*
Author to whom correspondence should be addressed.
Reactions 2023, 4(1), 176-188; https://doi.org/10.3390/reactions4010011
Submission received: 10 January 2023 / Revised: 2 February 2023 / Accepted: 9 February 2023 / Published: 1 March 2023

Abstract

:
With the goal to better process the monitoring of occurring fouling, a backscatter probe was developed to perform in-line measurements in a half-shell reactor during the reaction of N-vinylpyrrolidone (NVP) to polyvinylpyrrolidone (PVP). The measurement technique detects the changes of bands in the UV range, which allows a direct correlation with the concentration. Thus, the measured absorbance signal allows a conclusion on the accumulation of fouling in the reactor and on changes in the conversion at the measurement location.

1. Introduction

The field of process analytical technology (PAT) covers industrial areas such as chemistry, pharmacy, and petrochemistry [1,2]. The analytics used are constantly evolving to increase the quality of products and the degree of automation [2,3]. Optical spectroscopy, in particular, offers opportunities to obtain data that provide direct information about molecular compositions. This can be used to supplement or completely replace indirect parameters such as temperature and pressure [2]. Optical spectroscopy can be divided into UV/VIS spectroscopy, near-infrared spectroscopy, mid-infrared spectroscopy, fluorescence spectroscopy, and Raman spectroscopy, thus offering a wide field of possible applications [4,5,6].
The measurement technique used in this work is UV spectroscopy. The wavelength of typically used UV lamps is 160–400 nm [7]. Quantitative analysis of the samples is usually achieved by measuring the absorbance of the light. According to the Lambert–Beer law, there is a linear correlation between the path length and the signal, as well as between the concentration and the signal [4,7]. The prerequisite is that the sample to be measured also has detectable bands in the UV range, which does not apply to every substance and thus does not allow universal application [8]. The advantage of this method lies in its non-destructive measurement method, and in its simple implementation of processes. In this work, the implementation of the sensor system was performed by a narrow rod probe (Ø = 1.6 mm) inserted lengthwise, through drilled mixing elements, into a half-shell reactor. The probe was aligned to the flat side of a metallic mixing element, which allowed an extinction measurement in backscatter. The aim of the measurement was to detect fouling generated during a reaction.
Fouling is generally a solid deposit formed during a reaction process. Tank reactors are the primary setting for batch and semibatch process activities used to produce polyvinylpyrrolidone, or PVP. In those reactors only minor fouling deposits occur [9]. Due to process intensification and energy reduction, smart scale reactors, such as tubular reactors with static mixing elements, were the focus of the presented study. Continuous reactor operation offered improved controllability, a higher volume-to-surface ratio, improved heat transmission, and good scaling from laboratory settings. The production of gel deposits was the fundamental disadvantage of using continuous reactors for PVP polymerization. The more fouling was deposited on the inner wall of a reactor, the lower the heat input or output and, in the case of flow-through tubular reactors, a shift in the conversion profile could occur due to the change in cross section [10,11]. In the context of this work, fouling occurred during the polymerization of N-vinylpyrrolidone (NVP) to polyvinylpyrrolidone (PVP). The reaction and the resulting problems due to fouling have already been investigated, for example, in works by Welzel et al. and Neßlinger et al. [12,13].
To date, there is no established state of the art for fouling measurements in reactors. However, there are several approaches that are still under development, such as ultrasonic sensors in the study by Osenberg et al. [14], quartz crystal microbalance in the study by Böttcher et al. [15], and general fouling investigations as described by Hohlen et al. [16]. For spectroscopic inline measurements of fouling, there are, however, no known examples in literature.
The aim of the following work was to use the developed UV rod probe to measure the formation of fouling deposits during the reaction of NVP to PVP in a half-shell reactor. In preliminary investigations, concentration series were measured, which showed the influence of the individual components on the spectrum. In addition, the change in conversion due to individual batches was simulated in order to correctly interpret the signal progression during the reactions. Following this, the reaction series were run in the half-shell reactor at different reactant and initiator concentrations. The information from the preliminary tests and from the manual tracing of the fouling layer on the probe allowed an interpretation of the signal course with respect to the layer growth and the reduction in conversion. It was also shown that the developed measurement setup had a higher sensitivity compared to conventional pressure measurements, and thus allowed an earlier detection of fouling.

2. Materials and Methods

2.1. Chemicals

BASF SE (Ludwigshafen, Germany) was provided with N-vinylpyrrolidone (NVP) in 30 kg barrels stabilized with 0.5% NaOH.
To remove stabilizer and high-molecular components, the monomer was vacuum-distilled in the column head at 81–83 °C. The monomer was then frozen. On the day of the experiment, the required quantity was defrosted and used.
The initiator, 2,2′-Azobis[2-methylpropionamidine]dihydrochloride (V-50), was acquired from WAKO chemicals (Ludwigshafen, Germany). It was consumed as delivered and kept in a refrigerator.

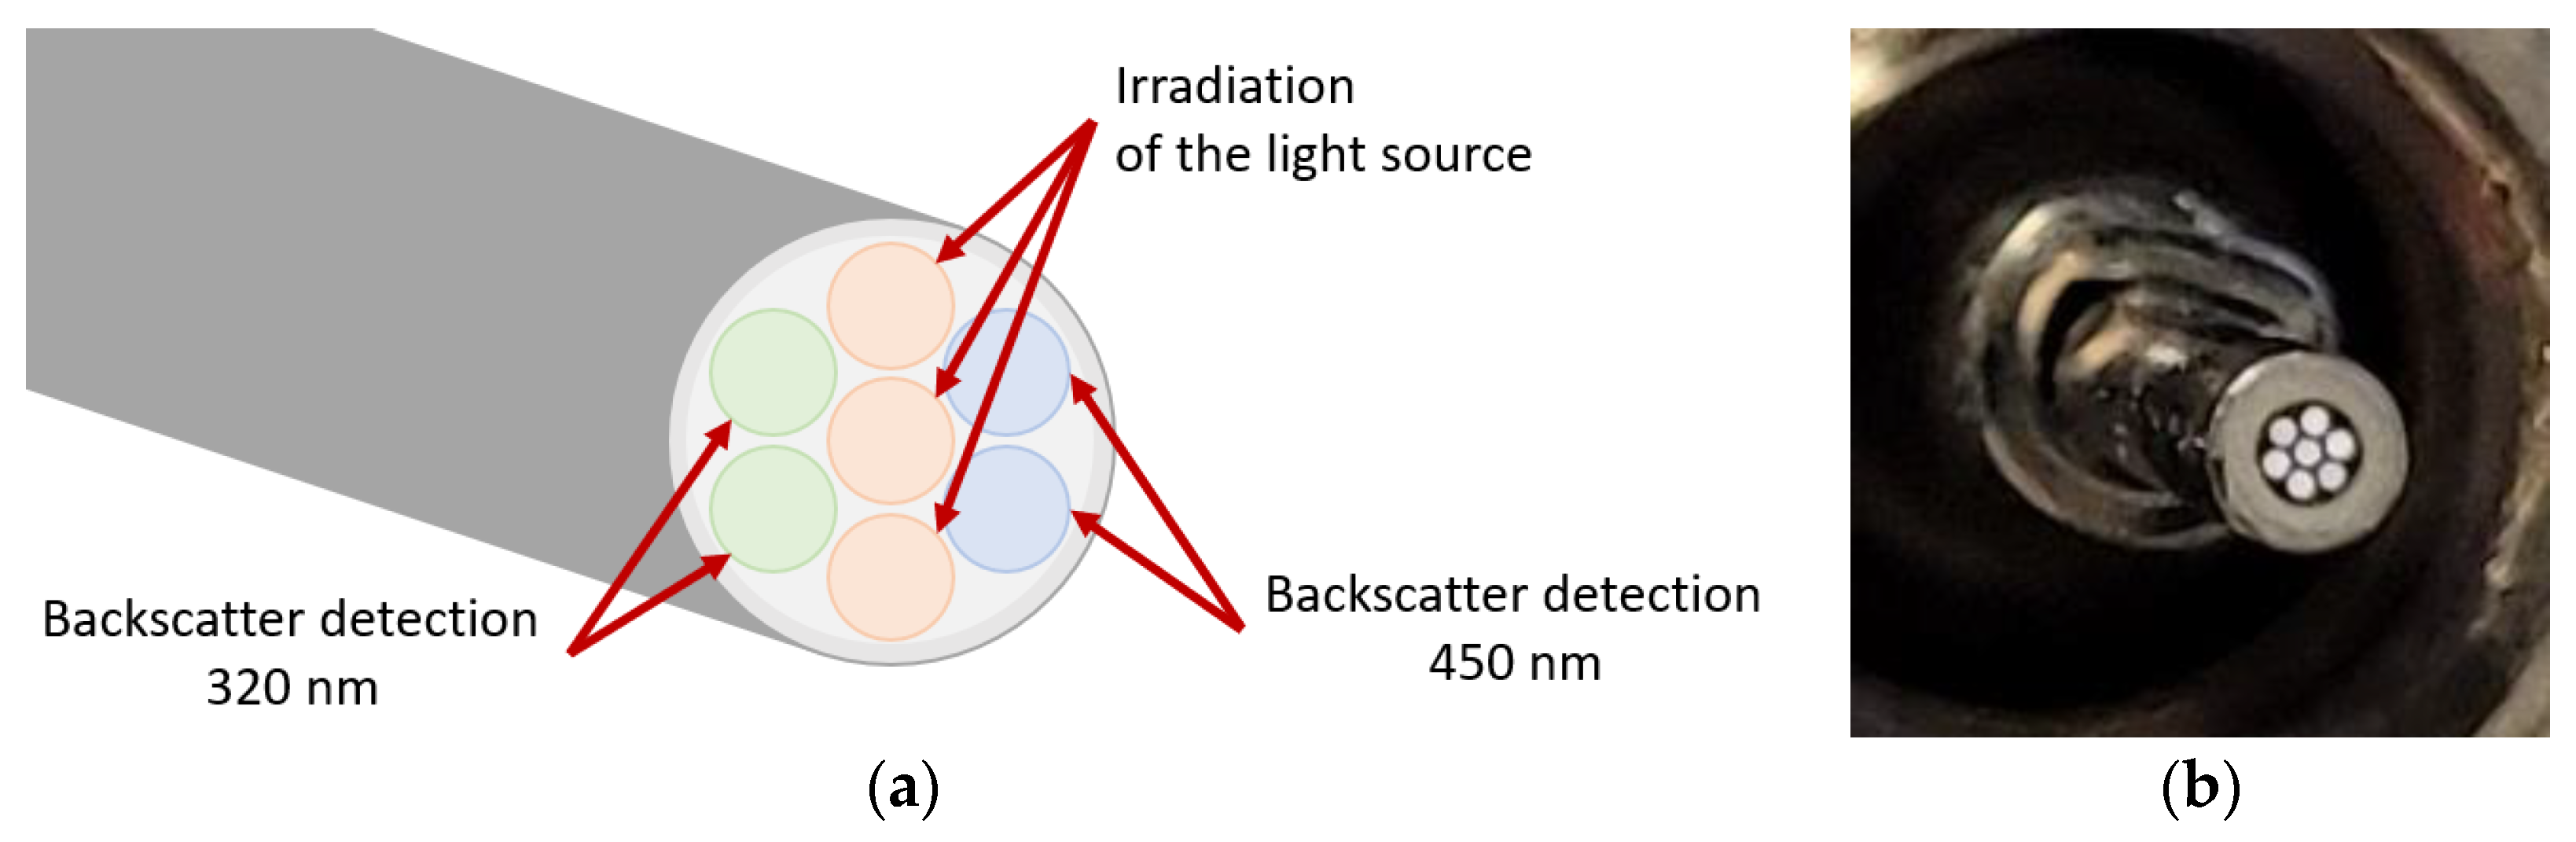
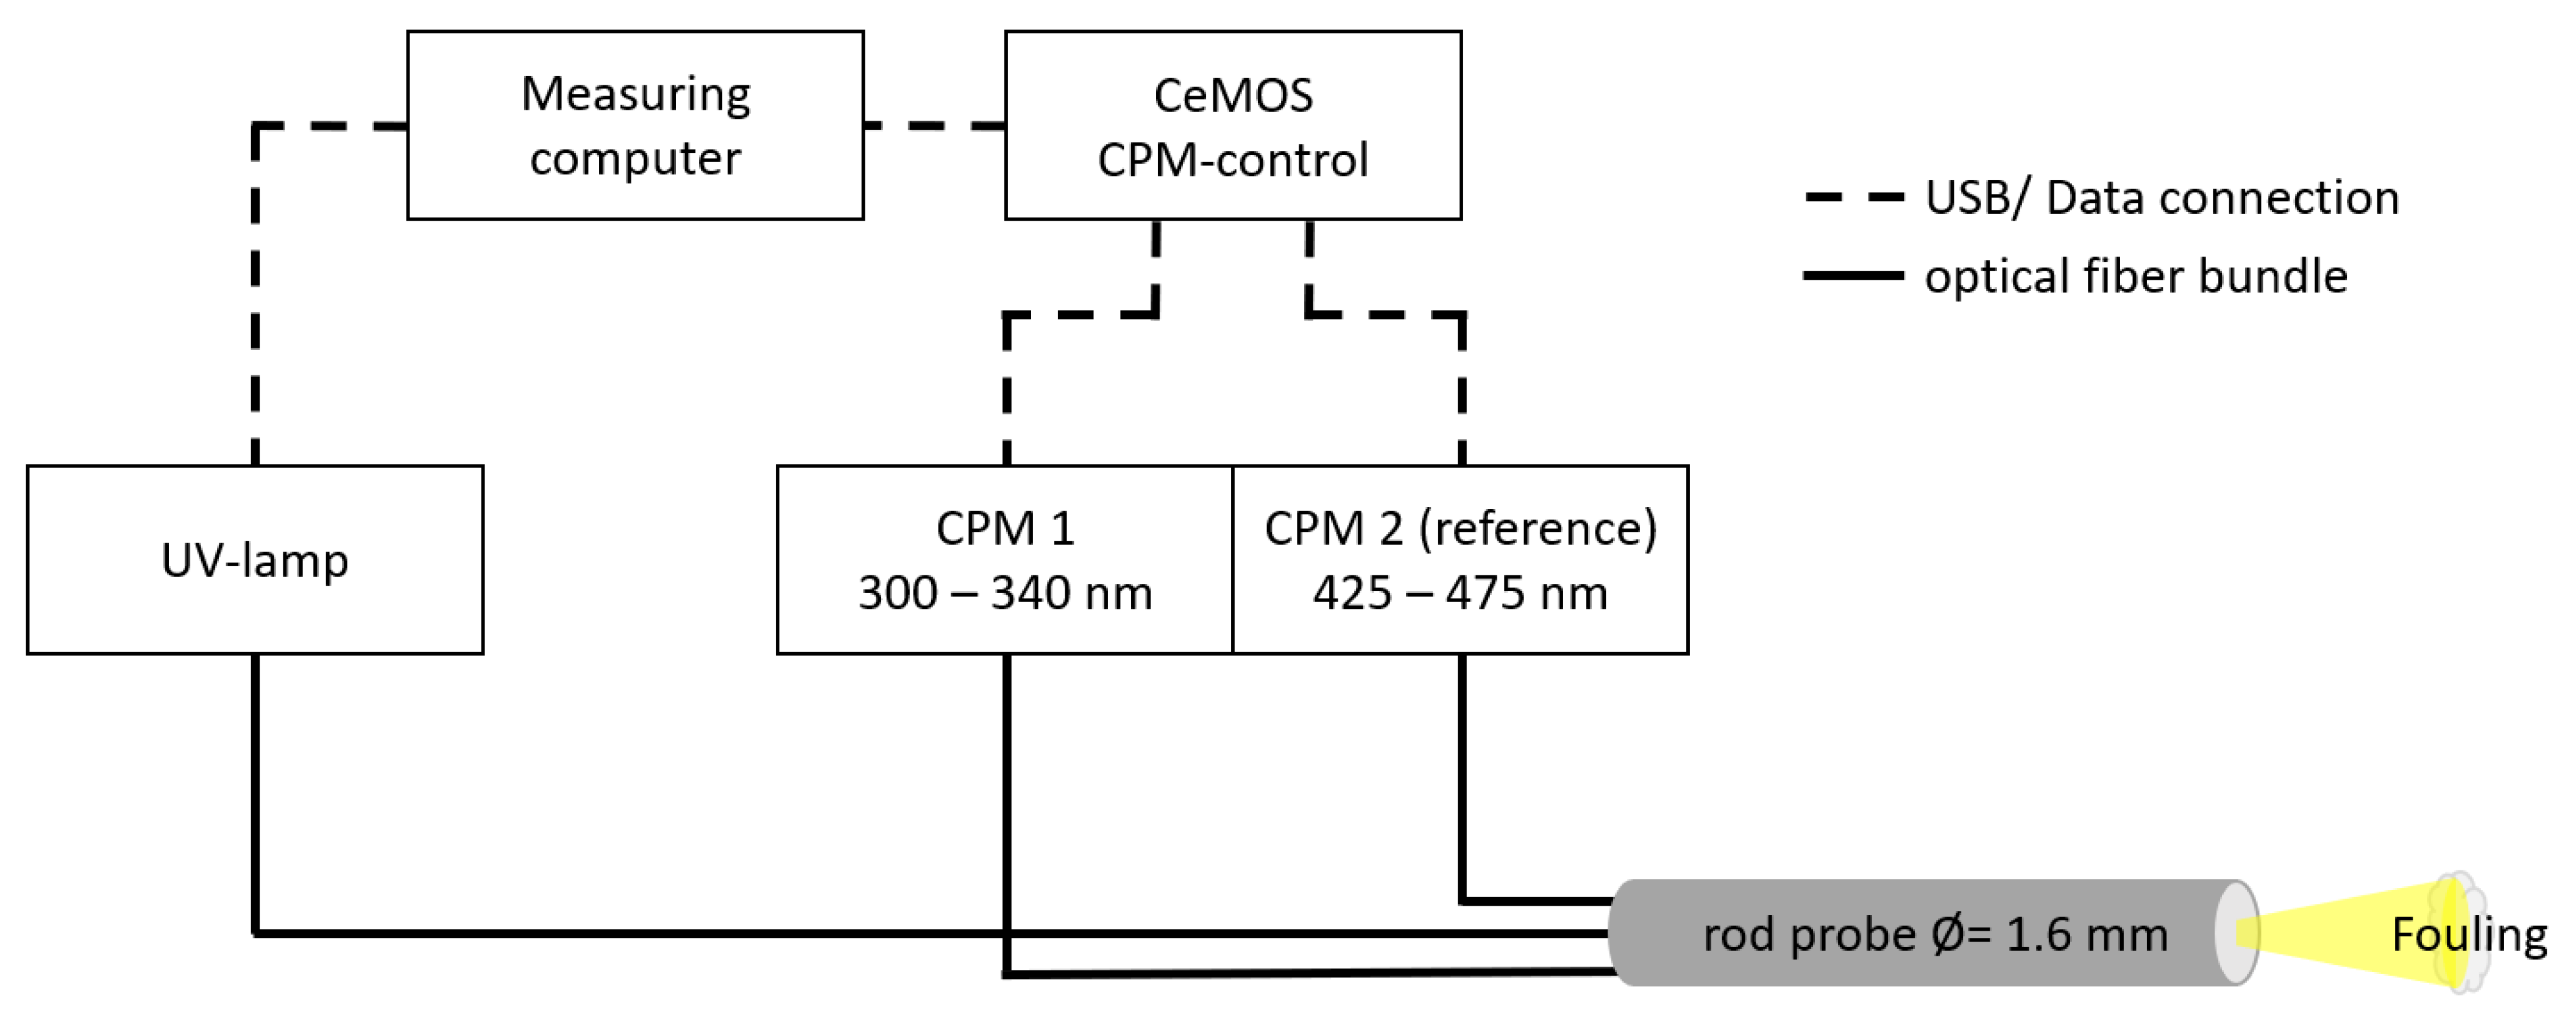
2.2. Optical Measurement Setup
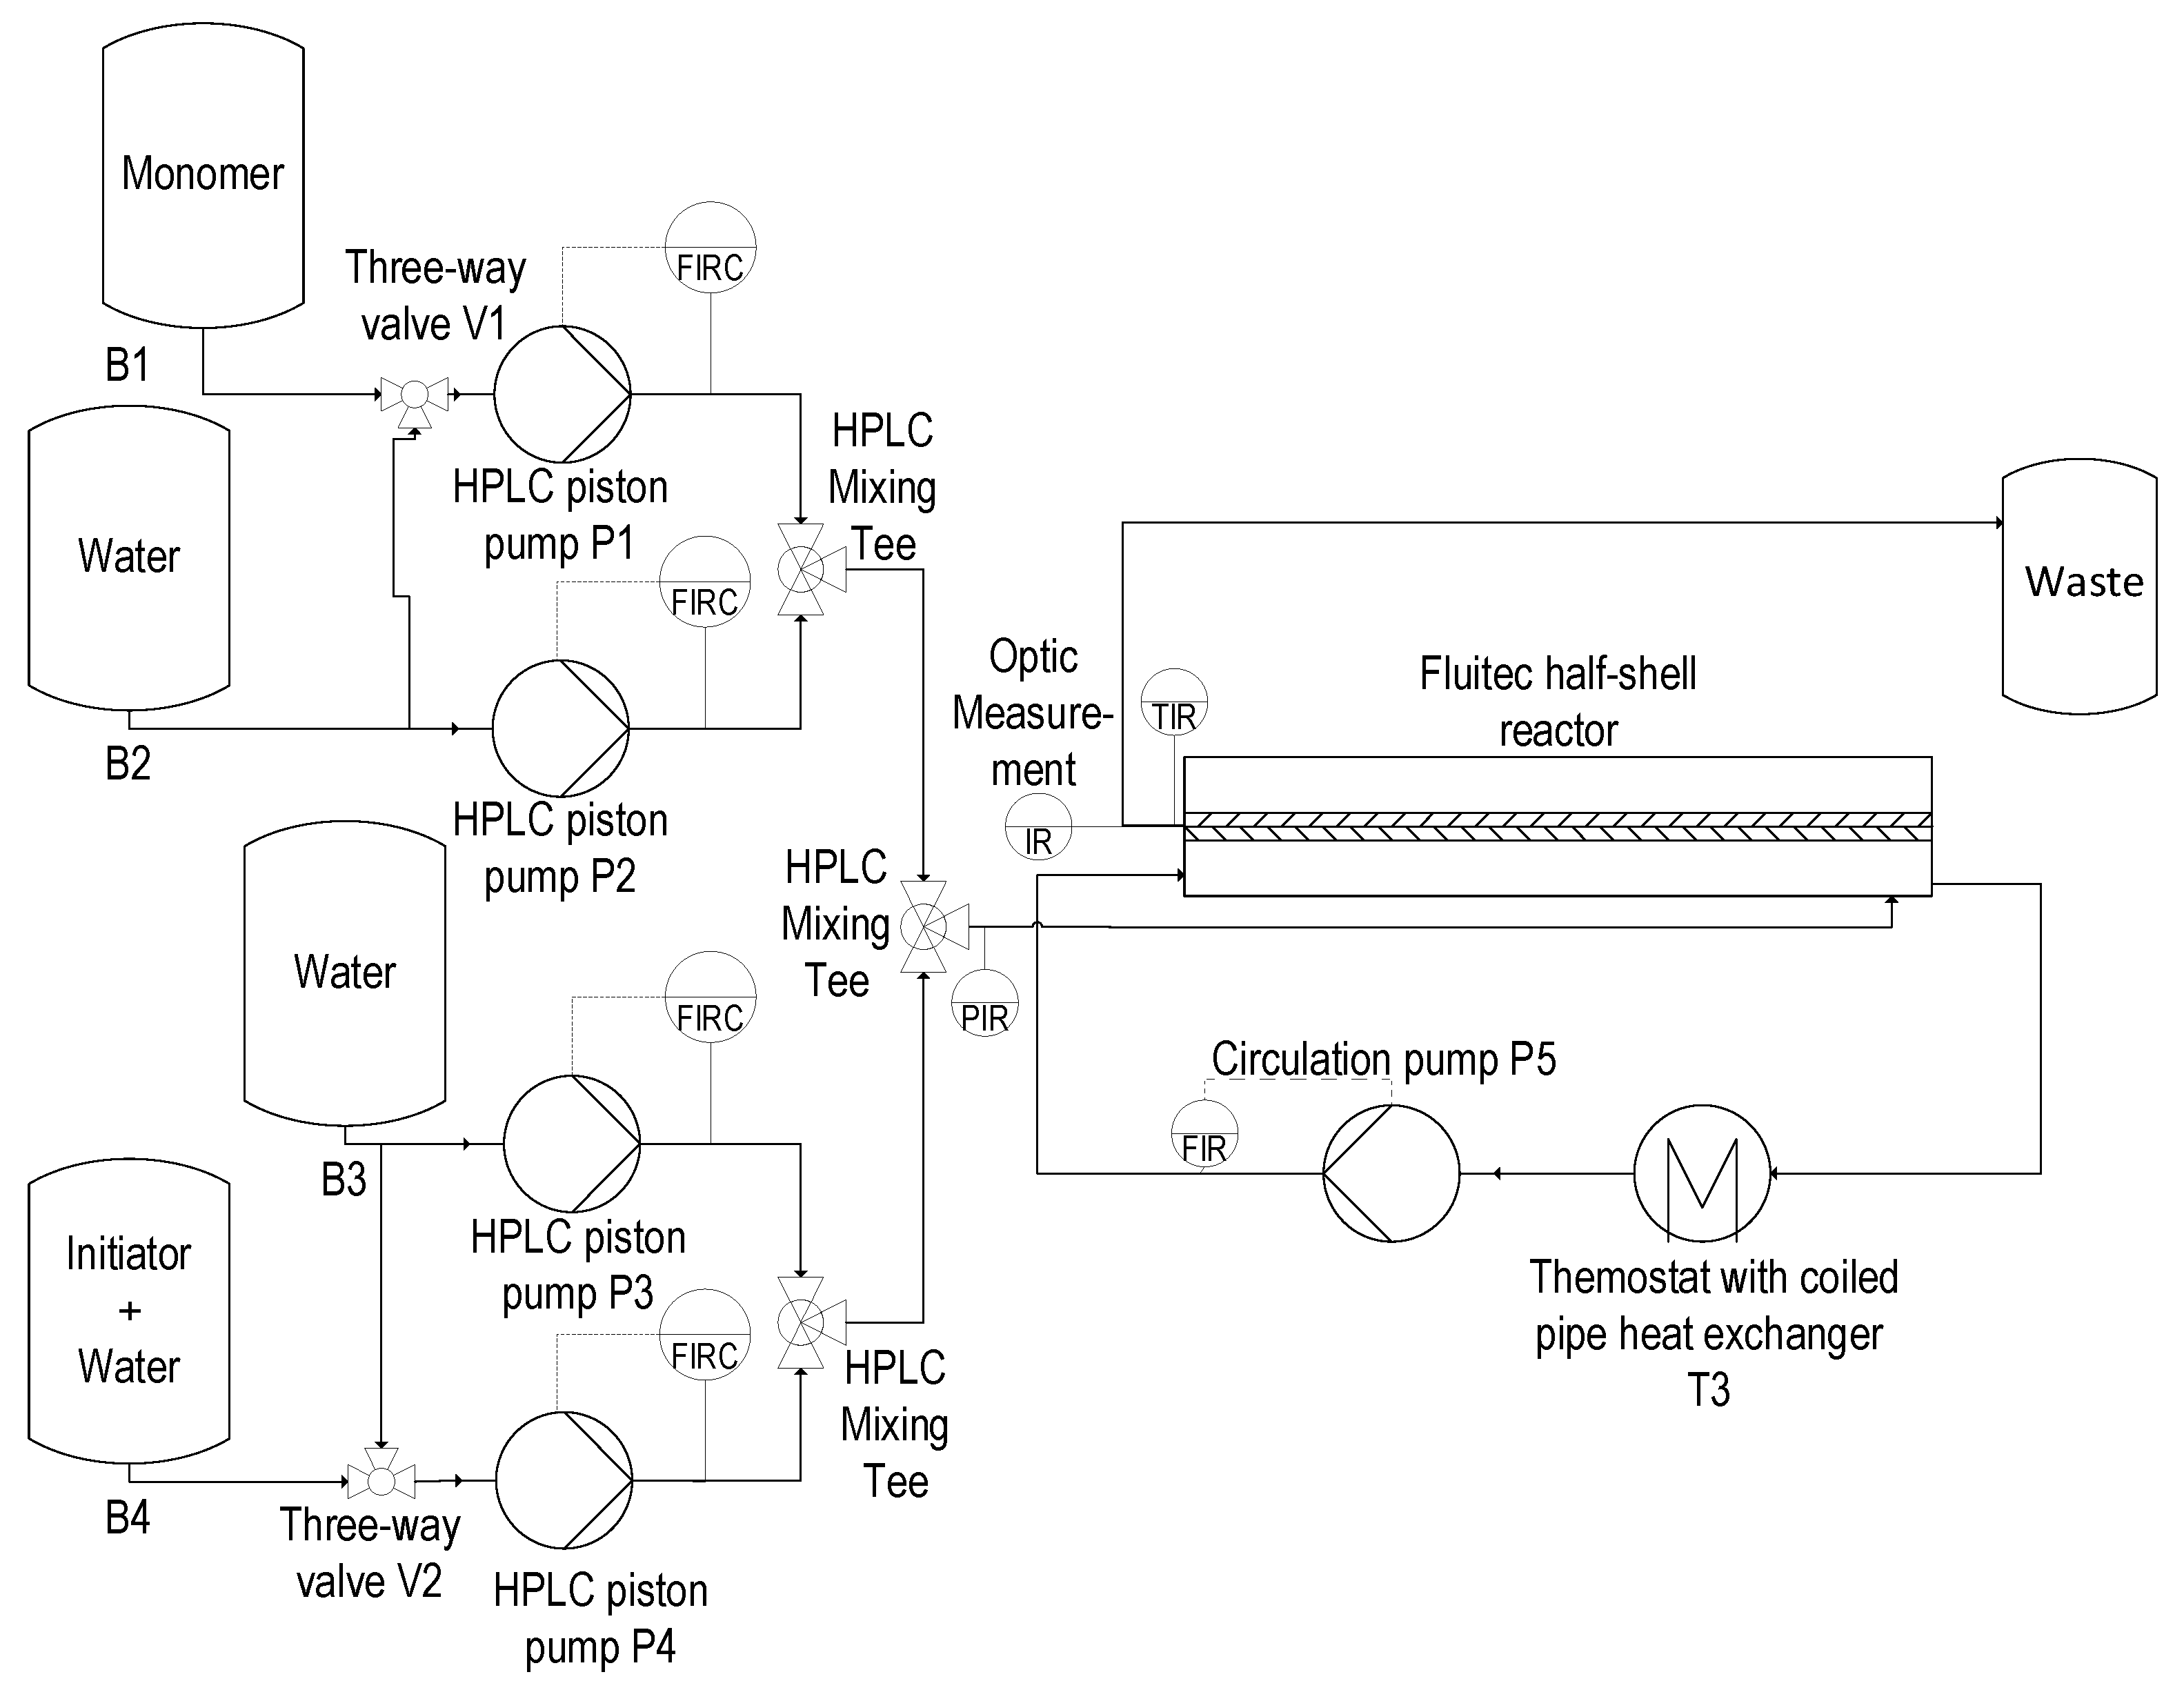
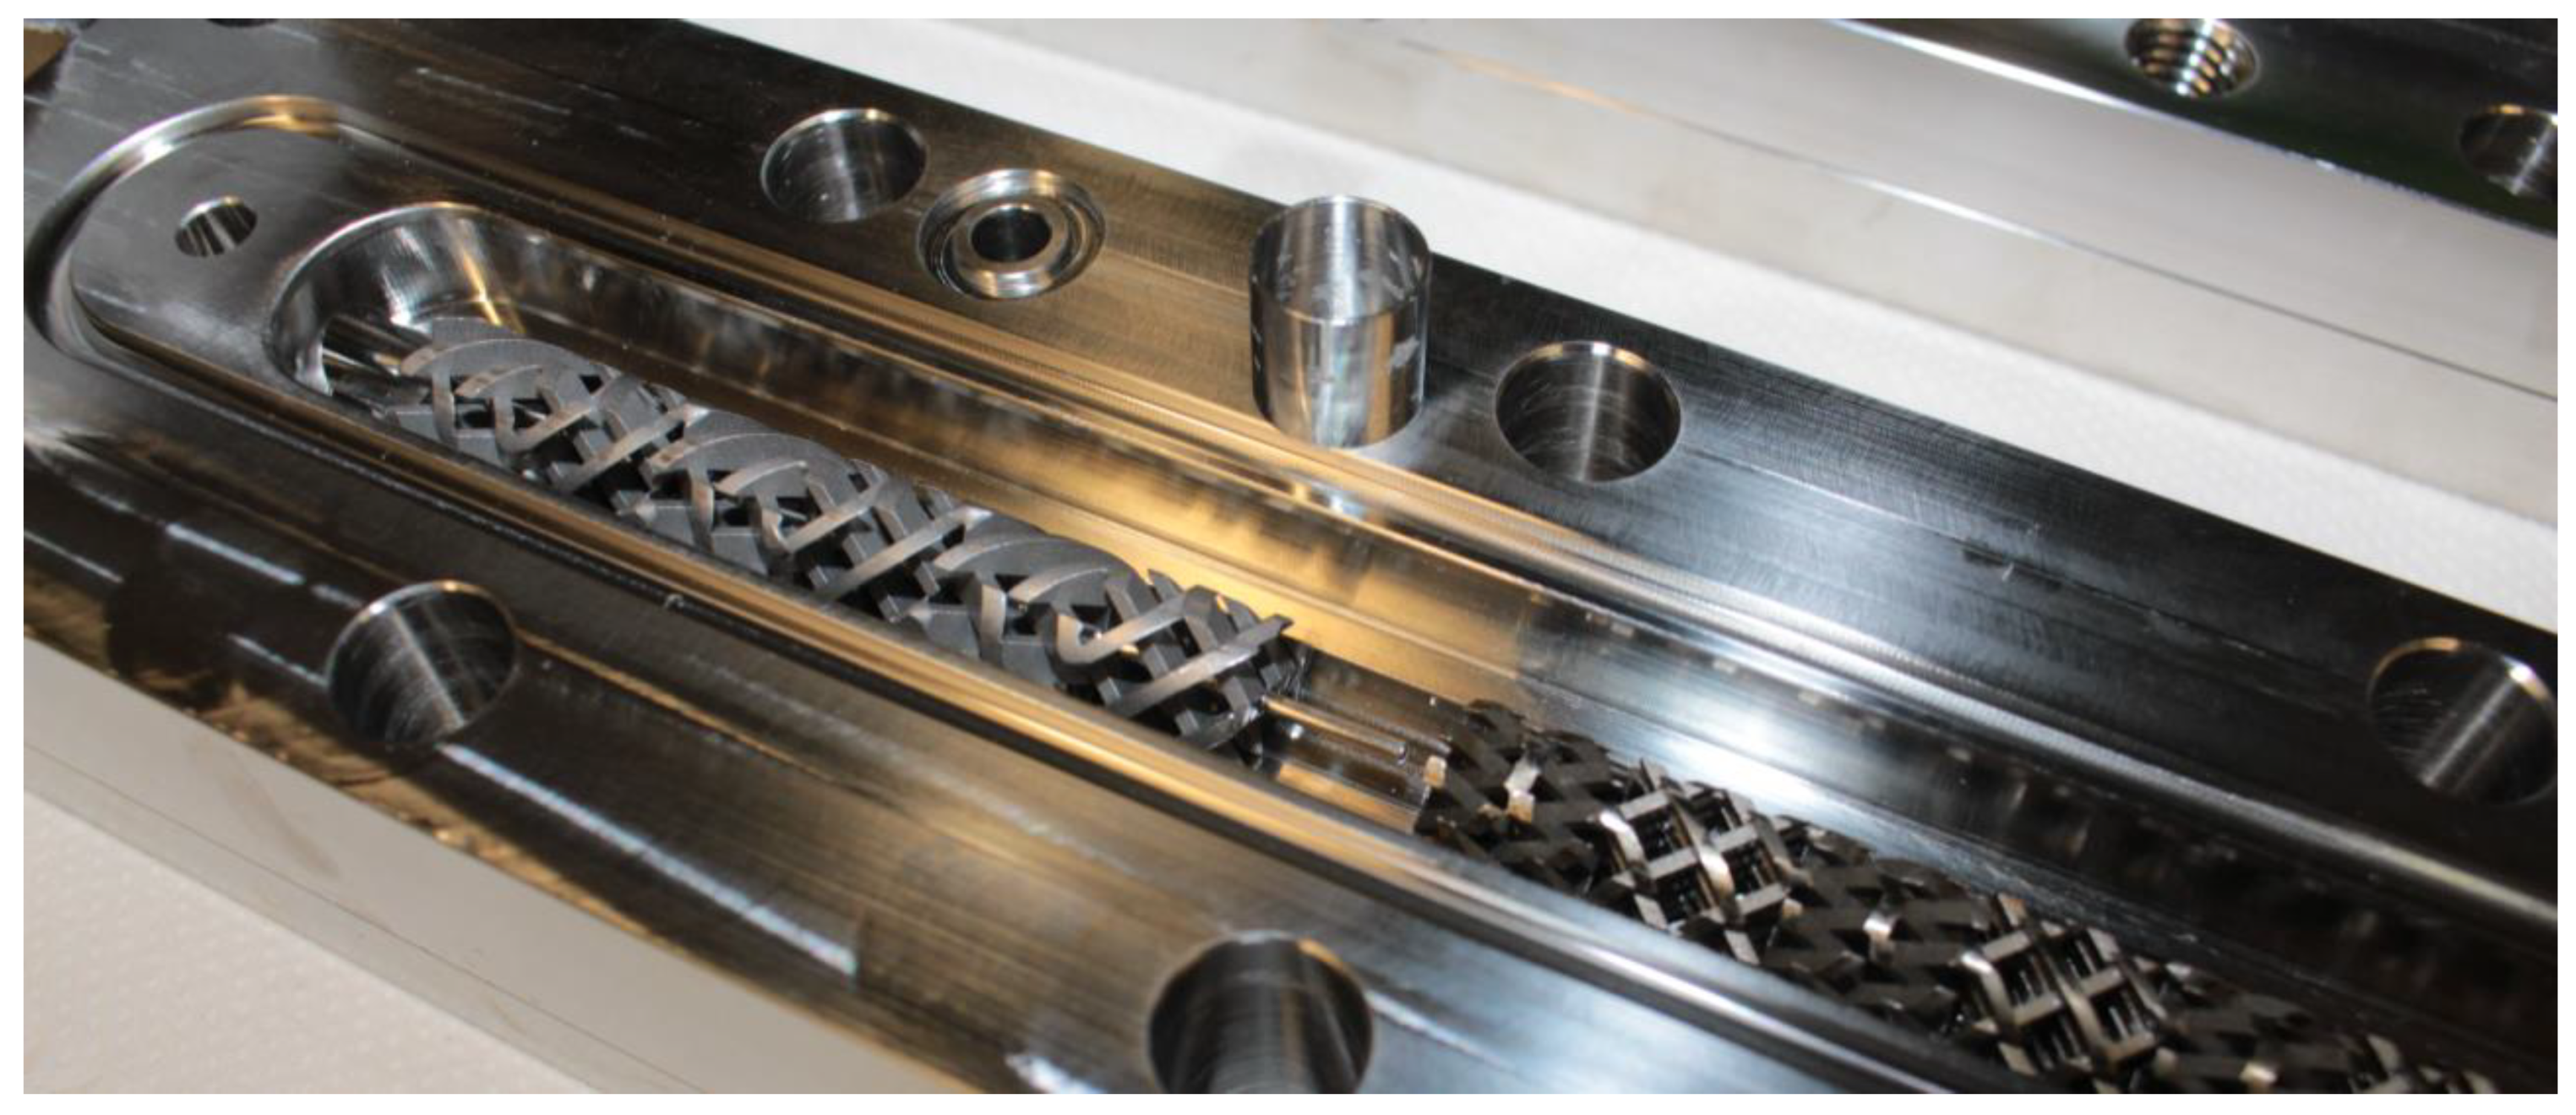
For the inline measurements, a special measuring system and an optical arrangement were developed. The basic measuring principle was that light is irradiated onto a sample and the backscattered light is subsequently detected. During the interaction of the light with the sample, mainly scattering and absorption processes occurred, which caused the detected measurement signal to be lower than the irradiated light. These light losses were summarized in the form of the extinction E, and described the change in the measurement signal compared to the start of the reaction. In total, two signals were recorded. The first signal corresponded to the wavelength range around 320 nm, as this is where the largest change in the measurement signal occurred during the reaction process. The second signal served as a reference and lay around a wavelength range of 450 nm, since there was no change in the qualitative spectral profile during the reaction. The reference made it possible to perform an offset correction by calculating changed scattering properties, and reducing the measurement signal to the portion caused by structural changes.
The light source was an XD 6265-08TJ deuterium lamp from Heraeus Noblelight (Hanau, Germany). It provided a constant spectrum with the highest intensity in the UV range of 160–400 nm. The light from the lamp passed through a lens with a focal length of 12 mm and was focused into a fiber bundle consisting of three individual fibers. These fibers guided the light to a rod probe fixed in the half-shell reactor. The rod probe had an outer diameter of 1.6 mm and a bundle of seven glass fibers were glued inside it. A similar probe principle has already been successfully tested for monitoring dispersed surfaces in crystallization in the work of Schmitt et al. [17]. Figure 1 shows the arrangement of the fibers. The middle three fibers were connected to the light source and radiated the light into the reactor and onto the sample. The two left and right fibers were connected to the detection modules. This fiber arrangement was chosen so that the detection fibers would be located at the same distance from the irradiated light, thus minimizing location-dependent differences in backscatter.
The modules for detecting the backscattered light were Customized Photo Multipliers (CPMs) from Proxivision (Bensheim, Germany). CPMs have the advantage of high sensitivity with low background noise. Fifty-millimeter focal length optical lenses were installed in front of each CPM to focus the light onto the sensor. Additional optical filters were installed between the lenses and the CPMs to reduce the incoming spectrum of light to the wavelength range that is relevant for the analysis. The sensor technology was comparable, for example, to the measurement system of Guffart et al., where highly concentrated dispersions were measured and the suitability of the CPM modules for spectroscopic applications could be demonstrated [18]. The advantage of high sensitivity can also be demonstrated in the work of Manser et al. in Raman spectroscopy, which is known for its low signal yield [19].
The first detection range lay at 320 nm and was limited by a bandpass filter (320/40 BrightLine HC) from Semrock (Rochester, New York, NY, USA), with a bandwidth of 40 nm. The corresponding CPM was the model CM92B, which had an increased sensitivity in the range of 165–650 nm. The second detection range was at 450 nm and was achieved by a bandpass filter (450/50 AT bandpass) from Chroma (Bellows Falls, VT, USA), with a bandwidth of 50 nm. The CPM installed behind it was of the model CM93LB and had an increased sensitivity in the range of 185–650 nm. The setup of the measurement system is shown schematically in Figure 2.

2.3. Reactor Setup

The experimental setup for testing the optical measurement technique under reaction conditions is shown in Figure 3.
The degassed monomer, the solvent, and an initiator solution were prepared in four storage containers labelled B1 to B4 (Figure 3), in accordance with Table 1. For the reference conditions, the mass flow rates shown in Table 1 yielded to a velocity of 6 mm/s. To achieve good micro-mixing quality, the feed streams of P1 and P2, as well as those of P3 and P4 were premixed using 0.06 in HPLC T-connectors. They were then mixed again with a 1:1 mass flux ratio in a second 0.06 in HPLC T-connector.
The reactor system was heated using a water circuit that included the circulation pump P5 and a coiled pipe heat exchanger, which had been placed in an oil bath thermostat (T3). A circulation flux between seven and eight l/min, and an oil bath temperature of 100 °C were chosen to adjust the temperature of the heating medium to 86 °C at the reactor inlet. The temperature dropped in the water circuit approx. 1 °C due to heat losses. At the start of the experiment, the reactor was flooded with the monomer-water solution, then the initiator-water solution was added.
The reactor system consisted of one Fluitec ContiPlant half-shell reactor, shown in Figure 4, with an internal diameter of 12.3 mm and a length of 495 mm. Six mixing elements were placed in the reactor for each experiment. The operating run of each time was 8 h. The mixing elements were given a hole with a diameter of d = 1.6 mm. This hole allowed the rod probe to be passed through the mixers and the tip to be placed in the free space between two mixing elements. A 12.3 mm-wide sleeve guaranteed the distance between these mixing elements. In the experiments, the space between the last and penultimate mixing elements was chosen because this is where the most deposit formation occurred. The planar surface of a mixer served as a reflection surface. The probe tip was placed in the mixer from the reactor outlet (against the direction of flow) to allow as little fouling as possible on the probe tip.

3. Results

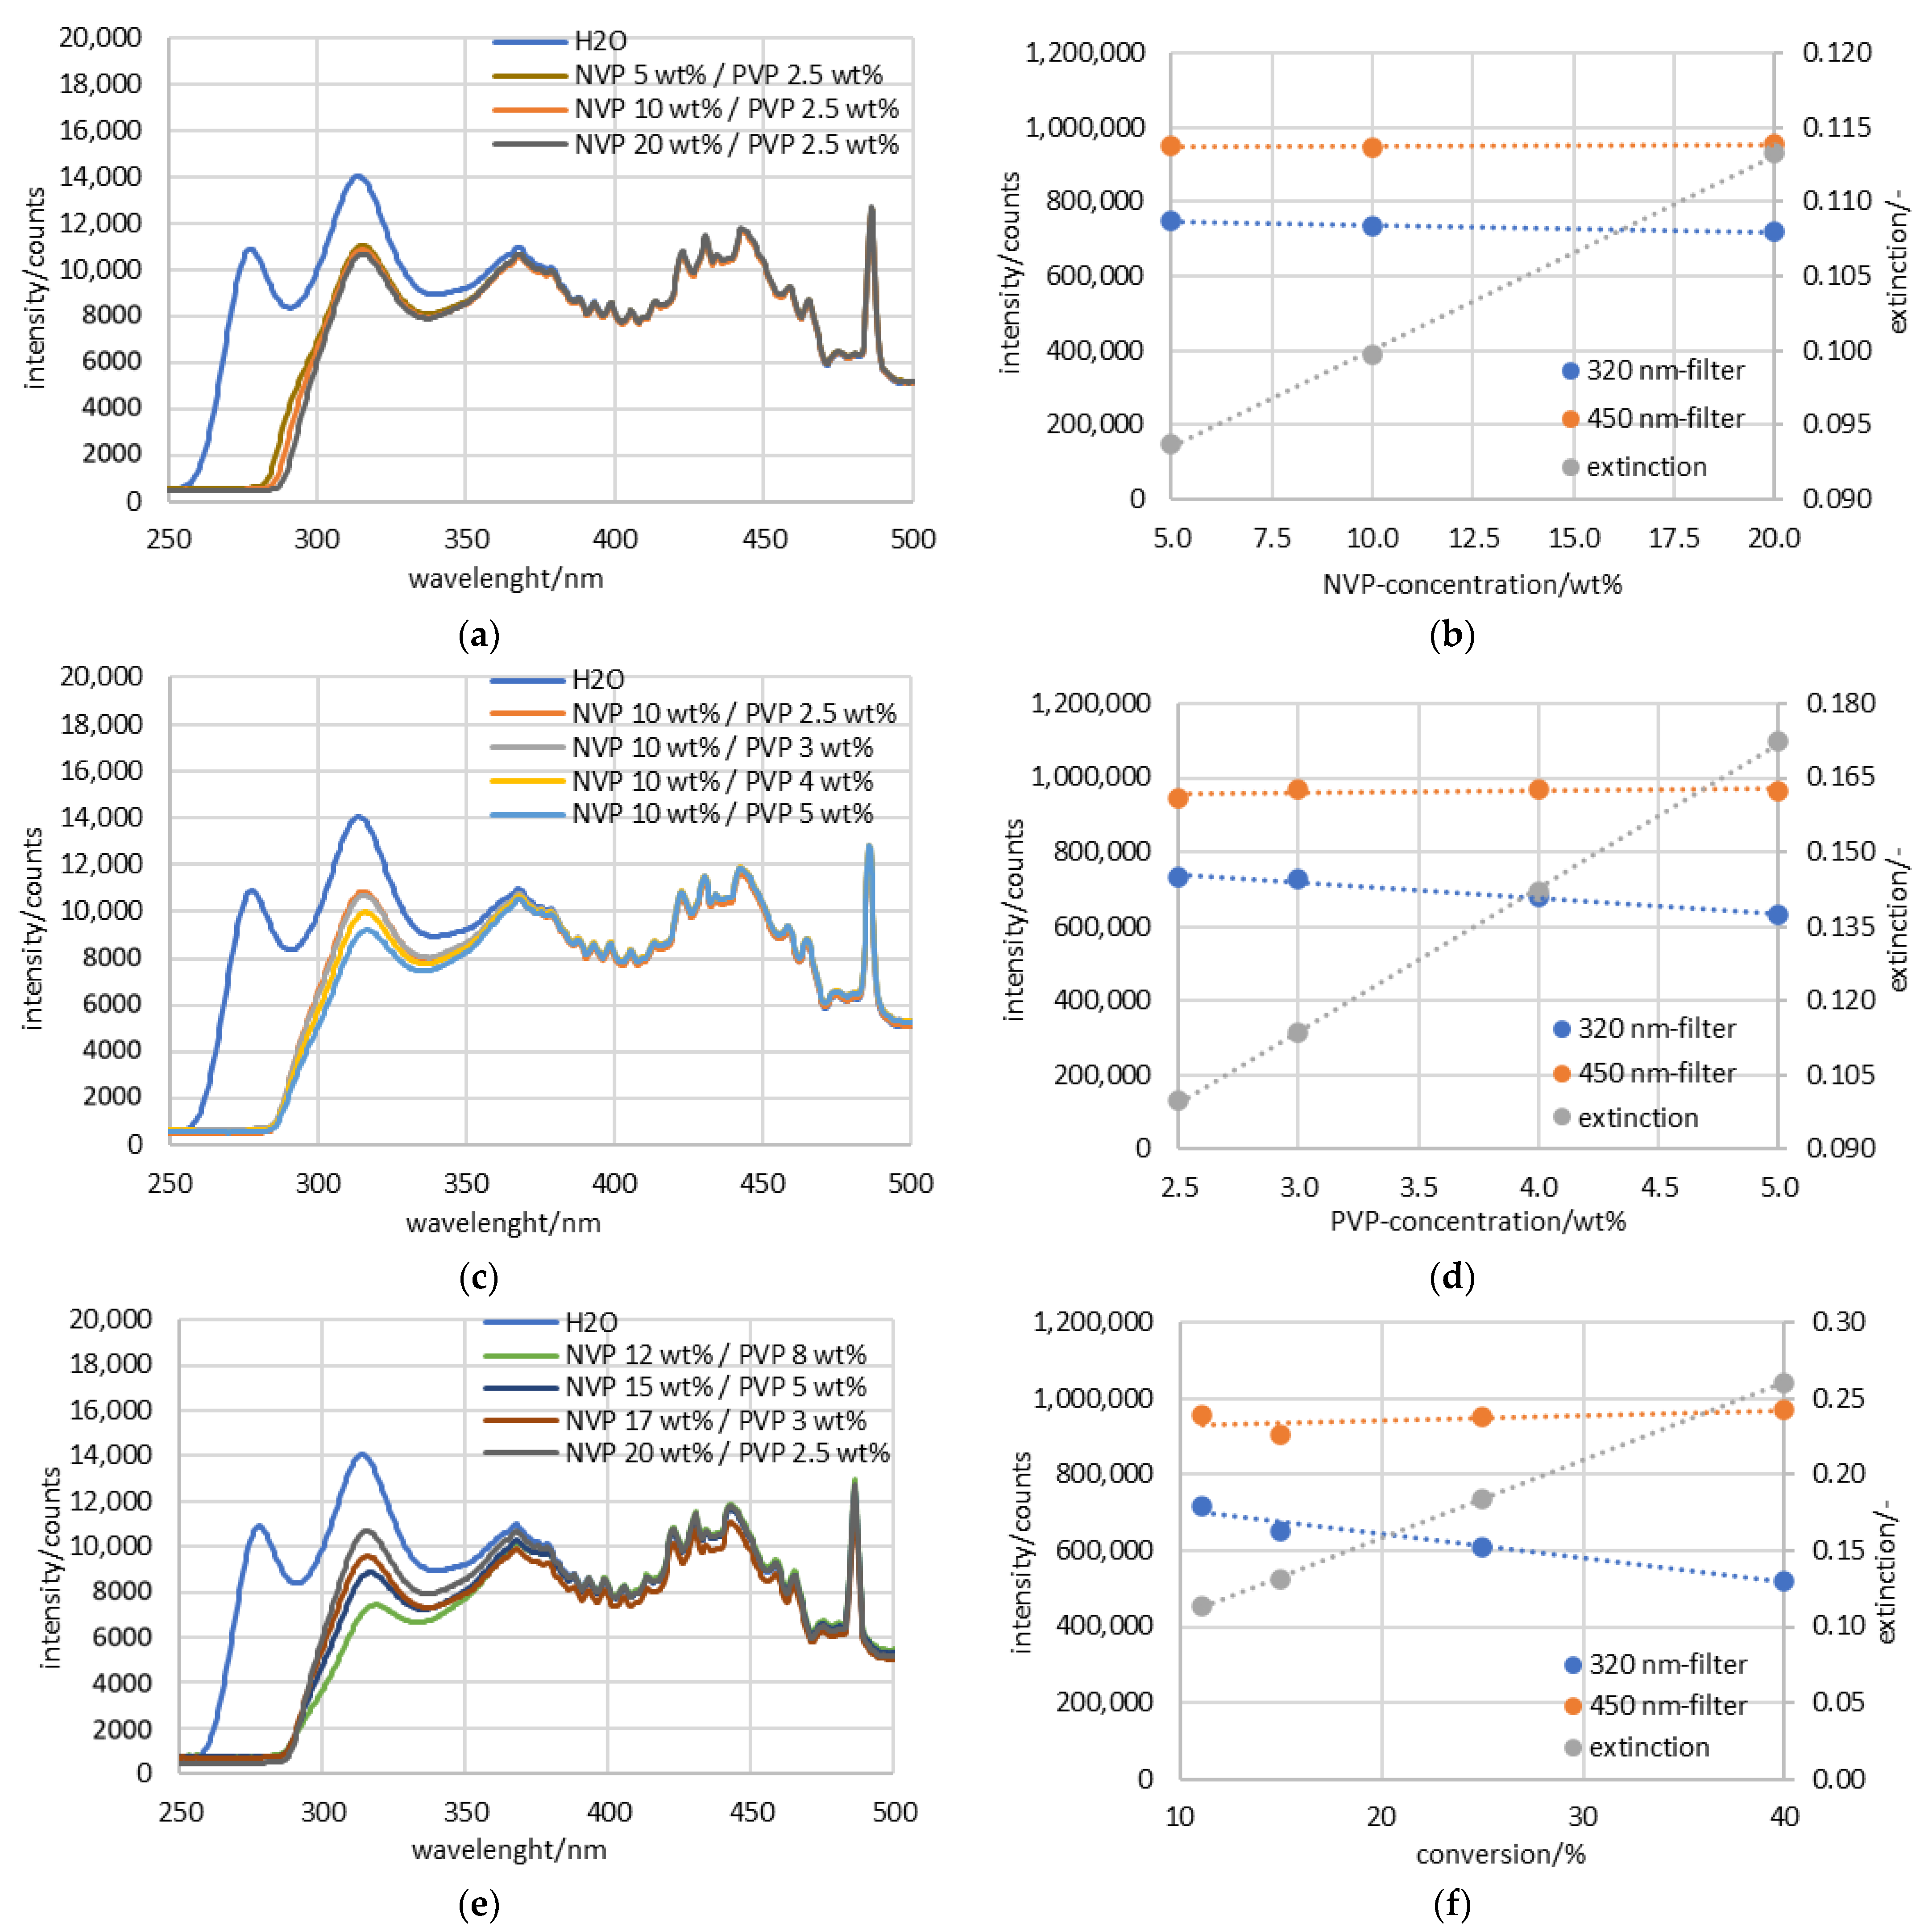
3.1. Preliminary Examination of the UV-Spectra

As the measurement system with the CPMs for detection only provided a time course of the measurement signal, and the influences of the individual components could not be differentiated, the spectra were first measured at known reactant and product concentrations. This is why, for the following experiments, the CPMs used for detection were replaced by a conventional UV spectrometer (MCS 601 UV-NIR) from Zeiss (Oberkochen, Germany), which allows the entire spectrum to be obtained.
Three series of measurements are examined below. Each of the series was a solution of NVP, PVP, and water. For the first series, at a constant PVP concentration of 2.5 wt%, the NVP concentration was increased from 5 to 20 wt% (Figure 5a,b). In the second series of measurements, the concentration of NVP was constant at 10 wt%, and the PVP concentration was increased from 2.5 to 5 wt% (Figure 5c,d). The third series of measurements simulated a change in conversion by increasing the concentration of NVP from 12 to 20 wt%, and decreasing the concentration of PVP from 8 to 2.5 wt% (Figure 5e,f). In addition to the spectra, the measurement ranges of the CPMs were plotted and calculated as extinction.
The extinction can be calculated according to the Lambert–Beer law (Equation (1)) [4]. I 0 corresponds to the H2O spectrum of the measurement series and I corresponds to the measured concentration.
E λ = log 10 ( I I 0 ) = ε λ · c · d
To make the results obtained with the spectrometer comparable with the measurements of the CPMs discussed later, the extinction was calculated according to the spectral bandwidth of the optical filters in front of the CPMs. The integral of the spectrum was determined for the respective bandwidth of the filters, and the corresponding extinction value was calculated from this according to Equation (1). This resulted in one extinction value E for each filter range, which could then be subtracted from each other for the offset correction. The total equation that followed from this is Equation (2).
E = E 320 nm E 450 nm = log 10 ( I ( 320   nm ) I 0 ( 320   nm ) ) + log 10 ( I ( 450   nm ) I 0 ( 450   nm ) )
The first series of measurements at a constant PVP concentration (Figure 5a) shows in the range of 320 nm that an increase of the NVP concentration from 5 to 20 wt% leads to a signal drop of about 1000 counts. Calculated as absorbance in Figure 5b, this corresponds to an increase from 0.094 to 0.113.
In the second series of measurements, at a constant NVP concentration, and an increase in PVP concentration from 2.5 to 5 wt% (Figure 5c), there is also a signal drop of about 1600 counts. The extinction therefore increases from 0.998 to 0.172 (Figure 5d). Comparing the change in the spectrum in both series of measurements, when the NVP concentration is changed, the signal drops by 66.7 c o u n t s w t % , and when the PVP concentration is changed, the signal drops by 640 c o u n t s w t % . This results in a stronger influence by a factor of 9.6 due to the PVP. Calculated as extinction, this influence is even more significant. For PVP, this results in a change of 0.029 e x t i n c t i o n s w t % , and for NVP in a change of 0.001 e x t i n c t i o n s w t % . Thus, the influence of PVP on the extinction is greater by a factor of 22. For the measurement of the extinction, this means that the influence of NVP is negligible, and the signal mainly provides information about the quantity of the PVP in the reactor.
To investigate this further, the signal behavior with changing conversion was simulated in measurement series three (Figure 5e,f). The NVP concentration increased from 12 wt% to 20 wt%, and at the same time, the PVP concentration decreased from 8 wt% to 2.5 wt%. The results of the measurement are shown in Figure 5e. As the reactant concentration increases and the product concentration decreases, a decrease in conversion is simulated and the spectroscopic measurement signal increases by about 3000 counts in the 300–340 nm range. For the extinction in Figure 5f, this results in an increase of 0.147 for a conversion increase from 11 to 40%, demonstrating that the influence of the PVP on the extinction signal dominates and overlaps the NVP signal.
In addition, the spectra of all three series of measurements (Figure 5a,c,e) show that the reference in the 450 nm bandwidth is not significantly affected by concentration changes and is thus suitable for offset correction.

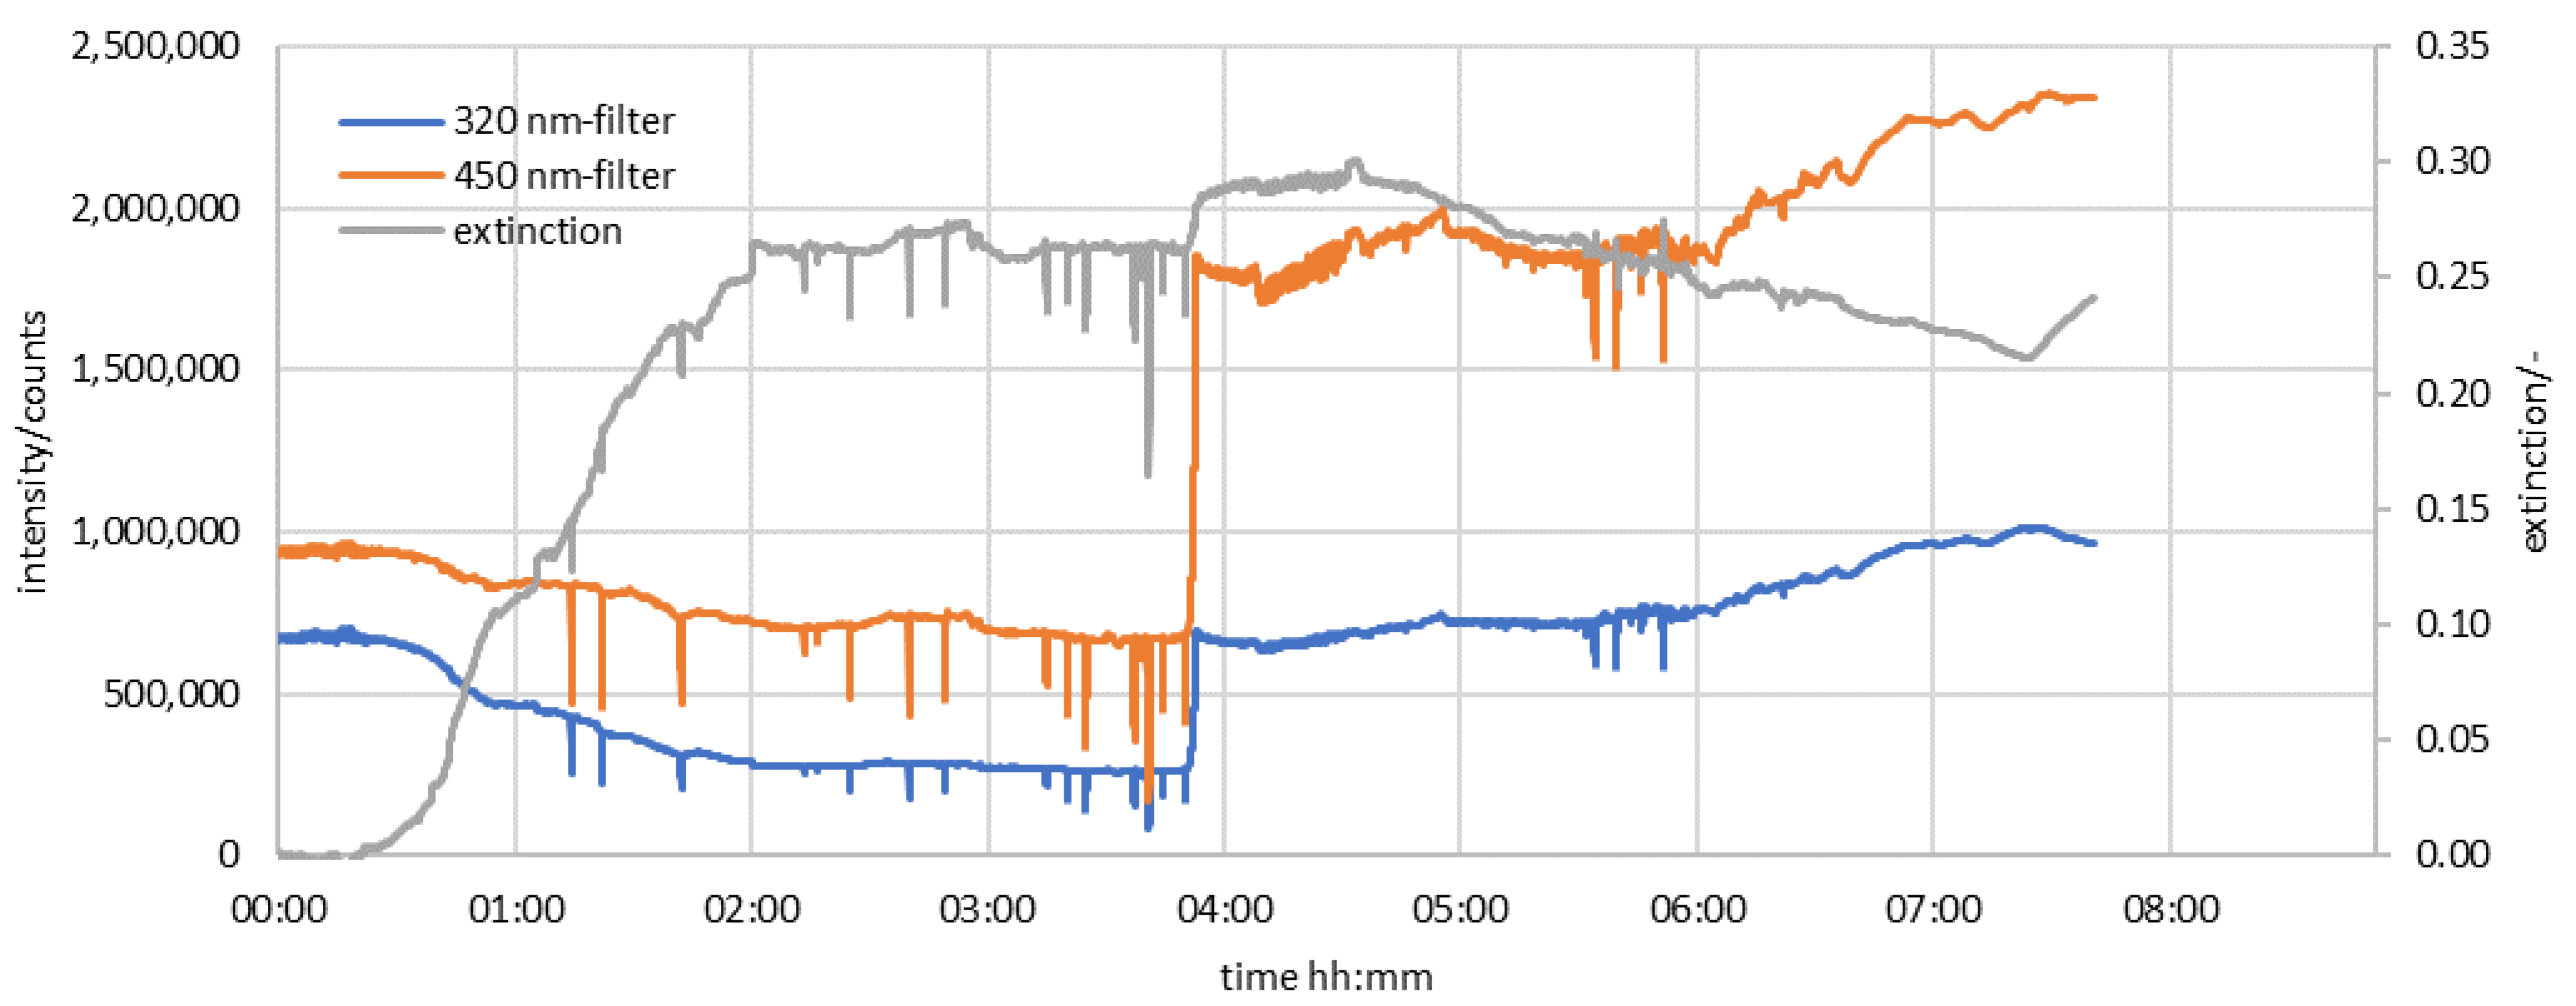
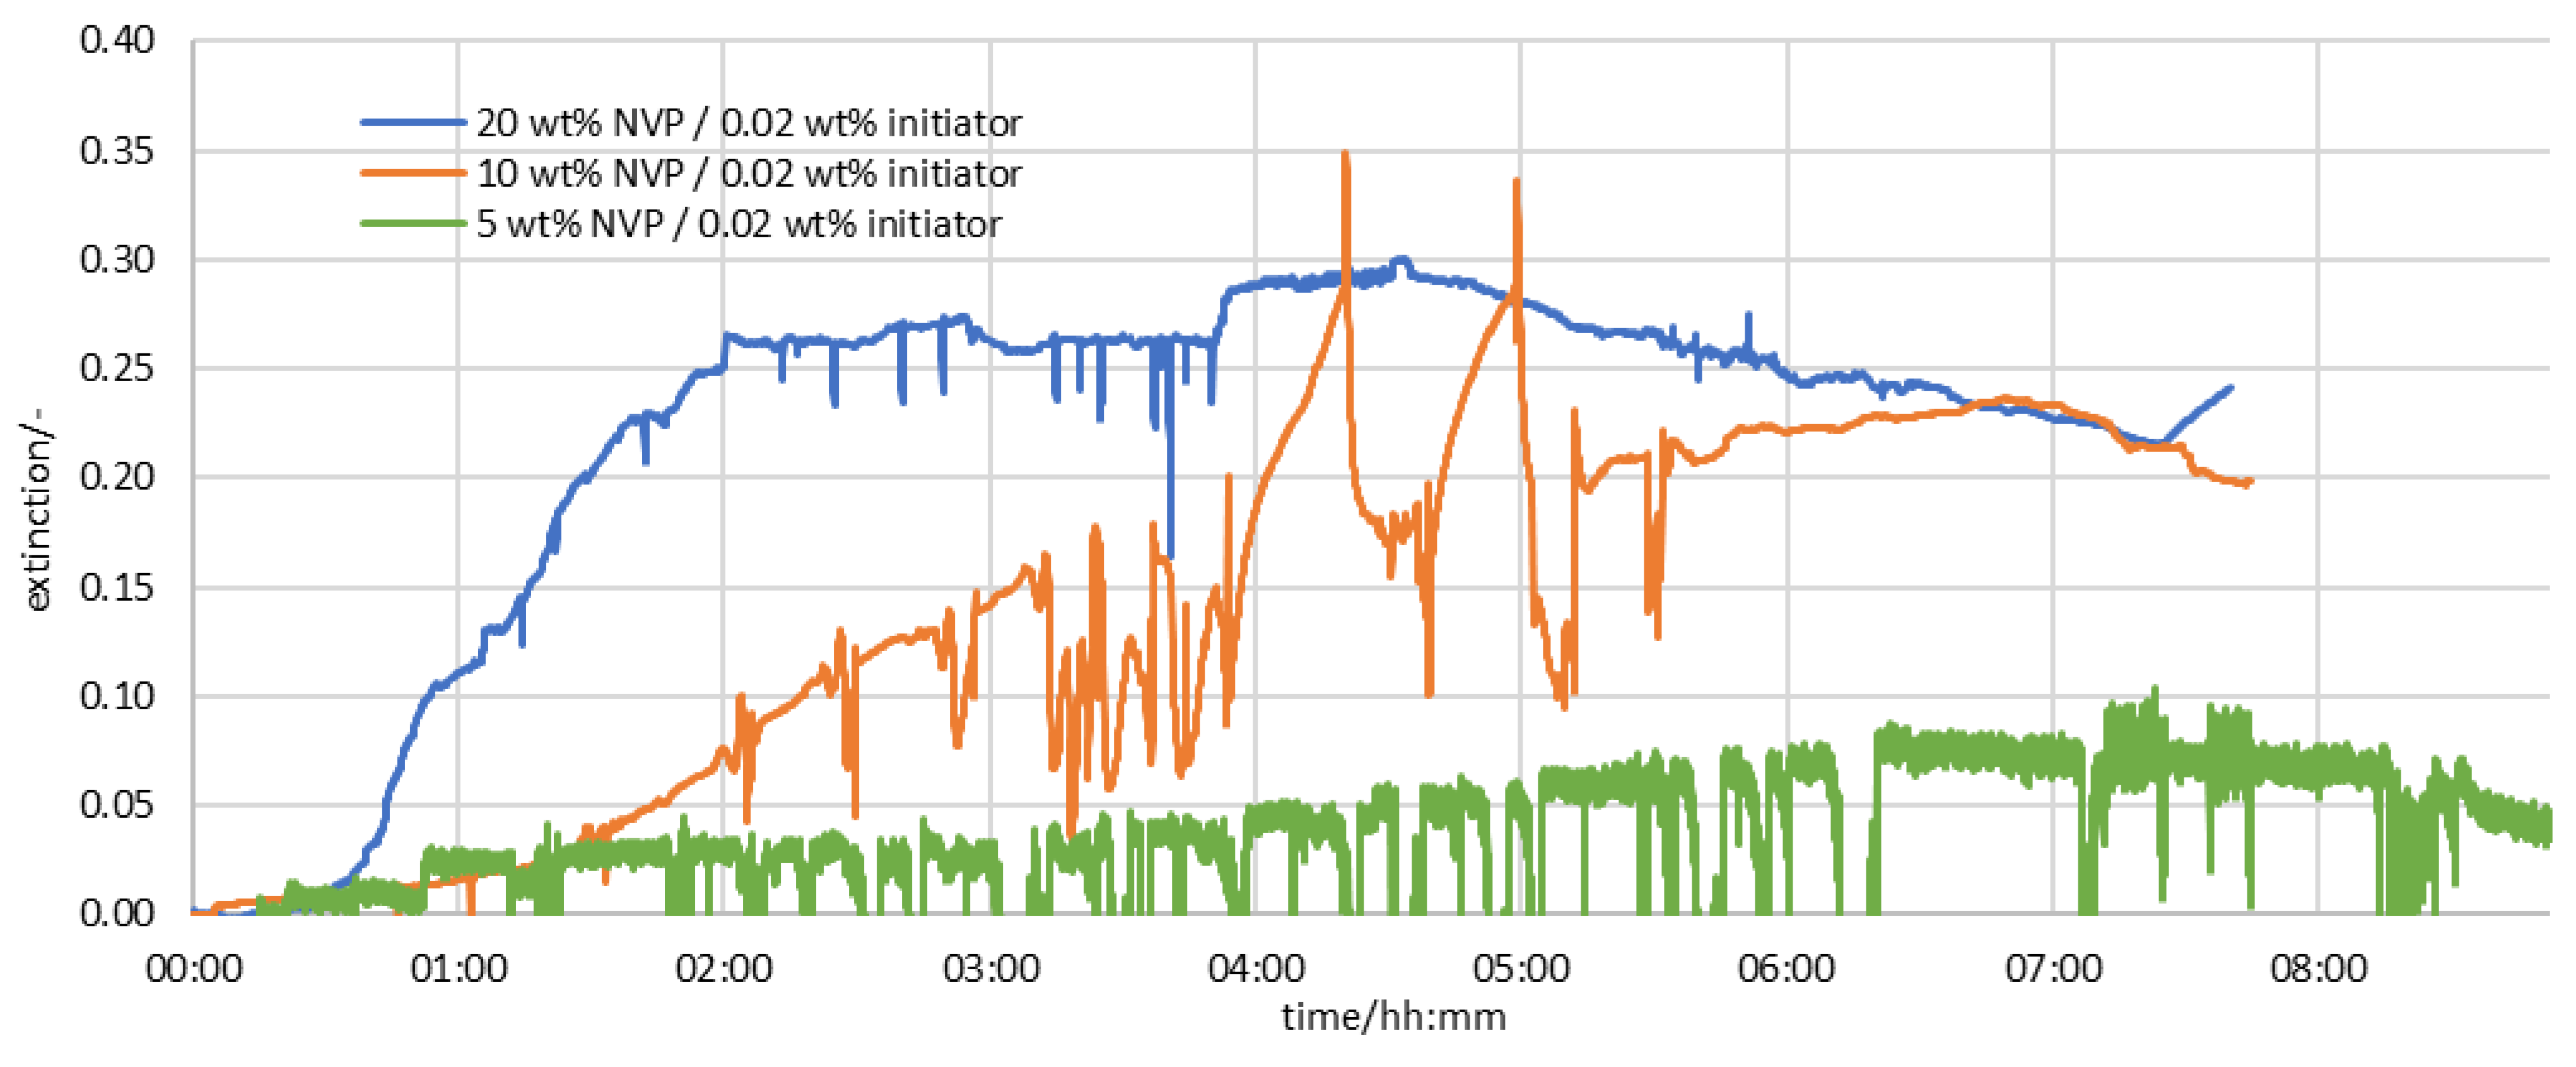
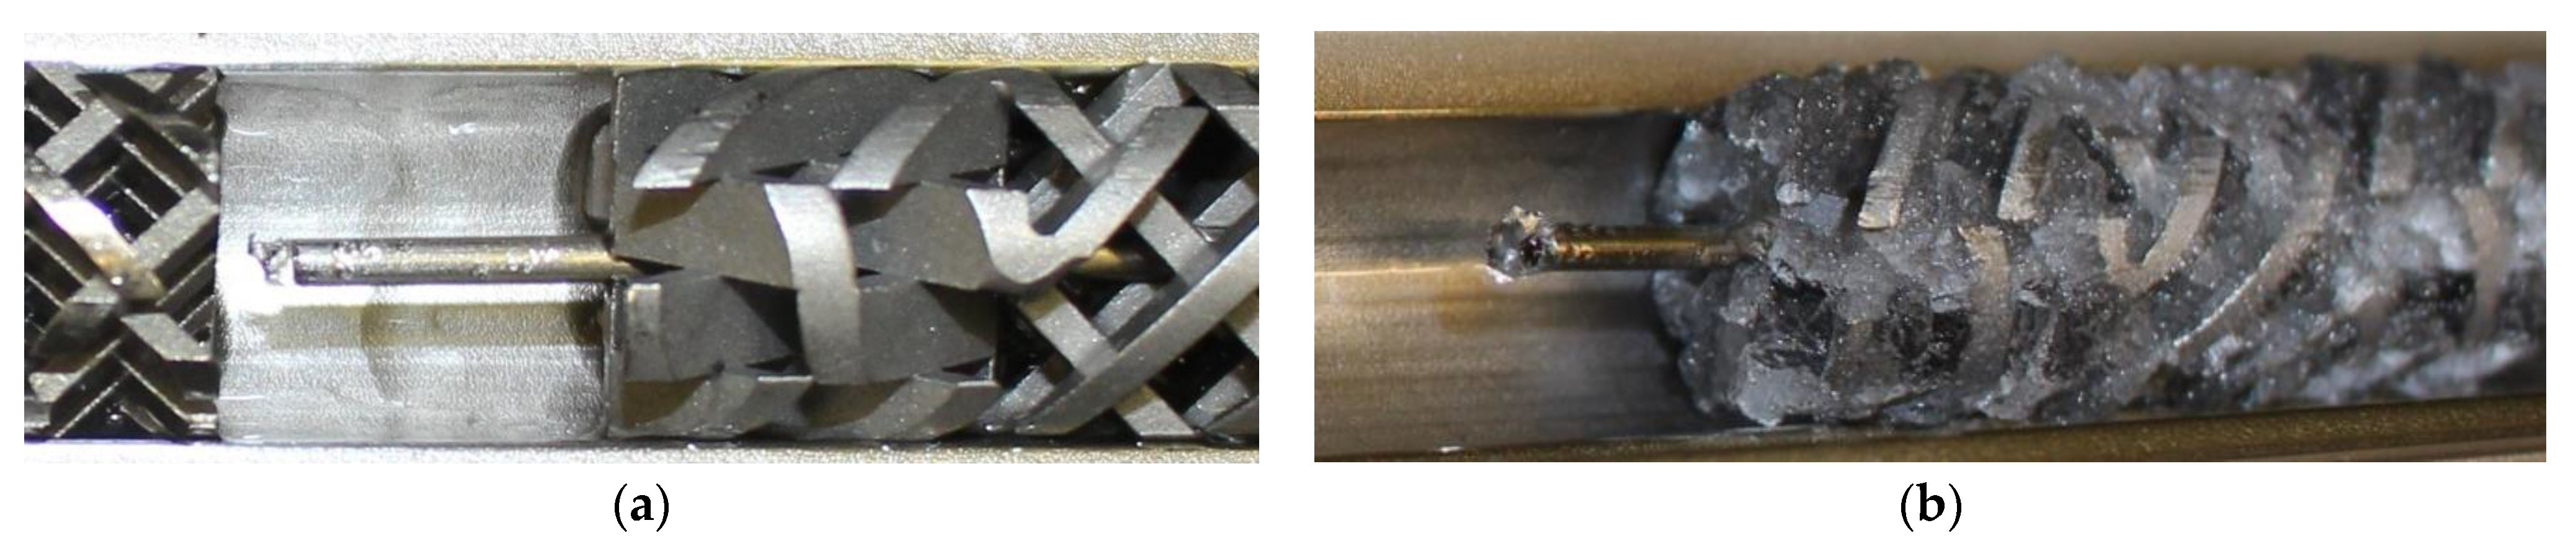
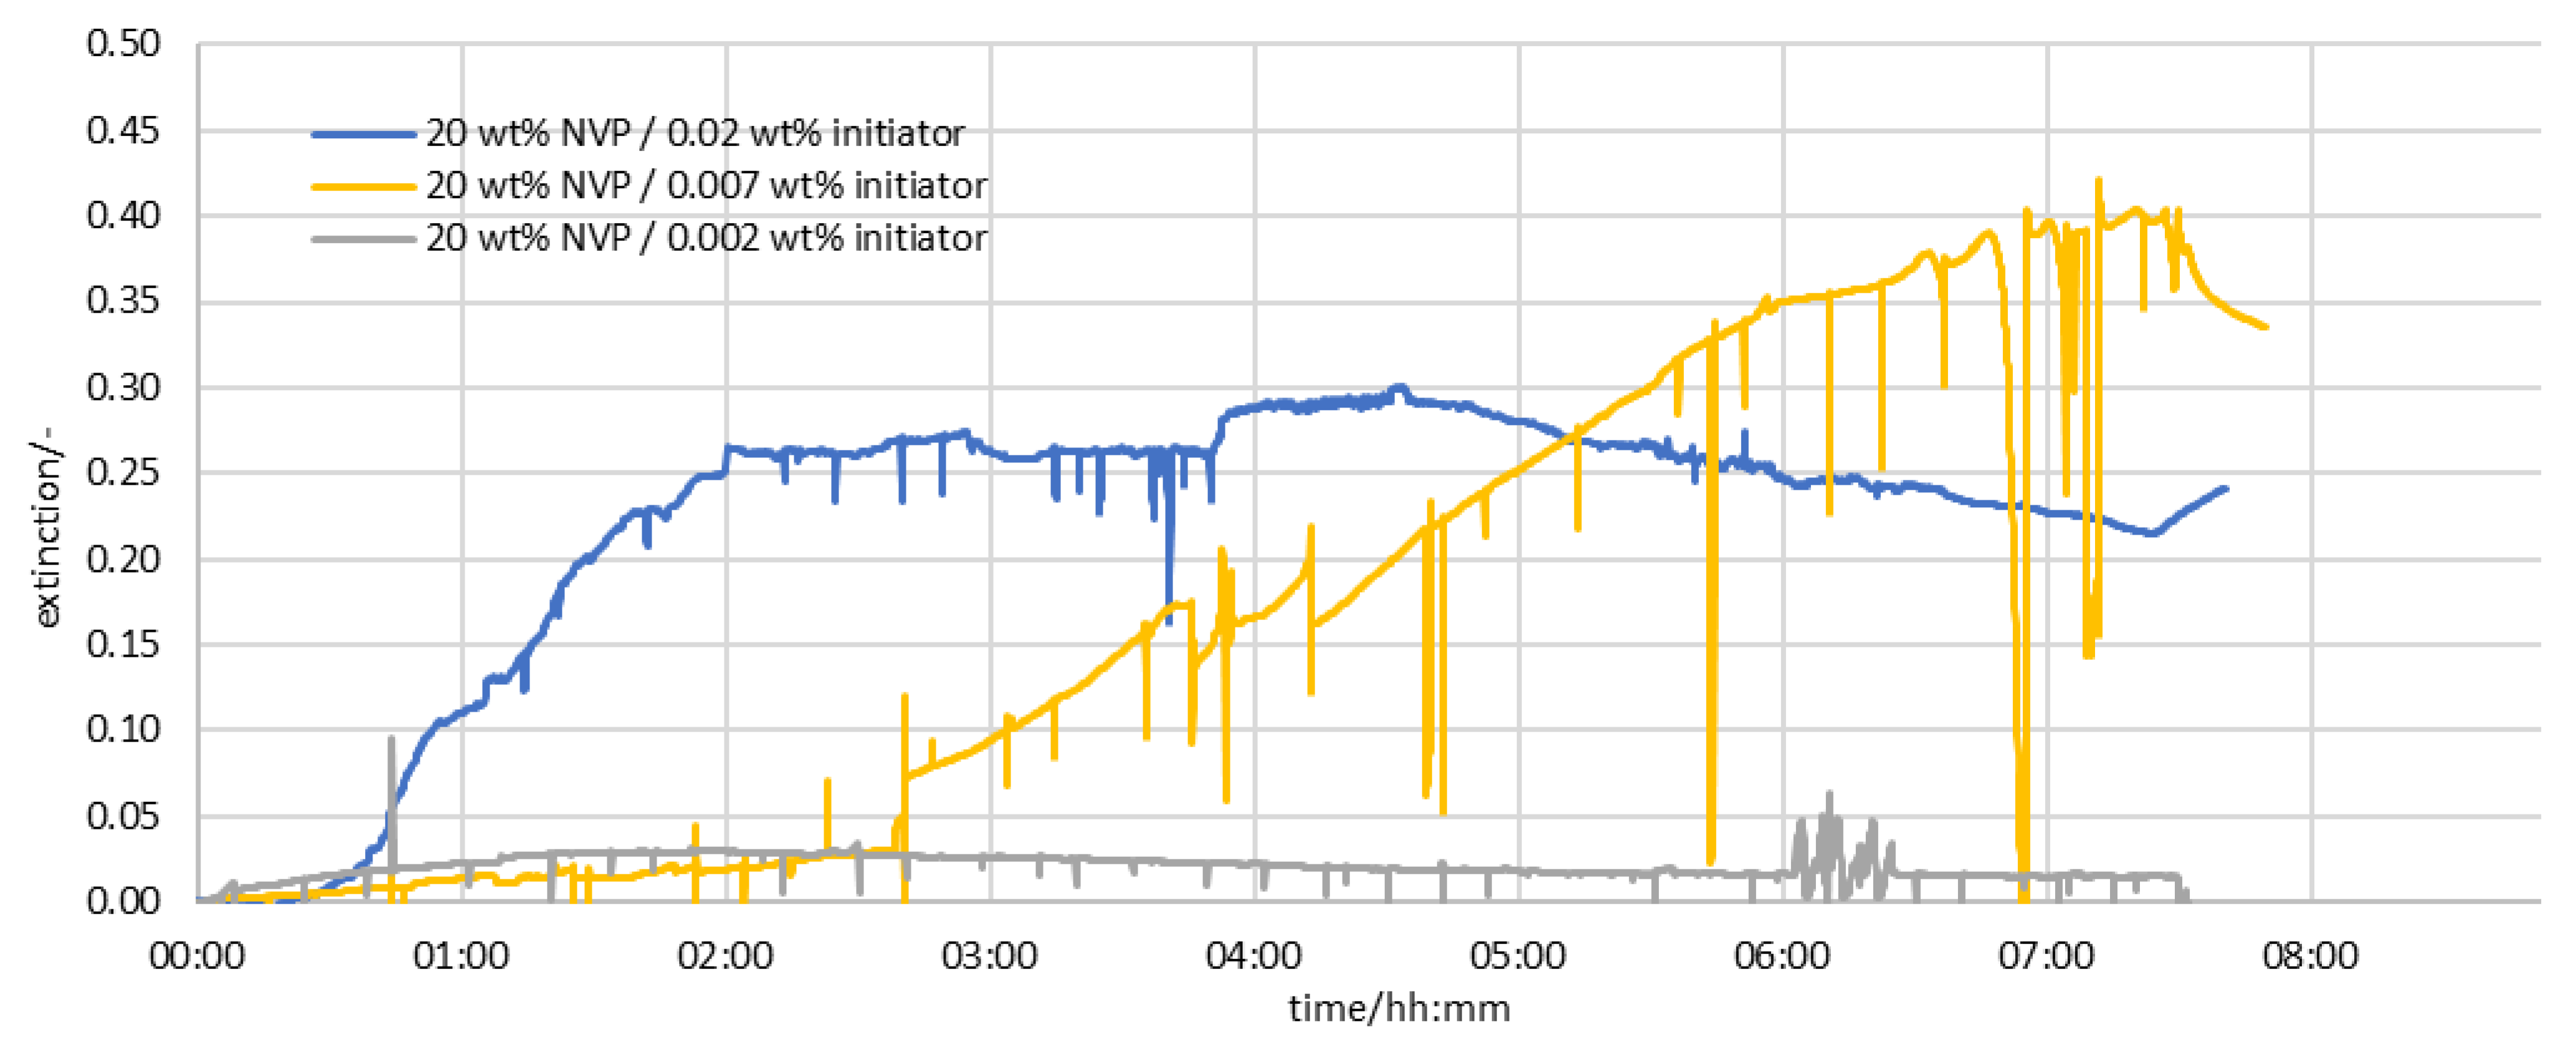
3.2. Results of the Measurement Series in the Half-Shell Reactor

The series of measurements in the half-shell reactor took place at 85 °C and ran over a period of approx. 8 h. The CPMs each recorded a measured value every 5 s. For a monomer concentration of 20 wt%, and an initiator concentration of 0.02 wt%, the measured data are shown in Figure 6. The graphs of the 320 nm filter and the 450 nm filter are the raw data output from the CPMs. These two measurement curves were calculated according to the Lambert–Beer law (Equation (1)), as mentioned above. In Figure 6 the extinction was plotted together with the raw data. The advantages resulting from the processing were a reduction in noise, a reduction in the interference effects (e.g., compensation of the signal jump at 3:53) and the increased stability and reproducibility of the measurement data.
Figure 7 shows the extinction curves with a varying monomer concentration at 85 °C, and an initiator concentration of 0.02 wt%. A higher monomer concentration led to a higher extinction, and an earlier increase of the measured values. The interpretation of the results, considering Figure 5, suggests that an increase in extinction correlates with an increase in product, or a higher conversion, and a decrease in extinction correlates with a decrease in product, or a lower conversion.
During the first three hours, additional HPLC measurements were performed, which are shown in Figure 8 and demonstrate that the conversion remains constant during this time. This suggests that the increase in extinction is due to an increased concentration of product in front of the probe. An increased product concentration can, in turn, be interpreted as fouling in the reactor.
This can be proved by opening the reactor after three hours and looking at the probe tip in Figure 9a. A layer of fouling has formed on the probe tip while the mixing elements are free of fouling. In the later course of Figure 7 starting at 4:33 h, at a monomer concentration of 20 wt%, a decrease in extinction can be seen. This can be interpreted as a decrease in conversion due to the reduction in reactor volume caused by fouling. The fouling and reduction of the volume can be seen in Figure 9b when the reactor is opened after a reaction time of 8:00 h. In the range of 2:11–4:33, where the signal is constant, the effects of the layer growth and of the conversion decrease balance each other out. In general, it can also be seen that there is a correlation between the monomer concentration and the extinction maximum, as well as in the steepness of the increase. Outlier values and sudden drops in the signal can be caused by the decay of the initiator, where nitrogen (N2) bubbles form and flow past the probe.
Another series of measurements investigated the variation of the initiator concentration at a monomer concentration of 20 wt% and an 85 °C reactor temperature. The results are shown in Figure 10. The interpretation of the extinction increase and decrease can be made analogously to Figure 7. The influence of the initiator concentration manifests itself in the fact that with lower initiator concentration the signal is weaker, and the rise occurs later. With a concentration of a 0.002 wt% initiator, almost no fouling occurs and the course of the graph is approximately constant. Overall, the figure shows that a high turnover due to a high amount of initiator is decisive for the formation of coatings.

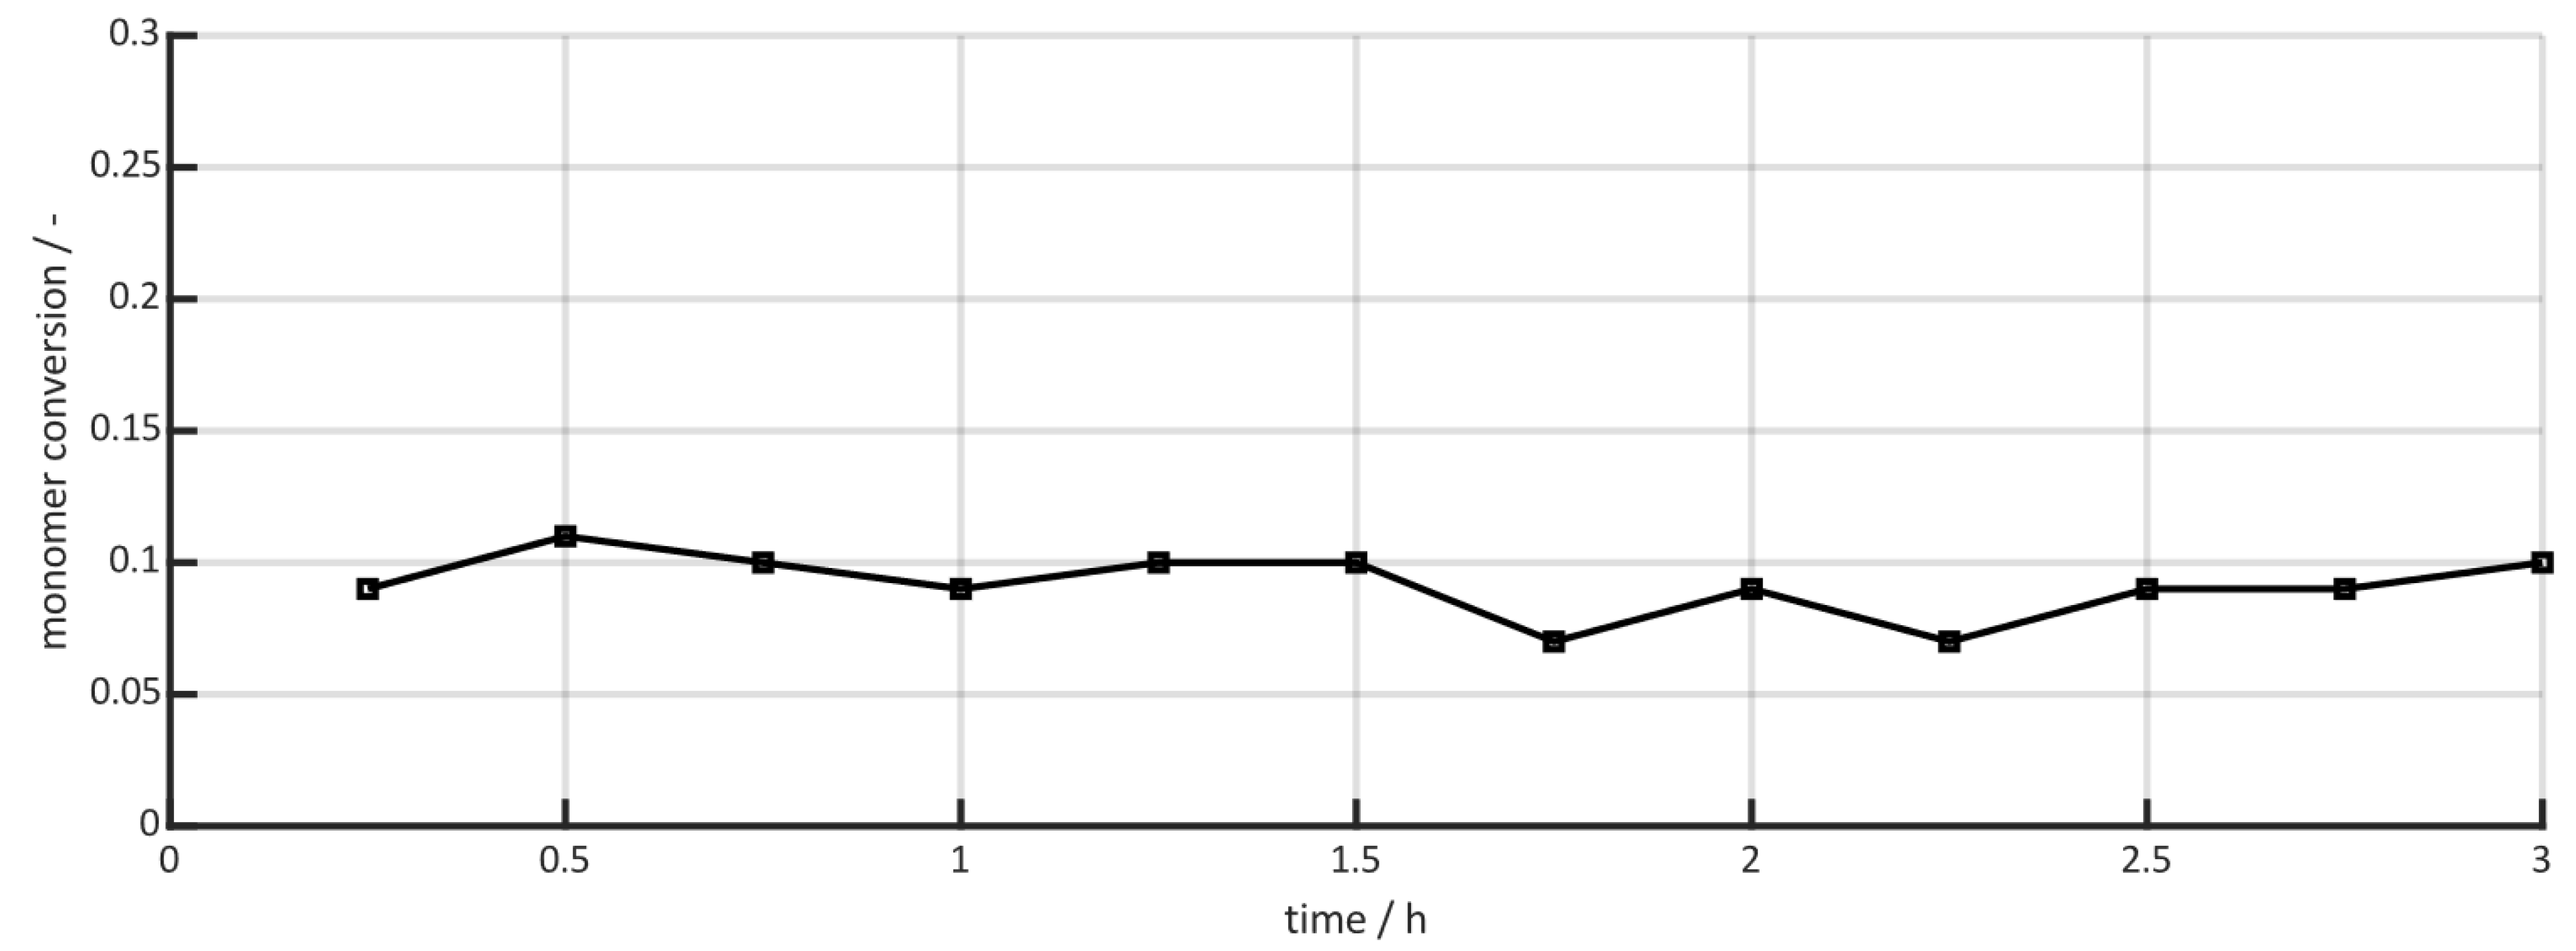
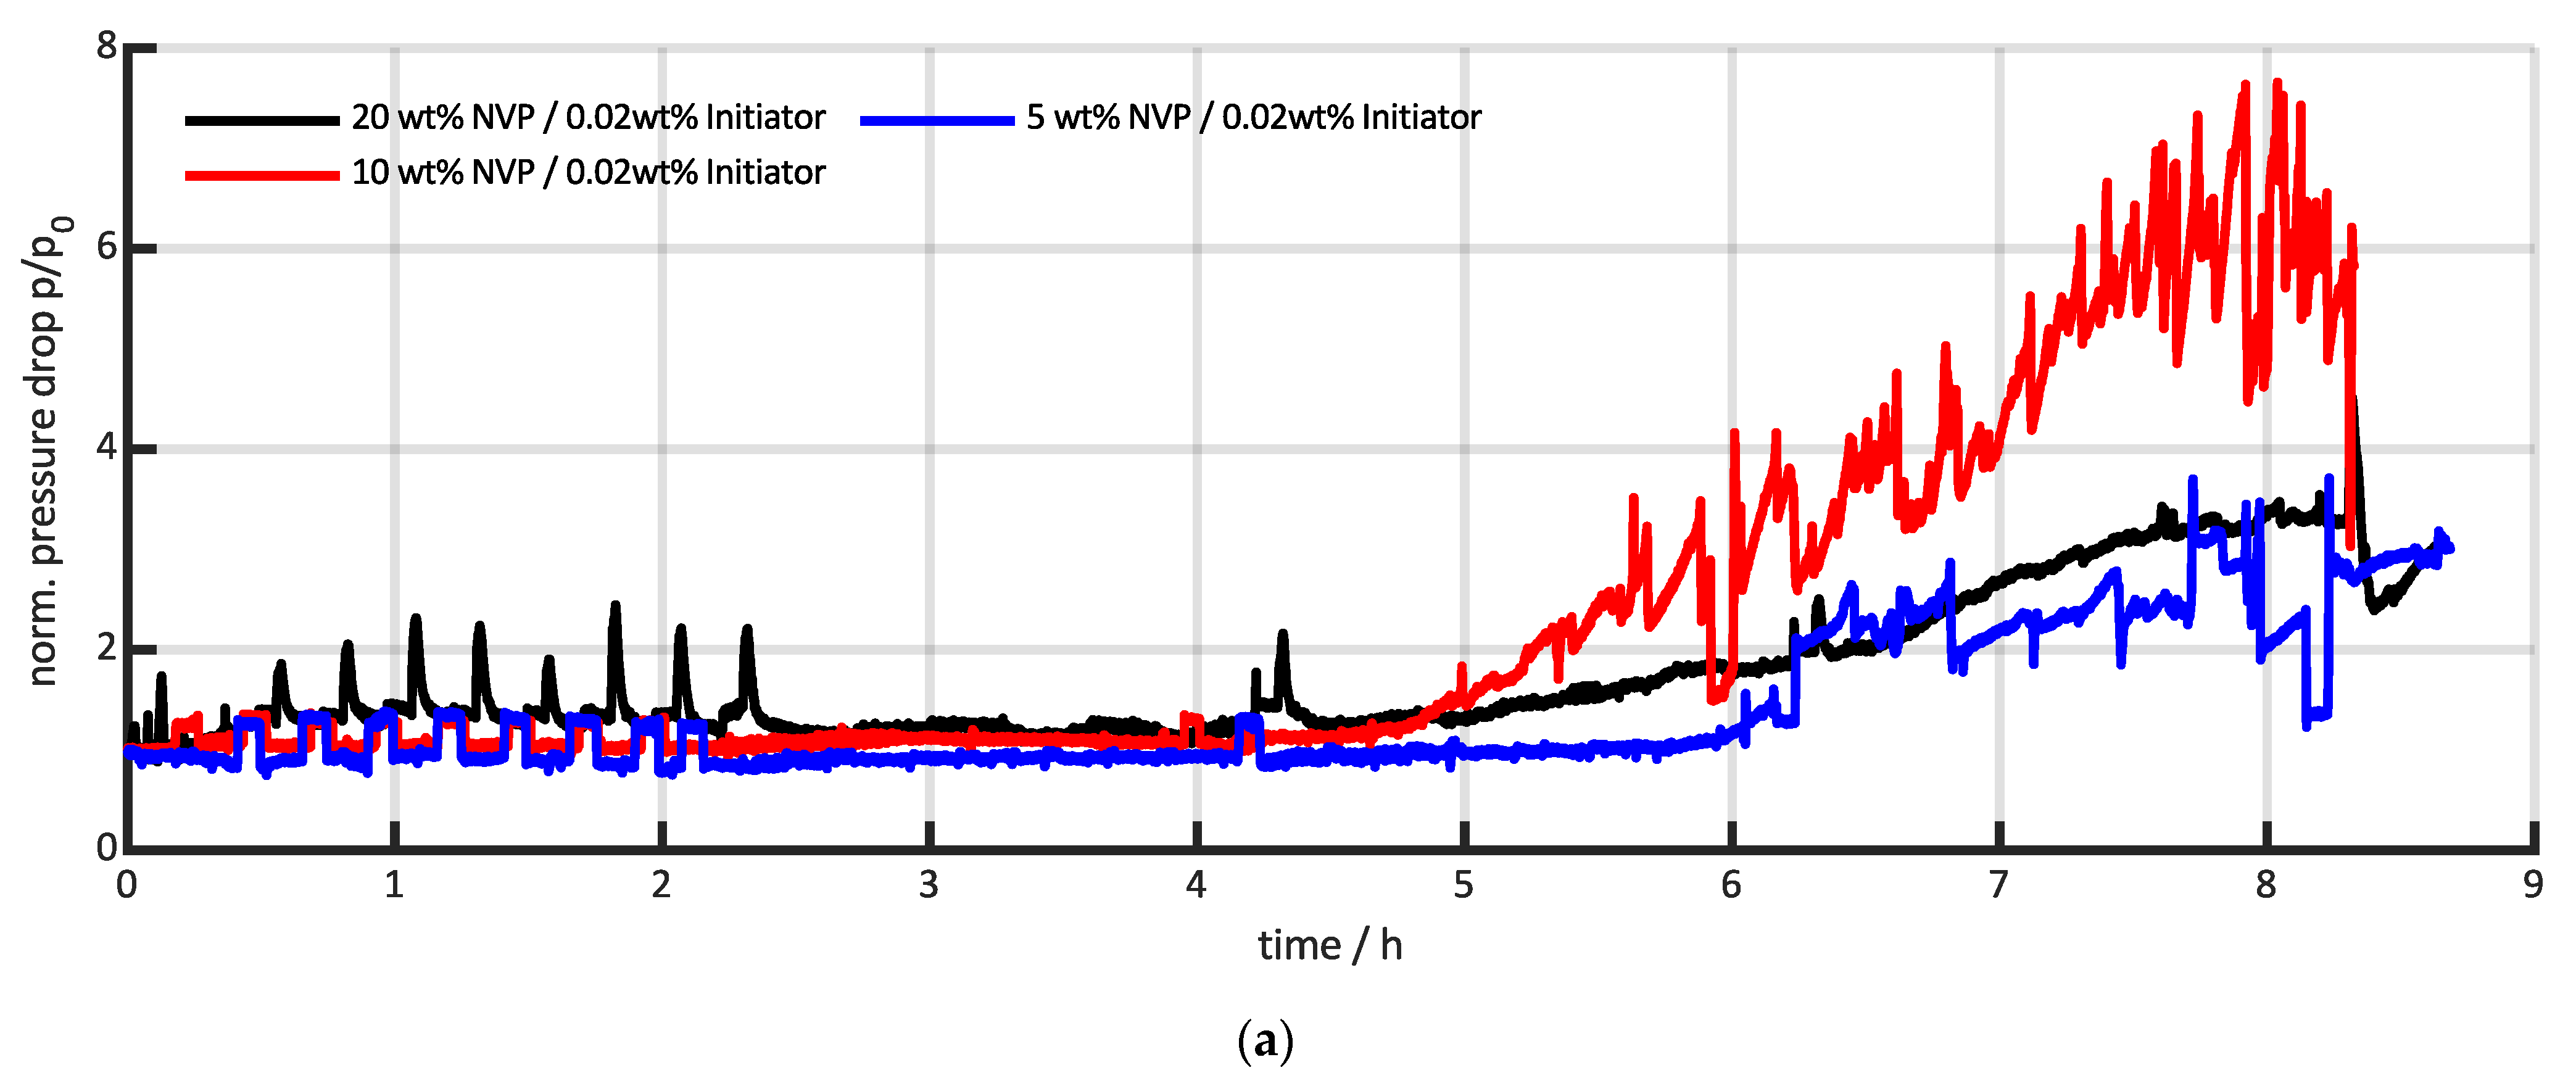
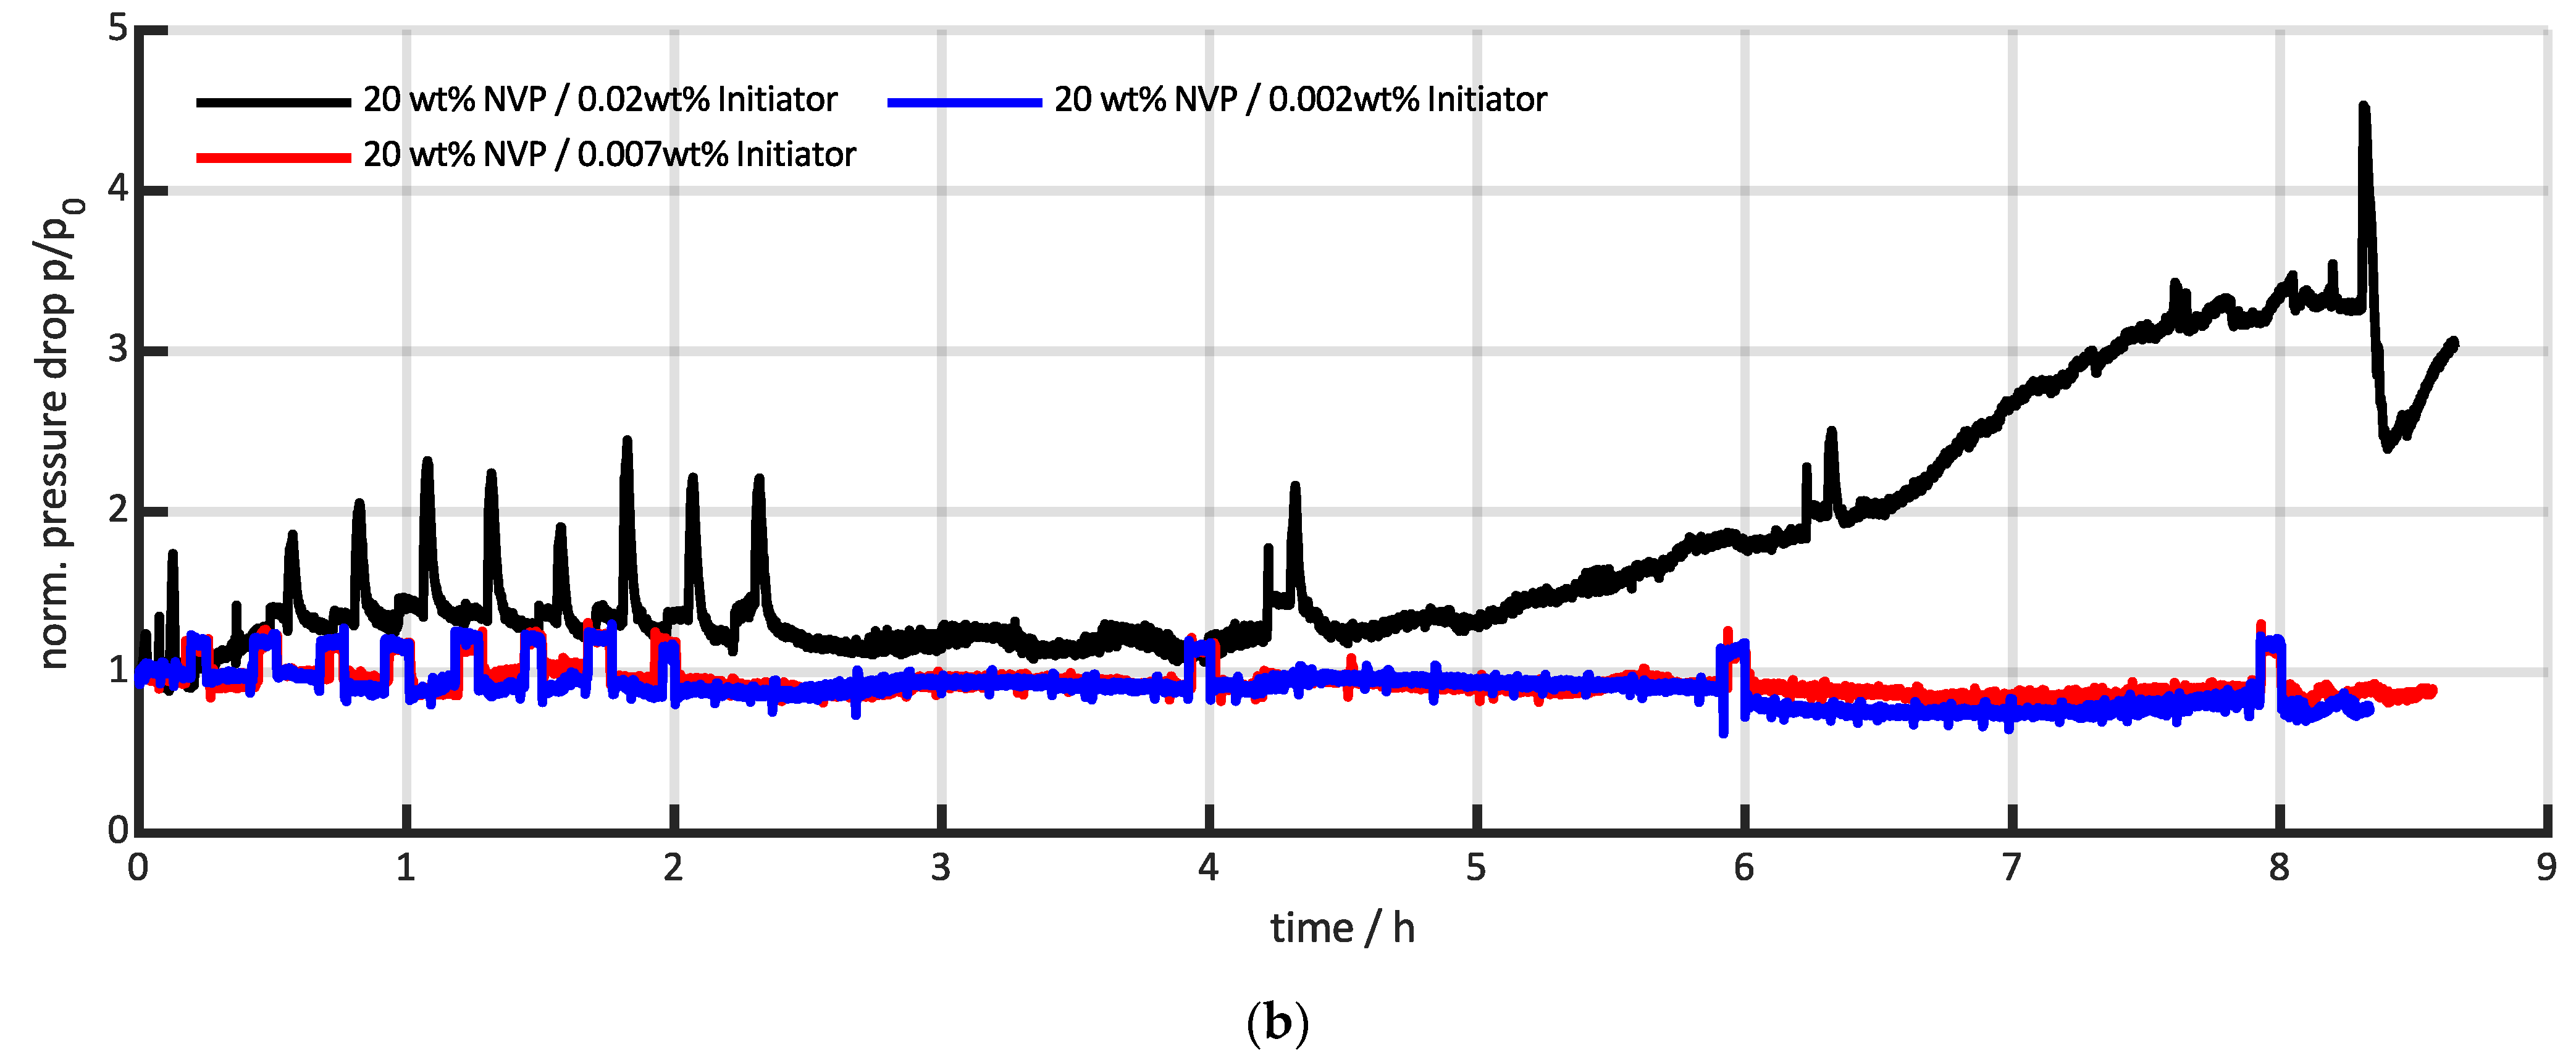
3.3. Comparison with Conventional Pressure Measurements

To compare the spectroscopic measurements with previous measurement methods, additional pressure measurements were performed. The reaction conditions for Figure 11a are the same as for Figure 7 and the conditions for Figure 11b are the same as for Figure 10.
The pressure curve generally correlates with a clogging of the reactor by fouling. Figure 11a shows a stable pressure curve in the first 5 h for all concentrations and then an increase of the 10 wt% curve to a norm. pressure of 6 after approx. 6 to 8 h. For the 20 wt% curve, the increase is flatter and ends at a norm. pressure of 3.7 after approx. 8 h. The pressure of the 5 wt% curve increases after 6 h and has the lowest, final norm. pressure of 3 after approx. 2.5 h. The pressure increase from approx. the fifth hour is comparable to the drop in the extinction signal that occurs at about the same time in Figure 7. The disadvantage of the pressure measurement is, however, that in the first 5 h no statement can be made about the reaction progress, and, thus, no early detection is possible. In addition, the pressure curves do not provide a correlation between the monomer concentration and the signal maximum.
In Figure 11b, an increase in pressure can only be seen in the “20 wt% NVP/0.02 wt% Initiator” curve. This curve shows the same measurement as in Figure 11a. For the measurements with a 0.007 wt% and a 0.002 wt% initiator concentration, no pressure increase can be detected and therefore no statement about the reaction can be made. Comparing this with the extinction in Figure 10, a signal influence can be measured at least for the 0.007 wt% measurement series, which demonstrates the higher sensitivity of the spectroscopic measurement system.

4. Discussion

Several series of measurements under different starting conditions were performed in a half-shell reactor using UV spectroscopy. The rod probe developed for this purpose was installed against the direction of flow and continuously recorded the spectral change of the NVP and PVP peak in the wavelength range of 320 nm. Looking at the whole spectrum, it can be seen that an increase in the extinction signal is related to an increase in product deposition (fouling), and to an increase in conversion.
Based on an 8 h measurement of the reaction, the increase in extinction can be interpreted as a layer build up in the first 3 h. This can also be verified by opening the reactor after 3 h. After 5 h the signal drops again, which can be explained by a decrease in conversion as the reactor volume decreases. With smaller starting concentrations of the monomer, a correlation with smaller signal maxima can be demonstrated, since less product is formed overall. This correlation can also be seen with decreasing initiator concentrations.
A comparison of the pressure measurements demonstrates that spectroscopy can detect product deposits earlier, making it possible to optimize process control and to avoid a complete clogging of the reactor. Spectroscopy still provides fouling signals at lower concentrations than pressure measurements, demonstrating better sensitivity.
The optimized measurement technology for the detection of fouling can be used in further applications to investigate in more detail the process control of existing processes, and ultimately to optimize them. In the simplest case, optimized process control can mean that batches are stopped well before an extensive cleaning of deposits becomes necessary or, in the worst case, before reactors become clogged. This, in turn, leads to improved product quality, less waste, lower energy requirements, and reduced production costs in the long term.
However, since the extinction signal is increased on the one hand by the layer growth, and decreased on the other by a decrease in the conversion, a direct correlation of the measurement signal and of the layer thickness is only possible to a limited extent. For the first 3 h, a change in conversion can be excluded by additional measurements, but in the latter course, the signal overlap of both effects means that it is no longer possible to make a representative statement about the layer thickness.

5. Conclusions

In summary, the developed rod probe, compared to conventional pressure measurements, allows earlier detection of fouling. It is possible to qualitatively monitor the trend of the layer growth, and, in the later course of the measurement, the decrease in conversion. The measurement technology thus allows real-time investigation of the processes in the reactor and can be used to optimize reaction control. A clear quantification of the fouling thickness cannot yet be calculated, due to overlapping effects, and must be further investigated in a series of more extensive tests.

Author Contributions

Conceptualization, E.S.; methodology, E.S. and S.W.; validation, E.S. and S.W.; formal analysis, E.S. and S.W.; investigation, E.S. and S.W.; resources, M.R.; data curation, S.W.; writing—original draft preparation, E.S.; writing—review and editing, S.W. and M.R.; visualization, E.S. and S.W.; supervision, M.R. and U.N.; project administration, E.S. and S.W.; funding acquisition, M.R. and U.N. All authors have read and agreed to the published version of the manuscript.

Funding

This research was funded by the Federal Ministry for Economic Affairs and Climate Action Germany, grant number 03EN2004F (University of Stuttgart) and 03EN2004K (CeMOS).

Data Availability Statement

Not applicable.

Acknowledgments

The authors of this article would like to thank all project partners and especially the project manager, Hungenberg, for their support.

Conflicts of Interest

The authors declare no conflict of interest. The funders had no role in the design of the study; in the collection, analyses, or interpretation of data; in the writing of the manuscript; or in the decision to publish the results.

References

  1. Bakeev, K.A. Process Analytical Technology: Spectroscopic Tools and Implementation Strategies for the Chemical and Pharmaceutical Industries, 2nd ed.; Wiley: Chichester, UK, 2010; ISBN 9780470722077. [Google Scholar]
  2. Simon, L.L.; Pataki, H.; Marosi, G.; Meemken, F.; Hungerbühler, K.; Baiker, A.; Tummala, S.; Glennon, B.; Kuentz, M.; Steele, G.; et al. Assessment of Recent Process Analytical Technology (PAT) Trends: A Multiauthor Review. Org. Process Res. Dev. 2015, 19, 3–62. [Google Scholar] [CrossRef]
  3. Kessler, R.W.; Kessler, W.; Zikulnig-Rusch, E. A Critical Summary of Spectroscopic Techniques and their Robust-ness in Industrial PAT Applications. Chem. Ing. Tech. 2016, 88, 710–721. [Google Scholar] [CrossRef]
  4. Parson, W.W. Modern Optical Spectroscopy; Springer: Berlin/Heidelberg, Germany, 2015; ISBN 978-3-662-46776-3. [Google Scholar]
  5. Günzler, H.; Gremlich, H.-U. IR-Spektroskopie; Wiley: Hoboken, NJ, USA, 2003; ISBN 9783527308019. [Google Scholar]
  6. Ritgen, U. Analytische Chemie I, 1. Aufl; Springer: Berlin/Heidelberg, Germany, 2020; pp. 63–83. ISBN 3662604949. [Google Scholar]
  7. Perkampus, H.-H. UV-VIS Spectroscopy and Its Applications; Springer: Berlin/Heidelberg, Germany; New York, NY, USA, 1992; ISBN 978-3-642-77479-9. [Google Scholar]
  8. Shinde, G.; Godage, R.K.; Jadhav, R.S.; Manoj, B.; Aniket, B. A Review on Advances in UV Spectroscopy. Res. J. Scie. Technol. 2020, 12, 47. [Google Scholar] [CrossRef]
  9. Zander, C. Fouling during Solution Polymerization in Continuously Operated Reactors; University of Stuttgart: Stuttgart, Germany, 2021. [Google Scholar]
  10. Lim, S.Y.; Ghazali, N.F. Product Removal Strategy and Fouling Mechanism for Cellulose Hydrolysis in Enzymatic Membrane Reactor. Waste Biomass Valor. 2020, 11, 5575–5590. [Google Scholar] [CrossRef]
  11. Peinemann, K.-V. Membranes for Water Treatment, 1st ed.; John Wiley & Sons Incorporated: Weinheim, Germany, 2010; ISBN 978-3-527-31483-6. [Google Scholar]
  12. Neßlinger, V.; Welzel, S.; Rieker, F.; Meinderink, D.; Nieken, U.; Grundmeier, G. Thin Organic-Inorganic Anti-Fouling Hybrid-Films for Microreactor Components. Macro React. Eng. 2022, 10, 2200043. [Google Scholar] [CrossRef]
  13. Welzel, S.; Zander, C.; Hungenberg, K.-D.; Nieken, U. Modeling of the Branching Point Distribution During the Polymerization of N -Vinylpyrrolidone. Macro React. Eng. 2022, 16, 2200005. [Google Scholar] [CrossRef]
  14. Osenberg, M.; Forster, J.; Rust, S.; Fritsch, T.; Tebrugge, J.; Pauer, W.; Musch, T. Ultrasound Sensor for Process and Fouling Monitoring in Emulsion Polymerization Processes. In Proceedings of the 2022 IEEE Sensors, Dallas, TX, USA, 30 October–2 November 2022; IEEE: Piscataway, NJ, USA, 2022; pp. 1–4, ISBN 978-1-6654-8464-0. [Google Scholar]
  15. Böttcher, A.; Petri, J.; Langhoff, A.; Scholl, S.; Augustin, W.; Hohlen, A.; Johannsmann, D. Fouling Pathways in Emulsion Polymerization Differentiated with a Quartz Crystal Microbalance (QCM) Integrated into the Reactor Wall. Macro React. Eng. 2022, 16, 2100045. [Google Scholar] [CrossRef]
  16. Hohlen, A.; Augustin, W.; Scholl, S. Quantification of Polymer Fouling on Heat Transfer Surfaces During Synthesis. Macromol. React. Eng. 2020, 14, 1900035. [Google Scholar] [CrossRef] [Green Version]
  17. Schmitt, L.; Meyer, C.; Schorz, S.; Manser, S.; Scholl, S.; Rädle, M. Use of a Scattered Light Sensor for Monitoring the Dispersed Surface in Crystallization. Chem. Ing. Tech. 2022, 94, 1177–1184. [Google Scholar] [CrossRef]
  18. Guffart, J.; Bus, Y.; Nachtmann, M.; Lettau, M.; Schorz, S.; Nieder, H.; Repke, J.-U.; Rädle, M. Photometric Inline Monitoring of Pigment Concentration in Highly Filled Lacquers. Chem. Ing. Tech. 2020, 92, 729–735. [Google Scholar] [CrossRef]
  19. Manser, S.; Kommert, S.; Keck, S.; Spoor, E.; Rädle, M. New Conceptional Study of a Portable Highly Sensitive Pho-tometric Raman Sensor. Sensors 2022, 22, 6098. [Google Scholar] [CrossRef] [PubMed]
Figure 1. (a) Schematic of the probe tip and location of the optical fibers; (b) Photo of the polished probe tip.
Reactions 04 00011 g001
Figure 2. Scheme of the measurement setup.
Reactions 04 00011 g002
Figure 3. Simplified flow sheet of the experimental setup with the Fluitec ContiPlant half-shell reactor.
Reactions 04 00011 g003
Figure 4. Half-shell reactor with built-in probe.
Reactions 04 00011 g004
Figure 5. Measured raw data spectra of NVP and PVP dissolved in water (a) raw data of measurement series with increasing NVP concentration (b) processed data of measurement series with increasing NVP concentration (c) raw data of measurement series with increasing PVP concentration (d) processed data of measurement series with increasing PVP concentration (e) raw data of measurement series with increasing conversion (f) processed data of measurement series with increasing conversion.
Reactions 04 00011 g005
Figure 6. Conti measurement in a half-shell reactor at 85 °C with a monomer concentration of 20 wt%, and an initiator concentration of 0.02 wt%.
Reactions 04 00011 g006
Figure 7. Extinction measurement of different monomer concentrations in the half-shell reactor at 85 °C, and an initiator concentration of 0.02 wt%.
Reactions 04 00011 g007
Figure 8. Measurement of the conversion with HPLC over 3 h for a starting concentration of 20 wt% NVP, and an initiator concentration of 0.02 wt%.
Reactions 04 00011 g008
Figure 9. Tip of the rod probe and mixing elements (a) after approx. 3:00 h reaction time; (b) after 8:00 h reaction time.
Reactions 04 00011 g009
Figure 10. Extinction measurement of different initiator contents in the half-shell reactor at 85 °C, and a monomer content of 20 wt%.
Reactions 04 00011 g010
Figure 11. Pressure profile over reaction time with (a) varying NVP concentration, and (b) varying initiator concentration.
Reactions 04 00011 g011aReactions 04 00011 g011b
Table 1. Mass fluxes and composition for the reference case conditions and a superficial velocity of 5 mm/s in the Fluitec ContiPlant half-shell reactor.
Feed PumpMass Flux/g/minWeight Fractions (NVP/Water/Initiator)
P16.21/0/0
P29.30/1/0
P39.30/1/0
P46.20/0.999/0.001
Disclaimer/Publisher’s Note: The statements, opinions and data contained in all publications are solely those of the individual author(s) and contributor(s) and not of MDPI and/or the editor(s). MDPI and/or the editor(s) disclaim responsibility for any injury to people or property resulting from any ideas, methods, instructions or products referred to in the content.

