1. Introduction
Poultry mortality refers to the death of domestic birds within a flock or population, which might occur due to various reasons, which include diseases (infectious and non-infectious) [
1,
2], management practices [
2,
3,
4], and environmental factors [
4,
5,
6]. Among these various mortality-causing factors, the main cause of mortality is infectious disease. Common infectious diseases that can cause high mortality rates are avian influenza, Newcastle disease, infectious bronchitis, infectious bursal disease, and coccidiosis [
5]. Infectious diseases must be diagnosed early to control disease spread across a flock and provide treatment to decrease substantial mortality rates. On the other hand, non-infectious factors such as overcrowding [
6], neoplasia [
1], extreme temperatures [
7], poor nutrition [
1], and poor ventilation [
7] might also contribute to mortality inside poultry housing. For example, heat stress can cause chickens to die in large numbers, especially during hot weather conditions [
8]. Similarly, overcrowding can lead to stress, disease transmission, and poor air quality, resulting in high mortality rates [
6]. Preventing mortality requires a comprehensive approach that involves good management practices, adequate nutrition, and disease prevention and control. For example, farmers should ensure that birds have adequate food, water, and a clean house with a well-ventilated environment. It is also important to implement biosecurity measures, such as limiting access to the flock to prevent the introduction of infectious agents. Therefore, understanding the factors contributing to mortality and implementing good management practices can help reduce mortality rates and improve health and welfare.
In order to stop the spread of infectious diseases and reduce the influence of other factors that can cause mortality, early mortality detection (MD) in poultry is crucial. According to Wibisono et al. [
9], infectious diseases are the primary causes of bird mortality. Therefore, early detection of sick or dying birds can help farmers promptly isolate affected birds, implement preventive disease strategies, and seek veterinary assistance when necessary. Additionally, early MD allows farmers to minimize further losses by culling remaining birds to prevent the spread of disease or other risk factors. Therefore, regularly monitoring flocks and seeking veterinary assistance at the first sign of illness or mortality is critical in ensuring the health and well-being of poultry and the success of poultry farming operations. That is why a good MD model is required for early MD and removing dead birds from the farm.
Automatic identification of dead birds in commercial poultry production can save time and labor while providing a crucial function for autonomous mortality removal systems, which eliminates the need for manual identification and helps streamline the identification process. High-resolution thermography has been investigated as a potential method for early MD in poultry production [
10]. Previous studies that have utilized MD in broilers involved extracting features and utilizing a pairwise approach to capturing thermal and visual spectrum images [
11]. Similarly, Zhu et al. [
12] developed a detection model based on Support Vector Machine (SVM) and achieved 95% accuracy in identifying dead birds. The combination of artificial intelligence and sensor networks using five classification algorithms (SVM, K-Nearest Neighbors, Decision Tree, Naïve Bayes, and Bayesian Network) achieved a 95.6% accuracy in identifying dead and sick chickens [
13]. However, equipping sensors to each bird in commercial cage-free (CF) housing is not a feasible or cost-effective approach. Comparative studies have shown that the YOLO model outperformed the SVM model in balanced object datasets [
14], emphasizing the importance of implementing image analysis techniques for early mortality detection in the industry using the YOLO model.
YOLO models have proven to be highly effective in detecting small objects such as laying hens [
15,
16,
17,
18] and eggs [
19]. For instance, these models have successfully detected individual hens and their distribution [
15,
18], and achieved higher accuracy in identifying problematic behaviors such as pecking [
16] and mislaying [
17]. In the context of dead chicken removal, the implementation of YOLOv4 reached a system accuracy of 95.24% [
20]. Another study utilized YOLOv4 and a robot arm under specific lighting conditions (10–20 lux), resulting in a precision range of 74.5% to 86.1% [
21]. While the YOLOv5 model demonstrated high precision with an accuracy decrease of 0.1% in detecting dead broilers in a caged broiler house [
22], it lacked comprehensive details, and the housing conditions and bird type differed significantly from our current study. Therefore, our research aimed to compare the performance of the YOLOv5-MD and YOLOv6-MD models in detecting dead hens in CF housing settings, considering factors such as camera height, litter condition, and feather coverage. The objectives of this study were to (a) develop and test the performance of different deep learning models; and (b) evaluate the optimal YOLO-MD model’s (e.g., the YOLOv5-MD and YOLOv6-MD models) performance under different CF housing settings.
2. Materials and Methods
2.1. Experimental Design
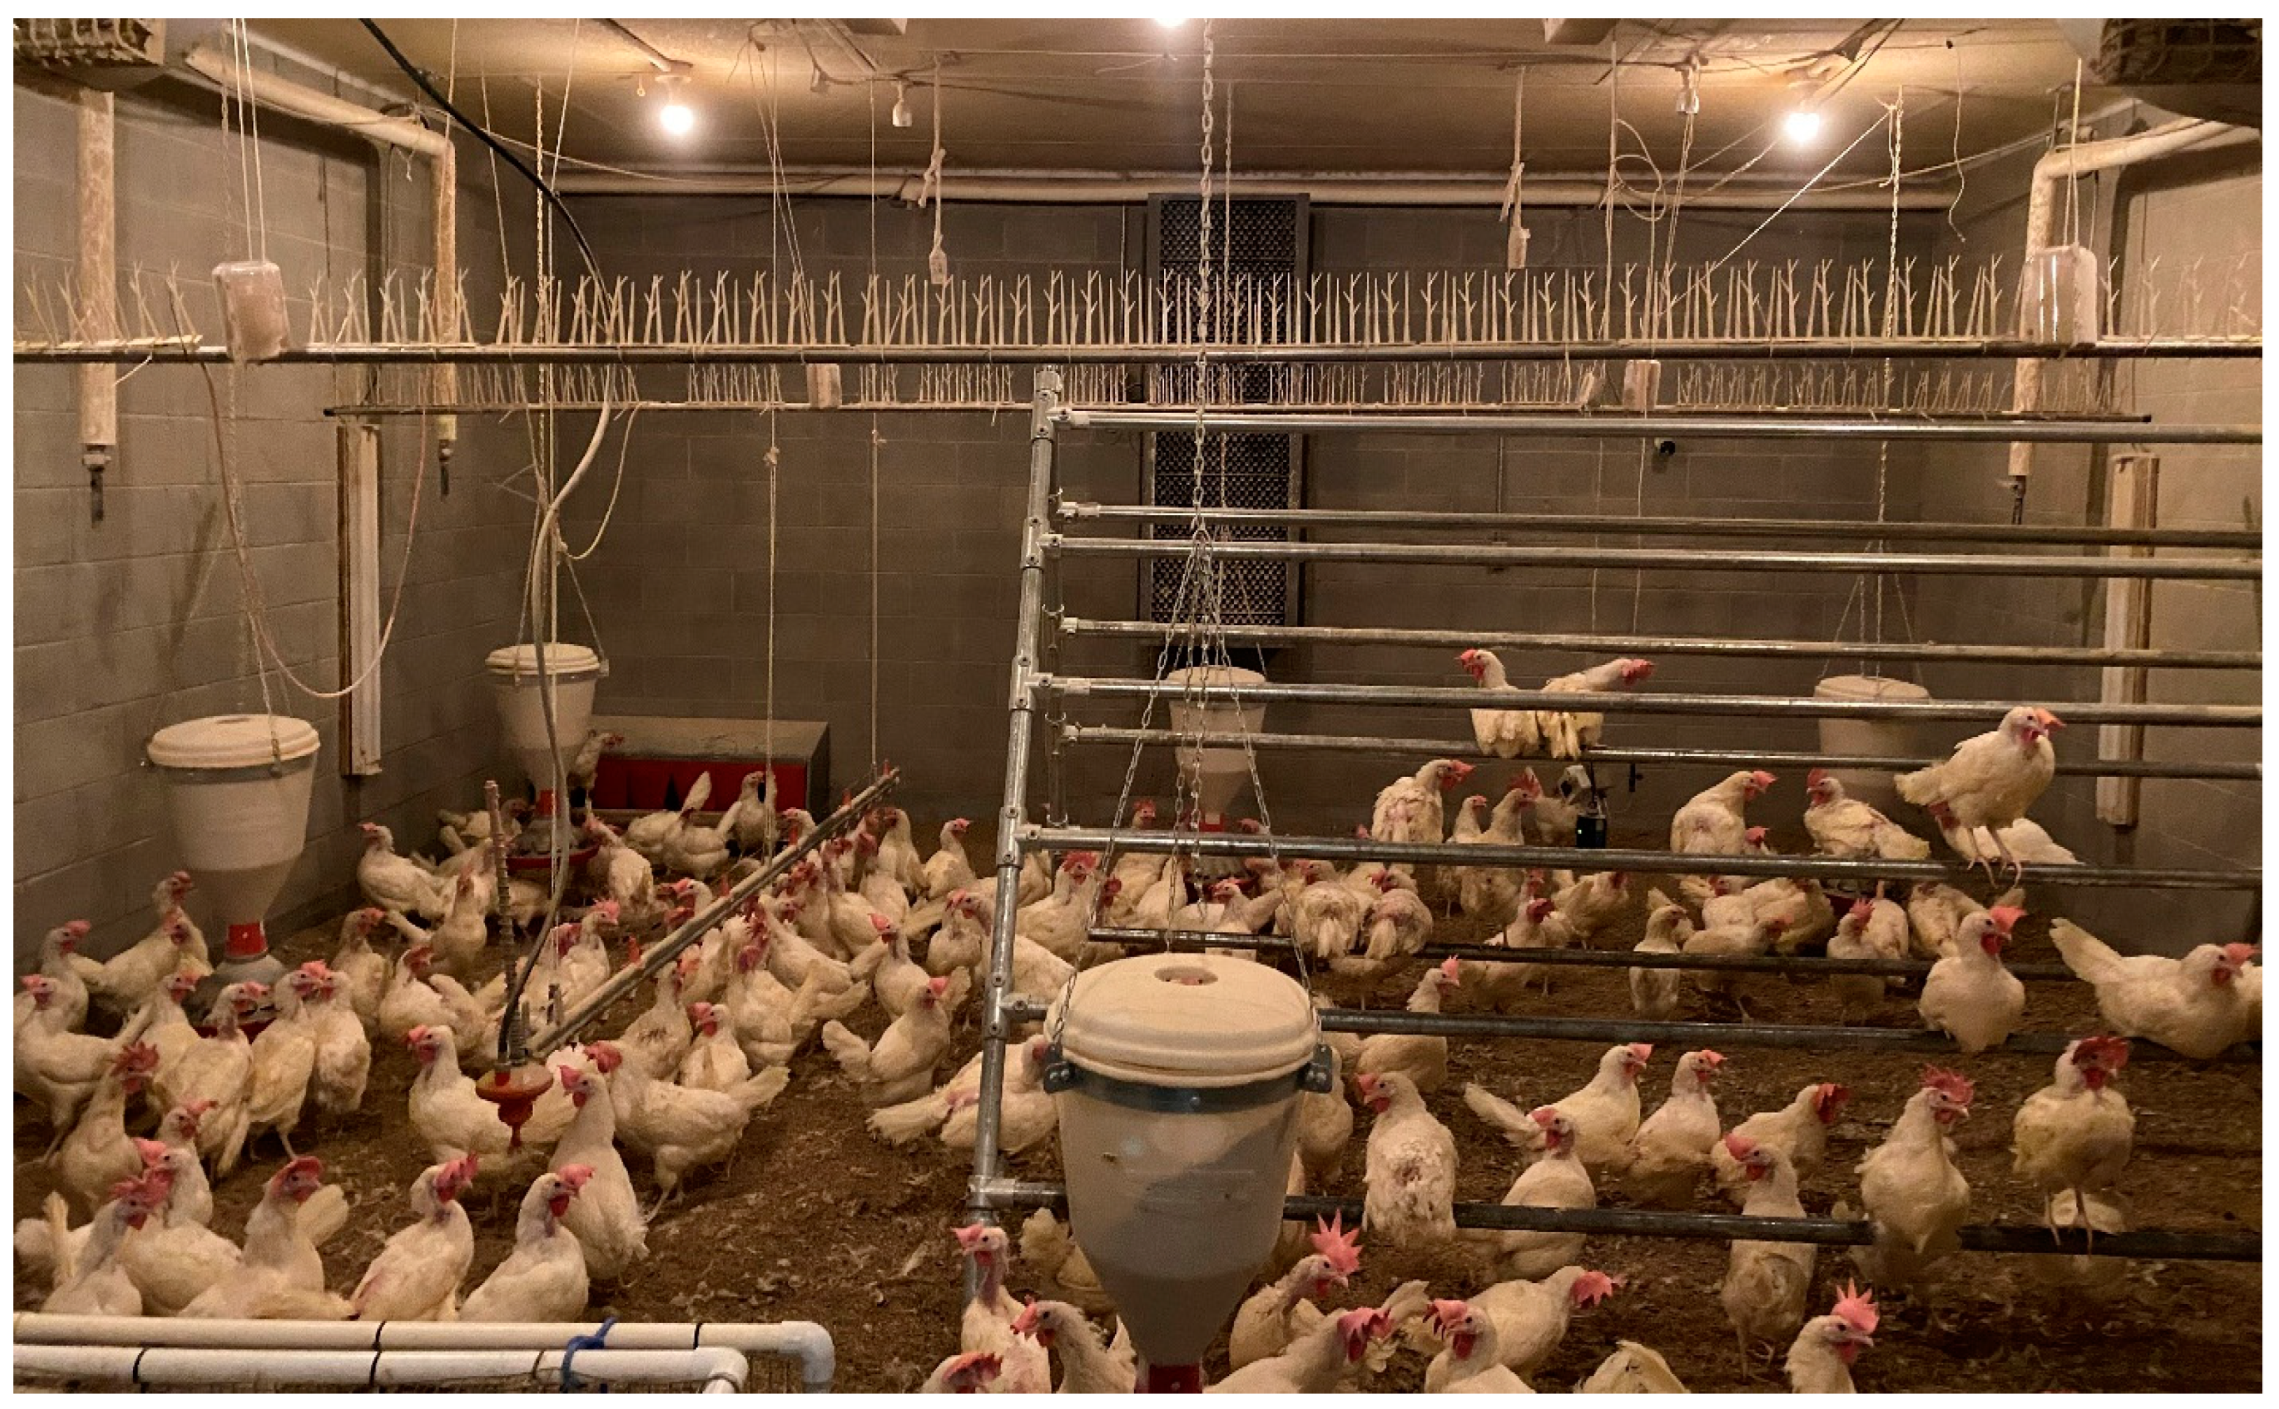
This study was conducted at the University of Georgia (UGA) in Athens, GA, USA, which involved four identical CF research facilities measuring 7.3 m L × 6.1 m W × 3 m H each. These facilities house approximately 200 Hy-line W36 birds raised from day 1 to day 420. The houses were equipped with feeders, drinkers, perches, nest boxes, and lighting, and the floors were covered with pine shavings measuring 5 cm in depth (
Figure 1). The ventilation rates, temperature, relative humidity, and light intensity and duration were all automatically controlled using the Chore-Tronics Model 8 controller (Chore-Time Equipment, Milford, IN, USA). Previous research studies have described the housing system details [
15,
16]. The animal management and utilization in this study were carefully monitored and approved by the Institutional Animal Care and Use Committee (IACUC) at the UGA, demonstrating a commitment to ethical and responsible research practices.
2.2. Image Data Acquisition and Pre-Processing
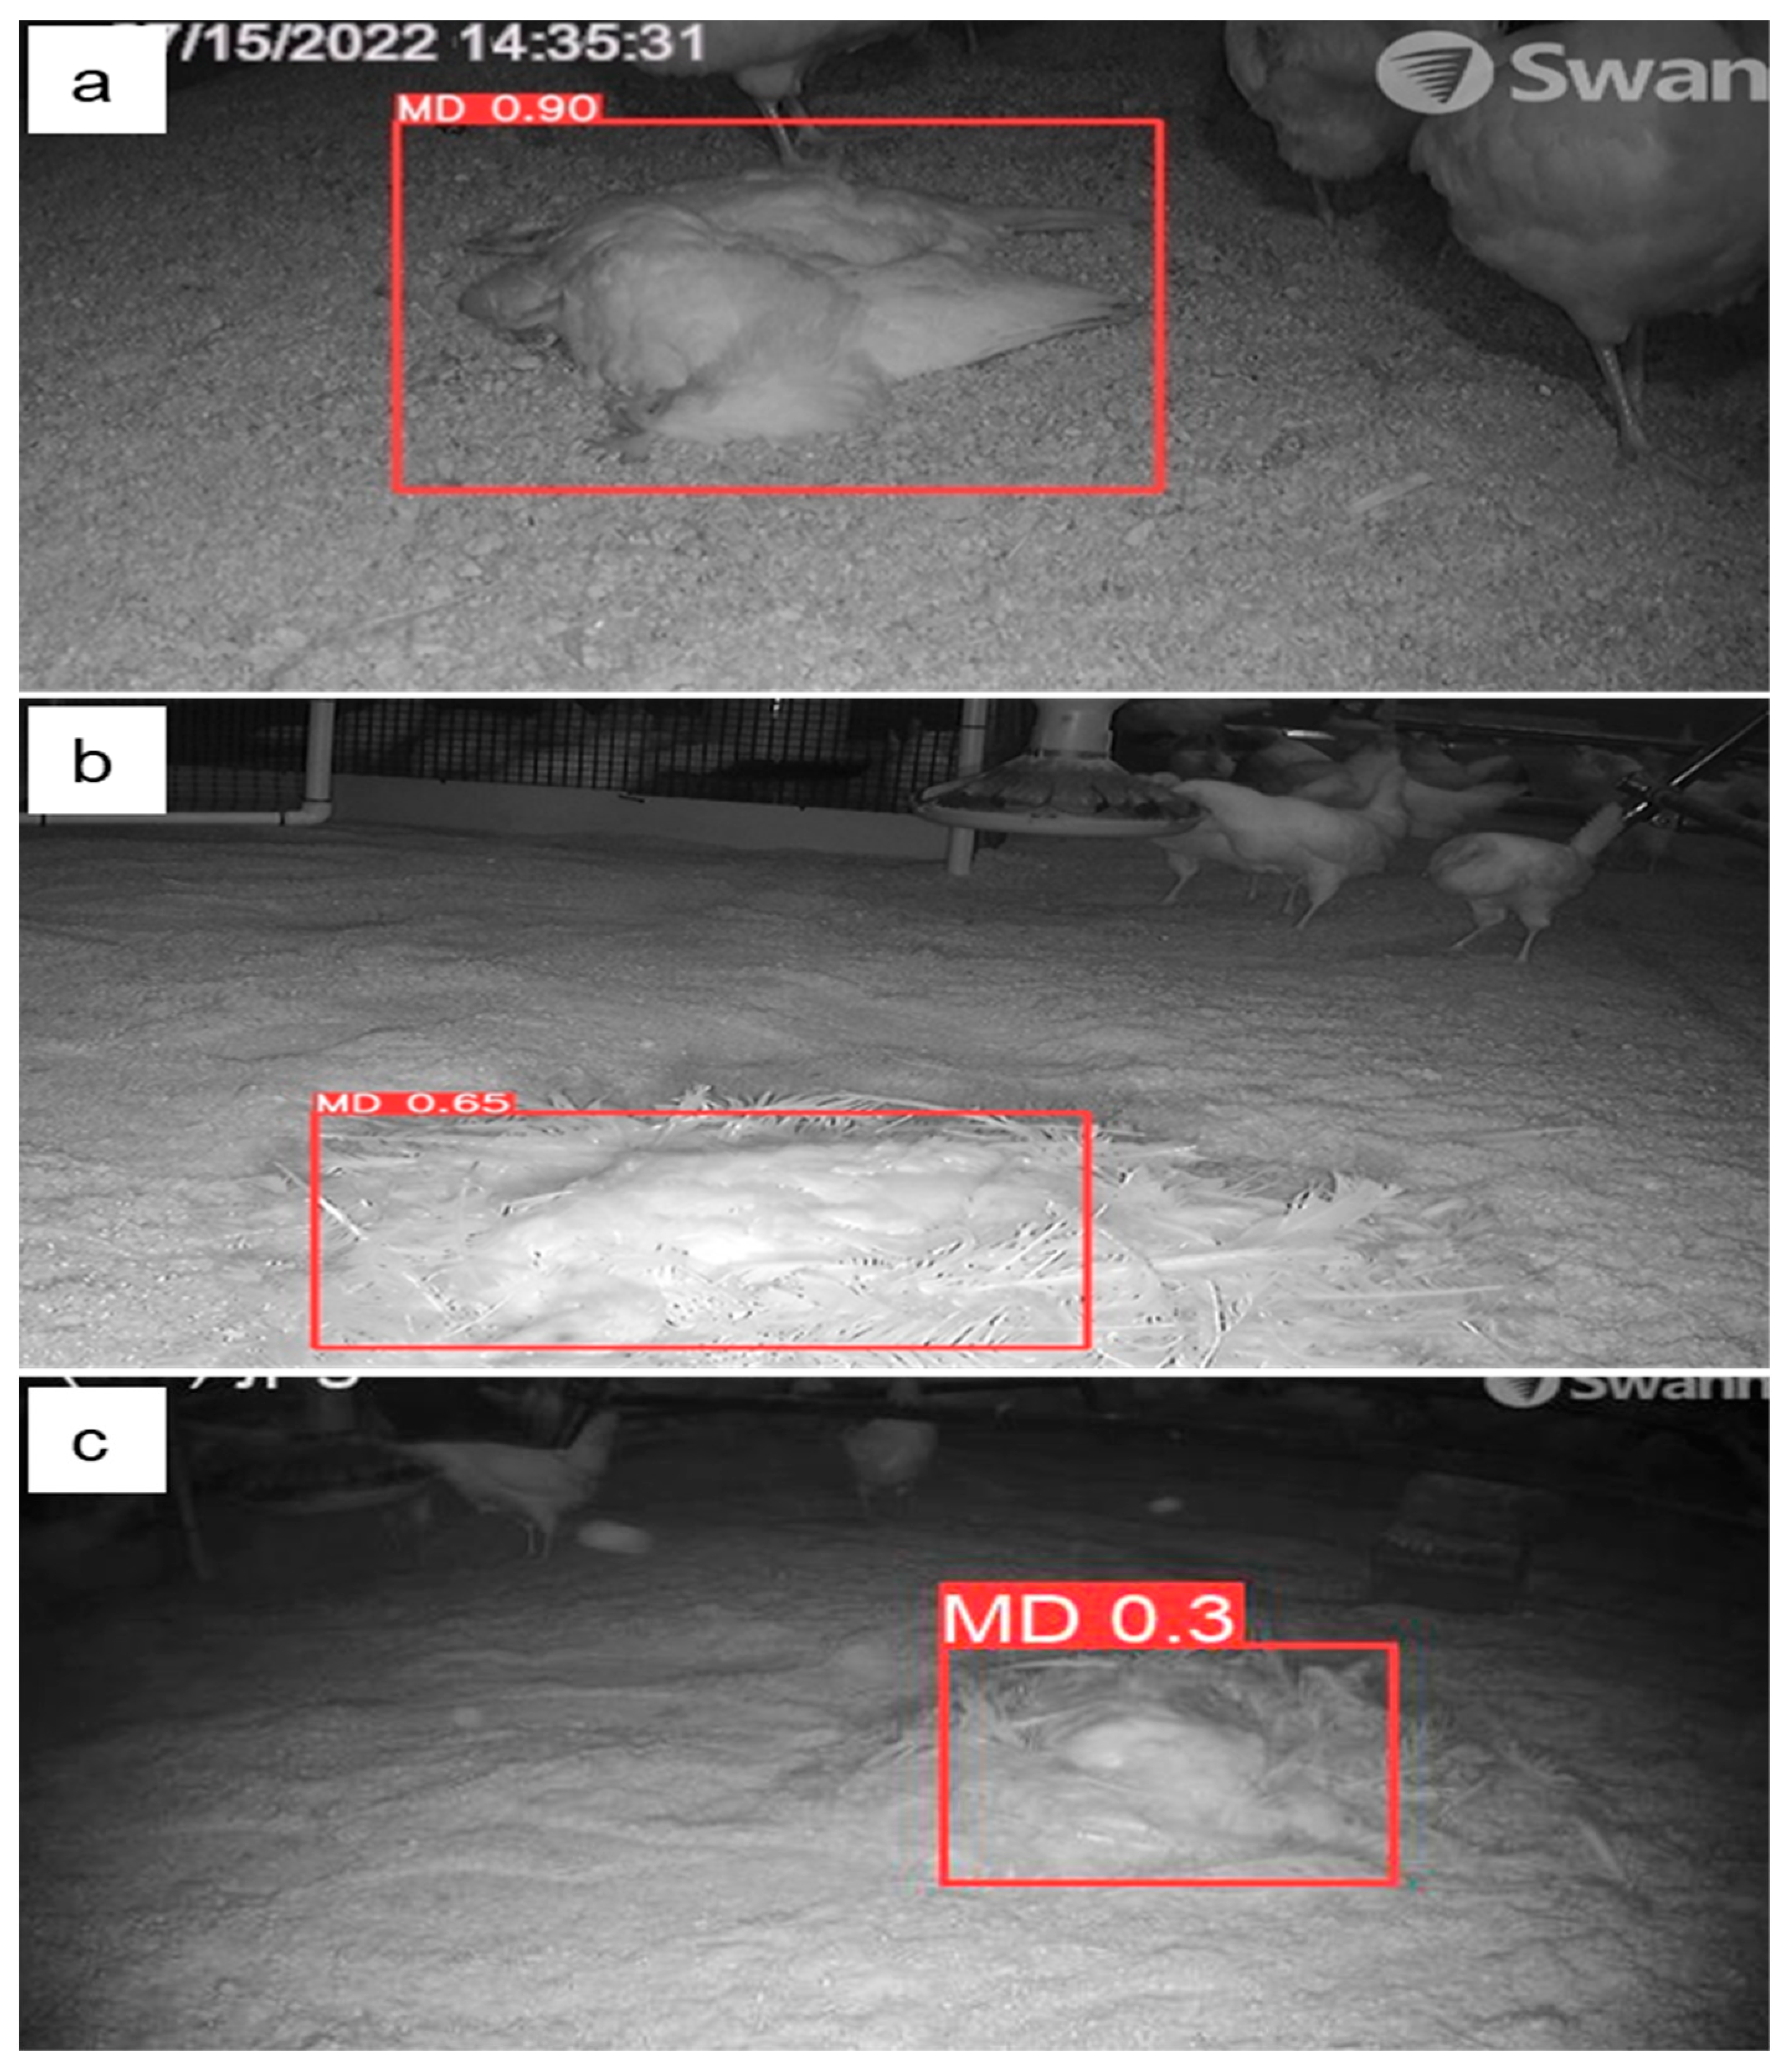
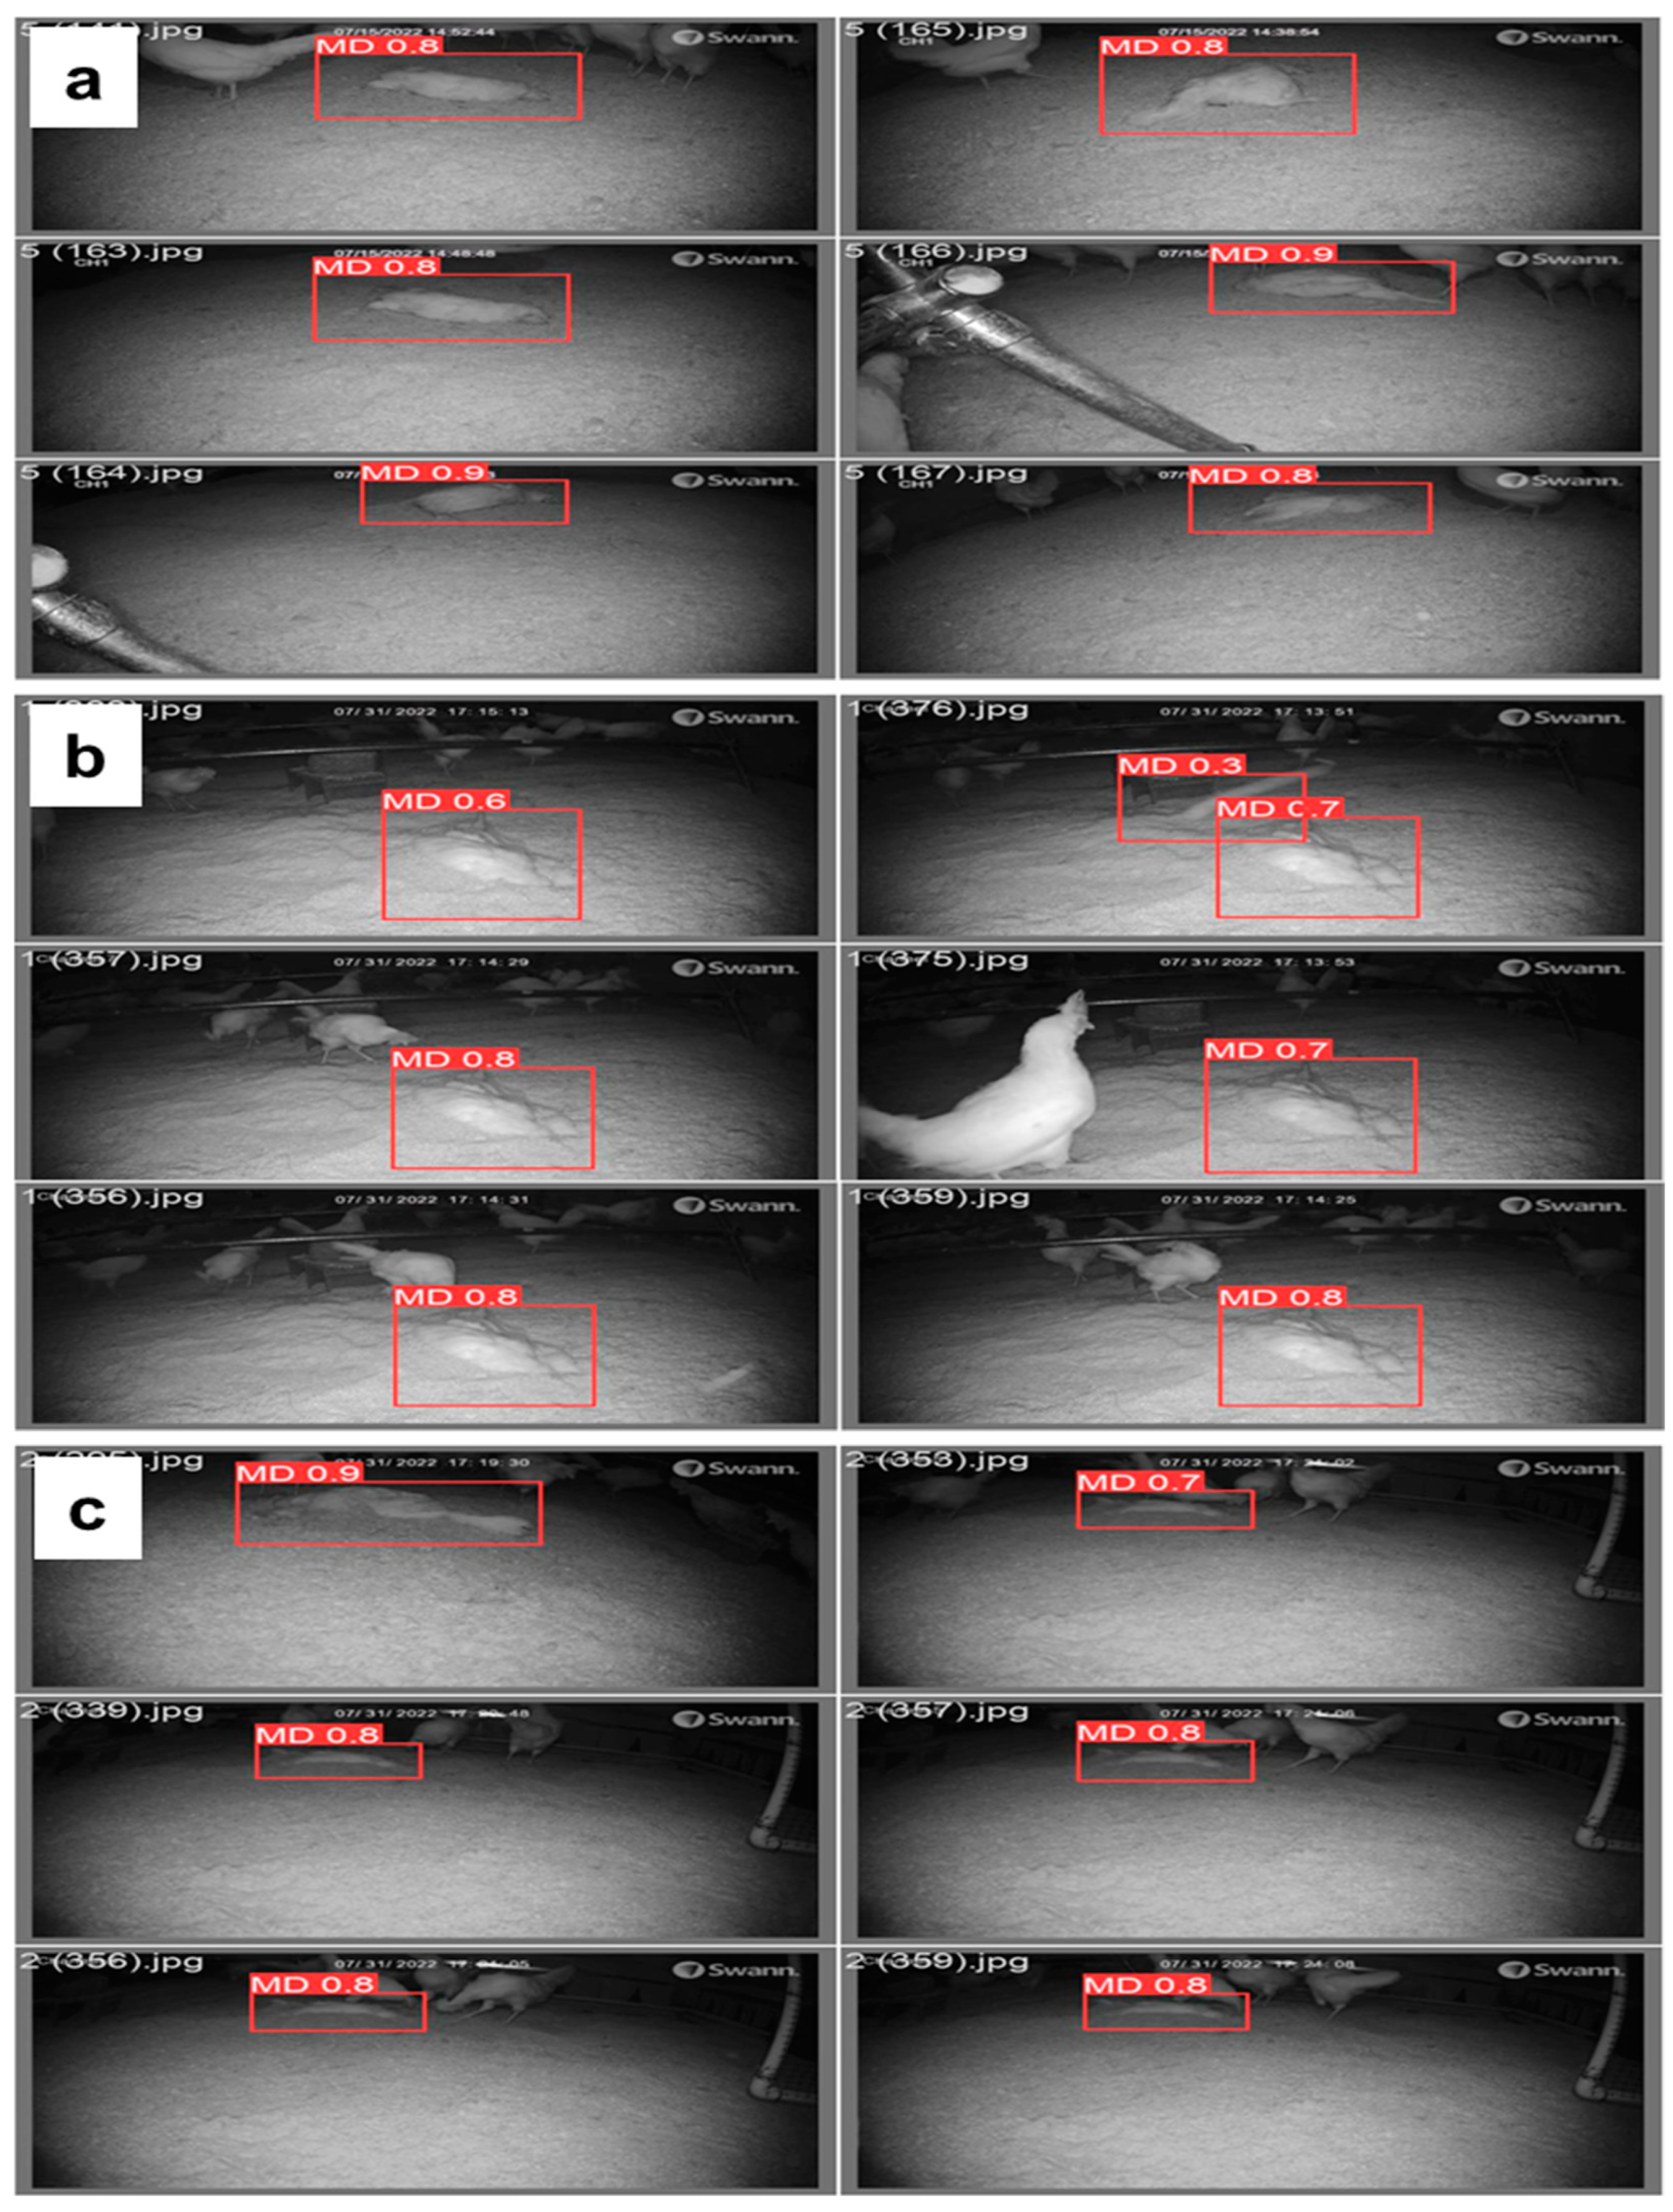
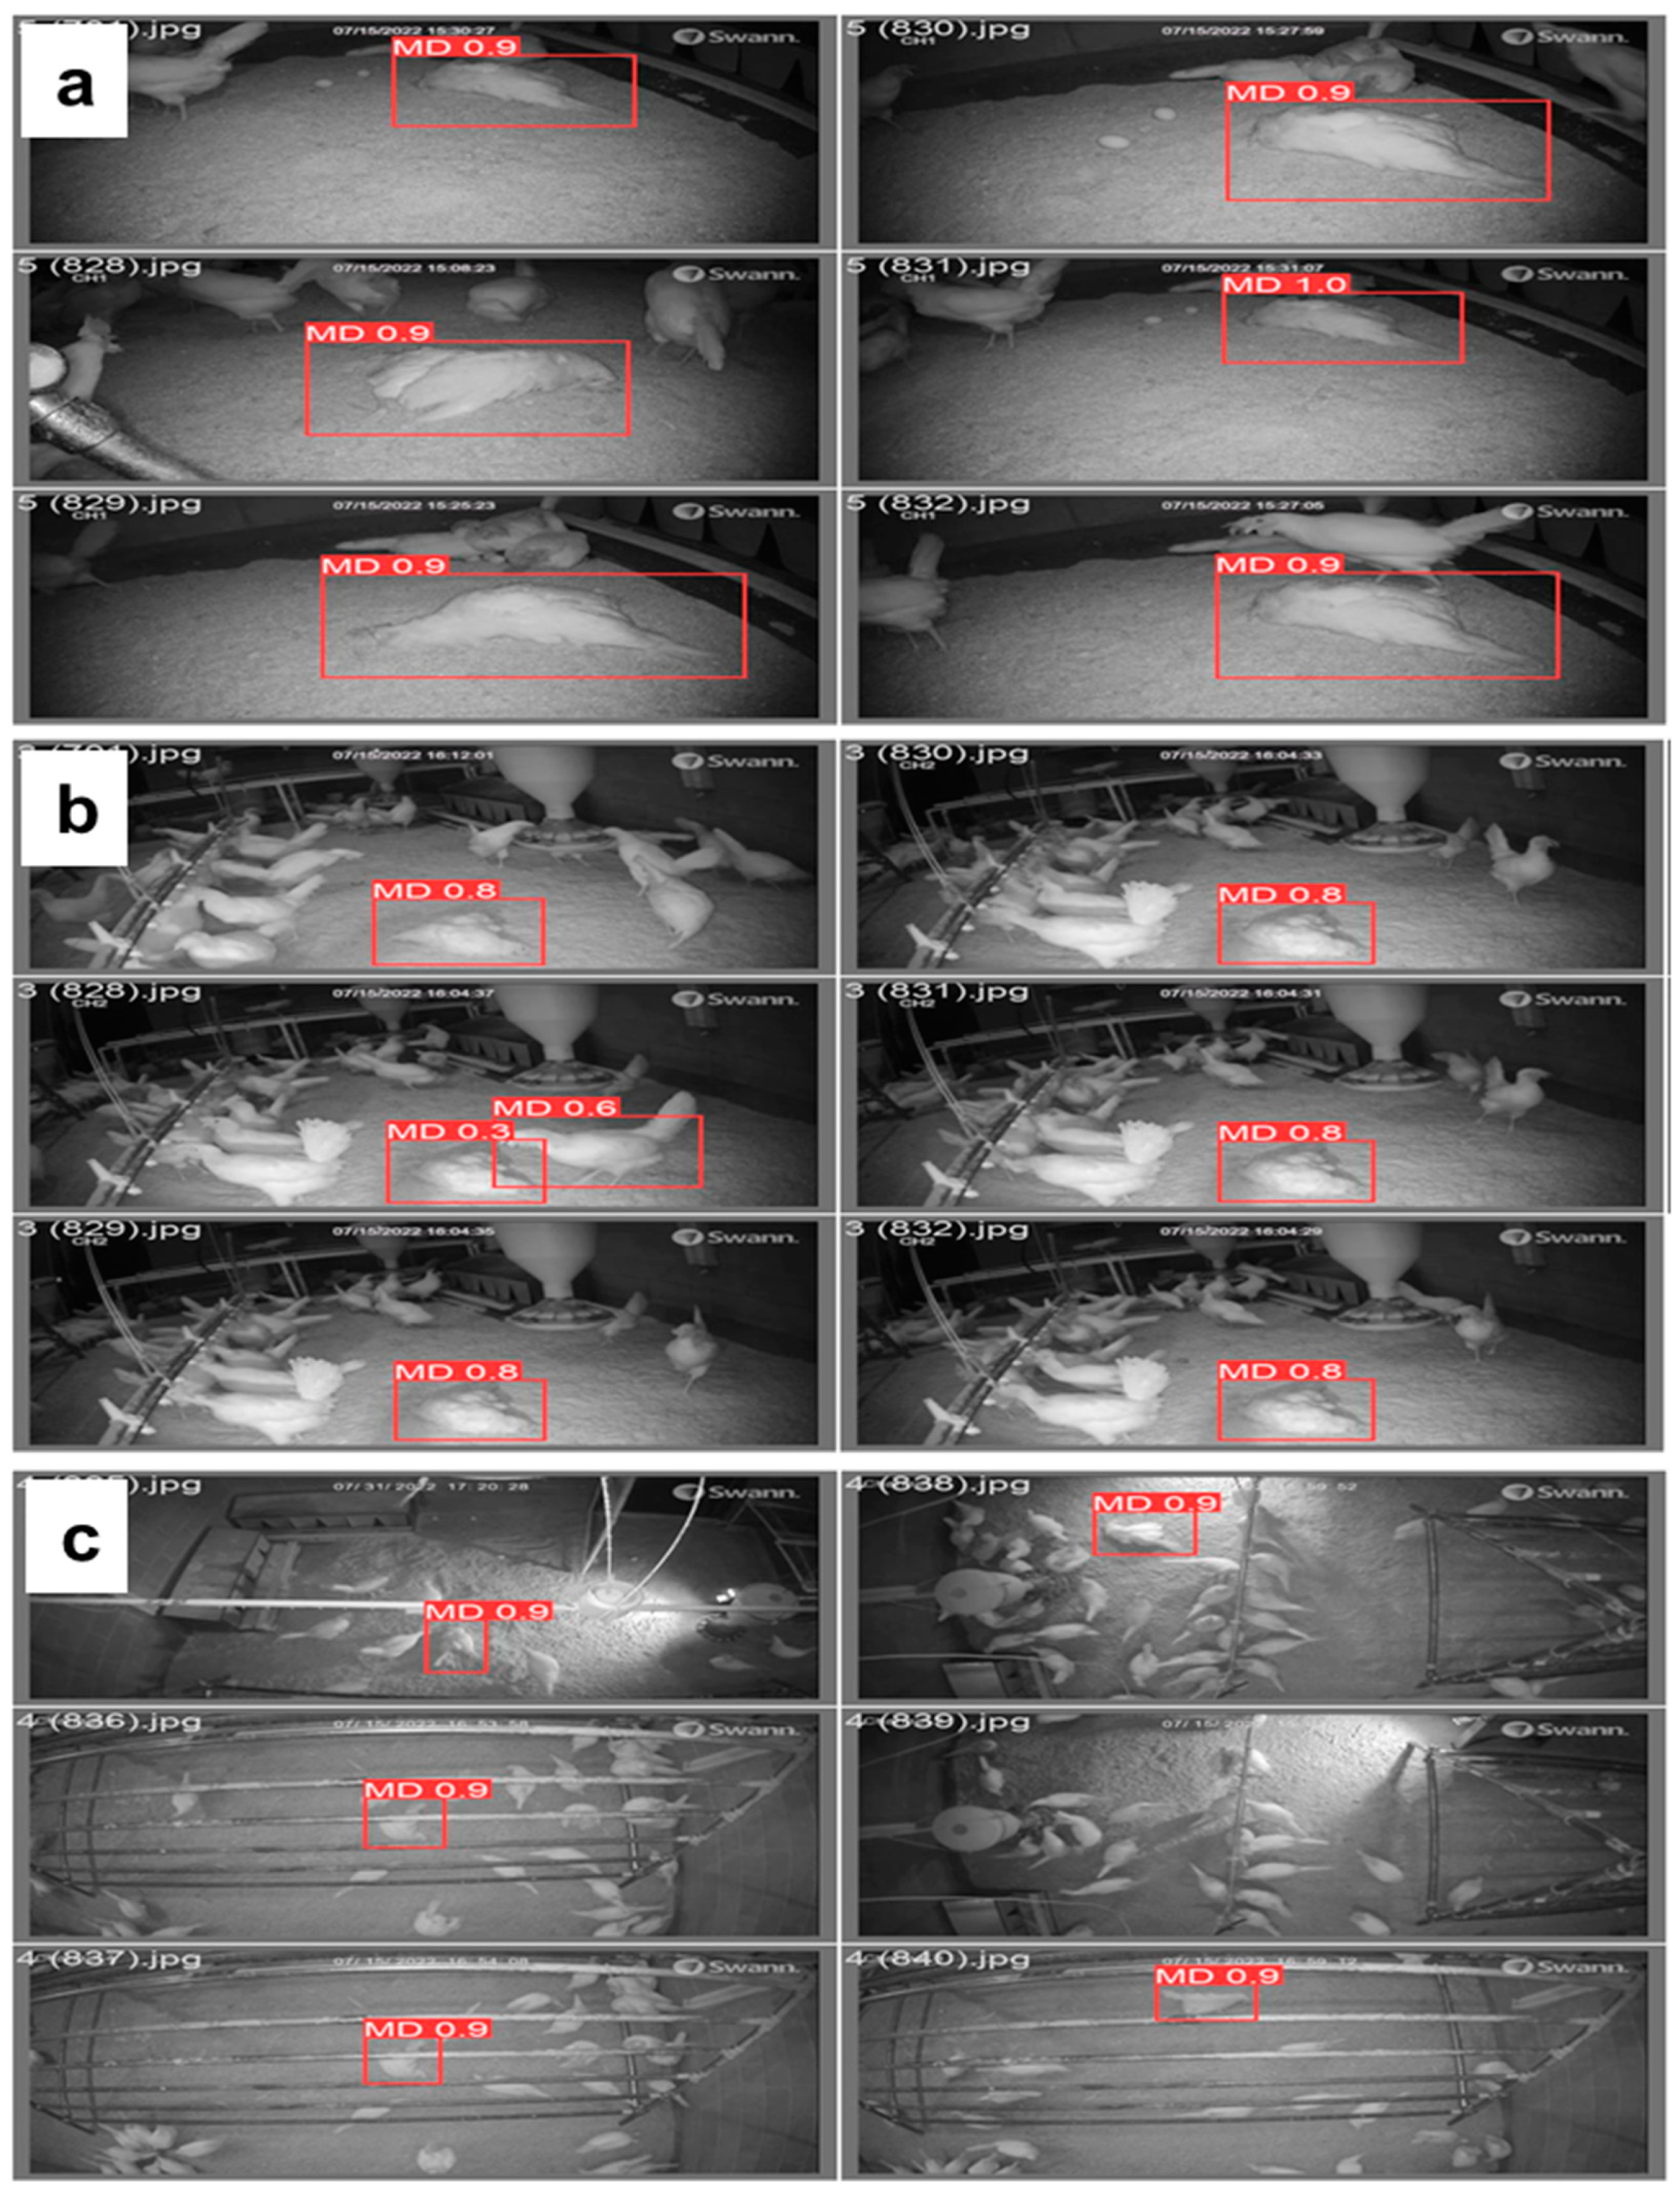
The primary data acquisition tool used in this study to record the mortality of hens was a night-vision network PRO-1080MSB camera (Swann Communications USA Inc., Santa Fe Springs, CA, USA) with six cameras installed in each room, mounted at approximately 3 m above the litter floor. Additionally, two cameras were placed at 0.5 and 1 m above the ground floor. The video recording was performed every day for 24 h using a digital video recorder (DVR-4580) from 50 to 60 weeks of age (WOA), while mortality data was collected when birds were found dead. Eight hens were found dead during that period, and video was recorded of those hens. The video files were saved in .avi format, with a 1920 × 1080-pixel resolution and a sampling rate of 15 frames per second (FPS). This data acquisition method provided a comprehensive and high-quality dataset for analyzing the behavior of the hens, which was instrumental in drawing meaningful conclusions from this study.
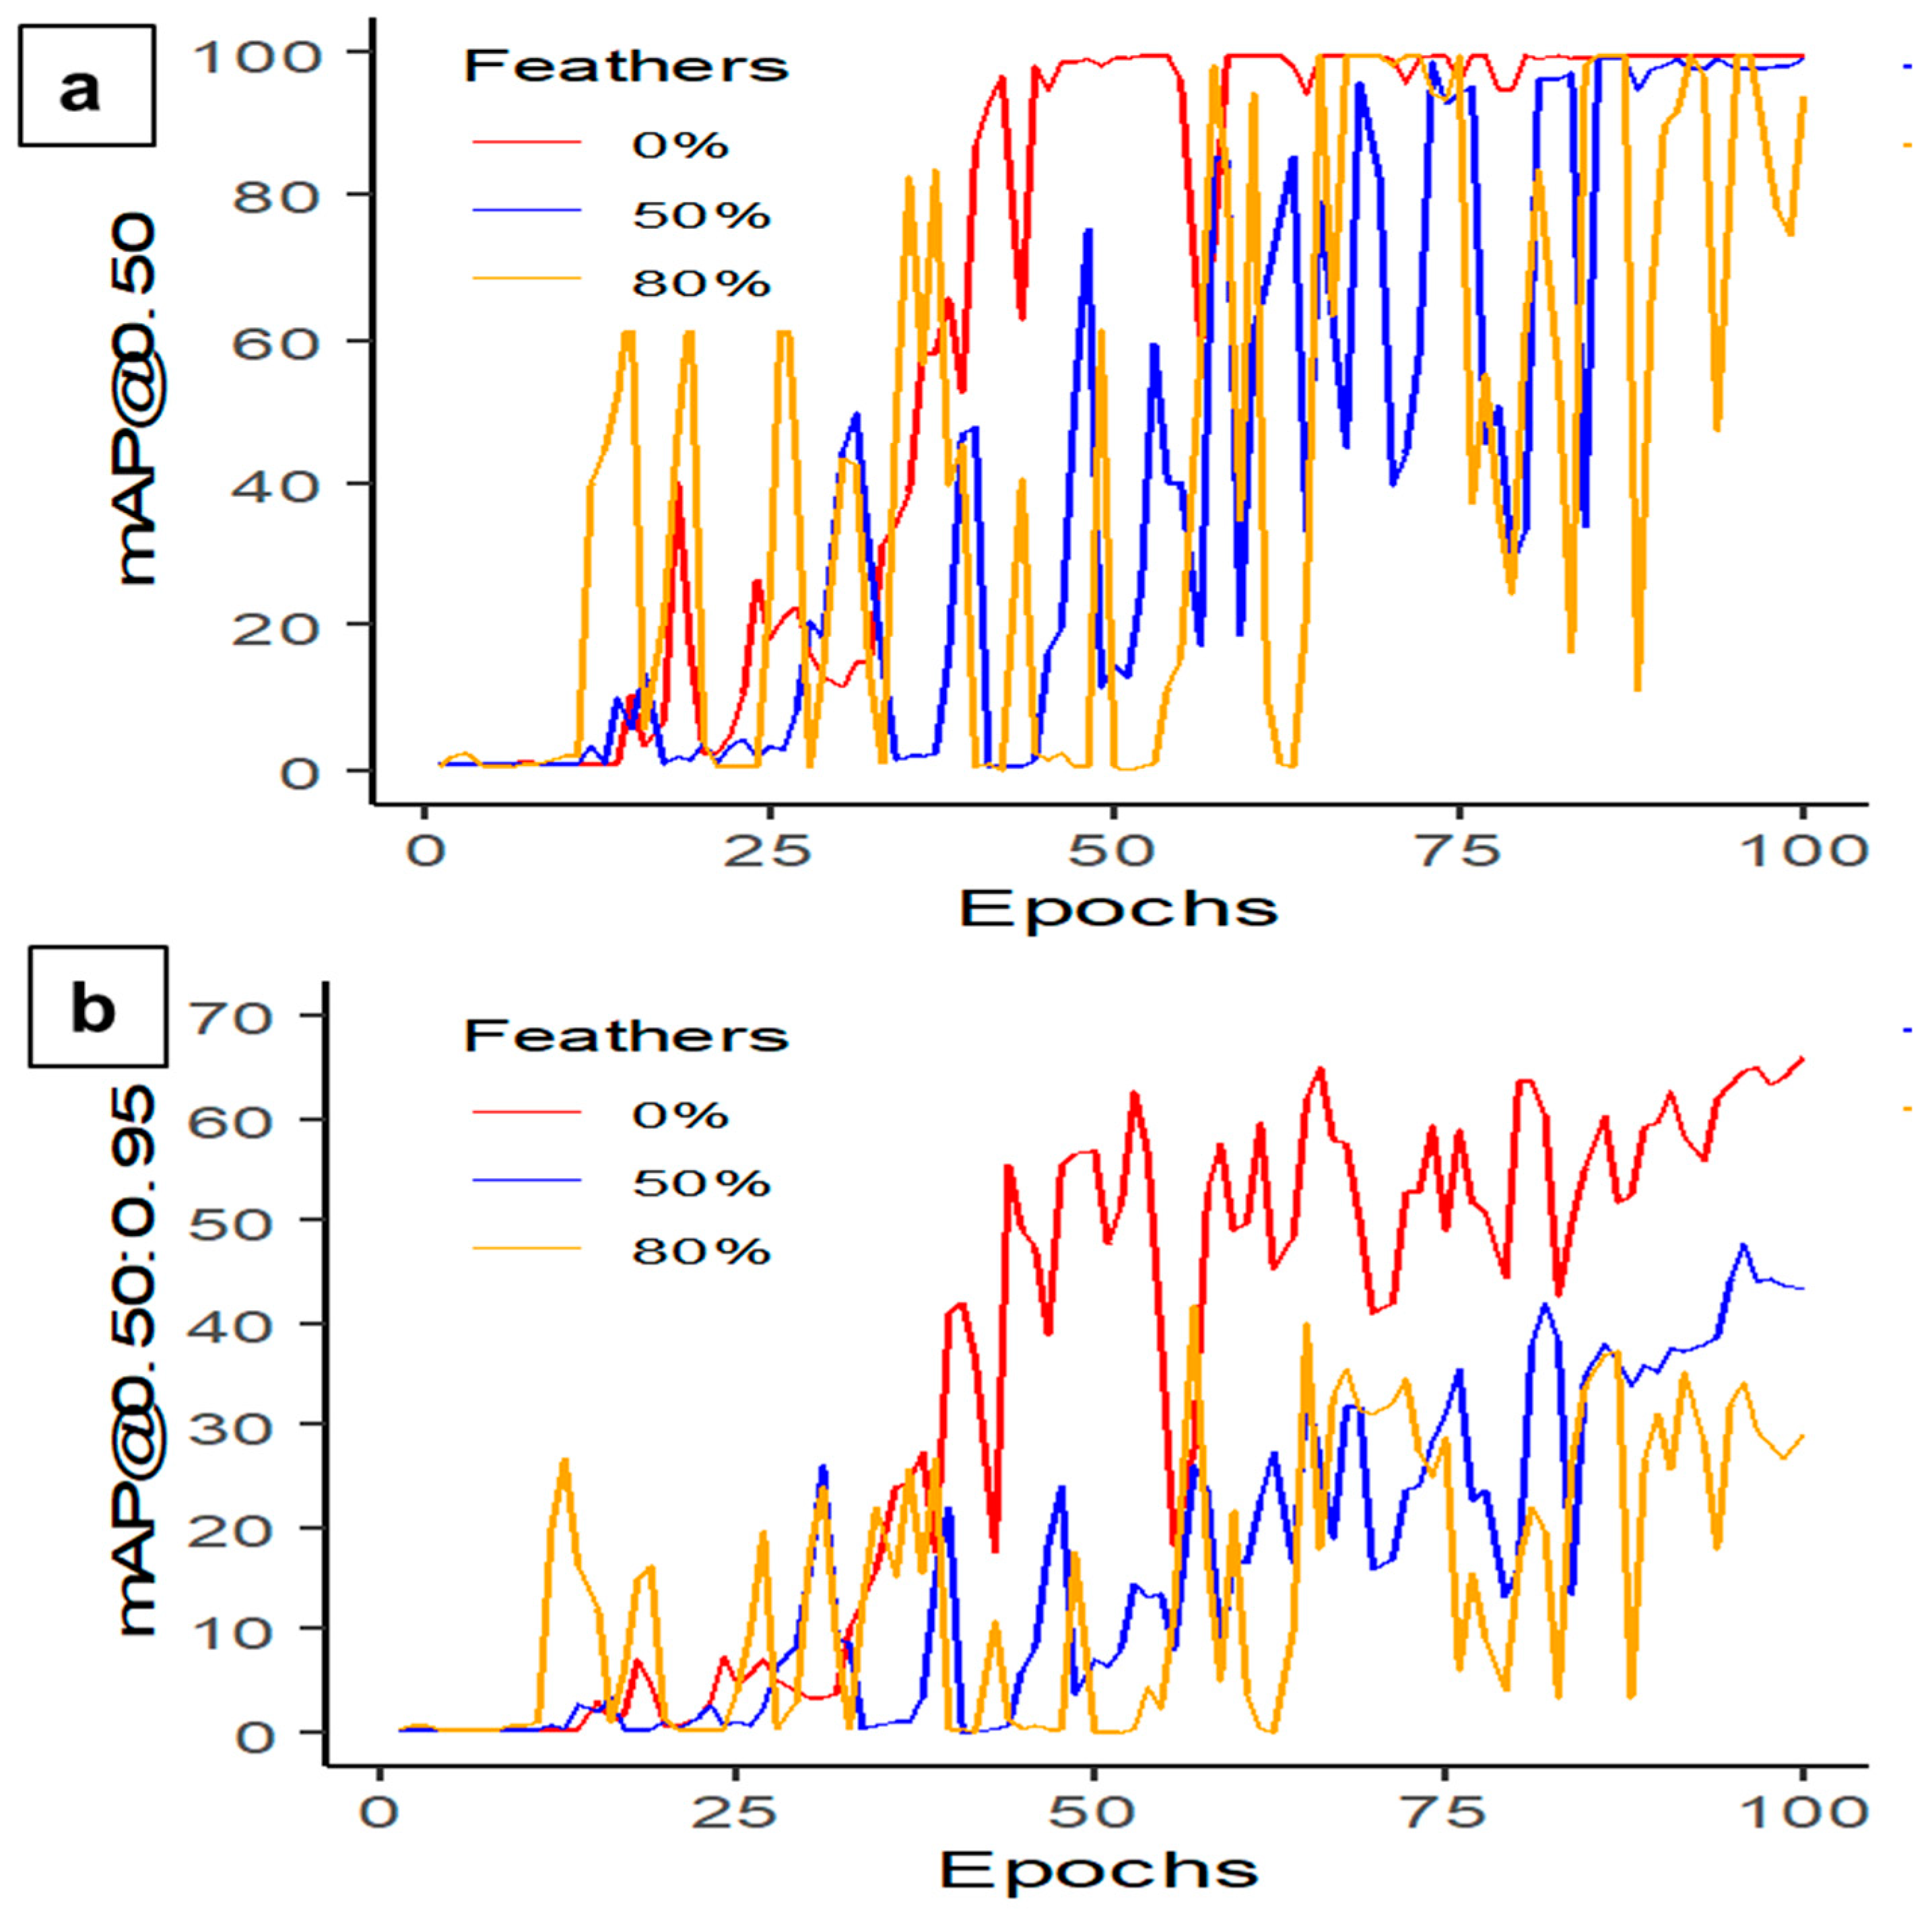
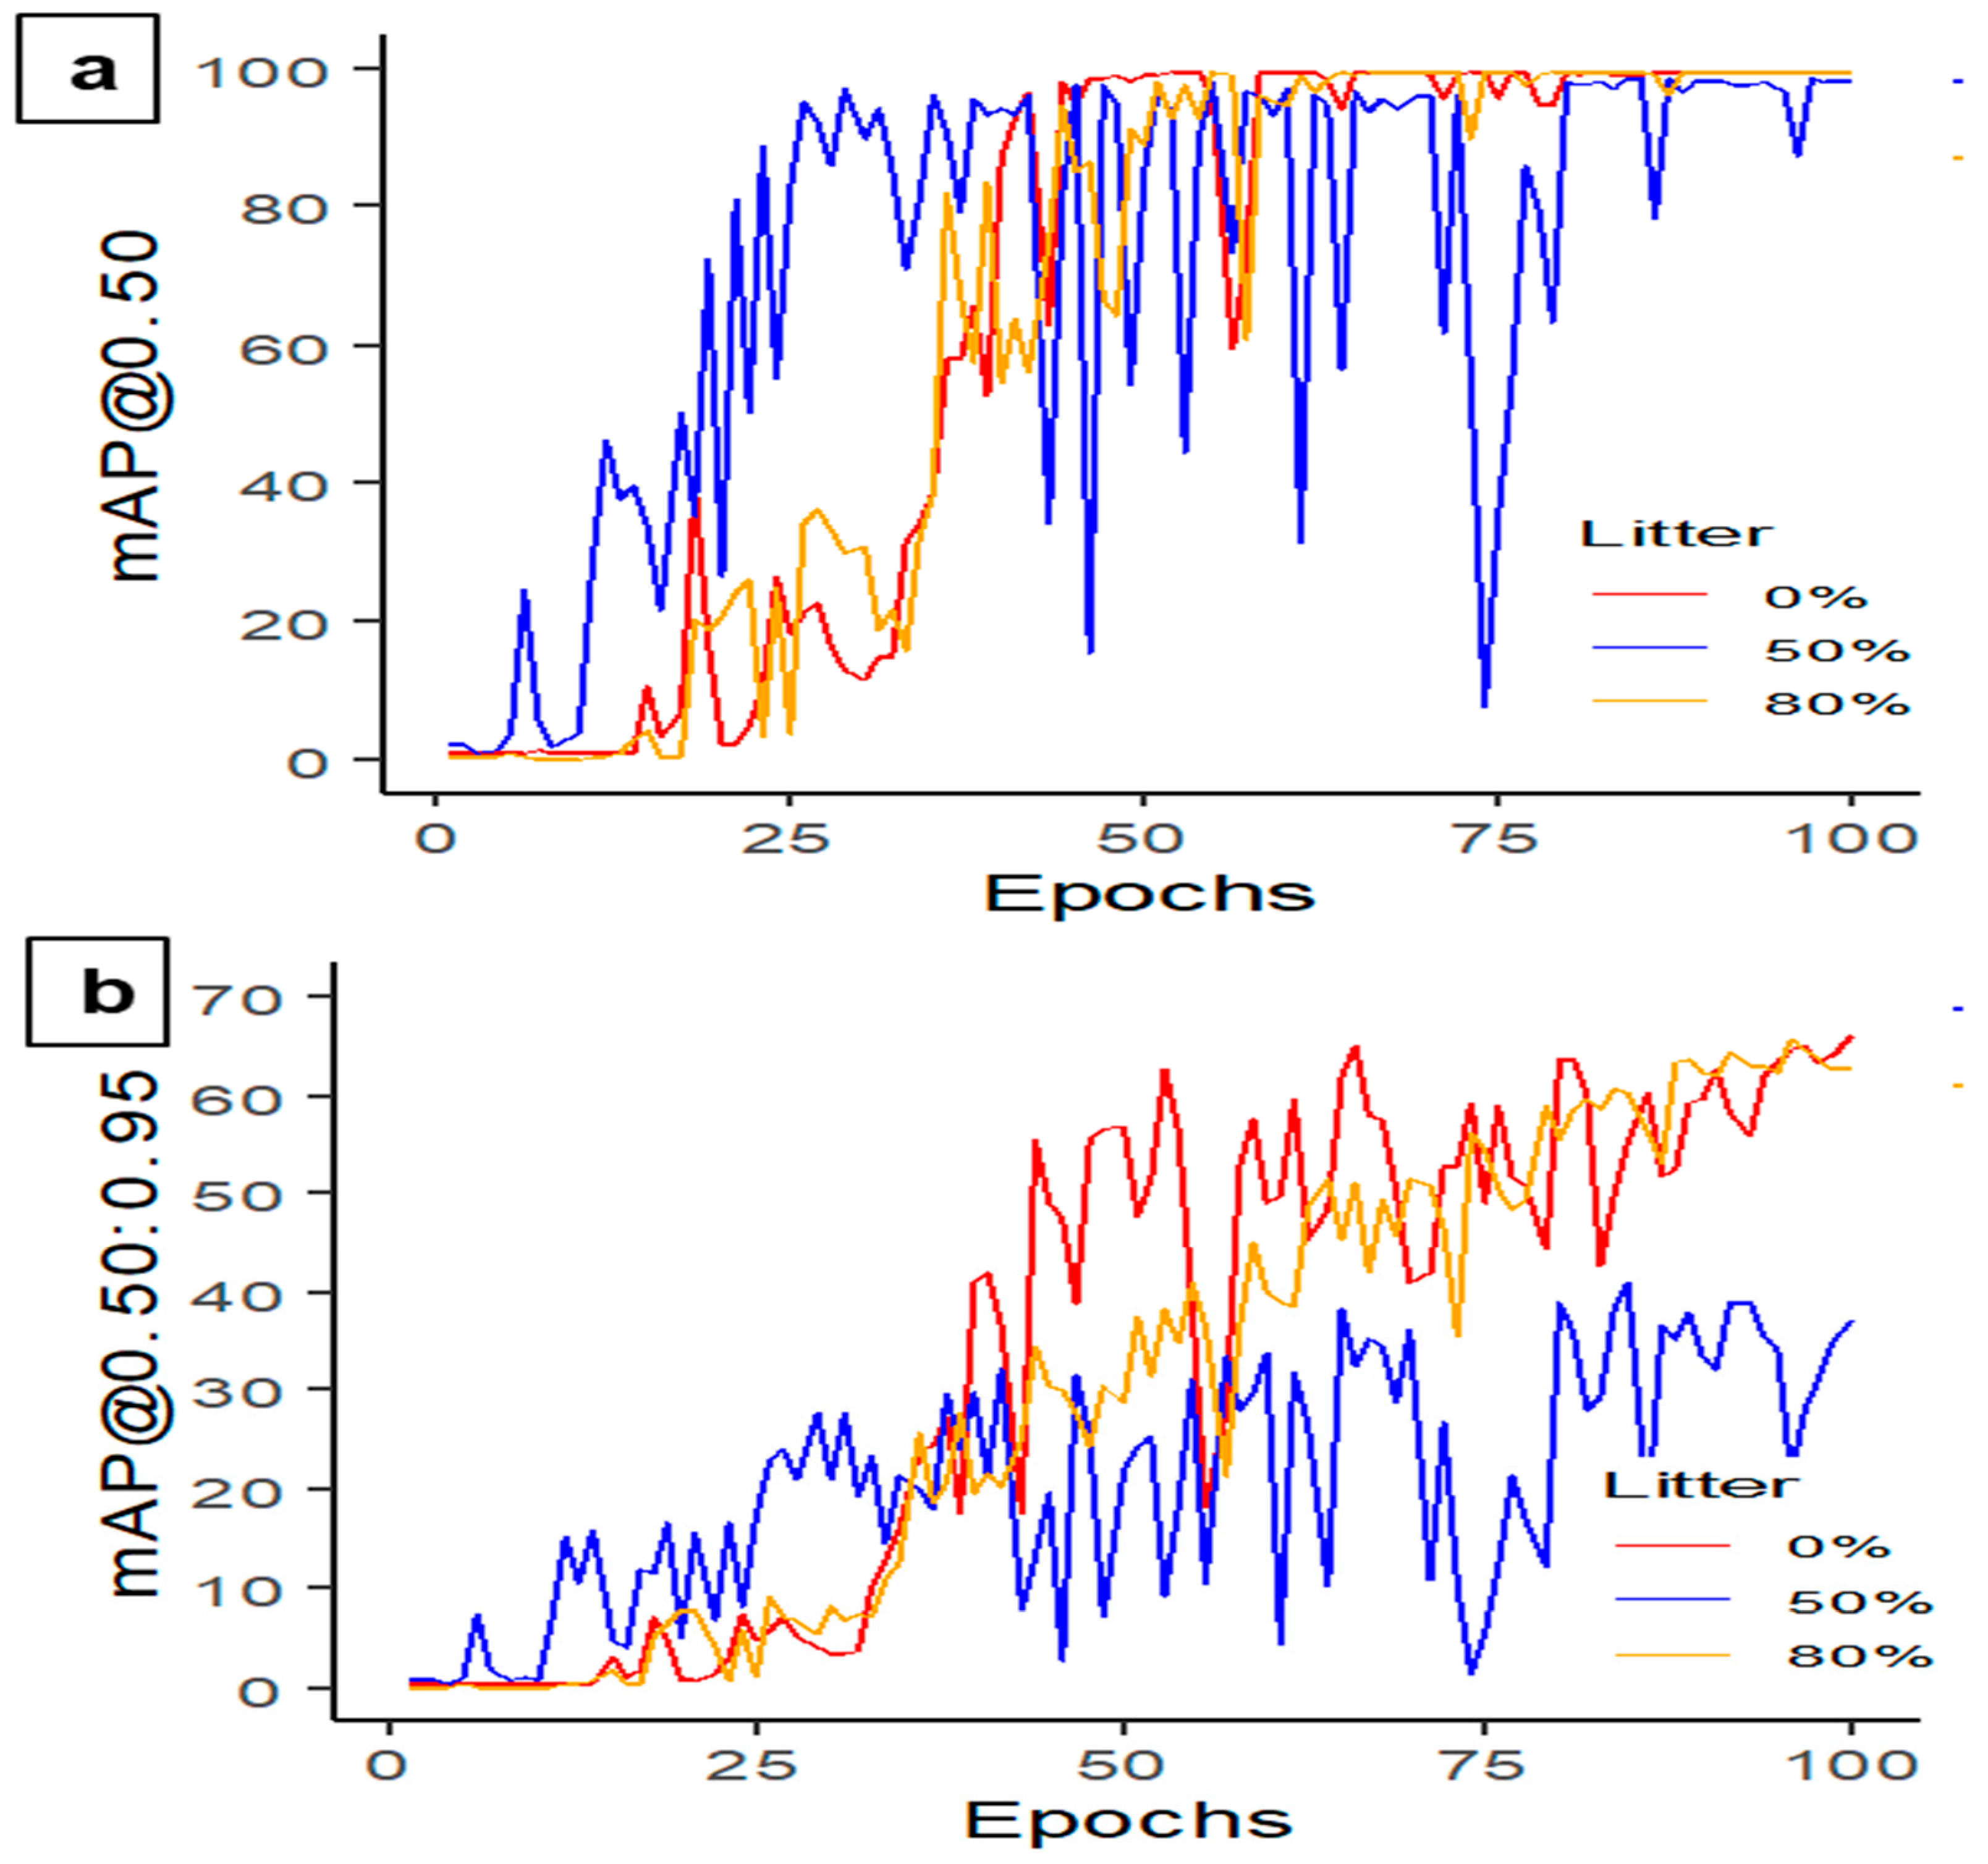
The CF housing consists of litter and feathers on the floor [
23,
24], which might affect the MD of hens. In addition, dustbathing or other hen activities might cover the dead bird fully or partially, so this research considers every scenario. To accurately represent the conditions in CF housing, this study employed video recording to capture the dead hens in different environmental conditions with varying degrees of litter and feather coverage. This research selected three litter and feather coverage levels—0% (no litter or feather coverage), 50% (50% of hen’s body covered with litter or feathers), and 80% (80% of hen’s body covered with litters or feathers)—as detailed in
Table 1. The decision to not exceed 80% was motivated by the potential discrepancies between actual hen mortality and the appearance of hen images beyond that level of coverage. The resulting dataset accurately depicts the different litter and feather covering levels in CF housing, enabling the deep learning model to perform effective MD.
In order to expand our image dataset and increase the number of samples, we employed various strategies. Firstly, we positioned the dead birds in different orientations, including vertical, horizontal, upward-facing, and downward-facing positions. Secondly, we placed the birds in various locations within the hen house, such as near perches, drinkers, feeders, walls, and in between perches, feeders, and drinkers. Additionally, we varied the housing conditions by covering the birds with different depths or percentages of litter or feathers. Finally, each time we encountered a dead bird, we recorded 10-min videos capturing the different orientations, placements, and housing conditions.
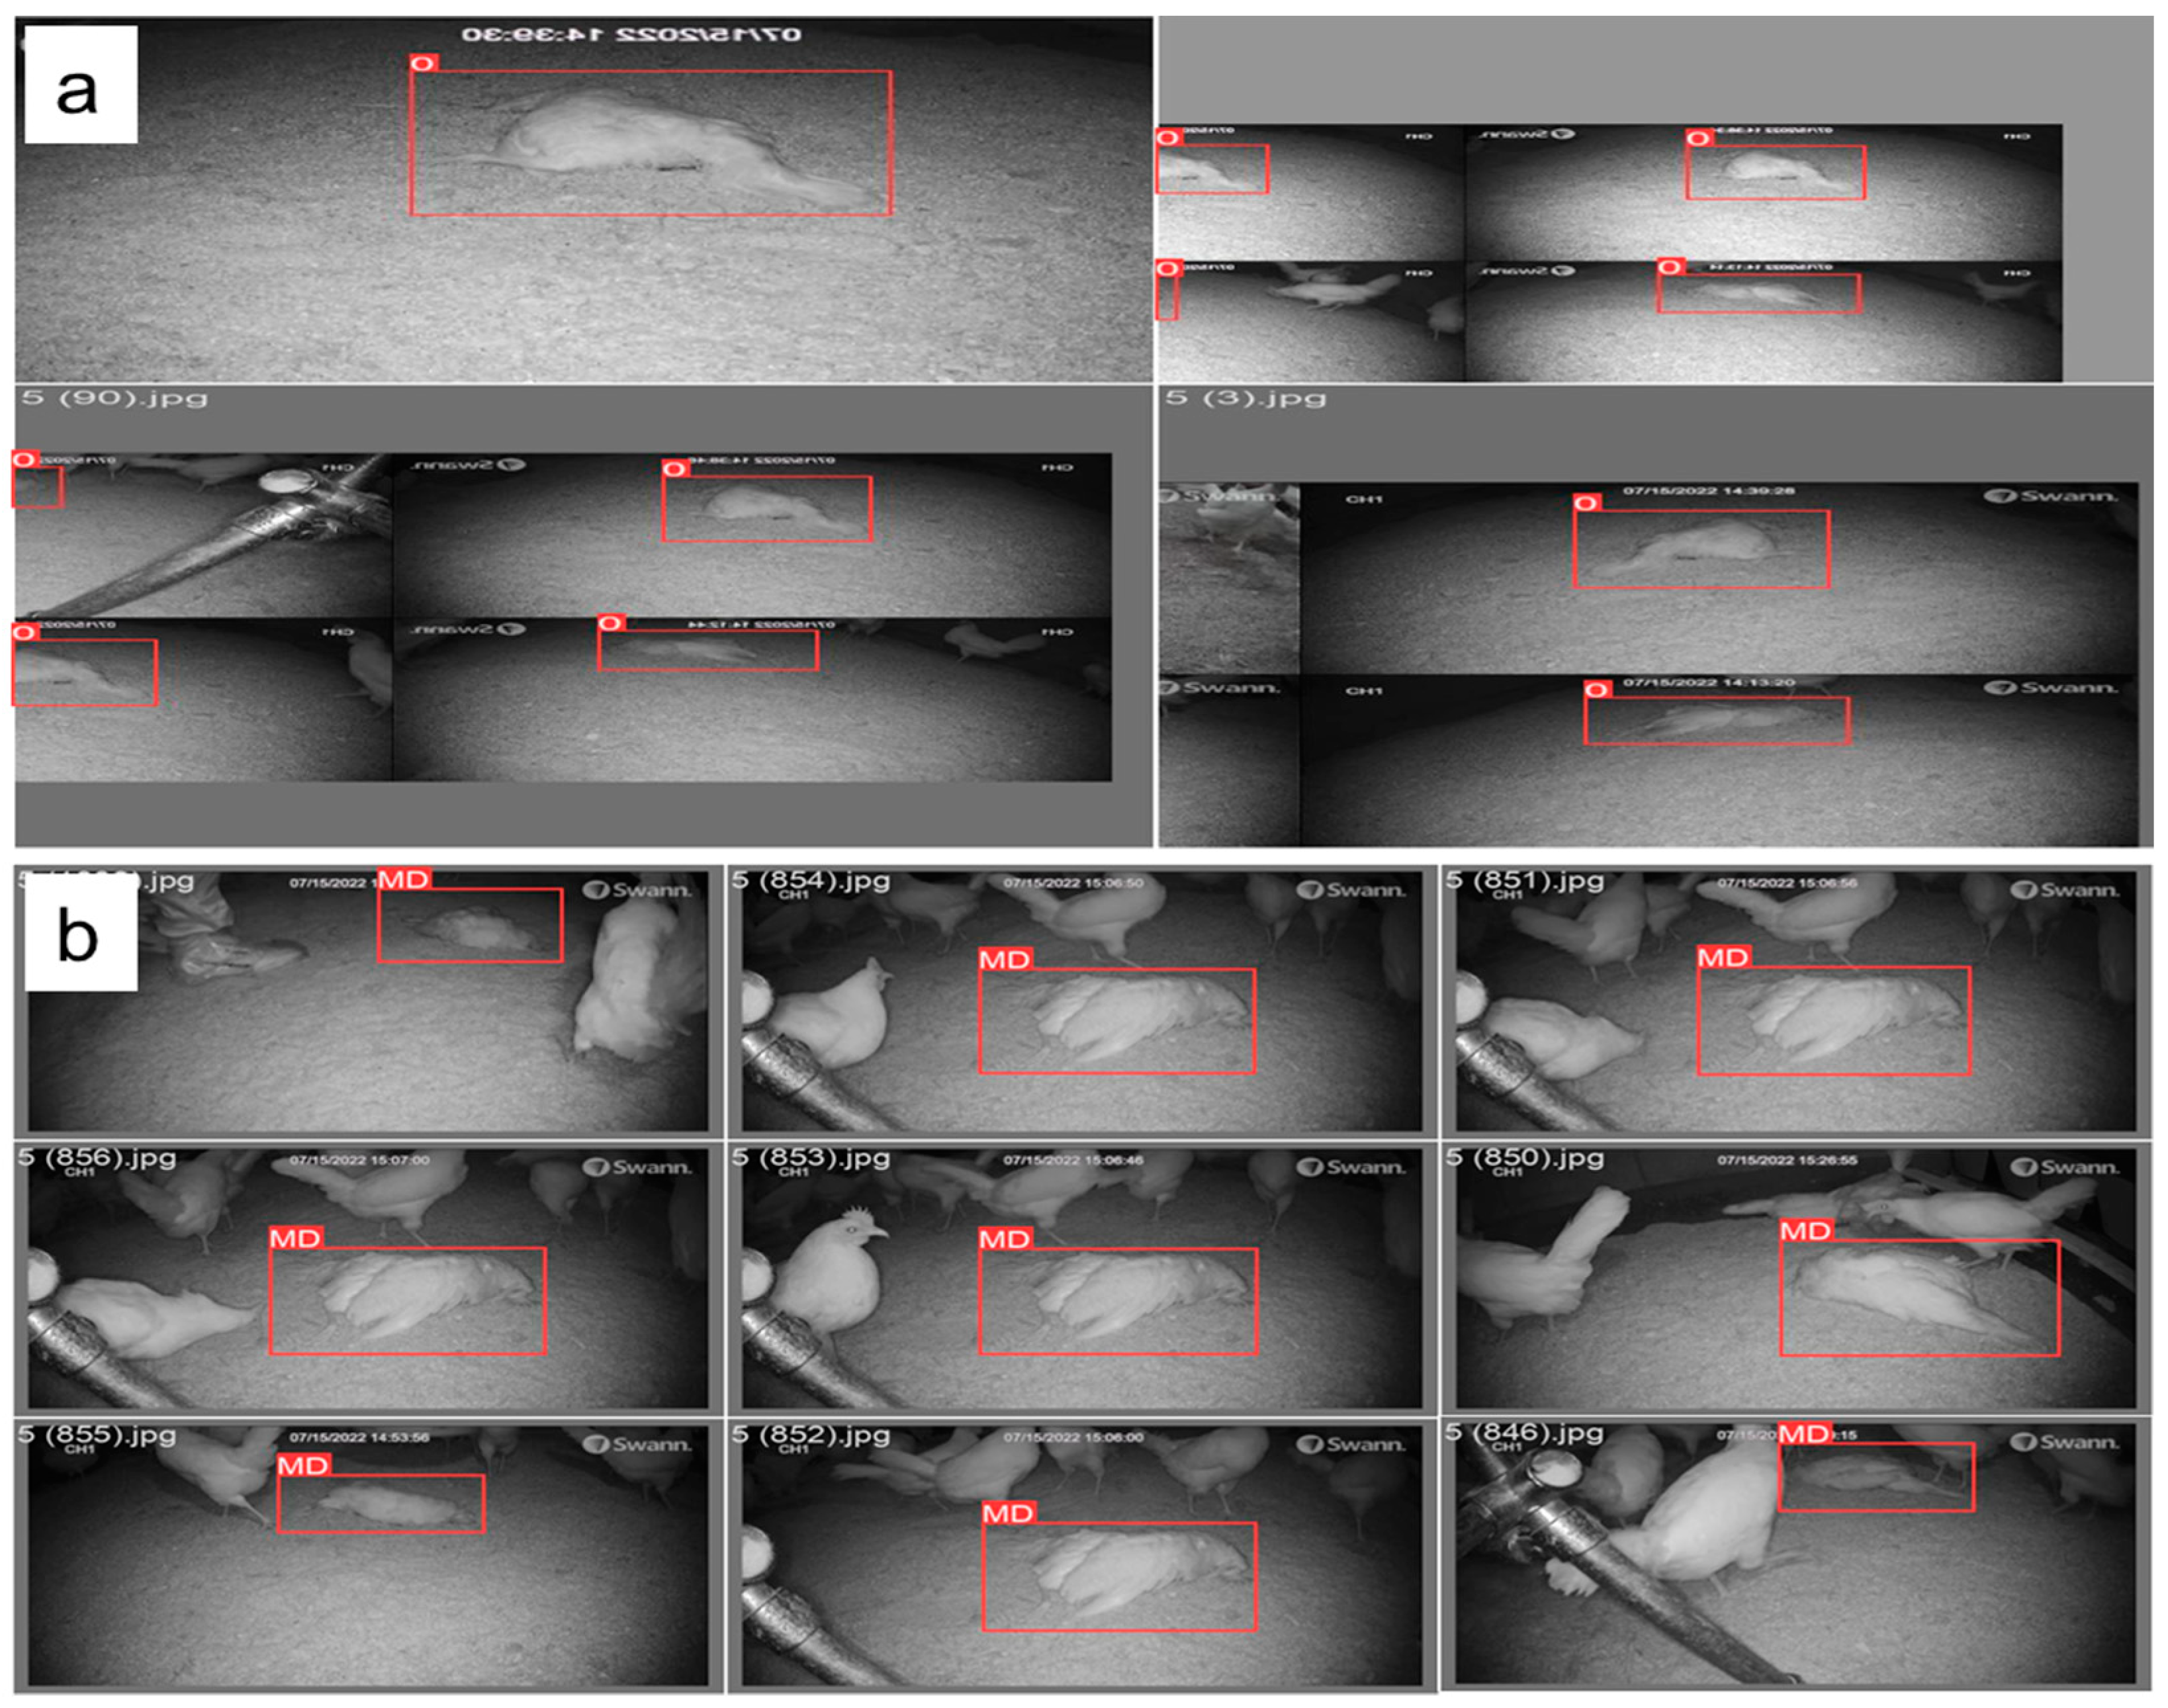
The video data collected in this study were processed by converting them into individual images in .jpg format using the Free Video to JPG Converter App (version 5.0). Subsequently, the obtained images were augmented to create a large image dataset. Techniques such as rotation, blurring, flipping, and cropping were employed in this study for image augmentation. These methods allowed the generation of additional variations of the collected images, increasing the diversity and size of the dataset for training, validating, and testing the detection models. The images were then labeled in YOLO format with the assistance of the image labeler website (Makesense.AI). This labeling process was essential in ensuring the images were correctly identified and classified for use in the deep learning model. Furthermore, the resulting labeled dataset was essential in developing and training the model for effective and accurate MD (
Figure 2). The labeled-image dataset consisting of 9000 images was divided into three sets for training, validation, and testing purposes, with approximately 70%, 20%, and 10% of the total images allocated to each set, respectively (
Table 2). The MD
Model image dataset was used to compare YOLOv5s, YOLOv5m, YOLOv5x, YOLOv6s, YOLOv6m, and YOLOv6l-relu models.
2.3. YOLO Architecture
Object detection has been an active area of research in computer vision. Among the popular algorithms in this domain, YOLO (You Only Look Once) algorithms have successfully detected objects such as hens with higher accuracy and in real time [
15,
16,
17,
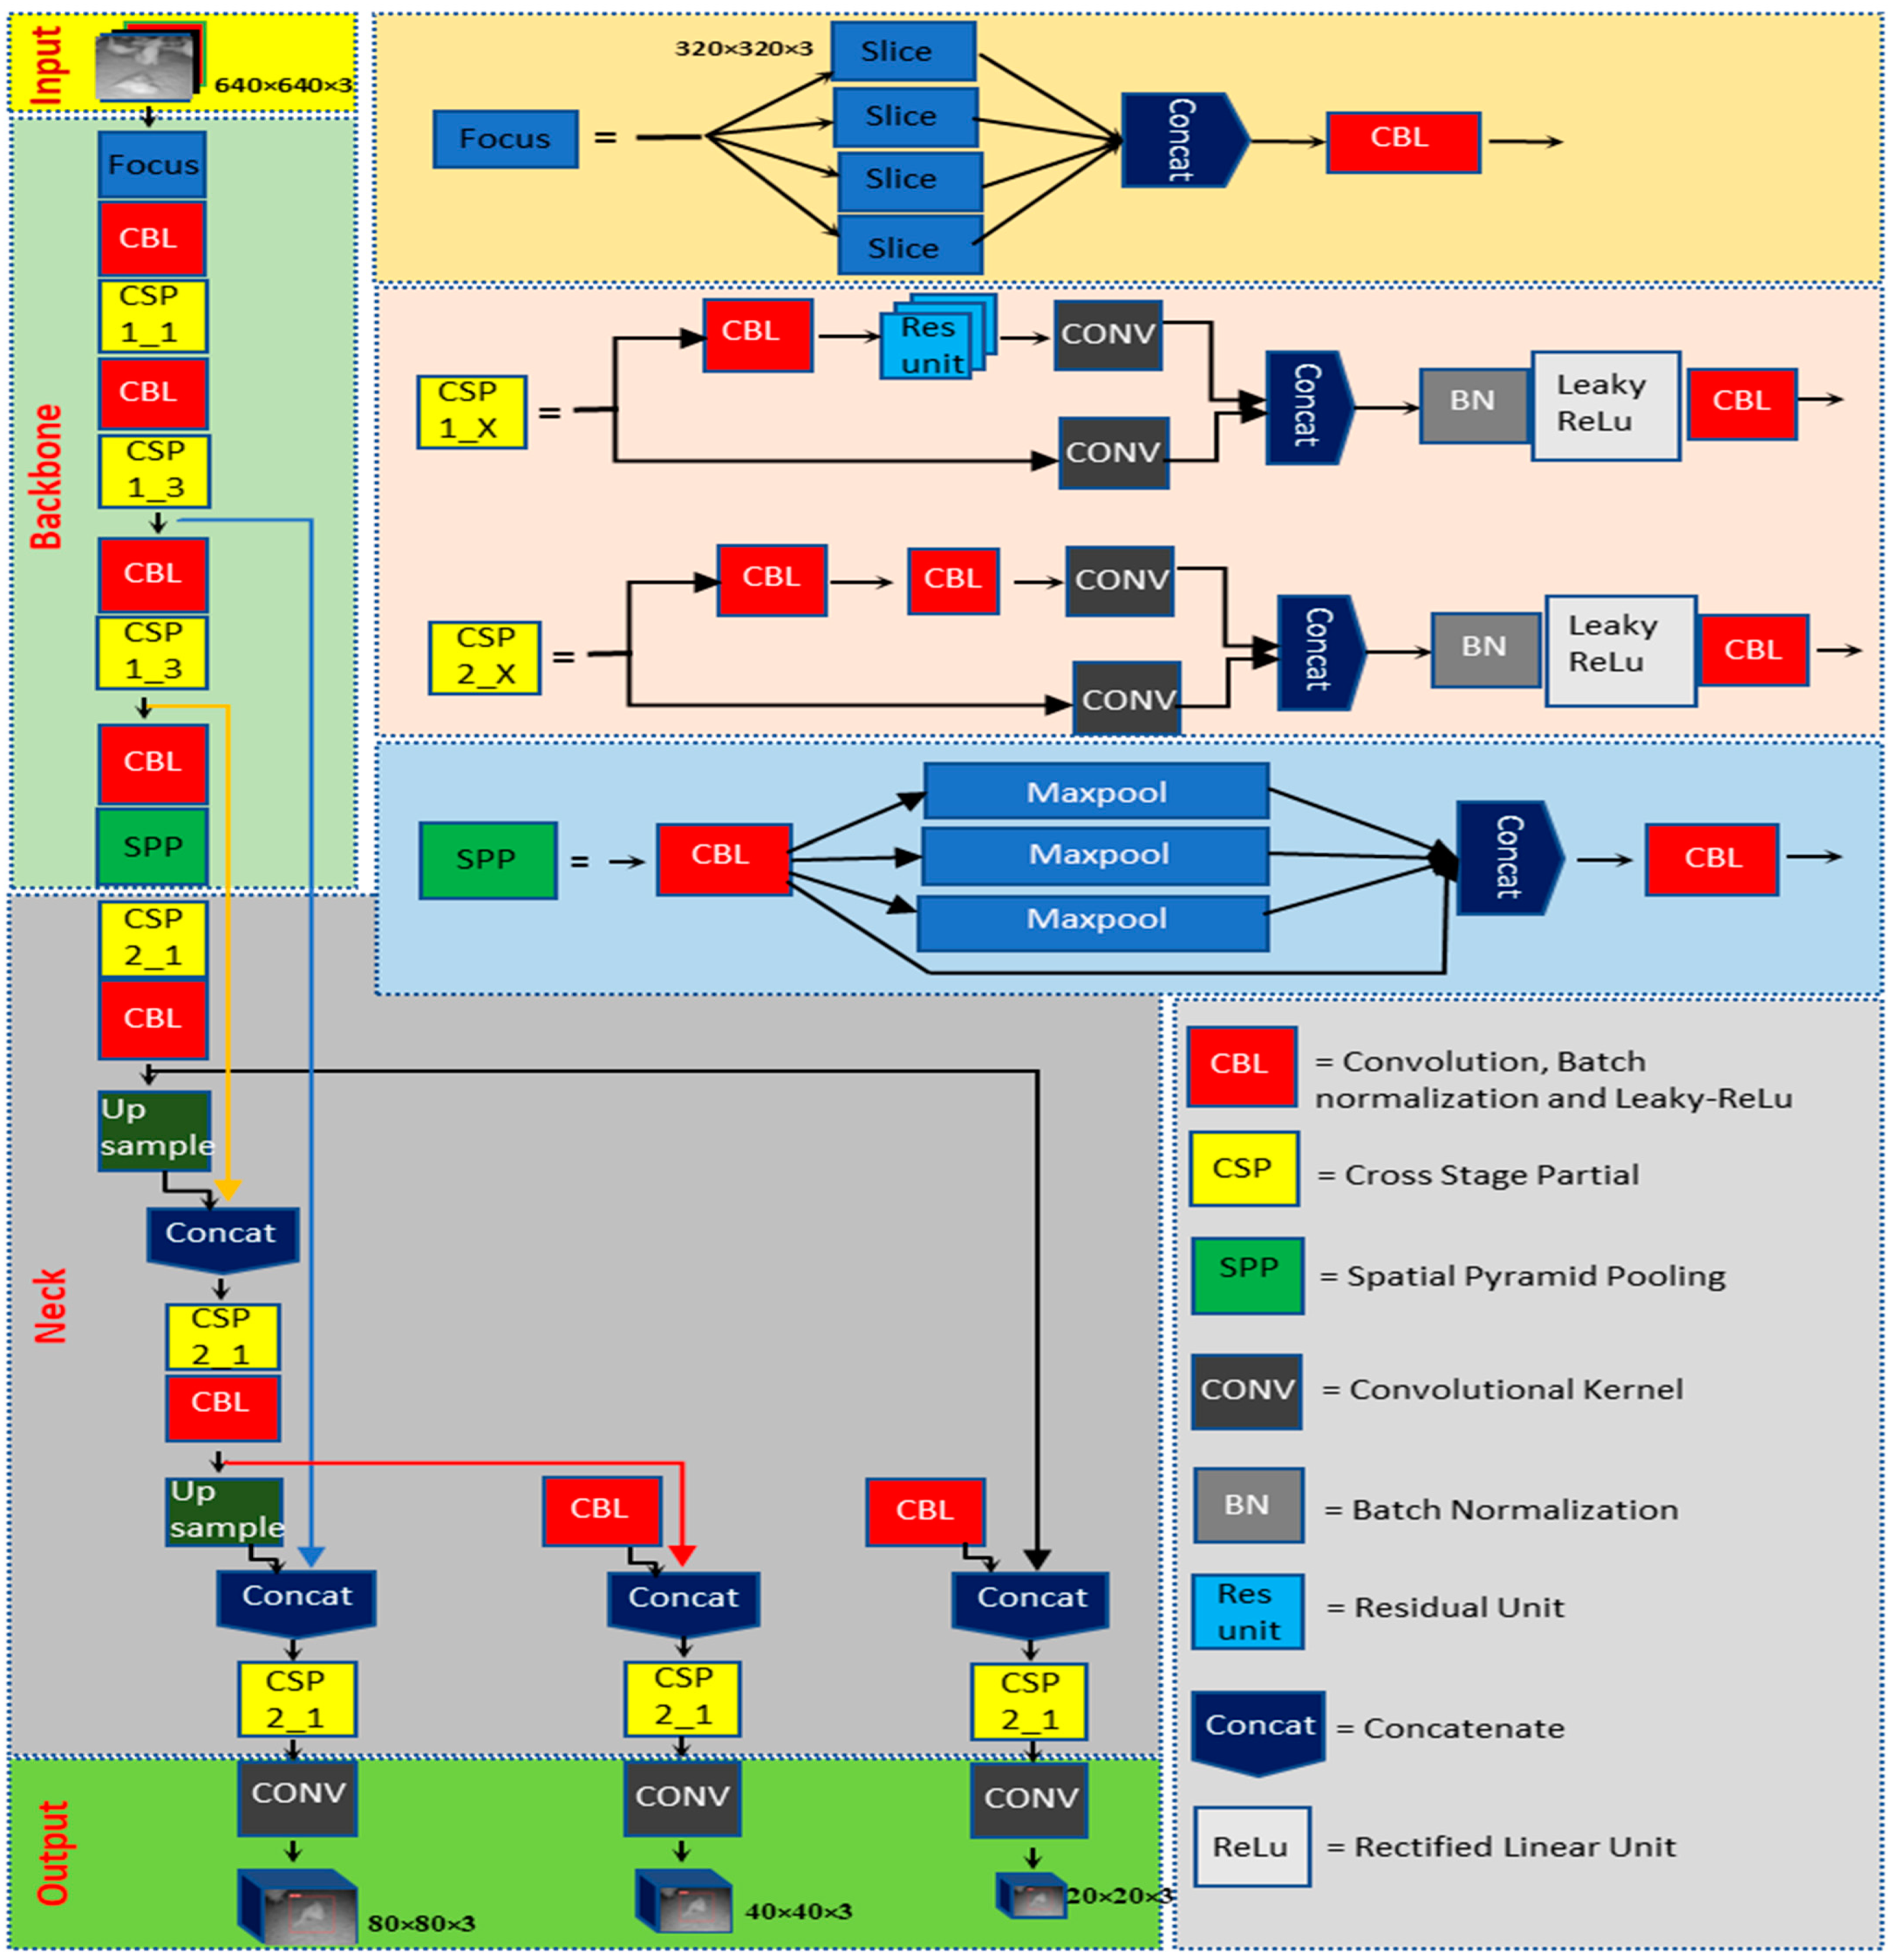
19]. YOLOv5 and YOLOv6 are two variants of the YOLO algorithm, each with its unique network architecture. In this study, the best YOLOv5-MD (YOLOv5s-MD, YOLOv5m-MD, and YOLOv5x-MD) and YOLOv6-MD (YOLOv6s-MD, YOLOv6m-MD, and YOLOv6l-relu-MD) models were used to compare. Both the YOLO-MD models’ architectures were mainly classified into three major parts: backbone, neck, and head. These YOLOv5-MD and YOLOv6-MD models differ in parameters within types. The detailed architecture of YOLOv5-MD and YOLOv6-MD used for this research is shown in
Figure 3 and
Figure 4, respectively.
2.3.1. Backbone
The main difference between YOLOv5-MD and YOLOv6-MD is the backbone network architecture. YOLOv5-MD uses a variant of the efficientNet architecture, while YOLOv6-MD uses a pre-trained CNN with an efficientRep backbone or CSP-Backbone for MD. EfficientNet is a family of neural networks designed for efficient and effective model scaling [
25]. YOLOv5-MD’s backbone uses convolutional layers at different scales to perform feature extraction from labeled MD image datasets with the help of Spatial pyramid pooling (SPP), which helps it achieve good performance on object-detection tasks while being lightweight and efficient [
26]. On the other hand, YOLOv6-MD’s backbone network is typically a pre-trained CNN with SPP and efficientRep architecture [
27]. SPP helps max-pooling layers reduce the feature map’s size while maintaining the most important features for MD. EfficientRep backbone is designed to both effectively use the computational resources of hardware such as GPUs and possess robust feature representation abilities compared to the CSP-Backbone utilized by YOLOv5 [
28]. In summary, YOLOv5-MD and YOLOv6-MD use different backbone network architectures for feature extraction, affecting their efficiency and performance on object-detection tasks.
2.3.2. Neck
The neck component is essential in YOLOv5-MD and YOLOv6-MD for connecting the backbone to the MD head. YOLO-MD versions employ convolutional layers in their necks, but their specific architectures differ. YOLOv5-MD’s neck utilizes a Feature Pyramid Network (FPN) that includes a top-down and bottom-up path, which captures multi-scale objects with high accuracy [
29]. In contrast, YOLOv6 features a more efficient neck design known as the Rep-PAN Neck [
30] that utilizes convolutional, pooling, and up-sampling layers to manipulate the backbone network’s features to the desired scale and resolution for the heads. This Rep-PAN Neck design is based on hardware-aware neural network architecture concepts that balance accuracy and speed while optimizing hardware resources [
31]. Therefore, YOLOv5-MD and YOLOv6-MD differ in their neck designs, with YOLOv5-MD using an FPN and YOLOv6-MD utilizing a more efficient Rep-PAN Neck design.
2.3.3. Head
The head component in YOLOv5-MD and YOLOv6-MD is responsible for the final stage of object detection by generating predictions from the extracted features. In YOLOv5-MD, the head comprises fully connected layers and a convolutional layer that predicts the detected mortality objects’ bounding boxes and class probabilities. In addition, it has three output layers: a detection layer that predicts object class probabilities, a localization layer that forecasts bounding box coordinates, and an anchoring layer that defines the prior box shapes and scales [
32]. The YOLOv5-MD head is designed to be resource-efficient, enabling real-time object detection across a range of devices. On the other hand, YOLOv6’s Decoupled Head design focuses on improving hardware utilization while maintaining high detection accuracy [
28]. Overall, YOLOv5-MD and YOLOv6-MD have different head structures, but they aim to generate accurate and efficient object detection predictions.
2.4. Performance Metrics
2.4.1. Precision
Precision measures how many MDs the system made were correct and is calculated by dividing the true positives (
TP) and the sum of
TP and false positives (
FP).
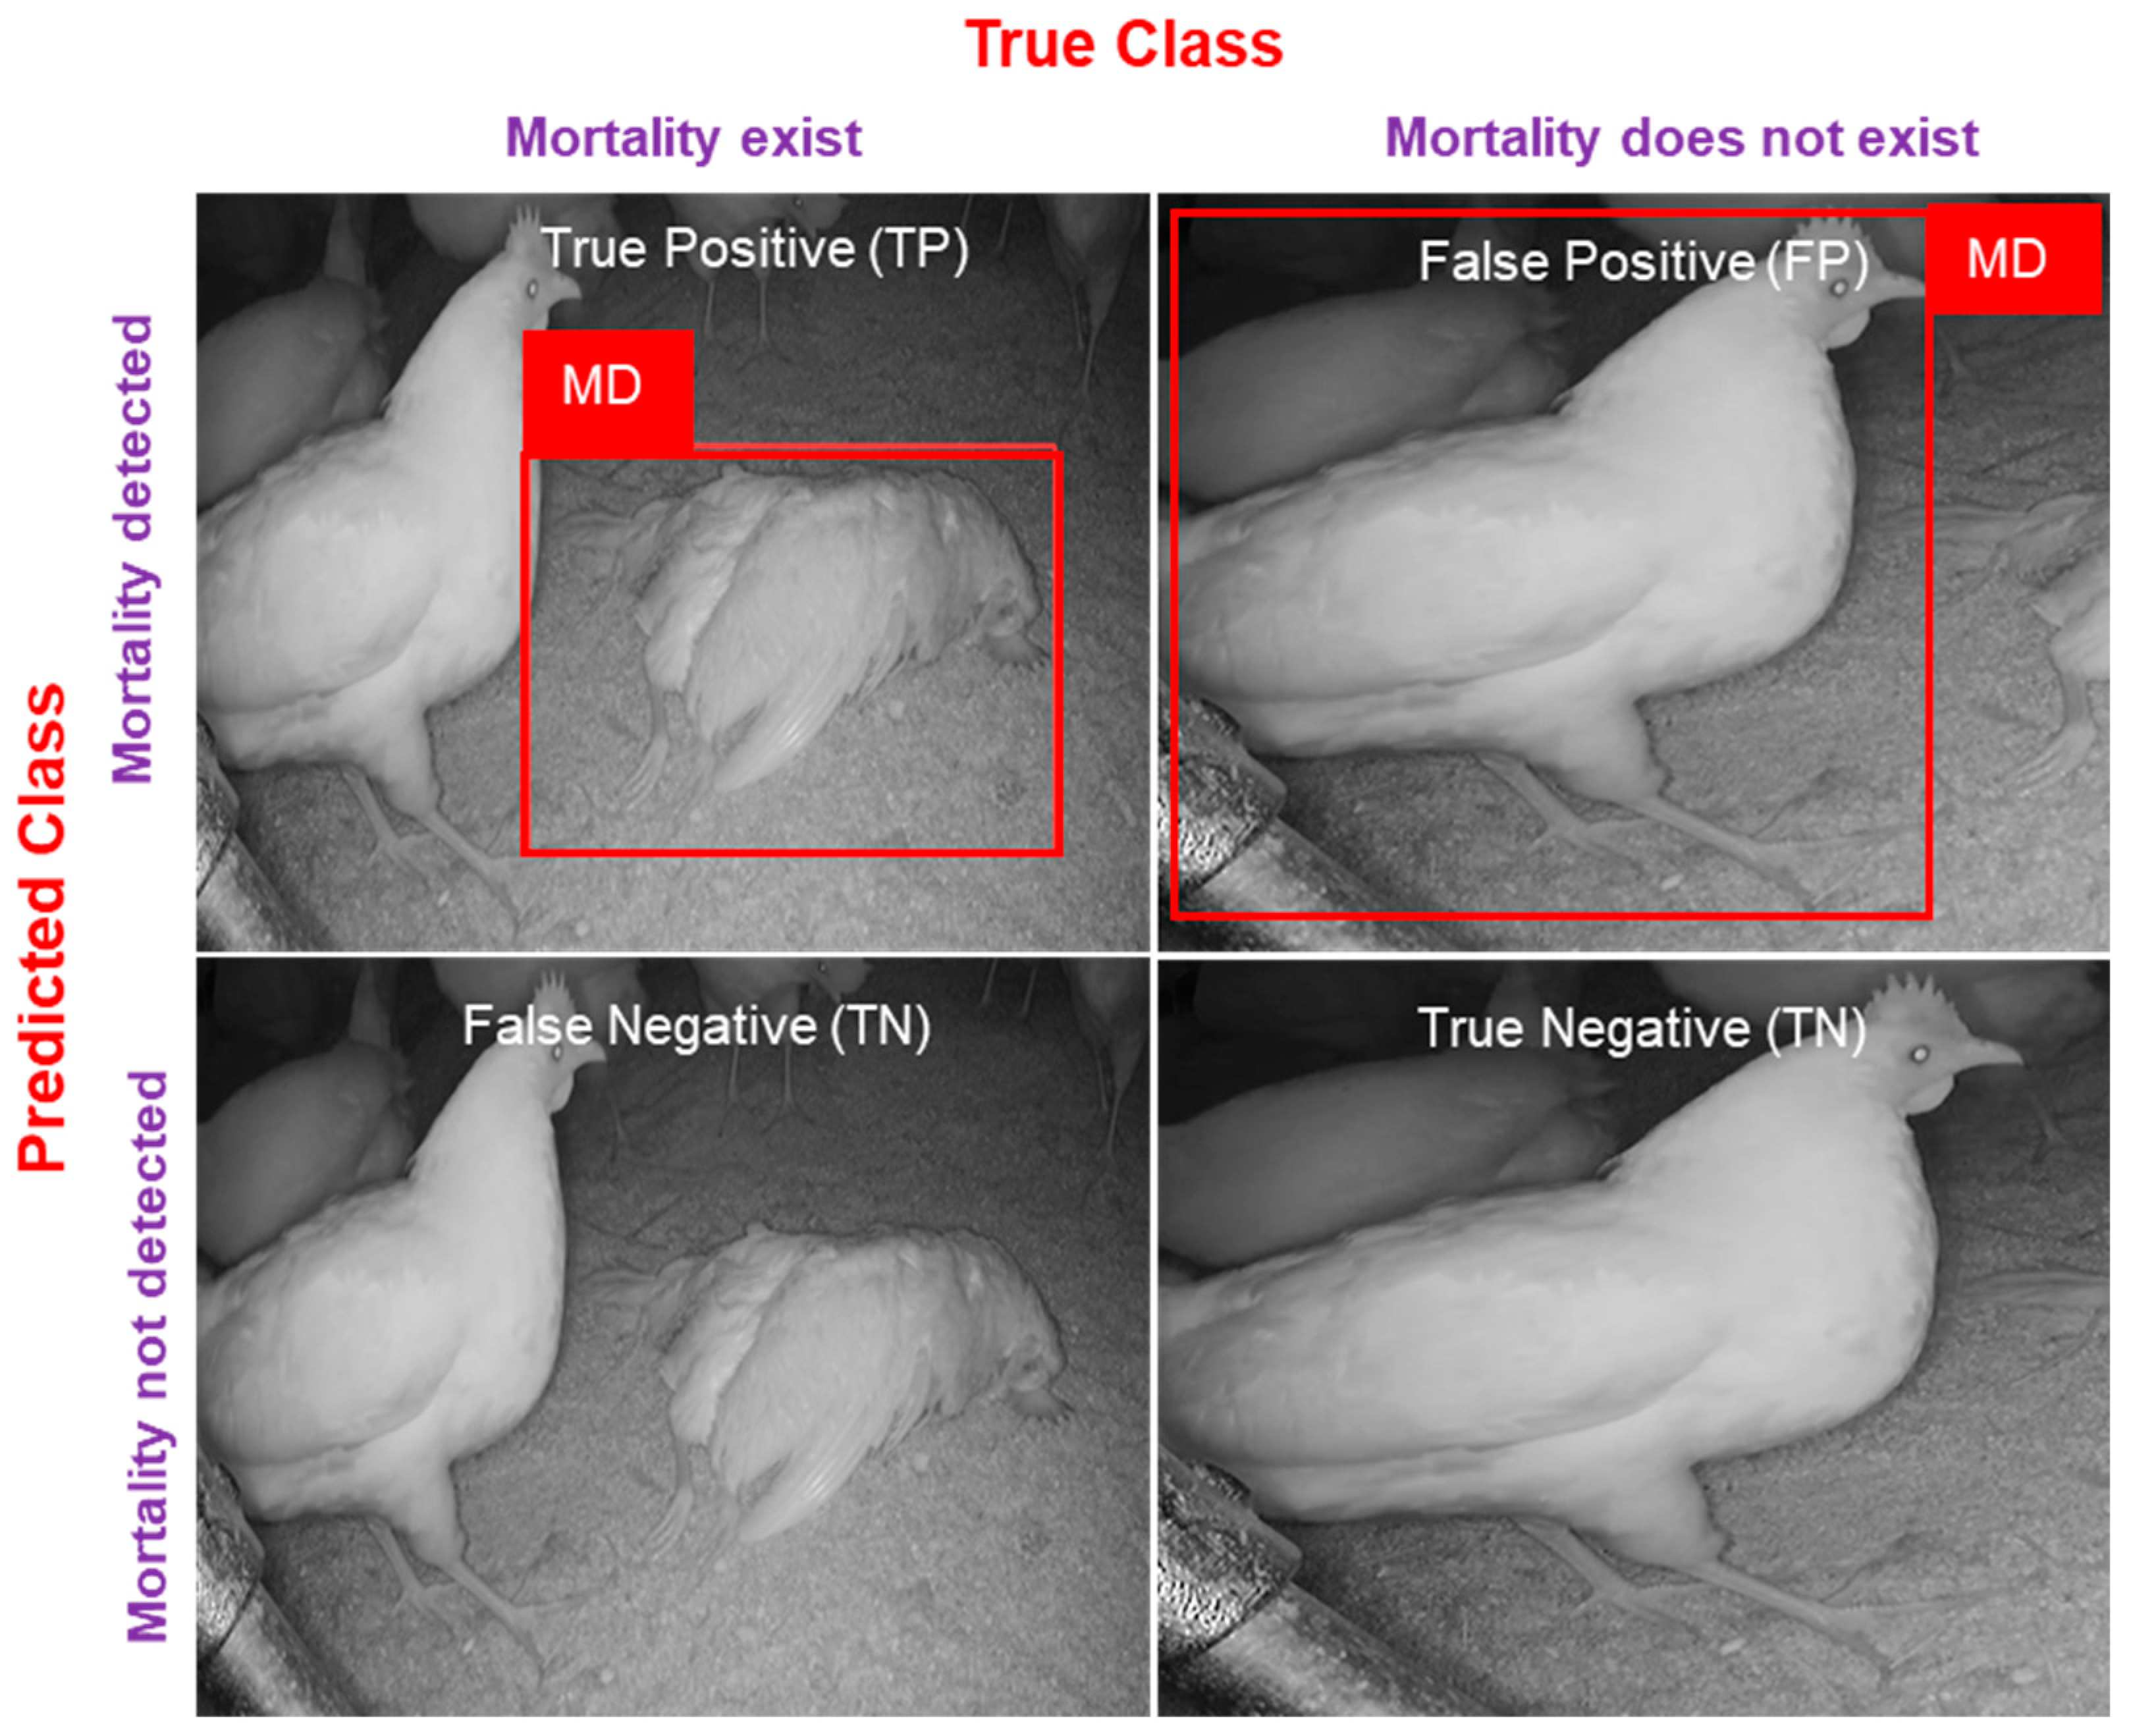
where
TP,
FP,
FN, and
TN represent true positives (mortality is present in the image, and the model predicts it correctly), false positives (mortality is not in the image, and the model detects it), and false negatives (mortality is present in the image but the model unable to detect it), and true negatives (mortality is not present in the image and not detected by the model). In detail, visualization for evaluation metrics is mentioned in
Figure 5.
2.4.2. Recall
Recall measures how many of the actual mortality hens in an image were correctly identified by the system. It is calculated as the ratio of
TP to the sum of
TP and false negatives (
FN):
2.4.3. Mean Average Precision
Mean Average Precision (
mAP) is a widely used metric in object-detection tasks that measures the system’s overall accuracy across multiple object classes [
33]. It is calculated based on the precision and recall values at a certain threshold or over a range of thresholds. The most common
mAP calculation is based on the area under the precision–recall curve and is calculated as follows:
where
APi is the average precision of the
ith category, and
C represents the total number of categories of
MD.
2.4.4. F1-Score
The F1-score is a harmonic mean of precision and recall and is a widely used metric in machine learning for evaluating the performance of binary classification models [
34]. It combines precision and recall metrics into a single value that indicates the balance between them. The formula for the F1-score is as follows:
In other words, the F1-score gives equal importance to precision and recall, with a higher score indicating better performance. For example, a perfect F1-score of 1.0 indicates that the model has both perfect precision and recall, while a score of 0 indicates that the model has either low precision or recall or both.
2.4.5. Loss Function
The YOLO-MD object-detection algorithm trains the model using a custom loss function called the “YOLO Loss” (
Figure 6). The YOLO-MD Loss combines several different loss terms that penalize the model for incorrect predictions and encourage it to make accurate predictions [
35]. For example, the YOLO-MD Loss consists of the following loss terms:
Objectness loss: This loss term encourages the model to correctly predict whether a mortality object is present in each grid cell. Objectness loss (λobj) is computed between the predicted and ground truth objectness scores by the binary cross-entropy loss [
36].
Classification loss: This loss term encourages the model to correctly classify the detected mortality objects into their respective classes. Classification loss (λcls) is computed as the cross-entropy loss between the predicted class probabilities and the ground truth class labels [
36].
Regression loss: This loss term penalizes the model for incorrect predictions of the bounding box coordinates and dimensions [
36]. Regression loss (λreg) is computed as the sum of the smooth L1 loss between the predicted and ground truth x and y coordinates, the smooth L1 loss between the predicted and ground truth width and height, and the focal loss between the predicted and ground truth confidence scores [
29]. The YOLO-MD Loss is computed as the weighted sum of the mortality objectness loss, classification loss, and regression loss. In general, the importance of each term in the loss function is determined by the user, who sets the corresponding weights accordingly. The YOLO Loss is minimized during the training process using backpropagation and gradient descent, with the goal of reducing the overall prediction error of the model [
37].
2.5. Computational Parameters
A high-performance computational configuration was utilized to detect mortality. This study employed various configurations on the Oracle cloud to train, validate, and test the image datasets. It has been observed that a higher number of computational parameters can enhance the model’s speed and detection accuracy. The system configuration comprises a 64-core OCPU for CPU processing and four NVIDIA®A10 GPUs, each with 24 GB of memory, for GPU acceleration. The operating system employed is Ubuntu 22.10 (Kinetic Kudu), and the accelerated environment is NVIDIA CUDA. The system has ample storage capacity with 1024 GB of memory and two 7.68 TB NVMe SSD drives. Torch 1.7.0, Torch-vision 0.8.1, OpenCV-python 4.1.1, and NumPy 1.18.5 were the libraries utilized in the system. Together, these components create a high-performance system capable of efficiently running deep learning models for various applications, including MD. In addition, the YOLO model underwent 100 epochs of training with a batch size of 16.
4. Conclusions
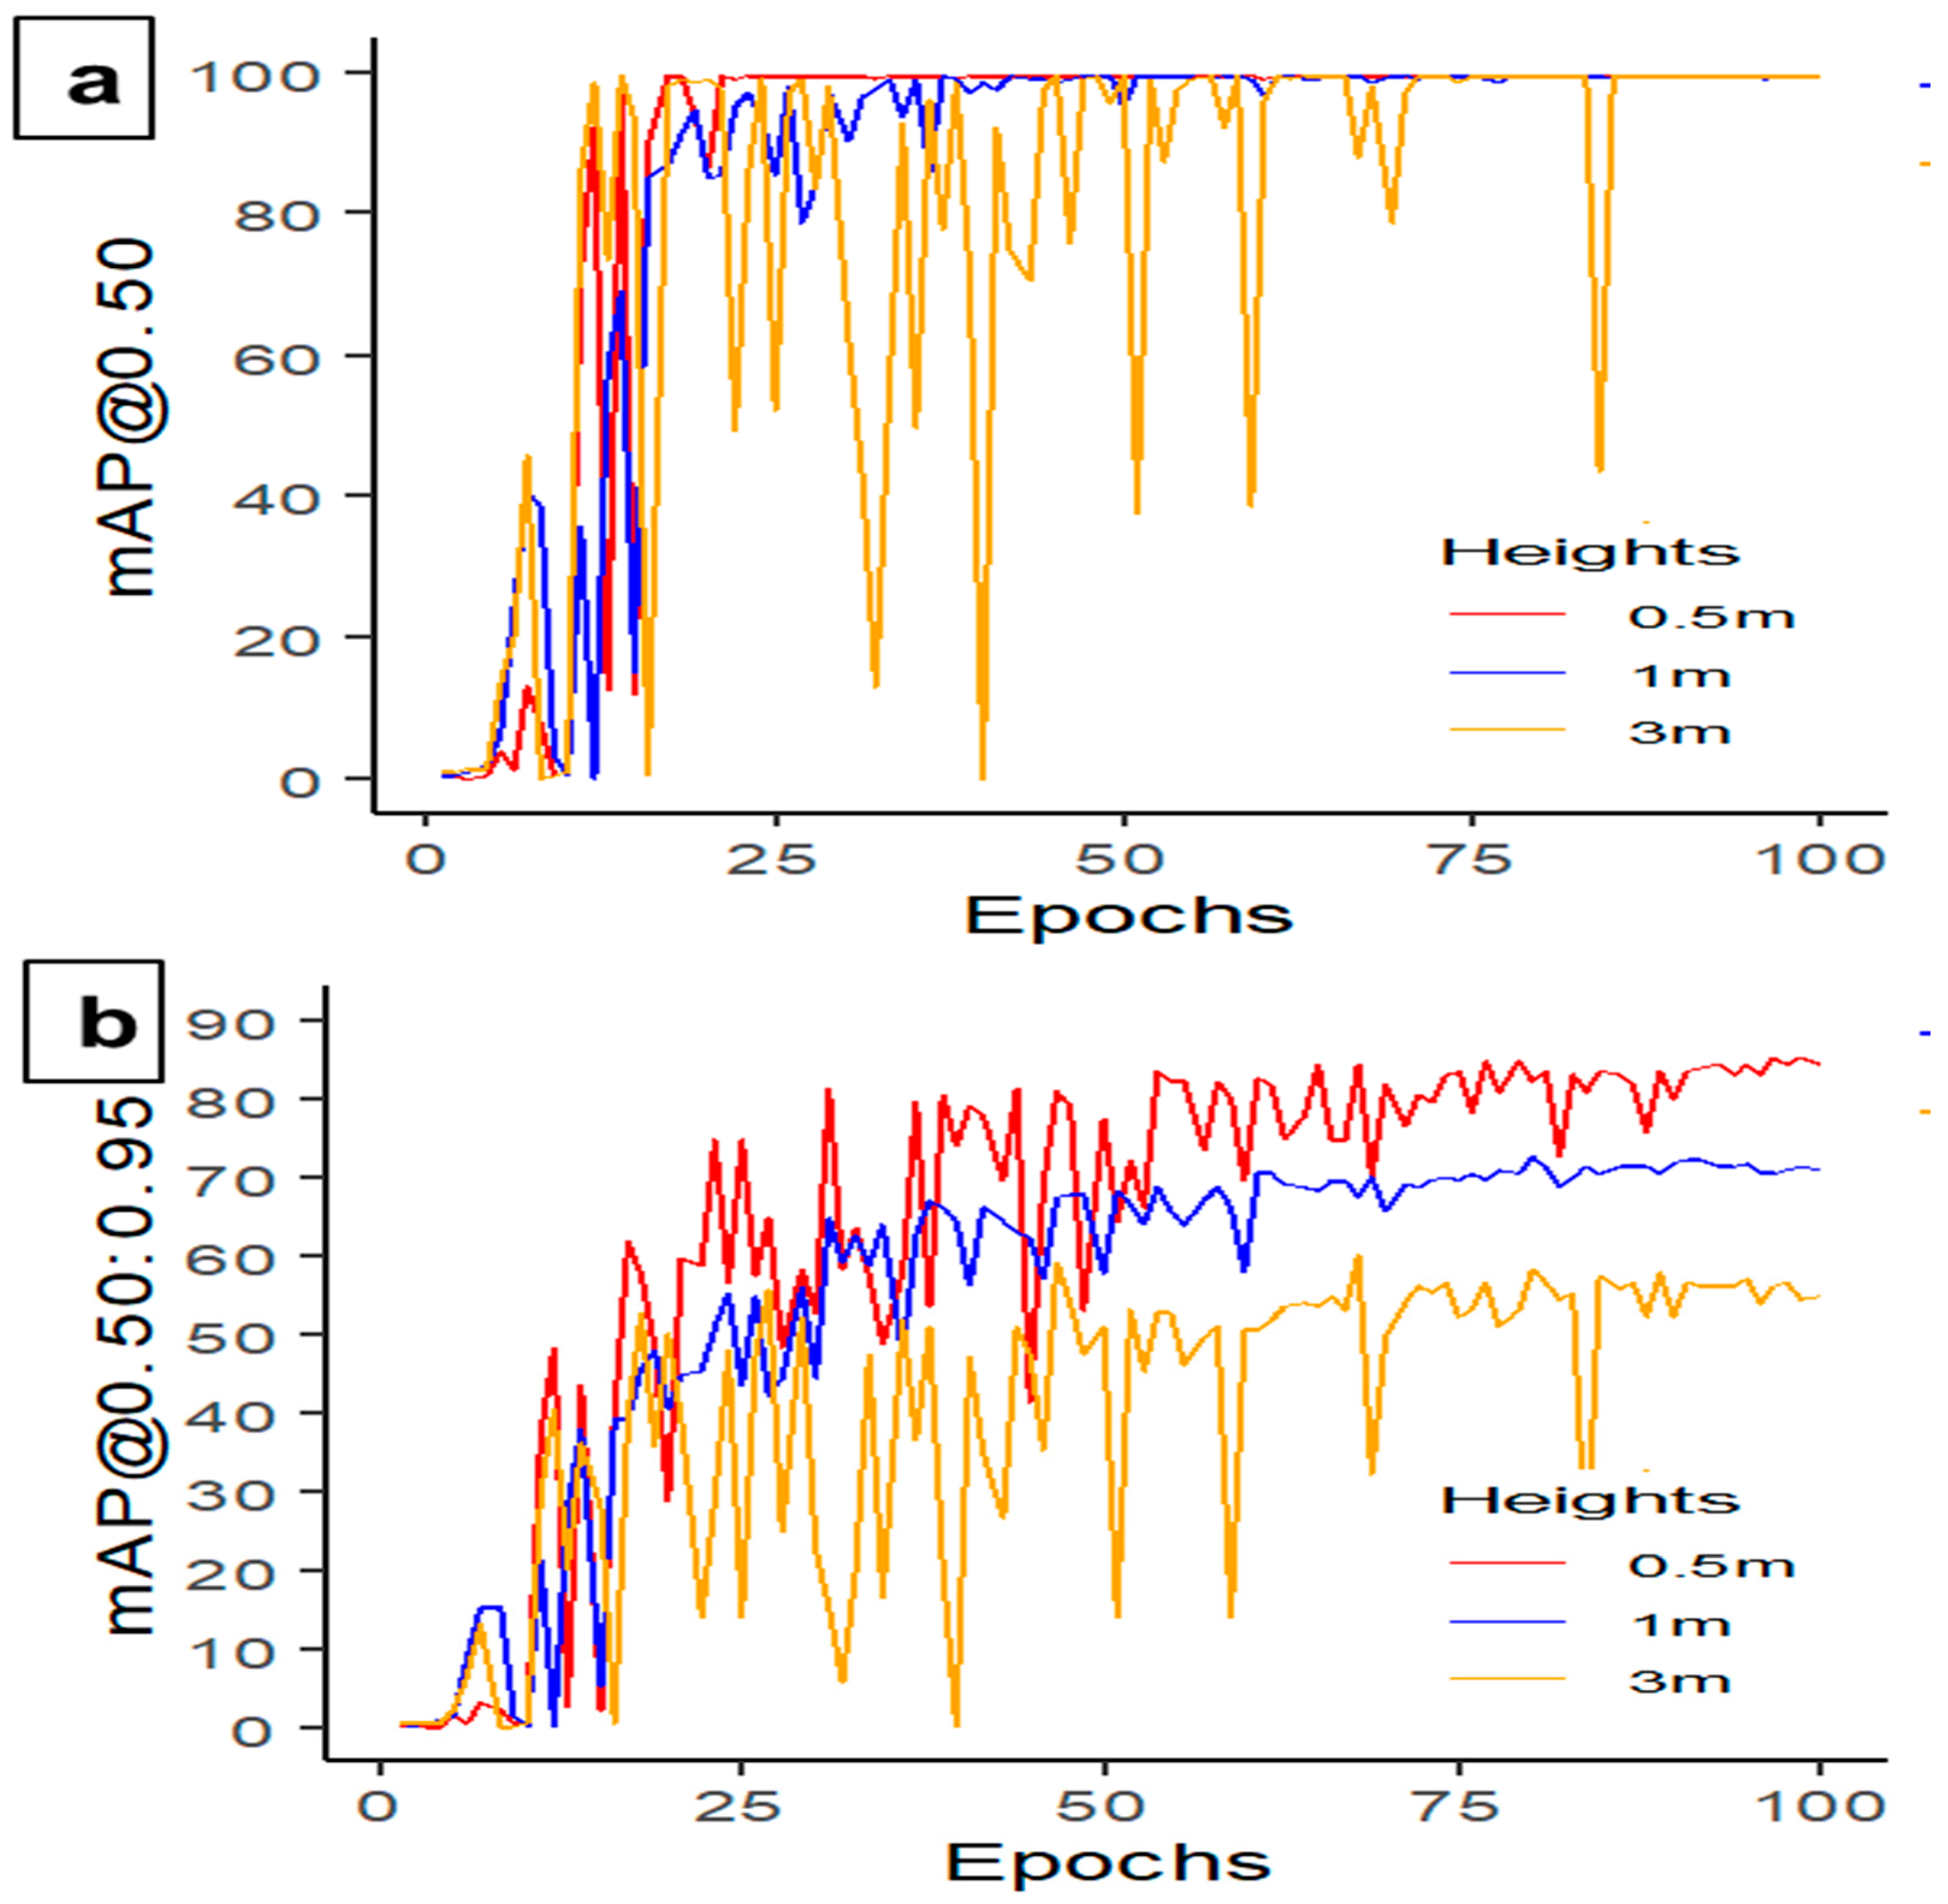
This study developed and tested different YOLO deep learning models and identified that YOLOv5s-MD had higher accuracy, faster processing time, and lower GPU usage compared to other models. Additionally, this study revealed that feathering percentage and litter coverage impacted the model’s performance, with 0% feather covering achieving the highest mAP@0.50 and 80% litter covering reaching the highest precision, recall, and mAP. Furthermore, the model’s performance varied with camera height from the target object, with the best precision, recall, and mAP achieved at 0.5 m.
The main achievement of this study is establishing a foundation for developing a mortality scanning system specifically designed for commercial CF houses. The YOLOv5s-MD model, developed and validated in this research, shows promise for accurately detecting and monitoring mortalities within the CF housing system. In the future, the focus will be on implementing the YOLOv5s-MD model in a robot or utilizing a movable camera device capable of navigating commercial CF housing systems. This implementation will enable real-time testing and evaluation of the model’s performance in practical scenarios. Additionally, as necessary, the model will undergo further refinement and improvement to enhance its accuracy and reliability. This study aims to successfully integrate the YOLOv5s-MD model into a functional mortality scanning system for commercial CF houses through these future investigations. This contribution will lead to improved monitoring and management of mortalities, ultimately enhancing welfare and productivity in the poultry industry.


