Article

Makeup Water Addition Can Affect the Growth of Scenedesmus dimorphus in Photobioreactors

1
Agricultural and Biosystems Engineering, South Dakota State University, Brookings, SD 57007, USA
2
Institute of Environmental Sciences and Engineering, National University of Sciences and Technology, Islamabad 44000, Pakistan
3
Biosystems Engineering, Faculty of Agriculture, Bursa Uludag University, Gorukle 16240, Bursa, Turkey
4
Biology and Microbiology, South Dakota State University, Brookings, SD 57007, USA
5
Civil and Environmental Engineering, South Dakota State University, Brookings, SD 57007, USA
*
Author to whom correspondence should be addressed.
AgriEngineering 2023, 5(2), 982-991; https://doi.org/10.3390/agriengineering5020061
Submission received: 15 March 2023 / Revised: 11 May 2023 / Accepted: 29 May 2023 / Published: 1 June 2023

Abstract

:
Makeup water constitutes a key component in the water management of microalgal cultivation systems. However, the effect of makeup water addition on microalgal growth remains largely unexplored. This study compared two deionized water addition intervals (1 day and 4 days) for their effect on the growth of Scenedesmus dimorphus (S. dimorphus hereafter) in 2000 mL Pyrex bottles under controlled conditions. Cell counts and dry algal biomass (DAB) were measured to characterize the microalgal growth rate. Water addition intervals impacted algal cell counts but had little effect on DAB. Adding makeup water every day resulted in a higher growth rate (8.80 ± 1.46 × 10⁵ cells mL−1 day−1; p = 0.22, though) and an earlier occurrence of the peak cell count (day 9) than adding it every 4 days (6.95 ± 1.68 × 10⁵ cells mL−1 day−1 and day 12, respectively). It is speculated that water loss over an extended period and the following makeup water addition posed stress on S. dimorphus. Surpassing the peak cell count, S. dimorphus continued to grow in DAB, resulting in an increased cell weight as a response to nutrient starvation. Optical density at 670 nm (OD670) was also measured. Its correlation with DAB was found to be affected by water addition intervals (R2 = 0.955 for 1 day and 0.794 for 4 days), possibly due to a water loss-induced change in chlorophyll a content. This study is expected to facilitate the makeup water management of photobioreactor and open pond cultivation systems.

1. Introduction

The cultivation of microalgae as a renewable resource continues to receive intensive attention due to their fast growth, superior photosynthetic efficiency, low nutrient requirements, etc. [1,2]. Microalgae have also been utilized for cleaning up contaminated water [3] and air [4], recovering precious or rare earth metals [5], and capturing CO2 from the atmosphere or flue gas [6]. Water management is critical for microalgal cultivation—producing 1 kg of dry microalgal biomass requires approximately 5–10 kg of water [7]. Meanwhile, water is an invaluable resource, and water conservation represents an increasing challenge [8]. For water management, factors—including the volume of water needed for algal cultivation, water loss, and makeup water (i.e., water added to restore a desired volume or level)—must be properly assessed and controlled. These factors are further related to target biomass productivity, cultivation system design, cultivation conditions, etc. Numerous efforts have been made to examine the water footprint of microalgal production systems, through experiments [9] and modeling [10,11]. Despite the importance of makeup water in overall water balance, the effect of makeup water on microalgal growth is largely unexplored.
Makeup water compensates for water loss from cultivation systems, and various processes can lead to substantial water loss. For photobioreactors (PBRs), the factors affecting water loss include aeration, water circulation, temperature, relative humidity, light intensity, and a PRB’s surface area-to-volume ratio. Many of the factors are related to evaporation, a primary cause of water loss from a PBR [7]. For open ponds (e.g., raceways), the additional factors affecting water loss include wind, mixing, solar radiation, and leakage [12]. However, for cultivating microalgae in PBRs, many researchers assume evaporation water loss to be negligible and present their data without any correction [13]. For open ponds, water loss is usually more pronounced, and an evaporation rate can be estimated through modeling [11,14] or a simple pan evaporation method [7]. To estimate the volume of makeup water required for open pond systems, precipitation must be considered, and it is highly variable with time and location. Precipitation (e.g., rainfall and snowfall) contains mostly pure water relative to a cultivation medium. Thus, evaporation loss and precipitation (plus makeup water addition) will result in a fluctuation in parameters such as pH, salinity, nutrients, and microalgal concentrations in a pond. It remains poorly understood if and to what degree such water loss-gain cycles affect microalgal cultivation.
To fill the knowledge gap, S. dimorphus was cultivated under lab conditions simulating the water loss-gain cycles in open ponds or PBRs. The hypothesis was that the time interval for makeup water addition would affect microalgal growth. It is noteworthy that the time interval is generally proportional to the amount of water loss and, accordingly, the amplitude of parameter fluctuations. The specific research objectives were to (1) cultivate S. dimorphus in a medium for an extended period to make it well adapted to the medium as well as lighting, mixing, etc., and maintain stable growth; (2) compare S. dimorphus growth rates in cell counts and dry algal biomass between different water addition time intervals; and (3) examine the optical density (OD) of the microalgal culture during the experiments and its correlation with S. dimorphus concentrations. Deionized water was selected as the makeup water due to its similar composition to precipitations. In reality, frequently refilling a PBR or open pond with nutrient-rich cultivation media is difficult to manage. A realistic way to maintain water levels is adding tap or other relatively pure water, in combination with less frequent addition of cultivation media.

2. Materials and Methods

2.1. Algal Strain

The S. dimorphus strain UTEX 1237 was obtained from the UTEX Culture Collection of Algae at the University of Texas at Austin (Austin, TX, USA). The strain was selected due to its adaption to a wide pH range, efficient ammonia removal, and high growth rate [15,16]. It has been researched in Dr. Anderson’s (note: a co-author) lab for years, with extensive experience gained concerning its cultivation, maintenance, and troubleshooting. It was cultured and maintained in four PBRs for six months before the makeup water experiments started. A Bold’s Basal Medium (BBM)—widely used for freshwater green algae [17]—was selected for algal cultivation. The composition of the medium can be found in Ref. [4]. The prepared BBM was adjusted for pH (to 6.4 ± 0.5) and was autoclaved for 40 min at 121 °C before use. The cultivation started from a 100 mL algal culture in a 500 mL glass flask. With the growth of S. dimorphus, the culture was doubled every 7 days with a freshly prepared BBM (at a 1:1 dilution ratio). The time interval of doubling was selected to be consistent with a previous study by the authors [4]. Cell count and OD were monitored during the doubling process, but they were not used for determining the time interval of doubling. During cultivation, the culture was continuously aerated with air at an airflow rate of 0.5 LPM per liter of culture. Fluorescent lamps were placed near the vessels to offer a light intensity of 60–70 µmol m−2 s−2. All glassware was autoclaved before use.

2.2. Algal Cultivation with Makeup Water and Growth Medium

An algal culture (1200 mL) was evenly distributed into three 2000 mL Pyrex bottles. Autoclaved BBM (1600 mL) was then added to each bottle. The 2000 mL algal culture in each bottle was continuously aerated at an airflow rate of 1 LPM. The same light source (fluorescent lamps) and intensity (60–70 µmol m−2 s−2) were applied. Aeration and water evaporation led to a loss of water in the bottles. The initial water level in each bottle was marked using a permanent marker after the 2000 mL algal culture was transferred in, and the water loss was determined as the volume of makeup water added to restore the marked level. The makeup water was added using 25 and 10 mL graduate pipettes so that the volume of the water could be quantitated. To study the effect of water makeup, two separate batches of experiments were conducted:
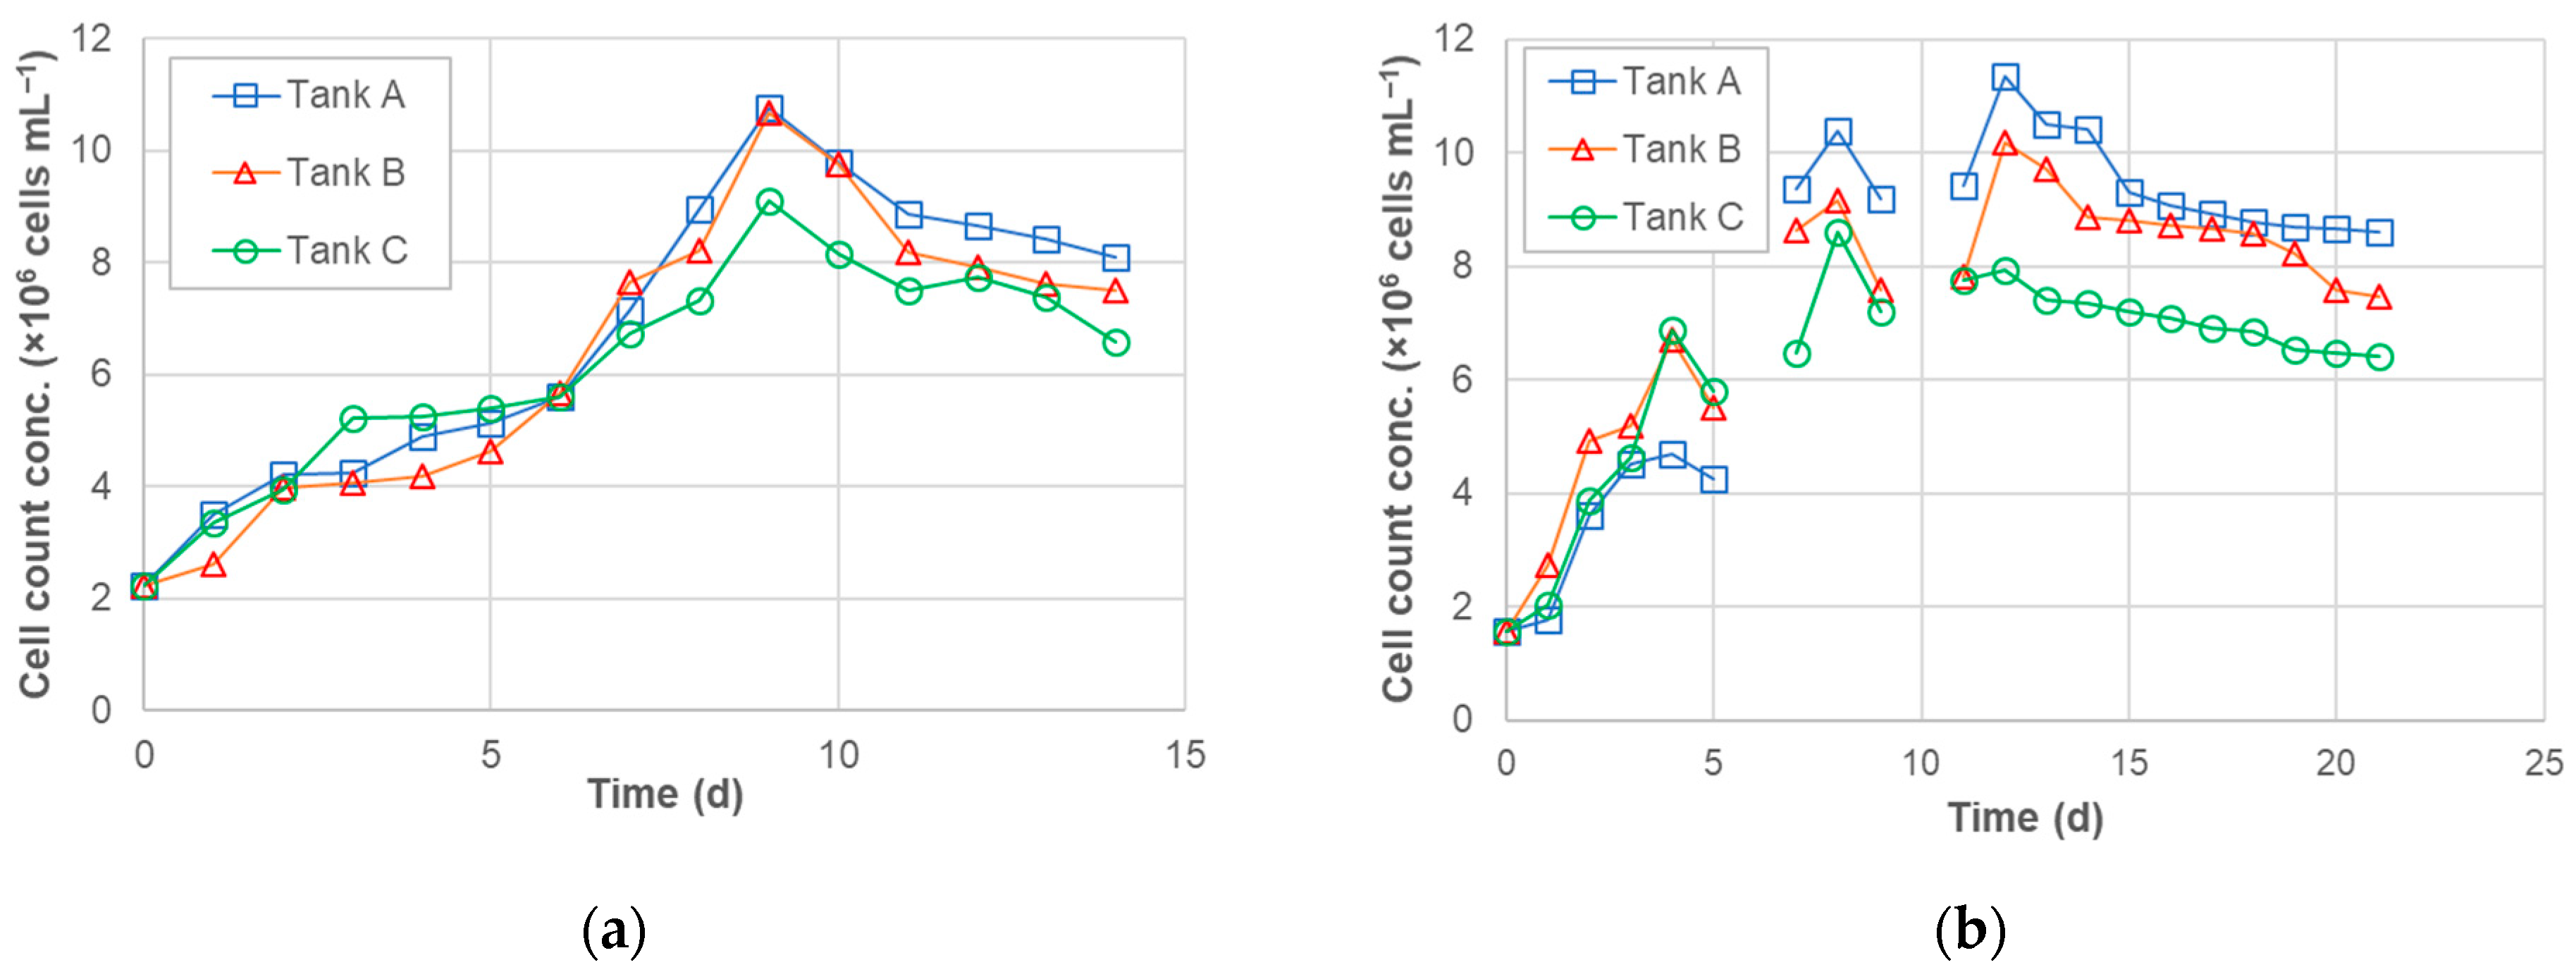
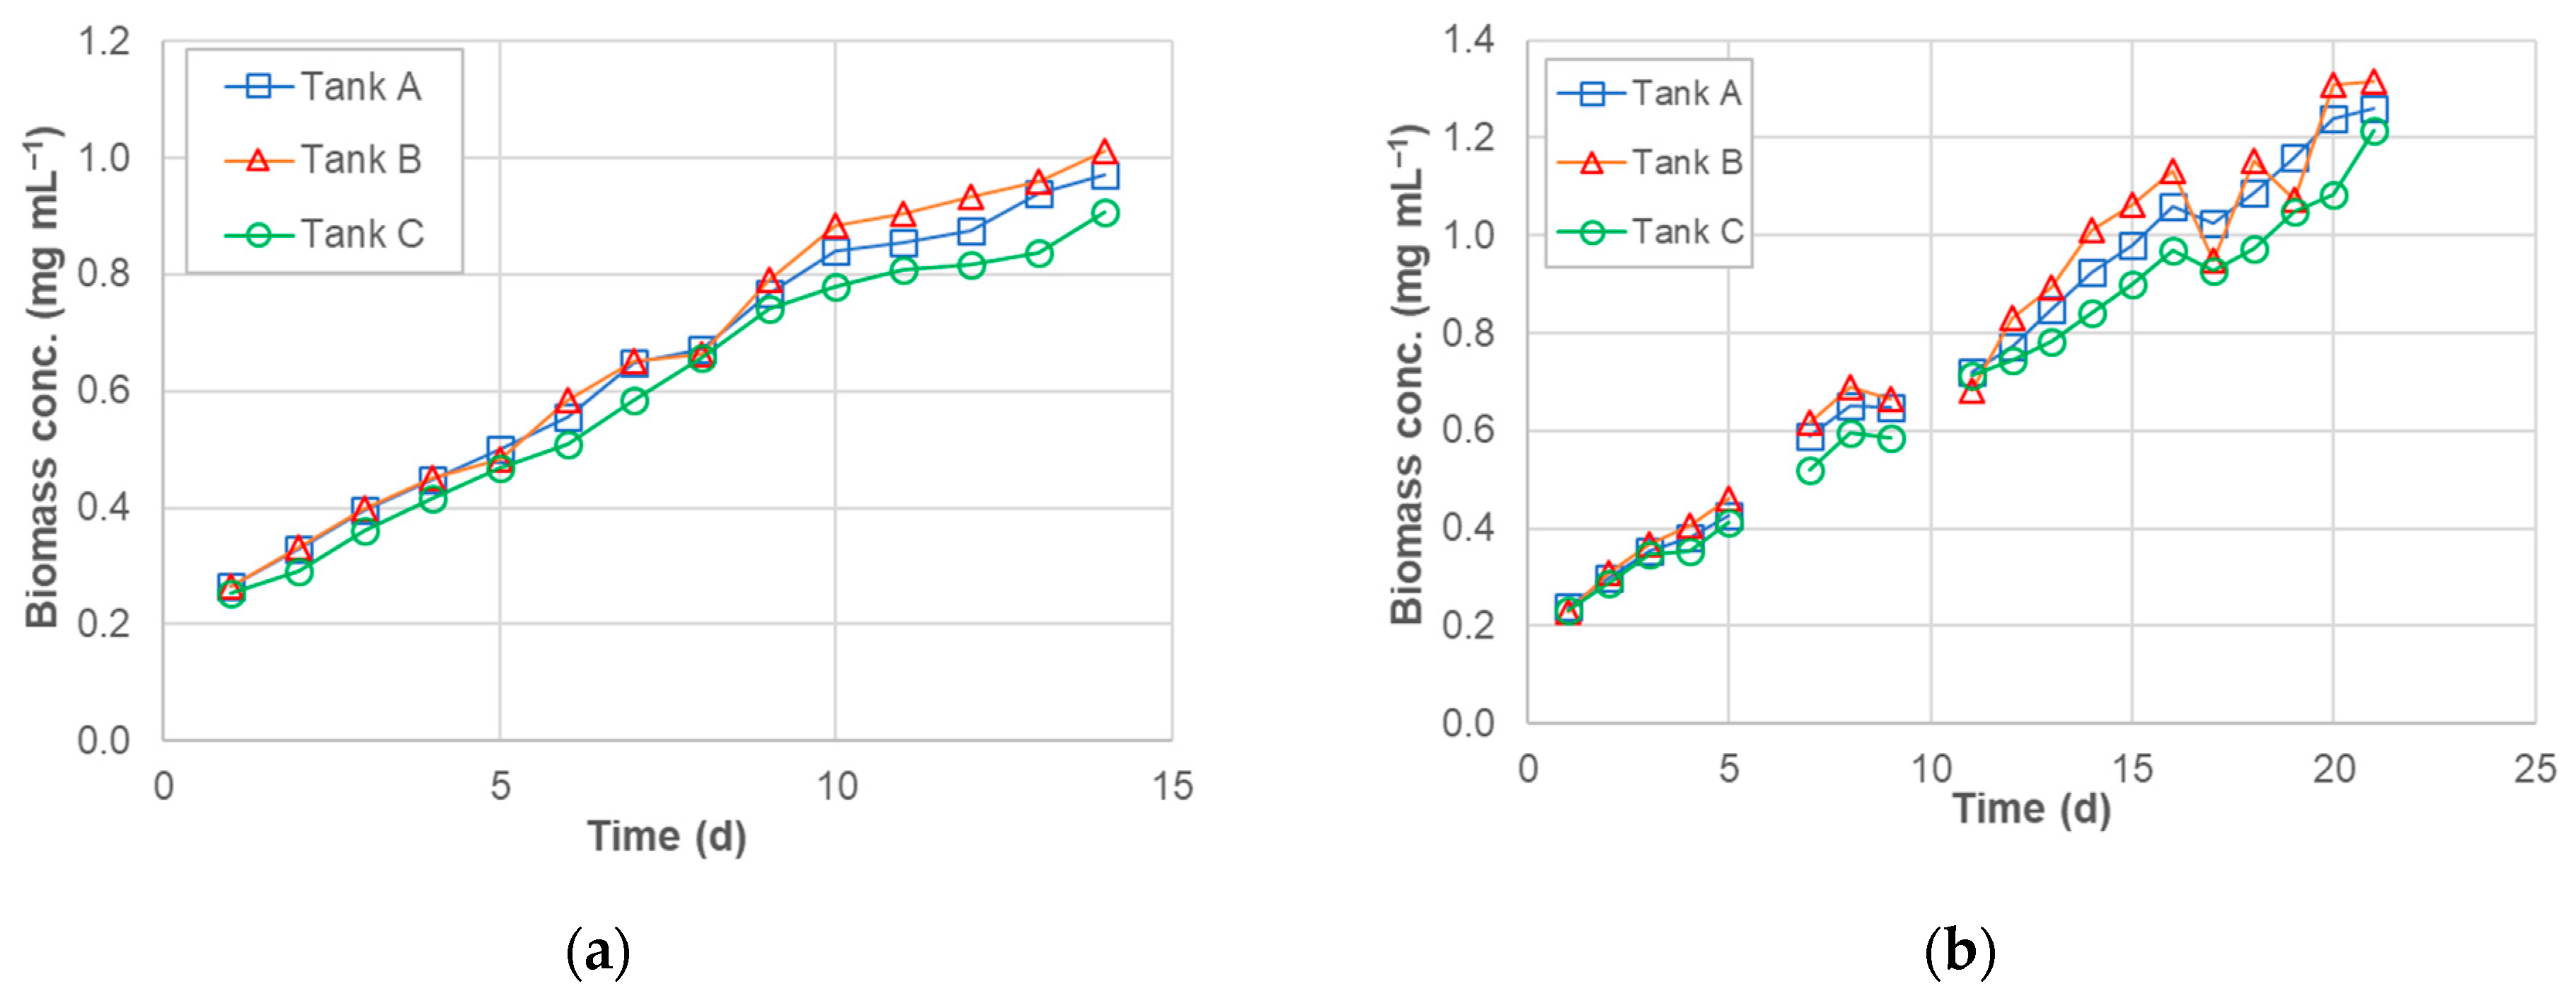
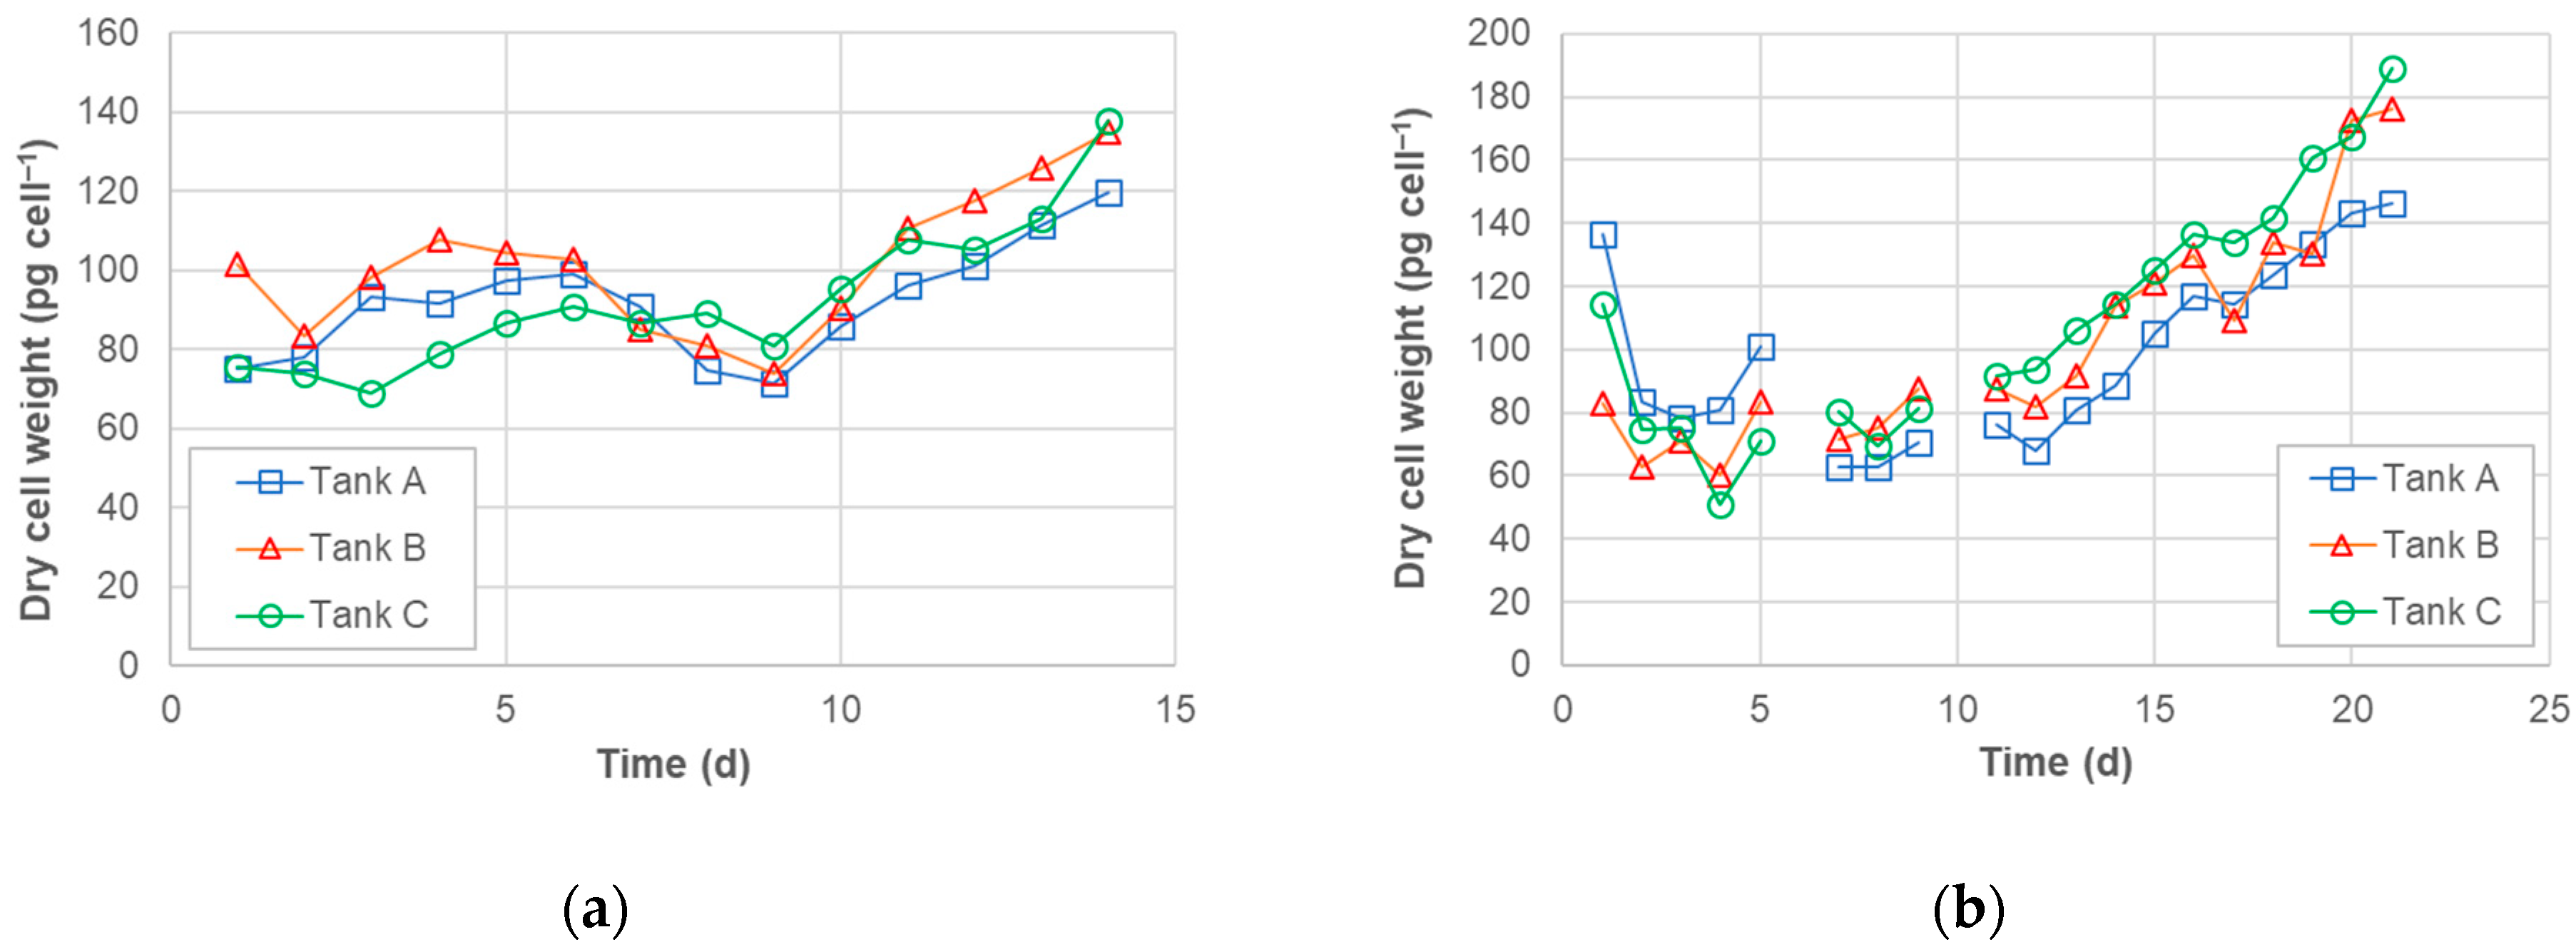
  • Add makeup water every day (1D). Autoclaved deionized water was added to compensate for water loss and to maintain a 2000 mL algal culture in each bottle. Before water addition, several parameters were measured, including temperature, pH, algal biomass, OD, and cell counts. The tests consumed ~26 mL of algal culture. This volume was also included in the water loss calculation. The entire experiment lasted 14 days.
  • Add makeup water every four days (4D). The experiment started with another 1200 mL healthy algal culture that was independent of the previous batch. Again, deionized water was added to maintain a 2000 mL algal culture in each bottle. Temperature, pH, algal biomass, OD, and cell counts were measured every day, and on the day when water was added, the measurement was performed right before water addition. The entire experiment lasted 21 days.
The pH of the algal cultures was monitored with an Oakton PC-450 pH meter and maintained at 6.0–7.0 using 0.5 M HCl or NaOH. However, pH adjustment (on the day of makeup water addition) was rarely needed in reality. The temperature was measured with the same meter and was found to be relatively stable (21 ± 4 °C) during the experiments. Temperature control largely relied on the building’s heating, ventilation, and air conditioning (HVAC) system with a set point of 21 °C (70 °F). No supplemental cooling or heating was used. The Pyrex bottles were directly exposed to room air, with no surrounding shield or the like (Figure 1). The radiation heat due to lighting was dissipated to the room space through convection.

2.3. Analytical Methods

Dry algal biomass (DAB; mg mL−1) was gravimetrically determined [18]. In brief, a 25 mL algal culture sample was taken and vacuum-filtered through a pre-weighed 70 mm glass fiber filter (Fisherbrand G4, Fisher Scientific International, Inc., Waltham, MA, USA). During the vacuum filtration, the sample was rigorously washed with deionized water using a wash bottle. The algae-laden filter was dried in a lab oven at 105 °C for 1 h and then cooled for 3 min in a desiccator before being weighed on an analytical balance (readability: 0.1 mg). For the pre-weighed filter, the same drying condition was followed before weight determination.
Algal cell counts (N; cell mL−1) were measured using a Neubauer hemocytometer under an Olympus CX41 LEEDS optical microscope (Olympus Corp., Tokyo, Japan). Algal suspension samples were imaged with no further dilution. Images were taken using the Infinity Analyze software that came along with the microscope. Algal cells on the acquired images (totaling nine squares, occupying an area of 3 mm × 3 mm) were counted using ImageJ. No replicate counting was conducted for each sample.
The optical density (absorbance) of algal cultures at 670 nm (OD670) was measured using a Hach DR3900 spectrophotometer (Hach Company, Loveland, CO, USA). The wavelength is characteristic of chlorophyll a, and OD670 is often selected as an indirect measure of algal biomass [19]. A BBM without algae was used as a lab blank for absorbance measurement.

2.4. Data Analysis

DAB (mg mL−1) was calculated as
D A B = W f , t W f , 0 V
where Wf,t is the dry weight of an algae-laden filter (mg), Wf,0 is the dry weight of the filter without algae (mg), and V is the volume of the algal culture sample taken for DAB measurement (25 mL). An average dry cell weight was calculated by dividing the DAB by the cell count (N) of the same sample and is presented in the unit of picogram per cell (pg cell−1). It is noteworthy that the algae-laden filter could capture solid substances other than algal cells, such as extracellular substances (EPS) and cell debris. As a result, the calculated DAB and, subsequently, average cell weight, could carry uncertainties. Because algae did not exponentially grow during the makeup water experiments, an arithmetic average growth rate was calculated for algal biomass (µm; mg mL−1 day−1) and cell counts (µn; mg mL−1 day−1):
μ n = N t N 0 t t 0
μ m = D A B t D A B 0 t t 0
where Nt is the cell count on the day of measurement (t), N0 is the initial cell count at day 1 (t0), DABt is the DAB on the day of measurement (t), and DAB0 is the initial DAB at day 1 (t0). No DAB or OD analyses were conducted on day 0 (for system setup, including algal culture transfer and dilution) due to time constraints. To be consistent, µm and µn were calculated from day 1.
A Shapiro–Wilk test revealed that most of the measured and calculated parameters did not follow the normal distribution. As a result, a Kruskal–Wallis test (a non-parametric one-way ANOVA method) was used to compare 1D versus 4D experimental results and further compare them with those acquired from the six-month cultivation experiment. Linear regression was performed to assess a correlation between different algal concentration measures (DAB, cell counts, and OD670). Microsoft Excel and PAST [20] were used to perform the above analyses.

3. Results and Discussion

3.1. Algal Cell Counts

The time interval for makeup water addition showed an effect on algal cell counts (Figure 2). For daily water addition (1D), the maximum cell counts occurred on day 9 in all three Pyrex bottles (1.07 × 10⁷, 1.06 × 10⁷, and 9.12 × 10⁶ cells mL−1 in bottles A, B, and C, respectively). After that, the algal cell counts started to drop, likely due to the depletion of nutrients. In comparison, for every four-day water addition (4D), the maximum cell counts occurred on day 12 (1.11 × 10⁷, 1.01 × 10⁷, and 7.94 × 10⁶ cells mL−1 in bottles A, B, and C, respectively). A consistently lower algal cell concentration in bottle C was possibly related to a difference in air diffusers and, accordingly, bubble sizes. Although no significant difference in the maximum cell counts was seen between 1D and 4D (p = 0.22), 4D resulted in a more pronounced fluctuation in algal cell counts. In particular, on the day following makeup water addition (e.g., days 5, 8, and 12), a dip in algal cell counts was observed in all the bottles. The dip was largely attributed to dilution by makeup water. Due to continuous aeration and lighting, the algal bottles lose 8.1–25.0% of water volume after four days (versus 1.3–4.1% after one day). This substantial water loss could impose stress on S. dimorphus, resulting in a slightly slower growth rate (µn) than 1D (8.80 ± 1.46 × 10⁵ cells mL−1 day−1 for 1D versus 6.95 ± 1.68 × 10⁵ cells mL−1 day−1 for 4D) before the algae reached the maximum cell counts. However, no significant difference was seen from the ANOVA test (p = 0.22).
A control experiment was conducted with BBM added every four days. Algal cell counts continued to increase during the experiment and reached 1.97 ± 0.23 × 10⁷ cells mL−1 on day 21 in the three bottles. A time-average growth rate (µn) of 9.31 ± 1.02 × 10⁵ cells mL−1 day−1 was achieved, greater than that of 1D or 4D, but no significant difference was noted (p = 0.12 versus 4D).

3.2. Dry Algal Biomass (DAB)

In contrast to cell counts, algal biomass continued to increase until the end of the experiments for both 1D and 4D (Figure 3). A linear increase pattern was seen, and a time-average growth rate (µm) was calculated to be 0.054 ± 0.004 mg mL−1 day−1 for 1D (over 14 days) and 0.052 ± 0.003 mg mL−1 day−1 for 4D (over 21 days). Continual growth of algal biomass was also observed during the control experiment. A time-average growth rate of 0.078 ± 0.008 mg mL−1 day−1 was achieved (over 21 days), ~50% greater than that in 1D or 4D (p < 0.05). Thus, keeping enough nutrients in the cultivation medium is critical for maintaining the fast growth of algal biomass. The time interval for makeup water addition showed little effect on the growth of algal biomass.
During both the 1D and 4D experiments, the average cell weight slightly decreased at the beginning and then became relatively stable for days (Figure 4). However, it increased after day 9 in 1D and day 12 in 4D, the same days on which algal cell counts reached the maximum and started to decrease. At the end of the experiments, the average cell weight reached 130.7 ± 9.6 pg cell−1 for 1D and 170.5 ± 22.0 pg cell−1 for 4D. As a comparison, the average cell weight was 93.3 ± 19.5 pg cell−1 for the control experiment, similar to that during the “stable stage” of 1D (days 2–9) and 4D (days 2–12).

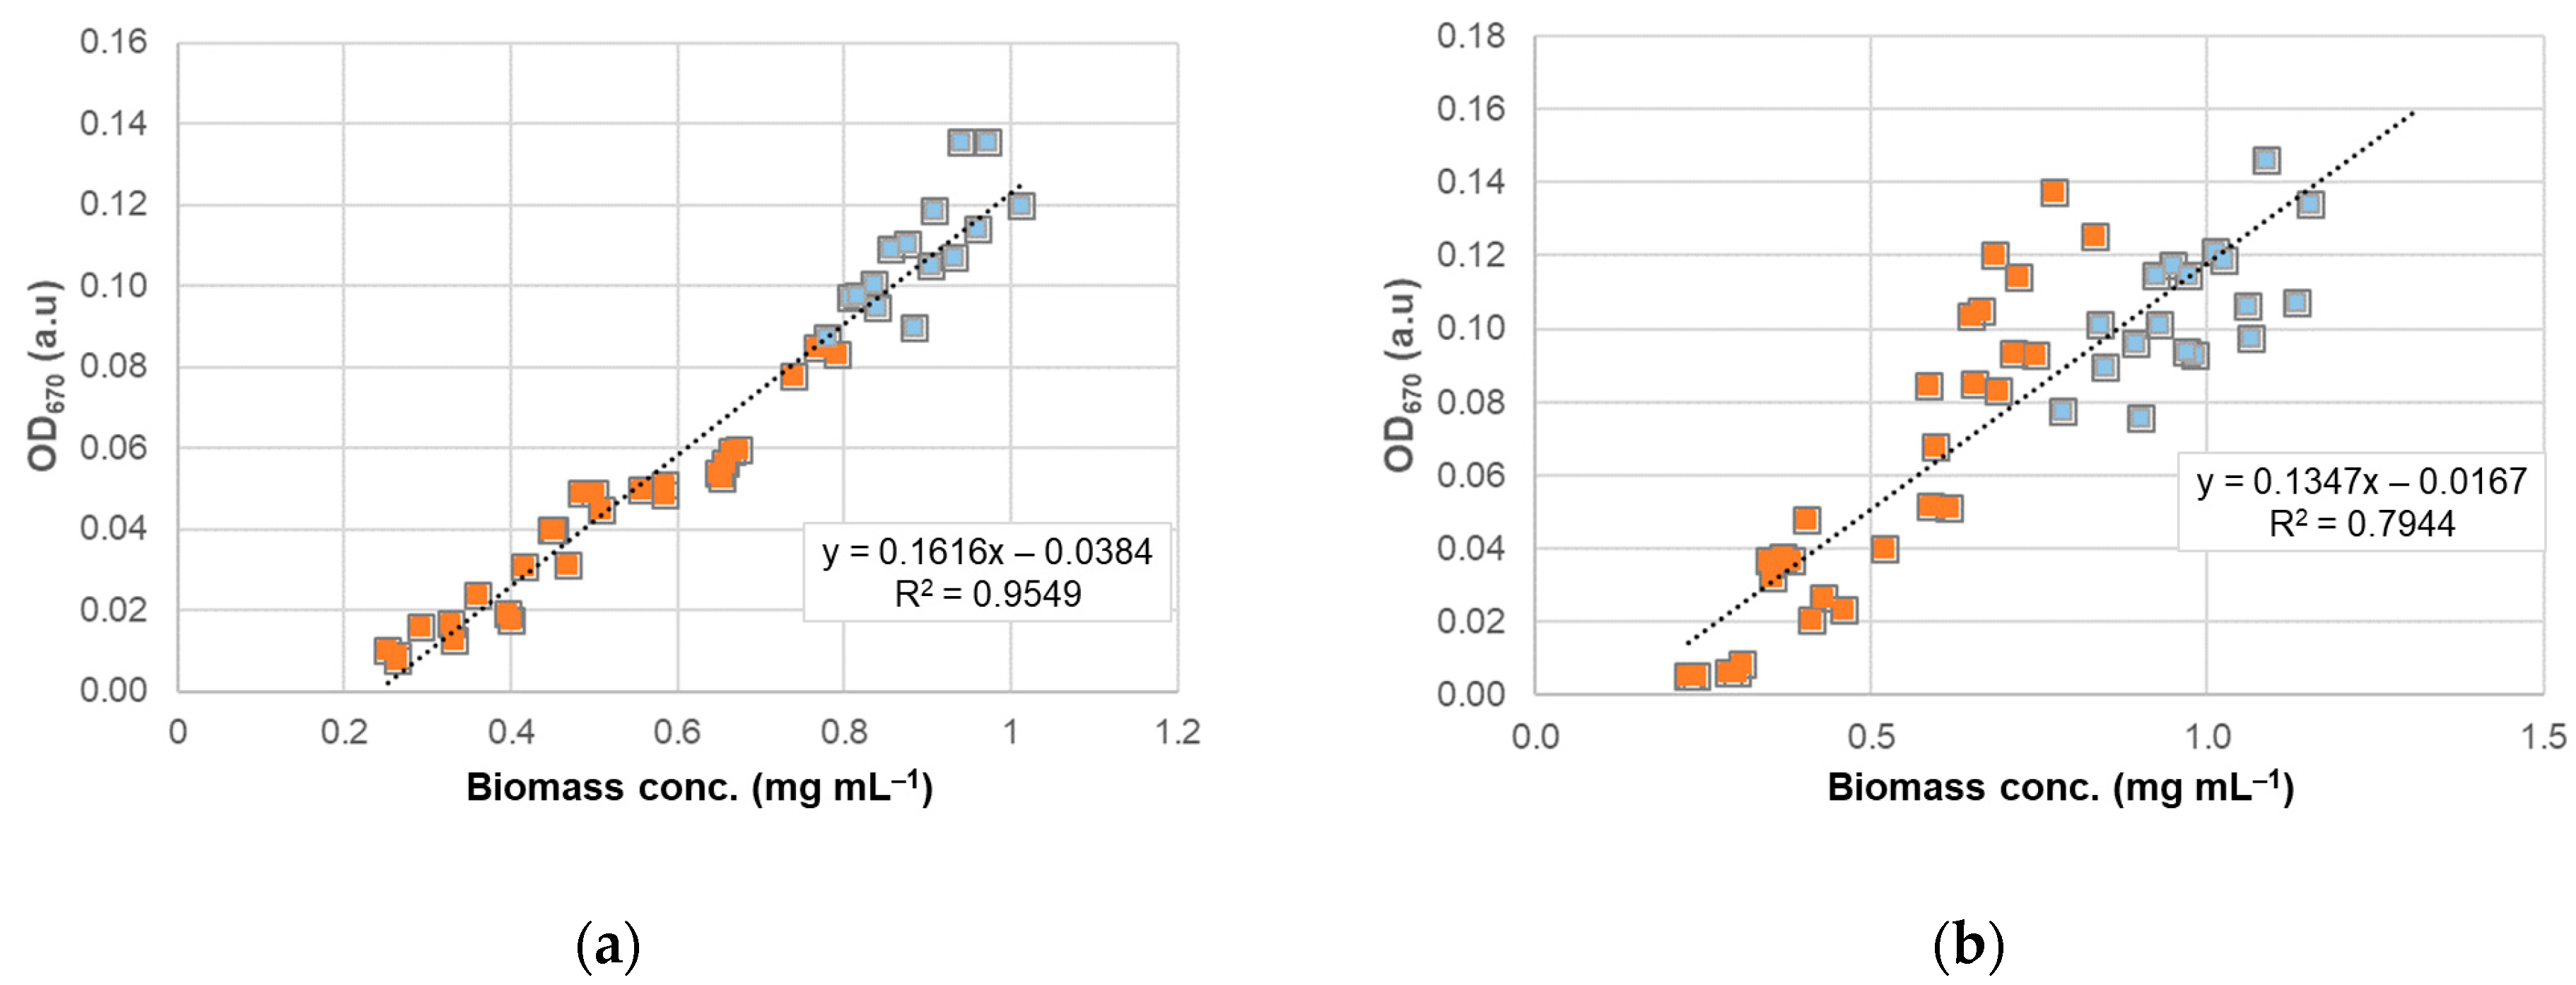
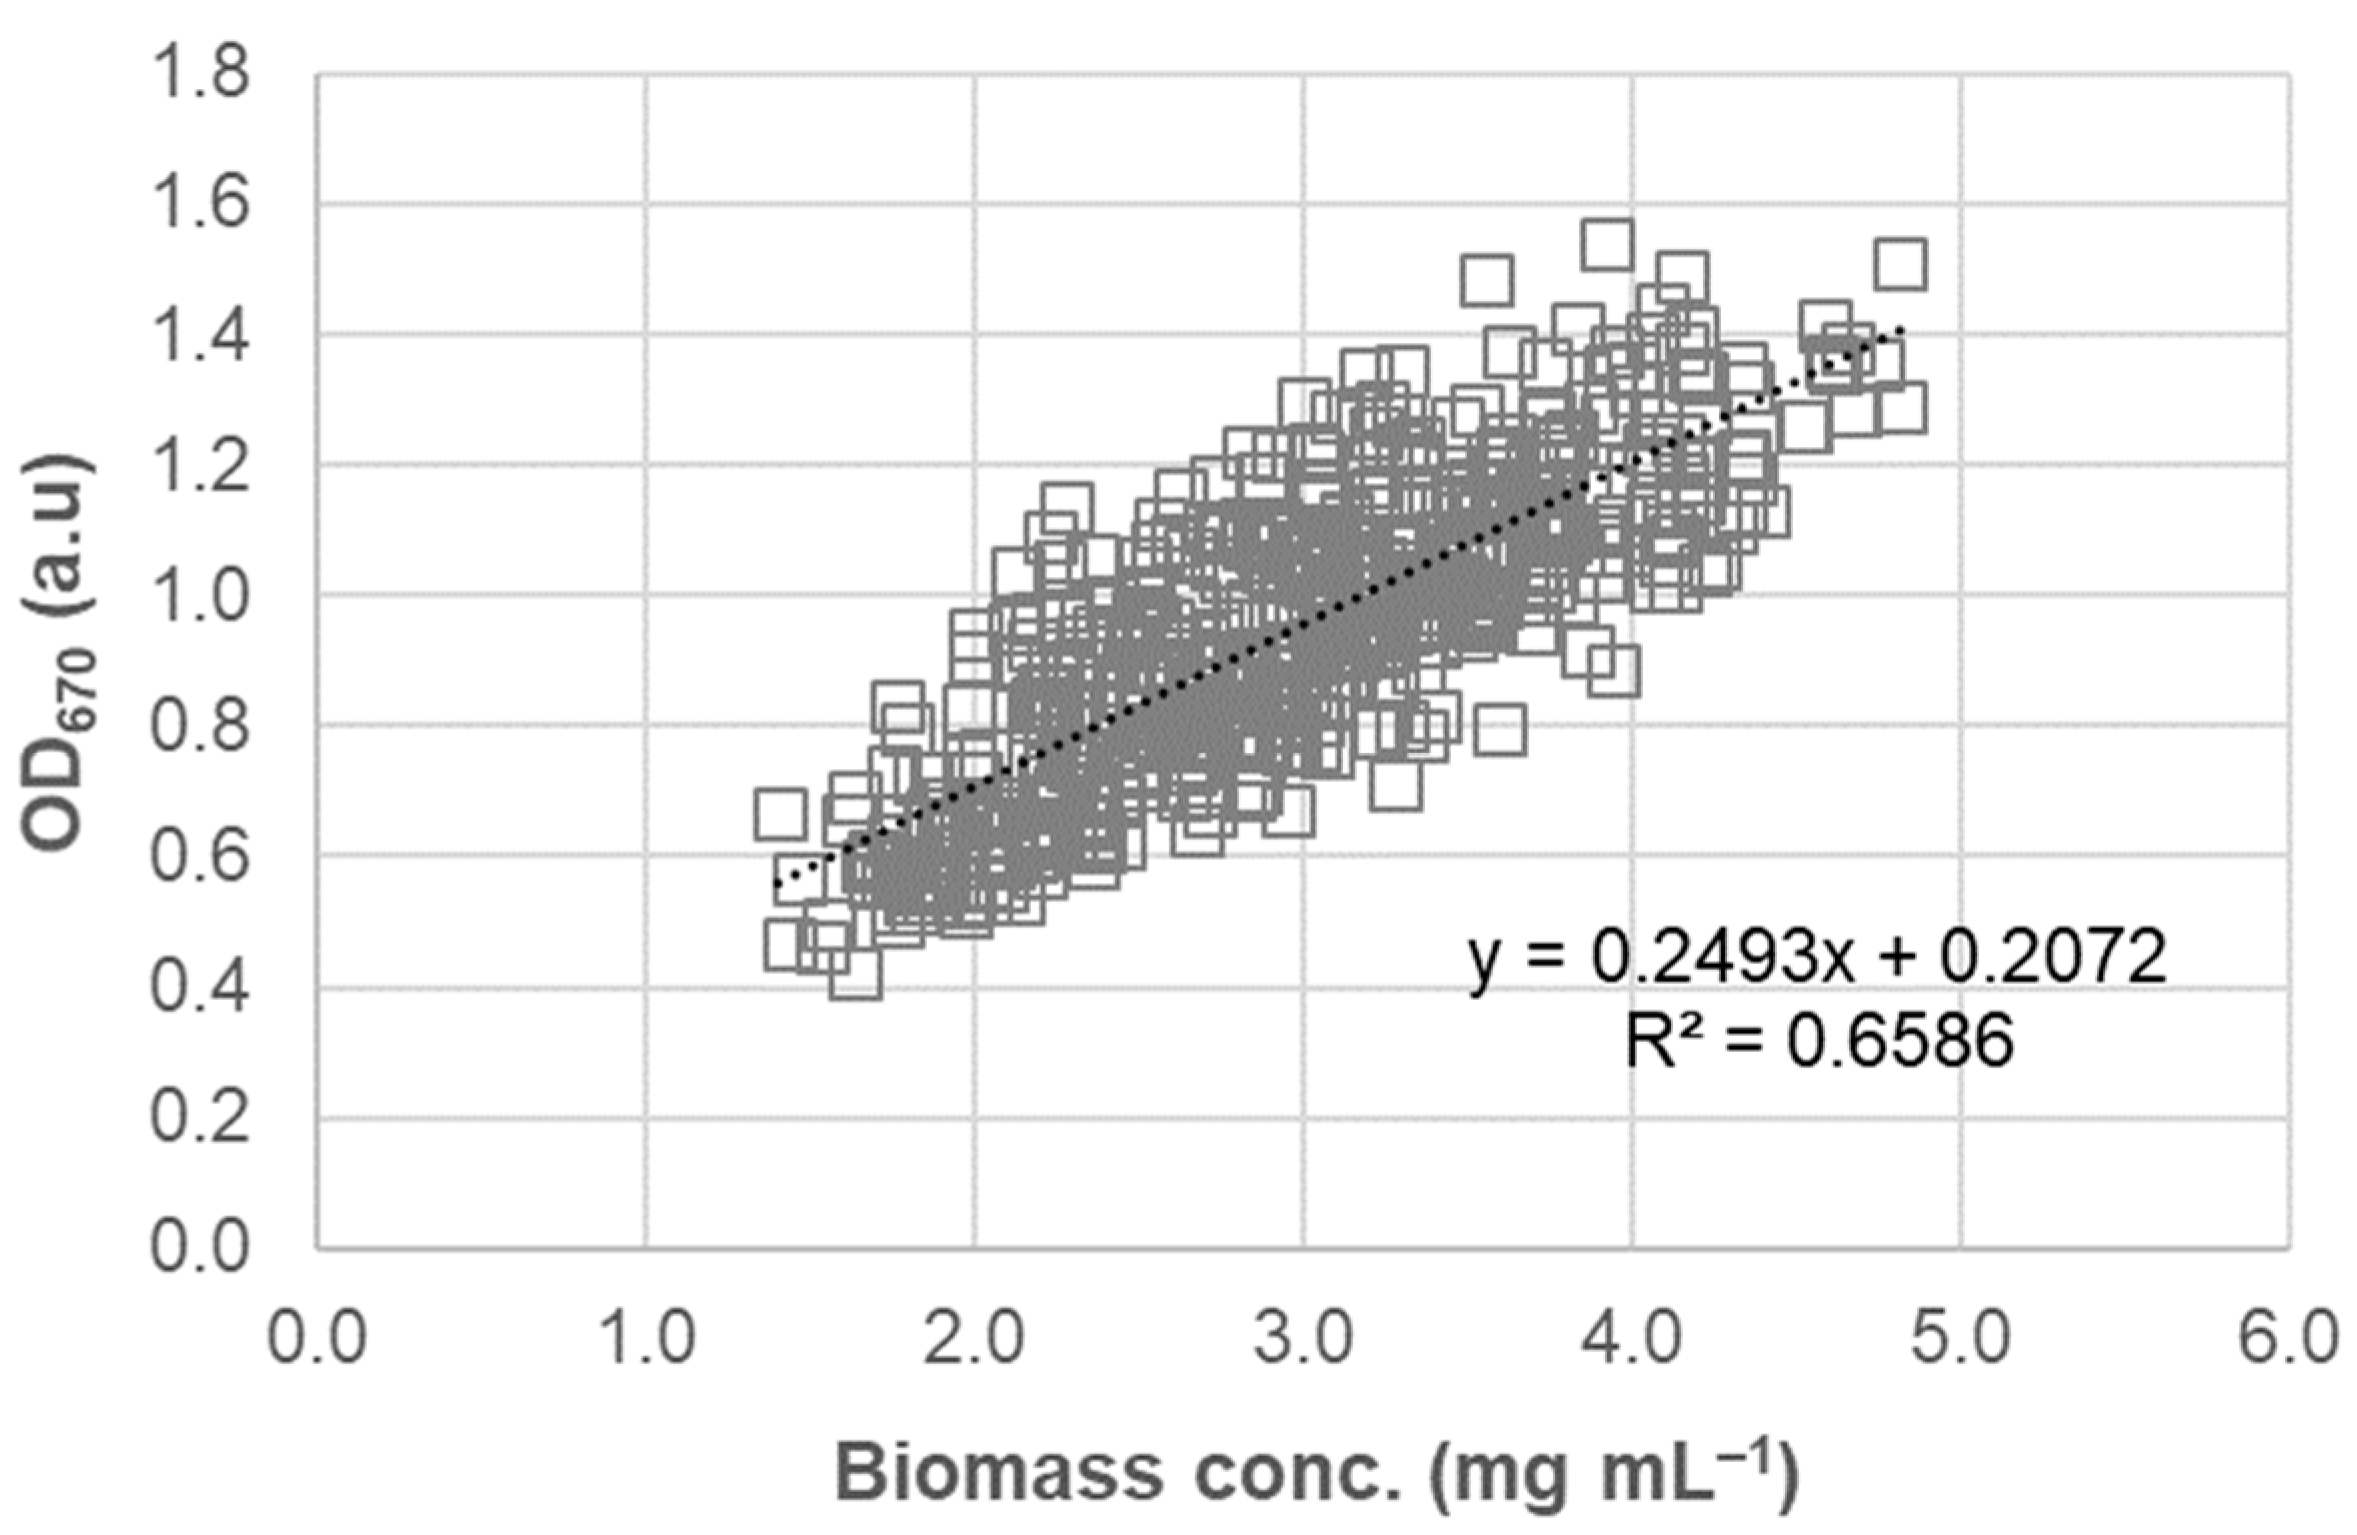
3.3. OD670 as a Surrogate for Algal Biomass

The time interval for makeup water addition was found to affect the applicability of OD670 as a surrogate measure for algal biomass. A greater coefficient of determination (R2) indicates a better prediction of algal biomass (DAB) from OD670 measurement. As shown in Figure 5, OD670 would be a better predictor when makeup water was added every day (1D) than every four days (4D). The reason is uncertain but likely related to the chlorophyll a content in algal cells. Without frequently adding makeup water, the water loss-induced stress on algal cells could lead to a change in their chlorophyll a content per DAB basis. It is noteworthy that for both 1D and 4D, high DAB concentrations occurred towards the end of the experiments when depleted nutrients could have resulted in enlarged algal cells and changes in the content of chlorophyll a. The greater slope from the 1D experiment suggests that the algal cells were overall greener than those in 4D.
No OD measurement results were available for the control experiment. To further examine the effect of nutrient constraints, the cell count and DAB data were retrieved from the six-month cultivation of S. dimorphus. During the cultivation, the algal culture doubled every seven days and the BBM was periodically added to ensure sufficient nutrient supply for the microalgae and to maintain water levels. Only a moderate R2 value (0.659) was obtained (Figure 6), indicating the relatively poor performance of OD670 as a surrogate measure for DAB during long algal cultivation experiments. The regression coefficients (slope = 0.249 and intercept = 0.203) acquired from the six-month cultivation were considerably different than those from 1D or 4D (a greater slope indicating greener cells than 1D and 4D), suggesting a large effect of nutrients on the chlorophyll a content per DAB basis. Caution must be taken when using OD670 as a measure of algal biomass, and a frequent and case-specific calibration may be necessary.
A correlation analysis was also conducted between cell counts and OD670 readings. Only a moderate correlation was seen for the makeup water experiments (R2 = 0.611 for 1D and 0.682 for 4D). The (relatively) highest R2 value (0.715) was derived from the six-month cultivation.

3.4. Discussion

The DAB concentrations of S. dimorphus from 1D (0.96 ± 0.05 mg mL−1 on day 14) and 4D (1.26 ± 0.05 mg mL−1 on day 21) were lower than that from the control experiment (1.82 ± 0.11 mg mL−1 on day 21). These results were similar to those reported by Ref. [21] (0.96 mg mL−1 on day 16), in which S. dimorphus was cultivated in a BBM but with no makeup water or BBM added during cultivation. In that study, a decrease in DAB concentrations was seen after day 16. Amending the BBM with nitrates raised the maximum DAB concentration (up to 1.69 mg mL−1 on day 16); however, the concentration still decreased after day 16. The addition of makeup water (4D) appears to benefit the continual growth of S. dimorphus biomass. A DAB concentration of 1.2 mg mL−1 was reported by Ref. [22], which is also close to the values derived from these makeup water experiments.
No exponential growth in cell counts or DAB concentrations was observed in this study. According to Ref. [23], S. dimorphus ended exponential growth when its cell counts exceeded 1.2 × 10⁵ cells mL−1, substantially smaller than the cell count range in this study (Figure 2). This supports the use of arithmetic average growth rates in Equations (2) and (3). Ref. [23] also reported an average dry cell weight of 194 pg cell−1, larger than our observed values. The reason for different cell weights is uncertain but likely related to differences in algal strains, cultivation media, and cell counts (a strain isolated from rivers and cultivated in a WC medium, with counts of 1.2 × 10⁴–2.9 × 10⁵ cells mL−1 in Ref. [23]).
For both 1D and 4D, algal cell counts declined after surpassing a peak value. The decrease was ascribed to nutrient depletion. With limited nutrients, microalgal cells would stop dividing and start to accumulate triacylglycerides for survival [24]. Assuming that the average nitrogen content of S. dimorphus cells is 8.75% by weight [25], the nitrogen in the BBM (0.0413 mg mL−1) could sustain the growth of DAB concentrations by 0.472 mg mL−1. This is lower than the actual DAB concentration (0.77 ± 0.03 mg mL−1) on day 9 during the 1D experiment and that (0.78 ± 0.04 mg mL−1) on day 12 during the 4D experiment. Thus, the occurrence of nutrient depletion is anticipated. Nutrient starvation has been explored for enhanced lipid production from microalgae, including S. dimorphus [26,27]. During nutrient starvation, photosynthesis still occurs but towards the conversion to—and accumulation of—lipids in a cell, resulting in a continuous increase in DAB concentrations [21,24]. Frequent addition of makeup water appears to speed up the coming of such a “flip point” (peak cell counts in Figure 2). An analysis of lipid contents in S. dimorphus is needed to further verify the enhancement of lipid production.
OD readings at various wavelengths have been measured as a surrogate for S. dimorphus concentrations. However, few studies included enough data to validate the adopted OD method. Ref. [21] took OD550 readings, but no correlation with DAB concentrations was attempted. Ref. [23] measured OD438, OD540, OD678, and OD750 and found a strong correlation of OD438 with S. dimorphus cell counts (R2 = 0.992). However, only five data points were used to establish the relationship. Ref. [28] reported a strong correlation of OD400, OD500, and OD680 with S. dimorphus cell counts (R2 = 0.883, 0.916, and 0.994, respectively). However, for each OD, only ten data points were available. Ref. [29] used OD600 to measure S. dimorphus cell counts. A calibration curve (R2 = 0.999) was built through the dilution of a microalgal culture to four dilution ratios (accordingly, only four data points). Other adopted wavelengths include OD730 [30] and OD690 [31]. The only study including a large data set was reported by Ref. [32]. A strong correlation of OD680 was found with UTEX B72 (R2 = 0.966) and UTEX 1237 DAB concentrations (R2 = 0.972). No detailed calibration information, however, was provided. According to Ref. [29], nitrogen starvation could change the chlorophyll content of S. dimorphus. This may explain the low R2 values calculated from the makeup water experiments.
High winds, elevated temperatures, low relative humidity, and strong aeration can lead to significant evaporation water loss from outdoor open ponds (e.g., raceways), while for PBRs, aeration and artificial lighting may result in substantial water loss [7]. The loss, if not compensated for in a timely manner with makeup water or growth media (the latter being expensive), could cause a surge in salinity, toxic/inhibitory substances (e.g., metals), and algal count concentrations, thereby affecting microalgal growth. The findings from this study support that the frequent (daily) addition of makeup water benefits microalgal growth in PBRs by possibly buffering the changes in those parameters. A similar benefit is expected for open pond systems. This, however, demands further investigation due to different water management challenges faced by open pond systems. For open ponds, precipitation is a factor affecting the water balance and it contains relatively pure water. This makes the use of deionized water in these experiments valid and relevant. It is noteworthy that the PBRs and open ponds discussed herein are suspension systems in which microalgal cells are suspended in a cultivation medium. For immobilized (biofilm) systems in which microalgal cells are immobilized and grown on a solid medium, water management, including makeup water, can also be a challenge [33]. However, the findings and discussions acquired from this study may not necessarily apply.

4. Conclusions

Makeup water is needed to compensate for water loss from a microalgal cultivation system. This study compared two makeup water addition time intervals (1D and 4D) for their effects on S. dimorphus cell counts and dry biomass. Results showed that the daily addition of makeup water resulted in faster growth of algal cell counts, but it had a negligible effect on the growth of algal biomass. S. dimorphus cell counts decreased after surpassing a peak value, but the accumulation of algal biomass continued for days, leading to a greater cell weight. The time interval also affected the performance of the OD method. OD670 offered a better estimate of dry algal biomass when makeup water was added more frequently. This was ascribed to the water loss-induced stress on S. dimorphus and associated changes in chlorophyll a content in algal cells. For future use of the OD method, frequent and case-specific calibration is recommended. The findings from this study are expected to raise awareness of the importance of makeup water management for PBRs and open pond systems. To further study the effect of makeup water addition, water quality parameters (e.g., total dissolved solids [TDS], pH, and nitrate) should be closely monitored, along with water loss and algal concentrations.

Author Contributions

Conceptualization, A.O., G.A.A. and X.Y.; methodology, A.O., G.A.A. and X.Y.; software, A.O. and X.Y.; validation, N.H., S.U. and K.M.; formal analysis, A.O., N.H. and X.Y.; investigation, A.O. and K.L.A.; resources, G.A.A., K.M. and X.Y.; data curation, A.O., G.A.A. and X.Y.; writing—original draft preparation, A.O.; writing—review and editing, N.H., S.U., K.M., G.A.A. and X.Y.; visualization, A.O., N.H. and X.Y.; supervision, G.A.A. and X.Y.; project administration, G.A.A. and X.Y.; funding acquisition, G.A.A. and X.Y. All authors have read and agreed to the published version of the manuscript.

Funding

This research was funded by the U.S. Department of Agriculture NIFA Hatch (SD00H709-20) and Multistate Hatch Projects (SD00R690-20) through the South Dakota Agricultural Experimental Station.

Data Availability Statement

Not applicable.

Acknowledgments

Seyit Uguz wishes to acknowledge the support from Bursa Uludag University and The Council of Higher Education of Turkey (YUDAB Scholarship) for his stay at South Dakota State University as a visiting student.

Conflicts of Interest

The authors declare no conflict of interest.

References

  1. Brennan, L.; Owende, P. Biofuels from microalgae—A review of technologies for production, processing, and extractions of biofuels and co-products. Renew. Sustain. Energy Rev. 2010, 14, 557–577. [Google Scholar] [CrossRef]
  2. Mascarelli, A.L. Algae: Fuel of the future? Environ. Sci. Technol. 2009, 43, 7160–7161. [Google Scholar] [CrossRef] [PubMed]
  3. Chen, C.Y.; Kuo, E.W.; Nagarajan, D.; Ho, S.H.; Dong, C.D.; Lee, D.J.; Chang, J.S. Cultivating Chlorella sorokiniana AK-1 with swine wastewater for simultaneous wastewater treatment and algal biomass production. Bioresour. Technol. 2020, 302, 122814. [Google Scholar] [CrossRef] [PubMed]
  4. Uguz, S.; Anderson, G.; Yang, X.; Simsek, E.; Osabutey, A. Cultivation of Scenedesmus dimorphus with air contaminants from a pig confinement building. J. Environ. Manag. 2022, 314, 115129. [Google Scholar] [CrossRef]
  5. Sirakov, M.; Palmieri, M.; Iovinella, M.; Davis, S.J.; Petriccione, M.; di Cicco, M.R.; De Stefano, M.; Ciniglia, C. Cyanidiophyceae (rhodophyta) tolerance to precious metals: Metabolic response to palladium and gold. Plants 2021, 10, 2367. [Google Scholar] [CrossRef]
  6. Zhao, B.; Su, Y. Process effect of microalgal-carbon dioxide fixation and biomass production: A review. Renew. Sustain. Energy Rev. 2014, 31, 121–132. [Google Scholar] [CrossRef]
  7. Murphy, C.F.; Allen, D.T. Energy-water nexus for mass cultivation of algae. Environ. Sci. Technol. 2011, 45, 5861–5868. [Google Scholar] [CrossRef]
  8. Moglia, M.; Cook, S.; Tapsuwan, S. Promoting water conservation: Where to from here? Water 2018, 10, 1510. [Google Scholar] [CrossRef]
  9. Feng, P.Z.; Zhu, L.D.; Qin, X.X.; Li, Z.H. Water footprint of biodiesel production from microalgae cultivated in photobioreactors. J. Environ. Eng. 2016, 142, 04016067. [Google Scholar] [CrossRef]
  10. Clarens, A.F.; Resurreccion, E.P.; White, M.A.; Colosi, L.M. Environmental life cycle comparison of algae to other bioenergy feedstocks. Environ. Sci. Technol. 2010, 44, 1813–1819. [Google Scholar] [CrossRef]
  11. Yang, J.; Xu, M.; Zhang, X.; Hu, Q.; Sommerfeld, M.; Chen, Y. Life-cycle analysis on biodiesel production from microalgae: Water footprint and nutrients balance. Bioresour. Technol. 2011, 102, 159–165. [Google Scholar] [CrossRef] [PubMed]
  12. Quiroz, D.; Greene, J.M.; McGowen, J.; Quinn, J.C. Geographical assessment of open pond algal productivity and evaporation losses across the United States. Algal Res. 2021, 60, 102483. [Google Scholar] [CrossRef]
  13. Martins, A.A.; Marques, F.; Cameira, M.; Santos, E.; Badenes, S.; Costa, L.; Vieira, V.V.; Caetano, N.S.; Mata, T.M. Water footprint of microalgae cultivation in photobioreactor. Energy Procedia 2018, 153, 426–431. [Google Scholar] [CrossRef]
  14. Sander, K.; Murthy, G.S. Life cycle analysis of algae biodiesel. Int. J. Life Cycle Assess. 2010, 15, 704–714. [Google Scholar] [CrossRef]
  15. Kang, J.; Wang, T.; Xin, H.; Wen, Z. A laboratory study of microalgae-based ammonia gas mitigation with potential application for improving air quality in animal production operations. J. Air Waste Manag. Assoc. 2014, 64, 330–339. [Google Scholar] [CrossRef]
  16. Xu, X.; Shen, Y.; Chen, J. Cultivation of Scenedesmus dimorphus for C/N/P removal and lipid production. Electron. J. Biotechnol. 2015, 18, 46–50. [Google Scholar] [CrossRef]
  17. Fábregas, J.; Domínguez, A.; Regueiro, M.; Maseda, A.; Otero, A. Optimization of culture medium for the continuous cultivation of the microalga Haematococcus pluvialis. Appl. Microbiol. Biotechnol. 2000, 53, 530–535. [Google Scholar] [CrossRef]
  18. Hu, W. Dry Weight and Cell Density of Individual Algal and Cyanobacterial Cells for Algae Research and Development. Master’s Thesis, University of Missouri-Columbia, Columbia, MO, USA, 2014. [Google Scholar]
  19. Menegazzo, M.L.; Ribeiro, D.M.; De Oliveira, N.N.; Marques, O.G.B.; Fonseca, G.G. Evaluation of Chlorella sorokiniana biomass recovery by using different chemical-based flocculants. J. Appl. Biotechnol. Rep. 2022, 91, 477–483. [Google Scholar]
  20. Hammer, Ø.; Harper, D.A.; Ryan, P.D. PAST: Paleontological statistics software package for education and data analysis. Palaeontol. Electron. 2001, 4, 1–9. [Google Scholar]
  21. Velichkova, K.; Sirakov, I.; Georgiev, G. Cultivation of Scenedesmus dimorphus strain for biofuel production. Agric. Sci. Technol. 2013, 5, 181–185. [Google Scholar]
  22. Varsharani, H.; Geeta, G. Isolation of microalgae with limitation on fatty acid and lipid content of marine microalgae. Biodiesel Product. Prospects 2011, 24, 585–588. [Google Scholar]
  23. Padovan, A. Isolation and Culture of Five Species of Freshwater Algae from the Alligator Rivers Region, Northern Territory; Australian Government Publishing Service: Canberra, Australia, 1992. Available online: https://www.awe.gov.au/science-research/supervising-scientist/publications/technical-memoranda/isolation-and-culture-five-species-freshwater-algae-alligator-rivers-region (accessed on 9 March 2022).
  24. Narala, R.R.; Garg, S.; Sharma, K.K.; Thomas-Hall, S.R.; Deme, M.; Li, Y.; Schenk, P.M. Comparison of microalgae cultivation in photobioreactor, open raceway pond, and a two-stage hybrid system. Front. Energy Res. 2016, 4, 29. [Google Scholar] [CrossRef]
  25. Bordoloi, N.; Narzari, R.; Sut, D.; Saikia, R.; Chutia, R.S.; Kataki, R. Characterization of bio-oil and its sub-fractions from pyrolysis of Scenedesmus dimorphus. Renew. Energy 2016, 98, 245–253. [Google Scholar] [CrossRef]
  26. Latsos, C.; van Houcke, J.; Timmermans, K.R. The effect of nitrogen starvation on biomass yield and biochemical constituents of Rhodomonas sp. Front. Mar. Sci. 2020, 7, 563333. [Google Scholar] [CrossRef]
  27. Rugnini, L.; Rossi, C.; Antonaroli, S.; Rakaj, A.; Bruno, L. The influence of light and nutrient starvation on morphology, biomass and lipid content in seven strains of green microalgae as a source of biodiesel. Microorganisms 2020, 8, 1254. [Google Scholar] [CrossRef]
  28. Perdana, B.A.; Dharma, A.; Zakaria, I.J.; Syafrizayanti, S. Freshwater pond microalgae for biofuel: Strain isolation, identification, cultivation and fatty acid content. Biodiversitas 2021, 22, 505–511. [Google Scholar] [CrossRef]
  29. Ferreira, V.S.; Pinto, R.F.; Sant’Anna, C. Low light intensity and nitrogen starvation modulate the chlorophyll content of Scenedesmus dimorphus. J. Appl. Microbiol. 2016, 120, 661–670. [Google Scholar] [CrossRef]
  30. Jiang, Y.; Zhang, W.; Wang, J.; Chen, Y.; Shen, S.; Liu, T. Utilization of simulated flue gas for cultivation of Scenedesmus dimorphus. Bioresour. Technol. 2013, 128, 359–364. [Google Scholar] [CrossRef]
  31. Cicci, A.; Stoller, M.; Bravi, M. Microalgal biomass production by using ultra-and nanofiltration membrane fractions of olive mill wastewater. Water Res. 2013, 47, 4710–4718. [Google Scholar] [CrossRef]
  32. Bohutskyi, P.; Kligerman, D.C.; Byers, N.; Nasr, L.K.; Cua, C.; Chow, S.; Su, C.; Tang, Y.; Betenbaugh, M.J.; Bouwer, E.J. Effects of inoculum size, light intensity, and dose of anaerobic digestion centrate on growth and productivity of Chlorella and Scenedesmus microalgae and their poly-culture in primary and secondary wastewater. Algal Res. 2016, 19, 278–290. [Google Scholar] [CrossRef]
  33. Tran, H.D.; Ong, B.N.; Ngo, V.T.; Tran, D.L.; Nguyen, T.C.; Tran-Thi, B.H.; Do, T.T.; Nguyen, T.M.L.; Nguyen, X.H.; Melkonian, M. New angled twin–layer porous substrate photobioreactors for cultivation of Nannochloropsis oculata. Protist 2022, 173, 125914. [Google Scholar] [CrossRef] [PubMed]
Figure 1. (a) A schematic diagram of experimental setup and (b) a photo of the real setup. Note that the bottle plugs were made from polystyrene foams, allowing moist air to go through (besides the outlet tubing). In the background is a LED panel for a 1000 L photobioreactor.
Agriengineering 05 00061 g001
Figure 2. Cell count concentrations of S. dimorphus with different time intervals of makeup water addition: (a) every day (1D) and (b) every four days (4D). For the 4D experiment, data on days 6 and 10 were missing due to lab accessibility issues.
Agriengineering 05 00061 g002
Figure 3. Dry biomass concentrations of S. dimorphus with different time intervals of makeup water addition: (a) every day (1D) and (b) every four days (4D).
Agriengineering 05 00061 g003
Figure 4. Average dry cell weight of S. dimorphus under different time intervals of makeup water addition: (a) every day (1D) and (b) every four days (4D).
Agriengineering 05 00061 g004
Figure 5. Correlation between OD670 and dry algal biomass concentration of S. dimorphus for (a) makeup water addition every day and (b) makeup water addition every four days. Note: orange squares were data before and including the day when a maximum cell concentration occurred (day 9 for 1D and day 12 for 4D) while light blue ones were data after that.
Agriengineering 05 00061 g005
Figure 6. Correlation between OD670 and dry algal biomass concentration of S. dimorphus during six-month algal cultivation with periodic nutrient addition.
Agriengineering 05 00061 g006
Disclaimer/Publisher’s Note: The statements, opinions and data contained in all publications are solely those of the individual author(s) and contributor(s) and not of MDPI and/or the editor(s). MDPI and/or the editor(s) disclaim responsibility for any injury to people or property resulting from any ideas, methods, instructions or products referred to in the content.

