Article

Energy Balance Assessment in Agricultural Systems; An Approach to Diversification

by
Susanthika Dhanapala
1,
Helitha Nilmalgoda
2,
Miyuru B. Gunathilake
3,4,
Upaka Rathnayake
5 and
Eranga M. Wimalasiri
1,*
1
Department of Export Agriculture, Faculty of Agricultural Sciences, Sabaragamuwa University of Sri Lanka, Belihuloya 70140, Sri Lanka
2
Department of Biosystems Technology, Faculty of Technology, Sabaragamuwa University of Sri Lanka, Belihuloya 70140, Sri Lanka
3
Hydrology and Aquatic Environment, Environment and Natural Resources, Norwegian Institute of Bioeconomy and Research, 1433 Ås, Norway
4
Water, Energy, and Environmental Engineering Research Unit, Faculty of Technology, University of Oulu, P.O. Box 8000, FI-90014 Oulu, Finland
5
Department of Civil Engineering and Construction, Faculty of Engineering and Design, Atlantic Technological University, Ash Lane, F91 YW50 Sligo, Ireland
*
Author to whom correspondence should be addressed.
AgriEngineering 2023, 5(2), 950-964; https://doi.org/10.3390/agriengineering5020059
Submission received: 16 April 2023 / Revised: 19 May 2023 / Accepted: 24 May 2023 / Published: 26 May 2023

Abstract

:
The energy in agricultural systems is two-fold: transformation and utilization. The assessment and proper use of energy in agricultural systems is important to achieve economic benefits and overall sustainability. Therefore, this study was conducted to evaluate the energy balance of crop and livestock production, net energy ratio (NER), and water use efficiency (WUE) of crops of a selected farm in Sri Lanka using the life cycle assessment (LCA) approach. In order to assess the diversification, 18 crops and 5 livestock types were used. The data were obtained from farm records, personal contacts, and previously published literature. Accordingly, the energy balance in crop production and livestock production was −316.87 GJ ha−1 Year−1 and 758.73 GJ Year−1, respectively. The energy related WUE of crop production was 31.35 MJ m−3. The total energy balance of the farm was 736.2 GJ Year−1. The results show a negative energy balance in crop production indicating an efficient production system, while a comparatively higher energy loss was shown from the livestock sector. The procedure followed in this study can be used to assess the energy balance of diversified agricultural systems, which is important for agricultural sustainability. This can be further developed to assess the carbon footprint in agricultural systems.

1. Introduction

Energy is a driving force of existence and it is required for all agricultural activities in terms of crop and livestock production [1,2,3]. Energy in agriculture is two-fold; energy is used in day-to-day activities in agriculture while also producing energy in the form of bioenergy and foods. Agriculture and energy are closely interconnected; therefore, the efficient use of energy is a key factor in sustainable agriculture production [4,5]. Due to its importance in global sustainability, farm energy can be related to the United Nations (UN) Sustainable Development Goals (SDGs). For example, the proper assessment of energy from agricultural systems is important to achieve affordable and clean energy (Goal 7), decent work and economic growth (Goal 8), responsible consumption, and production (Goal 12), and climate action (Goal 13) [6]. The importance of increased energy efficiency was also discussed in the United Nations Climate Change Conference (COP26 can be found at https://ukcop26.org/ (accessed on 10 April 2023)).
The energy used in agriculture can be divided into direct and indirect energy where direct energy is directly used for different agricultural activities, such as the transportation of agricultural inputs, land preparation, irrigation, harvesting, and other management practices. Human labor, electricity, fuel, and water for irrigation and animal consumption are examples of direct energy. Indirect energy inputs are used in the manufacturing, distribution, and transport of chemical inputs, and products. The major indirect energy inputs are seeds, fertilizers, pesticides, herbicides, and fungicides. The rate of energy used in agriculture directly depends on the soil conditions, climate, and other environmental factors [5,7,8].
The energy used in agriculture has become more intensive to fulfill the food demands of increasing populations and insufficient arable land [5,9]. Due to these reasons in all societies, energy inputs have been increased to maximize the final yield of agricultural production and to reduce labor costs without considering environmental effects and human health [10]. However, the overuse of energy is a problem for the sustainability of agricultural systems, human health, and environmental health. For example, energy overuse affects soil degradation, increases fertile soil erosion, pollutes water, soil, and air with chemicals, and results in the loss of plant and animal species, greenhouse gas emissions, and global warming [11,12]. Therefore, the efficient use of energy, and enough energy, is important to increase agricultural production, minimize environmental damage, and for sustainable agricultural development [9]. The analysis of energy balance in agricultural systems can help compare and understand the energy flows and efficiency in agricultural systems, which will also help find ways to save energy [13].
A simple definition of energy balance is “a numerical comparison of the relationship between inputs and outputs” [14]. The widely used method to analyze the energy balance in an agricultural system is the Life Cycle Assessment method (LCA). A commonly used definition of LCA is a “compilation and evaluation of the inputs, outputs, and potential environmental impacts of a product system throughout its life cycle” [14]. There are four main steps: the goal and scope definition, the inventory analysis, the impact assessment, and the interpretation [15]. This approach can be used on a regional, national, and global scale to analyze energy balance in different agricultural systems [16,17]. It can also be used in comparative studies in agriculture such as conventional farming versus organic farming and open field versus control environmental conditions (greenhouse), etc. Climate, water availability, soil characteristics, raw materials, crop biomass, and management practices directly influence the energy balance of the agricultural production system [16,18].
The relationship between energy inputs and outputs in an agricultural system that includes both crop and livestock production has been analyzed previously. Many studies have been conducted in different regions across the world to analyze the energy inputs and outputs in different crop types where most of the energy balances analyzed have been conducted on single crops. For example, the assessment of energy inputs and outputs of fava bean production [19], energy analysis in cassava production [20,21], banana production [22], rice [23,24], cotton [25], tomato [26] and wheat [27] have been reported, and a few studies have been conducted on different cropping systems [28,29]. In addition, many studies have been conducted on the energy balance in livestock production [30,31]. Yan et al. [1], assessed the energy balance of crop and livestock production in the Shihezi Oasis of China. Yan et al. [32], assessed the energy balance of different agricultural production systems in Minqin Oasis, China. However, due to its complexity, limited attention has been received for energy balance studies on both crop and livestock production systems and multiple cropping systems. Energy balance studies in a Sri Lankan context are in the infant stage and energy balance study related decision making is almost non-existent in the Sri Lankan agricultural sector.
Crop diversification has been identified as one of the most cost-effective ways to reduce uncertainties in a farmer’s income, especially among poor smallholder farmers, which will also improve the productivity and the overall sustainability of the farming systems [33,34] under both current and future climates [35]. There is enough evidence to show that the diversification of crops has increased energy efficiency and improved sustainability in different geographical scales [36,37]. Therefore, detailed energy assessments in complex farming systems is important.
The purpose of this study is to promote the diversification of the agricultural system by assessing the energy efficiency of crop and livestock production. Thus, the objective of this study is to evaluate the energy balance of the Faculty of Agricultural Sciences, Sabaragamuwa University of Sri Lanka farm as a case study using the Life Cycle Assessment (LCA) approach. Thus, the total energy inputs and outputs in crop and livestock production in the faculty farm, the Net Energy Ratio (NER), and the energy related water use efficiency of crop production were assessed. The findings of the study are important to adjust the agricultural practices towards the efficiency of the farming system including input management, decision making in crop diversification, and best practices on the farm. This analysis is important to improve an efficient and environmentally friendly production system without wasting money and energy resources. In addition, it will increase energy use efficiency, which is important to achieve the sustainable development goals of the country. Moreover, the study focuses on the introduction of the novel idea of energy balance and the diversification of agricultural systems in Sri Lanka as a valuable tool to achieve sustainability in farming systems.
The manuscript is organized into Section 2 with a site description, data collection, and an overall methodology section. Then, the Section 3 flows on with the results obtained under crop production and livestock production. The Section 4 presents the limitations of the study and the way forward from this research work. Finally, the conclusions are presented from the study.

2. Materials and Methods

2.1. Site Description

The Faculty of Agricultural Sciences farm, Sabaragamuwa University of Sri Lanka (Latitude 5°–7°, Longitude 79°–81°), which is located close to Belihuloya (approximately 160 km away from the capital city of Colombo), was used as the study site due to the availability of good quality farm records. It is located in the Mid Country Intermediate zone of the country where the average annual rainfall is about 1875 mm–2500 mm and the average ambient temperature is 28.3 °C. The total area of the farm is 33 acres (refer to Figure 1). The farm used in this study is a teaching farm, which is mainly used for educational purposes and demonstration while maintaining a steady income from crop and livestock production. The farm consists of both crop and livestock production units. The crop production unit consists of different types of plantation crops (tea, rubber, and coconut), fruit crops, and vegetables. The livestock production unit consists of goat, poultry, broiler, dairy cattle, rabbit, a piggery, and miscellanies units.

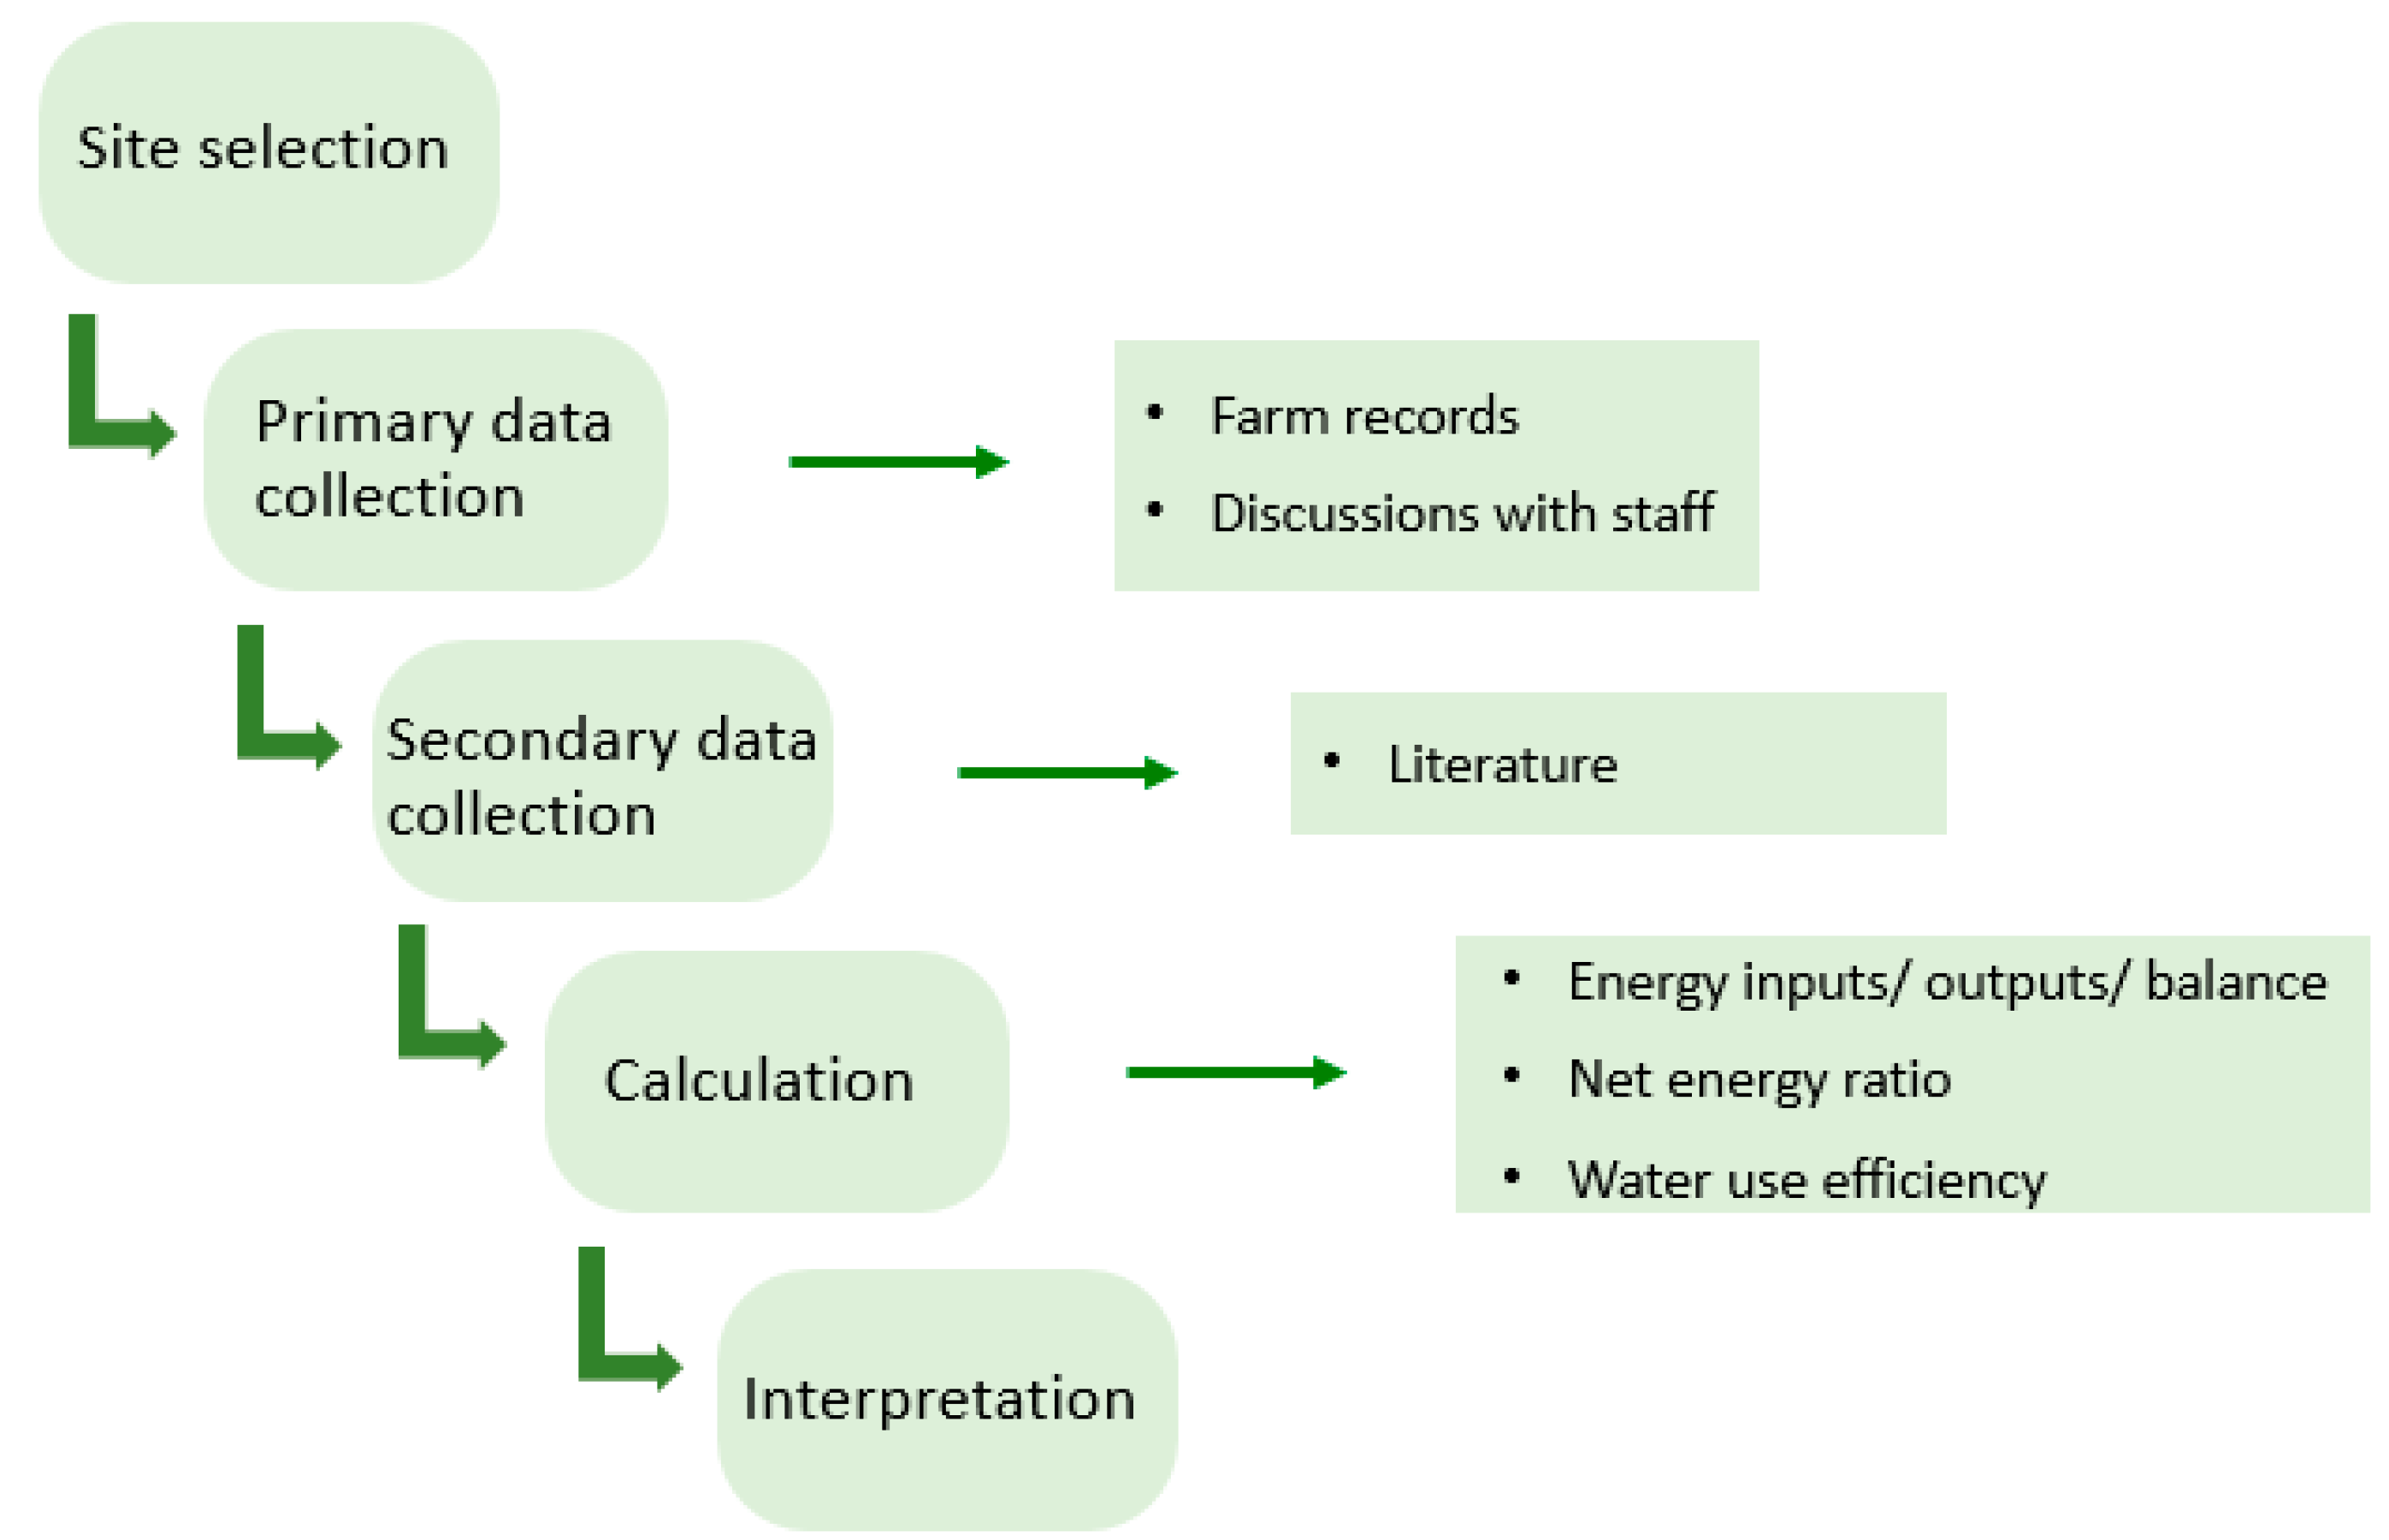
2.2. Data Collection

The primary data for energy input resources and outputs were collected from the official farm records and by contacting farm workers The year 2020 to 2022 production period was considered in this study. The coefficients of energy equivalent factors (secondary data) were collected from previously published literature. The data collected for the inputs of crop production (for each crop) included the following:
  • Type of crops;
  • Cultivated area;
  • Seed rate;
  • Type and rate of fertilizer used;
  • Type and rate of pesticides;
  • Number of laborers and working hours;
  • Fuel consumption for production (ploughing, tillage, and transportation);
  • Electricity consumption for irrigation.
The data collected for the output of crop production included the yield of the crop products and the crop residuals. In this study, 18 crops were selected to analyze the energy balance of crop production in the faculty farm. These crops were banana (Musa sp.), bean (Phaseolus vulgaris L.), cassava (Manihot esculenta), coconut (Cocos nucifera), tea (Camellia sinensis), okra (Abelmoschus esculentus), long bean (Vigna unguiculata), wing bean (Psophocarpus tetragonolobus), cabbage (Brassia oleracea), radish (Raphanus sativus), tomato (Solanum lycopersicum), brinjal (Solanum melongena L.), wild eggplant/elabatu (Solanum insanum), cucumber (Cucumis sativus), snake gourd (Trichosanthes cucumerina), luffa (Luffa aegyptiaca), paddy (Oryza sativa), and maize (Zea maize).
The collected data as inputs of livestock production included the species of livestock, number of animals in each species, number of laborers and working hours, type and amount of feed used, fuel and electricity consumption. The output data included the livestock products (milk, eggs, and meat) and manure. In this study, the cattle, broiler and layer chicken, piggery, goat, and rabbit units were selected to analyze the energy balance in the livestock production.

2.3. Calculation of Energy Balance

Before the calculations, all the collected data went through a rigorous quality check. The number of inputs and outputs in the crop production was calculated on a per hectare per year basis. The input data were multiplied with their respective energy equivalent factors to convert them into the energy value of MJ ha−1 year−1. The number of inputs and outputs in the livestock production was calculated on a per year basis. These data were multiplied with their respective energy equivalent factors to convert them into energy values and expressed in MJ year−1. The Microsoft Excel 2019 package was used for the calculations.

2.3.1. Total Energy Input for Crop Production

The energy inputs of the crop production system in the faculty farm were calculated using Equation (1).
E I c r o p = i = 1 n [ ( C I l , i × E C l , i ) + ( C I s , i × E C s , i ) + ( C I f , i × E C f , i ) + ( C I p , i × E C p , , i ) + ( C I i e , i × E C i e , i ) + ( C I d c , i × E C d c , i ) + ( C I m d , i × E C m d , i ) ]
where E I c r o p , i and n represent the unit area of the total energy inputs for crop production (MJ ha−1), crop type, and the number of crops, respectively. C I is the unit area of energy inputs for crop production, E C is the energy coefficient factor (refer to Table 1), and l , s , f , p , i e , p m , d c and m d represent the inputs of labor (h), seeds (kg), fertilizers (kg), pesticides (kg), electricity consumption for irrigation (kWh), diesel fuel (Liters), and machinery (kg), respectively.

2.3.2. Total Energy Output for Crop Production

The energy outputs for the crop production system in the faculty farm were calculated using Equation (2).
E O c r o p = i = 1 n C Y g r a i n , i × E C g r a i n , i + C Y s t r a w , i × E C s t r a w , i + C Y r o o t , i × E C r o o t , i
where E O c r o p , i , n are the unit area of the total energy outputs from the crop production (MJ ha−1), crop type, and number of crops, respectively. C Y is the unit area of crop yield, E C is the energy coefficient factor (refer to Table 2), and g r a i n , s t r a w and r o o t are the yield crop grain (kg), crop straw (kg), and crop root (kg), of the crop products, respectively.

2.3.3. Total Energy Input for Livestock Production

The energy inputs of livestock production on the farm were calculated using Equation (3).
E I l i v e s t o c k = i = 1 n { [ j = 1 m L I f e e d , j × E C f e e d , j i ] + L I d r u g , i × E C d r u g , i + L I l a b o r , i × E C l a b o r , i + L I e l e c , i × E C e l e c , i }
where E I l i v e s t o c k , i , n , j and m are the total energy inputs for the livestock production (MJ), livestock category, number of livestock in each category, and the classification of feeds and types of feeds, respectively. L I is the unit livestock of energy inputs for livestock production, E C is the energy equivalent factor (refer to Table 3), and C W l i v e s t o c k is the unit livestock of carcass weight. Other than that, d r u g , l a b o r and e l e c are the veterinary drugs (kg), human labor (h), and electricity consumption for the lighting of the housing structures (kWh), respectively.

2.3.4. Total Energy Output for Livestock Production

The energy outputs of the livestock products in the faculty farm were calculated using Equation (4).
E O l i v e s t o c k = i = 1 n ( L Y c a r c a s s , i × E C c a r c a s s , i + L Y m i l k , i × E C m i l k , i + L Y e g g , i × E C e g g , i )
where E O l i v e s t o c k , i , n are the total energy outputs for the livestock production (MJ), livestock category, and number of livestock in each category, respectively. L Y is the unit livestock of yield, and E C is the energy equivalent factors (refer to Table 4). Further, c a r c a s s , m i l k , and e g g s are the carcass weight (kg), milk (kg), and eggs of livestock (kg), respectively.

2.3.5. The Energy Balance and Net Energy Ratio

The energy balances and the net energy ratio of the farm were calculated using Equations (5) and (6), respectively.
E B f a r m = ( E O c r o p + E O l i v e s t o c k ) E I c r o p + E I l i v e s t o c k
N E R f a r m = E O c r o p + E O l i v e s t o c k E I c r o p + E I l i v e s t o c k
where E B f a r m , and N E R f a r m are the respective energy balance (MJ) and the net energy ratio (Output/Input), while E O c r o p , E O l i v e s t o c k , E I c r o p , and E I l i v e s t o c k denote the same parameters in the above equations.

2.3.6. Calculation of Water Use Efficiency Based on Energy

The energy related water use efficiency of crop production on the farm was calculated using Equation (7).
W U E c r o p = E B c r o p W U c r o p
where W U E c r o p is the water use efficiency of crop (MJ m−3), E B c r o p is the energy balance of crop (MJ ha−1) and W U c r o p is the water use of crop (m3 ha−1).

2.4. Overall Methodology

Figure 2 showcases the overall methodology followed in this study using a flowchart. Site selection, primary data collection, and secondary data collection were the main initial steps that were carried out. The collected data were processed to calculate the energy balance, net energy ratio, and water use efficiency. Finally, the results were interpreted according to their physical importance.

3. Results

3.1. Crop Production

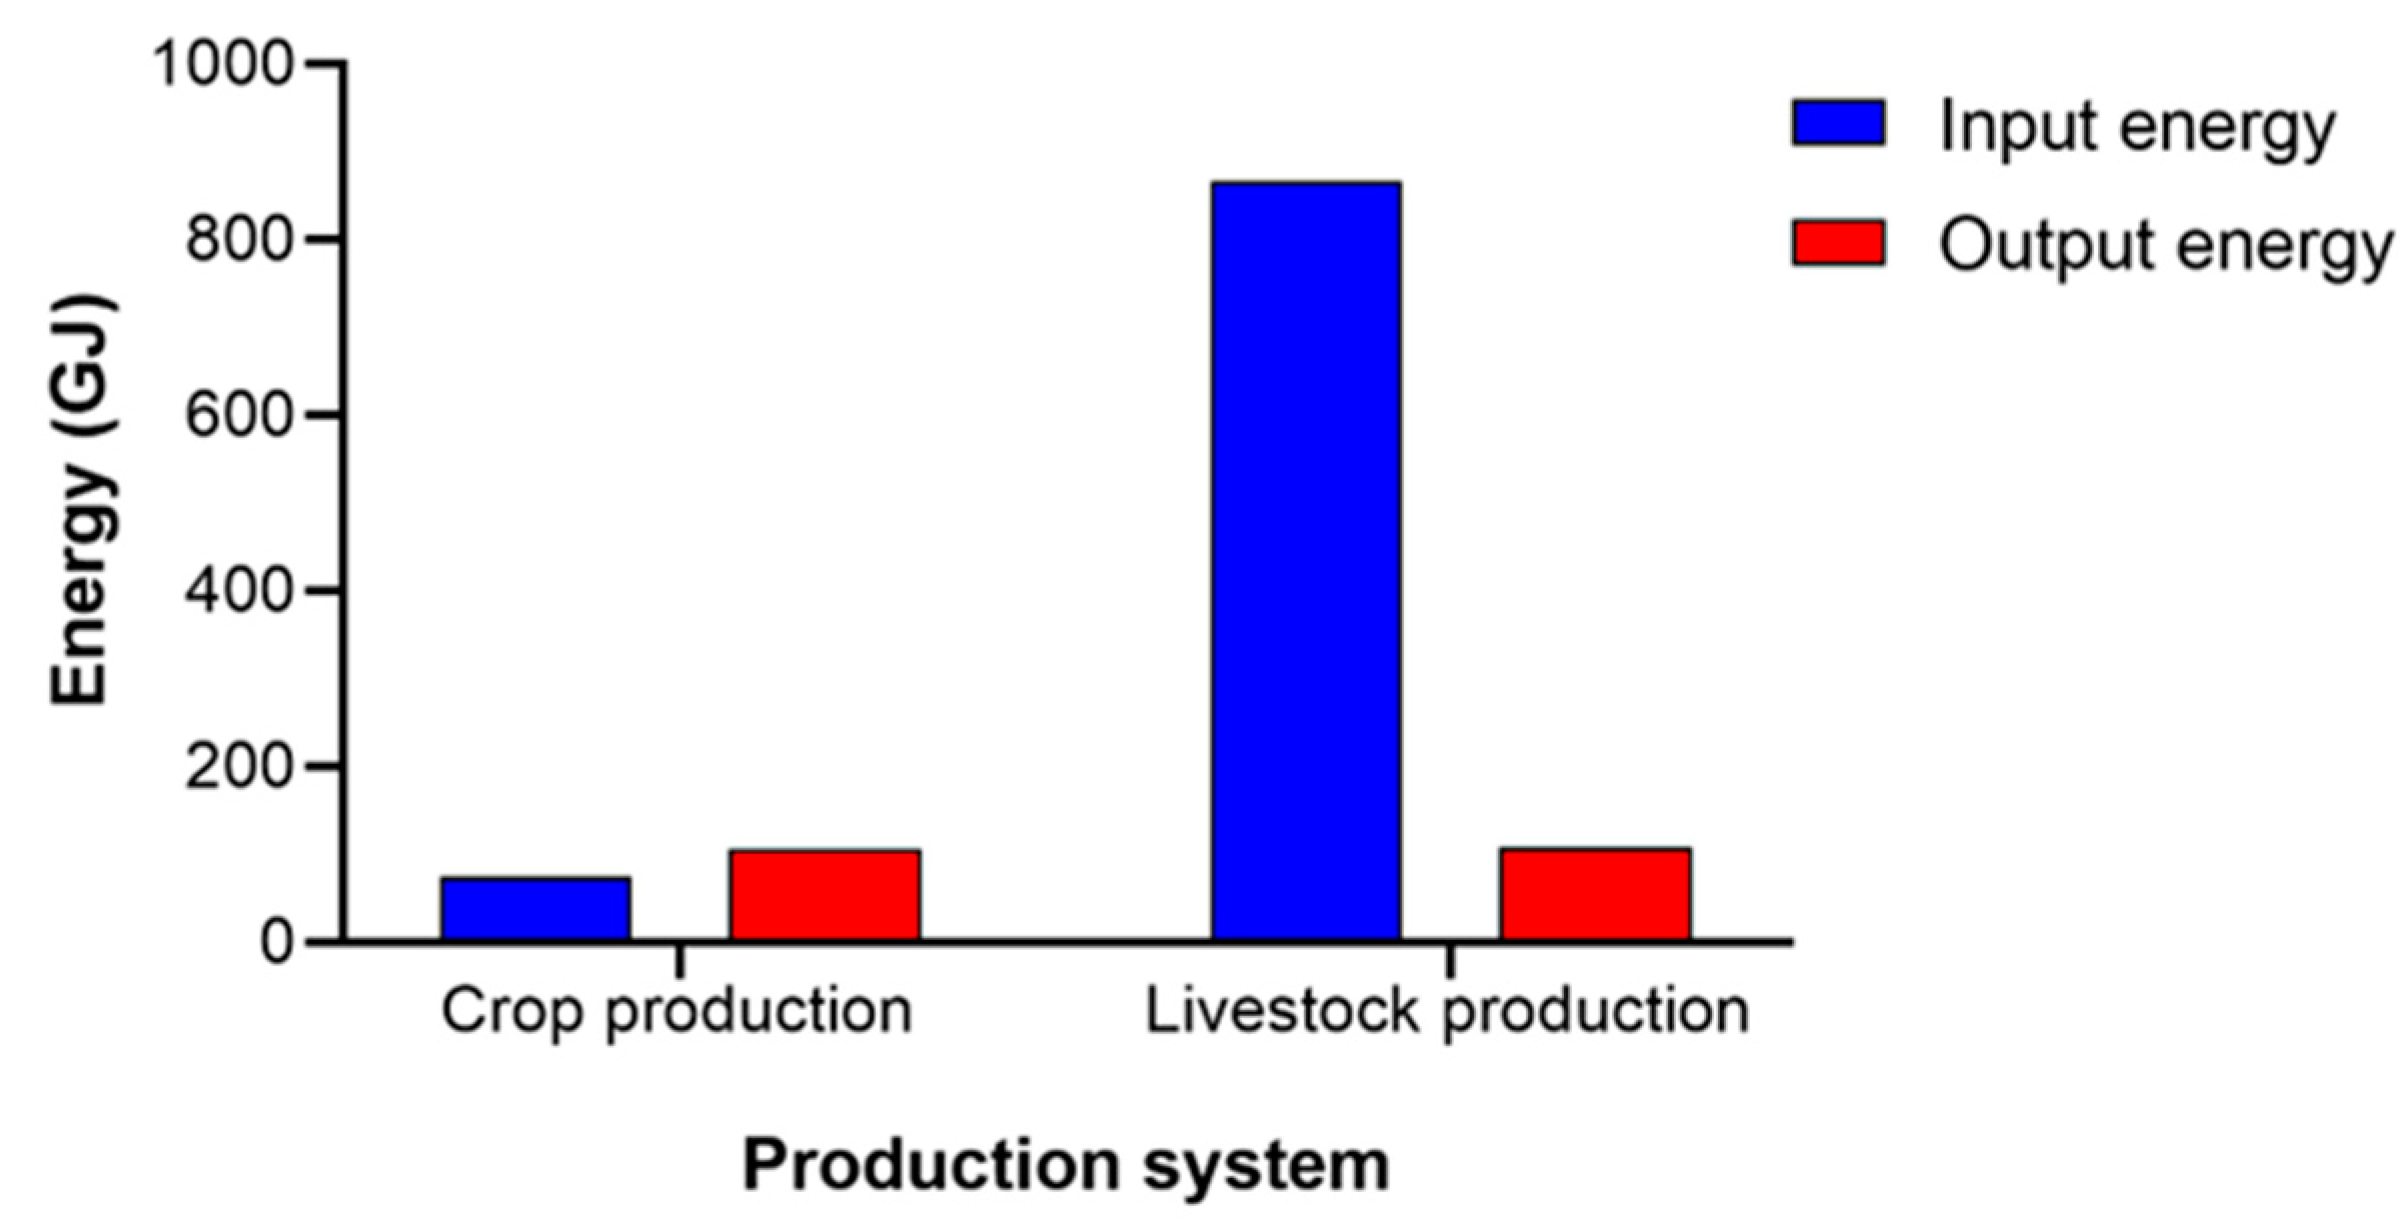
3.1.1. Energy Inputs and Energy Outputs

Table 5 shows the average total energy input and output per hectare per year in crop production on the farm from the year 2020 to 2022. The total average energy input for crop production was 400,241.30 MJ ha−1 year−1 (75,706.30 MJ year−1), and total average energy output of crop production on the farm was 717,106.56 MJ ha−1 year−1 (107,055.74 MJ year−1).
The input and output energy values for crop production indicated that the energy output of crop production is 1.79 times higher than that of the total energy input, which means that crop production in the faculty farm was energy efficient (refer to Figure 3). Out of the selected crops, the highest total energy inputs were for cabbage production (34,686.35 MJ ha−1 year−1) followed by radish and tomato. Energy consumed for human labor and fertilizer application was responsible for the higher energy consumption in cabbage production. The lowest total energy input was for banana cultivation (830.12 MJ ha−1 year−1). In addition, coconut produced the highest energy (199,901.95 MJ ha−1 year−1), and snake gourd produced the lowest energy of all other crops in the studied farm. The input (3311.41 MJ ha−1 year−1) and output (4000.00 MJ ha−1 year−1) energy of tea was comparatively lower than the other annual and perennial crops (Table 5).

3.1.2. Energy Balance and Net Energy Ratio (NER)

The results of the total energy balance, net energy ratio, and the water use efficiency for crop production on the farm from 2020 to 2022 are presented in Table 6. For crop production, the energy balance, net energy ratio, and water use efficiency were −31.35 GJ, 1.71, and −31.35 MJ m−3, respectively. For livestock production, the energy balance and net energy ratio were 758.73 GJ, and 0.13, respectively. The total energy input of the overall farm was 943.14 GJ Year−1. The NER of the overall farm was 0.23.

3.2. Livestock Production

Total Energy Inputs and Outputs in Livestock Production

The total average amount of energy input and output of livestock production on the farm are given in Table 7. The total average energy consumed for livestock production (input) was 867,437 MJ Year−1. The total average energy produced from livestock production (output) on the farm was 108,702.97 MJ Year−1. The highest and lowest energy inputs on the farm were from cattle (415,127.57 MJ Year−1) and rabbits (25,272.6 MJ Year−1). The highest energy output from the livestock sector was from broilers (44,666.42 MJ Year−1). The input and output energy values of livestock production indicated that the energy output of livestock production is 7.98 times lower than that of the total energy input, which means the livestock production on the farm was not energy efficient and needs attention and development.

3.3. The Energy Balance, the Net Energy Ratio, and WUE Based on Energy

The energy balance, net energy ratio, and water use efficiency of the studied farm are shown in Table 6. According to the results, the energy balance, net energy ratio, and WUE (crop) of the faculty farm were 740.6 GJ, 0.23, and −31.35 MJ m−3, respectively.

4. Discussion

4.1. Crop Production

The crop-related total energy inputs and outputs on the farm were comparable to those published elsewhere in the world assessed using a similar approach. For example, the total energy used in cassava production on the faculty farm was 8602.22 MJ ha−1 while the output energy was 31,490.65 MJ ha−1. In similar studies, Adekanye et al. [54] calculated 36,482.8 MJ ha−1 as the energy input and 179,326.8 MJ ha−1 as the energy output for cassava production in Nigeria. Chamsing et al. [55] reported 4950 MJ ha−1 input energy for cassava production in Thailand. These variations in results may be due to differences in the number of inputs used in cassava production, which depends on the technology used in different geographic scales. The average total energy consumed for tomato production per hectare per year was determined as 23,752 MJ ha−1 while the output energy per hectare per year was determined as 21,838 MJ ha−1. In similar studies, Çetin and Vardar [56] determined 45,530 MJ ha−1 as the energy input for tomato production in Turkey. In another study, in Iran, Moghaddam et al. [26] calculated the total energy used in open field tomato production was 47,647.1 MJ ha−1 while the total energy output in the open field per hectare was 67,729.3 MJ ha−1. As mentioned previously, variations can be expected among different locations.
The total average energy used in the cultivation of rice is 9451.98 MJ ha−1 and the average output energy from rice grain and straw was 18,600.57 MJ ha−1. Yadav et al. [57] estimated 3338.984 MJ ha−1 as the energy inputs while 25,594.8 MJ ha−1 were the energy outputs for rice cultivation. Wakil et al. [58] determined the total average energy used and produced in rice cultivation as 36,397.85 MJ ha−1 and 89,996.57 MJ ha−1, respectively. The total average input and output energy of maize production (10,603.19 MJ ha−1 and 63,892.98 MJ ha−1, respectively) on the faculty farm was lower than the input (76,500 MJ ha−1) and output energy (201,000 MJ ha−1) of maize production in Minqin Oasis, China [32].
The amount of pesticide usage, electricity consumption for irrigation, and machine energy usage for land preparation was not recorded crop-wise in the studied farm. Therefore, the total energy inputs of pesticides, electricity consumption for irrigation, and machine energy used for land preparation were calculated by considering all of the crops cultivated on the farm during the examined period. Therefore, in the calculation process, pesticide energy, electricity consumption for irrigation, and machine energy used for land preparation were not calculated crop-wise. Thus, this may be the reason for the lower total energy inputs of different crops than the total energy inputs of other farms in the world.
The crop-related net energy ratio on the farm is much lower than the net energy ratio of the crop production system in China and Turkey (1.09 and 1.18, respectively). In a similar study in China, the net energy ratio of crop production (5.24) was higher than the farm net energy ratio of the crop production system due to high crop yield as the output (Table 8).

4.2. Livestock Production

The present total energy inputs and outputs of livestock production on the farm are within the acceptable limit when compared to published information in several other countries using the same methodology. For example, the total energy inputs and outputs of livestock production (867.43 GJ and 108.72 GJ, respectively) on the faculty farm are much higher than those (201 GJ and 153 GJ, respectively) estimated using life cycle assessment methodology in China [32]. In the current study, cattle, goat, poultry (layer and broiler), pig, and rabbit production were considered for the calculations. However, the composition of the livestock species and the management methods are different in other farms, which causes the difference in energy inputs and outputs.
The livestock-related net energy ratio on the farm was 0.13, which indicates the inefficient use of energy inputs in livestock production. If the NER value is high, it shows a better production system in terms of energy use. When compared with the previous literature, the net energy ratio of livestock production is comparatively low. For example, the net energy ratio of livestock production (0.13) on the faculty farm is lower than that (0.63) of livestock production in China [32]. If the NER values are less than 1, this indicates an energy deficit because the output energy is less than the input energy. Normally, animal production is a double energy transformation process. First, soil nutrients and solar energy are converted into biomass by green plants and only a small portion of the energy is used to produce products, such as meat, milk, and eggs [11].

4.3. Limitations

One of the major reasons for the lower energy efficiency of the study farm is because it is a teaching farm that is not mainly business oriented. Production and harvesting can be lower compared to commercial farms because the students are involved in these activities most of the time. Since the energy levels of individual categories were identified from this study, necessary actions can be taken to minimize the losses and increase the efficiencies. The lack of a proper record-keeping system in the studied site, to measure some inputs and outputs, is another limitation. In this case, the recommended values from the Department of Agriculture Sri Lanka were used in the calculations.

4.4. Way Forward

The procedure followed in this study can be used to evaluate the energy balance of diversified agricultural systems, which is important for agricultural sustainability. Based on the energy balance of individual crops and livestock species, decisions can be made in order to minimize losses and maximize savings. Therefore, this process acts as a decision-support tool in agricultural diversification and sustainability. This procedure can be further developed to assess the carbon footprint in agricultural systems. The procedure should be repeated in different farming systems in different agricultural regions of the country to further fine-tune the approach required to obtain better results in a Sri Lankan context. Assessing the energy balance in other farming systems, such as commercial, intensive farms using more crop and livestock types, is also expected.
In addition, data collection can be improved by introducing UAVs and drones to assess the farmlands [59,60]. More accurate data can be gathered using new techniques used in agriculture. Furthermore, such technological improvements can lead to energy efficiencies in a world with higher energy demands [61]. This helps in reducing fossil fuel usage and directly helps to reduce emissions [62].

5. Conclusions

The amount of input and output energy, energy balance, net energy ratio in crop and livestock production, and water use efficiency in crop production, in a multiple cropping and animal rearing farm were evaluated using a life cycle assessment approach. According to the assessment, the total energy input, total energy output, energy balance, and NER on the farm were 956.36 GJ, 215.76 GJ, 740.6 GJ, and 0.23, respectively. According to the results, the crop production system on the farm shows a negative energy balance (−31.35 GJ), which indicates good energy efficiency in crop production. The energy balances for livestock production and the overall farm show a positive energy balance (758.73 GJ and 740.6 GJ, respectively), which suggests an improvement in energy efficiency for livestock production is required. The data will be used to assess the carbon footprint in agricultural systems.

Author Contributions

Conceptualization, H.N. and E.M.W.; methodology, S.D. and H.N.; software, S.D.; validation, H.N.; formal analysis, S.D.; data curation, S.D.; writing—original draft preparation, S.D.; writing—review and editing, H.N., M.B.G., U.R. and E.M.W.; visualization, S.D.; supervision, H.N. and E.M.W.; project administration, U.R. and E.M.W. All authors have read and agreed to the published version of the manuscript.

Funding

This research received no external funding.

Data Availability Statement

The data used in this study can be obtained upon request from the corresponding author.

Acknowledgments

The authors wish to thank the farm staff and all who helped to conduct this study.

Conflicts of Interest

The authors declare no conflict of interest.

Abbreviations

KPotassium
LCALife cycle assessment
NNitrogen
NERNet energy ratio
PPhosphorus
SDGsSustainable Development Goals
WUSWater use efficiency

References

  1. Yan, Z.; Hou, F.; Hou, F. Energy Balances and Greenhouse Gas Emissions of Agriculture in the Shihezi Oasis of China. Atmosphere 2020, 11, 781. [Google Scholar] [CrossRef]
  2. Paris, B.; Vandorou, F.; Balafoutis, A.T.; Vaiopoulos, K.; Kyriakarakos, G.; Manolakos, D.; Papadakis, G. Energy Use in Open-Field Agriculture in the EU: A Critical Review Recommending Energy Efficiency Measures and Renewable Energy Sources Adoption. Renew. Sustain. Energy Rev. 2022, 158, 112098. [Google Scholar] [CrossRef]
  3. Mathur, S.; Waswani, H.; Singh, D.; Ranjan, R. Alternative Fuels for Agriculture Sustainability: Carbon Footprint and Economic Feasibility. AgriEngineering 2022, 4, 993–1015. [Google Scholar] [CrossRef]
  4. Khoshroo, A.; Emrouznejad, A.; Ghaffarizadeh, A.; Kasraei, M.; Omid, M. Sensitivity Analysis of Energy Inputs in Crop Production Using Artificial Neural Networks. J. Clean. Prod. 2018, 197, 992–998. [Google Scholar] [CrossRef]
  5. Wang, X. Managing Land Carrying Capacity: Key to Achieving Sustainable Production Systems for Food Security. Land 2022, 11, 484. [Google Scholar] [CrossRef]
  6. United Nations. The 17 Goals. Available online: https://sdgs.un.org/goals (accessed on 24 January 2023).
  7. Kennedy, S. Energy Use in American Agriculture; Massachusetts Institute of Technology: Cambridge, MA, USA, 2000; pp. 1–26. [Google Scholar]
  8. Saleem, M. Possibility of Utilizing Agriculture Biomass as a Renewable and Sustainable Future Energy Source. Heliyon 2022, 8, e08905. [Google Scholar] [CrossRef]
  9. Esengun, K.; Gündüz, O.; Erdal, G. Input–Output Energy Analysis in Dry Apricot Production of Turkey. Energy Convers. Manag. 2007, 48, 592–598. [Google Scholar] [CrossRef]
  10. Khaledian, M.R.; Mailhol, J.C.; Ruelle, P.; Mubarak, I.; Perret, S. The Impacts of Direct Seeding into Mulch on the Energy Balance of Crop Production System in the SE of France. Soil Tillage Res. 2010, 106, 218–226. [Google Scholar] [CrossRef]
  11. Frorip, J.; Kokin, E.; Praks, J.; Poikalainen, V.; Ruus, A.; Veermäe, I.; Lepasalu, L.; Schäfer, W.; Mikkola, H.; Ahokas, J. Energy Consumption in Animal Production—Case Farm Study. Agron. Res. 2012, 10, 39–48. [Google Scholar]
  12. Elahi, E.; Zhang, Z.; Khalid, Z.; Xu, H. Application of an Artificial Neural Network to Optimise Energy Inputs: An Energy- and Cost-Saving Strategy for Commercial Poultry Farms. Energy 2022, 244, 123169. [Google Scholar] [CrossRef]
  13. Eurostat Energy Balance Guide. Methodology Guide for the Construction of Energy Balances & Operational Guide for the Energy Balance Builder Tool; Eurostat: Luxembourg, 2019. [Google Scholar]
  14. ISO SO 14040:2006; Environmental Management—Life Cycle Assessment—Principles and Framework. ISO/TC 207/SC 5 Life Cycle Assessment. International Organization for Standardization: Geneva, Switzerland, 2006; p. 28.
  15. Ximenes, F.D.A. Life Cycle Assessment—Principles, Practice and Prospects. Austral Ecol. 2010, 35, 117–118. [Google Scholar] [CrossRef]
  16. Abbas, A.; Zhao, C.; Waseem, M.; Ahmed Khan, K.; Ahmad, R. Analysis of Energy Input–Output of Farms and Assessment of Greenhouse Gas Emissions: A Case Study of Cotton Growers. Front. Environ. Sci. 2022, 9, 826838. [Google Scholar] [CrossRef]
  17. Drosou, F.; Kekes, T.; Boukouvalas, C. Life Cycle Assessment of the Canned Fruits Industry: Sustainability through Waste Valorization and Implementation of Innovative Techniques. AgriEngineering 2023, 5, 395–412. [Google Scholar] [CrossRef]
  18. Yu, L.; Liu, S.; Wang, F.; Liu, Y.; Li, M.; Wang, Q.; Dong, S.; Zhao, W.; Tran, L.-S.P.; Sun, Y.; et al. Effects of Agricultural Activities on Energy-Carbon-Water Nexus of the Qinghai-Tibet Plateau. J. Clean. Prod. 2022, 331, 129995. [Google Scholar] [CrossRef]
  19. Alhajj Ali, S.; Tedone, L.; Verdini, L.; De Mastro, G. Implications of No-Tillage System in Faba Bean Production: Energy Analysis and Potential Agronomic Benefits. Open Agric. J. 2018, 12, 270–285. [Google Scholar] [CrossRef]
  20. Bamgboye, A.I.; Kosemani, B.S. Energy Input in the Production of Cassava. Energy Environ. Res. 2015, 5, 42. [Google Scholar] [CrossRef]
  21. Olaniran, J.A.; Jekayinfa, S.O.; Adekanye, T.A. Energy Consumption and Environmental Burden Analysis of Cassava Tuber Production in Ogbomoso Southwest Nigeria. IOP Conf. Ser. Earth Environ. Sci. 2020, 445, 012062. [Google Scholar] [CrossRef]
  22. Akcaoz, H. Analysis of Energy Use for Banana Production: A Case Study from Turkey. Afr. J. Agric. Res. 2011, 6, 5618–5624. [Google Scholar] [CrossRef]
  23. Bautista, E.G.; Minowa, T. Analysis of the Energy for Different Rice Roduction Systems in the Philippines. Philipp. Agric. Sci. 2010, 93, 322–333. [Google Scholar]
  24. Kosemani, B.S.; Bamgboye, A.I. Energy Input-Output Analysis of Rice Production in Nigeria. Energy 2020, 207, 118258. [Google Scholar] [CrossRef]
  25. Polat, R.; Copur, O.; Saglam, R.; Saglam, C. Energy Use Pattern and Cost Analysis of Cotton Agriculture: A Case Study for Sanliurfa, Turkey. Philipp. Agric. Sci. 2006, 89, 368–371. [Google Scholar]
  26. Moghaddam, P.R.; Feizi, H.; Mondani, F. Evaluation of Tomato Production Systems in Terms of Energy Use Efficiency and Economical Analysis in Iran. Not. Sci. Biol. 2011, 3, 58–65. [Google Scholar] [CrossRef]
  27. Yuan, S.; Peng, S.; Wang, D.; Man, J. Evaluation of the Energy Budget and Energy Use Efficiency in Wheat Production under Various Crop Management Practices in China. Energy 2018, 160, 184–191. [Google Scholar] [CrossRef]
  28. Kheiry, A.N.O.; Dahab, M.H. Energy Input-Output Analysis for Production of Selected Crops in the Central Clay Vertisols of Gezira Agricultural Scheme (Sudan). IJSR 2016, 5, 1215–1220. [Google Scholar] [CrossRef]
  29. Ozkan, B.; Akcaoz, H.; Fert, C. Energy Input–Output Analysis in Turkish Agriculture. Renew. Energy 2004, 29, 39–51. [Google Scholar] [CrossRef]
  30. Heidari, M.D.; Omid, M.; Akram, A. Energy Efficiency and Econometric Analysis of Broiler Production Farms. Energy 2011, 36, 6536–6541. [Google Scholar] [CrossRef]
  31. Hosseinzadeh-Bandbafha, H.; Safarzadeh, D.; Ahmadi, E.; Nabavi-Pelesaraei, A. Optimization of Energy Consumption of Dairy Farms Using Data Envelopment Analysis—A Case Study: Qazvin City of Iran. J. Saudi Soc. Agric. Sci. 2018, 17, 217–228. [Google Scholar] [CrossRef]
  32. Yan, Z.; Li, W.; Yan, T.; Chang, S.; Hou, F. Evaluation of Energy Balances and Greenhouse Gas Emissions from Different Agricultural Production Systems in Minqin Oasis, China. PeerJ 2019, 7, e6890. [Google Scholar] [CrossRef]
  33. Barman, A.; Saha, P.; Patel, S.; Bera, A.; Barman, A.; Saha, P.; Patel, S.; Bera, A. Crop Diversification an Effective Strategy for Sustainable Agriculture Development; IntechOpen: London, UK, 2022; ISBN 978-1-80355-697-0. [Google Scholar]
  34. Hufnagel, J.; Reckling, M.; Ewert, F. Diverse Approaches to Crop Diversification in Agricultural Research. A Review. Agron. Sustain. Dev. 2020, 40, 14. [Google Scholar] [CrossRef]
  35. Wimalasiri, E.M.; Jahanshiri, E.; Perego, A.; Azam-Ali, S.N. A Novel Crop Shortlisting Method for Sustainable Agricultural Diversification across Italy. Agronomy 2022, 12, 1636. [Google Scholar] [CrossRef]
  36. Rahman, S.; Kazal, M.M.H. Whether Crop Diversification Is Energy Efficient: An Empirical Analysis from Bangladesh. Renew. Sustain. Energy Rev. 2015, 45, 745–754. [Google Scholar] [CrossRef]
  37. Martey, E. Empirical Analysis of Crop Diversification and Energy Poverty in Ghana. Energy Policy 2022, 165, 112952. [Google Scholar] [CrossRef]
  38. Pérez-Neira, D.; Schneider, M.; Armengot, L. Crop-Diversification and Organic Management Increase the Energy Efficiency of Cacao Plantations. Agric. Syst. 2020, 177, 102711. [Google Scholar] [CrossRef]
  39. Alletto, L.; Vandewalle, A.; Debaeke, P. Crop Diversification Improves Cropping System Sustainability: An 8-Year on-Farm Experiment in South-Western France. Agric. Syst. 2022, 200, 103433. [Google Scholar] [CrossRef]
  40. Koocheki, A.; Ghorbani, R.; Mondani, F.; Alizade, Y.; Moradi, R. Pulses Production Systems in Term of Energy Use Efficiency and Economical Analysis in Iran. Int. J. Energy Econ. Policy 2011, 1, 95–106. [Google Scholar]
  41. Malunjkar, V.S.; Balakrishnan, P.; Deshmukh, S.K.; Dugad, S.B. Energy Efficiency of Banana (Musa sp.) Crop under Different Irrigation Methods. Int. J. Innov. Technol. Explor. Eng. 2015, 4, 43–47. [Google Scholar]
  42. Tuti, M.D.; Prakash, V.; Pandey, B.M.; Bhattacharyya, R.; Mahanta, D.; Bisht, J.K.; Kumar, M.; Mina, B.L.; Kumar, N.; Bhatt, J.C.; et al. Energy Budgeting of Colocasia-Based Cropping Systems in the Indian Sub-Himalayas. Energy 2012, 45, 986–993. [Google Scholar] [CrossRef]
  43. Banzon, J.A. The Coconut as a Renewable Energy Source. Philipp. J. Coconut Stud. 1980, 5, 11–27. [Google Scholar]
  44. Mihov, M.; Antonova, G.; Masheva, S.; Yankova, V. Energy Assessment of Conventional and Organic Production of Head Cabbage. Bulg. J. Agric. Sci. 2012, 18, 320–324. [Google Scholar]
  45. Zhanbota, A.; Noor, R.S.; Wang, G.Y. Yield, Energy and Economic Analysis of Greenhouse Cucumber (Cucumis Sativus L.) Production under Different Farming Treatments. THE JAPS 2020, 31, 509–521. [Google Scholar] [CrossRef]
  46. Fazeli, M. Energy Balance in IPM Rice Farms Compared to Conventional Farms. Ann. Agrar. Sci. 2017, 15, 287–293. [Google Scholar] [CrossRef]
  47. Soheilifard, F.; Salvatian, S. Forecasting of Tea Yield Based on Energy Inputs Using Artificial Neural Networks (A Case Study: Guilan Province of Iran). Biol. Forum Int. J. 2015, 7, 1432–1438. [Google Scholar]
  48. Baran, M.F.; Oguz, H.I.; Gokdogan, O. Determination of Energy Input-Output Analysis in Plum (Prunus Domestica L.) Production. Erwerbs-Obstbau 2017, 59, 331–335. [Google Scholar] [CrossRef]
  49. Paramesh, V.; Parajuli, R.; Chakurkar, E.B.; Sreekanth, G.B.; Kumar, H.B.C.; Gokuldas, P.P.; Mahajan, G.R.; Manohara, K.K.; Viswanatha, R.K.; Ravisankar, N. Sustainability, Energy Budgeting, and Life Cycle Assessment of Crop-Dairy-Fish-Poultry Mixed Farming System for Coastal Lowlands under Humid Tropic Condition of India. Energy 2019, 188, 116101. [Google Scholar] [CrossRef]
  50. Sefeedpari, P. Assessment and Optimization of Energy Consumption in Dairy Farm: Energy Efficiency. IJEE 2012, 3, 213–224. [Google Scholar] [CrossRef]
  51. Meul, M.; Nevens, F.; Reheul, D.; Hofman, G. Energy Use Efficiency of Specialised Dairy, Arable and Pig Farms in Flanders. Agric. Ecosyst. Environ. 2007, 119, 135–144. [Google Scholar] [CrossRef]
  52. Clark, S.; Khoshnevisan, B.; Sefeedpari, P. Energy Efficiency and Greenhouse Gas Emissions during Transition to Organic and Reduced-Input Practices: Student Farm Case Study. Ecol. Eng. 2016, 88, 186–194. [Google Scholar] [CrossRef]
  53. Dalle Zotte, A. Rabbit Farming for Meat Purposes. Anim. Front. 2014, 4, 62–67. [Google Scholar] [CrossRef]
  54. Adekanye, T.A. Analysis of Energy Uses in Cassava Production in North-Central Nigeria. Agric. Eng. Int. CIGR J. 2020, 22, 98–104. [Google Scholar]
  55. Chamsing, A.; Salokhe, V.M.; Singh, G. Consumption Analysis for Selected Crops in Different Regions of Thailand. Agric. Eng. Int. CIGR J. 2006, VIII, 1–18. [Google Scholar]
  56. Çetin, B.; Vardar, A. An Economic Analysis of Energy Requirements and Input Costs for Tomato Production in Turkey. Renew. Energy 2008, 33, 428–433. [Google Scholar] [CrossRef]
  57. Yadav, S.N.; Chandra, R.; Khura, T.K.; Chauhan, N.S. Energy Input–Output Analysis and Mechanization Status for Cultivation of Rice and Maize Crops in Sikkim. Agric. Eng. Int. CIGR J. 2013, 15, 108–116. [Google Scholar]
  58. Wakil, M.; Ibrahim, A.; Umar, A.S.S.; Bukar, G. Analysis of Energy Input-Output of Irrigated Rice Production in Jere Bowl Borno State, Nigeria. Afr. J. Agric. Res. 2018, 13, 1661–1666. [Google Scholar] [CrossRef]
  59. Gul, O.M.; Erkmen, A.M.; Kantarci, B. UAV-driven sustainable and quality-aware data collection in Robotic Wireless Sensor Networks. IEEE Internet Things J. 2022, 9, 25150–25164. [Google Scholar] [CrossRef]
  60. Gul, O.M.; Erkmen, A.M. Energy-efficient cluster-based data collection by a UAV with a limited-capacity battery in Robotic Wireless Sensor Networks. Sensors 2020, 20, 5865. [Google Scholar] [CrossRef]
  61. Praveenkumar, S.; Agyekum, E.B.; Kumar, A.; Velkin, V.I. Thermo-Enviro-Economic Analysis of solar photovoltaic/thermal system incorporated with U-shaped grid copper pipe, thermal electric generators and nanofluids: An experimental investigation. J. Energy Storage 2023, 60, 106611. [Google Scholar] [CrossRef]
  62. PraveenKumar, S.; Agyekum, E.B.; Kumar, A.; Velkin, V.I. Performance evaluation with low-cost aluminum reflectors and phase change material integrated to solar PV modules using natural air convection: An experimental investigation. Energy 2023, 266, 126415. [Google Scholar] [CrossRef]
Figure 1. Location of the farm of the Faculty of Agricultural Sciences, Sabaragamuwa University of Sri Lanka (Source: Google Earth—https://earth.google.com/web/, accessed on 19 May 2023).
Agriengineering 05 00059 g001
Figure 2. Graphical flowchart of the approach used in this study.
Agriengineering 05 00059 g002
Figure 3. Total energy input and output in crop and livestock production on the farm during the 2020–2022 period.
Agriengineering 05 00059 g003
Table 1. Factors used to calculate the energy inputs in crop production.
InputEnergy Equivalent (MJ Unit−1)References
Human labor (h)1.96[36]
Electricity (kWh)11.93[22,37]
Diesel fuel (l)47.8[38]
Tractor (kg)93.61[39]
Fertilizers (kg)Nitrogen (N)75.46[40]
Phosphorus (P)13.07[40]
Potassium (K)11.15[40]
Manure0.3[22]
Agro Chemicals (kg)Herbicide238[41]
Insecticide238[41]
Fungicide92[41]
Stalk (kg)Cassava5.6[19]
Seeds (kg)Okra0.8[42]
Luffa1.0[43]
Bean14.9[40]
Long bean14.9[40]
Cabbage0.8[42]
Radish0.8[42]
Chili1.0[44]
Tomato1.0[44]
Brinjal0.8[44]
Wing bean25.0[45]
Cucumber1.0[43]
Ela batu1.0[44]
Snake gourd1.0[43]
Paddy14.57[46]
Maize104.65[32]
Table 2. Factors used for the calculation of the energy outputs in crop production.
Output (in kg)Energy Equivalent
(MJ Unit−1)
References
Bean grain yield14.9[40]
Bean straw yield12.5[40]
Banana yield11.8[41]
Banana stem yield18[41]
Banana leaves yield10[41]
Okra yield1.9[42]
Okra Straw yield10[42]
Coconut yield58.525[43]
Husk yield16.736[43]
Cassava yield5.6[20]
Cassava stem5.6[20]
Cabbage yield1.2[44]
Cabbage residual yield10[42]
Radish yield1.6[42]
Long bean grain yield14.9[40]
Long bean straw yield12.5[40]
Cucumber yield0.8[45]
Cucumber residuals7.5[45]
Brinjal yield0.8[42]
Brinjal residuals yield10[42]
Chili yield0.8[45]
Chili residuals yield10[42]
Tomato yield0.8[42]
Tomato residuals yield10[42]
Maize grain yield18.26[32]
Maize straw yield15.22[32]
Wing bean yield14.7[40]
Wing bean residuals yield12.5[40]
Rice grain yield14.57[46]
Rice straw yield12.5[46]
Ela batu yield0.8[42]
Ela batu residuals yield10[42]
Tea leaves yield0.8[47]
Snake gourd yield0.8[45]
Snake gourd straw yield7.5[45]
Luffa Yield0.8[45]
Luffa residuals yield7.5[45]
Table 3. Factors used for the calculation of the energy inputs in livestock production.
InputUnitEnergy Equivalent
(MJ Unit−1)
References
Human laborh1.96[48]
ElectricitykWh11.93[22,41]
Diesel fuelL47.8[28]
Chickkg10.33[49]
FeedForage (silage)kg2.2[50]
Concentratekg6.3[49]
Pig growerkg3.4[51]
Saw feedkg3.7[51]
Vitamin/Mineralkg1.59[49]
Table 4. Factors used for the calculation of the energy outputs in livestock production.
OutputsUnitsEnergy Equivalent
(MJ Unit−1)
References
Manurekg0.3[49]
CattleMilkkg7.14[49]
BroilerMeatkg10.33[49]
PiggeryMeatkg9.8[52]
LayerEggskg7.28[49]
Meatkg10.33[49]
Weightkg10.7[49]
RabbitWeightkg6.03[53]
Table 5. Average total energy inputs and outputs in crop production.
Input Energy (MJ ha−1 Year−1)Output Energy (MJ ha−1 Year−1)Area (ha)Input Energy (MJ Year−1)Output
(MJ Year−1)
Pesticide---128.11-
Machine Energy151,570.03-0.3857,141.90-
(land preparation)-----
Electricity for Irrigation20,244.85-0.448907.73-
Bean14,868.8983,272.210.03446.072498.17
Banana830.1258,344.820.17141.129918.62
Okra20,957.1426,460.880.02482.01608.60
Coconut8482.09199,901.950.403392.8479,960.78
Casava8602.2231,490.650.06516.131889.44
Cabbage34,686.3515,241.000.01242.80106.69
Radish25,768.2918,749.330.01257.68187.49
Long bean12,778.46103,818.850.01166.121349.64
Brinjal5828.4620,436.360.10582.852043.64
Tomato23,753.0021,838.000.051068.88982.71
Maize10,603.1963,892.980.09954.295750.37
Wing bean5422.8023,714.870.03173.53758.88
Rice9451.9818,600.570.01122.88241.81
Eggplant11,577.205141.700.0192.6241.13
Tea3311.414000.000.07231.80280.00
Snake gourd8011.713094.450.03272.40105.21
Luffa7756.834508.930.0169.8140.58
Cucumber15,736.2814,599.030.02314.73291.98
Total400,241.30717,106.56-75,706.30107,055.74
Table 6. Energy indices of crop and livestock production.
Crop ProductionLivestock ProductionOverall Farm
Total Energy Inputs (GJ Year−1)75.71
(400.24 MJ/ha/year)
867.44943.14
Total Energy Outputs (GJ Year−1)107.06
(717.11 MJ/ha/year)
108.70215.76
Energy Balance (GJ Year−1)−31.35758.73727.38
NER1.710.130.23
WUE (MJ m−3)−31.35
Table 7. Average total energy inputs and outputs in livestock production.
Energy Inputs (MJ Year−1)Energy Outputs (MJ Year−1)
Cattle415,127.570724,830.33
Broiler87,008.5244,666.42
Layer130,516.4130,461.38
Piggery39,842.834615.65
Goat116,603.7763147.53
Rabbit25,272.6981.66
Total867,437.00108,702.97
Table 8. Comparison of the NER of crop production with verified recent similar work.
Study AreaInput (MJ/ha)Output
(MJ/ha)
NERReferences
Faculty Farm75.71107.061.41
China63.870.41.09[1]
China273.691433.765.24[32]
Turkey47.455.81.18[29]
Disclaimer/Publisher’s Note: The statements, opinions and data contained in all publications are solely those of the individual author(s) and contributor(s) and not of MDPI and/or the editor(s). MDPI and/or the editor(s) disclaim responsibility for any injury to people or property resulting from any ideas, methods, instructions or products referred to in the content.

