1. Introduction
The agricultural sector has been increasingly challenged to feed the rising population, where there is a clear need for the optimization and sustainable intensification of global crop production [
1]. However, the conventional means of agriculture relies upon manual labor, which is not only physically intensive [
2], but also expensive [
3] to carry out. During this digital era, agriculture has continued to evolve toward the use of data-driven technologies, often involving the use of geographic positioning systems (GPS), geographical information systems (GIS), and precision agriculture (PA) to inform seeding and harvesting practices, as well as the application of agricultural inputs [
4].
Precision agriculture constitutes a suite technology that can capture and analyze field data to inform the targeted management of farms while increasing cost-efficiency and productivity, and minimizing environmental impacts [
5]. For example, the real-time and site-specific management of cultivated lands can lead to productivity growth by using PA technologies for the targeted application of agrochemicals at optimal frequencies and amounts [
5]. Another technological development has been the advent of agricultural robots or ‘agrobots’, which may assist farmers with a wide range of operations, such as weeding, pest control, and crop harvesting [
6].
One important area of research in PA involves digital image analysis, which provides the means to detect, recognize, and describe objects to support management decisions [
7]. These image processing techniques are often based on the color, shape, and geometric features of target objects. Depending on the need to acquire real-time farm data, digital image analysis techniques may be used in applications, such as crop row detection, canopy measurement, weed detection, fruit sorting, and grading; the monitoring of plant growth, and fruit defects; and the measurement of vegetative indices [
8,
9]. However, the use of image processing techniques for the discrimination of crops and weeds based on color, shape, and texture, may be computationally complex and unsuitable for real-time field applications due to the limitations caused by computational time [
10]. Burgos-Artizzu et al. [
10] also described the economic cost as another obstacle to the commercialization of real-time weed or crop detection systems.
To address these limitations, on-board processing systems based on field programmable gate arrays (FPGAs) are reconfigurable, lightweight, and may be used for real-time object identification and tracking [
11,
12,
13,
14,
15]. FPGAs are flexible and may be integrated into a wide range of devices, and they reduce the amount of hardware and increase the cost-effectiveness of systems [
14]. Furthermore, FPGAs are also described as reconfigurable hardware because the same device may be reused by downloading a new program for different purposes. FPGAs only require hours to carry out the design-implement-test-debug cycle; in comparison, application-specific integrated circuit (ASIC) designs require days to complete all the processing [
13,
14]. Lastly, their ability to implement parallel processing ensures that multiple local operations may be carried out simultaneously [
14] and applied to image processing techniques, as described by Price et al. [
15].
FPGA implementations do not have widespread acceptance in the vision community yet [
14], although a few studies have included vehicle identification systems [
16], real-time license plate localization systems [
17], and human presence detection systems [
16]. In addition, they have been tested across a wide range of low-resolution dimensions; for example, 180 × 180 px to 600 × 600 px [
15], 128 × 128 px [
11], 256 × 256 px [
13], and 640 × 480 px [
17,
18]; however, there is the potential for FPGAs to be applicable to higher-resolution imagery compared to VGA (640 × 480). Hence, the development of real-time image acquisition and processing systems based on FPGA hardware for crop monitoring purposes is the major focus of this research. As the first step of the development, we started with an 800 × 600 resolution for the verification of system fabrication while aiming to extend up to 4-k images in the next step.
From the literature review of current image processing techniques in PA, it was found that processing images on-board while collecting images has some computational limitations [
10,
19]. While FPGA hardware provides the flexibility to perform both operations on a single processor [
16,
17], it has not been tested on agricultural crop monitoring applications yet [
20,
21,
22]. Therefore, this study proposes an FPGA-based image processing (FIP) system with multiple operational blocks, as a prototype, to perform higher-resolution crop monitoring than VGA that is computationally efficient. The specific objectives of this study are as follows: (1) to design the high-resolution FIP system; (2) to develop a system for transferring the processed image data in real-time; and (3) to evaluate the performance of the FIP system in both a lab and outdoor environment using reference camera systems.
2. Materials and Methods
To summarize the methods of this study, image acquisition was performed using a mobile industry processor interface (MIPI)-based D8 M camera board (Terasic Inc.; Hsinchu City, Taiwan), with a resolution of 800 × 600 px. The captured imagery was processed using a DE2-115 FPGA development board (Terasic Inc.; Hsinchu City, Taiwan) from the Altera Cyclone IV FPGA family (Intel Inc.; Santa Clara, CA, USA). Real-time processing utilized various module blocks of the Altera Cyclone IV processor, which applied three different color ratio filters and a threshold filter. The processed data consisted of the number of pixels detected, whereby the detected pixel area was transferred to another computing device, in real-time, by following a serial communication protocol. The performance of the proposed system was evaluated both in the lab and outdoor environment, where the real-time data were compared with manually processed images of the same target, captured by a DSLR camera as a reference for the lab environment, and a web camera as a reference for the outdoor environment.
2.1. Overview of the FIP System
An Altera Cyclone IV FPGA device with a DE2-115 development board was selected as the main controller of the total system. It had a universal serial bus (USB) blaster (onboard) port to download programs for specific applications. Furthermore, a part of the 2 MB static random-access memory (SRAM) and 128 MB synchronous dynamic random-access memory (SDRAM) memory buffers were used primarily to store the camera sensor outputs that needed to be processed. In addition, a few pushbuttons and slide switches were used to control the algorithms for image processing. To display the processed image, a video graphics array (VGA) and 8-bit high-speed triple digital-to-analog converter (DAC) integrated circuits (ICs) with a VGA-out connector were used as output pipelines. A Recommended Standard 232 (RS232) transceiver IC with a 9-pin connector and flow control was used to transfer the detected pixel area in real-time. Another important component of the DE2-115 development board was a 40-pin expansion header with diode protection and a General-Purpose Input/Output (GPIO) interface to communicate with the camera board.
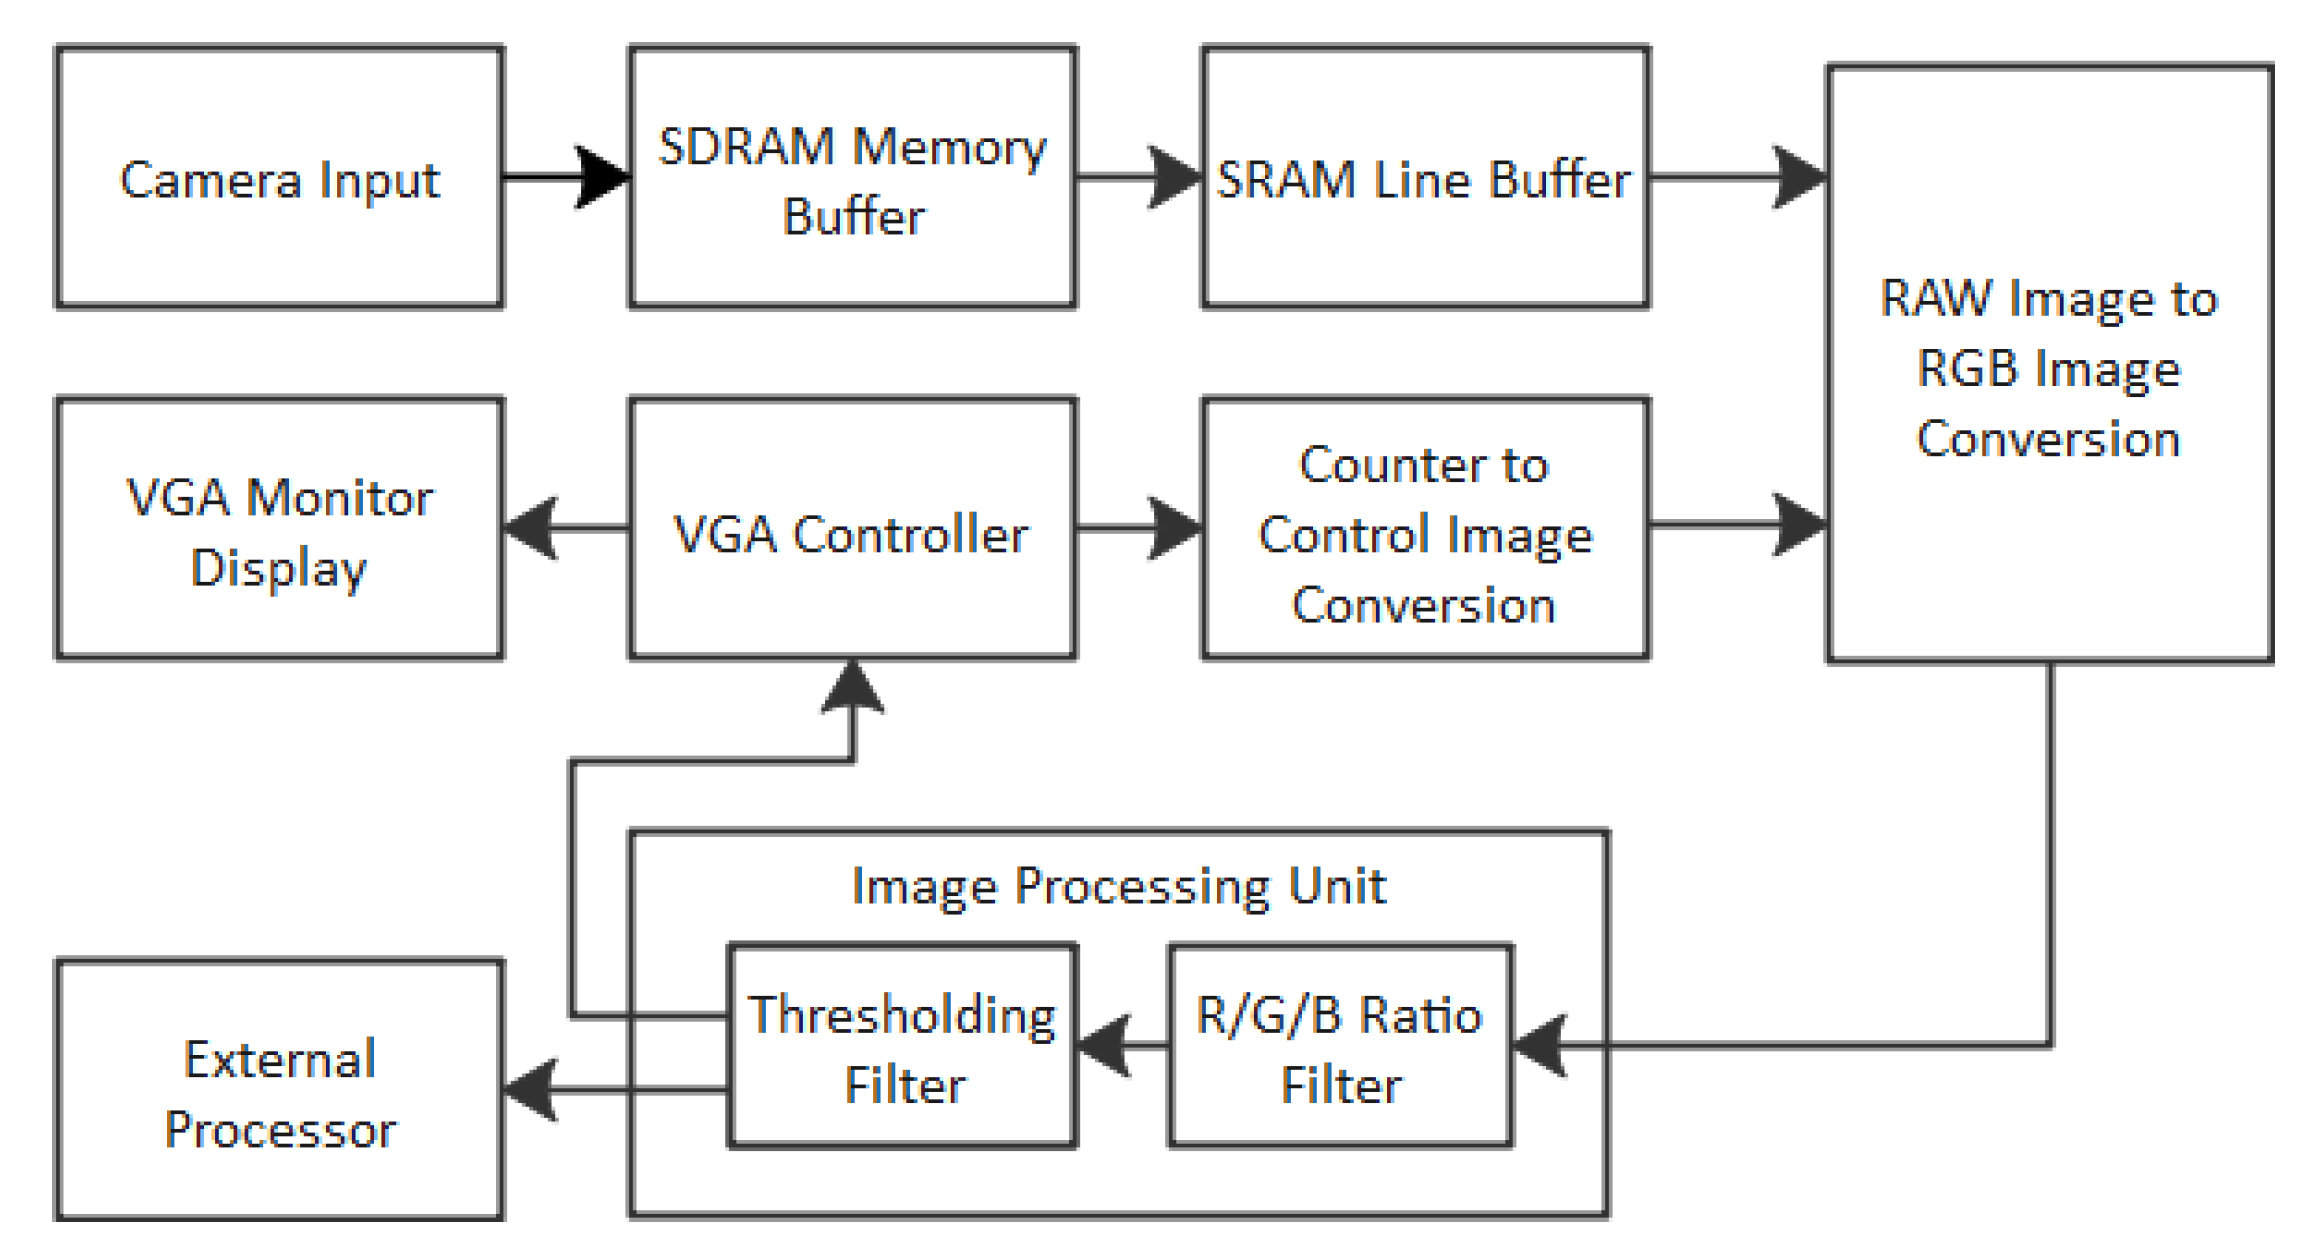
The overall functionality of this FIP system is summarized in
Figure 1. Firstly, the system acquired real-time camera sensor input by using look-up tables. Following this, the 10-bit serial image stream was written to the SDRAM memory buffer and read using an application-specific image resolution mask. The read image frame from the memory buffer was then buffered again using horizontal and vertical control signals in the SRAM line buffer. Next, a high-level control signal was used to convert the raw 10-bit image data from the line buffer into a 24-bit RGB image. To read pixels within the image frame, the control signal depended on the VGA clock, vertical synchronization signal, and read request control signal generated from the VGA controller system.
The image processing unit utilized the 24-bit RGB images and processed them in two steps by using the R/G/B ratio filter and the thresholding filter. As the image processing system used three different basic color detection algorithms (R-ratio, G-ratio, and B-ratio filters), a switching logic was developed with the combination of four switches from the development board to provide four different output images. Finally, the processing unit provided two different outputs: the original or binary images on the VGA monitor; and the number of pixels, detected as red, green, or blue, to the external computing device for data analysis.
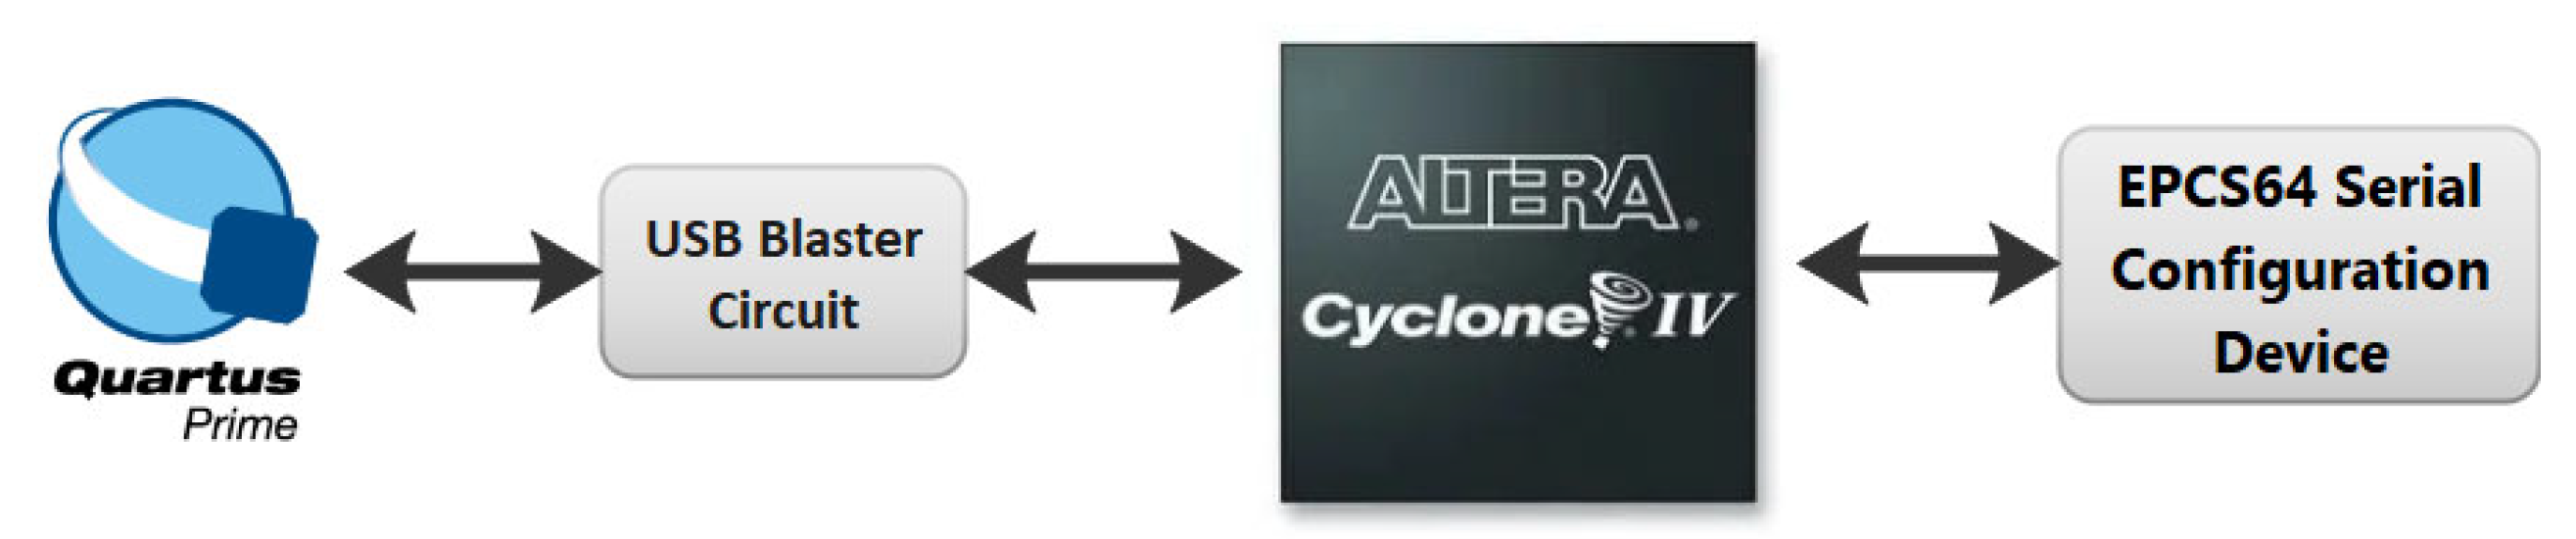
The software packages were used to design, program, and extract the image data needed for developing the FIP system (
Figure 2). Once the design was completed, the Quartus Prime (Intel Inc.; Santa Clara, CA, USA) software was used to generate an SRAM object file (SOF) in a file directory. The SOF contained the data for configuring all the SRAM-based Altera devices, supported by the Quartus Prime software. The USB blaster circuitry provided the program download interface to the Altera device’s processor using a Type A-B USB cable. Finally, the FPGA hardware was configured to the developed design by using the Programmer Tool.
2.2. Fabrication of System
2.2.1. Image Acquisition Unit
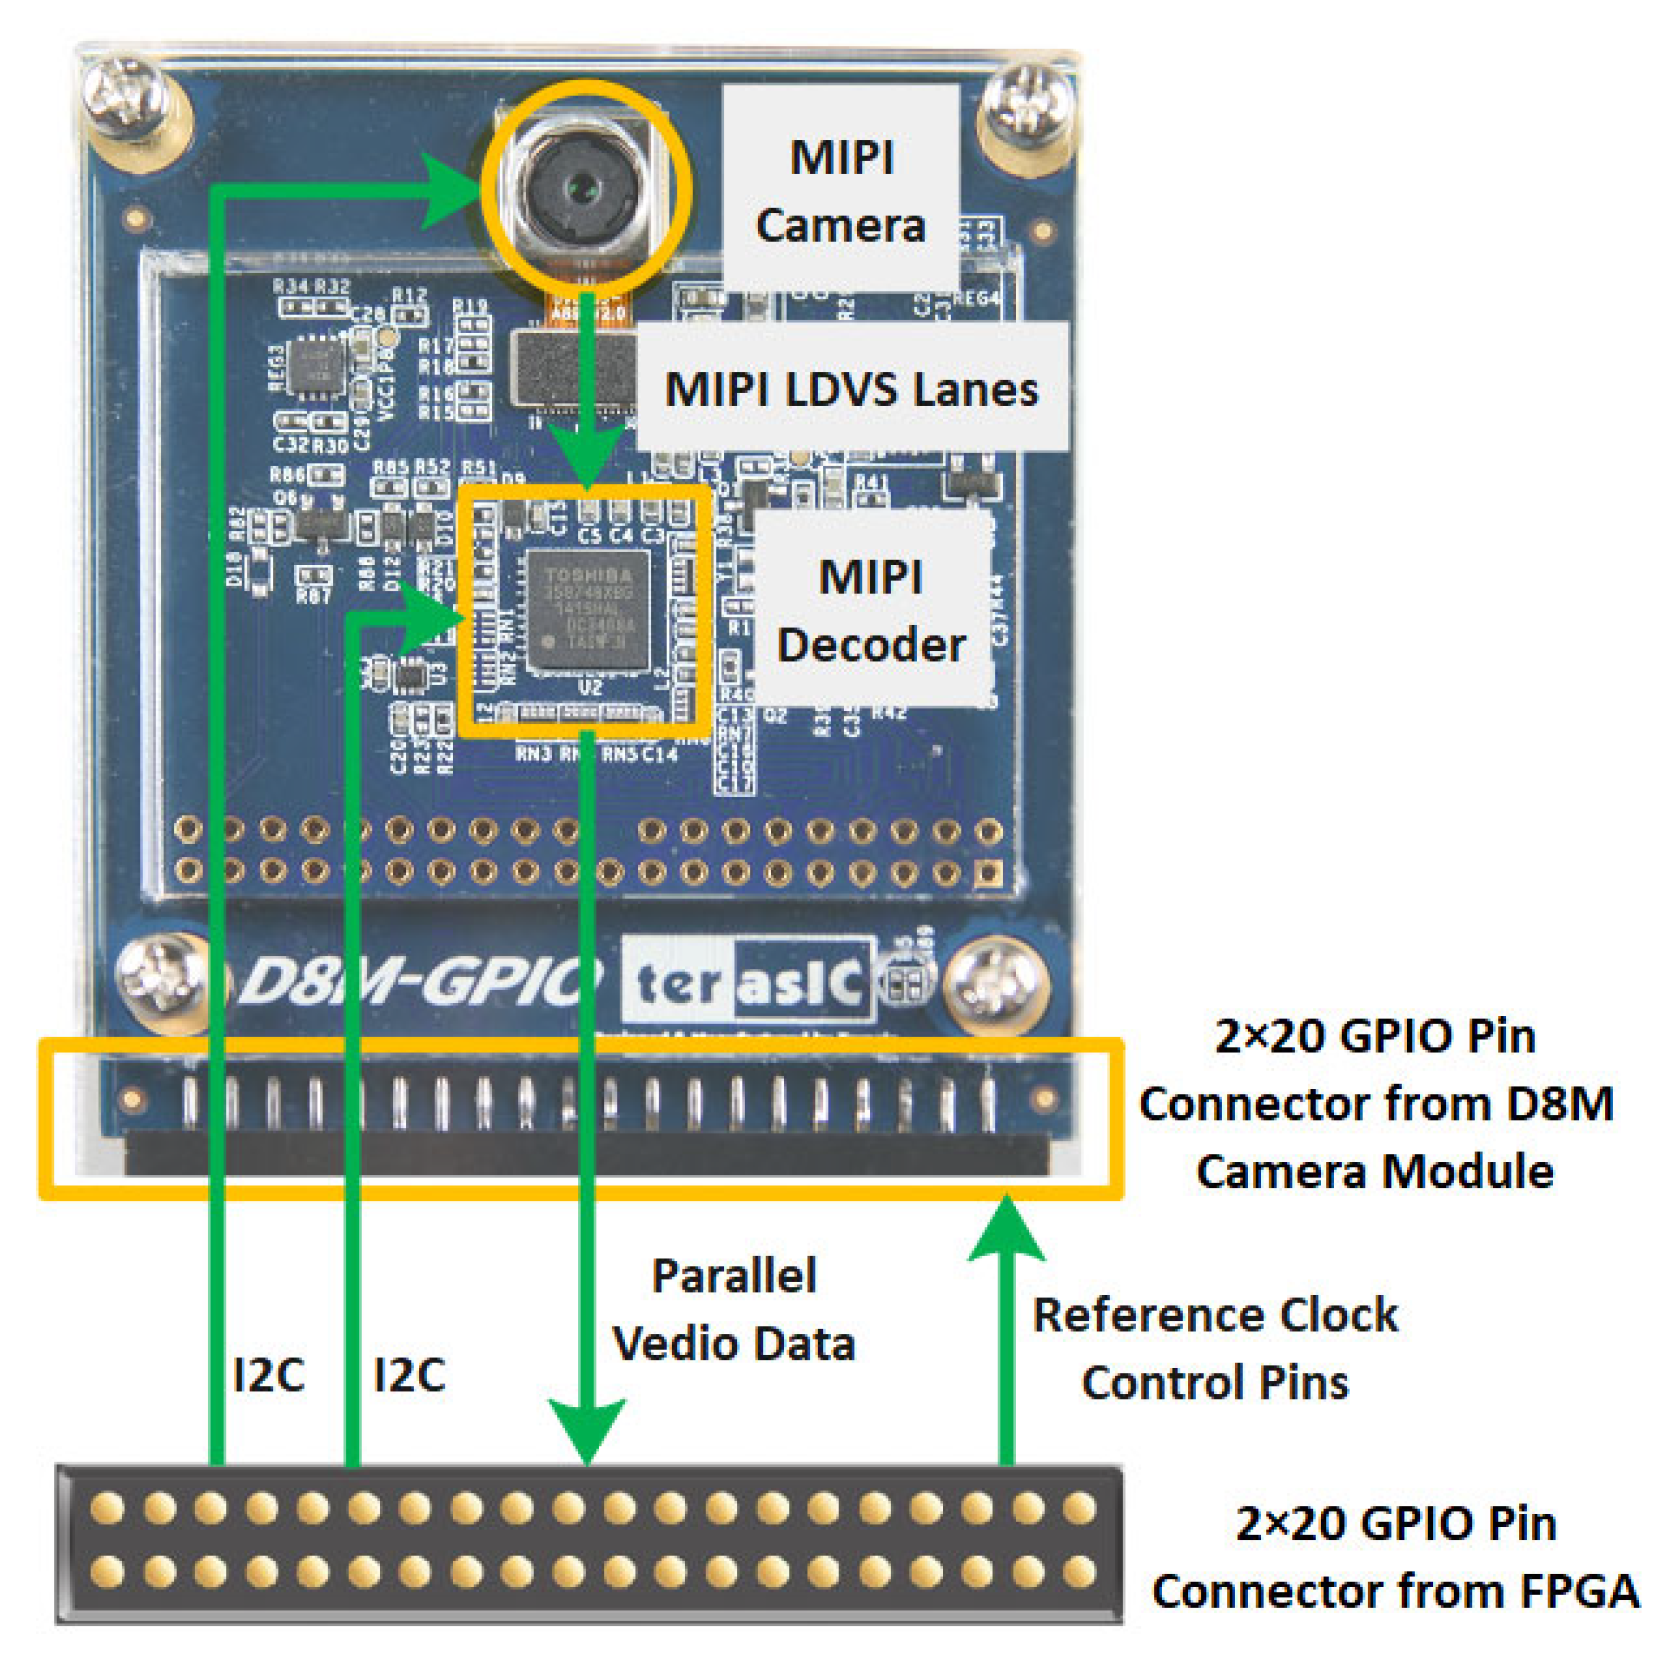
The image acquisition hardware consisted of a digital camera development package (
Figure 3), D8 M, which included an MIPI camera module, and an MIPI decoder that provided 10-bit parallel Bayer pattern image data. The MIPI camera module outputted 4 lanes of MIPI interface image data, which could be converted to parallel data by passing through the MIPI decoder IC to the GPIO interface. The D8 M board was connected to the DE2-115 FPGA development board via a 2 × 20 GPIO pin connector. Both the MIPI camera module and MIPI decoder of the D8 M camera were controlled by the FPGA using an inter-integrated circuit (I2 C) communication protocol.
The D8 M board was equipped with an MIPI image sensor, OV8865, with a lens size of 1/3.2” and pixel size of 1.4 × 1.4 μm (OmniVision Inc.; Santa Clara, CA, USA). The OV8865 sensor could acquire an RGB image with a 70° view angle. It should be noted that the sensor had additional flexibility in acquiring imagery at multiple resolutions using the windowing and cropping functions, while maintaining the corresponding field of view.
For programming the real-time image acquisition unit, the Verilog programming language was used in the Quartus Prime Lite 18.0 software tool. To change the output image resolutions, the OV8865 needed to be configured via I2 C so the camera could output the desired image format. Furthermore, the analog gain, digital gain (i.e., red, green, and blue channel gain), and exposure gain were chosen by several experiments and adjustments for the required 800 × 600 px resolution. The required clock frequency needed for the acquisition of the imagery was determined by adjusting the parameters from the Quartus Prime’s IP resources. For this study, an output clock of 40 MHz was used to achieve the acquisition of 800 × 600 px resolution imagery at 40 frames per second.
2.2.2. Image Processing Unit
The image processing hardware consisted of the DE2-115 development board. No additional hardware was used for the processing except for the image processing filter pipeline between the raw image to RGB converter and the VGA display controller. The raw image to RGB converter received a 10-bit raw image output from the D8 M camera board and converted that into 24-bit RGB images.
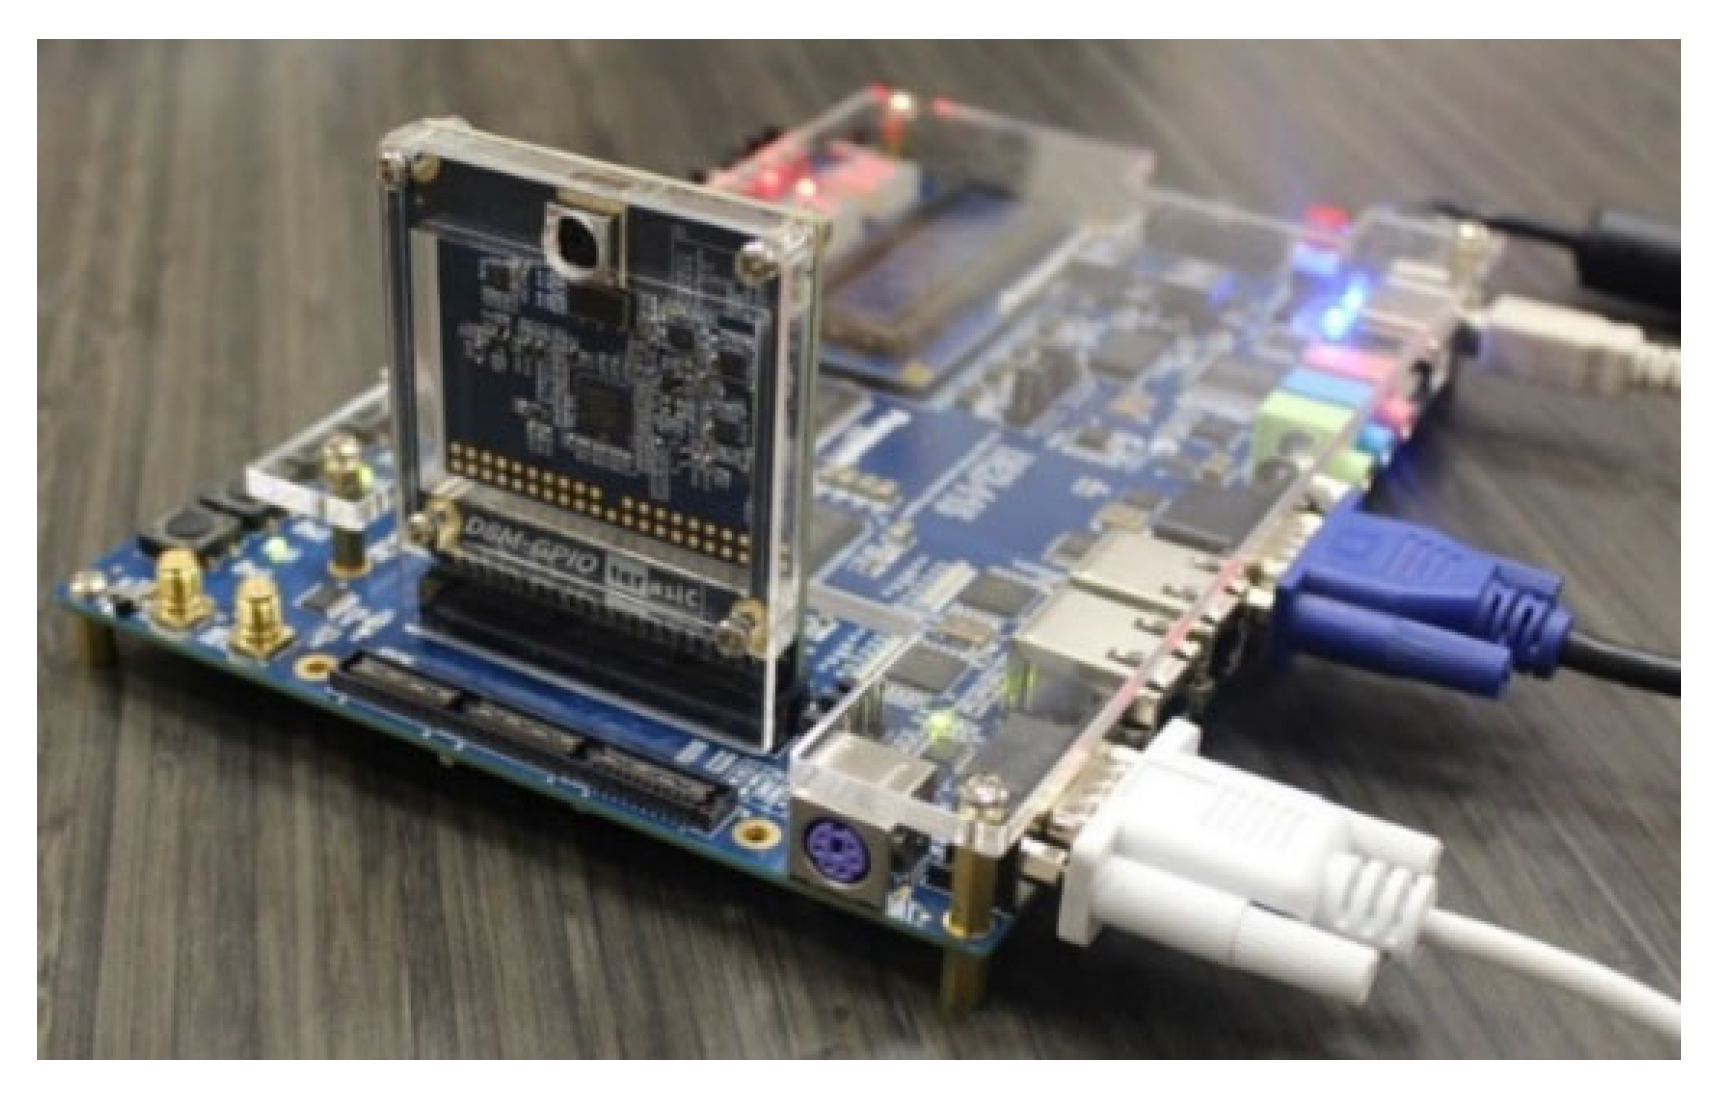
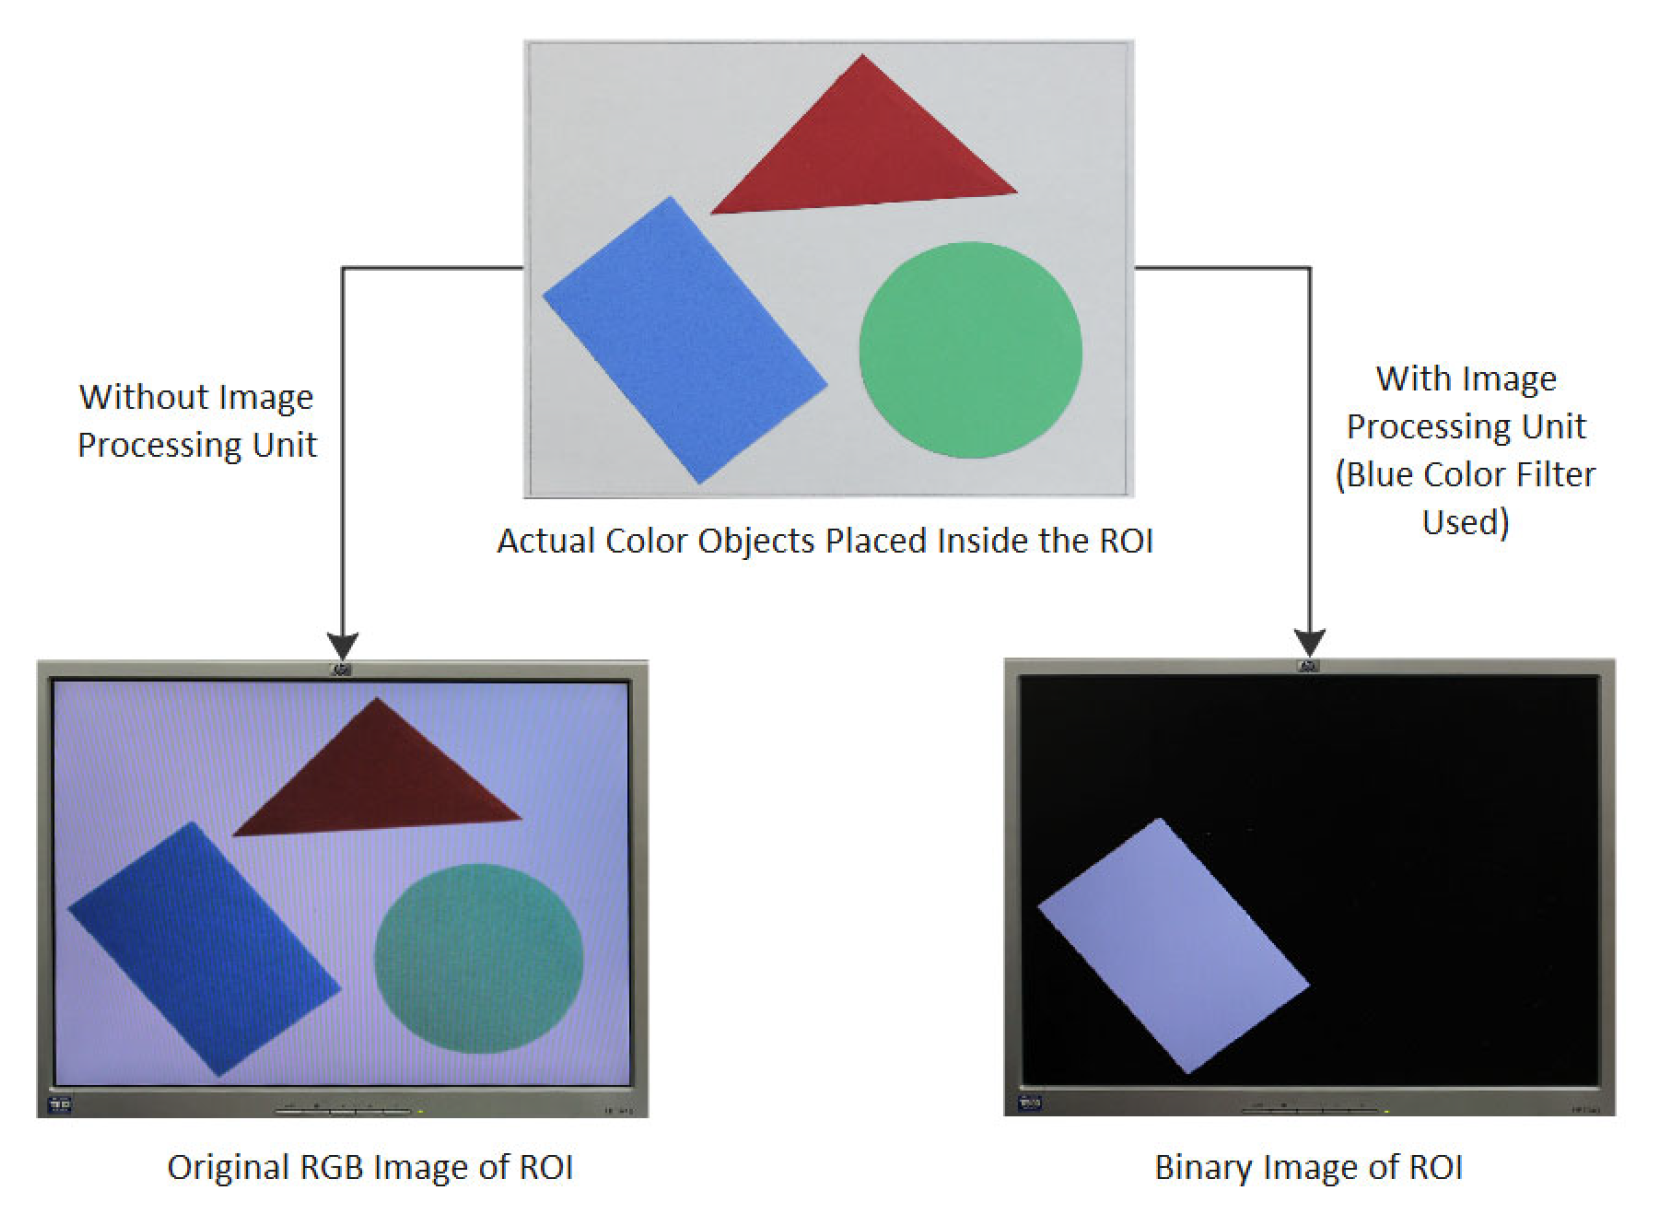
After establishing the communication between the D8 M camera board and the DE2-115 FPGA board (
Figure 4), the raw image was converted to RGB image data, consisting of three different color components (i.e., red, green, and blue) using a high-level logic control derived from the VGA display controller module. These three-color components were used to display the original RGB image of the object, which was placed in front of the D8 M camera board and viewed on the VGA display monitor. The image processing unit inputted the 24-bit RGB image data (i.e., 8-bit R component, 8-bit G component, and 8-bit B component of the color image) and applied the color ratio filters (R-ratio, G-ratio, or B-ratio) followed by a threshold filter on the R, G, and B color components. However, only one out of four processing operations (i.e., original RGB image; binary image of red objects; binary image of green objects; and binary image of blue objects) could be performed at a time using the developed switching logic. A sample of the original object, its original RGB image, and the detected binary image is shown in
Figure 5.
Previous studies have used the following G-ratio formula: (255 × G)/(R+G+B) for 24-bit RGB image analysis from wild blueberry fields for the spot-application of herbicide [
23]. Therefore, the formula was modified to perform an R-ratio and B-ratio filter analysis as follows: (255 × R)/(R+G+B) and (255 × B)/(R+G+B), respectively. A threshold of intensity 90 was selected for each of the color ratio filters to produce the binary image with the detected area as white by setting the processed R, G, and B output color components (Ro, Bo, and Go) at the maximum intensity, 255. Lastly, the final formulas for the real-time image processing unit for the three-color detection techniques are shown in Equations (1)–(3):
The developed switching logic used four switches to select one image processing operation among four (
Table 1). For displaying the original RGB image of the region of interest (ROI), all four switches were set to low. To select any of the R, G, and B color detection techniques, 3 were switched and one of the corresponding switches 0, 1, or 2 were set to high.
2.2.3. Real-Time Data Transfer Unit
The number of pixels detected as R, G, or B determined from their respective color ratio filters needed to be acquired from the system. Each time a pixel from an image frame satisfied the specified color detection formula (Equations (1)–(3)), the corresponding pixel was modified from a color pixel to a white pixel and counted as a detected pixel inside the ROI. When a pixel did not satisfy the specified color detection formula, the pixel was considered as a black pixel; hence, a binary image of the ROI was produced. After completing the real-time processing on one frame, the image processing unit provided two types of data for two different outputs. Firstly, the R, G, and B components of the binary images that were controlled by the VGA controller were displayed on the VGA monitor. Secondly, the total number of pixels counted from an image frame that satisfied the specific color detection formula were determined.
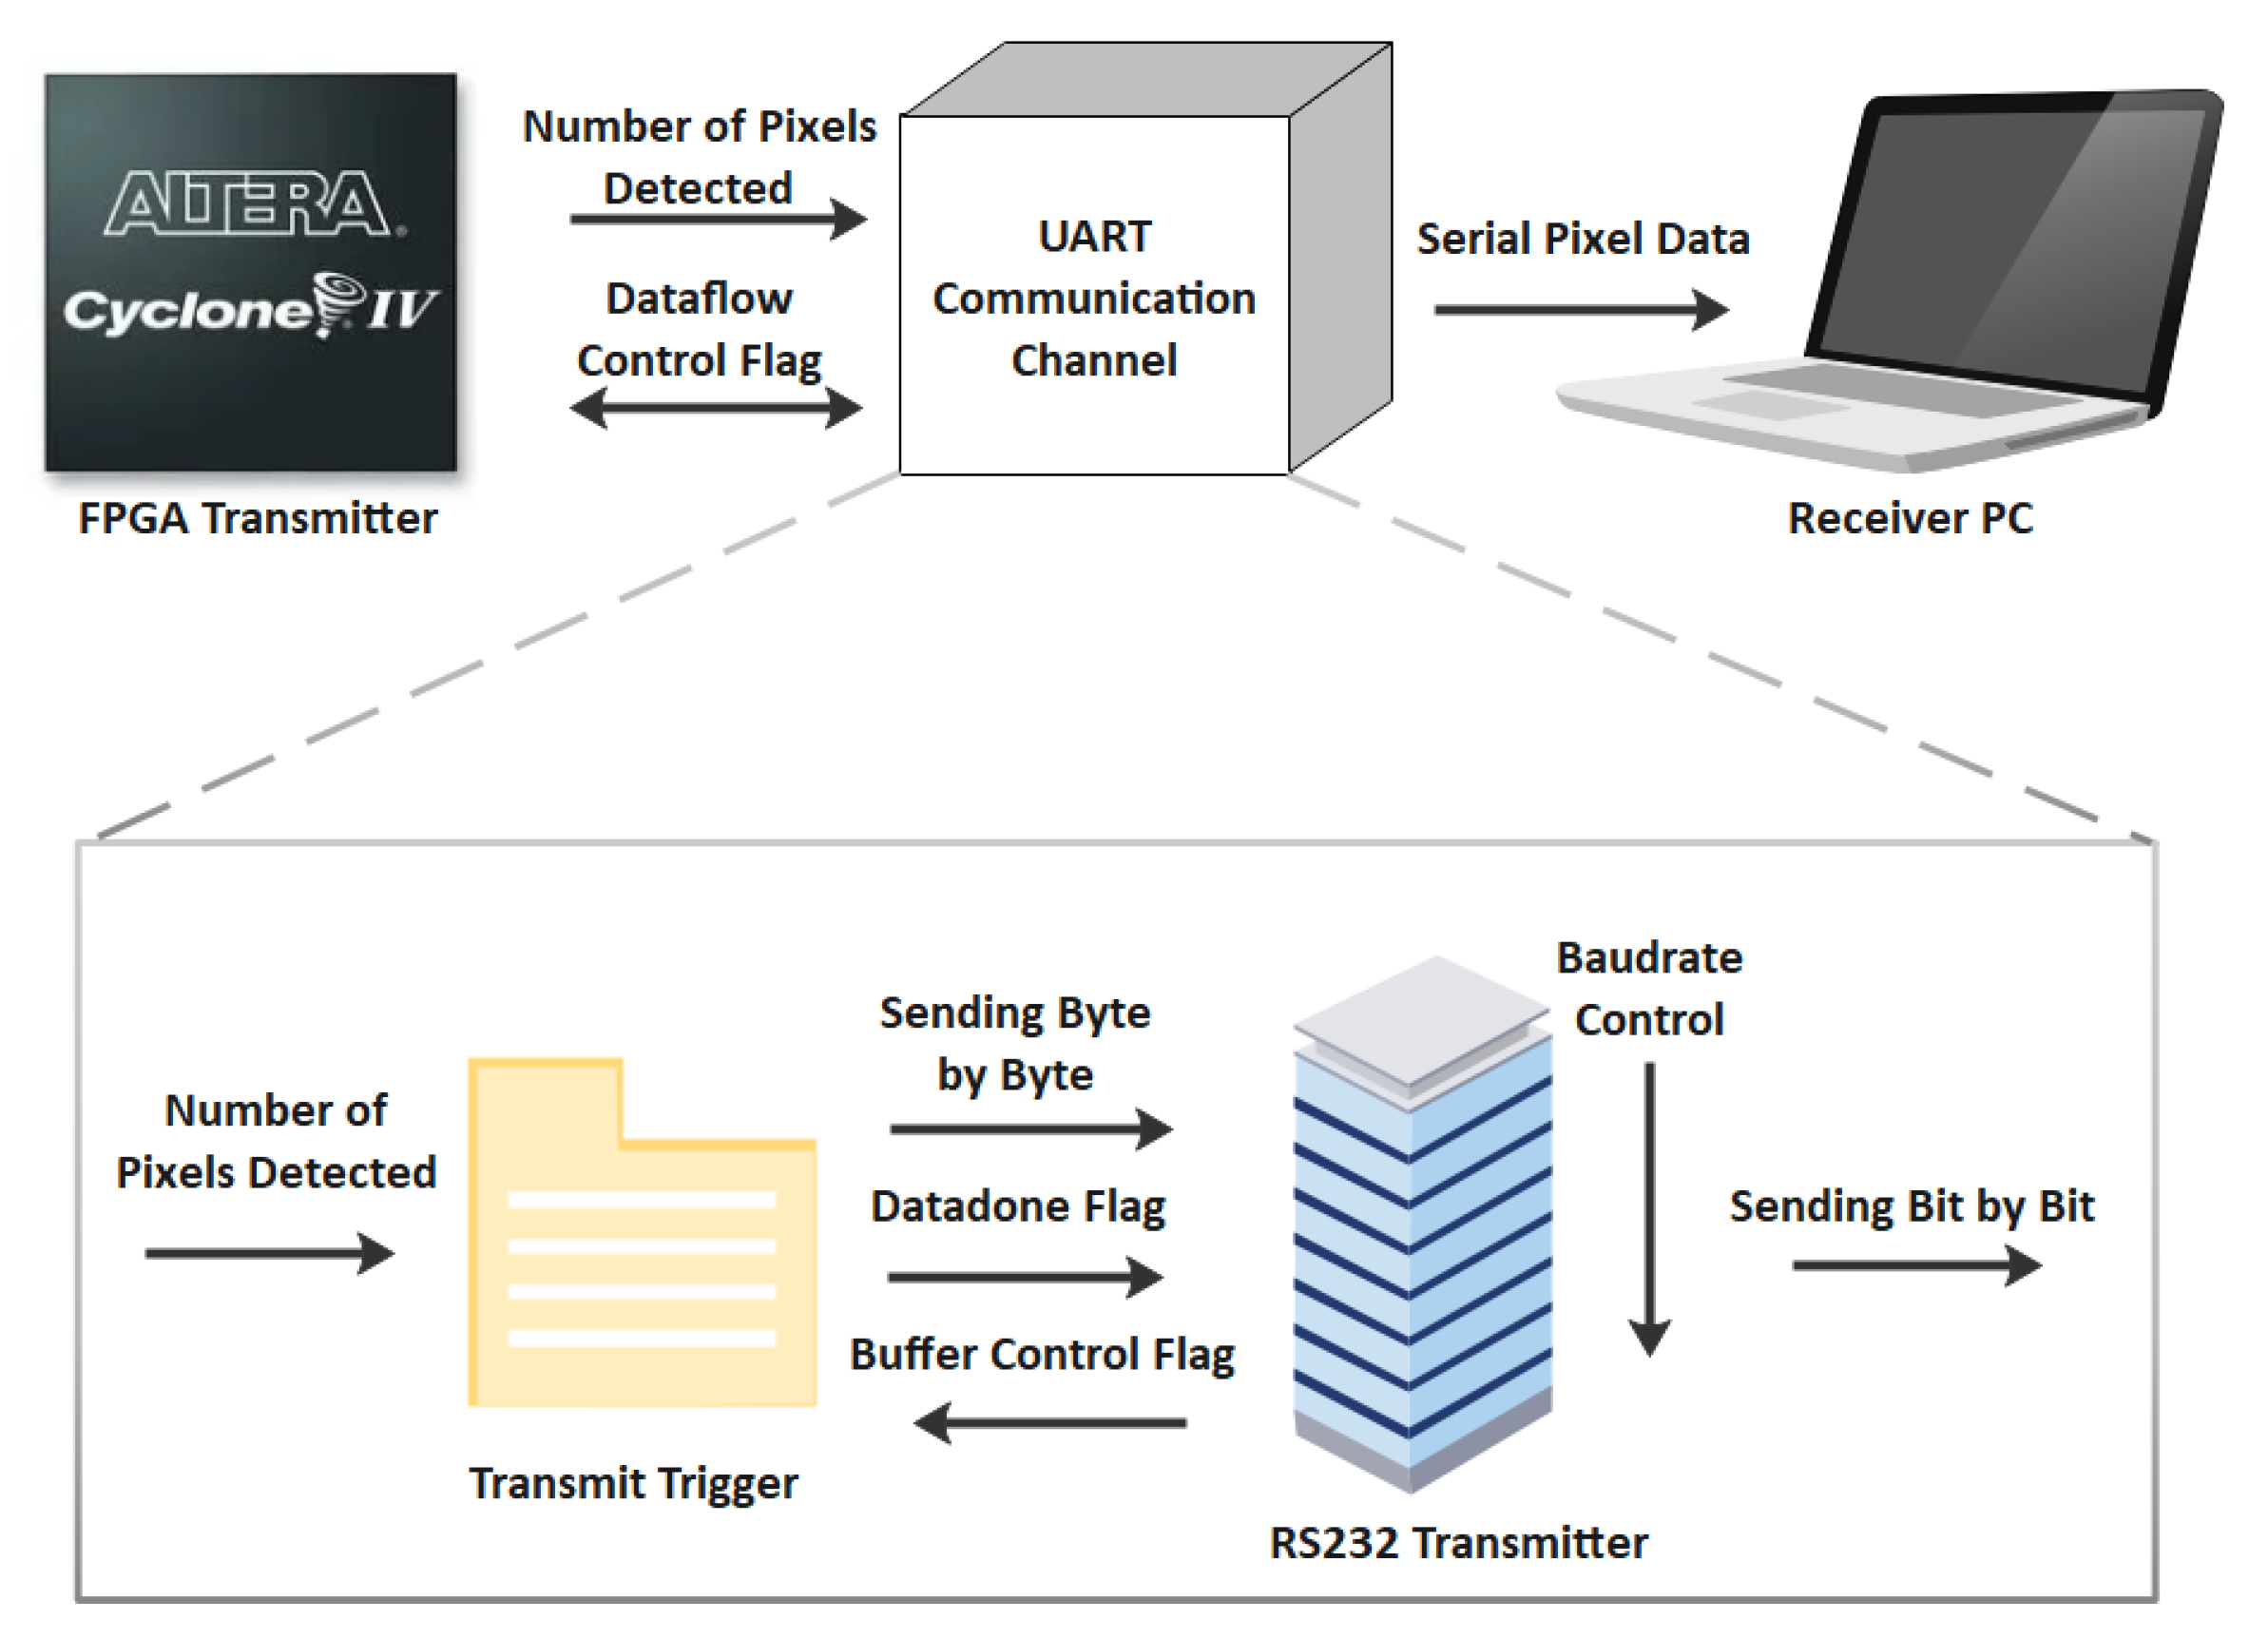
A real-time data transfer unit was developed to transfer the total number of detected pixels to an external processor to record the percentage of an area that was detected as R, G, or B. Here, the universal asynchronous receiver and transmitter (UART) communication protocol, along with the RS232 standard for serial communication, were used (
Figure 6).
The transmitter software was designed using the Quartus Prime Lite 18.0 programming tool using a personal computer (PC). For this communication channel, two different modules, Transmit Trigger and RS232 Transmitter, were created. The Transmit Trigger module inputted these six digits as six bytes and sent it to the RS232 Transmit module, one by one, and maintained a one-byte time interval with a baud rate of 115,200 for this study, and the UART module was running with a 50 MHz clock. The receiver software was designed using the Python programming tool. The Python 3.8.8 application package (©Python Software Foundation Inc.; Wilmington, DE, USA) was installed on the receiver PC by using the Anaconda navigator. The same Python tool was used to launch several Conda packages, such as Spyder and PySerial.
2.3. Testing of the FIP System—Lab Environment
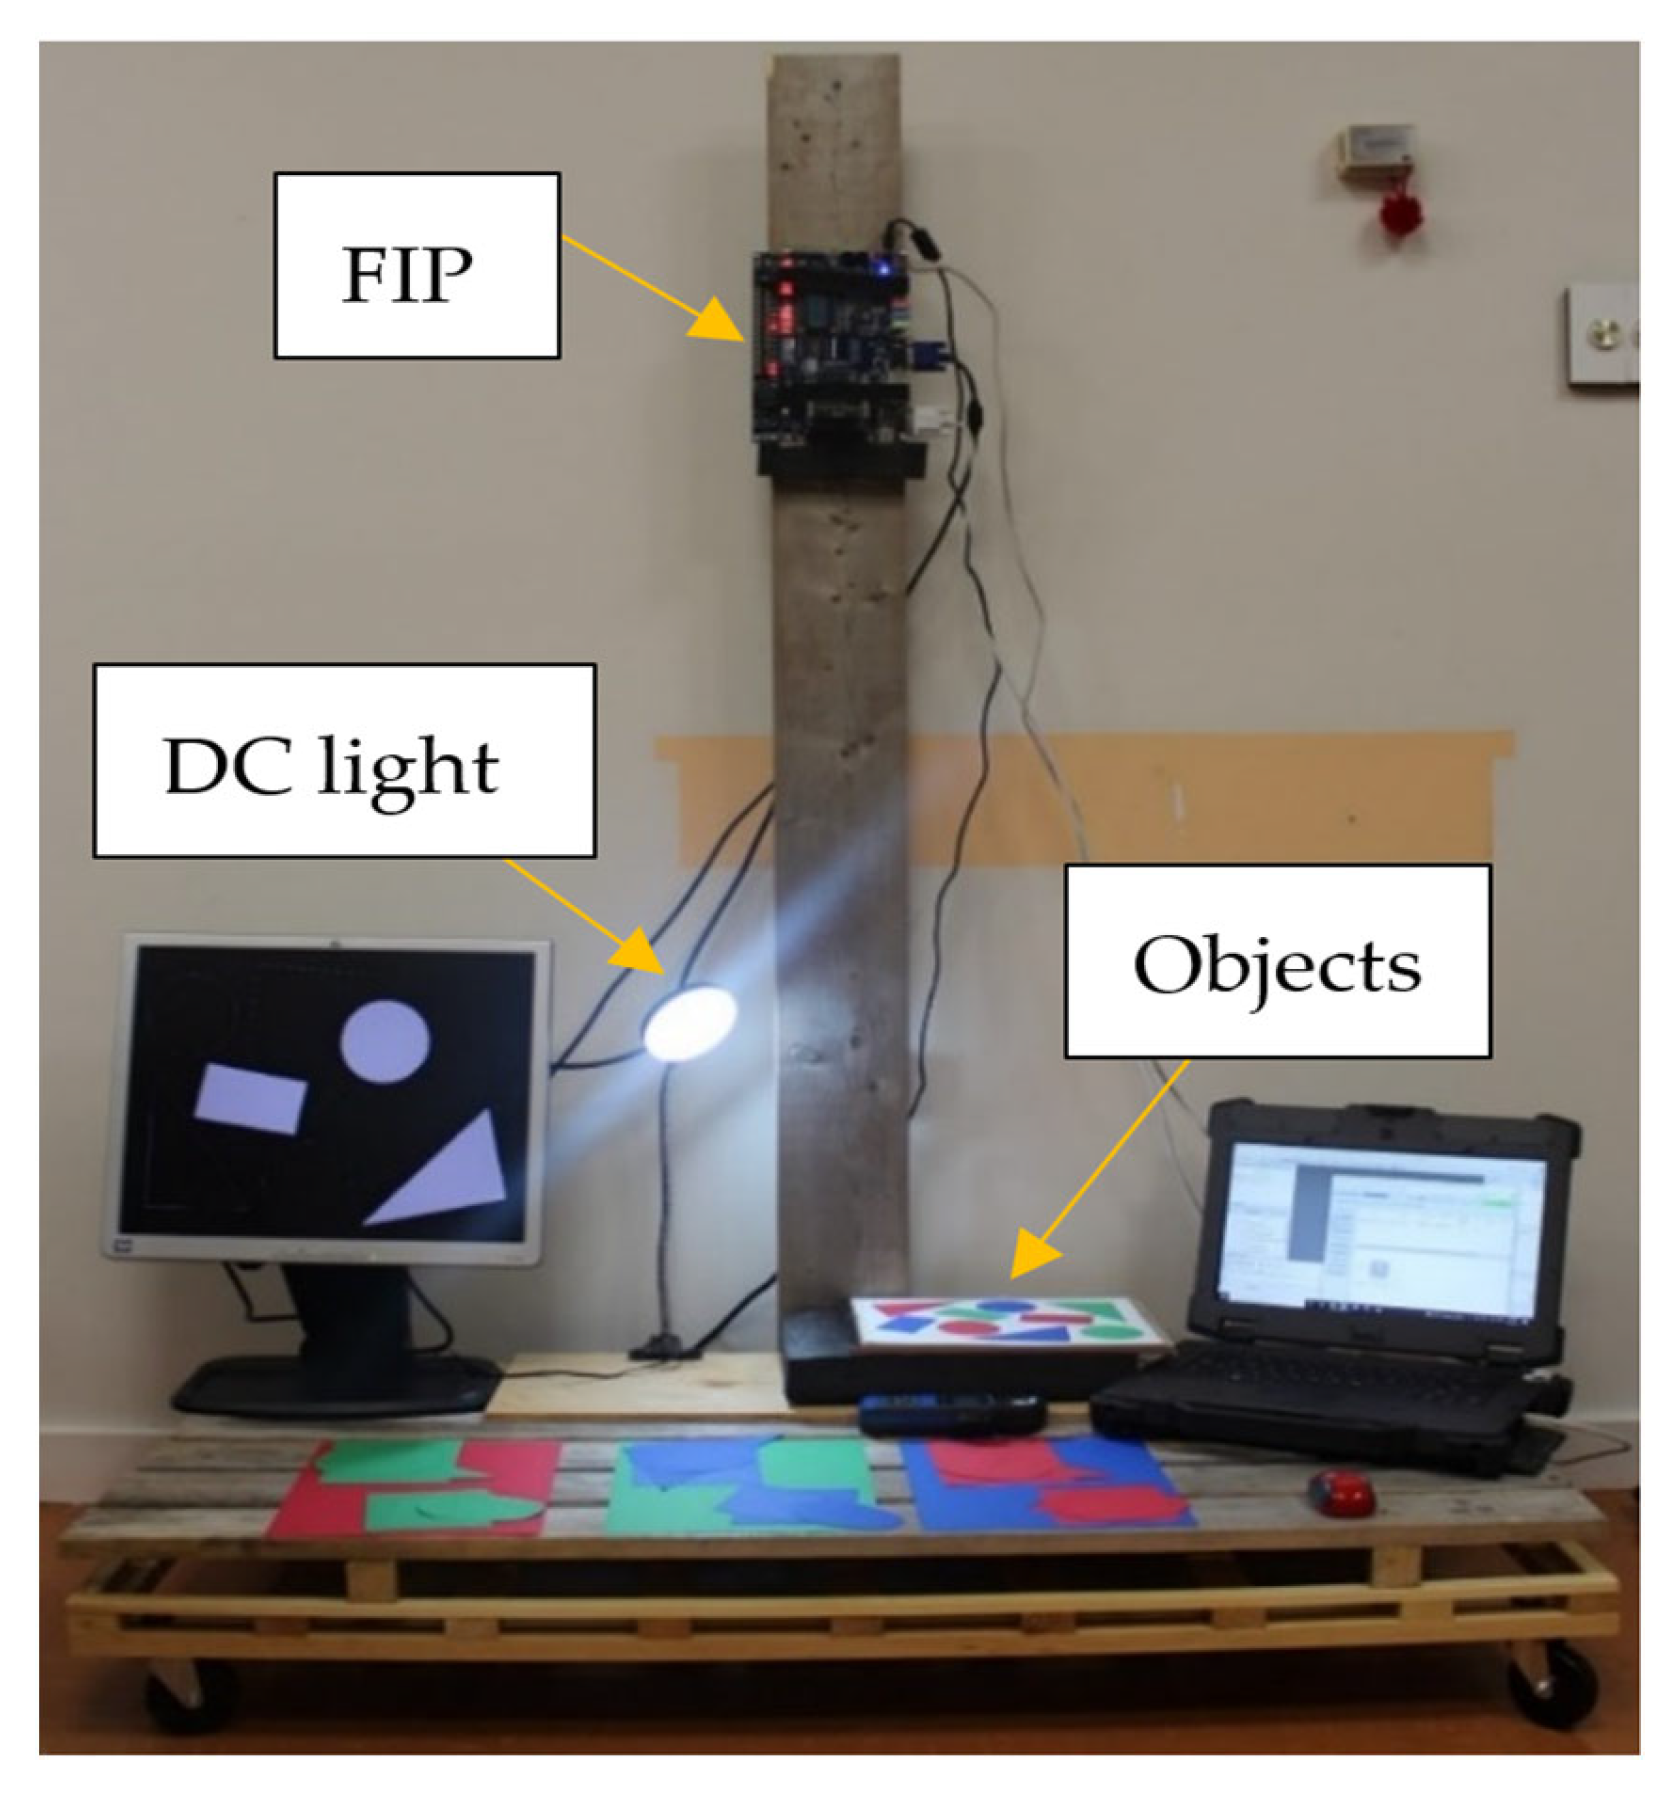
The experimental setup for the lab evaluation of the FIP system comprised of the DE2-115 FPGA development board, D8 M camera board, the receiver PC, a VGA display monitor, a custom-built wooden frame, one additional direct current (DC) light source with an SMD2835 light-emitting diode (LED; Vision Global Media Group Inc.; Waterloo, ON, Canada), and a digital lux meter from Aoputtriver
® (
Figure 7). The wooden frame consisted of a 122 × 61 cm base to place the test object on and a 152.4 × 5 cm vertical board to embed the DE2-115 FPGA board along with the D8 M camera board.
To ensure a consistent lighting condition, the DC light and the alternating current (AC) light, installed in the lab ceiling, were used. Before testing the system, the same light intensity for each object was ensured, which was 600–601 Lux with a room temperature of 21–22 °C. For evaluation purposes, several objects with different structures were formed using 28 cm × 22 cm color sheets. Here, the colors included re-entry red, gamma green, and blast-off blue (Astrobrights Inc.; Alpharetta, GA, USA;
Figure 8).
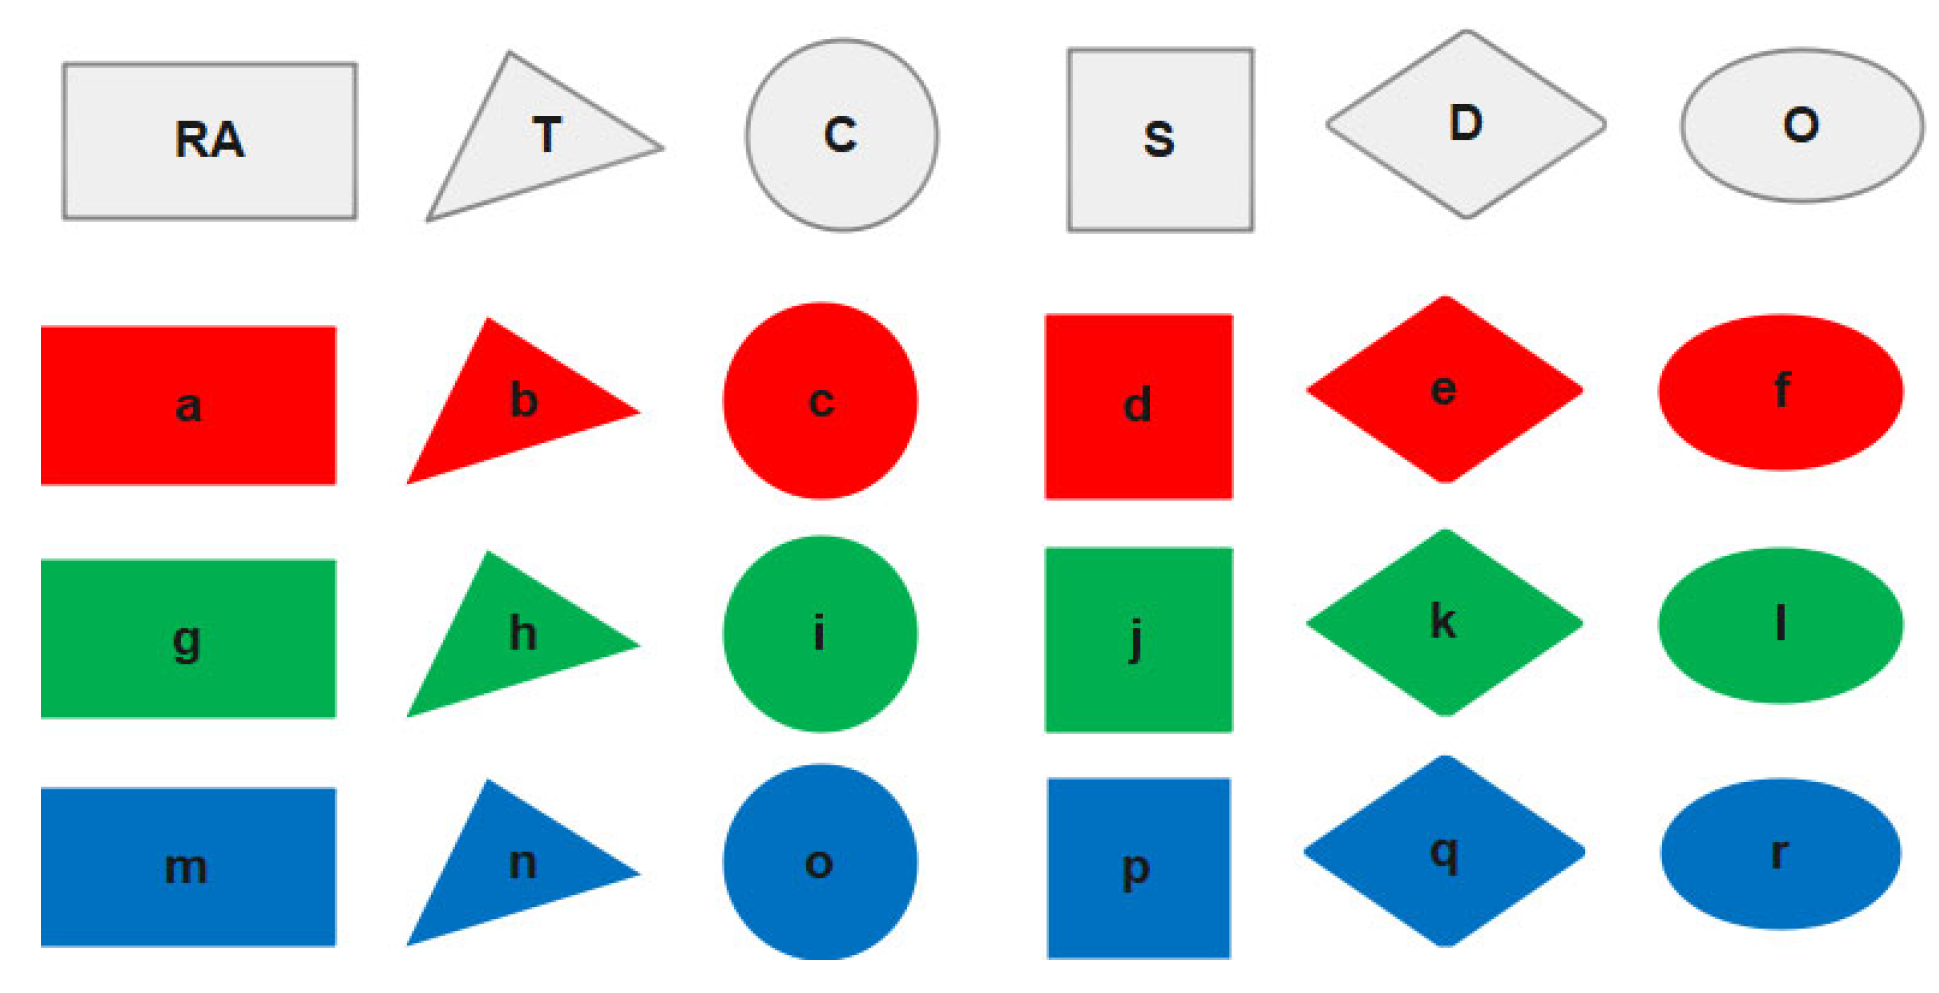
To test the image processing unit, 16 objects with different shapes were made by resizing the three-color sheets (
Table 2). In this experiment, rectangle (RA)-, triangle (T)-, circle (C)-, square (S)-, diamond (D)-, and oval (O)-shaped objects were used with three different colors (R, G, and B) for each [
24].
2.3.1. Data Collection Using the FIP System
The FIP system was mounted at 99 cm above the flat surface of the custom-built wooden frame for the data collection, where the different objects were placed for imaging. Images were collected while covering the area on the ground of 27.5 × 21.5 cm. During the data collection period, 10 sets of pixel data were recorded for each of the 16 objects that resulted in 160 values for each color detection algorithm.
2.3.2. Acquisition of Reference Data
To compare the performance of the developed FIP system, a Canon EOS 600D DSLR camera (Canon Inc.; Tokyo, Japan) with a Canon EFS Lens EF-S 55–250 mm f/4–5.6 IS II (Canon Inc.; Tokyo, Japan) was used. During the acquisition of the reference images, the same experimental setup as the FPGA data collection was maintained. Here, the F-stop, exposure time, and ISO speed of the camera were maintained at f/5.6, 1/30 s, and ISO-200, respectively.
After collecting all the reference images, they were cropped and resized to match the ROI area and resolution of the FPGA imaging system. Here, the Adobe Photoshop CC 2019 software (Adobe Inc.; San Jose, CA, USA) was used to make the modifications so they matched the 27.5 × 21.5 cm ground area and the 800 × 600 px image resolution. Finally, all the reference images were saved in a file directory for data analysis. Lastly, the Python programming tool and the corresponding color detection formulas were applied on the 160 reference images to determine the pixel areas and were saved in a text file.
2.4. Testing of the FIP System—Outdoor Environment
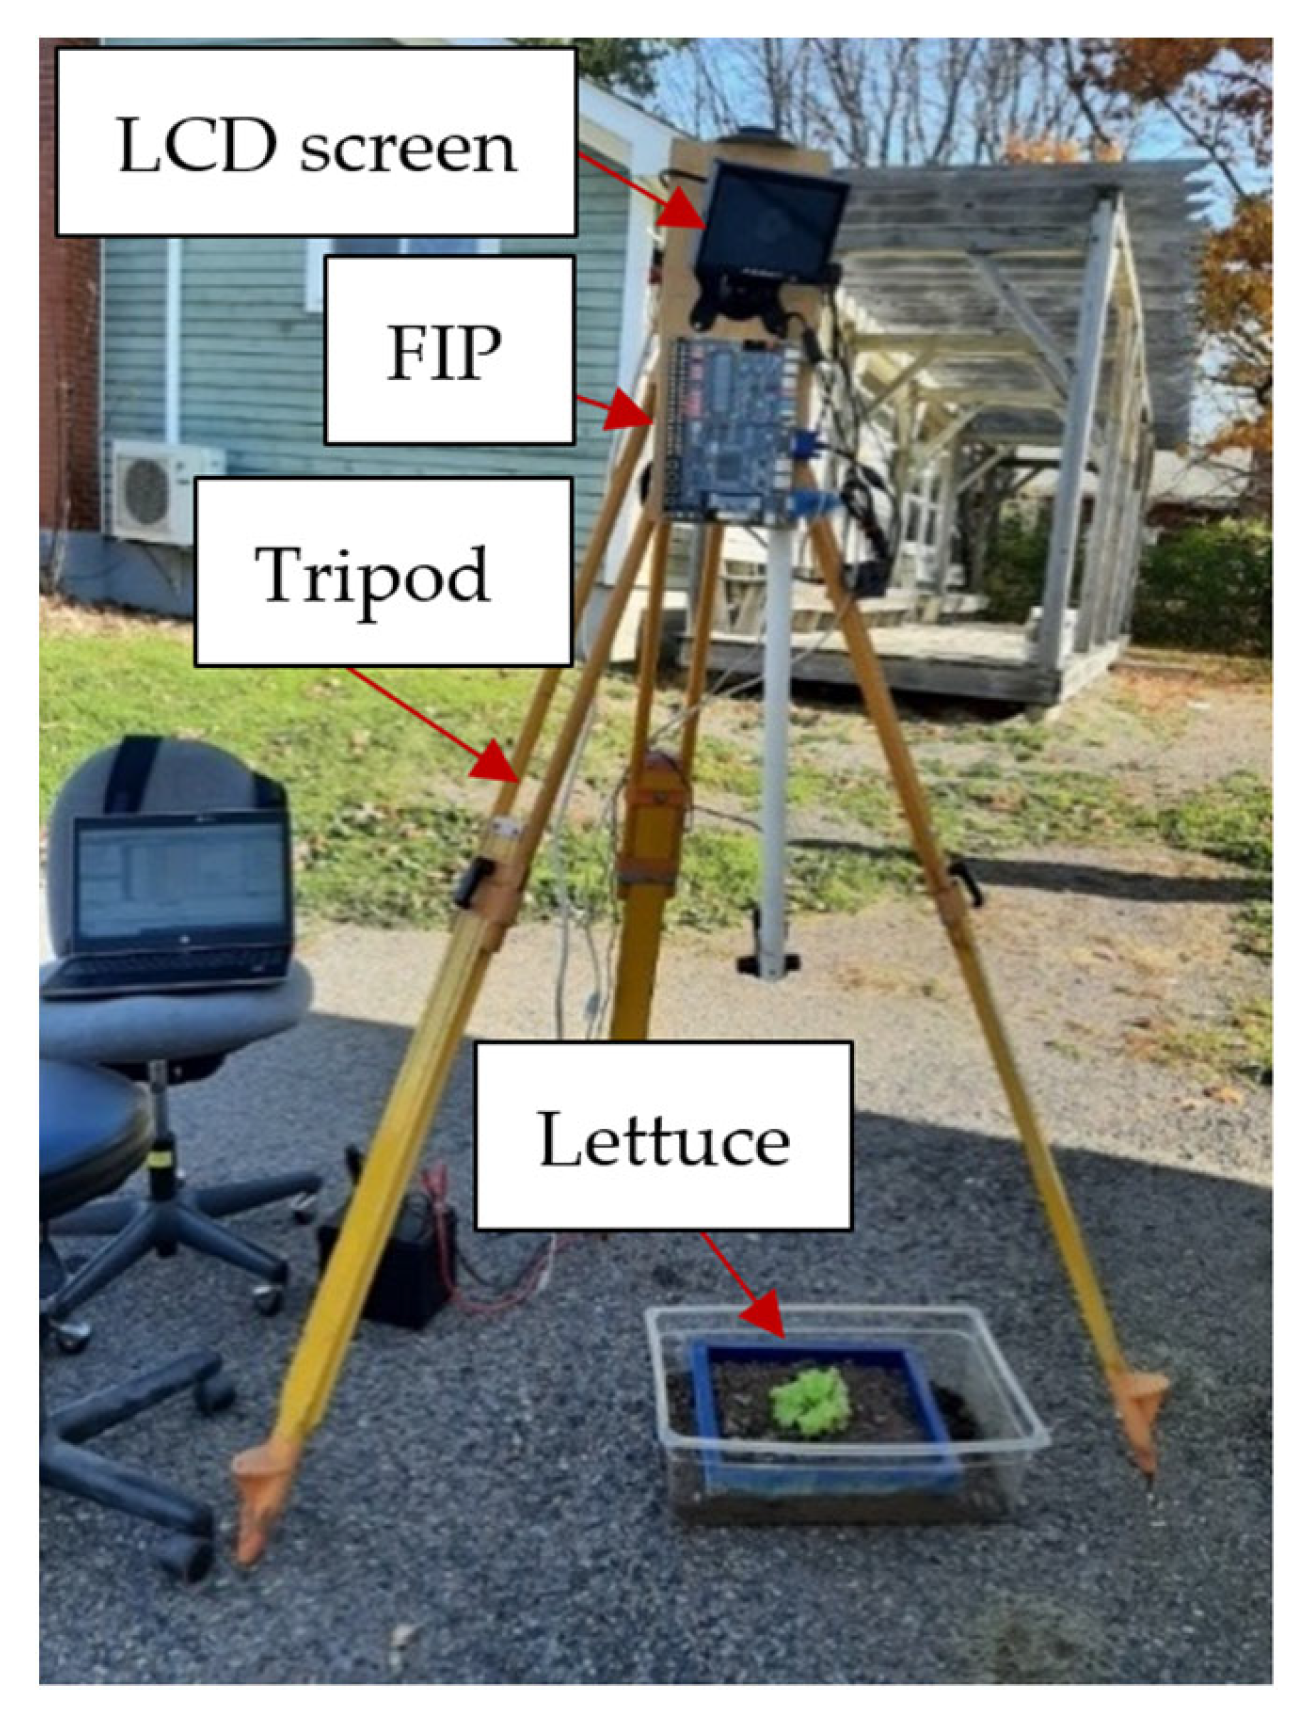
To evaluate the effectiveness of the FIP system in the outdoor environment, the system was tested at the Agricultural Campus of Dalhousie University, Truro, Canada (45.374° N, 63.264° W). The data collection unit was placed as a stationary unit, which included the following: the FIP system, installed on the custom-built T-shaped wooden frame and placed on top of a tripod; the battery and inverter to supply power; the PC to store collected data; the live streamer CAM 313 (PW313) 1080 p web camera (AverMedia Inc.; New Taipei City, Taiwan) to collect the reference images; and other necessary cables (
Figure 9). The D8 M camera was placed 29 cm down from the tripod top and 121 cm above the object, and the web camera was placed 82 cm down from the tripod top and 68 cm above the object. Two legs of the tripod were 152.4 cm, and one was 139.70 cm in length. The size of the container that carried the objects was 34.29 × 29.21 cm, and the wooden frame used to maintain the 800 × 600 px image resolution of the FIP system from 121 cm was 30 × 22.5 cm in size.
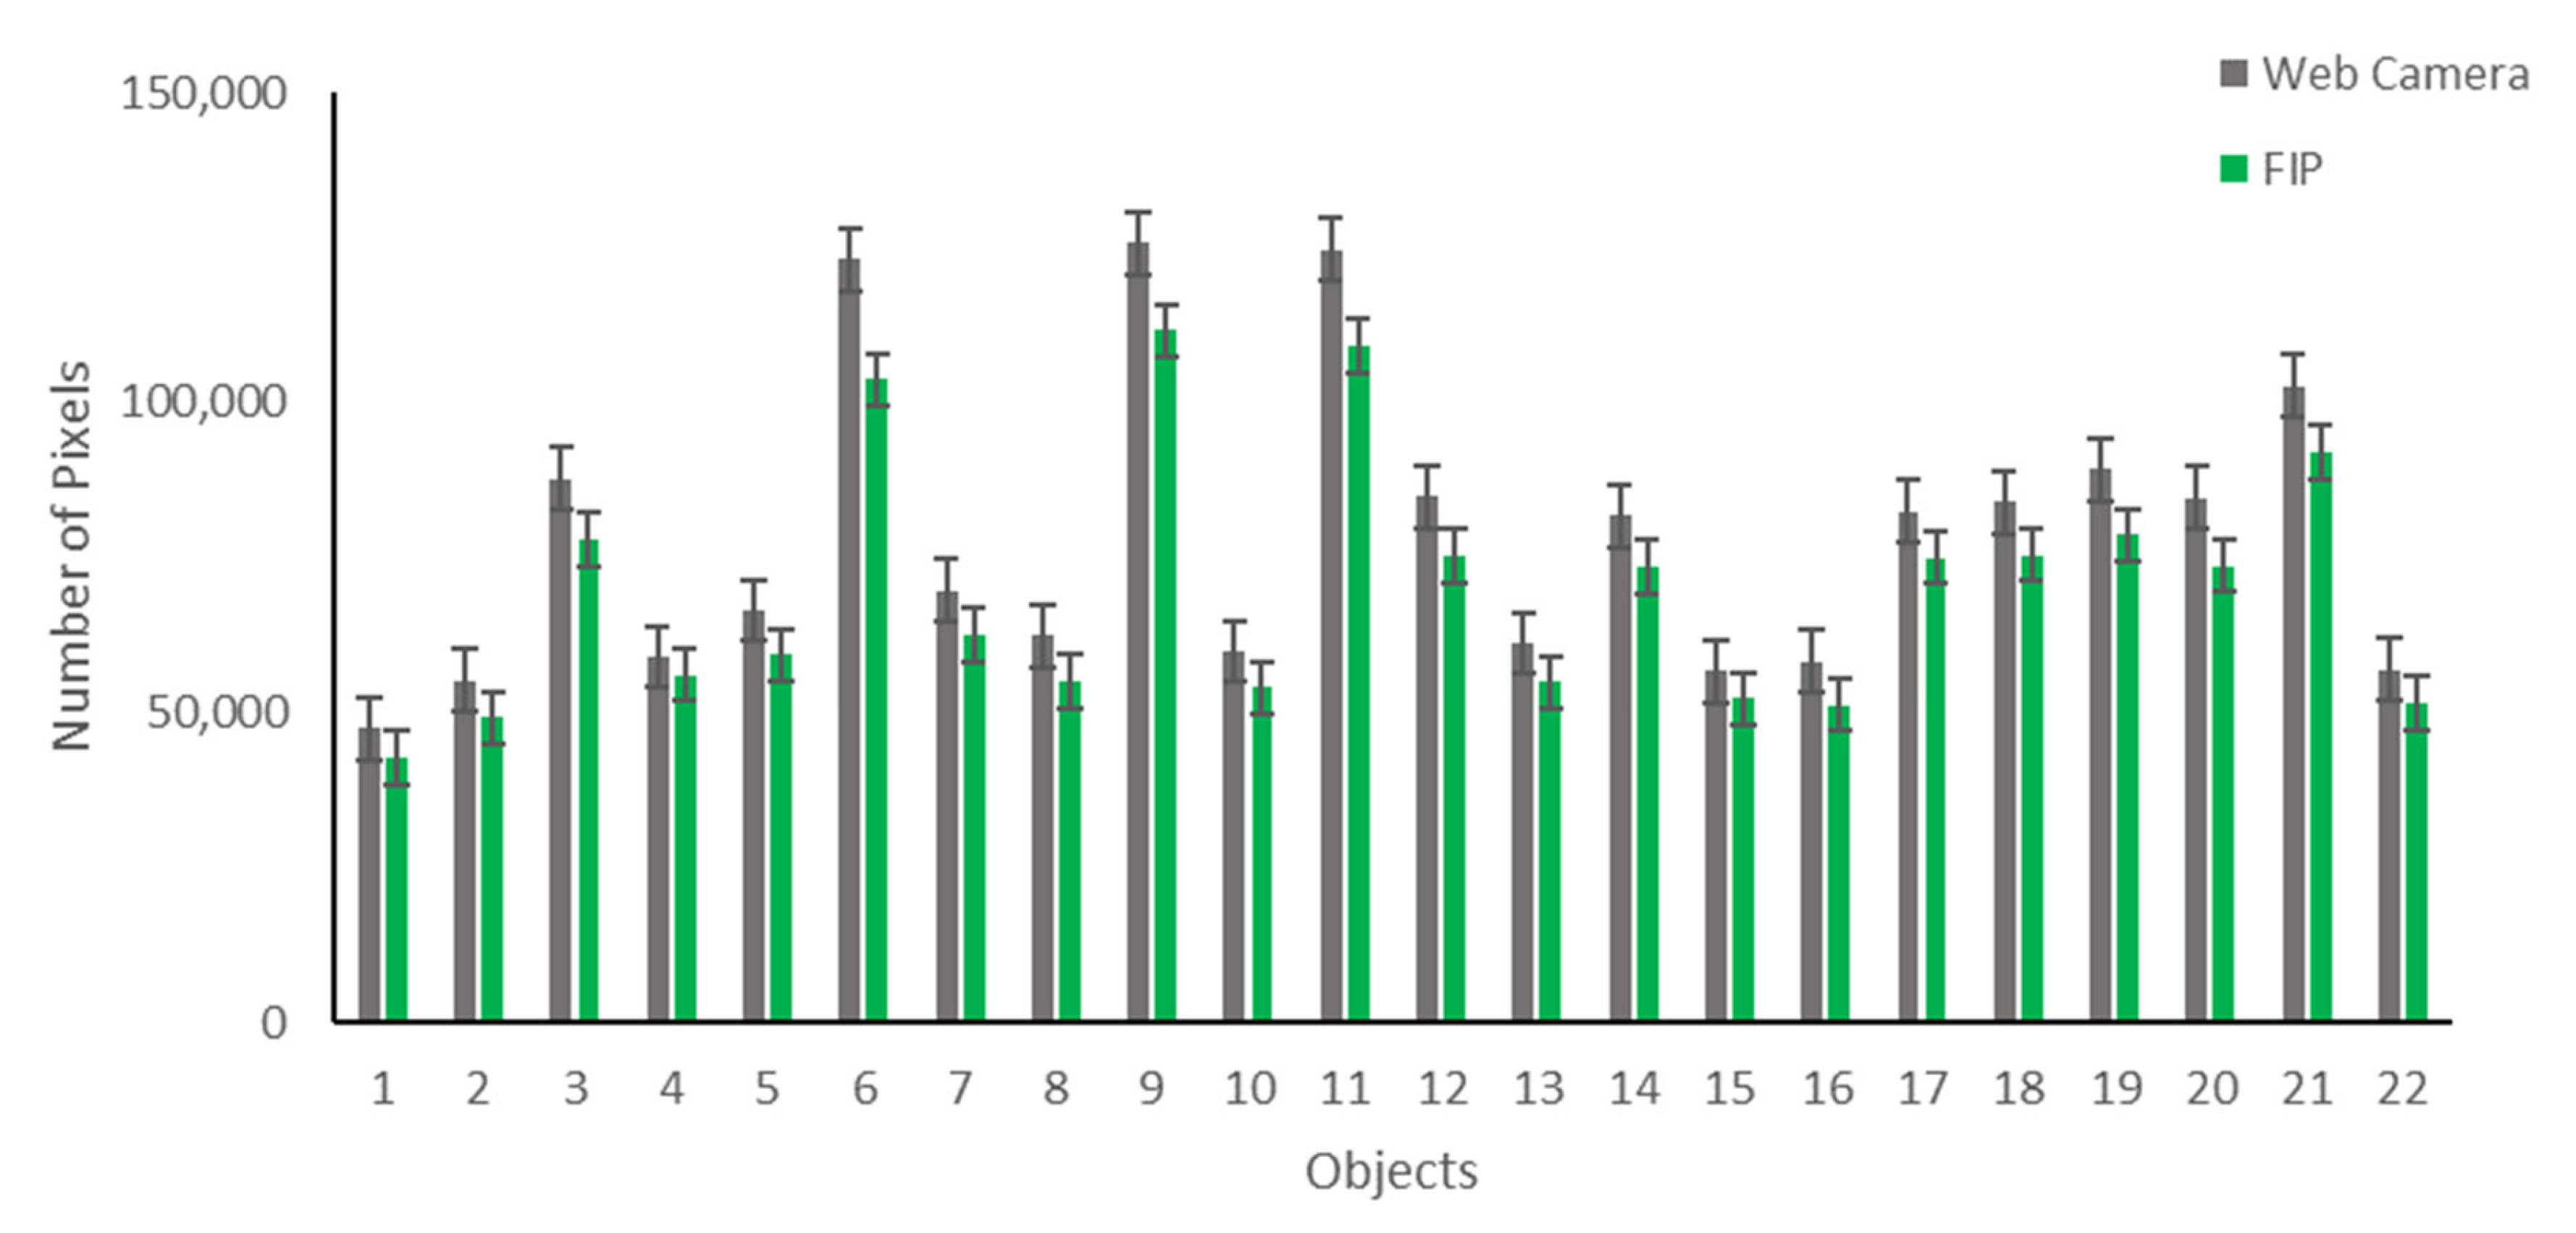
The date by which the system was tested was selected based on the weather conditions. The test occurred on a bright, clear day with a temperature of 15 °C, a wind speed of 17 km/h, a humidity of 72%, and an atmospheric pressure of 100.6 kPa. A location was selected where there was consistent shade and a lighting intensity of 3900–4000 Lux. For data collection purposes, 22 live lettuce (Lactuca sativa L. var. longifolia) plants were collected from the field and placed inside the container with its soil to create a field prototype and avoid system movements in the primary validation stage. The lettuce was selected due to its popularity within cropping systems and easy validation of its broad leaves. The number of lettuce plants was increased from the lab test sample number (n = 16) to account for the variability of outdoor lighting conditions and wind. From each plant using the Python Programming Tool, a total of 10 data samples were collected as the FPGA detected pixel area using the G-ratio detection formula, and 10 reference images using the web camera. Finally, 220 processed data from the FIP system were saved in a text file. Next, the 220 reference images were cropped by using the custom-built blue frame to match with the same ground resolution as the FPGA camera and processed using the same formula as used by the FPGA camera to detect plant leafage area, to generate the same set of 220 reference data for performance evaluation.
2.5. Performance Evaluation of the FIP System
The DSLR and web camera imagery were used to compare and evaluate the performance of the FIP system, as these two image acquisition sources have been widely used in real-time image processing systems over the past few years [
25,
26,
27]. Since this research focused on providing a cheaper, faster, and reliable real-time image processing system alternative, the performance of the developed system was compared with high-end image acquisition systems. Statistical analysis was performed to evaluate the developed system, whereby the mean, standard deviation (SD), and the percentage root mean square error (RMSE) of the detected pixel area (Equation (4)) were the main metrics for comparison.
For the lab evaluation of the FIP system, there were 10 samples per 16 objects, computing to a total of 160 samples from the FIP output and 160 samples from the DSLR reference system for each of the three corresponding ratio algorithms. The FIP data and DSLR data were averaged using 10 samples for each object and a total of 48 combinations were computed for the FIP data and DSLR data, respectively, including three-color ratio algorithms (16 × 3 = 48). For the outdoor evaluation of the FIP system, there were 10 samples per 22 plants, with a total of 220 samples from the FIP and web camera systems. The FIP data and web camera data were averaged using 10 samples for each plant to obtain 22 samples for each system. These data were analyzed and compared using the G-ratio algorithm for real-time detection in an outdoor environment.
The detected areas determined from the FIP system were correlated with the areas detected using the DSLR and the web camera via a regression analysis. Lin’s concordance correlation coefficient (CCC) from the lab and outdoor test results was calculated and used to measure the accuracy of the FIP results [
28]. For hypothesis testing, Lin [
28] indicates that rather than just testing whether the CCC is zero, it is more logical to test whether the CCC is greater than a threshold value, CCC0. The threshold was calculated using the following Equation (5), where Xa is the measure of accuracy calculated using Equation (6), υ2 and ω are a squared difference in means relative to the product of 2 standard deviations and a scale shift that is a ratio of 2 standard deviations, respectively, ρ represents the Pearson correlation coefficient when the FIP data was regressed on the reference data, and d is the % loss in precision that can be tolerated [
28].
This is analogous to a non-inferiority test of the CCC. The null and alternative hypotheses are H0: CCC ≤ CCC0 (there is no significant concordance between the FIP data and the reference data) and H1: CCC > CCC0 (there is a significant concordance between the FIP data and the reference data), respectively. If CCC > CCC0, the null hypothesis is hence rejected, and the concordance of the new test procedure is established. In addition, the RMSE was calculated and used to compare the performance of the FIP system with the reference systems using the same algorithms. As the FIP system was a combination of image acquisition and image processing systems, the reference images acquired were processed pixel by pixel using Python by applying the same algorithms used in the FIP system’s image processing unit.
4. Discussion
The proposed FIP system was able to acquire higher-resolution imagery (800 × 600 px) than the previous literature during the lab and outdoor evaluations of the system [
11,
13,
15,
17,
18]. In addition, the integration of image acquisition and processing on a lightweight FPGA platform for PA crop monitoring purposes responded adequately to the current needs of real-time farm management decision support systems [
19]. The FIP demonstrated its effectiveness by providing a 98.73% accuracy during the lab test and a 91.01% accuracy during the outdoor test (
Table 6), which were similar to the detection rate achieved by Zhai et al. [
17] for another field of study related to license plate detection.
Despite the success of the system, there were still data collection challenges during the experimental phase. For example, the motion effect of the researcher on the experimental setup due to continuous monitoring, the light reflection of the objects alongside the edges, and a little effect of the AC light source inside the lab. In the outdoor experiment, the results may have been affected by wind on the plant leaves, the presence of shadows of leaves, plants with multiple leaves, ambient sunlight, and clouds.
From the scatter plots shown in the results section, there was a slight under- or overestimation for the object area detection during the experimental trials. The potential reasons for this could be the manually adjusted exposure and brightness of the image sensor, the value chosen for the threshold filter, and the luminance effects on the ROI. A slight under- or overestimation is a common discrepancy found in remote sensing research [
30,
31]. Despite these factors, this study tried to ensure a consistent experimental setup during the data collection processes. For example, the region of interest was kept stationary for both the FIP and reference data collection. Moreover, the FIP was placed at the same height as the ground surface for all data collection with the help of a custom-built wooden frame. Overall, the FIP system showed great potential in the lab and outdoor environment for real-time object and plant detection using single, lightweight, and computationally effective FPGA hardware.
5. Conclusions
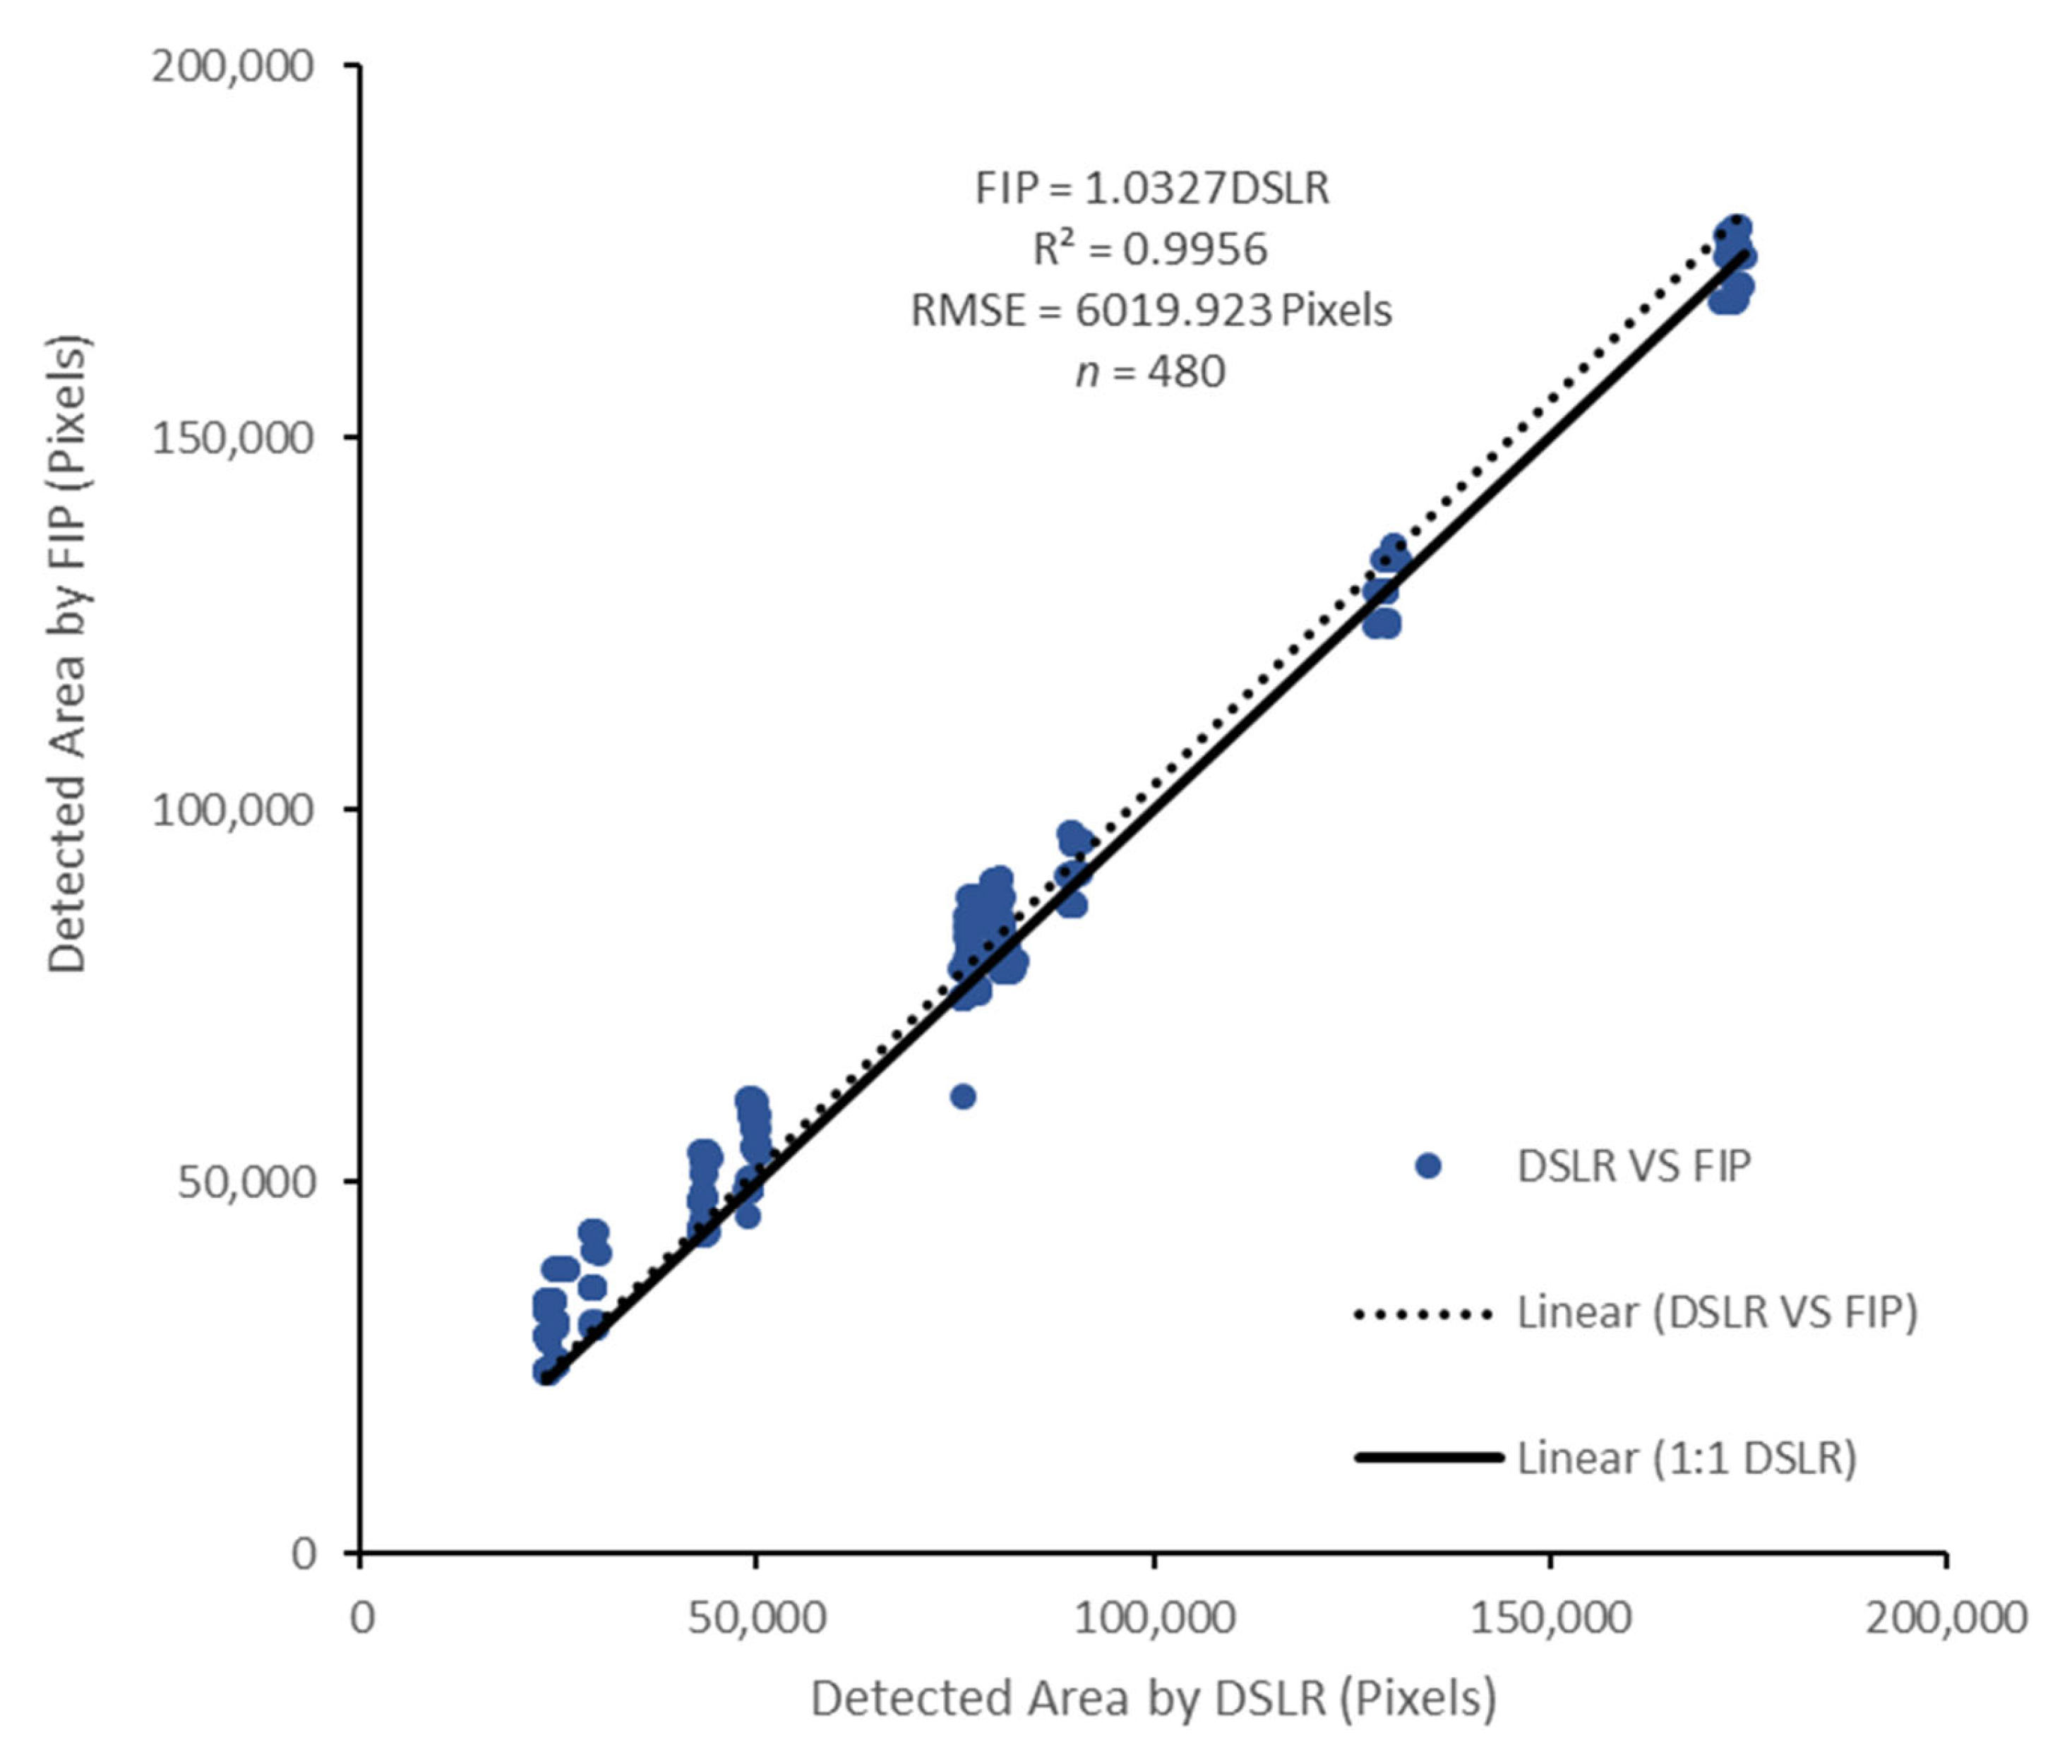
After analyzing the current methods of acquiring agricultural imagery, it was determined that a new strategy and system for real-time crop monitoring using cost-effective FPGA hardware might be a powerful solution to solve current demands in PA. Hence, a cost-effective FIP prototype was developed in this study to support future on-the-spot decisions in agriculture.
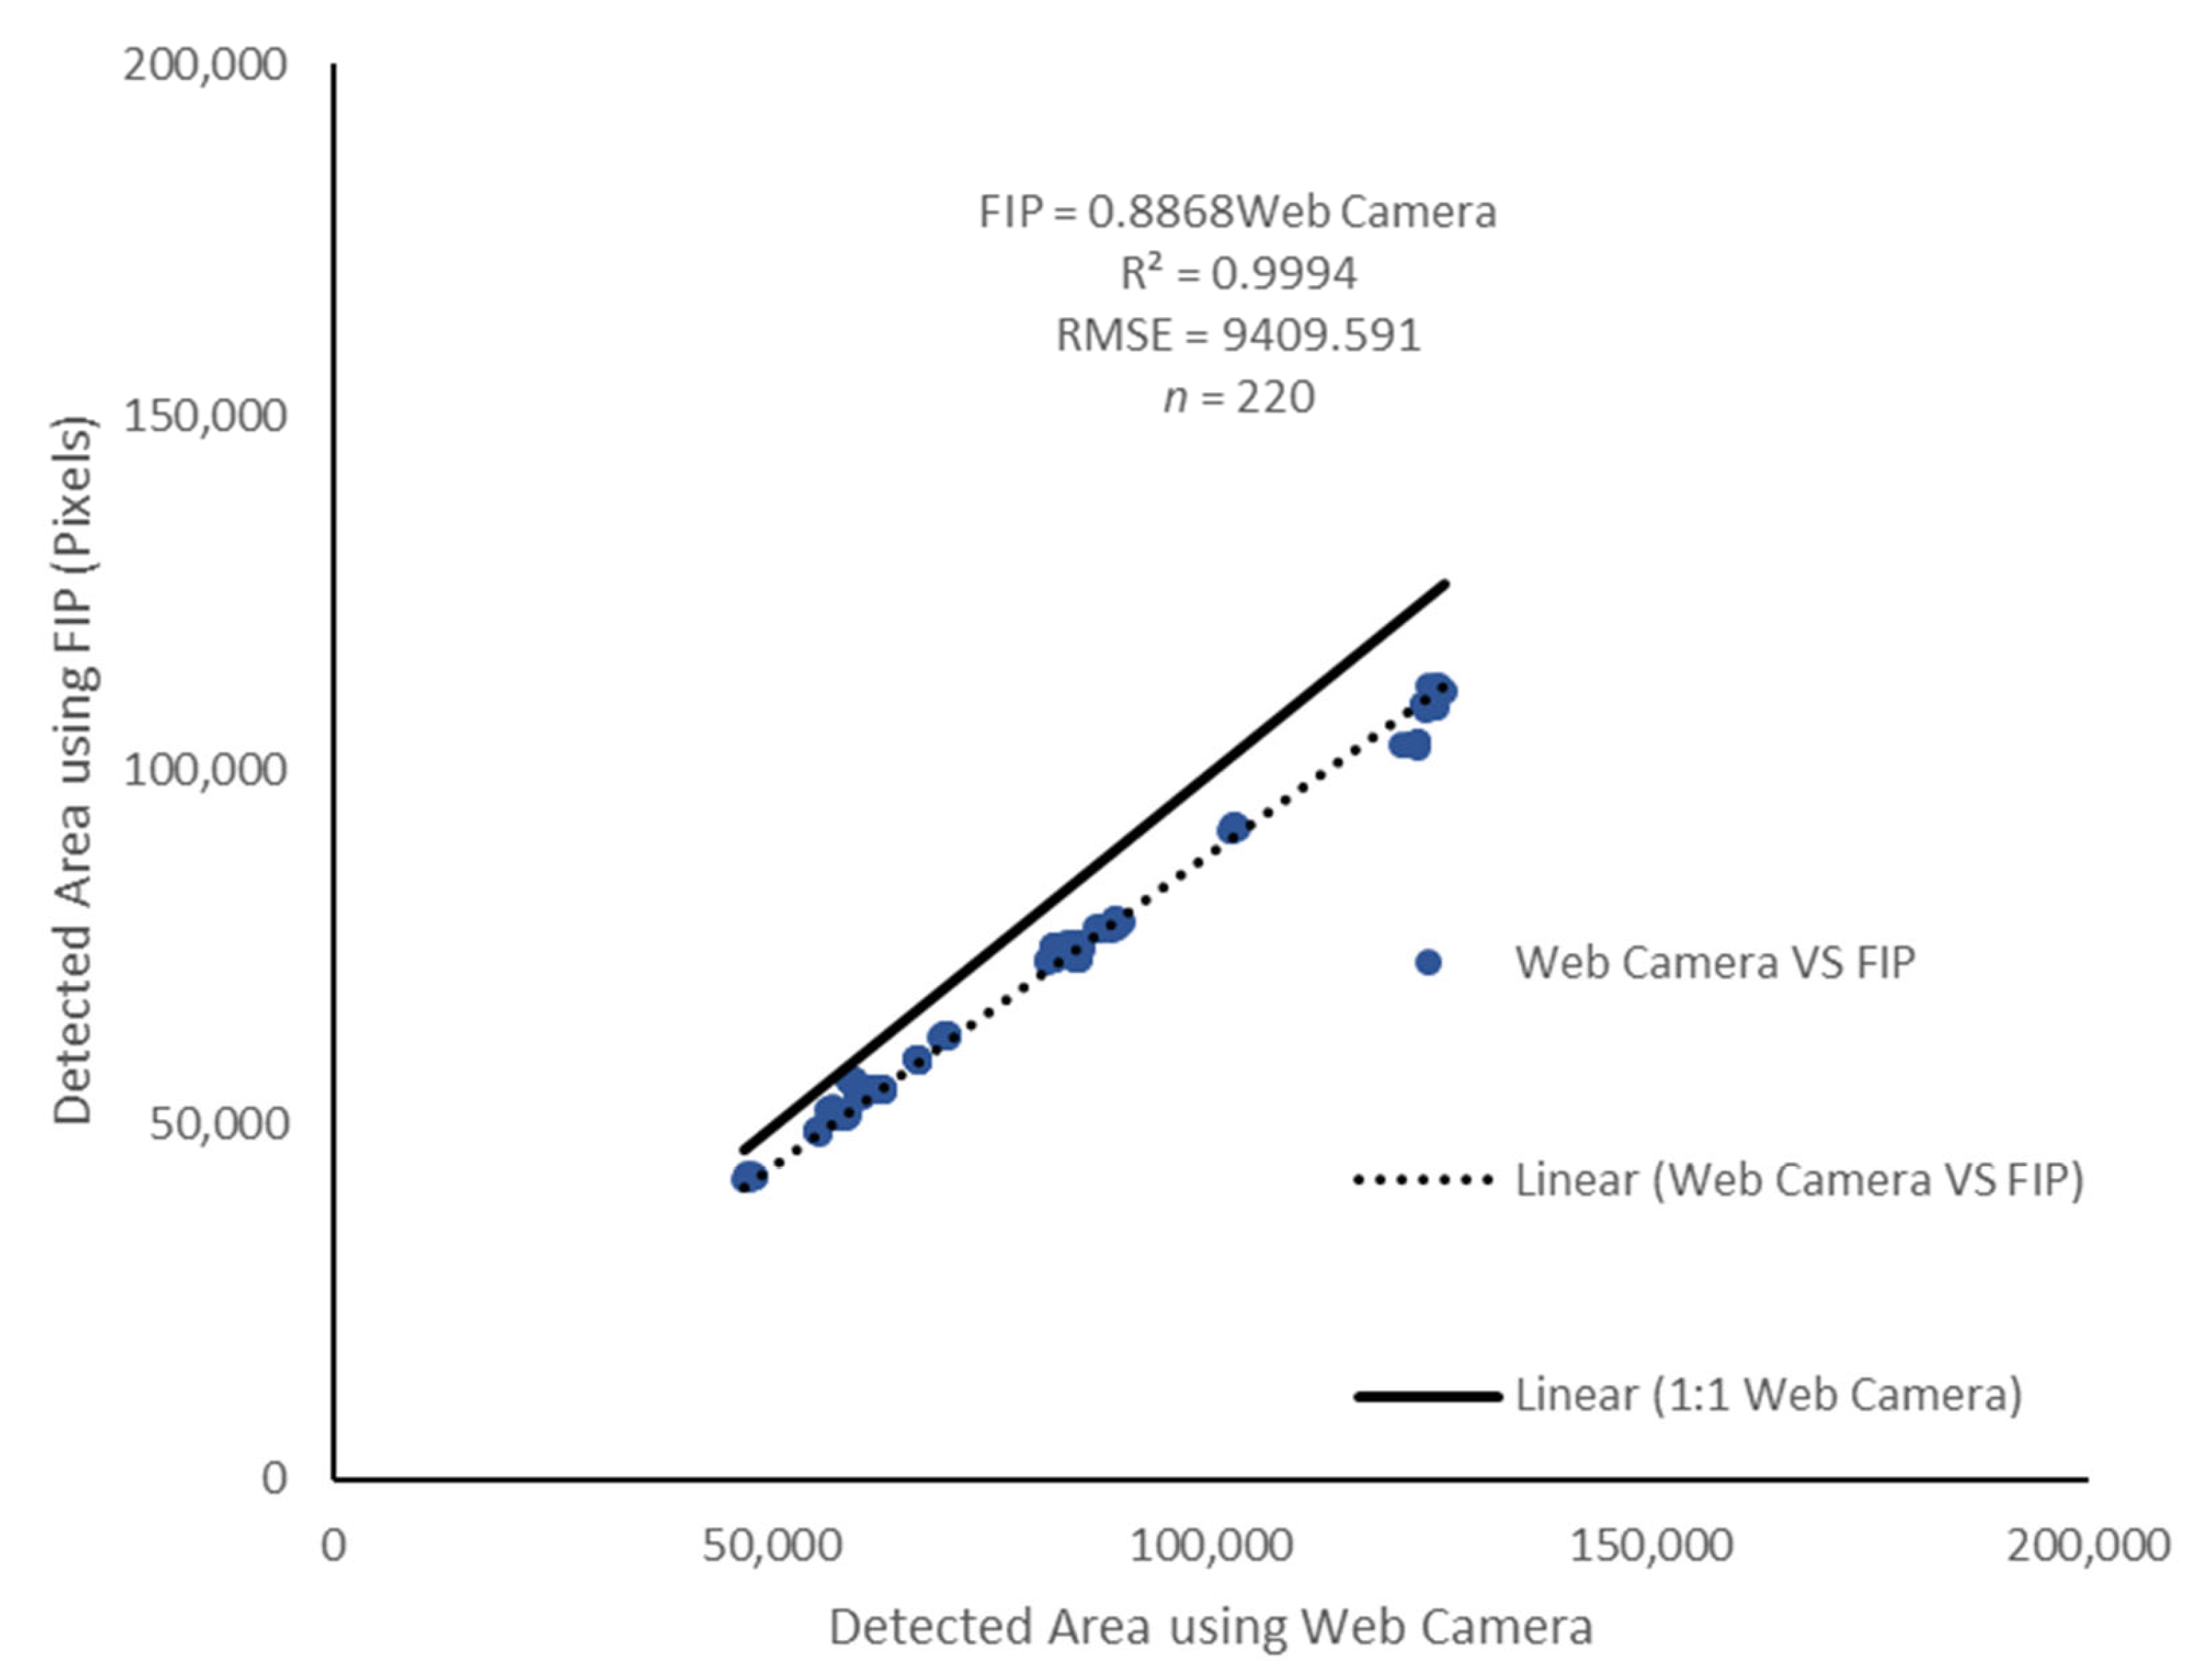
The developed FIP system was evaluated under both lab and outdoor environments. The evaluation under the lab environment was carried out based on a DSLR system for estimating three different color ratios with 16 different objects. The detected area using the FIP system was found to be strongly correlated with the DSLR imagery-based reference system (FIP = 1.0327 DSLR; R2 = 0.9956; RMSE = 6019.923 Px (1.25% of total pixel area); n = 480; p-value < 0.05) with a substantial accuracy (CCC = 0.9873). The evaluation under the outdoor environment was also performed by comparing the developed system with the reference web camera system using a G-ratio algorithm with 22 lettuce plants. Based on the accuracy metrics, the FIP system showed a strong correlation to the web camera system (FIP = 0.8868 WebCamera; R² = 0.9994; RMSE = 9409.591 Px; n = 220; p-value < 0.05) with a moderately high accuracy (CCC = 0.9101).
To address the current limitations of high-resolution imagery for real-time crop monitoring PA applications, this study showed great potential for on-field crop monitoring applications. Here, a real-time applicable crop monitoring system was developed that included a high-resolution, high-speed image acquisition and processing unit using the same FPGA platform to address the current PA limitations for on-the-spot farm management solutions.
The proposed system was able to minimize the imaging limitations in digital agriculture related to computational complexity, image resolution, and time of deploying this photographic technology and facilitate real-time, actionable management strategies in the field. This technology can contribute to other crop types, especially in vegetable cropping systems and assist in the estimation of crop yields. Furthermore, the cost-effectiveness of this technology would be particularly beneficial for small- and medium-sized farms. To reduce human errors and achieve a more precise real-time data acquisition, future research should include the adaptation of higher-resolution images with an FIP up to 4 K and wide dynamic range global shutter camera for the moving image acquisition circumstance, and the development of an agrobot that integrates the FIP with a real-time kinematics global positioning system and battery source. Furthermore, the developed system, with a lightweight FPGA nano board, would also be applicable for integration on an unmanned aerial vehicle.


