1. Introduction
Over millennia, whether in the birthplace of civilisation or in the new world after the period of geographical discovery, humans have tacitly built different styles of settlements on the earth’s surface along the storyline of ‘settlement—town—city’; however, the structure of human settlements is a dissipative system that requires an external input of energy to maintain it [
1,
2]. Urban structures are becoming more complex as human civilization and socioeconomic class grows more finely split. There are three classic models, the concentric zone model [
3], the sector model [
4] and the multiple nuclei model [
5]; these models have been used to study the morphology of urban structure since the early days of the modern city, and their complexity has increased over time as they have been proposed. With the development of socioeconomic activities and building technology, cities have expanded both horizontally to the earth’s surface and in a vertical dimension [
6]. Exploring urban structure from a 3D perspective helps urban planners or citizens who live in a metropolis understand the ongoing change in city morphology [
7].
Natural cities, from a topological perspective, are core areas in a large geographic space; previous empirical methods explored urban structures from a Euclidean geometry perspective [
8]. A whole city is seen as a group containing small units at a proposed scale; the size of the small units depends on how precisely the scale needs to be observed. As scales move towards the microscale, a small unit will be divided into more tiny units. All units are divided into different levels by head/tail breaks [
9]. Head/tail breaks are a classification method for data conforming to a heavy-tailed distribution, and areas of units generated from road networks meet this restriction [
10]. The term “natural city” refers to a naturally occurring distribution of active human activity in a city that is produced from the bottom up and is not predetermined by legislation [
11]. Its boundaries are fluid and vary as human activity concentrations shift in response to societal trends.
Because space, roads, and blocks all exhibit the scaling feature, these hierarchical load-bearing items may be employed to highlight the city’s inherent distinctions [
12]. Due to the rules of physics not enabling humans to pass through solid structures or geographical obstacles and the fact that private flying aircrafts for teleportation are not yet prevalent, most human movement now follows lines of communication to their destinations. Ground transportation is a highly prevalent mode of transportation, and regardless of the kind of transportation employed, roads are the framework that allows us to travel conveniently and swiftly [
13]. When a city’s road network is employed as a research vehicle, the city can be split into a huge number of living structure units formed by the road network. Unit regions are discovered to have a heavy-tailed distribution rather than a normal distribution. That is, there are far more small units than large ones in terms of unit area. The units may be separated into two parts based on the mean value of all of their areas, with a small number of large ones above the mean value in the head and a large percentage of tiny ones below the mean value in the tail (for more detail, please refer to [
14]). A smaller unit’s placement suggests that the road network in its neighbourhood is denser and can support more people in terms of infrastructure and that the unit is more accessible in the greater urban road network than bigger units, allowing for more planned routes through the unit [
15]. The small units in the tail are categorized as natural cities, while the large units in the head are classified as rural regions [
16]. According to empirical research that uses New Economic Geography (NEG) models, the uneven distribution of economic activity in different sections of the city may be related to agglomeration economies, which are connected by accessibility [
17,
18], and spatial circumstances can benefit local firms through co-location [
19].
In the above-mentioned classical natural city generation process, the road networks and units are generated in 2D space. The city area and rural region are defined by the density of the road network intersections as urban infrastructure, with the denser area identified as the city area. During data processing, the names, capacities, speed limits, and other properties of the streets are ignored in order to remove human influence, and they are considered only as sides of the undirected graph. This means that the intersections of all roads are considered road intersections in the 2D space, while some of the 3D roads that may not intersect with each other are neglected. It could bring bias to the generation of natural cities.
The remainder of the work is organised as follows.
Section 2 compares previous researchers’ distributions and elucidates the relationship between their opinions and this work.
Section 3 introduces the methodologies of head/tail breaks, natural city generation, and level distinguishment.
Section 4 introduces the study area and datasets.
Section 5 reports a comparison between classic representation and modified representation.
Section 6 further discusses the implications of 3D structures in the city taken into consideration and points to future work. Finally,
Section 7 draws a conclusion.
2. Literature Review
Researchers have used several models to explore the distribution of human activity in cities, most of which begin with the displacement and direction of human movement trajectories [
20]. For example, Silm and Ahas [
21] studied human activity spaces in terms of form and cause, and Schönfelder and Axhausen [
22] measured the extent of activity spaces by quantifying the probability of each agent reaching a certain area. There are other studies that use human-generated data to mine human behavioural patterns, such as Gao et al.’s study of smartphone data to investigate the spatiotemporal aspects of behaviours [
23]. Yu et al. proposed a data-driven analytical framework to locate city areas with different functional characteristics in tourists’ travel reviews [
24]. Because cities are hubs of human activity, this data might indirectly reveal which places are city hotspots. The concept of living structures proposed by Jiang [
25] treats urban spaces as a whole and analyses the distribution of human activities intuitively from a fractal perspective. Contrary to the assembly of a mainframe computer, where the function of each part is known in advance, and the parts are combined in a clever way using spatial relationships to form a computer that can light up, cities can be seen as an organic wholeness built up by many successive small changes, with the property of growth in the accumulation of the temporal dimension [
26]. Buildings, towns, and cities may all have living structures, displaying self-similar fractal qualities and scaling hierarchy, a typical aspect of complex systems. These living structures also interact with one another. When structures at the same level are treated as nodes, the connections between them do not have a path between every two nodes, as in a strongly connected graph, but instead, follow the degree distribution in a scale-free network. Their degree distribution follows a heavy-tailed distribution rather than a specific mean indication [
14,
27].
In Alexander’s and Jiang’s work [
14,
28], urban structures are delineated at different levels, which suggests that there are far more small objects than large ones [
8] and indicates living structures in cities. The smaller ones represent the hotspots of the city and carry most of the urban functions. Small objects and the city can be viewed as a hierarchy in terms of spatial relationships, assuming that the city can be viewed as a wholeness and that within the city, it can be subdivided into levels based on the functions it carries, such as the composition of the transportation network, and the history of the city’s development; this is similar to how the grain of a leaf of different thicknesses located on the leaf blade distributes in the leaf flesh tissue for transport and support [
29]. The borders utilized to identify the primary level of the hierarchy are like thick leaf veins that sustain the city’s basic framework. The greater the level of hierarchy, the greater the presence of little living structures.
Previous studies on 3D urban spatial structures have been based on remote sensing data. By adopting high-resolution remote sensing data, Huang and Wang explored the effect of 3D urban spatial morphology on land surface temperature in different urban functional zones at a fine scale [
30]. Chen et al. exploited the nighttime light intensity of the earth’s surface to identify locations and borders of urban centres [
31]. Wu et al. delineated 3D building characteristics from high-resolution light detection and ranging data, then extracted and differentiated local building patterns [
32]. Yang et al. used the Mobile laser scanning (MLS) technique to extract and delineate 3D roads composed of many road cross-sections to obtain complete, correct, and high-quality roads [
33].
Some studies on 3D road networks have considered the interaction between urban road networks and citizens. Sun et al. studied Hong Kong’s three-dimensional pedestrian network, dividing the roads into multi-height levels, and found that pedestrians needed to travel much longer distances in the three-dimensional urban structure than in the road network and required more time to reach their final destinations when using footbridges or underpass facilities [
34]. Chen et al. blended digital surface models (DSM), OpenStreetMap, and FABDEM to extract a large-scale 3D urban analysis that considered the verticality of the urban road networks; the model can be used as a tool to estimate time and fuel consumption through traffic congestion [
35]. The study by Yeh et al. helped vehicles distinguish which level they are currently in when drivers travel to a multi-layered road network using the angle difference method [
36].
The literature review revealed multiple research gaps: (1) The classic natural cities generation method was limited to a two-dimension earth surface; it did not take into account the complex 3D situation of a metropolis area and did not respond to the trend of human activities expanding toward the vertical dimension. (2) The studies focusing on 3D urban spatial structure were based on the city model restored from the building level. They did not use roads as materials for analysis. (3) Some studies did not regard the city as a complex system and did not consider the relationship between the small units of the city to have a hierarchy.
This work aims to consider 3D road networks in the process of natural city generation. The improved model will show more clearly the inherent spatial architecture of the city and will be more in line with human spatial perception, helping people to understand the morphology of the city.
3. Methodology
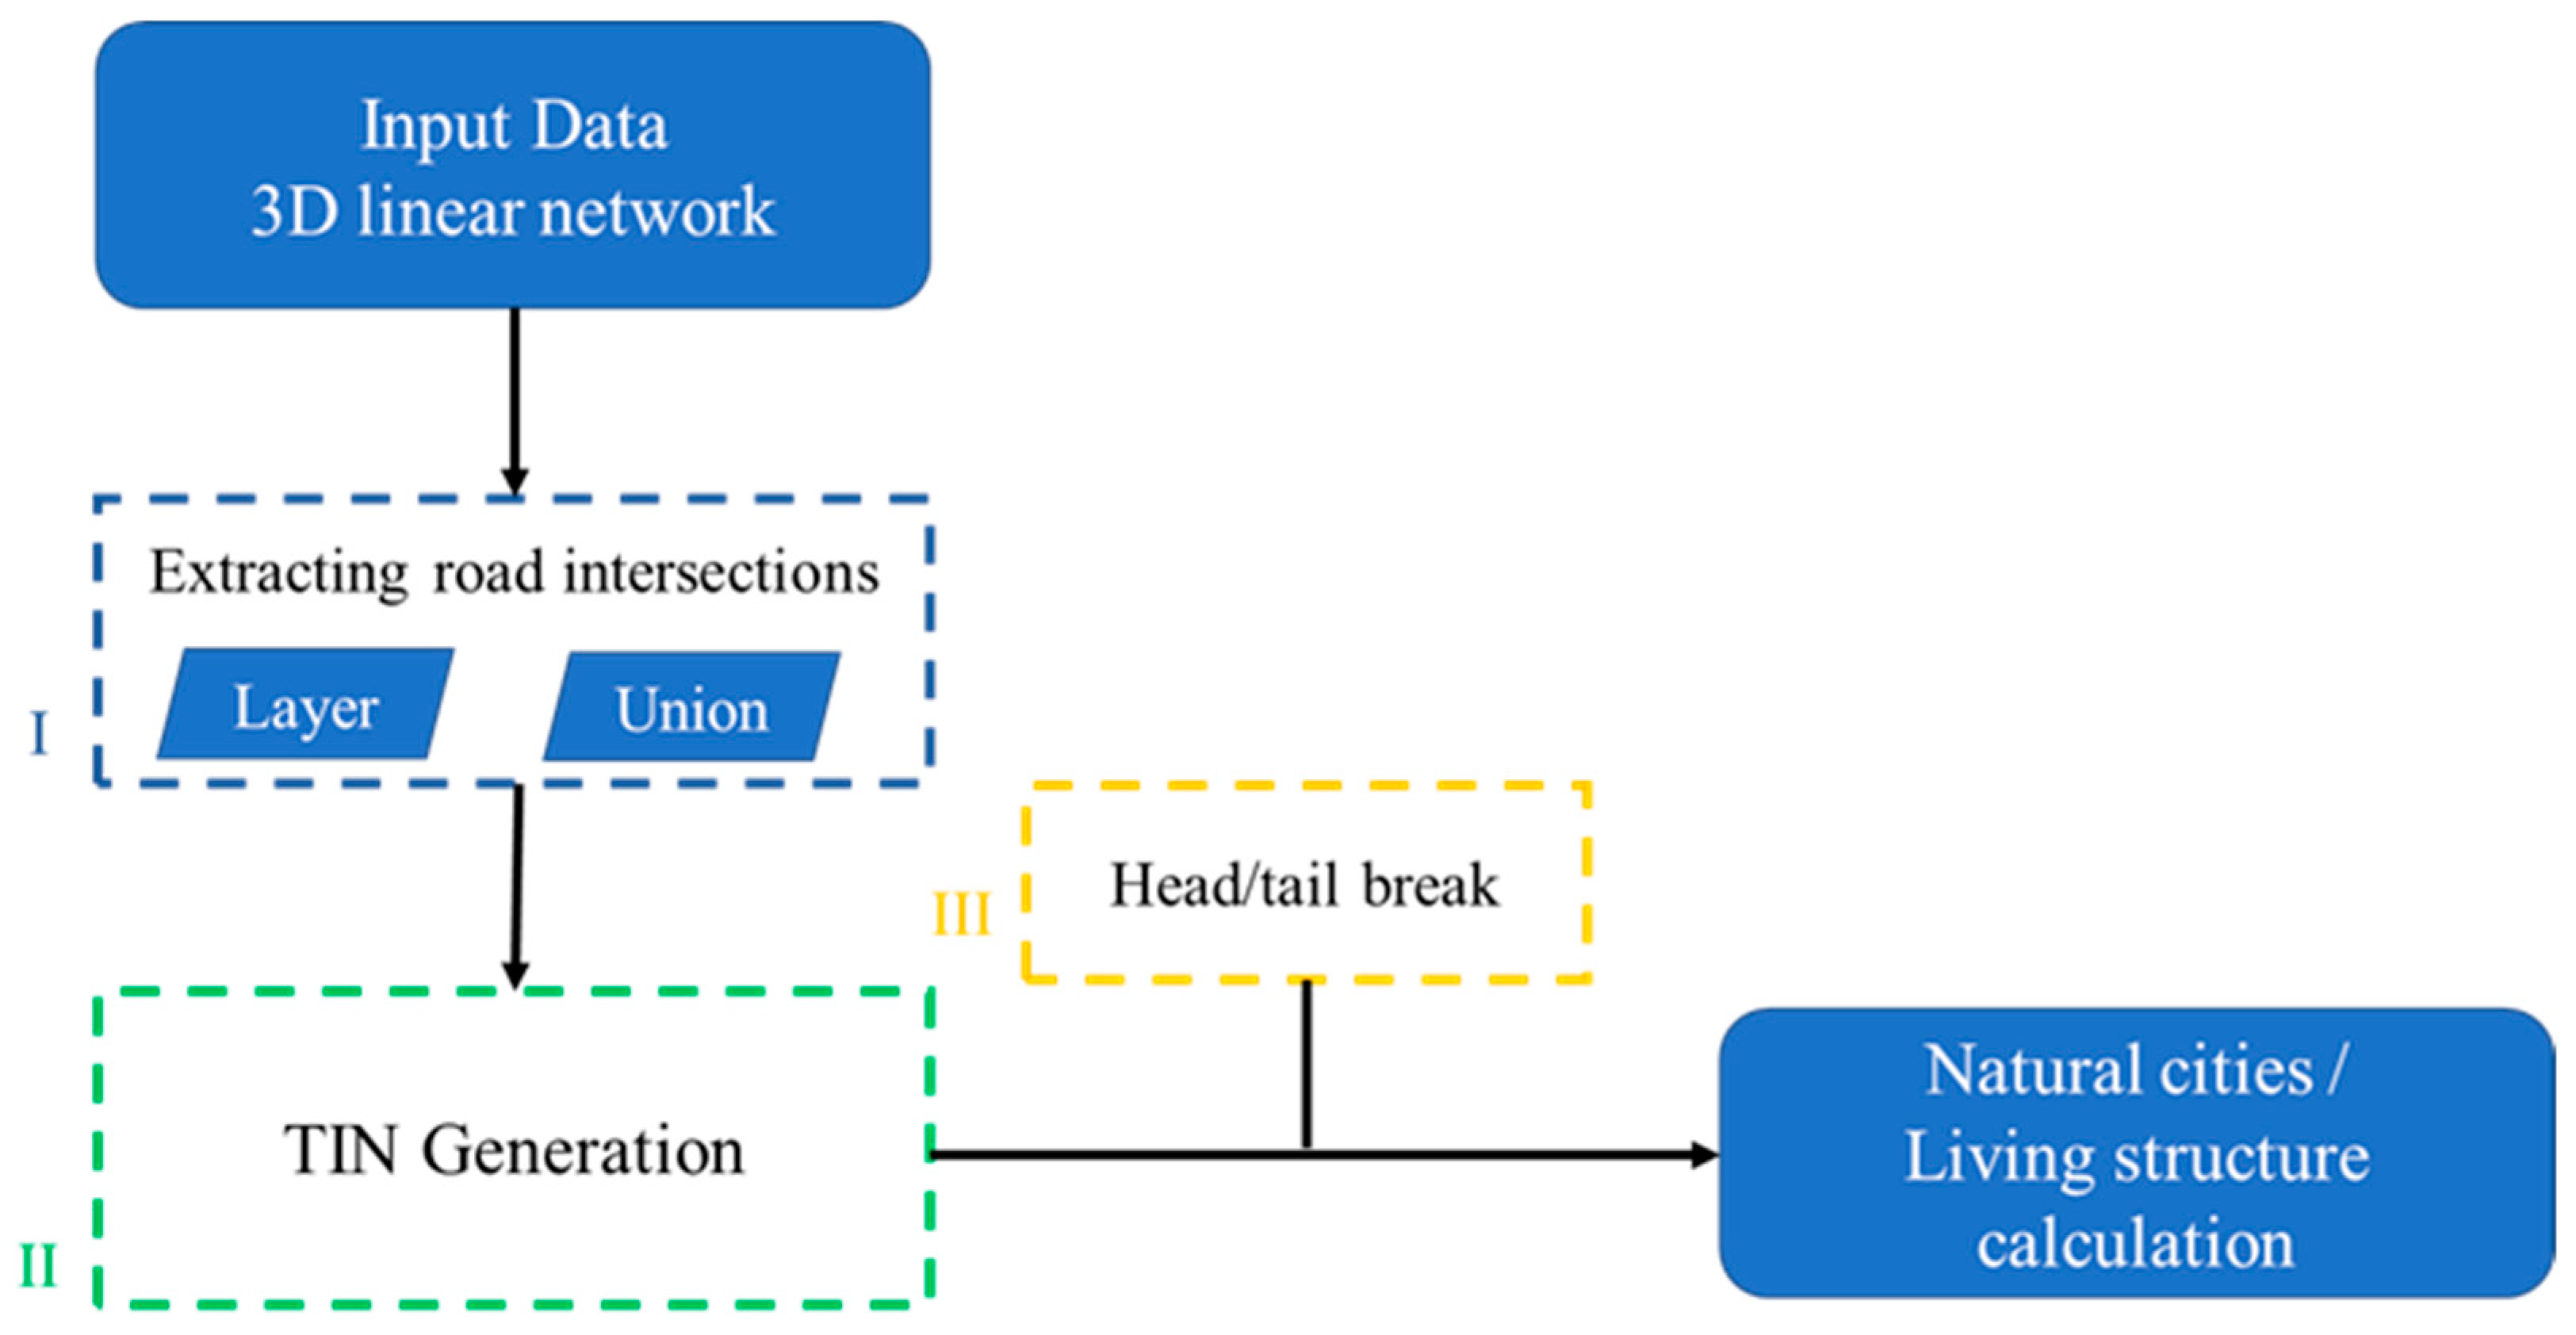
An analytical framework is proposed in our study to interpret natural cities composed of three-dimensional living structures. As shown in
Figure 1, the proposed framework includes three important parts: (1) extracting road intersections from 3D road networks; (2) creating a TIN (Triangle Irregular Network) based on 3D road intersections, and (3) using head/tail breaks to classify polygons in a TIN.
3.1. Extracting Road Intersections
Road intersections serve as the basis for the formation of natural cities; the greater their density, the greater the accessibility of the region to inhabitants, which can be used as an indicator of whether the area is suitable for urban function. As a result, detecting road intersections from road data is the initial stage in data processing. The classic model extracts road intersections by projecting the geographic data of the road network onto a plane, then locating the line segments whose topology intersects and using their intersection points as road network intersections. This strategy is simple to grasp, and the operation is ideal for popularizing the concept of natural cities.
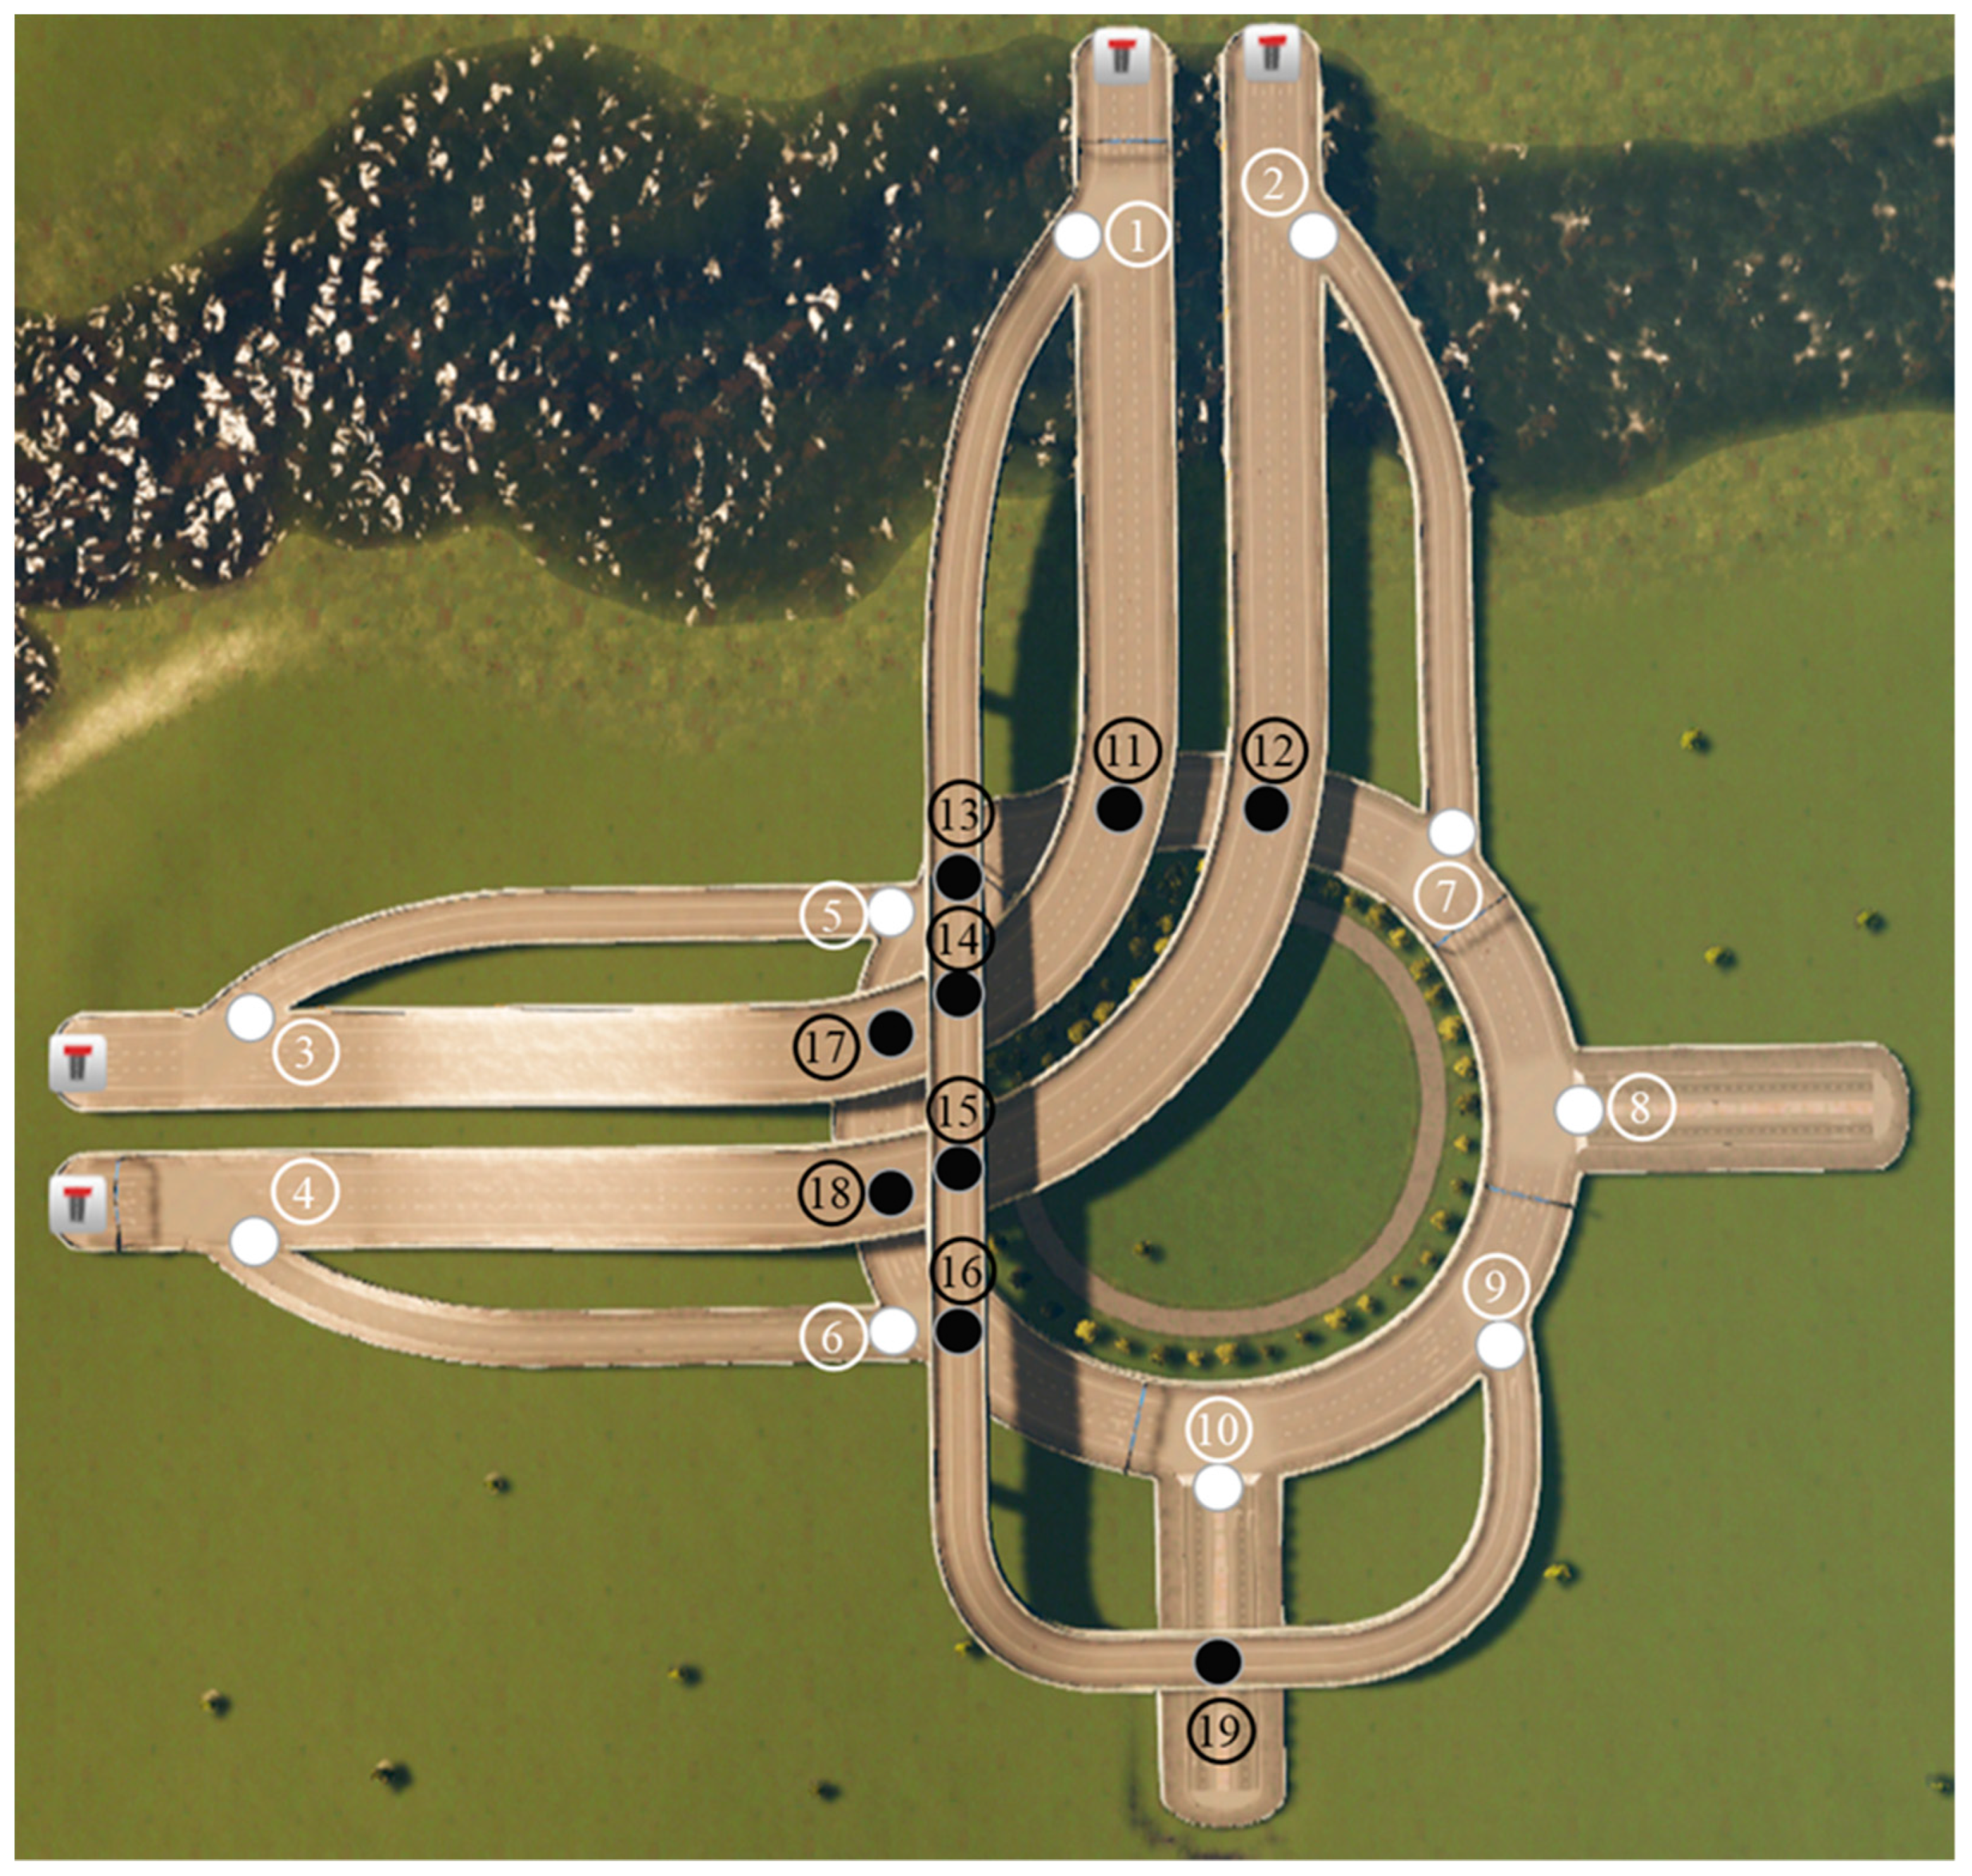
This work adds to the step of layer identification for matching relationships that exist in cities where roads have intersections in the two-dimensional plane but are skew lines in the vertical dimension. A sample of 3D road networks at different levels (heights) is illustrated in
Figure 2, whose three-dimensional road layout is highly distinct. Without considering 3D roads, there will be 19 intersections (No. 1–19, both dark and light nodes). In this work, the 3D information of roads is collected and considered; thus, the 9 intersections (No. 11–19, dark nodes) will not exist anymore.
Nevertheless, the dark intersections in
Figure 2 exist only in two-dimensional coordinates, and there is no possibility of switching road access at this location for vehicles on a cascading elevated road or for walkers in the shade of an elevated road. Light intersections are nodes that have physical access and connect roads of different levels. This work uses the Layer field in OpenStreetMap to find roads that cross or overlap in topological relationships, avoiding roads of different levels from generating road intersections. The pseudocode for the functional implementation is as follows:
![Smartcities 06 00070 i001]()
Due to the formation of OSM data, the road features are made of numerous short line segments; it is necessary to eliminate the influence of vertices between line segments. We dissolved the same named roads when they had a common endnote without creating multipart features. To find the intersection of a road and other roads, the other roads are dissolved into a whole in each operation in the loop to reduce computation time. Otherwise, the number of roads in the city is so large that computing one by one according to the named roads would take a lot of computation resources and computation time. Furthermore, by restricting the calculation to a specific level of roads, this phase does not generate non-existent intersections.
3.2. TIN Generation Using Road Intersections
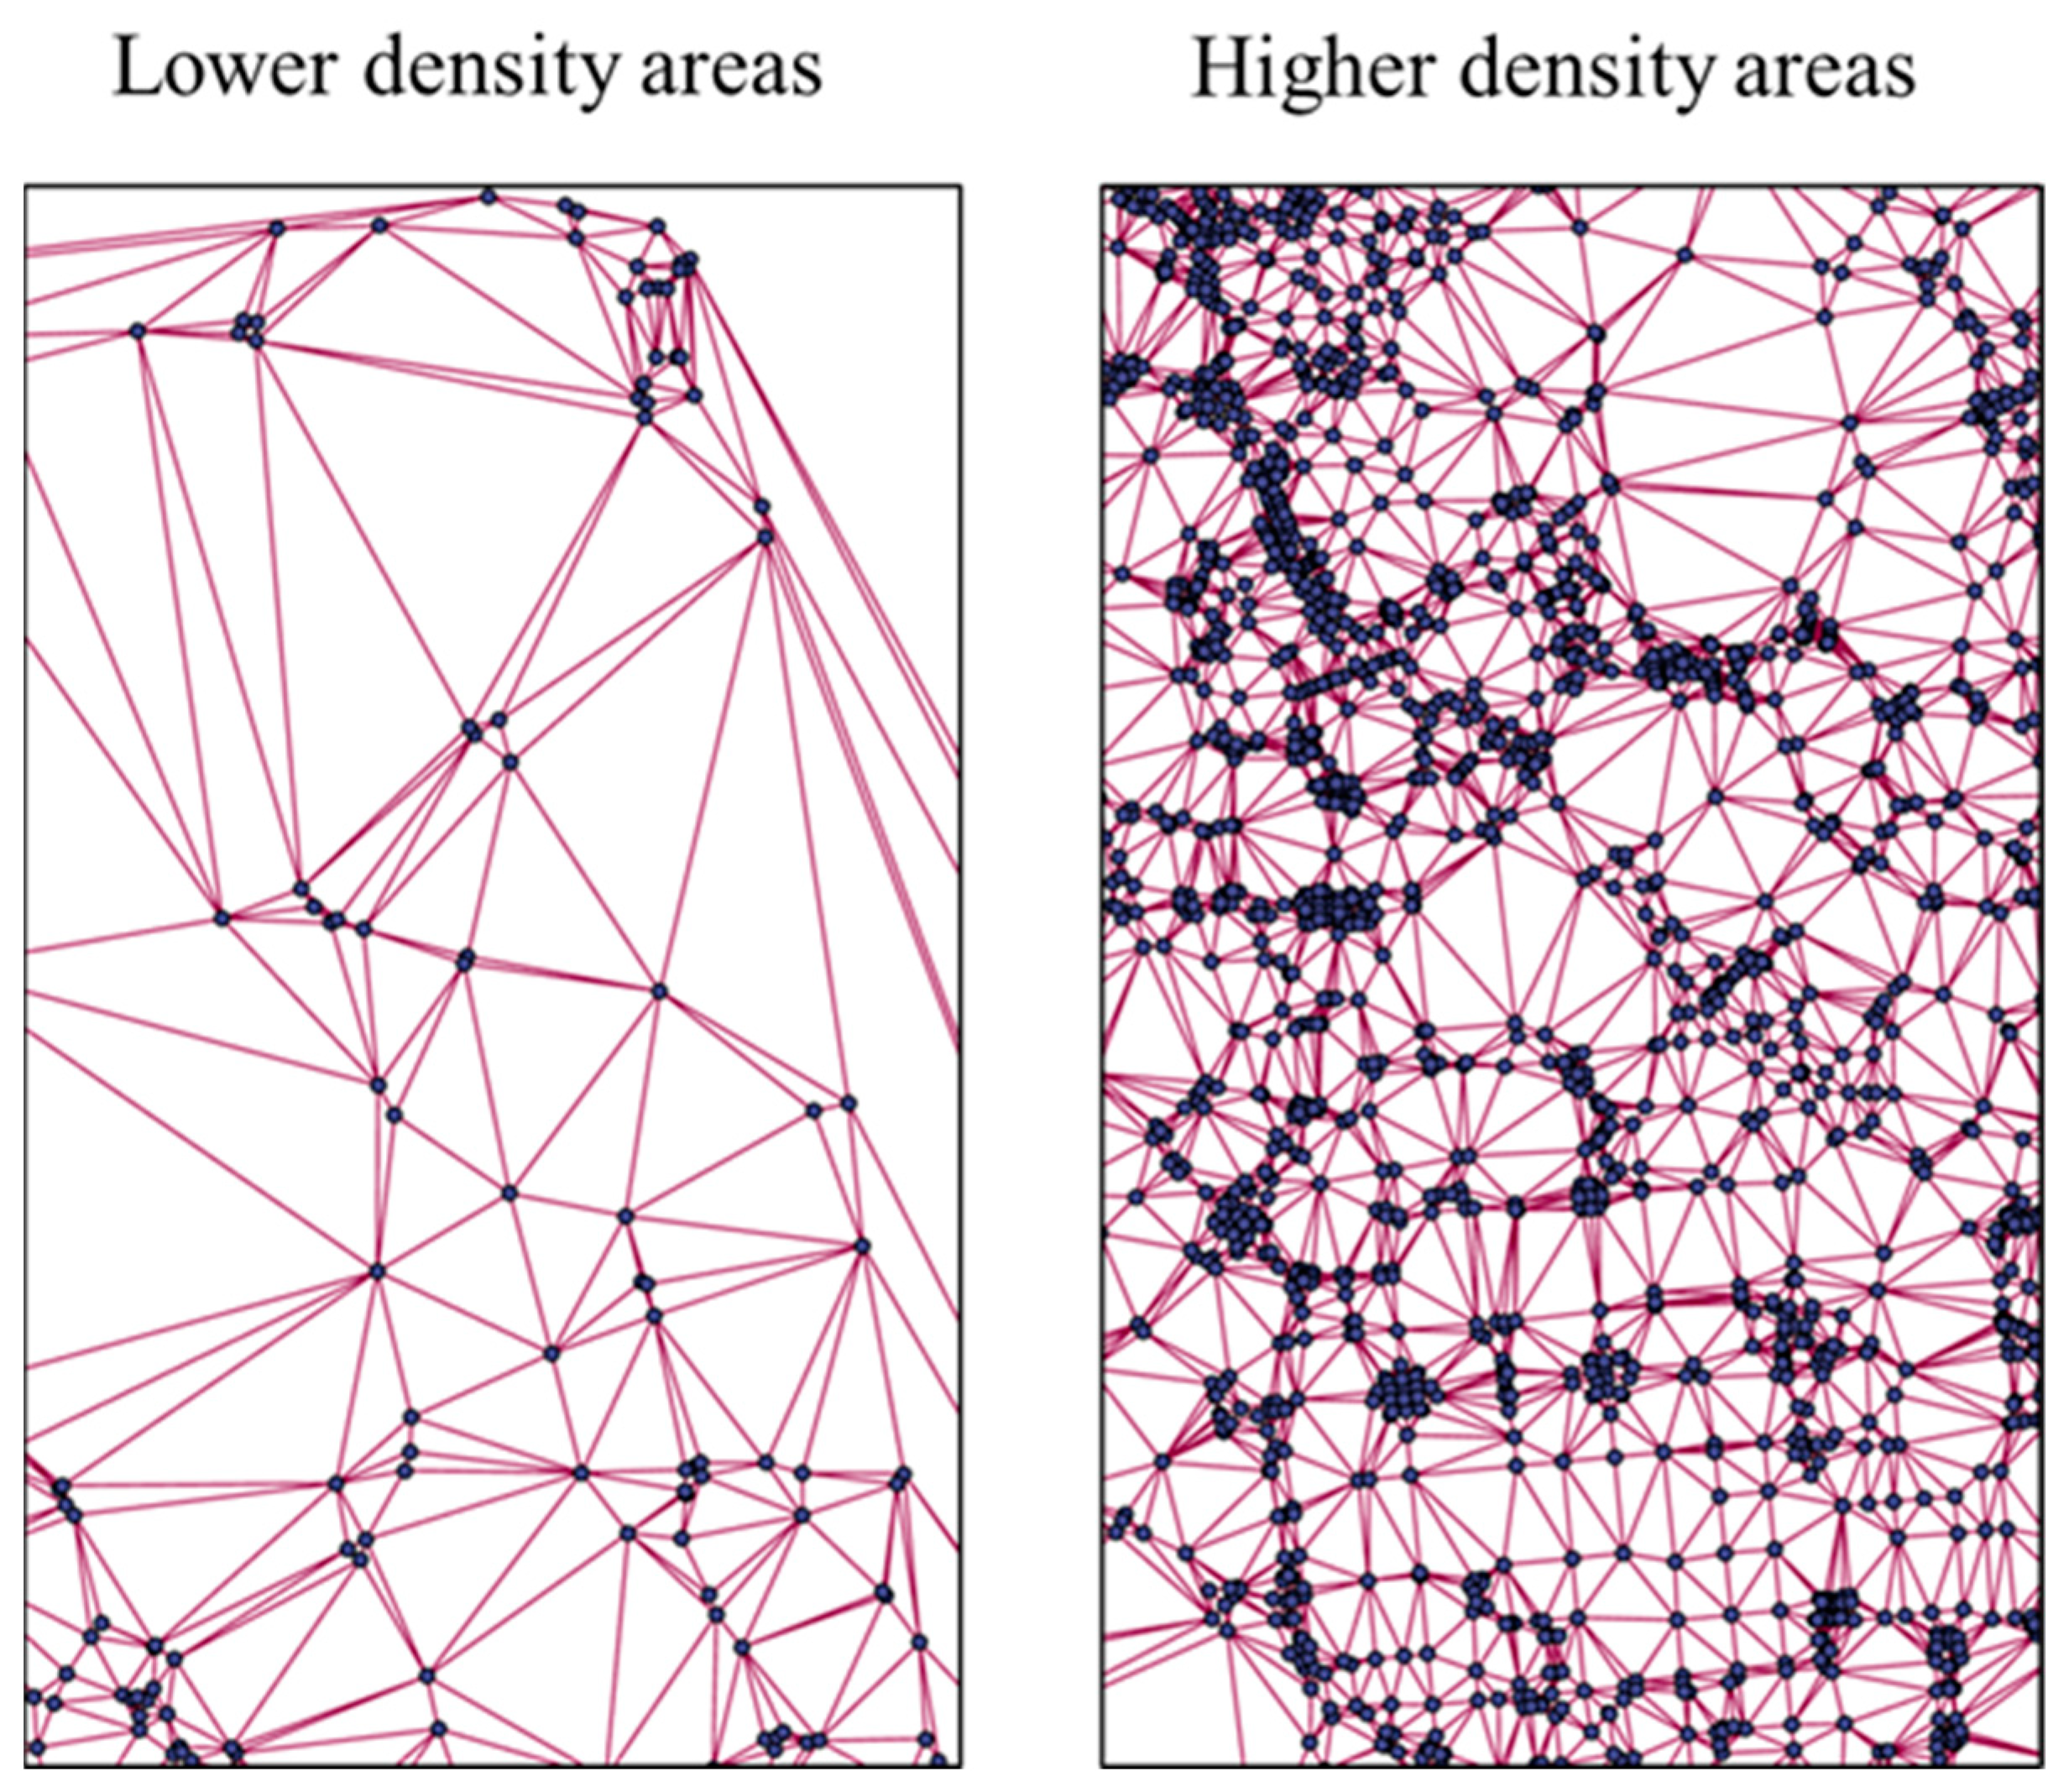
A triangulated irregular network (TIN) is a network that contains a number of small triangles and is composed of only small triangles [
37]. In areas where nodes are dense, this also means that the surface of this area is complex, and triangles of relatively small size are generated, as shown in
Figure 3. The triangle is larger in areas where the ground situation is simple. The TIN, based on the road intersection, is an important technical node for moving the object of study from the point to the surface and a convenient tool for discovering living structures in the city.
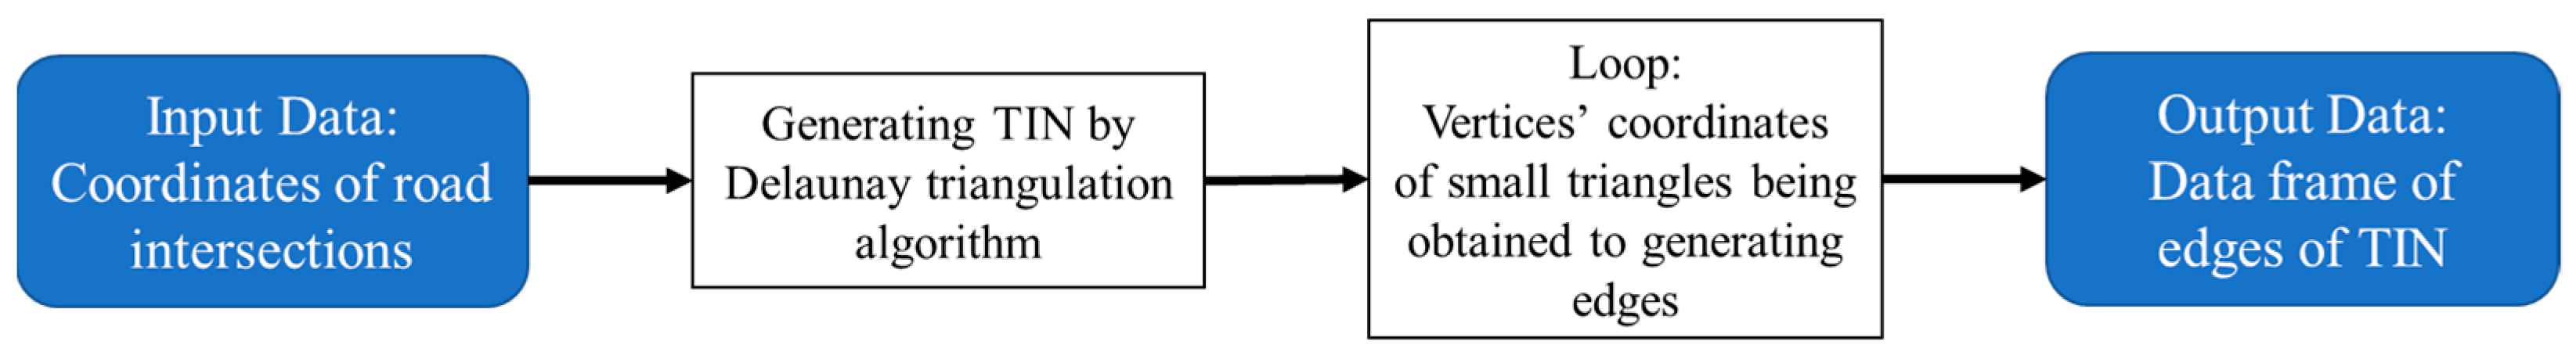
The Delaunay triangulation procedure is employed in this work to build TINs, with each triangle represented in code by the number of its three vertices, which are ordered in counter-clockwise order. Each edge is generated by the coordinates of its own two vertices, stored in LineString format. The flowchart for this step is as follows (
Figure 4):
3.3. Head/Tail Break Classification of Polygons in TIN
The edges mentioned in
Section 3.2 are objects of the head/tail break classification. It should be noted that although these edges are also linear objects, they are not road segments in the city but rather edges of TINs generated by road intersections, as shown in
Figure 5a.
Figure 5b shows that the lengths of the edges in a city are arranged in order from long to short, which conforms to the long tail distribution, and there are a large number of short-length edges [
14]. The arithmetic mean of the entire sample is used as the dividing line between the head and tail parts in this work. Edges with lengths less than or equal to the arithmetic mean are considered the tail part, whereas edges with lengths larger than the arithmetic mean are considered the head part. It is worth mentioning that this technique can be employed not only in data from the entire sample but can also continue to separate new head and tail parts in the head or tail part after the initial repetition. These new areas can be considered the true centre of the city or the true countryside. Polygons surrounded by short edges can be generated by passing the edges from the tail part into the shapely package’s polygonize() method. In TIN, each polygon is made up of many triangles; therefore, these polygons contain all of the road crossings that are enclosed by shorter edges. The area surrounded by these polygons is the area of the city where the road network is relatively dense, accessibility is good, and it is suitable for gathering human activities, that is, natural cities.
3.4. Living Structure Calculation
In a previous study, Jiang and Rijke [
38] proposed a quantifying approach for calculating the beauty of an image. Its operation method is to convert images containing objects into binary images, find connected domains composed of only dark pixels or light pixels in binary images, and apply numbers of monochrome pixels that make up each connected domain to head/tail breaks. Since then, the whole image can be regarded as a collection of connected domains with different areas of hierarchy. The structural beauty degree of this picture is the hierarchy level multiplied by the number of connected domains. This work refers to this thinking and combines it with natural cities, applied to measure the complexity of living structures with multi-level characteristics. This is a subset of the beauty degree mentioned above. This is also an application to understand spatial heterogeneity. The road network can be divided into different groups according to the layer. The ground layer is the earliest and most basic road facility in an area. The farther the vertical position from the ground road is, the higher the level of the hierarchy is. The presence of high-level roads gives this natural city a more complex structure, and its weight in the calculation will be greater from a recursive perspective. Thus, the degree of living structure complexity(
L) can be formally defined by
where
S is the number of living structure units,
H is the absolute maximum value of the number of layers located in a natural city, and
i is the layer.
5. Results
In this section, the distribution of modified natural cities and their key spatial patterns are described. Then, the largest natural cities in terms of area will be presented. Finally, the dissimilarities between the natural cities generated by the improved model and those generated by the classical model are described.
5.1. Finding about Study Area
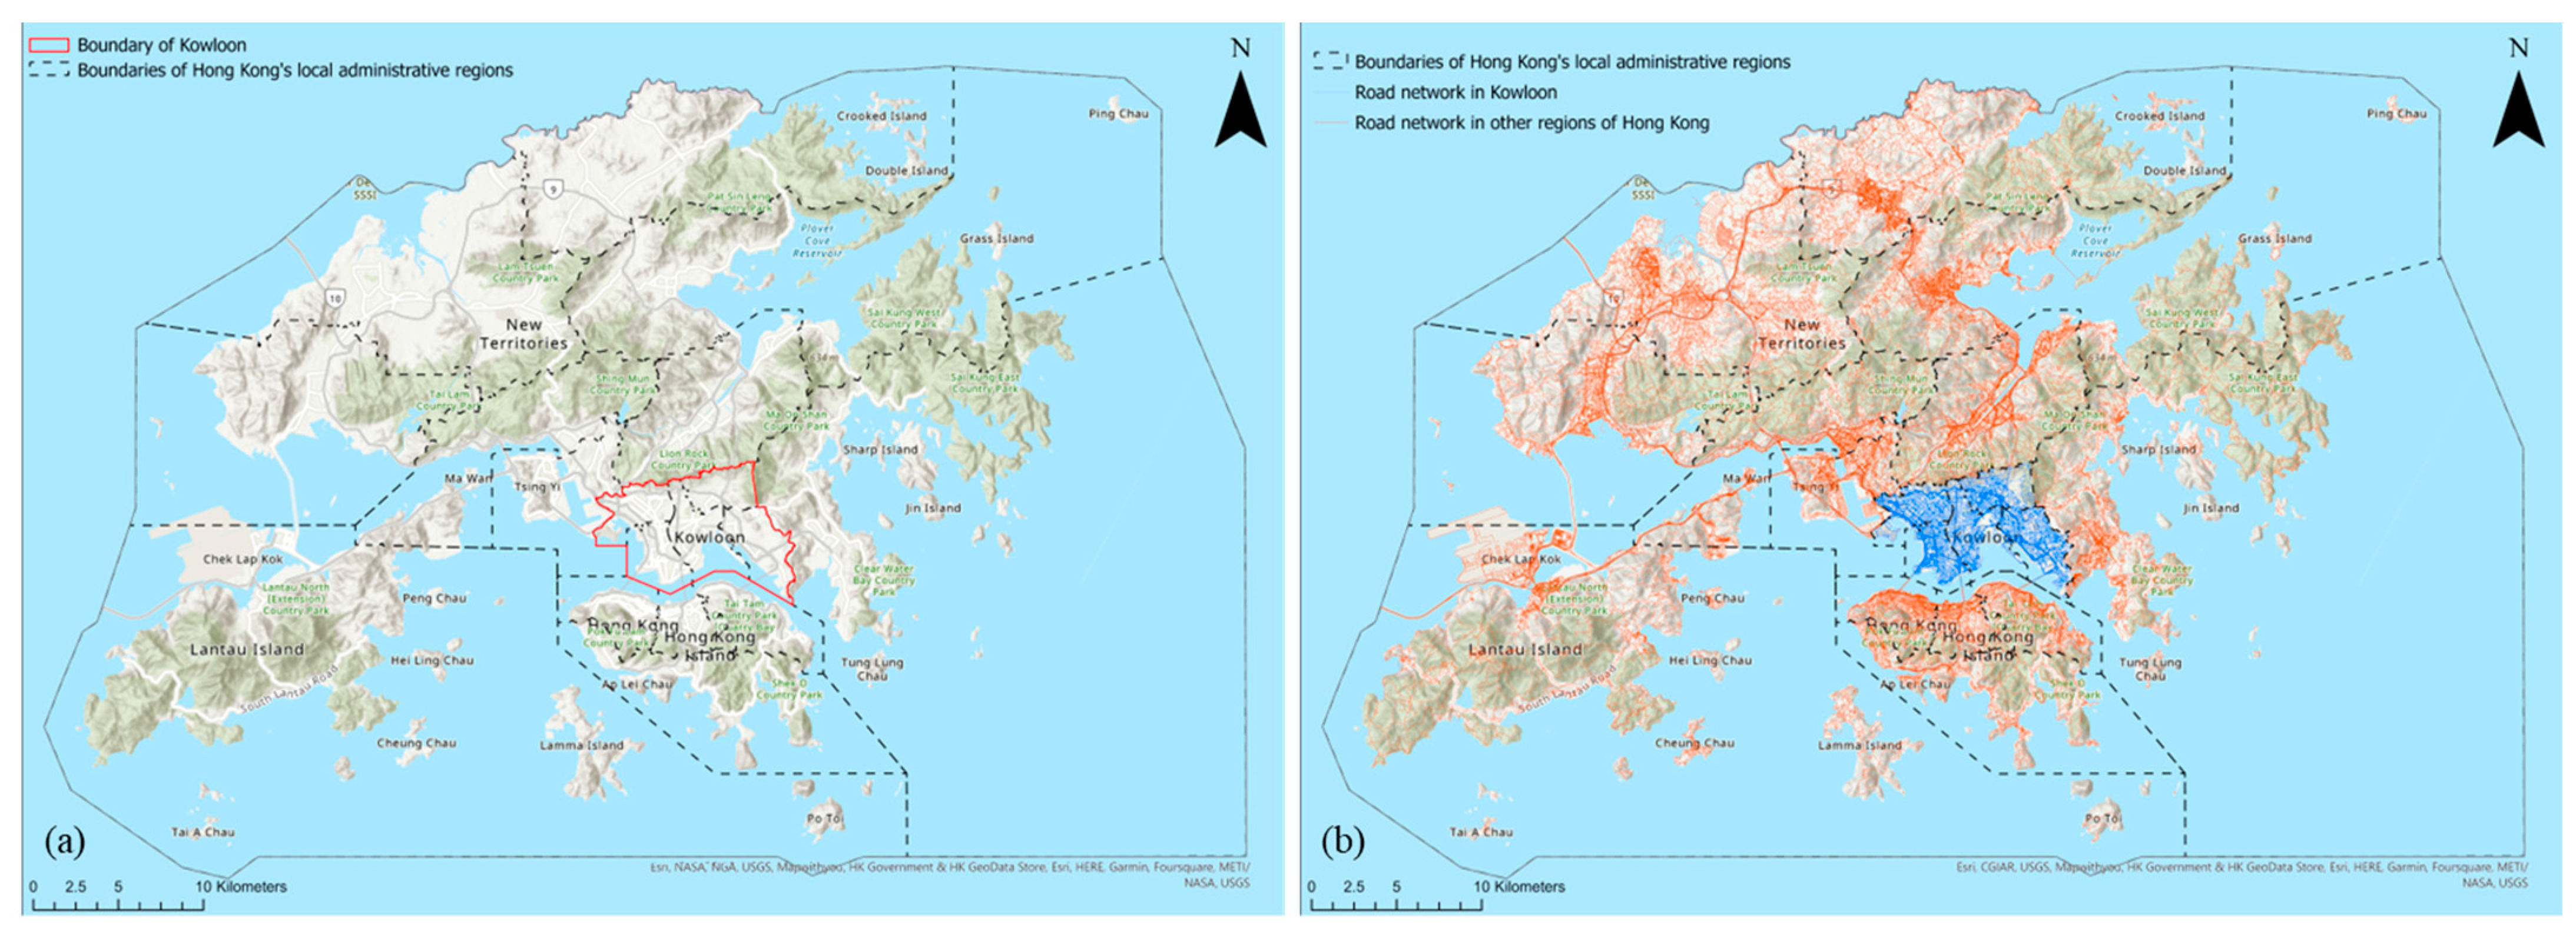
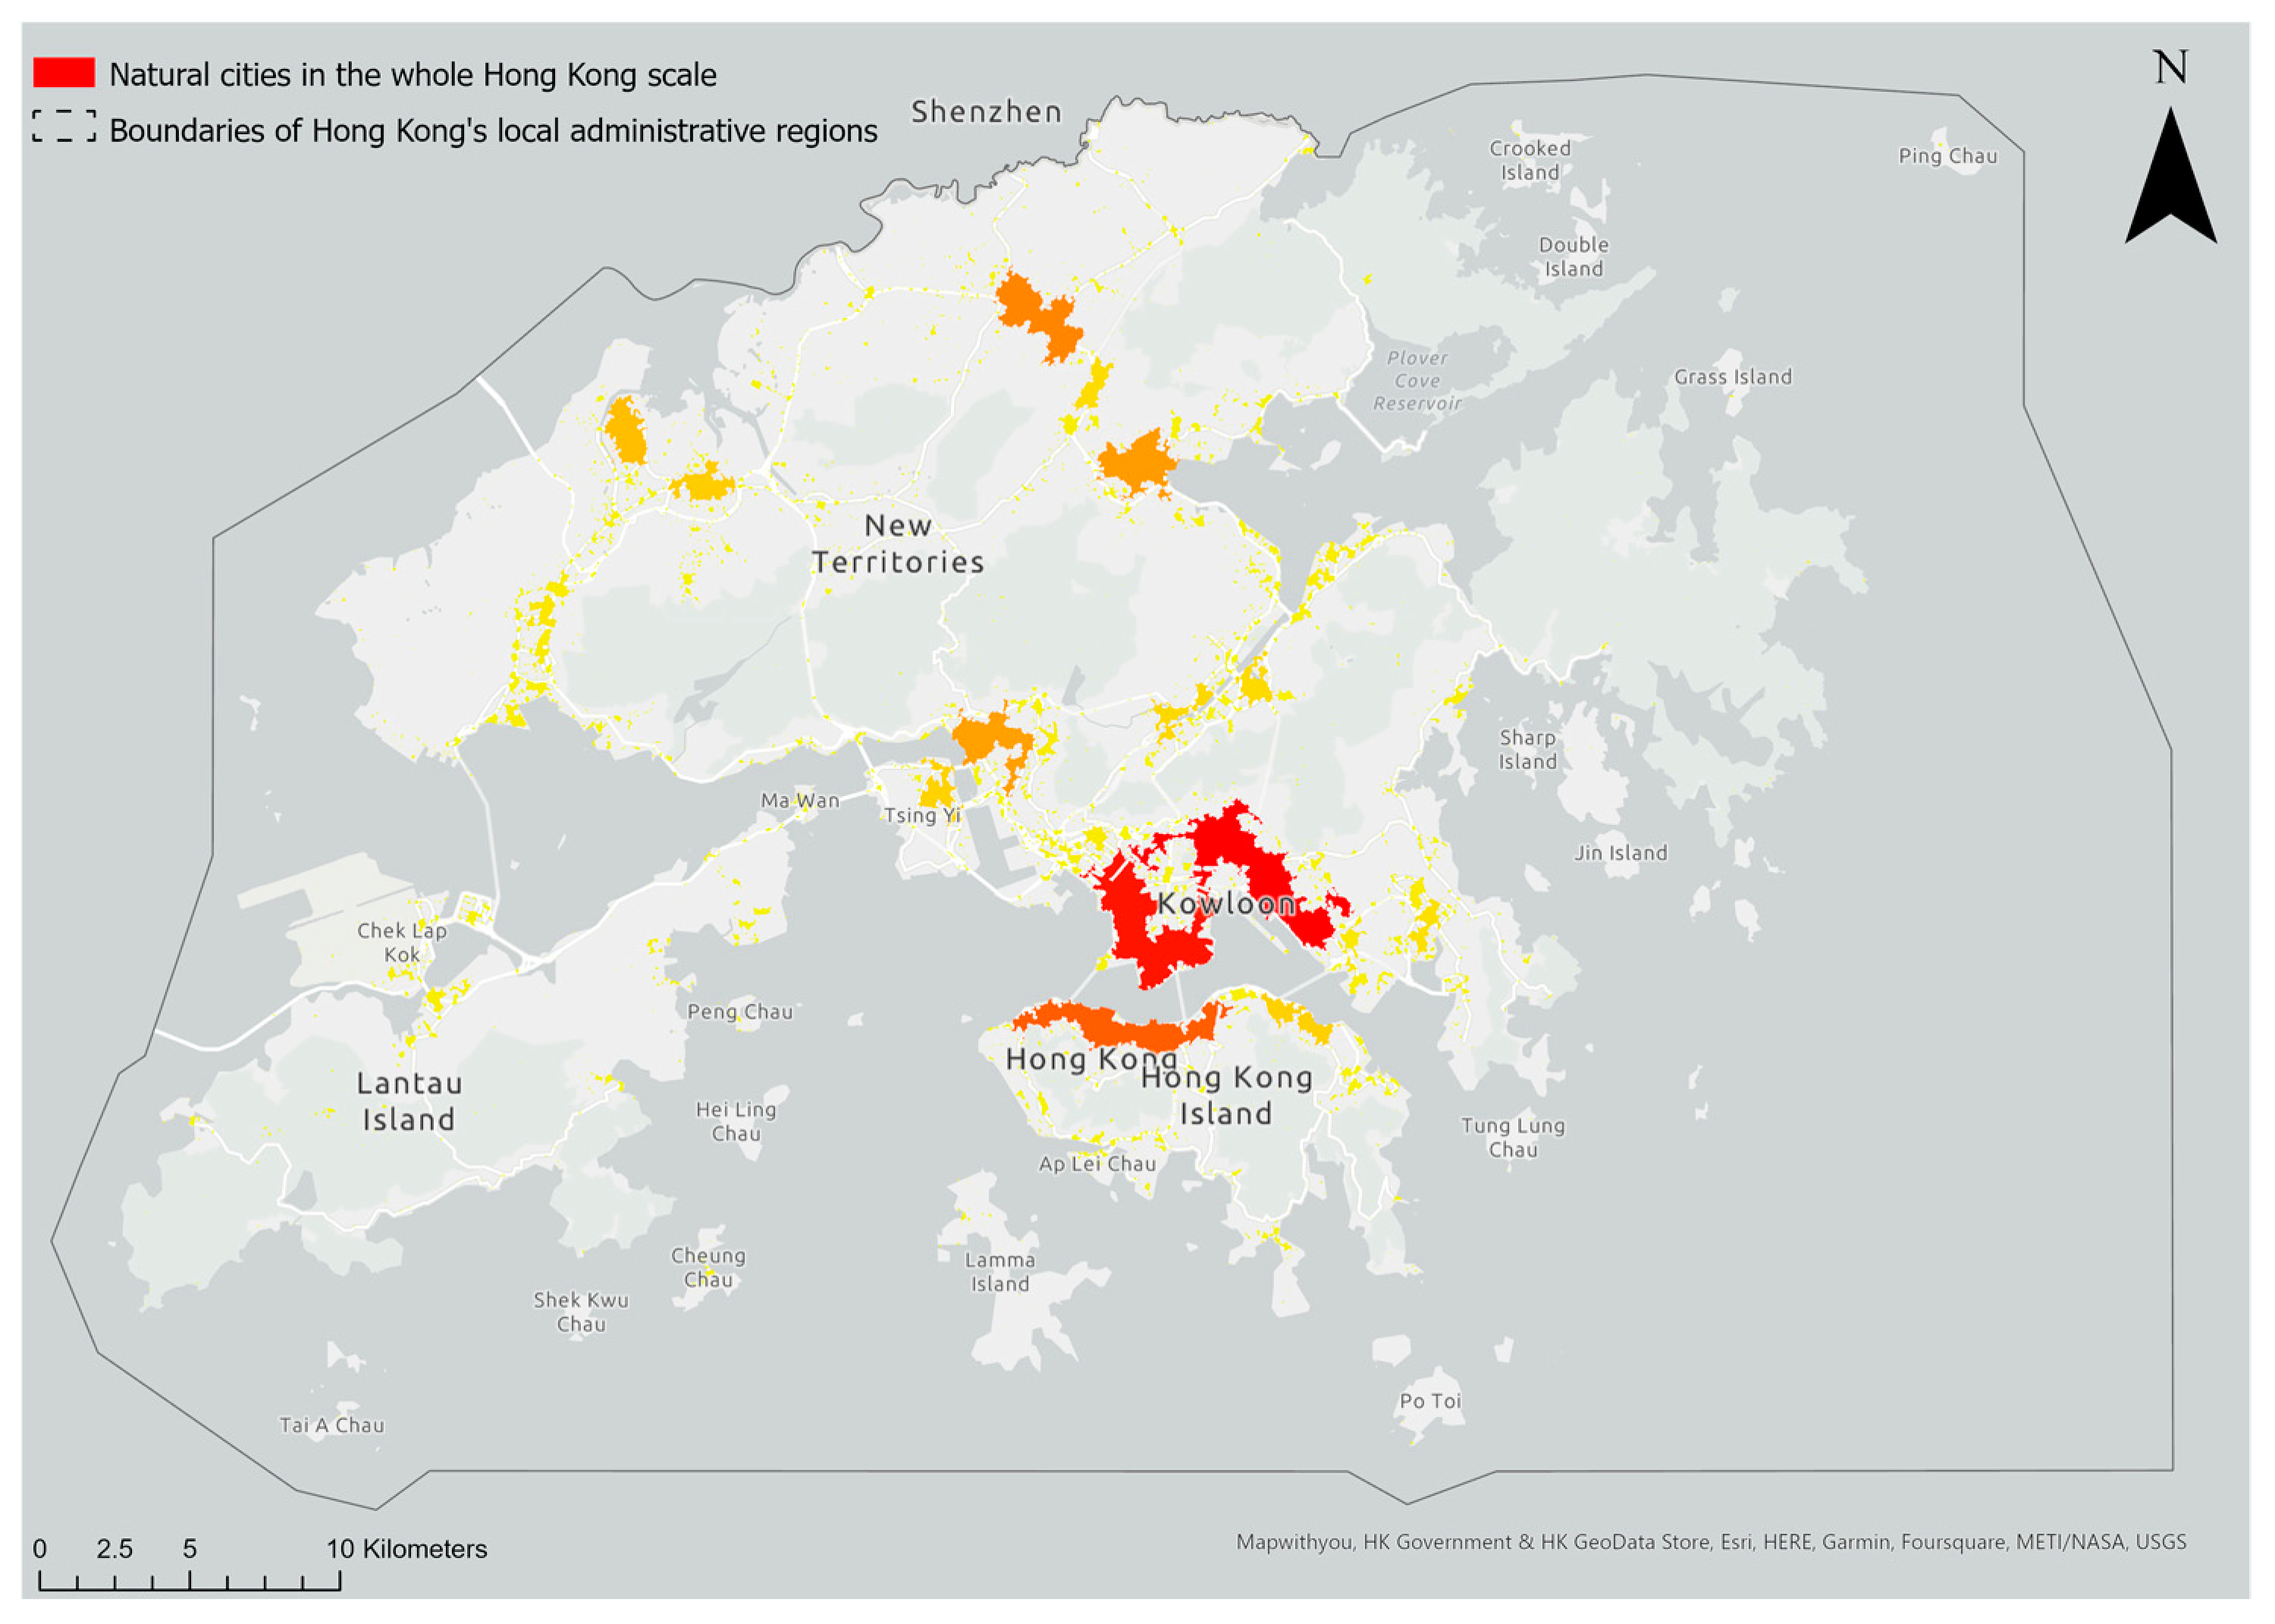
Besides Kowloon being a relatively independent geographic unit, another reason for choosing Kowloon as the study area is the result of the classical natural city generation method based on the whole of Hong Kong. As shown in
Figure 7, the Kowloon area contains several of the largest polygons in descending order of area. This result is also very interesting because it has long been believed that Hong Kong Island is the most developed metropolitan area in Hong Kong. It is vital to emphasize that this is an iteration in thought, not data, as previously mentioned because the full set of data has changed.
5.2. Distribution and Key Spatial Patterns
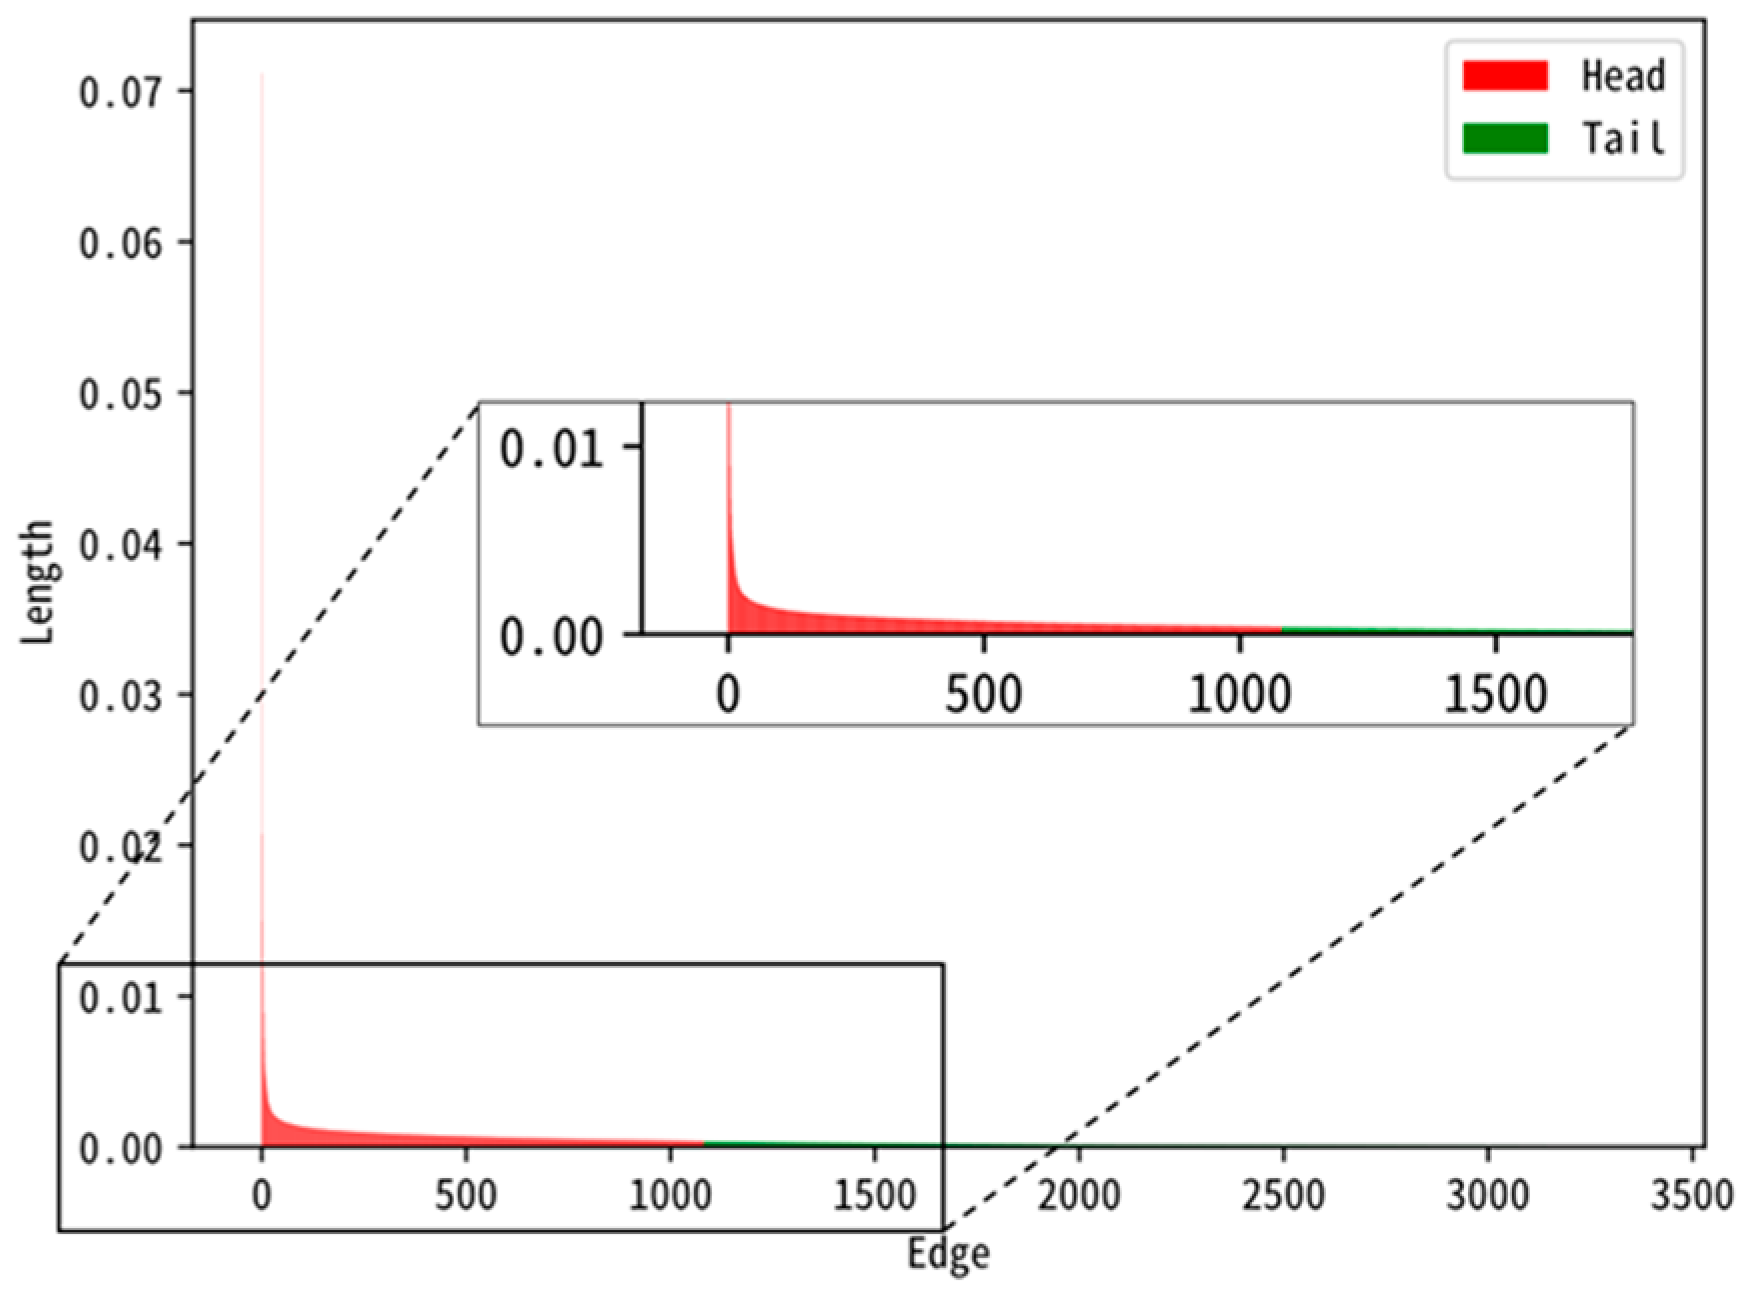
In the classic model, there are 76,991 road intersections in Kowloon. If a pilot with great eyesight flew over the entire Kowloon area, he would observe how many crossroads there are. The number of road intersections is 62,577 when the modified model recognizes that the roads are at different levels and only considers real-world intersections, a drop of 18.72% from the initial result. If the TIN edges generated by the new model are ordered from long to short, they still follow the long-tail distribution, as shown in
Figure 8.
This work is not an inquiry into whether the area of a natural city conforms to a power-law distribution but to what extent it does. Therefore, this work goes further and uses the least squares fitting method to examine whether the area values of natural cities are consistent with power-law distribution. The least squares fitting method is a mathematical optimisation technique that minimises the total fitting error by minimising the sum of squares of the errors to find the best functional match for the data [
39]. Compared to other research that uses the maximum likelihood method to fit the regression function [
40], the least squares fitting method is optimal in fitting the sample data, while the maximum likelihood method maximizes the probability that the fitted function fits the sample data [
41]. As shown in
Figure 9a, the area of the natural city generated by the modified model conforms to the power-law distribution, with a coefficient of determination
R2 very close to 1 The modified model does not violate the a priori conclusion that the distribution of units connected by urban road networks is a scale-free phenomenon. The charts for the probability density function, as shown in
Figure 9b, and the cumulative distribution function, as shown in
Figure 9c, also confirm the existence of power-law distributions in natural cities.
5.3. Typical Area of Natural Cities
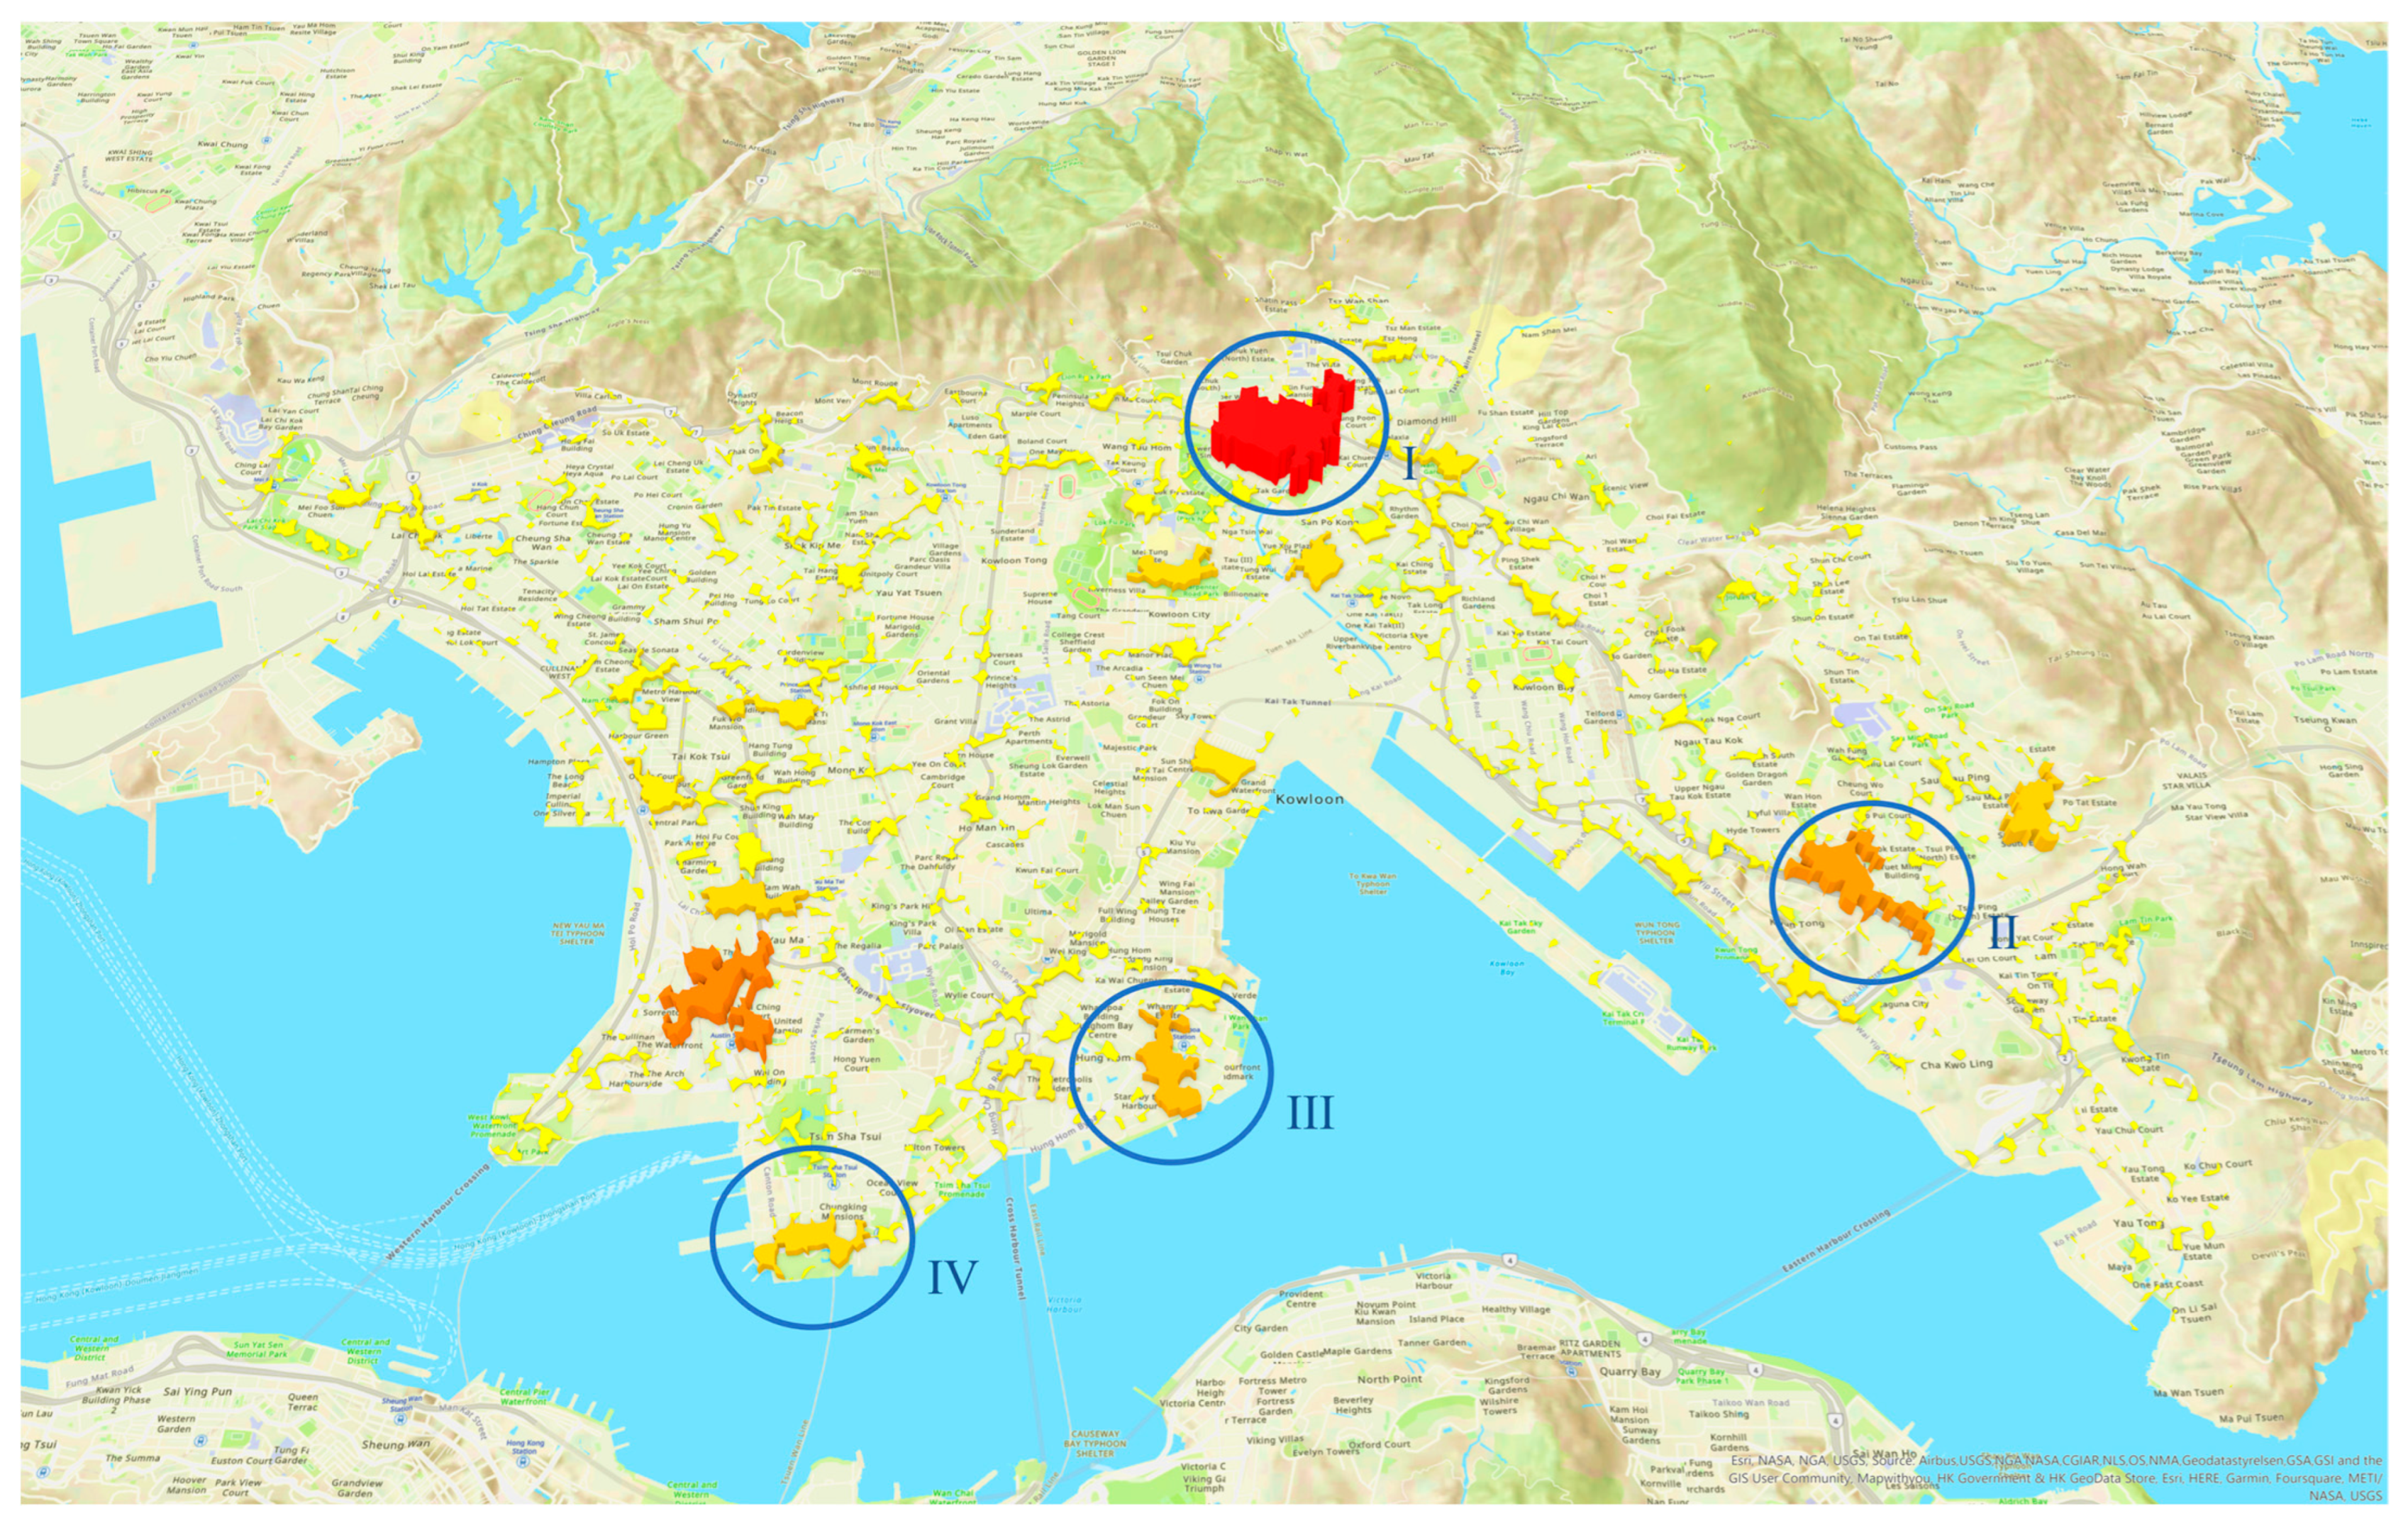
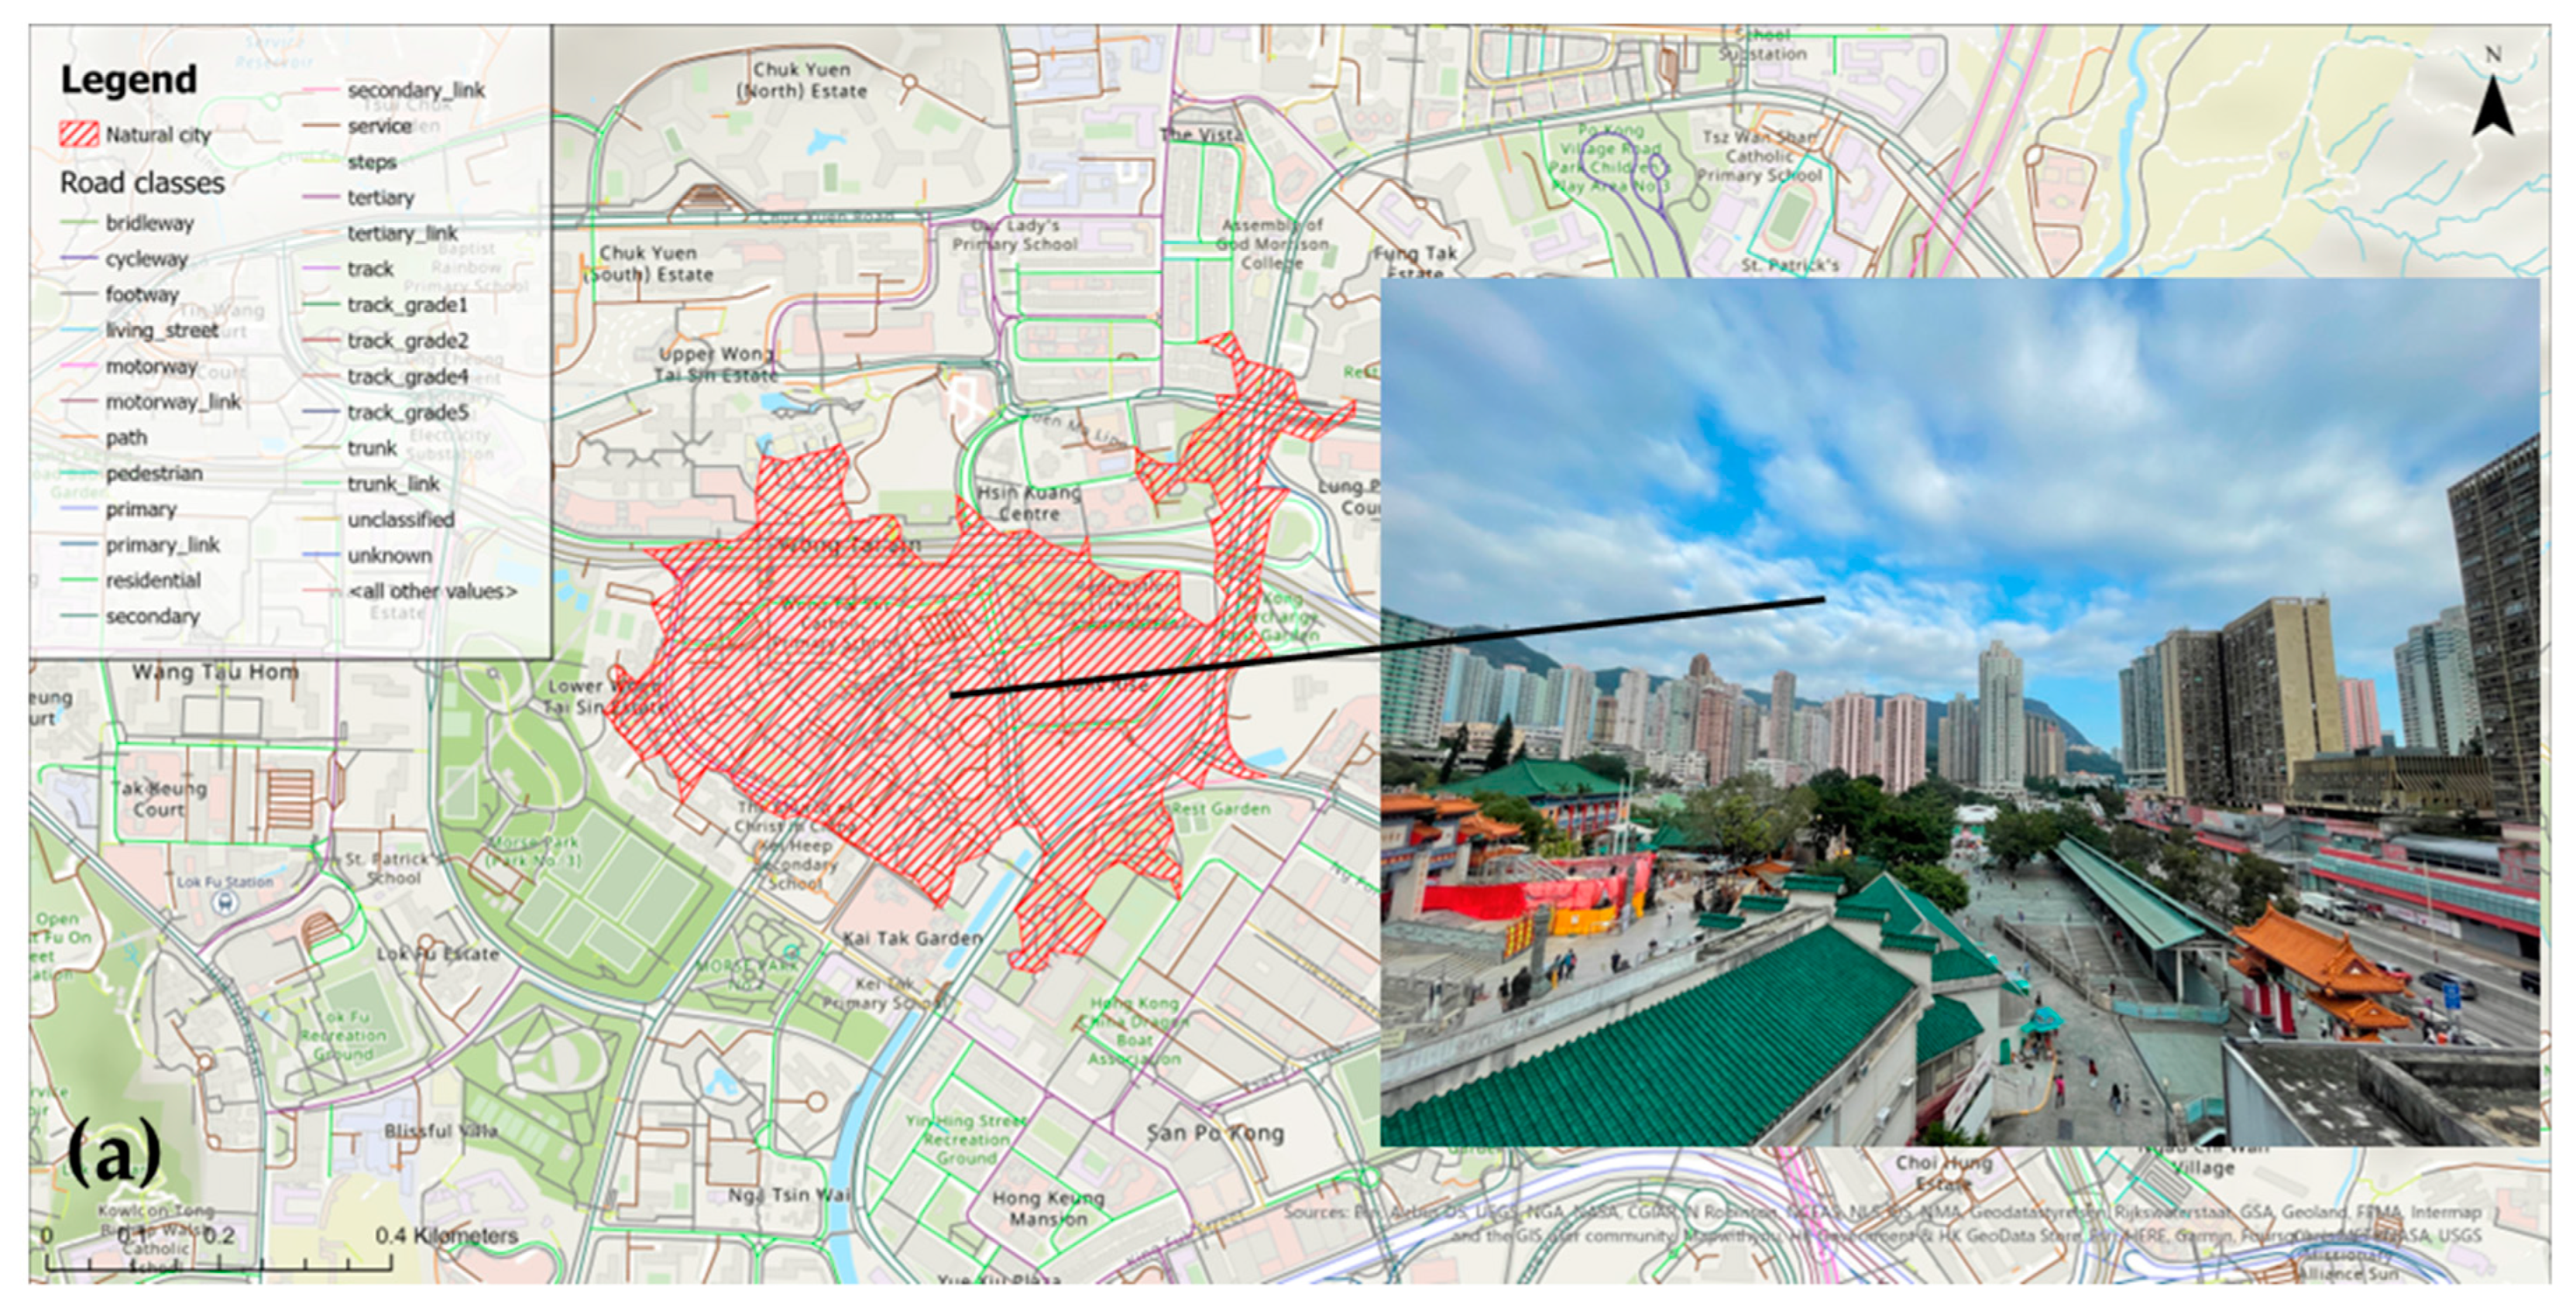
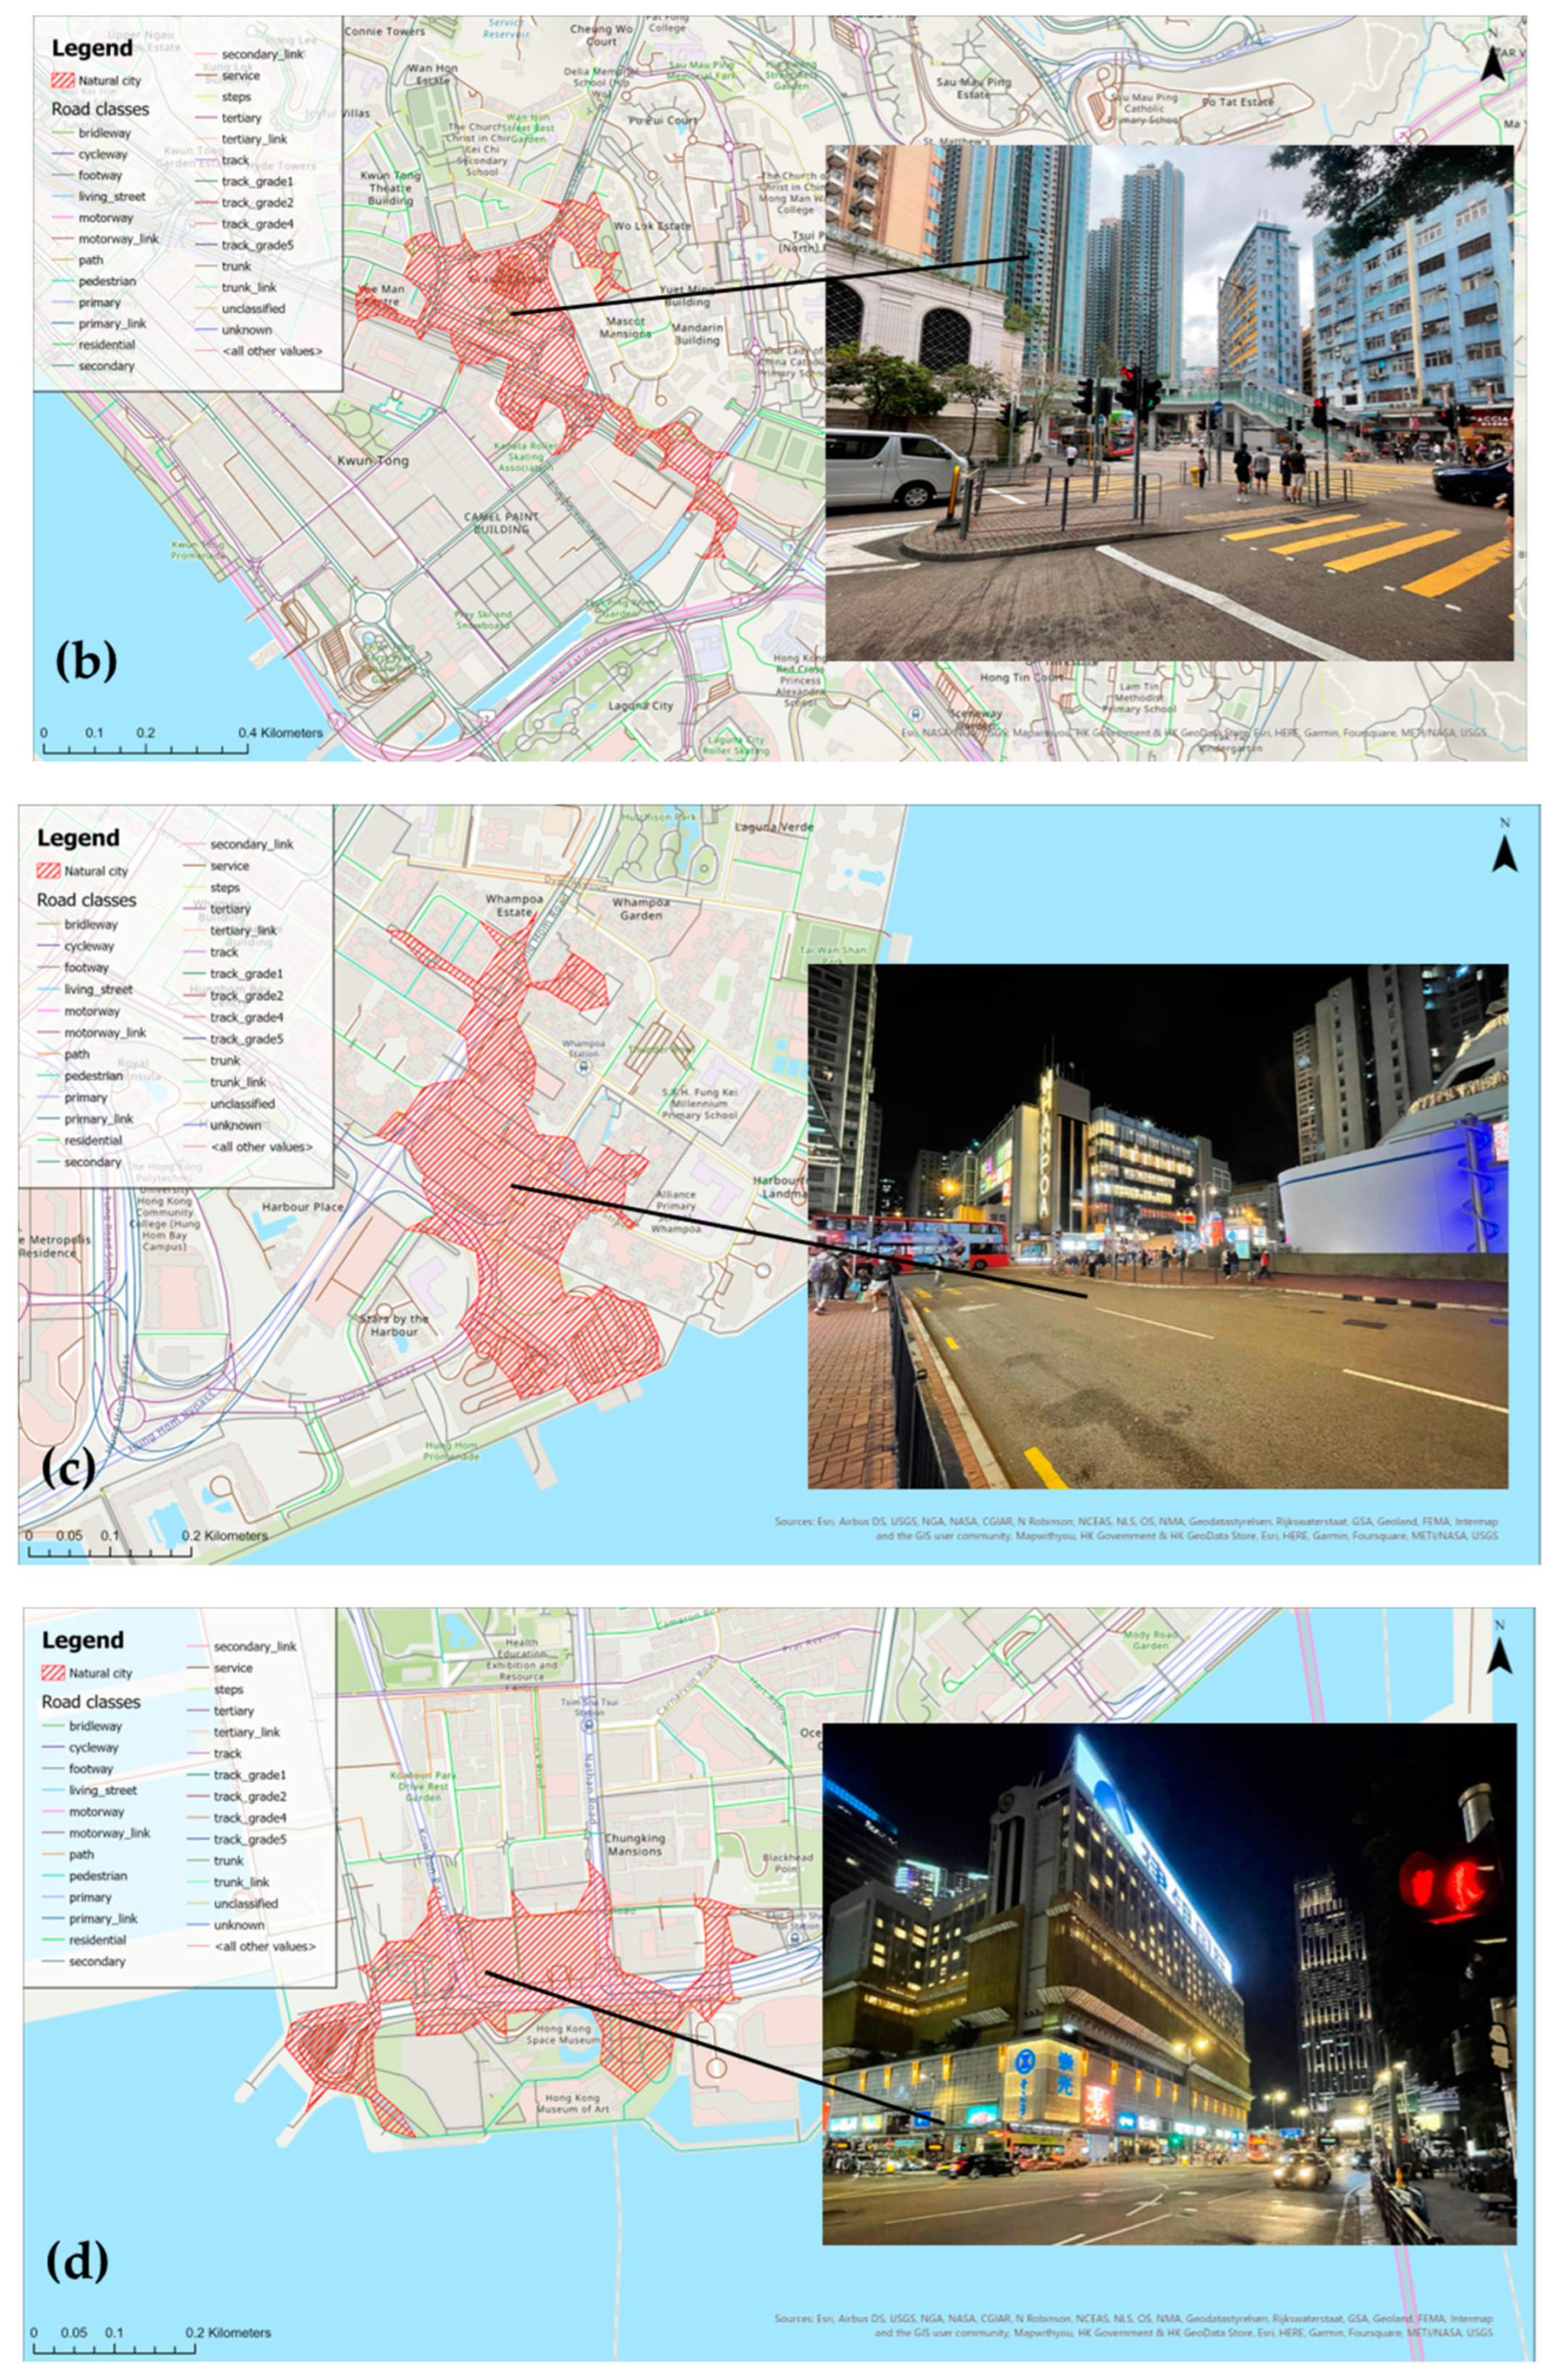
There are four large modified natural cities generated after applying layer attributes of road data and head/tail break classification in the algorithm, as shown in
Figure 10. Tones move in ascending order of area towards warmer tones in the figure. They are located in Wong Tai Sin, Kwun Tong, Whampoa, and Tsim Sha Tsui, respectively.
One of Hong Kong’s most prominent temples, as well as numerous high-rise buildings and houses, can be found in the Wong Tai Sin district, which combines the hustle and bustle of the city with the tranquillity of religion. The government has also constructed a huge number of public housing estates in the region; thus, there are many people there, as well as numerous supporting commercial facilities and activities organized by the residents themselves. Many of the roads in the region are narrow, and their capacity is not equivalent to that of main roads, but they are abundant and very handy for inhabitants to travel on foot or for private cars to drive and stop.
During the industrial boom years, a dense network of highways was created to accommodate the large volume of traffic, as well as a large number of public housing estates and residential structures to offer houses for industrial workers in the Kwun Tong region. Following the transformation of Hong Kong’s economic system, demand for industrial output fell, and the use of landmark buildings began to shift to tertiary supporting roles such as offices and shopping malls, so the population number did not decrease as a result of the loss of industry. Despite the great density of roads in the Kwun Tong area, there are insufficient capabilities, and traffic congestion is widespread today.
Whampoa is the name of a Kowloon common district, not an administrative district. The Whampoa region was once the site of the same-named dockyard, and after the dockyard closed, residential and commercial facilities began to be erected on the site. Whampoa’s flat geography permitted an orthogonal road layout based on Euclidean geometry. The natural city site does not encompass the entirety of Whampoa, but it does include a significant residential community and a public recreational space by Victoria Harbour.
The name Tsim Sha Tsui is derived from the sharp-shaped sandbar at the eastern edge of the Pearl River Delta. Tsim Sha Tsui was the first transport centre in Kowloon after the advent of rail travel in 1910, with one main road and a cluster of lower-level roads running through the region. The area is home to a variety of high-end shopping establishments that draw a steady stream of tourists, as well as numerous high-end hotels. Because of its extensive history, the district is also home to many of Hong Kong’s museums and cultural exhibitions.
All four of the larger regions are certainly hotspots in Kowloon, and the model’s results are quite close to reality. Each of these four regions has a well-developed, convenient, and easily accessible road network, as shown in
Table 1, and there is sufficient popularity to use these road networks, as shown in
Figure 11. Moreover, rather than simply having a number of passers-by crossing these zones via the road network, the nodes of human activity are also within four regions. The structural beauties of the four regions can be explored further based on the method employed to construct the living structures, and there are quite a few sub-structures among them, both in terms of topology and community function.
5.4. Comparison between Two Models
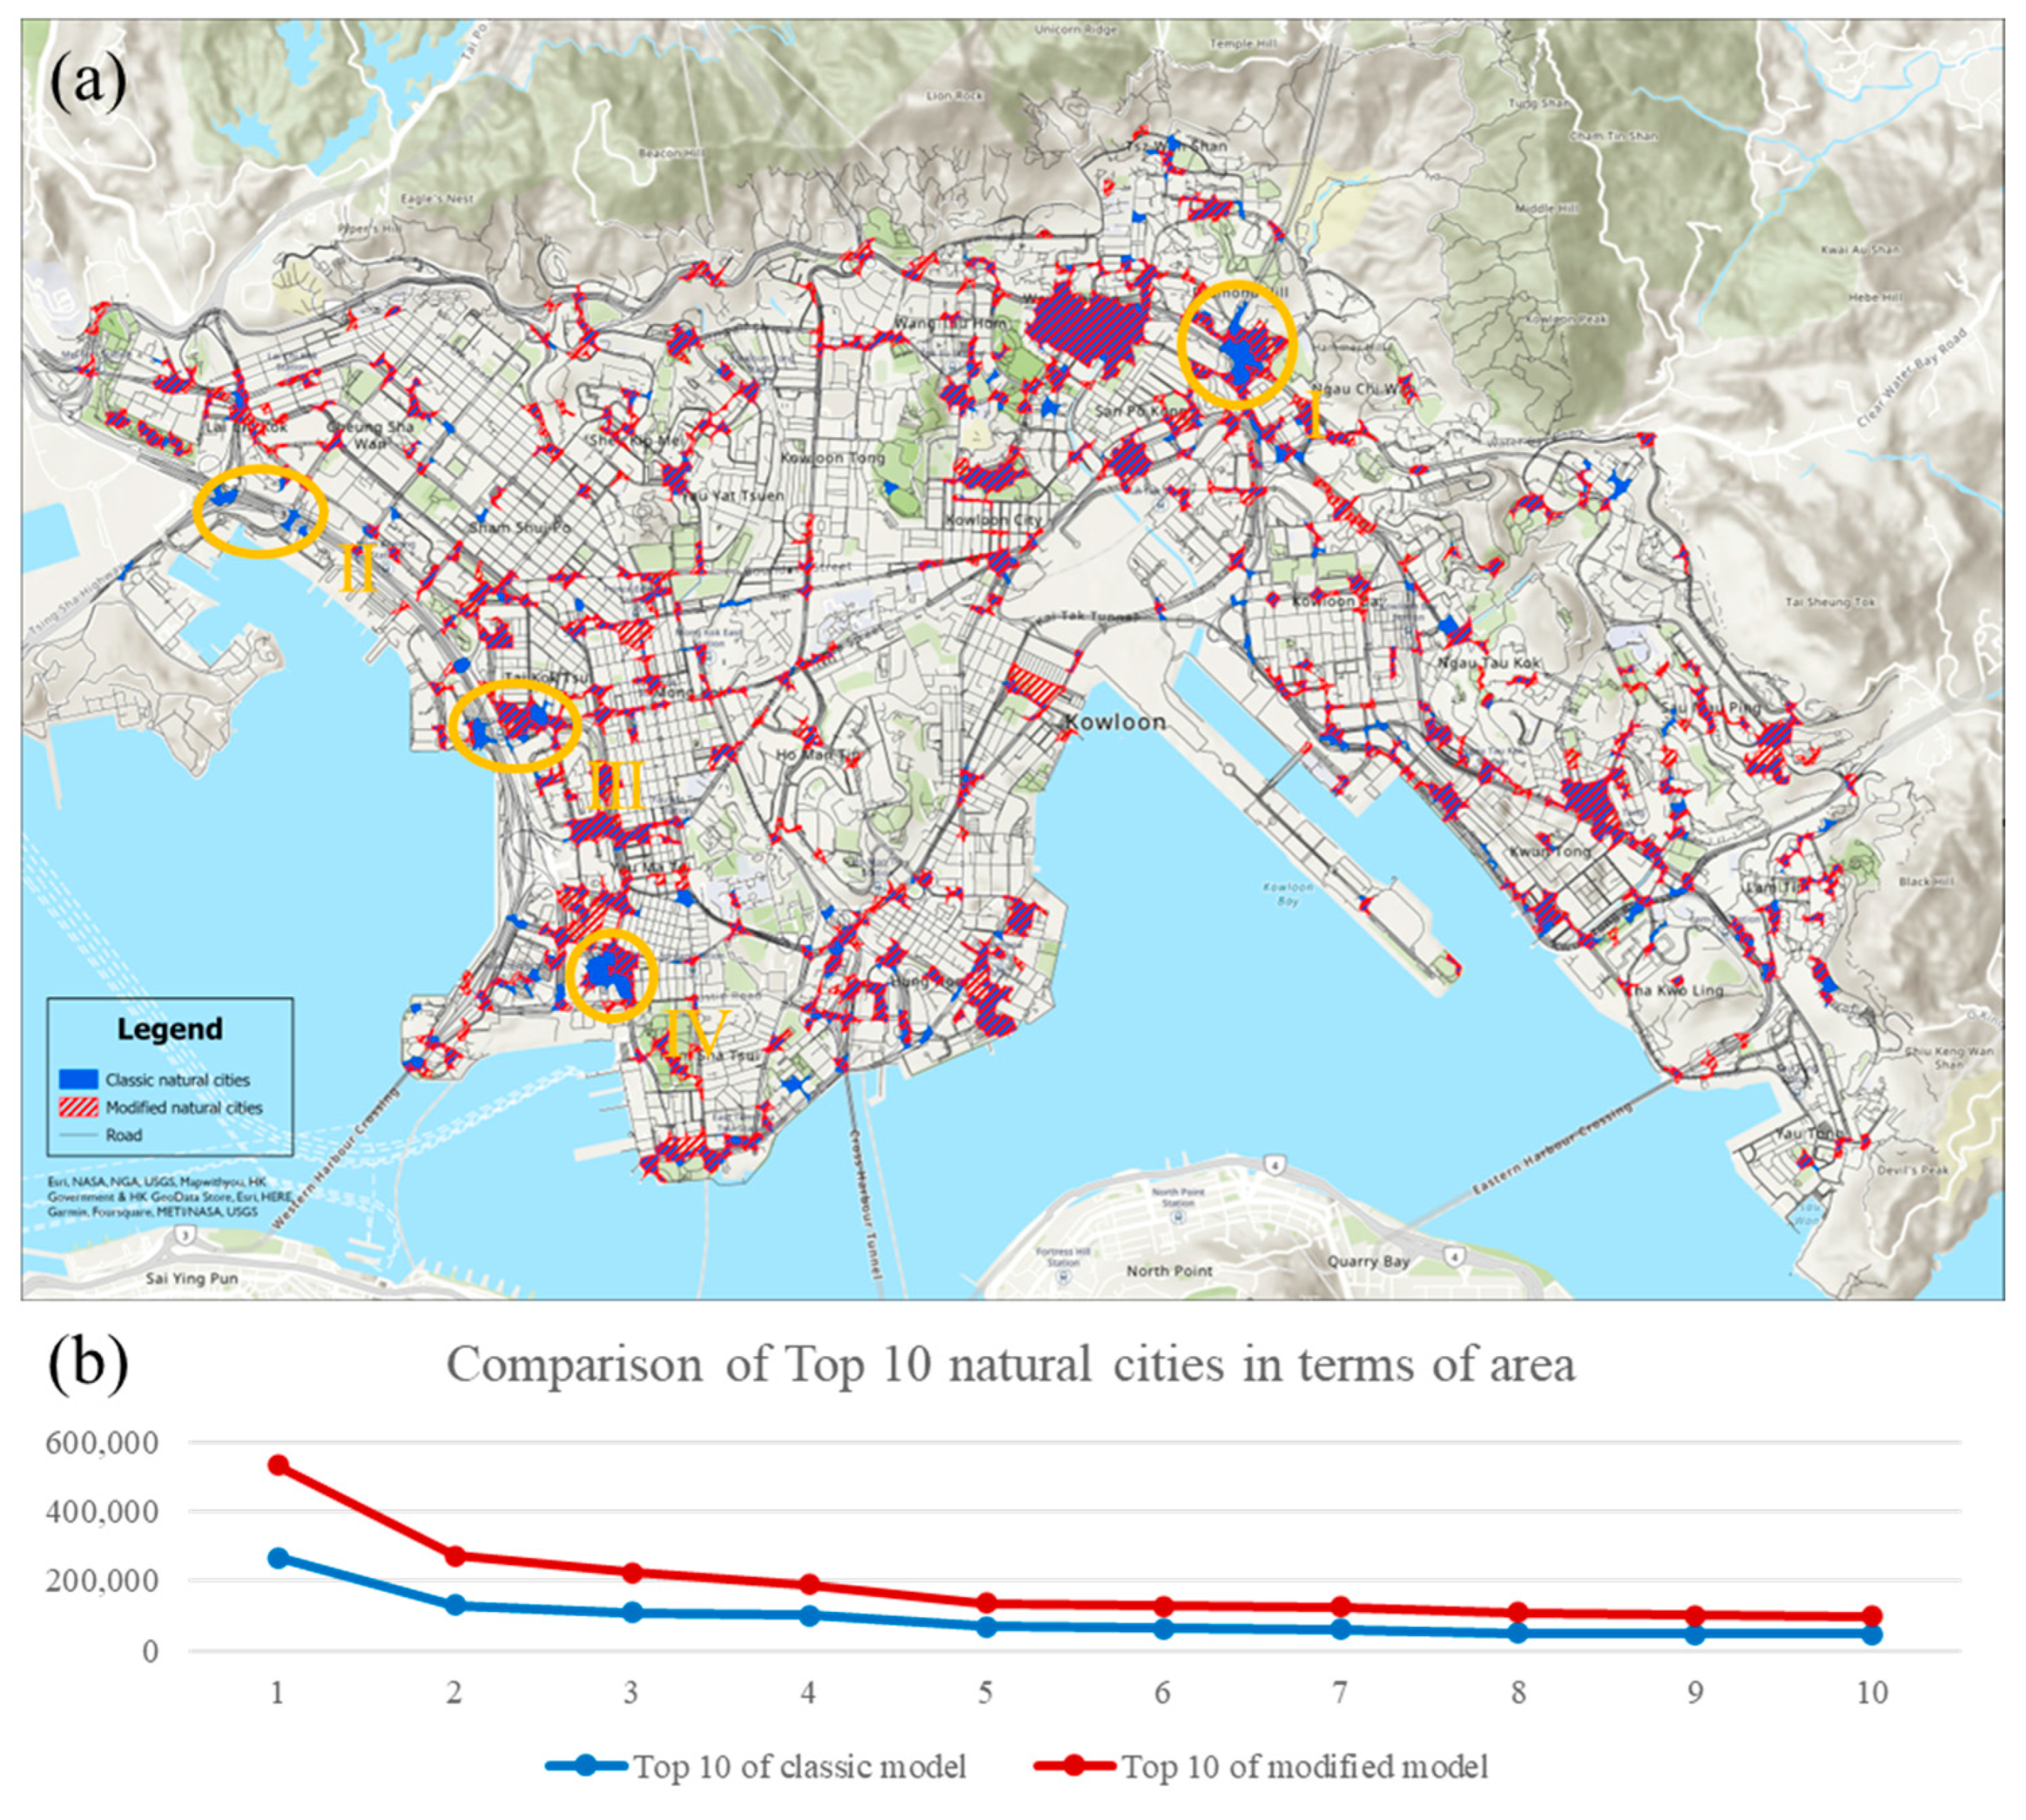
The natural cities in Kowloon generated by the classic model and the modified model are shown in
Figure 12, with the blue-filled units being classic natural cities and the red-slashed units being modified natural cities. It is clear that the distribution of natural cities is dispersed throughout the Kowloon area rather than concentrated in a single site or linearly along a single traffic route. Because the modified model considers the additional step of road level distinctions when compared to the classical model, the natural urban distribution presented will unavoidably be inconsistent, as shown in
Figure 12a. By comparing the two models (
Table 2), the new model has reduced the number of road intersections, which is due to the elimination of the bias generated by the classic model at the intersection of roads belonging to different layers. Due to the removal of non-existent road intersections, the edges become longer during the generation of the TIN; the area of the small triangles in the TIN is, therefore, larger than that of the ones in the classical model. Then, the average of small triangles also increases; this means that the threshold separating the head and tail parts is shifted to the right. A remarkable result is that in the area comparison of the 10 largest natural cities, the area of the natural cities from the new model is larger, as shown in
Figure 12b. More units were included in the scope of natural cities, and the total area of natural cities also rose. The practical significance is that the original undiscovered areas carrying human activities have been excavated.
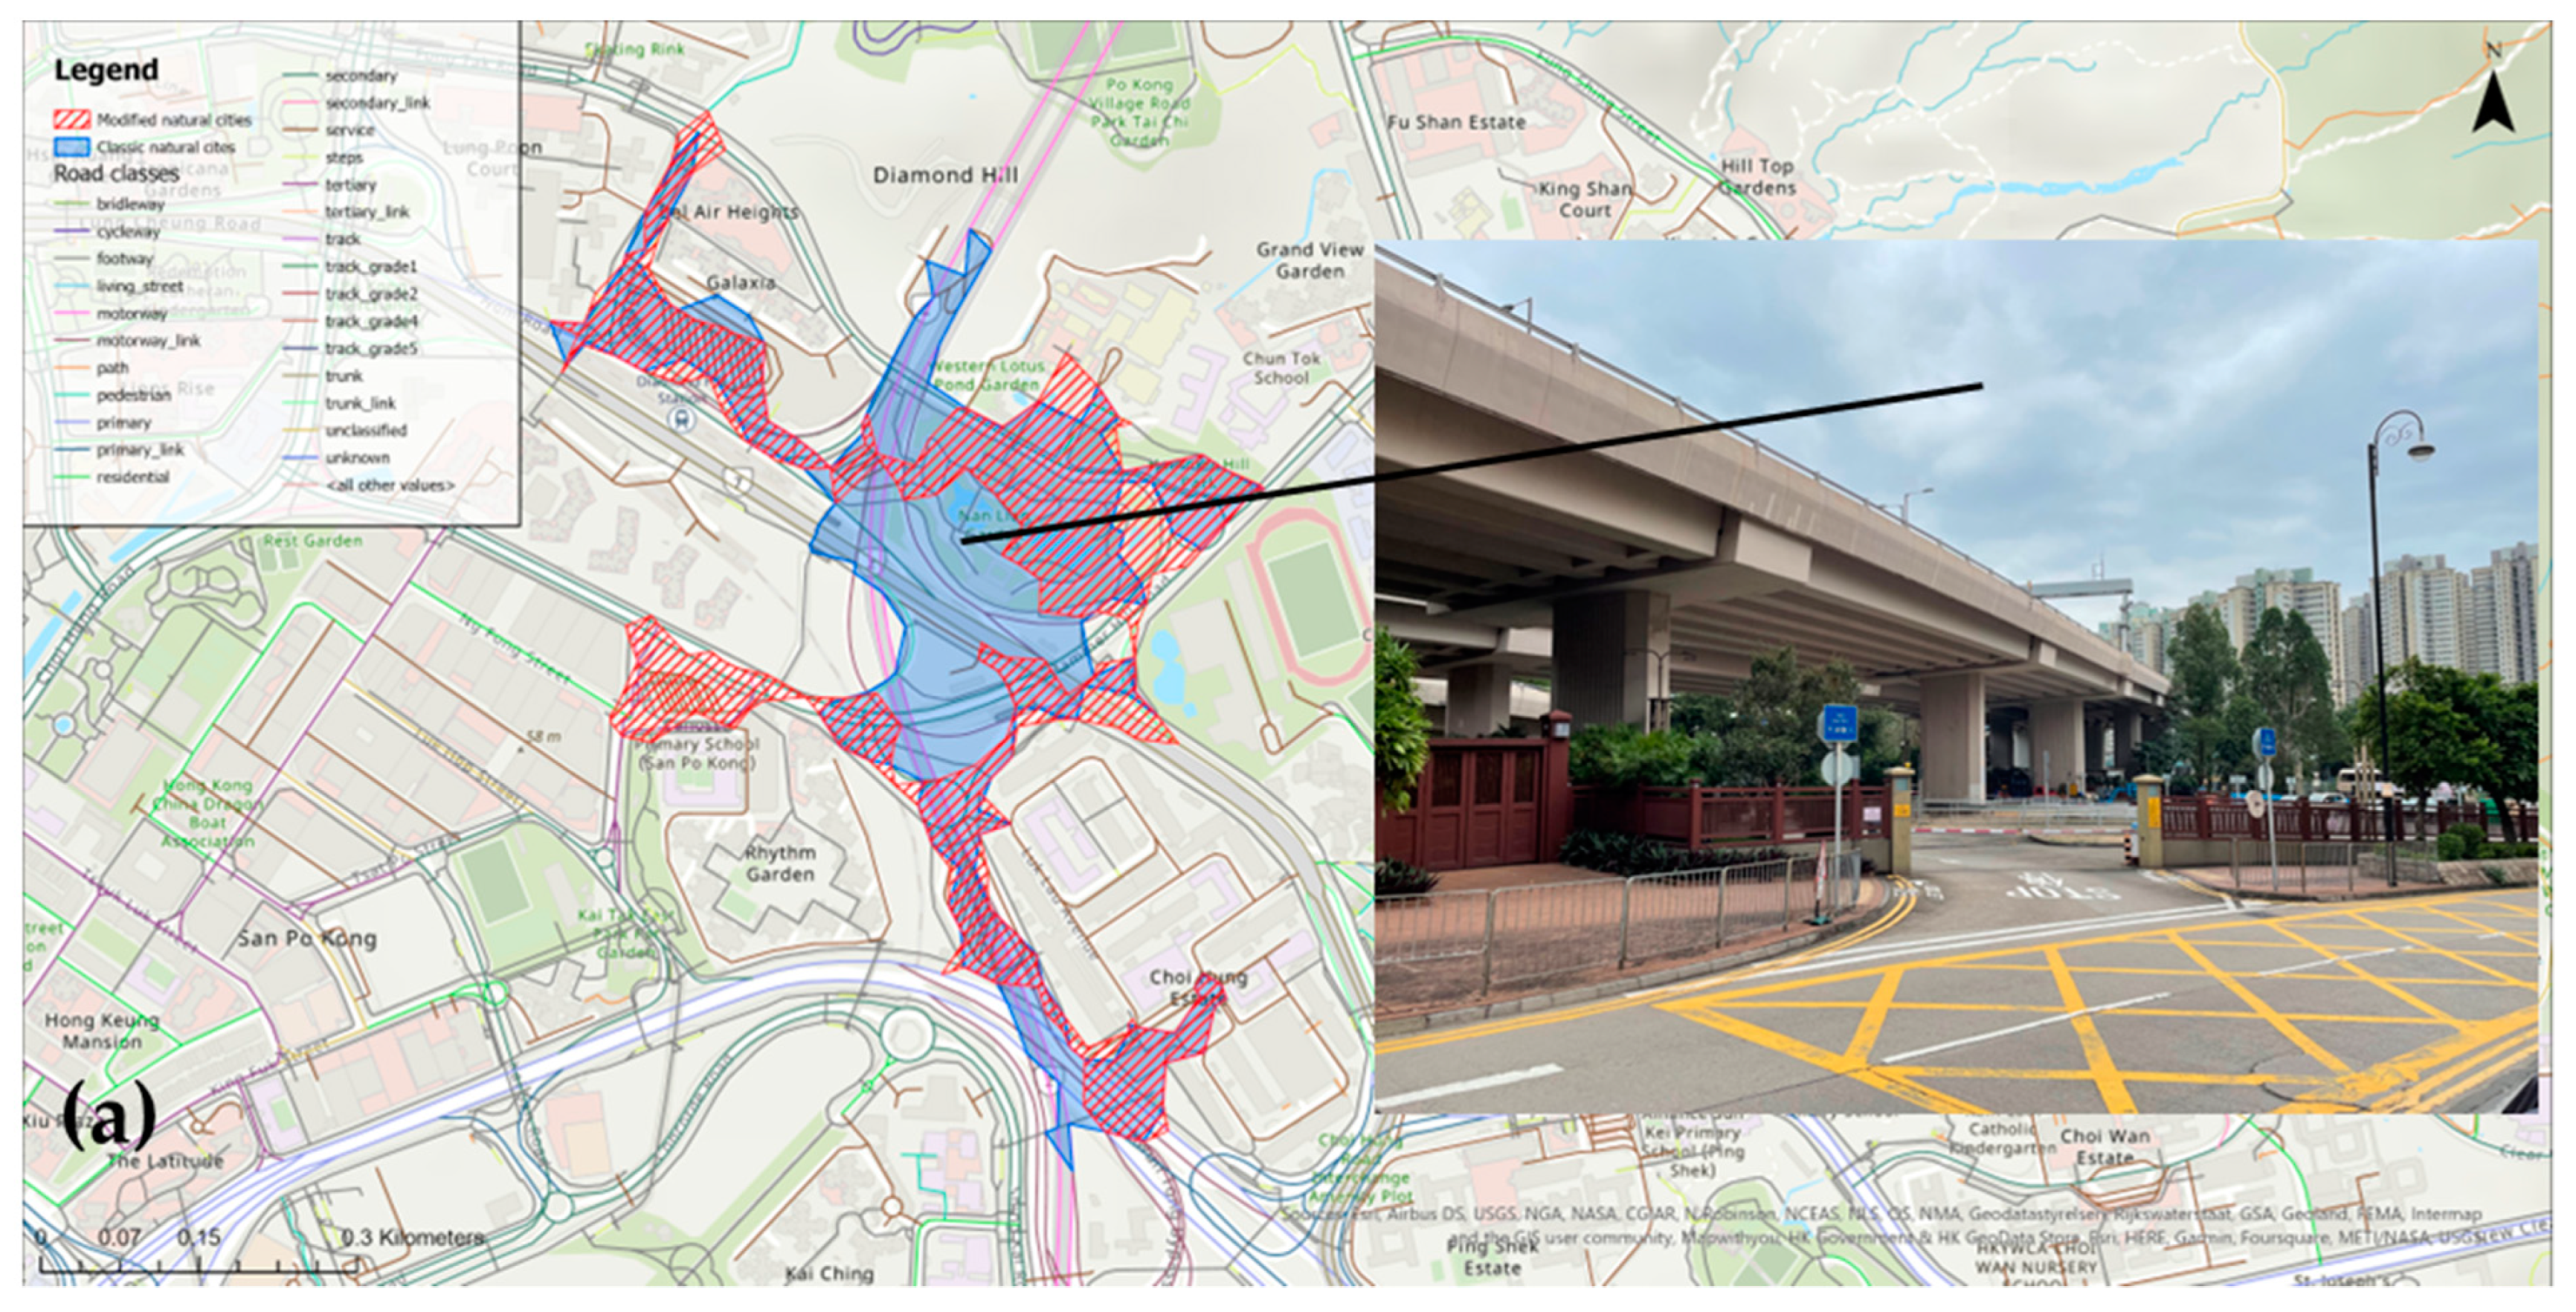
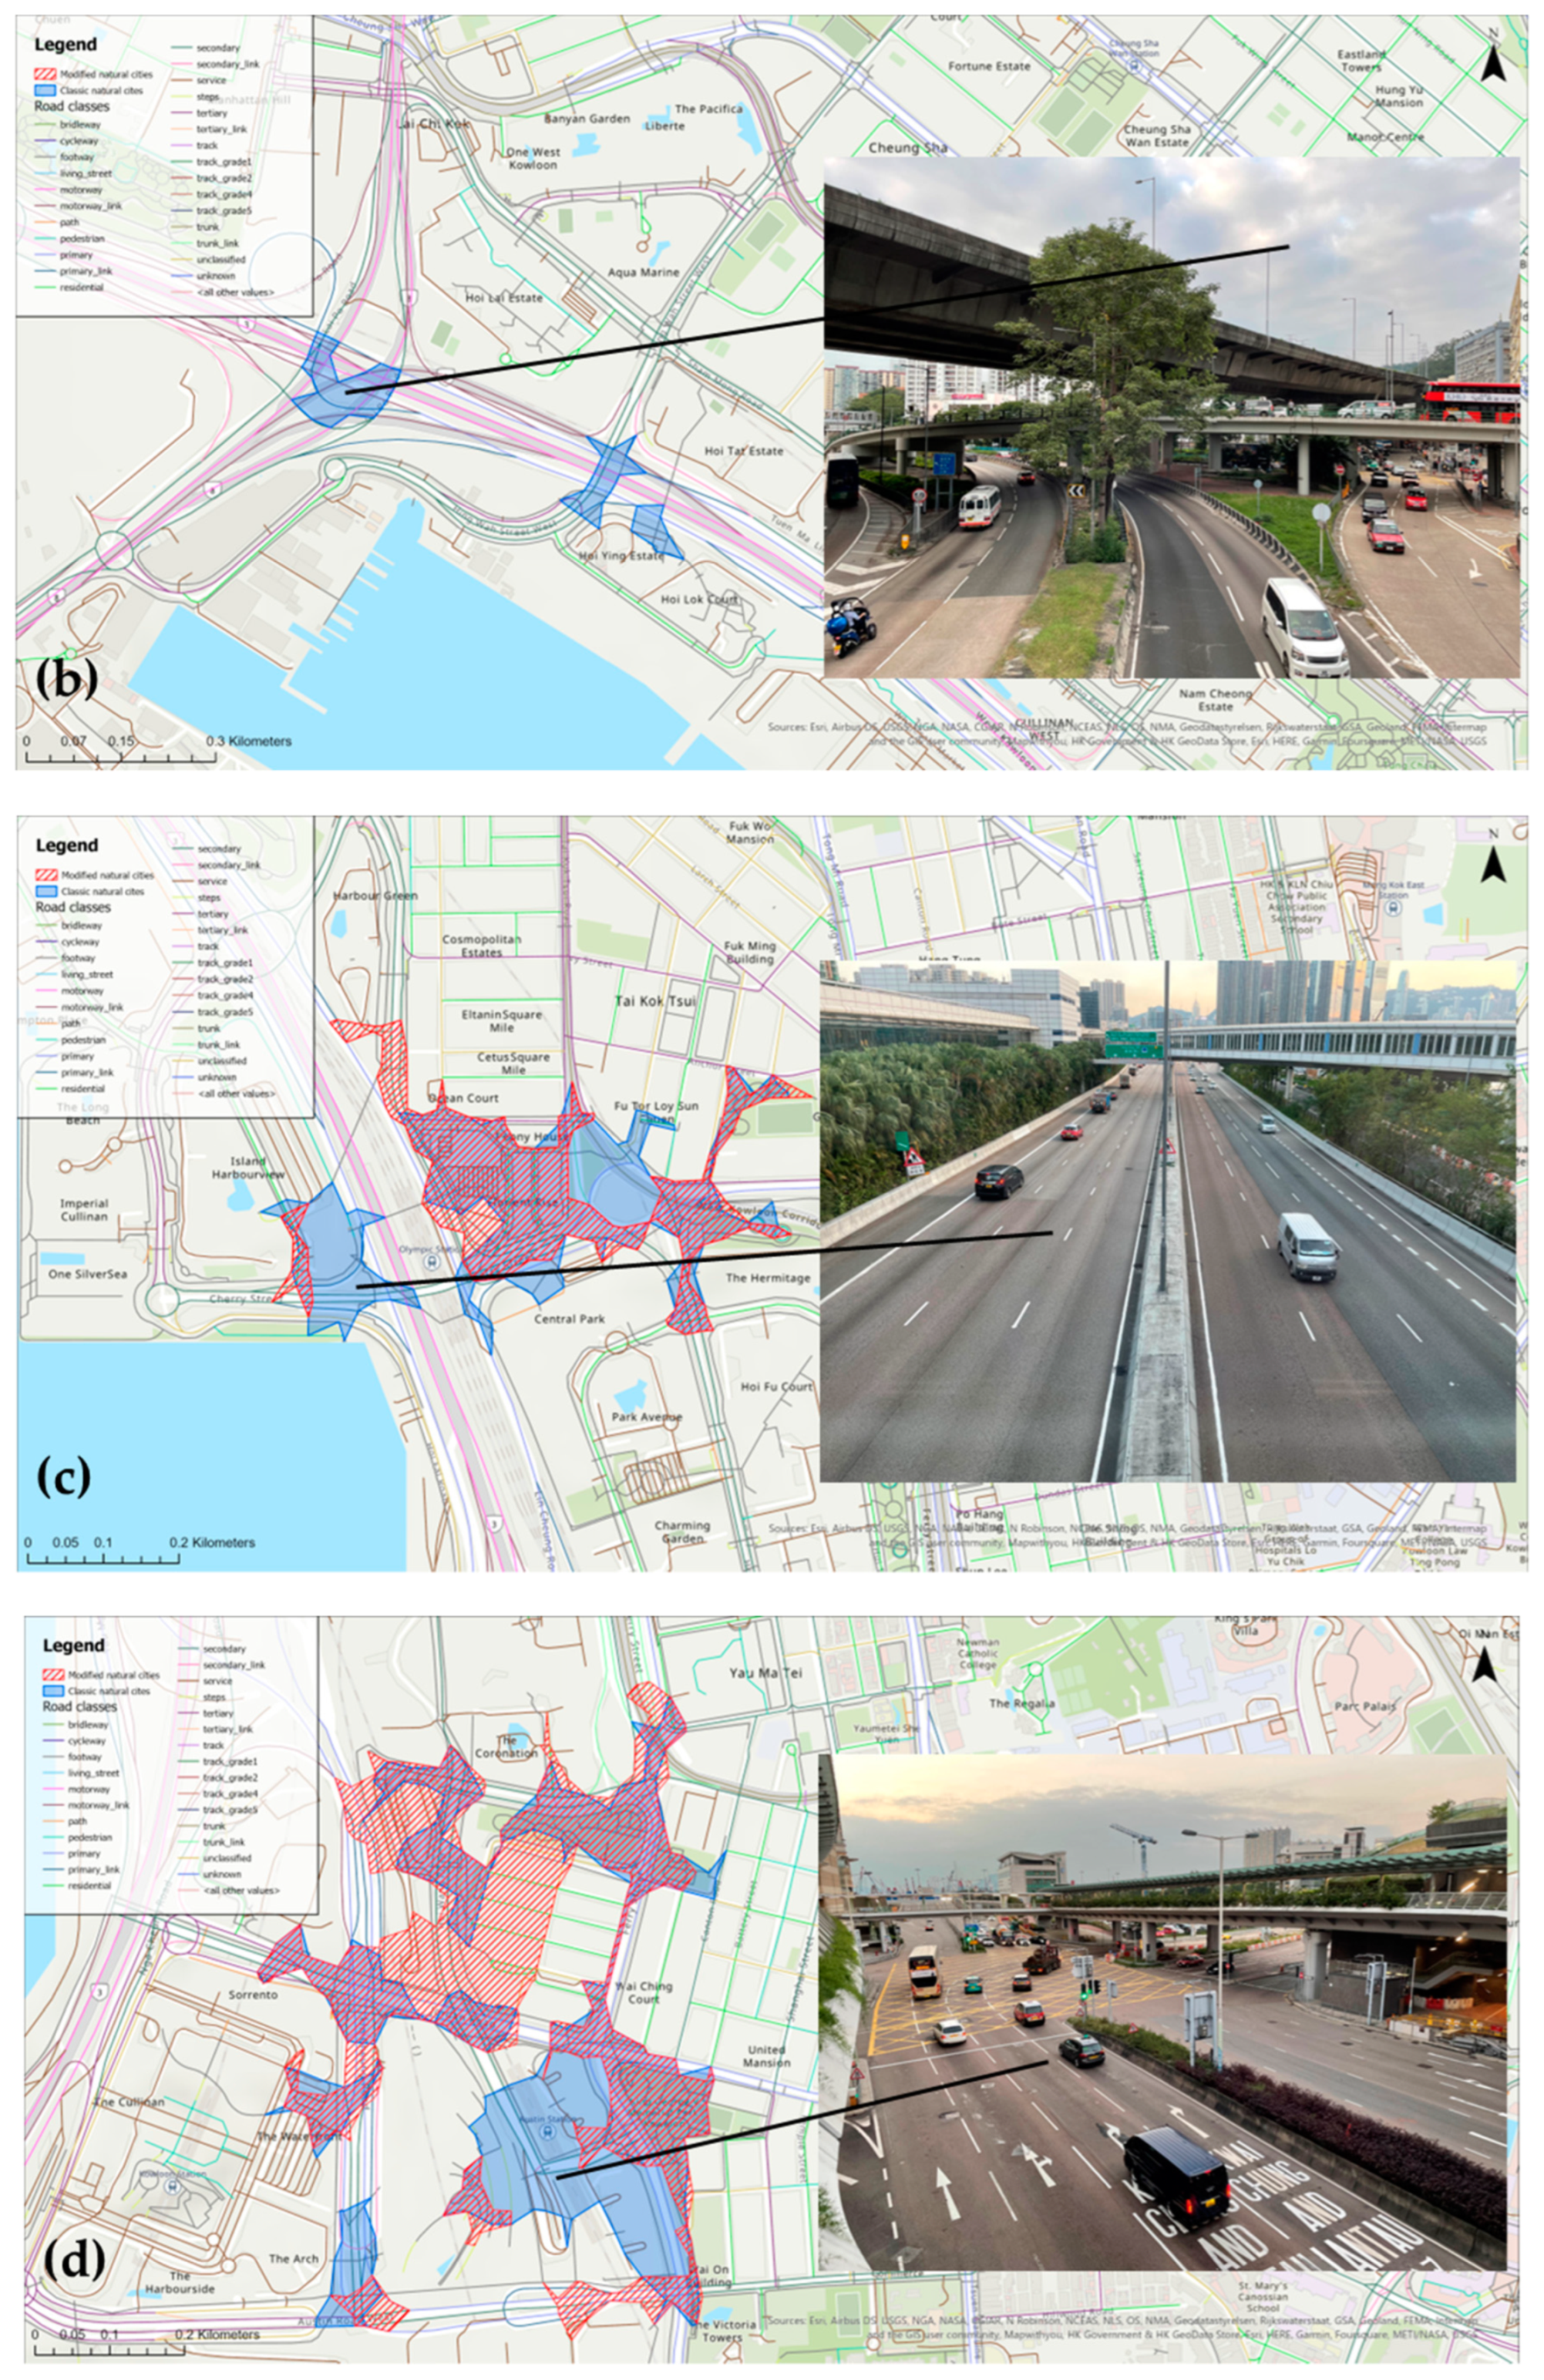
In Kowloon, we chose four of the more diverse regions to investigate these phenomena. They are Ha Yuen Leng, Lai Chi Kok, Tai Kok Tsui, and Austin, respectively.
An overpass is located in Ha Yuen Leng, a place that belongs to natural cities in the classical model but not in the modified model. Paths of varying orientations converge here but are impassable at the closest spatial distances and subsequently spread out in various directions. There is also a civic park here, with several interior routes for tourists to explore the scenery on foot. Although these trails are easily accessible from the outside world, they are not connected topologically because the park is separated from the outside world by a barrier. This cause reduces the connectivity of the road network in this region; hence, it is deducted from natural cities in the modified model (
Table 3).
The classic model’s natural city area in the Lai Chi Kok region is primarily covered by roads, the greatest of which is the crossing of Route three and Route eight in Hong Kong, resulting in a huge number of intersections in the 2D plane. Following field investigation, it was discovered that the local area is an interchange centre with a very complicated spatial structure, as shown in
Figure 13. Route three is the most direct route from the New Territories to Hong Kong Island and is the route of choice for a significant number of public transport routes. Route eight is an east-west link between the city and Hong Kong International Airport and is the only trunk line to the airport. However, there is no urban glitz in the region; the viaduct is largely surrounded by container yards and parking lots, and there is one decrepit public housing estate. The other two locations are similarly highway interchanges rather than community centres. As a result, the modified model removes the natural cities mentioned above (
Table 4).
Tai Kok Tsui is a place name rather than an administrative division. The region encompassed by the typical natural cities in this region comprises vast housing estates, commercial structures, and the previously mentioned Route three north-south arterial road. The Tai Kok Tsui region has a distinctive urban image with arterial highways, railway lines, and footbridges converging in the same area, resulting in a dense mass of road intersections in the 2D plane (
Table 5). The railway lines slowly turn to pass underneath the arterial highways, which are thus formed by an elevated structure, and the footbridges span over the wide roadway. In the modified model, these roads will no longer be considered passable to each other because of the inconsistent layer value. Therefore, in the generation of TIN, the nodes of this district are reduced, and the length of the edges on the road is increased to higher than the average of all edges. The large housing estates and commercial buildings belonging to residential areas on both sides of the road have been retained, but the areas overlapping the main roads have been removed, as shown in
Figure 13. This result is in accord with the reality that arterial highways are not level with the ground in densely populated areas for people to cross the road, which will increase the accident rate. People have to pass through footbridges with height differences from arterial highways and railway lines to gain accessibility, which also increases the distance.
Since Hong Kong West Kowloon Station was established for underground high-speed rail, it is separated from the rest of the surrounding transportation network both categorically and physically. Although the station has numerous internal roads for passengers and a developed upscale residential and cultural exhibition area not far from the exterior, there is still a hard boundary between the interior and exterior. Although there are many railroads and highways in this region, there is a lack of intersections. So, the modified model determines that there are few nodes near the boundary of the high-speed railway station, which increases the length of edges in the TIN (
Table 6). It is evident that there is a hole in the distribution of natural cities in the centre of Austin, as shown in
Figure 13. The surrounding residential buildings, parks, and green areas form pockets of natural cities and provide Austin’s natural cities with more substructures that can be subdivided downwards, enhancing the degree of living structure complexity.
Taken as a whole, the four cases where natural cities were left off the list, as shown in
Figure 13, are either because the adaptation of the viaduct to its surroundings was not considered during the urban construction process, because the decision-makers in the planning process intended to make the region a landmark inconsistent with its surroundings, or because the region itself does not have the capacity to carry human activities and is simply a classical model that has been misjudged.
5.5. Degree of Living Structure Complexity Calculation
Accompanied by the generated natural cities above, the preconditions for calculating the degree of living structure complexity have been collected completely. The first operation was the spatial join of 1585 natural cities and Kowloon’s road network. This step can extract all the roads passing through each natural city. Since 3D roads have viaducts above the ground and tunnels below the ground, these road structures reflect the complexity and inherent hierarchy of the area. To prevent the negative layer of tunnels from reducing the degree of living structure complexity during the operation, this work uses the absolute value of the road layer as a parameter. After obtaining all the road layers’ absolute values passed in each natural city, the living structure with the highest value was extracted to quantify every natural city. Calculated by the formula mentioned in 3.4., the Kowloon’s degree of living structure complexity (
Table 7) is obtained by summing (5 + 1) × 7 + (4 + 1) × 3 + (3 + 1) × 31 + (2 + 1) × 103 + (1 + 1) × 375 + (0 + 1) × 1066, and the result is 2306.
6. Discussion
6.1. The Impact of 3D Road Network on Neighbourhood Connectivity
Previous research has proposed the natural city formation model [
42]. According to our empirical results, the classic model misses the mark of 3D spatial relationships in metropolitan areas due to complicated traffic intersections. It is an intriguing concept that the classic model uses the road network as a carrier to uncover urban structure [
10]. However, not all roads are built on the ground; many are built as bridges or tunnels to reduce occupied land areas or improve traffic efficiency. In a metropolis like Hong Kong, such occurrences are not uncommon [
43]. This work used OpenStreetMap data to fit the true direction and topological relationship of roads and generate new natural cities for introducing a new approach to discovering urban area distribution.
Viaducts are the places where the traditional model and modified model differ the most frequently. This is the work’s entry point. Natural cities are defined by the concept of finding a location that serves as a hub for human activities and housing based on geographical features [
42]. The density of road intersections was important in its construction since the road network functions as the city’s blood vessel as in an organism. It is easy to overlook the detrimental influence of the road itself in the early stages of the city when the road network is still rather sparse [
44]. At this point, all roads are built on the earth’s surface and serve as handy travel routes for residents. There will be no need to bypass, and no roads will be nearby yet inaccessible. When a city reaches a prosperous stage, the differentiated road network competes for space with people’s dwelling areas, and not all roads are suitable for being the travel pathways of neighbouring residents [
45,
46]. This work does not ignore the role of these in improving the traffic speed for urban travel, commuting, and sightseeing. After keeping only true intersections in the road network, it was found that roads of both types are not strongly associated with other roads, and they often have clear starting and ending points. The influence of residents’ behaviour based on the perceptions they have on the environment around their travel needs to be taken into account as if the environment is perceived as a barrier, residents’ desire to travel will not be positive, and their extensibility reduces [
47,
48]. Urban planners need to be aware that the real city is not a directed graph, where the higher the connectivity, the better, and that meaningless gaps in the graph theory are the living spaces of the citizens [
26,
49]. The road network responds to the city’s expanding traffic demand, but itself is differentiated. Meanwhile, differentiation and adaptation are exactly the two complementary laws that organize living structures [
25].
6.2. The Optimisation Compared to the Classical Model
The range of natural cities generated by the two models is very similar, where there are no roads of multiple layers that intersect. The location of dense road networks is extracted as a result, and the result was found to fit the situation of human activities well with reality. The result also reveals that the classic model is still effective in places with sparse roads and without elevated roads. This result will be more obvious when the scale is enlarged to the entire city, province, or country separated by natural landforms because the need to build complex multi-layer road networks can only exist in urban areas.
In the modified model result, there are also inappropriate areas where the model is too far removed from the classical model. This is caused by the inclusion of the layer attribute as a condition for constructing a road intersection; some of the existing road intersections are removed, and the distance between two nearby road intersections in the decreased region increases. The created TIN edges will be longer as a result, and these edges will not be lower than the mean value in the new ordering, and so will not participate in the generation of natural cities. This issue can be solved by replacing the threshold with a different value rather than setting it to an empirical mean value.
This work has space for improvement. Other metropolises with a large number of viaducts, such as New York and Tokyo, could be utilized as material to validate the algorithm’s generalizability in addition to Hong Kong. This work does not take into consideration the various road classes. These variables can be used to improve the model by taking into account whether various classes of roads are passable.
6.3. Natural Cities and Deconstructionism
The process of creating natural cities as a result of this study allows individuals to discover a new perspective on their city and obtain a better understanding of the regions where human activity is most concentrated. This viewpoint does not begin with several centres or an overall layout in an urban planning scheme but rather begins with the most basic urban aspects and progresses to a more sophisticated dimension. The resulting design is fragmented and egocentric rather than a Euclidean geometric pattern. Grand infrastructural projects such as overpasses block the movement of nearby citizens, and the accessibility of their neighbourhoods is shared with the accessibility of the city as a whole.
It is important to note that the results of this generation are only representative of the results of the road network generation at the time and not of the hotspot areas of the city that have stayed intact for millennia. The results of each generation will follow the development of the city at that time and the change into an urban form so that the natural city is unstable and open. This is analogous to the philosophical concept of deconstructionism, which argues that structure has no fixed centre and is made up of a sequence of disparities [
50]. The main method of deconstructive analysis is to look at the dichotomies in a context and to present the fact that these two opposing facets are, in fact, fluid and impossible to separate completely [
51]. The head and tail parts in this work also show this attribute, they are the only two parts of the whole sample data, but the division value between them can change with the development of the urban morphology; several individuals constituting one part will then be grouped into another part. The head and tail parts do not exist in any fixed or absolute form.


