Article

Perceptions and Attitudes toward Risks of City Administration Employees in the Context of Smart City Management

by
Karolina Wielicka-Gańczarczyk
and
Izabela Jonek-Kowalska
*
Faculty of Organization and Management, Silesian University of Technology, 44-100 Gliwice, Poland
*
Author to whom correspondence should be addressed.
Smart Cities 2023, 6(3), 1325-1344; https://doi.org/10.3390/smartcities6030064
Submission received: 13 April 2023 / Revised: 6 May 2023 / Accepted: 8 May 2023 / Published: 10 May 2023

Abstract

:
Smart cities are required to be effectively and efficiently managed in order to ensure the desired level of sustainability and quality of life for all inhabitants. This is a particularly difficult challenge in crisis situations of considerable scale and intensity (for example, the COVID-19 pandemic, armed conflicts, social tensions). For this reason, the aim of this article is to identify the attitudes and perceptions of risk by city administration employees combined with an assessment of their impact on the consequences of risk (the implementation of internal and external threats). The analyses used the results of a survey conducted on a representative sample of 399 Polish municipal offices, as well as descriptive statistics and structural equation modeling. The obtained results show that: (1) employees of municipal offices negatively perceive risk and are aware of its destructive impact on the organization, but are reluctant to report the risks; (2) individual and collective measures are taken in offices to protect against risks, but employees are not always encouraged to report potential sources of risk (rarely in the form of an informal conversation and even more rarely in a systemic form); (3) for the most part, employees are aware that internal and external risks have a negative impact on the operation of municipal offices; (4) the consequences of risks are more strongly influenced by employees’ perceptions of risk than by individual, team, and systemic attitudes toward risk. The added value of the research presented in this article comes from diagnosing the behavioral aspects of urban risk management and assessing the impact of attitudes toward risks and risk perceptions (internal and external) in a broad, representative range.

1. Introduction

The foundation of the smart city concept is the need to improve the quality of life in cities [1,2,3]. This is a task that requires multifaceted and yet sustainable development. The above expectations are directed in practice to the authorities of smart cities, which, therefore, need to demonstrate above-average efficiency and managerial effectiveness [4,5]. Afterall, without proper planning and implementation of individual goals, it is impossible to coordinate the activities of large metropolises and reconcile the many, sometimes conflicting, interests of urban stakeholders [6,7].
The situation of cities becomes more complicated in the face of internal and external threats. Then, the primal need for a sense of security, which is far less present during the periods of socioeconomic prosperity, intensifies [8,9]. In the 21st century, such exposure to a violent global crisis occurred at least several times. This undoubtedly included the subprime mortgage crisis in 2007, the COVID-19 pandemic, and the Russia–Ukraine armed conflict [10,11,12].
At such a time, city authorities are forced not only to take care of the comfort of residents associated with improved quality of life, but also social, economic, and sanitary security. In the context of the intensification of external threats being beyond the control and possibility of influence, this is a complex and very difficult task. The important question then becomes whether municipal offices and their employees are ready for emergency risk management, and can they make the city more resilient to the effects of threats?
Due to the above circumstances, the aim of this article is to identify the attitudes and perceptions of risk by city administration employees, combined with an assessment of their impact on the consequences of risk (the implementation of internal and external threats). In order to achieve such a goal, the authors conducted survey research in 399 Polish cities (representative sample) relating to behavioral aspects of urban risk management in the context of the development and implementation of the smart city concept.
The results of the surveys are analyzed using descriptive statistics (measures of central tendency, variability, asymmetry and flattening, and concentration). In addition, structural equation modeling is used in the course of the research to identify the impact of risk perceptions and attitudes toward risk on the consequences of risk.
The originality of the considerations and research stems from the following goals:
  • Conducting a diagnosis of the behavioral aspects of urban risk management.
  • Assessment of the impact of attitudes and perceptions of risk on threats (internal and external) in a broad, representative range.
  • Contribution to the formation of resilience to internal and external risks of cities, which—in the current socioeconomic conditions—is important for the implementation and development of the smart city concept.
The structure of the article is subordinated to that mentioned above: the purpose and the research problem. It begins with this introduction, which is followed by a literature study related to smart city management, with a focus on risk management and resilience to threats. This is followed by a description of the research methodology (survey research with statistical analytical tools and principles of research sampling). In the next section, the results of the research are presented, with a focus on two key themes: (1) behavioral aspects of urban risk management and (2) assessment of the impact of risk perceptions and attitudes on the consequences of urban risk. The entire discussion concludes with references to previous research results and recommendations for the benefit of authorities in modern cities, along with a summary including conclusions, research limitations, and directions for further research.

2. Literature Overview

The literature studies are presented in the form of two topics, in accordance with the principle of content hierarchy. Within the first topic, reference was made to issues related to smart city management that constitute the broader context of the subject matter analyzed in the article. The second topic describes issues of risk management and smart city resilience.

2.1. Smart City Management

The literature emphasizes that a characteristic trait of smart cities is a focus on management using knowledge and innovation, especially those related to the development of information technology (IT) and information and communication technologies (ICT) [13,14,15,16,17,18,19]. The following management elements are important in the development of smart cities defined in this way [20,21]:
  • The definition of a strategic goal that includes the use of modern technologies for the improvement of urban services and cooperation developed between all stakeholders [22,23,24].
  • The use of open data in the process of informing the urban community about the development of the city, thereby increasing the transparency of city government activities [25].
  • Investing in ICT technologies to ensure accelerated service innovations’ implementation and to obtain automatic and dynamic responses in real time.
  • Adapting traditional organizational models of delivery using data and digital capabilities in favor of partnerships focused on shared outcomes [26,27,28].
The effect of effective governance in smart cities is undoubtedly a faster pace of development and easier access to financing. This is an effect also present in developing economies, where the research conducted in this article is located. Kóňa et al. (2020) [29] in their study of Slovak cities emphasize that those cities that aspire to be smart cities economically develop much better than others. They are also characterized by higher levels of innovation [30]. Therefore, it is worth creating and implementing smart city solutions. Nevertheless, as emphasized by Sheikh et al. (2023) [31], the development of smart cities should also take into account the human factor, the urban community, so that the newly created structures are not overly technical.
The inclusion of the urban community in the governance process, understood more broadly as public participation, is one of the characteristic traits of a modern smart city. However, the bottom-up approach to governance is also a source of new challenges and complications, such as reluctance to participate, excessive individualism, and the need to take into account many different positions. These issues are highlighted by Liu and Qi (2022) [32], among others.
The importance of effective governance of smart cities is also exposed by Janusz and Kowalczyk (2022) [33] in the course of their study of cities in the Visegrad Group. Their cross-country comparisons indicate that smart city structures develop best in the Czech Republic, and the development is the slowest in eastern Poland. The authors also argue that the Czech Republic’s success is primarily due to the efficient implementation of e-government, significant economic and social potential, as well as the good state of the labor market, including openness to labor migrants. On the other hand, among the reasons for the failure of the cities of eastern Poland, they mention primarily the depopulation process in economically less developed areas and the progressive aging of the population in this part of Poland.
Despite some successes in implementing smart city concepts in developing and emerging economies, it should be noted [34,35,36,37] that the pace of smart city development in these regions is lower than in developed countries. One of the reasons for this is ineffective and poorly coordinated management.
Thus, Tantau and Santa (2021) [38] find that developing economies often lack comprehensive strategies for smart city development, which makes implementation efforts difficult and sometimes even impossible.
Similar conclusions are reached by Naterer et al. (2018) [39] when analyzing the strategies of Slovenian cities and relating their content to the Europe 2020 Strategy. They note that Slovenian documents are of poor quality and do not comply with European guidelines. In practice, this results in selective and haphazard actions undertaken by city authorities to develop smart urban infrastructure, and such an approach does not support coordinated efforts to improve the quality of life of residents.
Based on the literature studies carried out in this subsection, the following general conclusions can be made:
  • Smart city management should be comprehensive, integrated, and sustainable.
  • Urban management strategies focus on technologies, innovations, and their use in the process of providing public services of the highest quality.
  • Smart city management in emerging and developing economies needs to be improved, as it does not meet the requirements indicated above.
The literature relatively rarely refers to issues related to human resource management in public administration, despite that it is they who largely determine the effectiveness of smart city development strategies. For this reason, in this article, considerations are embedded in the mentioned management area.

2.2. Risk Management in Smart Cities

Risk management is a structured (usually four-step) process oriented toward reducing the likelihood of risks or minimizing their impact. The process begins with risk identification, which involves developing a list of possible risk factors. It forms the basis for assessing the scale and scope of the risk. Based on the above stages, a risk management plan was developed, the effects of which should be monitored on an ongoing basis. The results of the risk control carried out should form the basis for improving the management plan.
The human factor is extremely important in risk management. Afterall, it is the attitude and response of managers that determine the plan for mitigating risks, and thus, the extent of protection, whether of an enterprise or a city [40,41]. Among behavioral factors, the most relevant are considered as:
  • Perception of risk, can be negative or positive (opportunity for additional benefits [42,43]).
Individual perception of risk is influenced by two factors. The first is the decisionmaker’s general, life-long attitude resulting from his or her personality traits, referred to as affectivity [44]. Affectivity can be positive or negative. If the decisionmaker is characterized by positive affectivity, then he or she most often views risk as an opportunity. If the decisionmaker is characterized by negative affectivity, then he or she perceives risk as a threat that must be prevented in order to minimize damage and loss [45].
In addition to affectivity, risk perception is also influenced by what is known as experience history, which shapes the decisionmaker’s past associations with the consequences of risk implementation. Thus, if a manager has realized gains more often in connection with risk-taking, they will view risk as an opportunity. If, on the other hand, risk is more often associated with losses, they will perceive it as a threat. Nonetheless, it is worth adding that some studies indicate that recent memories matter most in the history of experiences, and decisionmakers are less likely to consider the totality of past experiences [46].
In addition to the aforementioned factors, cognitive distortions signifying exaggerated and/or irrational thinking patterns also influence risk perception [47], for example: (1) an employee’s assessment of his or her own probability of failure as lower than that of others in the same situation, or (2) an employee’s assessment of certain events as less likely or less likely to result in losses, in a situation in which he or she has a direct influence.
  • Risk attitudes that are the product of risk perception and risk aversion [48,49,50] and include: risk-taking, risk avoidance, and risk indifference.
In risk management, the most desirable attitude toward risk is risk-taking (active attitude), which in practice consists of understanding the essence of risk, accepting its existence, and acting in order to mitigate threats, and then using opportunities connected with making specific decisions.
Risk avoidance can inhibit entrepreneurial initiatives and actions, which is a barrier to growth. It does not always imply a lack of knowledge about risk and risk management, but only a paralyzing fear of making decisions and the associated consequences.
The indifferent attitude toward risk associated with ignoring threats and the passive attitude toward opportunities seems to be the least desirable in risk management, due to the lack of knowledge about risk that it causes, ignorance, and consequently, not taking any action to prevent the occurrence of a threat regardless of its intensity and scale.
The above statements were developed primarily on the basis of studies conducted in enterprises (the authors of the article applied them in the research methodology for public administration). Studies devoted to the role of employees in urban risk management are less frequent. Urban risk, on the other hand, appears quite abundantly in the topics presented below.
Smart cities face a variety of risks due to several key circumstances. Many new solutions are being implemented in smart cities. Therefore, the implications of their use are not fully recognized. In the process of implementing smart city solutions, technical and social systems interact, which can cause tensions and problems. Finally, the infrastructure of a smart city is extremely complex, which only intensifies the scale and scope of possible risks [51].
For these reasons, effective smart city management is important and should be one of the priorities of city authorities. Its importance is exposed by crisis situations such as the COVID-19 pandemic and economic recession. The following are the latest topics connected with smart city risk management relating to the stages of the process described above.
Thus, Shayan and Kim’s (2023) [52] research on identifying urban risks shows that the biggest sociodemographic threat to smart cities is social exclusion. It is particularly dangerous for the elderly and women. For these reasons, the authors suggest developing urban plans to prevent the negative impact of smart city solutions on social sustainability.
There are also privacy and information security issues associated with the implementation of modern smart city technologies and open data systems. With the above in mind, Al Sharif and Pokharel (2022) [53] suggest organizing information security as early as the planning stage of smart city development. This is because it is crucial for the community to accept the modern, open-access urban solutions.
The COVID-19 pandemic has intensified the research on health and sanitation risks in smart cities. Gavurova et al. (2022) [54] proposed the integration of the following smart city systems in this regard: Smart Security, Smart Healthcare, Smart Environment, and the Smart WebGIS. They also noted the need to secure adequate funding in the municipal budget for both risk identification and prevention of health and sanitary risks.
Due to the intensity of the use of the city’s infrastructure, proper crisis management and the response of the city government to accidents or disasters is also an important issue. In this regard, Kollárová and Ristvej (2021) [55] propose using a process approach and analysis of faults and their consequences (FMEA) to identify and mitigate risks. In contrast, Zhang et al. (2021) [56], for this purpose, engage artificial intelligence to protect the city from fires.
Ullah et al. (2021) [57] undertook the difficult task of classifying the risks involved in creating smart cities. In the end, they managed to identify 56 risks, which they classified into 3 groups: technological, organizational, and environmental (TOE). They considered the most important sources of technological risk (17 factors, 37.8% share of total risk) to be: Internet of Things, public management of Internet networks, and loss of security by users of the listed tools. Among the most important organizational risks, they identified (11 factors, 15.6% share of total risk): data security and cloud management. Environmental risks, on the other hand, included (28 factors, 46.7% share of total risk): issues of pollution of the ecosphere, but also social integration and urban management. The authors also unanimously emphasize the importance of proper, integrated management and efficiency of the city government in the process of risk reduction.
According to the literature studies, contemporary research on risk management focuses on the identification of risks and the use of modern technologies in the process of their mitigation. Aspects of risk management itself are less often addressed, and if they are, then only in the context of final recommendations or the development of risk management strategies and plans. Little attention is paid to the human resources involved in the risk management process in municipal offices. Meanwhile, it is these resources, their attitudes, and approaches that will determine the quality of planning and the effectiveness of risk management. Considering such a research gap, the authors of this article undertook a study to identify attitudes toward risk and perceptions of risk by city administration employees, combined with an assessment of their impact on the consequences of risk (the implementation of internal and external risks).

3. Materials and Methods

3.1. Rationale, Intent, and Research Methods

In the context of the conducted literature studies, the following reasons for undertaking research can be found:
  • The relevance of risk management in smart cities due to the novelty and scope of the use of IT and ICT technologies and the complexity of urban infrastructures.
  • The lack of research on the impact of behavioral factors characterizing urban human resources on urban risk management.
  • The need to strengthen the resilience of cities to risks related to the intensification of external threats that could have been observed in recent years.
  • The need to improve the management of smart cities in emerging and developing economies.
Completion of the identified research gap was accomplished through surveys conducted in Polish cities.
The survey questionnaire was constructed on the basis of literature studies on behavioral aspects of risk management, which were then adapted to the specific traits of city administration. Thus, the questionnaire consists of three groups of statements concerning, respectively:
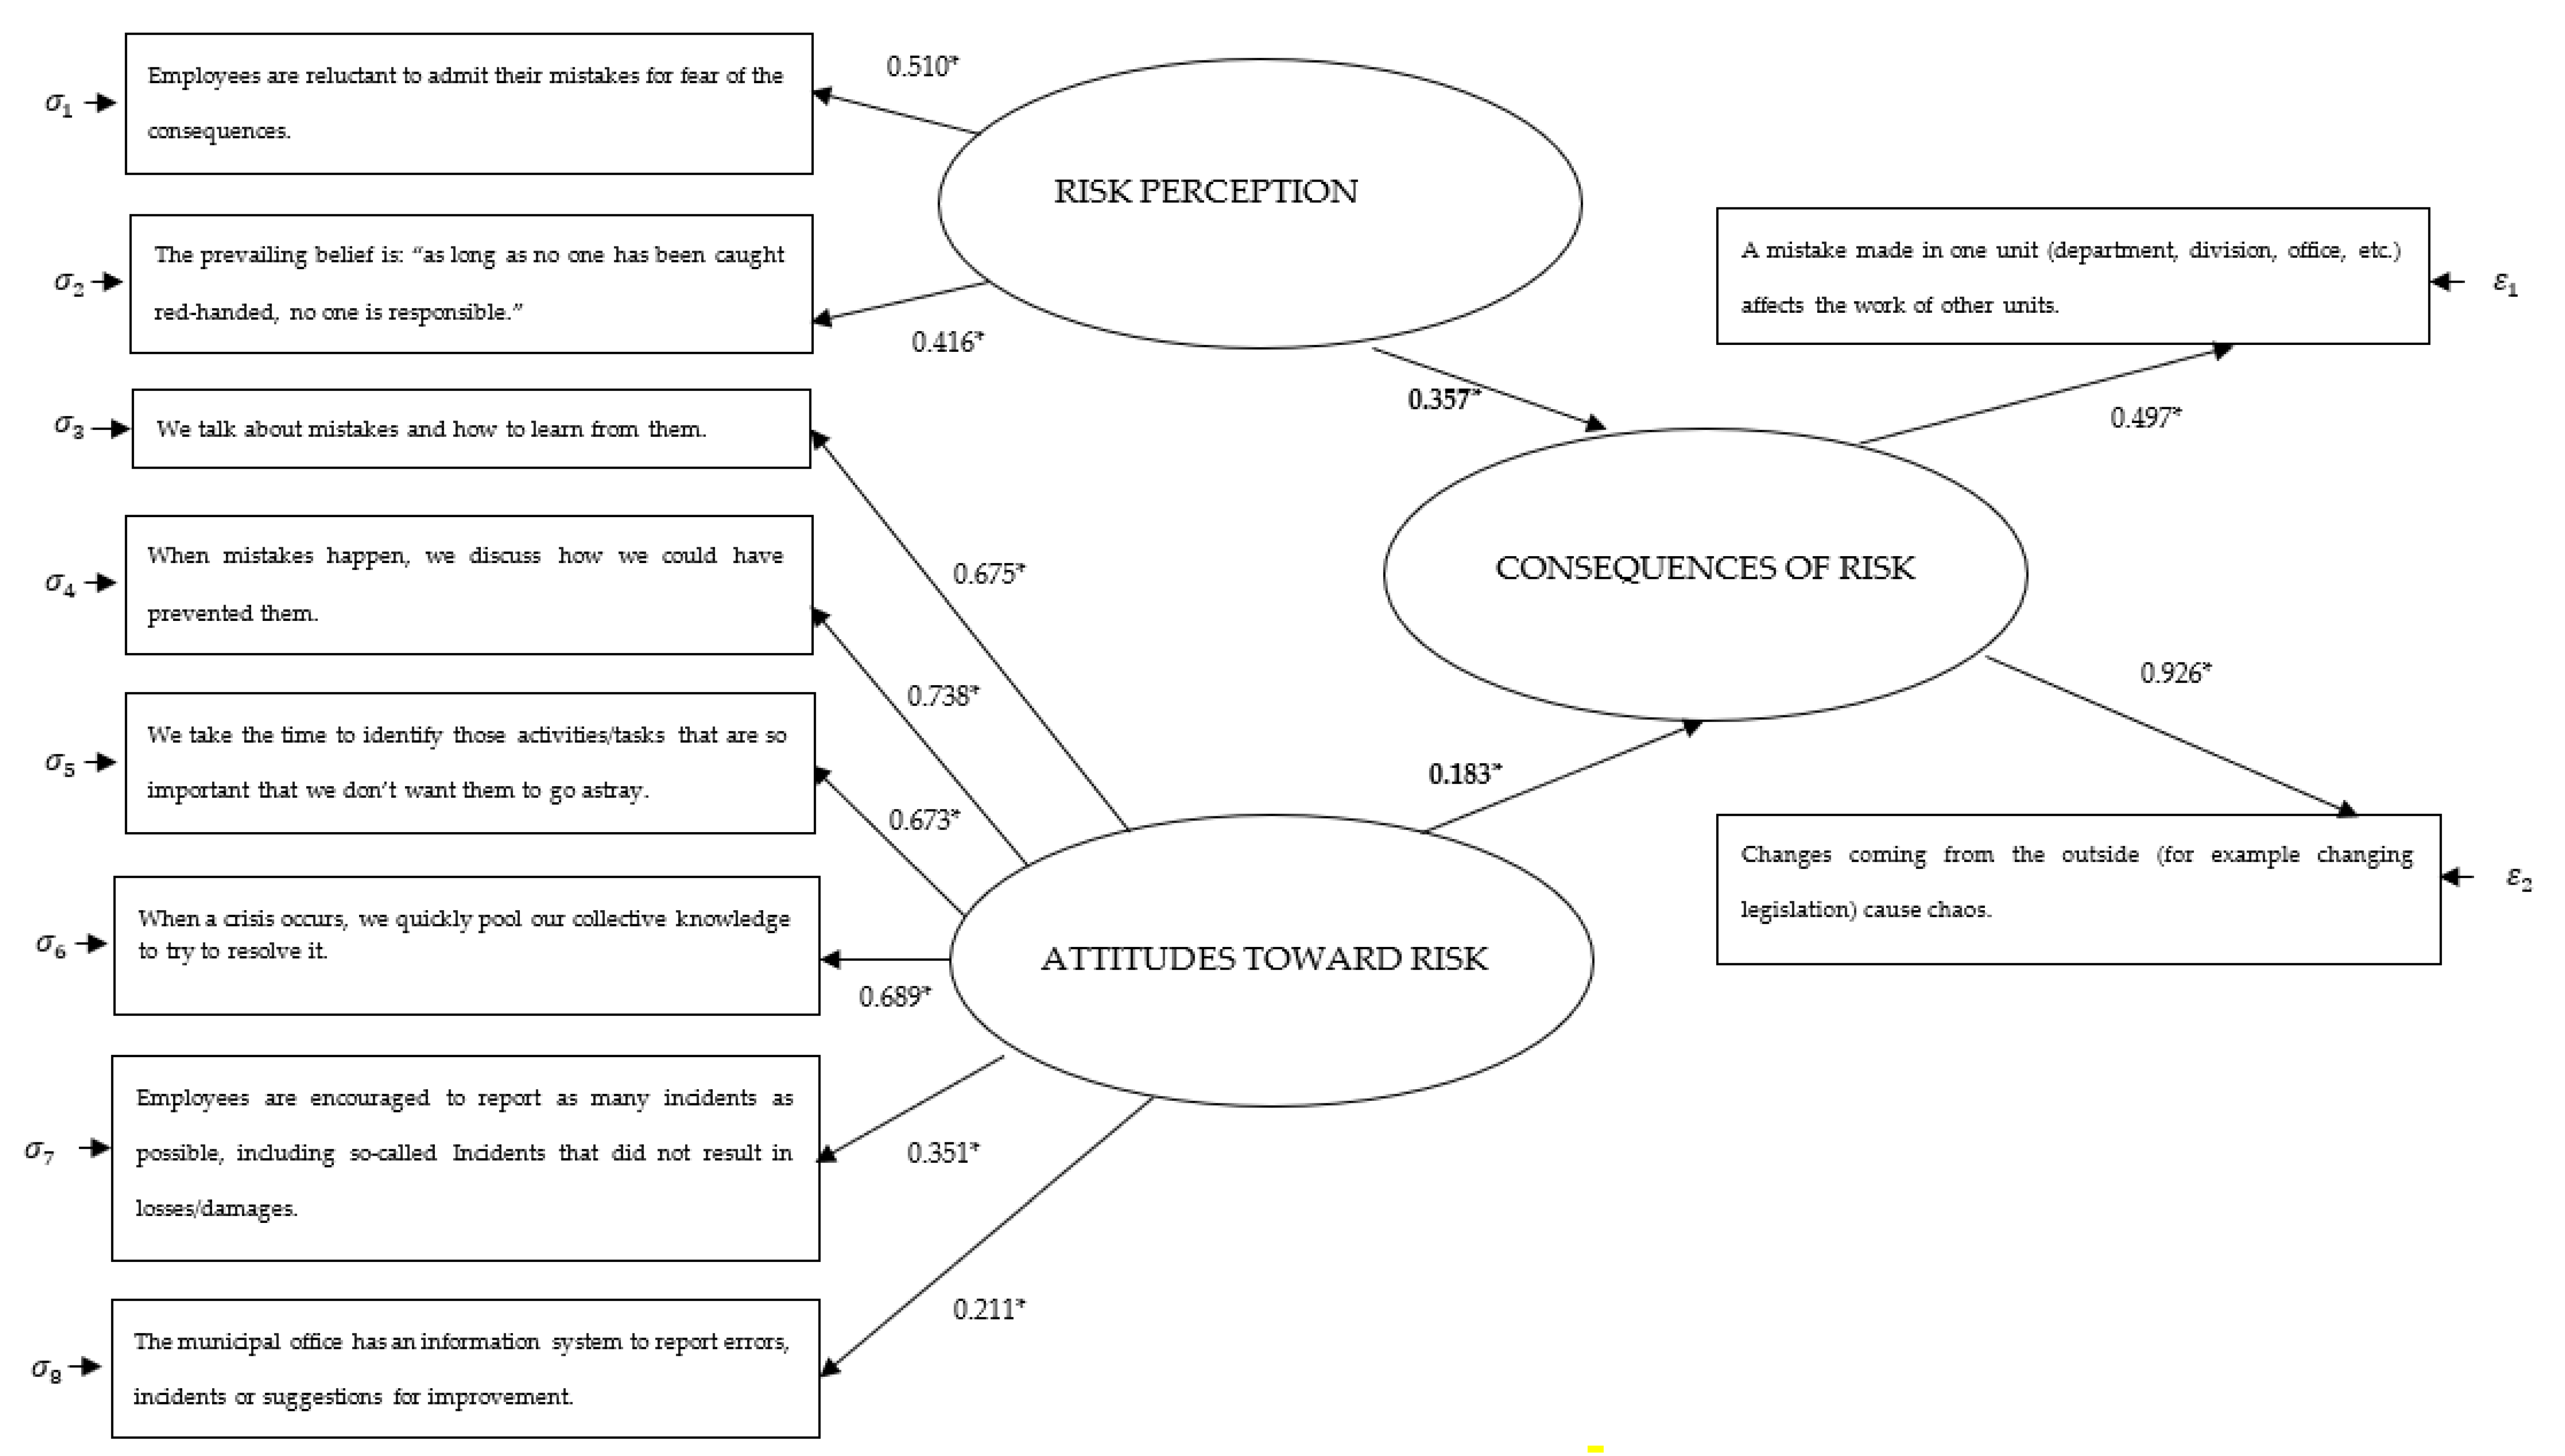
  • Perceptions of risk, allowing to determine whether and to what extent city employees perceive errors as a source of risk to the organization and are concerned about the consequences resulting from their occurrence.
  • Attitudes toward risk, allowing to identify the ways of responding to errors and crises in the organization at the individual (employee–supervisor), team (team of employees–supervisors), and systemic (employees–error and risk reporting systems) levels.
  • Consequences of risk, enabling identification of how employees perceive the effects of risk realization (in the form of change or error) in relation to external and internal threats.
In the process of creating the questionnaire, the authors used statements and a five-point Likert scale. This is a method often used in social and psychological research [58,59,60]. The respondent has the ability to quickly assimilate and understand the content of the statement and assess to what extent she/he agrees or disagrees with it. This, in turn, gives the researcher a wide opportunity to analyze the scale of the phenomenon.
A detailed list of survey statements with their assignment to each group is presented in Table 1.
The questions in the table relating to individual areas of risk management were assessed on a five-point Likert scale. The individual answers meant:
  • Definitely not
  • Rather not
  • I have no opinion
  • Rather yes
  • Definitely yes
This approach made it possible to accurately assess the scale of individual phenomena. It also enabled the use of structural equation modeling as a method of analyzing survey results.
The characterized survey questionnaire was completed by city officials employed in Polish municipal offices. There are currently 930 cities in Poland. The survey sample included 399 cities. This is a representative sample, selected assuming: (1) a maximum error of 5%, (2) a fraction size of 0.5, and (3) a 99% confidence level. The survey sample included 70% of smaller cities and 30% of cities with larger populations, reflecting the peculiarities of the population of Polish cities. The detailed composition of the research sample is presented in Figure 1.
It is worth explaining that only a few cities in Poland have the status of smart city. Nevertheless, many of them aspire to be called smart, and interest in smart urban solutions is constantly growing. In addition, the authors believe that smart city is the only right development concept for modern urban infrastructures—which is emphasized in the introduction. For these reasons, the considerations are set “in the context of smart cities”. The framework of this context is determined by theoretical considerations and discussion. The conducted research, in turn, is aimed at locating and inscribing the development of Polish cities into the paths of the SC concept. Thanks to the diagnosis obtained and the formulated recommendations, it will be possible to improve the management of Polish cities focused on being smart.

3.2. Methodology for Assessing Risk Management in the Surveyed Cities

The analysis of survey results was carried out in two stages. In the first stage—concerning the identification of risk perceptions, attitudes, and consequences—the following methods of descriptive statistics were used:
  • Measures of central tendency, that is: arithmetic mean, and dominant and median, depicting typical values of the surveyed variables.
  • Measures of variability, that is: standard deviation and coefficients of variation illustrating the degree of variation in the variables under study.
  • Measures of asymmetry, i.e., skewness, reporting how the variable is distributed around the mean value and the degree to which its distribution conforms to the normal distribution.
  • Measures of concentration and flattening, that is: kurtosis, indicating the intensity of the occurrence of extreme values of the variable.
In the second research stage, concerning the analysis of the relationship between risk perceptions and attitudes toward risk and the consequences of risk for the risk management in the city, structural equation modeling was used. This method makes it possible to analyze complex relationships between multiple variables, and for this reason it was chosen in the article as one of the research methods [61,62].
In practice, it is very often used in the fields of economics, social sciences, and humanities, because it allows systematizing the results of multi-faceted questionnaire research containing behavioral observations and subjective opinions of respondents [63]. This is carried out thanks to the possibility of parameterizing unobservable and non-quantifiable factors in the form of certain latent variables, and then aggregated to specific groups of endogenous variables, ultimately affecting the examined exogenous variable.
An additional advantage of modeling structural equations is the possibility of taking into account indirect relationships between individual groups of variables, which is not possible with classical multiple regression, most often used in the process of identifying the dependencies and effects of independent variables on the dependent variable.
Structural equation modeling takes place in five stages [64,65]:
  • Theoretical definition of the model,
  • Model identification,
  • Estimating model parameters,
  • Determining the goodness of fit of the model,
  • Possible modification of the model.
The first of these stages is considered the most important. Its task is to determine the basic relationships between the analyzed variables. These relationships are identified and described on the basis of the existing economic, social, and humanistic regularities reflected and confirmed in previous scientific research [66]. Therefore, the development of the model requires thorough literature studies, experience, and knowledge of the phenomena studied.
It is possible to parameterize it at the level of model identification. The necessary condition in this case is the fulfillment of the t rule, according to which the number of estimated parameters should be less than or equal to the number of unique values in the covariance matrix. In turn, the number of unique values can be calculated using Formula (1):
u = p × ( p + 1 ) / 2
p—number of observed variables.
Fulfillment of the above-mentioned relationship is a guarantee of the model’s traceability [67].
After finding the possibility of identifying the model, one can start estimating the parameters of the model, i.e., determining the strength and direction of the relationships linking the individual variables selected and characterized in the first stage. From a statistical point of view, estimating the model consists in finding such values of individual model parameters that will enable the most faithful replication of the observed real covariance matrix [68,69].
Four methods that can be used in the process of model estimation are described below [64]:
  • ML—maximum likelihood: Requires meeting the assumption of multidimensional normality of an observable variable, applicable with fewer attempts, and is resistant to change of the measuring scale. It cannot be used when the observed covariance matrix is not positively determined.
  • GLS—generalized least squares: Requires meeting the assumption of multivariate normality of an observable variable, applicable with fewer attempts, and can be used when the observed covariance matrix is not positively determined.
  • USL—unweighted least squares: May not require meeting the assumption of multivariate normality of an observable variable (however, then it is not possible to estimate the model measurement errors), applicable with fewer attempts, and can be used when the observed covariance matrix is not positively determined.
  • WLS—weighted least squares = ADF—asymptotically distribution-free: Does not require meeting the assumption of multidimensional normality of an observable variable, and can be used with numerous trials, at least 200–500 observations.
Model testing, which is the penultimate stage of creating structural equations, means the assessment of the fit of real data to the model form, i.e., checking to what extent the obtained model allows to replicate the input covariance matrix. Typically, the following indicators are used in the testing process:
  • GFI—goodness-of-fit index: Allows to determine what part of the variance in the observed matrix is explained by the identified model of structural equations. The satisfactory value of this indicator is 0.95 and more.
  • AGFI—adjusted-goodness-of-fit index: This is the degrees of freedom-adjusted version of the GFI indicator.
  • RMSEA—root mean square error of approximation: This is the value of the root mean square error of approximation, where 0.05 or less is considered a satisfactory value.
  • Bentler–Bonett Normed Fit Index: Indicates the degree of fit between the empirical and theoretical covariance matrix, and a satisfactory value for this index should be above 0.9.
The estimation of the model parameters may turn out to be unsatisfactory due to the failure to achieve the satisfactory values of the indicators outlined above. Then, an attempt should be made to modify the model, aimed at improving the fit. Most often, statistically insignificant relationships are removed from the model. One can also change the relationships between selected groups of variables and/or introduce new, justified relationships between the variables [70].
Structural equation modeling was carried out in this article using Statistica software in the SEPATH module. The research model developed on the basis of the literature studies is shown in Figure 2. It was used to identify the multidimensional relationships between attitudes toward risk and risk perceptions and the consequences of risk in the surveyed municipal offices.

4. Results

The methodology presented in the previous section was used to conduct surveys in 399 Polish cities. Their results are included in the next two subsections. The first includes descriptive statistics, allowing for characterizing risk perceptions, attitudes, and consequences. The second includes the identification of relationships between risk perceptions and attitudes and risk resilience carried out using structural equation modeling.

4.1. Perceptions, Attitudes, and Consequences of Risk in the Surveyed Cities

Table 2 shows the number and structure of responses, and Table 3 shows the basic descriptive statistics for each survey statement.
Thus, the distribution of responses to the first statement on risk perception indicates that municipal employees are reluctant to admit to making mistakes for fear of consequences (more than 40% of indications for the sum of “rather yes” and “definitely yes” responses). This observation is also confirmed by the rather high mean value of 3.18 and the dominant value of 4.00. This means that employees downplay organizational risks and prefer to expose the institution to risks rather than inform their superiors of a mistake. The anxiety they feel also reflects badly on the attitudes of managers, who introduce an atmosphere of a lack of understanding that causes fear and anxiety. This exposes the municipal office to a number of undisclosed internal sources of risk.
Despite the reluctance to disclose risks, most employees deny that in the municipal office it is believed that: “as long as no one has been caught red-handed, no one is responsible” (more than 50% of indications for the sum of “definitely not” and “rather not” answers; median and dominant 2.00; mean 2.32). Thus, it can be inferred that responsibility is enforced, and those guilty of making a mistake are sought out and identified. This attitude indicates that supervisors are attempting to identify internal sources of risk, but in light of the answers to question one, employees may associate them with repressive behavior that instills fear of both making a mistake and revealing it.
The results show a negative perception of risk by employees of municipal offices. They see in mistakes a threat to both themselves and the organization, but they prioritize protecting themselves over the effective functioning of the organization. They also associate risk with the need for accountability, which is enforced by supervisors.
Answers to the first two questions on attitudes toward risk show that in the municipal offices surveyed, time is spent, and employees are involved in the process of discussing misconduct. Mistakes are also treated as an opportunity to learn how to avoid them in the future (more than 80% of indications for the sum of “definitely yes” and “rather yes” answers for questions 3 “we talk about mistakes and how to learn from them”, and 4 “when mistakes happen, we discuss how we could have prevented them”). This is the right preventive attitude based on an ex-post analysis of the effects of risks. Discussing individual mistakes together helps in extending the prevention scope to the entire team. Nevertheless, in the context of such optimistic responses, it is surprising to see employees’ fear of revealing errors identified in the first part of the survey.
In the surveyed offices, efforts are also being made to mitigate risks ex ante. This is evidenced by more than 80% of the indications for the sum of “rather yes” and “definitely yes” answers to question 5: “we take the time to identify those activities/tasks that are so important that we don’t want them to go astray”. This is also confirmed by the high mean value of 3.89 and the median and dominant value of 4.00. The combination of ex post and ex ante protection increases the resilience of the city’s human resources to the implementation of insider threats.
From the answers to question 6: “when a crisis occurs, we quickly pool our collective knowledge to try to resolve it,” it can be deduced that the municipal offices do not underestimate crises and undertake team efforts to prevent their effects (highest mean in the statement, 4.05, and lowest standard deviation, 0.82; high median and dominant 4.00). The declaration of the highest level of response to the crisis also suggests an understanding of the nature of risk, as well as the presence of fear of the negative consequences of risks associated with their accumulation during the crisis phase.
The last two questions in the section on attitudes toward risk referred to the attitudes of supervisors (the municipal office) toward potential risks and their consequences. Thus, in the first question, respondents assessed the extent to which they are “encouraged to report as many incidents as possible, including so-called incidents that did not result in losses/damages”. For this question, the rather low value of the mean and the left skew of the distribution suggest that encouragement to report hazards is not common everywhere. This is also confirmed by the rather high standard deviation value of 0.93 and the coefficient of variation of 27.08%. It is worth adding, however, that perhaps such “incident reporting” is associated by employees with denunciation, which in Poland’s historical context (centrally planned economy system) raises negative connotations.
In the second question on official attitudes toward risk, respondents assessed whether “the municipal office has an information system to report errors, incidents, or suggestions for improvement”. According to the responses, majority of municipal offices do not offer employees such a solution (more than 39% of the responses were “definitely not” and “rather not”, and more than 25% of the responses were “don’t know”). Therefore, risk communication is mostly informal and not computer-assisted.
The last part of the survey referred to the internal and external consequences of risks perceived and felt by employees. In view of the responses, it can be concluded that city officials rate the negative consequences of internal errors slightly higher than external risks (average for internal risks 3.57, and external risks 3.49). Nevertheless, in both cases, they believe that errors and changes can negatively affect the functioning of the municipal office (dominant and median 4.00—“rather yes” for both questions).

4.2. Impact of Risk Perceptions and Attitudes on Resilience of Surveyed Cities

Besides assessing the involvement of the city authorities in protecting the health of residents, the article also plans to assess the participatory maturity of the city authorities in protecting the health of residents. The results are presented in this subsection.
Figure 3 shows the parameters of the structural model obtained from the surveys.
All the relationships between variables shown in Figure 3 are statistically significant at p = 0.01. The model is also a fairly good fit to the data, as confirmed by the following parameters:
  • GFI (goodness-of-fit index) = 0.951 (a satisfactory value for this index is 0.95 and above).
  • AGFI (adjusted goodness-of-fit index) = 0.918 (a value above 0.9 indicates an acceptable model, 0.95 and above, a satisfactory one, and 1 indicates an excellent fit).
  • RMSEA (root mean square error of approximation) = 0.058 (0.05 or less is considered a satisfactory value).
  • Bentler–Bonett Normed Fit Index = 0.918 (a satisfactory value for this index is above 0.9).
Analysis of endogenous variables (risk perception, attitudes toward risk) indicated that:
  • Perceptions of risk were more strongly influenced by reluctance to admit mistakes rather than by suffering consequences for making a mistake.
  • Attitudes toward risk are shaped primarily by the fact of discussing mistakes after they have been made (ex post) and by the accumulation of knowledge for the resolution of crises.
  • Individual and systemic reporting facilities affect attitudes toward risk to a lesser extent than behavioral factors arising from individual employee characteristic traits and the methods used to manage human resources in the face of risks and crises.
It follows from the above that the key role in shaping the right attitudes toward risk in municipal offices is the behavior and reactions of managers. It is their attitudes and organizing individual and collective work to reduce risks that most strongly influence the attitudes of city government employees.
Employees are afraid to admit their mistakes. In addition, some of them hide threats until they are revealed. Managers should therefore make employees aware of the importance of advance risk analysis and avoid scaring subordinates with the consequences of making a mistake. Perhaps an important solution in this case would be an institutionalized threat notification system, which currently exists only in a few municipal offices.
An important and positive aspect of risk management in the surveyed cities is the discussion about the threats that have materialized and those that may occur in the case of new challenges. In the light of the results obtained, these are the main factors shaping attitudes towards risk. The collective resolution of crisis situations should also be positively assessed.
On the other hand, in describing the exogenous variable (consequences of risk), external risks that can cause chaos in the organization are of the greatest importance. Internal risks associated with the risk of errors are of lesser importance. This confirms the management difficulties associated with risk management in crisis situations, especially those of significant scope and intensity.
Such an observation is certainly also the result of the intensification of threats in the contemporary turbulent environment. It emphasizes the importance of the external environment in risk management and the need to pay attention and use the efforts of the organization to mitigate exogenous risks.
Turning to the analysis of the impact of endogenous variables on the exogenous variable, it should be noted that employees’ perceptions of risk are more important for the consequences of risk than attitudes toward risk. This may be because risk perceptions are strongly related to employees’ personalities and past experiences. On the other hand, attitudes toward risk are derived from risk perception and can be influenced less directly.
It is difficult for managers to influence the perception of risk because it is rooted in the personality of employees. Nevertheless, the obtained results imply the need to mitigate concerns about disclosure of threats. However, a motivating approach to participating in risk management can modify risk perception and encourage employees to work together to protect the organization.
Therefore, risk perceptions—as being rooted in personality—will be more difficult to change and shape. Nonetheless, considering the extent of its influence on the consequences of risk, managers of individual municipal departments should focus on this factor as important in protecting against risks and strengthening the organization’s resilience to risk. This conclusion is further strengthened by the analysis conducted earlier, which showed that employees are reluctant to admit their mistakes, despite that they understand and recognize the negative consequences of risks.

5. Discussion

This section compares the results of the research with existing insights on risk management. Recommendations are also formulated for human resource management in the process of risk mitigation in smart cities.
The survey of risk perception in the municipal offices of Polish cities indicates that employees perceive risk as a threat. They also have concerns about facing the consequences associated with it. This is identical to the perception of risk by most managers in companies and stands in opposition to Ducker’s recommendation that risk should also be seen as an opportunity [42,43]. The affectivity of officials in the Polish administration is, thus, decidedly negative [44,45].
It is worth noting that negative risk perceptions may also be the result of a history of past experience [47], which is an important clue for human resource managers and should guide them to increase communication related to making mistakes and recognizing risks. The relevance of this observation is further reinforced by the high degree of dependence of risk consequences on risk perceptions, as demonstrated in the structural equation modeling process.
With regard to attitudes toward risk, it should be noted that in most of the surveyed units, they are in line with the recommendations of the literature and practice, as employees are aware of risks and the need to mitigate them, and therefore, consciously take risks [48,49,50]. It is also worth mentioning that risk protection is implemented both ex post and ex ante, which is a positive indication of the risk management process in the cities studied.
Nevertheless, the measures taken for risk mitigation are not institutionalized. They mainly take place on the line between supervisor–employee and supervisor–team. They mainly use traditional dialog. There is a lack of incentives and systems for reporting errors and risks that can make risk protection more effective. This corresponds with previous management insights into the development of smart cities in emerging and developing economies made by, among others: Janusz and Kowalczyk (2022) [33], Tantau and Santa (2021) [38], and Naterer et al. (2018) [39].
From the analysis of the responses regarding the consequences of risk, it can be noted that the respondents consider internal risks to be more dangerous than external ones, which may indicate a very individual perception of risk and a disregard for the decidedly more serious risks coming from the environment. Meanwhile, the role of the latter in urban management is clearly exposed by: Gavurova et al. (2022) [54], Kollárová and Ristvej (2021) [55], as well as Ullah et al. (2021) [57].
In the context of the obtained results, the following recommendations can be made concerning human resource and risk management in municipal offices:
  • Paying more attention to the role of human resources in human resource management.
  • Reviewing the conduct of supervisors in situations involving the reporting and monitoring of errors and risks.
  • Raising employee awareness of risk prevention measures (training, workshops, panel meetings).
  • Making employees aware of the importance of external risks in the context of the functioning of the city.
  • Making efforts to institutionalize the risk identification system using human resources.
  • Coordinating and integrating efforts to manage risks using human resources.

6. Conclusions

The conclusions drawn from the considerations undertaken in this article relate to the perceptions, attitudes, and consequences of risk in municipal offices and the impact of perceptions and attitudes on the realization of risks. They can be listed in the form of the following formulations:
  • Perception: Employees in municipal offices negatively perceive risk and believe that it has a disruptive effect on the organization. However, they are reluctant to report these risks, prioritizing their own safety over that of the municipal office.
  • Attitudes: Employees report high levels of taking individual and collective action to mitigate risks ex ante (before the risk occurs) and ex post (after the risk occurs). Municipal offices, however, do not always offer the opportunity to report risks both informally (in the form of a conversation) and in a computerized manner (using a computer system).
  • Consequences: City officials see a negative impact of external and internal threats on the functioning of city administration. Internal threats (e.g., errors) are slightly more serious, in their opinion.
  • Relationships: The consequences of risk are more strongly influenced by employees’ perceptions of risk than by individual, team, and systemic attitudes toward risk.
The above statements highlight the role of human resources in the management of cities that are and aspire to be smart cities. Afterall, the scale of efforts to mitigate risks, and thus the level of city resilience and safety for all residents, depends on perceptions and attitudes toward risk. In the current socioeconomic conditions, these are very important issues, affecting the quality of life of urban communities. For these reasons, smart city managers should pay more attention to risk management, not only to infrastructural measures, but also to measures that can strengthen behavioral aspects.
The main research limitation of the study is its reference to Polish cities. Nevertheless, the representativeness of the sample makes it possible to generalize the results and can provide an objective basis for international comparisons, in particular those conducted in developing economies.
Therefore, directions for further research may concern international comparisons. They may also include an in-depth cause-and-effect analysis of the impact of behavioral determinants on the scale of losses caused by the presence of risks in municipal administration. Finally, they may also relate to residents’ perceptions of risk and municipal counter-risk measures, thus confronting the viewpoints of the city and of its key stakeholders.
The added value of the research presented in this article comes from diagnosing the behavioral aspects of urban risk management and assessing the impact of attitudes toward risks and risk perceptions (internal and external) in a broad, representative range. Such research has not been conducted before, and the results contribute to the development of analyses on the role of urban risk management in the context of the smart city concept.

Author Contributions

Conceptualization, formal analysis, writing—original draft preparation, funding acquisition, I.J.-K.; conceptualization, methodology, investigation, resources, data curation, K.W.-G. All authors have read and agreed to the published version of the manuscript.

Funding

This research was funded by the Silesian University of Technology (BK-274/ROZ1/2023-13/010/BK_23/0072).

Institutional Review Board Statement

Not applicable.

Informed Consent Statement

Not applicable.

Data Availability Statement

Data are available upon request by e-mail: karolina.wielicka-ganczarczyk@polsl.pl.

Conflicts of Interest

The authors declare no conflict of interest.

References

  1. Szczepańska, A.; Kaźmierczak, R.; Myszkowska, M. Smart City Solutions from a Societal Perspective—A Case Study. Int. J. Environ. Res. Publ. Health 2023, 20, 5136. [Google Scholar] [CrossRef] [PubMed]
  2. Lapão, L.V.; Correia, J.C.; Jevtic, M. Public Health Framework for Smart Cities within the Comprehensive Approach to Sustainability in Europe: Case Study of Diabetes. Sustainability 2023, 15, 4269. [Google Scholar] [CrossRef]
  3. Lee, S. The Acceptance Model of Smart City Service: Focused on Seoul. Sustainability 2023, 15, 2695. [Google Scholar] [CrossRef]
  4. Kim, N.; Yang, S. Conceptually Related Smart Cities Services from the Perspectives of Governance and Sociotechnical Systems in Europe. Systems 2023, 11, 166. [Google Scholar] [CrossRef]
  5. Kociuba, D.; Sagan, M.; Kociuba, W. Toward the Smart City Ecosystem Model. Energies 2023, 16, 2795. [Google Scholar] [CrossRef]
  6. Hashem, I.A.T.; Usmani, R.S.A.; Almutairi, M.S.; Ibrahim, A.O.; Zakari, A.; Alotaibi, F.; Alhashmi, S.M.; Chiroma, H. Urban Computing for Sustainable Smart Cities: Recent Advances, Taxonomy, and Open Research Challenges. Sustainability 2023, 15, 3916. [Google Scholar] [CrossRef]
  7. Locurcio, M.; Tajani, F.; Anelli, D. Sustainable Urban Planning Models for New Smart Cities and Effective Management of Land Take Dynamics. Land 2023, 12, 621. [Google Scholar] [CrossRef]
  8. Burdzik, R. An Application of the DHI Methodology for a Comparison of SARS-CoV-2 Epidemic Hazards in Customer Delivery Services of Smart Cities. Smart Cities 2023, 6, 965–986. [Google Scholar] [CrossRef]
  9. Taghipour, A.; Ramezani, M.; Khazaei, M.; Roohparvar, V.; Hassannayebi, E. Smart Transportation Behavior through the COVID-19 Pandemic: A Ride-Hailing System in Iran. Sustainability 2023, 15, 4178. [Google Scholar] [CrossRef]
  10. Jasińska-Biliczak, A. Smart-City Citizen Engagement: The Answer to Energy Savings in an Economic Crisis? Energies 2022, 15, 8828. [Google Scholar] [CrossRef]
  11. Petrova, M.; Tairov, I. Solutions to Manage Smart Cities’ Risks in Times of Pandemic Crisis. Risks 2022, 10, 240. [Google Scholar] [CrossRef]
  12. Strielkowski, W.; Zenchenko, S.; Tarasova, A.; Radyukova, Y. Management of Smart and Sustainable Cities in the Post-COVID-19 Era: Lessons and Implications. Sustainability 2022, 14, 7267. [Google Scholar] [CrossRef]
  13. Caragliu, A.; Del Bo, C.; Nijkamp, P. Smart Cities in Europe. J. Urban Technol. 2011, 18, 15–38. [Google Scholar] [CrossRef]
  14. Dameri, R.P. Searching for smart city definition: A comprehensive proposal. Int. J. Comput. Technol. 2013, 11, 75–128. [Google Scholar] [CrossRef]
  15. Komninos, N. The Age of Intelligent Cities: Smart Environments and Innovation-for All Strategies; Routledge: London, UK, 2014. [Google Scholar]
  16. Hollands, R.G. Will the real smart city please stand up? Intelligent, progressive or entrepreneurial? City 2008, 12, 128–136. [Google Scholar] [CrossRef]
  17. Vujković, P.; Ravšelj, D.; Umek, L.; Aristovnik, A. Bibliometric Analysis of Smart Public Governance Research: Smart City and Smart Government in Comparative Perspective. Soc. Sci. 2022, 11, 293. [Google Scholar] [CrossRef]
  18. He, W.; Li, W.; Deng, P. Legal Governance in the Smart Cities of China: Functions, Problems, and Solutions. Sustainability 2022, 14, 9738. [Google Scholar] [CrossRef]
  19. Nina, X.; Hao, Z.; Huije, L.; Rongxial, Y.; Jia, W.; Zhongke, F. Performance Analysis of Smart City Governance: Dynamic Impact of Beijing 12345 Hotline on Urban Public Problems. Sustainability 2022, 14, 9986. [Google Scholar]
  20. Hajduk, S. Modele smart city a zarządzanie przestrzenne miast. Pol. J. Econ. 2020, 302, 123–139. [Google Scholar]
  21. Overview of the Smart Cities Maturity Model. Urban Tide. 2016. Available online: https://static1.squarespace.com/static/5527ba84e4b09a3d0e89e14d/t/55aebffce4b0f8960472ef49/1437515772651/UT_Smart_Model_FINAL.pdf (accessed on 3 March 2023).
  22. Smart Prague Action Plan 2030. 2019. Available online: https://www.smartprague.eu/action-plan (accessed on 3 March 2023).
  23. Laurini, R. A primer of knowledge management for smart city governance. Land Use Policy 2021, 111, 104832. [Google Scholar] [CrossRef]
  24. Maurya, K.K.; Biswas, A. Performance assessment of governance in Indian smart city development. Smart Sustain. Built Environ. 2021, 10, 653–680. [Google Scholar] [CrossRef]
  25. Landsbergen, D.; Girth, A.; Westover-Muñoz, A. Governance rules for managing smart city information. Urban Gov. 2022, 2, 221–231. [Google Scholar] [CrossRef]
  26. Fonseca, D.; Sanchez-Sepulveda, M.; Necchi, S.; Peña, E. Towards smart city governance. Case study: Improving the interpretation of quantitative traffic measurement data through citizen participation. Sensors 2021, 21, 5321. [Google Scholar] [CrossRef]
  27. Yoo, Y. Toward sustainable governance: Strategic analysis of the smart city Seoul portal in Korea. Sustainability 2021, 13, 5886. [Google Scholar] [CrossRef]
  28. Saadah, M. Artificial Intelligence for Smart Governance; towards Jambi Smart City. IOP Conf. Ser. Earth Environ. Sci. 2021, 717, 012030. [Google Scholar] [CrossRef]
  29. Kóňa, A.; Guťan, D.; Horváth, P. Slovak Republic on the Way to Build Smart Cities Based on KPIs with First Slovak Smart City Index. Sci. Pap. Univ. Pardubic. Ser. D Fac. Econ. Adm. 2020, 28, 1061. [Google Scholar]
  30. Mora, L.; Gerli, P.; Ardito, L.; Petruzzelli, A.M. Smart city governance from an innovation management perspective: Theoretical framing, review of current practices, and future research agenda. Technovation 2023, 123, 102717. [Google Scholar] [CrossRef]
  31. Sheikh, K.; Mitchell, P.; Foth, M. More-than-human smart urban governance: A research agenda. Digit. Geogr. Soc. 2023, 4, 100045. [Google Scholar] [CrossRef]
  32. Liu, D.; Qi, X. Smart governance: The era requirements and realization path of the modernization of the basic government governance ability. Procedia Comput. Sci. 2022, 199, 674–680. [Google Scholar] [CrossRef]
  33. Janusz, M.; Kowalczyk, M. How Smart Are V4 Cities? Evidence from the Multidimensional Analysis. Sustainability 2022, 14, 10313. [Google Scholar] [CrossRef]
  34. Varró, K.; Szalai, A. Discourses and practices of the smart city in Central Eastern Europe: Insights from Hungary’s ‘big’ cities. Urban Res. Pract. 2022, 15, 699–723. [Google Scholar] [CrossRef]
  35. Jonek-Kowalska, I.; Wolniak, R. Economic opportunities for creating smart cities in Poland. Does wealth matter? Cities 2021, 114, 103222. [Google Scholar] [CrossRef]
  36. Popova, Y.; Popovs, S. Impact of Smart Economy on Smart Areas and Mediation Effect of National Economy. Sustainability 2022, 14, 2789. [Google Scholar] [CrossRef]
  37. Senetra, A.; Szarek-Iwaniuk, P. Socio-economic development of small towns in the Polish Cittaslow Network—A case study. Cities 2020, 103, 102758. [Google Scholar] [CrossRef]
  38. Tantau, A.; Şanta, A.M.I. New Energy Policy Directions in the European Union Developing the Concept of Smart Cities. Smart Cities 2021, 4, 241–252. [Google Scholar] [CrossRef]
  39. Naterer, A.; Žižek, A.; Lavrič, M. The quality of integrated urban strategies in light of the Europe 2020 strategy: The case of Slovenia. Cities 2018, 72, 369–378. [Google Scholar] [CrossRef]
  40. Jia, J.; Bradbury, M.E. Complying with best practice risk management committee guidance and performance. J. Contemp. Account. Econ. 2020, 16, 100225. [Google Scholar] [CrossRef]
  41. Kirin, S.; Sedmak, A.; Lic, W.; Brzaković, M.; Miljanoviće, I.; Petrović, A.; Sedmaka, S. Human factor risk management procedures applied in the case of open pit mine. Eng. Fail. Anal. 2021, 126, 105456. [Google Scholar] [CrossRef]
  42. Drucker, P.F. Skuteczne Zarządzanie; Wydawnictwo Naukowe PWN: Warszawa, Poland, 1976. [Google Scholar]
  43. Drucker, P.F. Zarządzanie Organizacja Pozarządową. Teoria i Praktyka; Wydawnictwo Borodo: Warszawa, Poland, 1985. [Google Scholar]
  44. Isen, A.M.; Geva, N. Influence of positive effect on the subjective utility of gains and losses: It is just not worth the risk. J. Personal. Soc. Psychol. 1988, 55, 710–717. [Google Scholar] [CrossRef]
  45. Isen, A.M.; Geva, N. The influence of positive affect on acceptable level of risk: The person with a large canoe has a large worry. Org. Behav. Hum. Decis. Proc. 1987, 39, 145–154. [Google Scholar] [CrossRef]
  46. Campara, J.; Da Costa, N., Jr.; Matsushita, R.; Da Silva, S. Two selves and two minds in a longitudinal survey of risk attitudes. J. Behav. Exp. Financ. 2021, 29, 100444. [Google Scholar] [CrossRef]
  47. Macko, A.; Tyszka, T. Przedsiębiorczość i ryzykowanie. Decyzje 2005, 4, 29–50. [Google Scholar]
  48. Tavor, T. The theoretical attitude and actual behavior of an individual towards risk. J. Behav. Exp. Financ. 2019, 23, 1–11. [Google Scholar] [CrossRef]
  49. Jaramillo, M.; Vargas, K.L. Interpersonal comparisons and risk attitudes: An artefactual field experiment. Econ. Lett. 2019, 179, 16–18. [Google Scholar] [CrossRef]
  50. Nax, H.H.; Newton, J. Risk attitudes and risk dominance in the long run. Games Econ. Behav. 2019, 116, 179–184. [Google Scholar] [CrossRef]
  51. Jian, P.; Guo, T.; Wang, D.; Valipour, E.; Nojavan, S. Risk-based energy management of industrial buildings in smart cities and peer-to-peer electricity trading using second-order stochastic dominance procedure. Sustain. Cities Soc. 2022, 77, 103550. [Google Scholar] [CrossRef]
  52. Shayan, S.; Kim, K.P. 2023. Understanding correlations between social risks and sociodemographic factors in smart city development. Sustain. Cities Soc. 2023, 89, 104320. [Google Scholar] [CrossRef]
  53. Al Sharif, M.; Pokharel, K. Smart City Dimensions and Associated Risks: Review of literature. Sustain. Cities Soc. 2022, 77, 103542. [Google Scholar] [CrossRef]
  54. Gavurova, B.; Kelemen, M.; Polishchuk, V. Expert model of risk assessment for the selected components of smart city concept: From safe time to pandemics as COVID-19. Socio-Econ. Plan. Sci. 2022, 82, 101253. [Google Scholar] [CrossRef]
  55. Kollárová, M.; Ristvej, J. Proposal of Risk Reduction Measures for the Construction of Smart Cities. Transp. Res. Procedia 2021, 55, 1753–1758. [Google Scholar] [CrossRef]
  56. Zhang, Y.; Geng, P.; Sivaparthipan, C.B. Big data and artificial intelligence based early risk warning system of fire hazard for smart cities. Sustain. Energy Technol. Assess. 2021, 45, 100986. [Google Scholar] [CrossRef]
  57. Ullah, V.; Qayyum, S.; Thaheem, M.J.; Al-Turjman, F.; Sepasgozar, S.M.E. Risk management in sustainable smart cities governance: A TOE framework. Technol. Forecast. Soc. Change 2021, 167, 120743. [Google Scholar] [CrossRef]
  58. Joshi, A.; Kale, S.; Chandel, S.; Pal, D.K. Likert Scale: Explored and Explained. Br. J. Appl. Sci. Technol. 2015, 7, 396–403. [Google Scholar] [CrossRef]
  59. Jebb, A.T.; Ng, V.; Tay, L. A Review of Key Likert Scale Development Advances: 1995–2019. Front. Psychol. 2021, 12, 637547. [Google Scholar] [CrossRef] [PubMed]
  60. Nemoto, T.; Beglar, D. Developing Likert-scale questionnaires. In JALT2013 Conference Proceedings; Sonda, N., Krause, A., Eds.; JALT: Tokyo, Japan, 2013. [Google Scholar]
  61. Hershberger, S.L. The Growth of Structural Equation Modeling: 1994–2001. Structural Equation Modeling. A Multidiscip. J. 2003, 10, 35–46. [Google Scholar]
  62. Cliff, N. Some Cautions Concerning the Application of Causal Modeling Methods. Multivar. Behav. Res. 1983, 18, 115–126. [Google Scholar] [CrossRef]
  63. Staniec, I. Modelowanie równań strukturalnych w naukach o zarządzaniu. Organ. I Kier. 2012, 2, 65–88. [Google Scholar]
  64. Zasuwa, G. Zastosowanie Modelowania Równań Strukturalnych do Badań nad Zachowaniem Konsumentów. Available online: https://www.statsoft.pl/textbook/stathome_stat.html?https%3A%2F%2Fwww.statsoft.pl%2Ftextbook%2Fstsepath. (accessed on 1 April 2023).
  65. Baumgartner, H.; Homburg, C. Application of structural equation modelling in marketing and consumer research. A review. Int. J. Res. Mark. 1996, 13, 139–161. [Google Scholar] [CrossRef]
  66. MacKenzie, S.B.; Lutz, R.J. An Empirical Examination of the Structural Antecedents of Attitude toward the Ad in an Advertising Pretesting Context. J. Mark. 1989, 53, 48–65. [Google Scholar] [CrossRef]
  67. Schumacker, R.M.; Lomax, R.G. A Beginner’s Guide to Structural Equation Modeling; Lawrence Erlbaum Associates Publishers: London, UK, 2004. [Google Scholar]
  68. Kacprzak, A. Modelowanie strukturalne w analizie zachowań konsumentów: Porównanie metod opartych na analizie kowariancji (CB-SEM) i częściowych najmniejszych kwadratów (PLS-SEM). Handel Wewnętrzny 2018, 6, 247–261. [Google Scholar]
  69. Konarski, R. Modele Równań Strukturalnych. Teoria i Praktyka; Wydawnictwo Naukowe PWN: Warszawa, Poland, 2009. [Google Scholar]
  70. Richter, N.F.; Sinkovics, R.R.; Ringle, C.M.; Schlägel, C. A critical look at the use of SEM in international business research. Int. Mark. Rev. 2016, 33, 67–81. [Google Scholar] [CrossRef]
Figure 1. The structure of the surveyed cities sample.
Smartcities 06 00064 g001
Figure 2. Research model adopted (influence of risk perception and attitudes toward risk on the risk consequences).
Smartcities 06 00064 g002
Figure 3. Research model achieved (influence of risk perception and attitudes toward risk on the risk consequences (* p = 0.01)).
Smartcities 06 00064 g003
Table 1. Survey statements, including risk perception, attitudes toward risk, and consequences of risk.
Research AreaSurvey Statements
(Rated on a Five-Point Likert Scale: 1—Definitely Not; 2—Rather Not; 3—I Have No Opinion; 4—Rather Yes; 5—Definitely Yes)
(1) Risk PerceptionEmployees are reluctant to admit their mistakes for fear of the consequences.
The prevailing belief is: “as long as no one has been caught red-handed, no one is responsible.”
(2) Attitudes Toward RiskWe talk about mistakes and how to learn from them.
When mistakes happen, we discuss how we could have prevented them.
We take the time to identify those activities/tasks that are so important that we don’t want them to go astray.
When a crisis occurs, we quickly pool our collective knowledge to try to resolve it.
Employees are encouraged to report as many incidents as possible, including so-called incidents that did not result in losses/damages.
The municipal office has an information system to report errors, incidents, or suggestions for improvement.
(3) Consequences of RiskA mistake made in one unit (department, division, office, etc.) affects the work of other units.
Changes coming from the outside (for example changing legislation) cause chaos.
Table 2. The number and structure of the answers to specific survey statements.
No.Statement
Answers: *
Number of Responses
12345Total
Risk Perception
1Employees are reluctant to admit their mistakes for fear of the consequences910611614127399
2The prevailing belief is: “as long as no one has been caught red-handed, no one is responsible” 861581083710399
Attitudes Toward Risk
3We talk about mistakes and how to learn from them7303425375399
4When mistakes happen, we discuss how we could have prevented them81732242100399
5We take the time to identify those activities/tasks that are so important that we don’t want them to go astray 7244824575399
6When a crisis occurs, we quickly pool our collective knowledge to try to resolve it52034232108399
7Employees are encouraged to report as many incidents as possible, including so-called incidents that did not result in losses/damages144513517035399
8The municipal office has an information system to report errors, incidents, or suggestions for improvement589210010841399
Consequences of Risk
9A mistake made in one unit (department, division, office, etc.) affects the work of other units 4597822137399
10Changes coming from the outside (for example changing legislation) cause chaos10935916473399
No.QuestionResponses Structure
12345Total
Risk Perception
1Employees are reluctant to admit their mistakes for fear of the consequences2.26%26.57%29.07%35.34%6.77%100.00%
2The prevailing belief is: “as long as no one has been caught red-handed, no one is responsible” 21.55%39.60%27.07%9.27%2.51%100.00%
Attitudes Toward Risk
3We talk about mistakes and how to learn from them1.75%7.52%8.52%63.41%18.80%100.00%
4When mistakes happen, we discuss how we could have prevented them2.01%4.26%8.02%60.65%25.06%100.00%
5We take the time to identify those activities/tasks that are so important that we don’t want them to go astray 1.75%6.02%12.03%61.40%18.80%100.00%
6When a crisis occurs, we quickly pool our collective knowledge to try to resolve it1.25%5.01%8.52%58.15%27.07%100.00%
7Employees are encouraged to report as many incidents as possible, including so-called incidents that did not result in losses/damages3.51%11.28%33.83%42.61%8.77%100.00%
8The municipal office has an information system to report errors, incidents, or suggestions for improvement14.54%23.06%25.06%27.07%10.28%100.00%
Consequences of Risk
9A mistake made in one unit (department, division, office, etc.) affects the work of other units 1.00%14.79%19.55%55.39%9.27%100.00%
10Changes coming from the outside (for example changing legislation) cause chaos2.51%23.31%14.79%41.10%18.30%100.00%
* Statements were rated on a five-point Likert scale: 1—definitely not; 2—rather not; 3—I have no opinion; 4—rather yes; 5—definitely yes.
Table 3. Descriptive statistics for each survey statement.
No.QuestionMeanMedianModeStd. Dev.Coef. Var.SkewnessKurtosis
Risk Perception
1Employees are reluctant to admit their mistakes for fear of the consequences3.183.004.000.9830.68−0.07−0.85
2The prevailing belief is: “as long as no one has been caught red-handed, no one is responsible” 2.322.002.000.9942.870.53−0.13
Attitudes Toward Risk
3We talk about mistakes and how to learn from them3.904.004.000.8521.81−1.231.94
4When mistakes happen, we discuss how we could have prevented them4.034.004.000.8320.53−1.362.89
5We take the time to identify those activities/tasks that are so important that we don’t want them to go astray 3.894.004.000.8421.44−1.151.93
6When a crisis occurs, we quickly pool our collective knowledge to try to resolve it4.054.004.000.8220.20−1.202.19
7Employees are encouraged to report as many incidents as possible, including so-called incidents that did not result in losses/damages3.424.004.000.9327.08−0.520.12
8The municipal office has an information system to report errors, incidents, or suggestions for improvement2.953.004.001.2241.39−0.05−1.00
Consequences of Risk
9A mistake made in one unit (department, division, office, etc.) affects the work of other units3.574.004.000.8924.86−0.67−0.13
10Changes coming from the outside (for example changing legislation) cause chaos3.494.004.001.1131.82−0.37−0.95
Disclaimer/Publisher’s Note: The statements, opinions and data contained in all publications are solely those of the individual author(s) and contributor(s) and not of MDPI and/or the editor(s). MDPI and/or the editor(s) disclaim responsibility for any injury to people or property resulting from any ideas, methods, instructions or products referred to in the content.

