
Assessing the Effectiveness of Air Quality Improvements in Polish Cities Aspiring to Be Sustainably Smart

Abstract
:1. Introduction
- An assessment carried out concerning the effectiveness of improving air quality in Polish cities in the long term and comparatively;
- Indication of the scope for achieving environmental quality improvement goals in cities aspiring to be smart;
- Identification of the cities that best fit with the environmental priorities of the European Union and the smart city concept;
- Embedding research in a developing economy characterized by problems in meeting environmental goals;
- To fill the research gap in terms of holistic (non-case study) analyses of the environmental aspects of smart city development, with a particular focus on the impact of the COVID-19 pandemic on air quality in Polish cities (such studies have not been conducted so far and are part of the international research trend from 2019 to 2022).
2. Literature Overview
2.1. Environmental and Climate Issues in Smart Cities of Developing and Emerging Economies
- The need to monitor environmental and climate progress;
- Exposing the importance of environmental priorities in the smart city concept;
- The need to evaluate the effectiveness of municipal policies to take care of air quality;
- The lack of studies documenting the effects of environmental goals in smart cities in a long-term and comparative perspective.
2.2. Air Quality in Smart Cities
3. Materials and Methods
3.1. Research Intentions, Data, and Methods
- 1.
- The first stage assessed the level of compliance with PM10 standards set by the European Union and WHO (in this respect, a comparison of institutional standards with indicators reported by individual cities was used, the assessment was carried out with two criteria: “compliance with the requirements” or “non-compliance with the requirements”).
- 2.
- In the second stage, the obtained data were compared with additional measures for assessing the effectiveness of PM10 reduction, which were taken as:
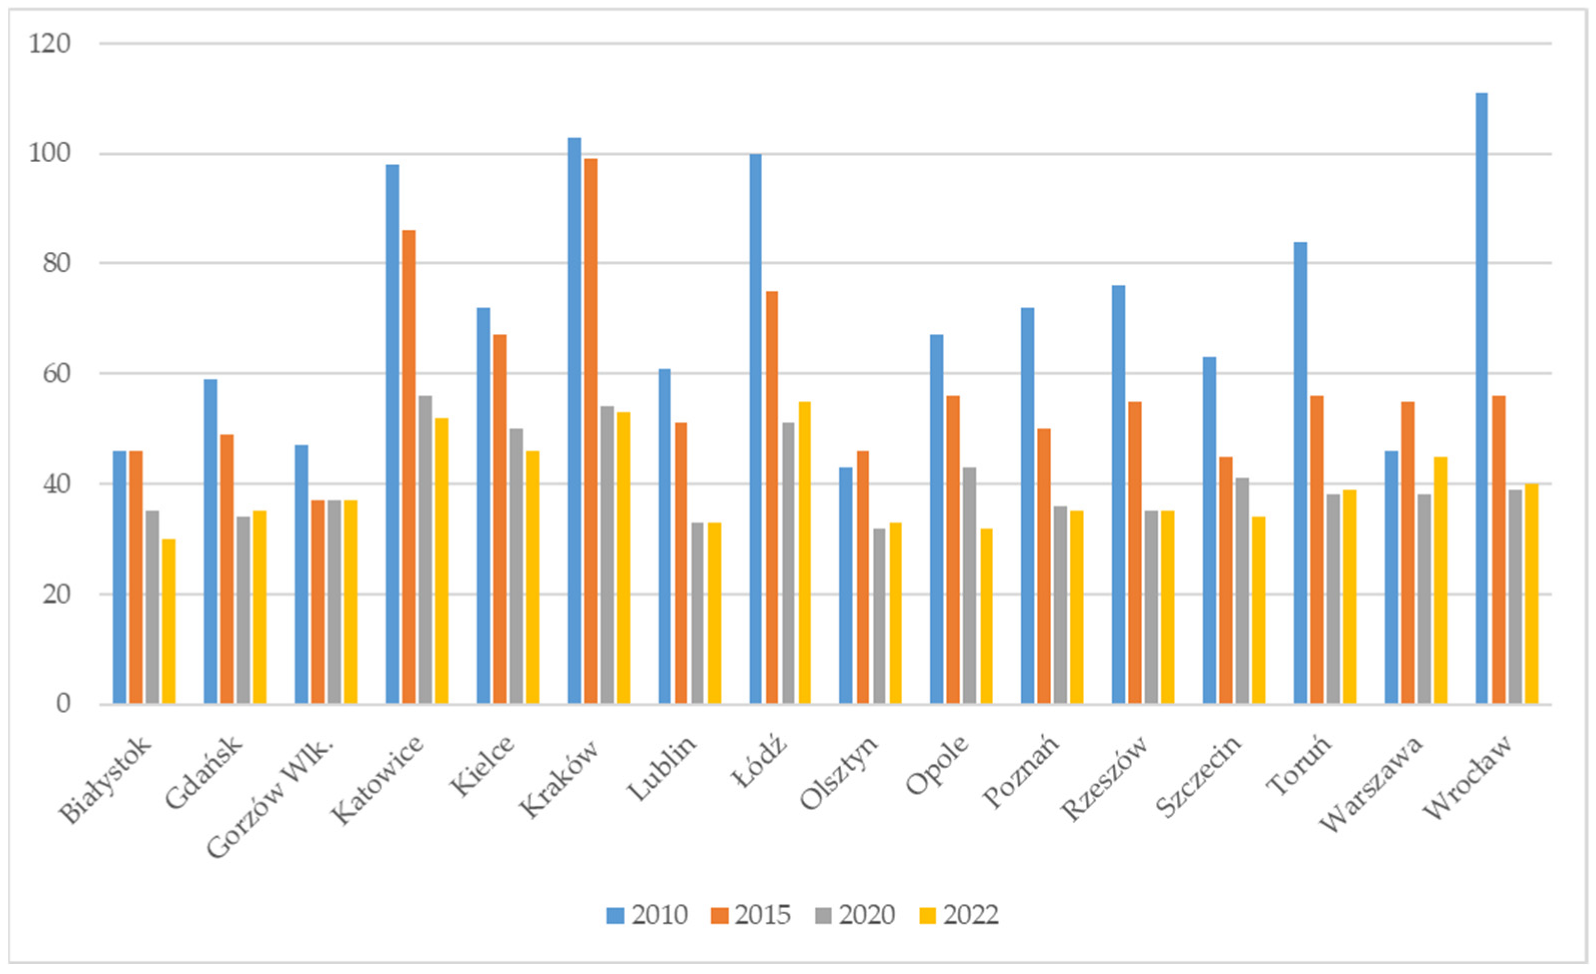
- P90 percentile indicating up to which limit 90% of daily PM10 concentration measurements were in;
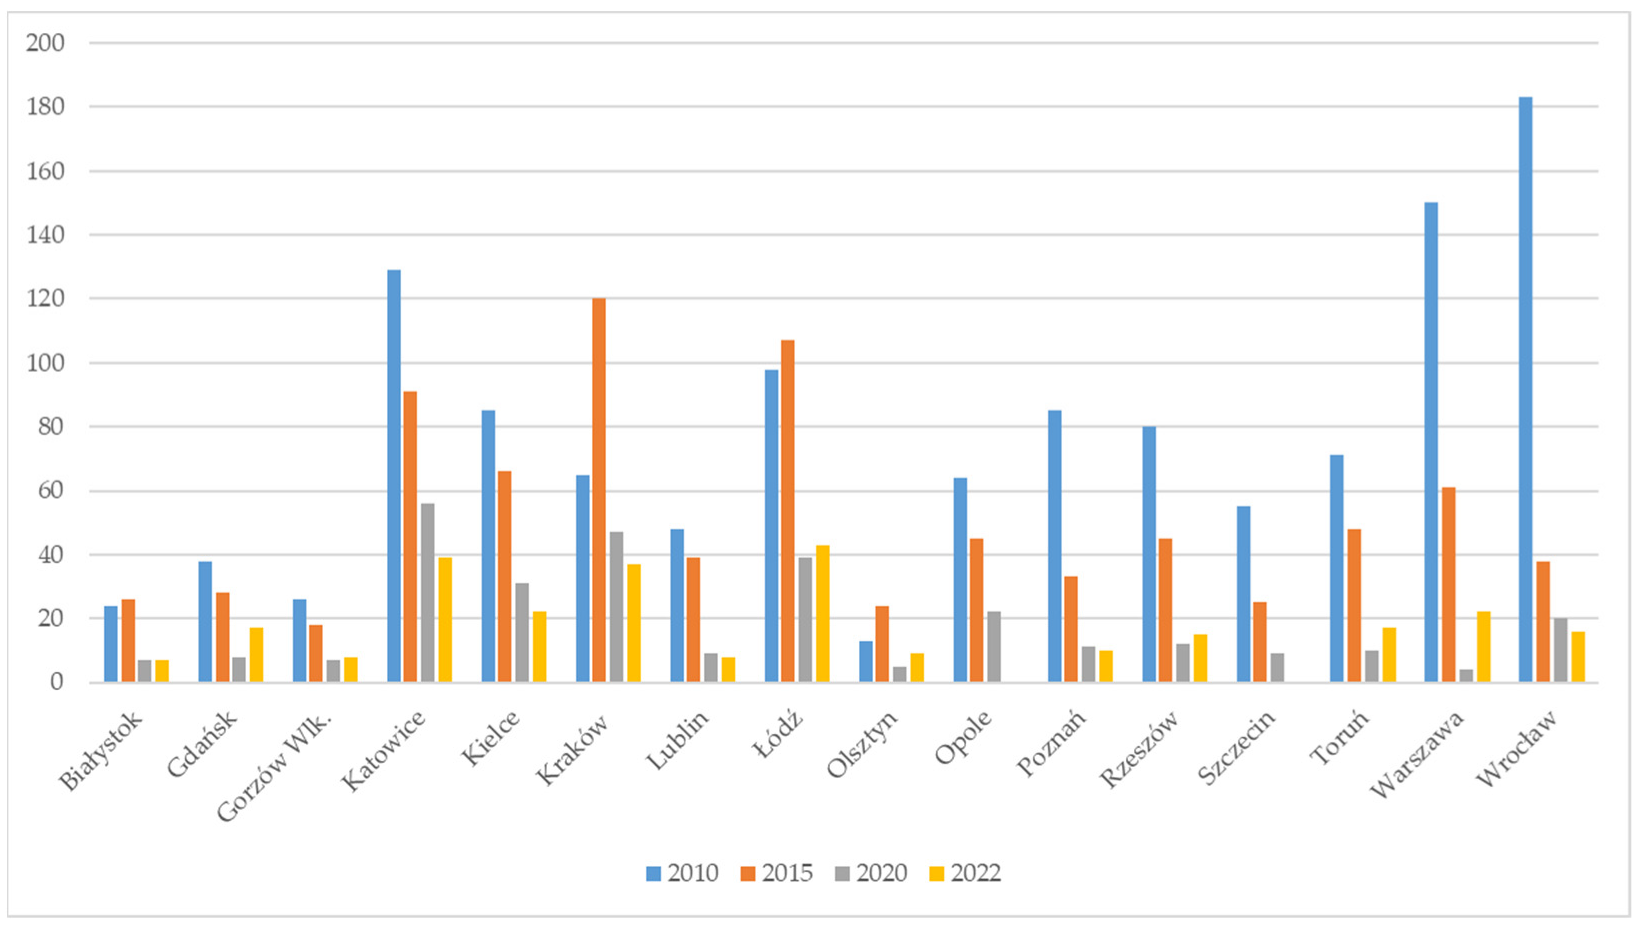
- maximum values of daily PM10 concentrations;
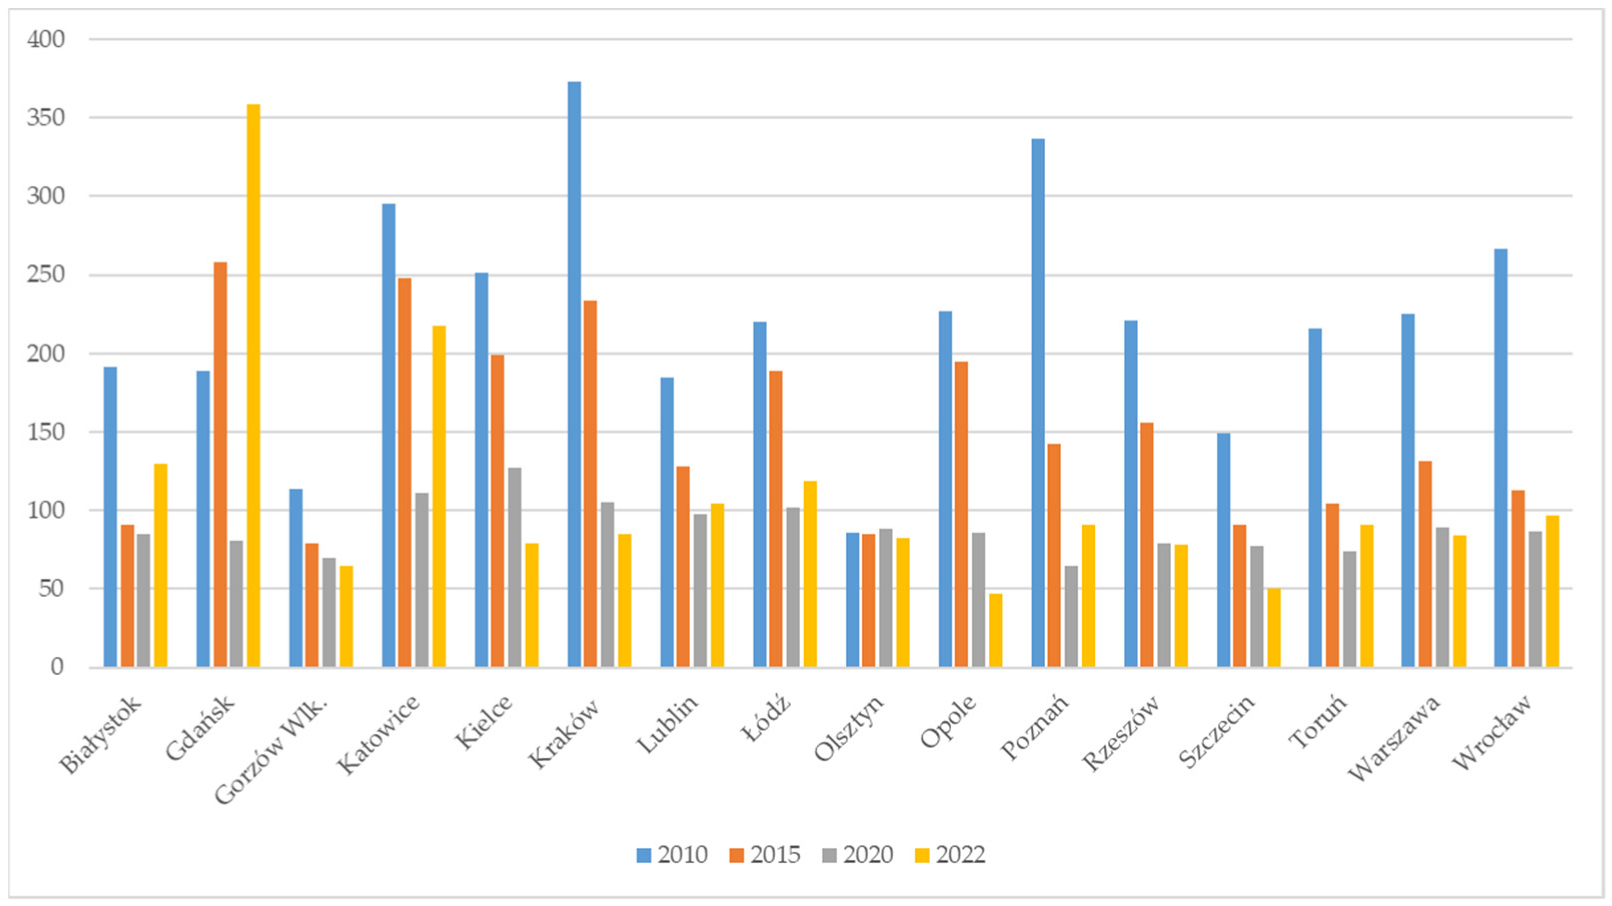
- the number of days on which PM10 concentrations exceeded the daily average value.
The indicators listed above were used to deepen the assessment of effectiveness. Meeting the standards in one narrow scope does not guarantee a real improvement in air quality, and thus in the quality of life. The measurement itself can also be aimed at meeting defined requirements. Hence the need to observe non-standardized PM10 values. - 3.
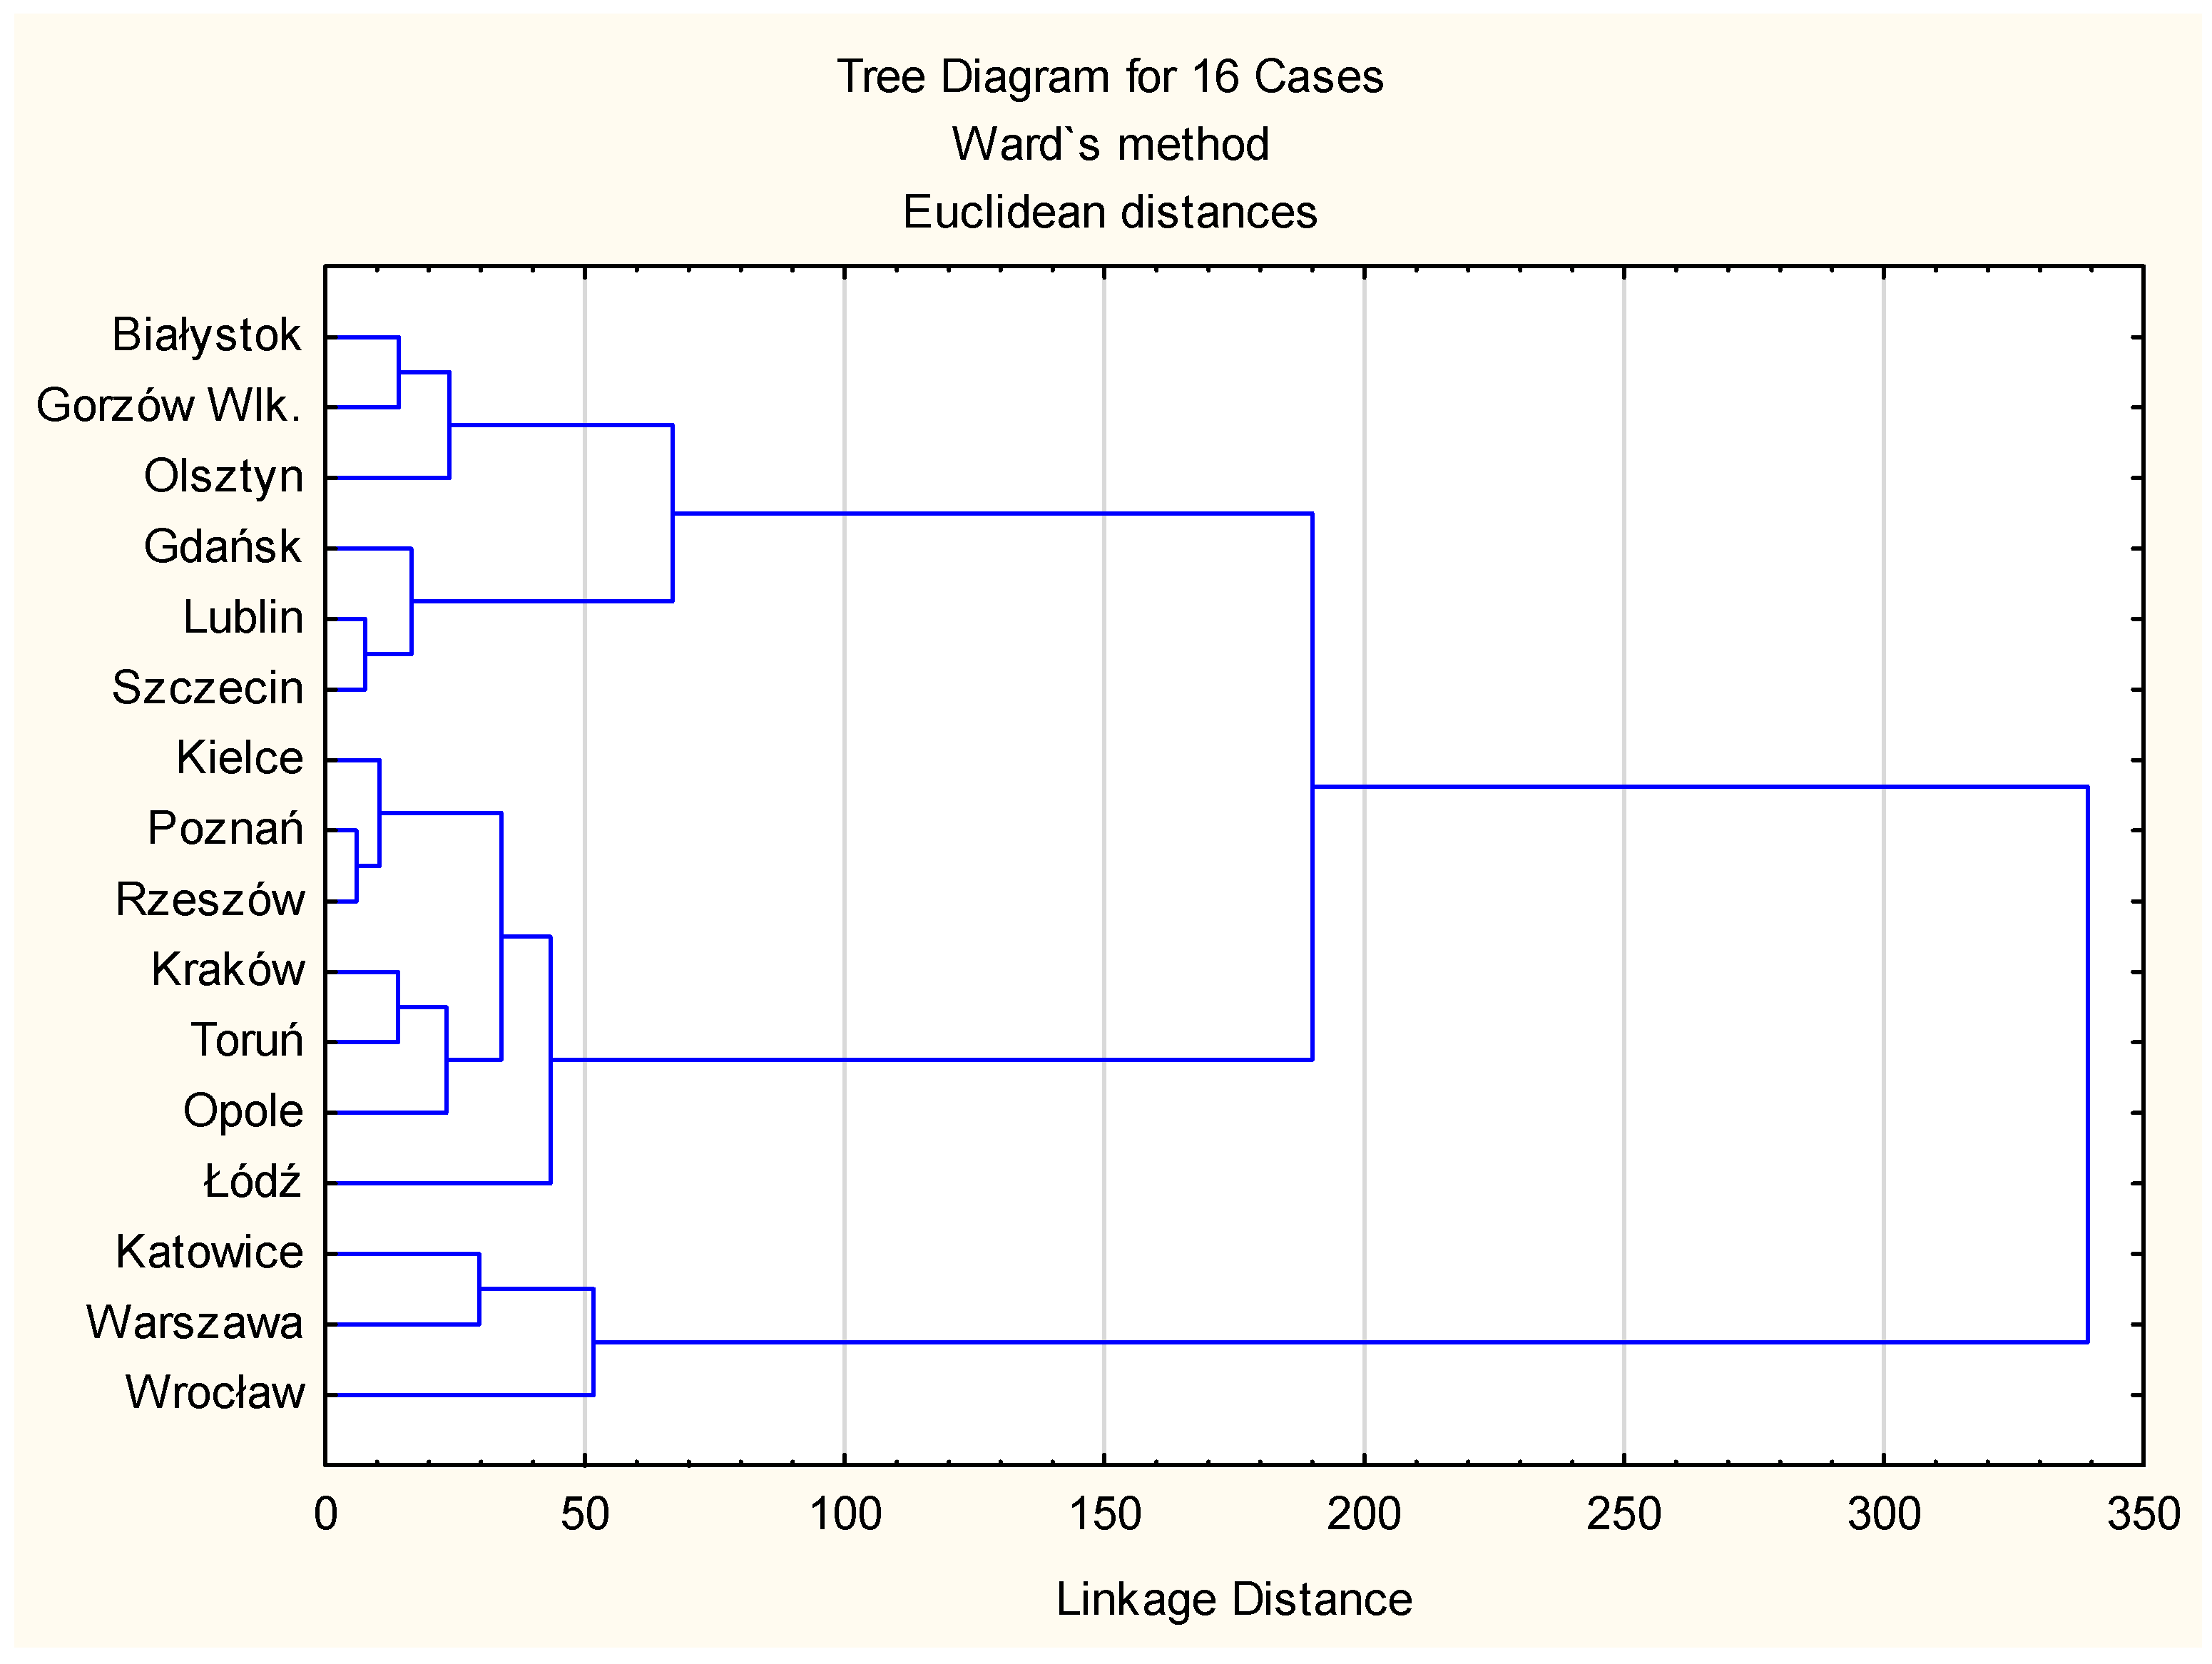
- In the third stage, a comparative analysis of the surveyed cities was carried out using the level of change in PM10 concentrations in 2010–2022 and the average annual rate of change, and the surveyed units were grouped using cluster analysis (unsupervised learning method).The clustering of the examined cities allowed for the selection of the cities with the worst and the best efficiency in terms of improving the quality of urban air. This, in turn, made it possible to develop more precise recommendations for each of the selected groups. Cluster analysis was used as an unsupervised machine learning method in the clustering process. It detects dependencies between objects only based on the data assigned to them. In the clustering process, the Euclidean distance was adopted and the Wards method was used.
- 4.
- In the fourth stage, a comparative analysis of the effectiveness of air quality improvements during and after the COVID-19 pandemic was conducted (this analysis was based on the calculation and comparison of the percentage range of PM10 reduction in 2010–2022).
- ○
- 2010—the start of EU air protection standards;
- ○
- 2015—the first 5 years of EU air protection standards providing a medium-term perspective for assessing the effectiveness of air quality improvements;
- ○
- 2020—the next 5 years of EU air protection standards providing a long-term perspective for assessing the effectiveness of air quality improvements, and additionally the opportunity to assess the impact of the COVID-19 pandemic on PM10 concentration levels;
- ○
- 2022—date to compare the sustainability of changes in PM10 concentrations during the pandemic period with the period of normal economic operation.
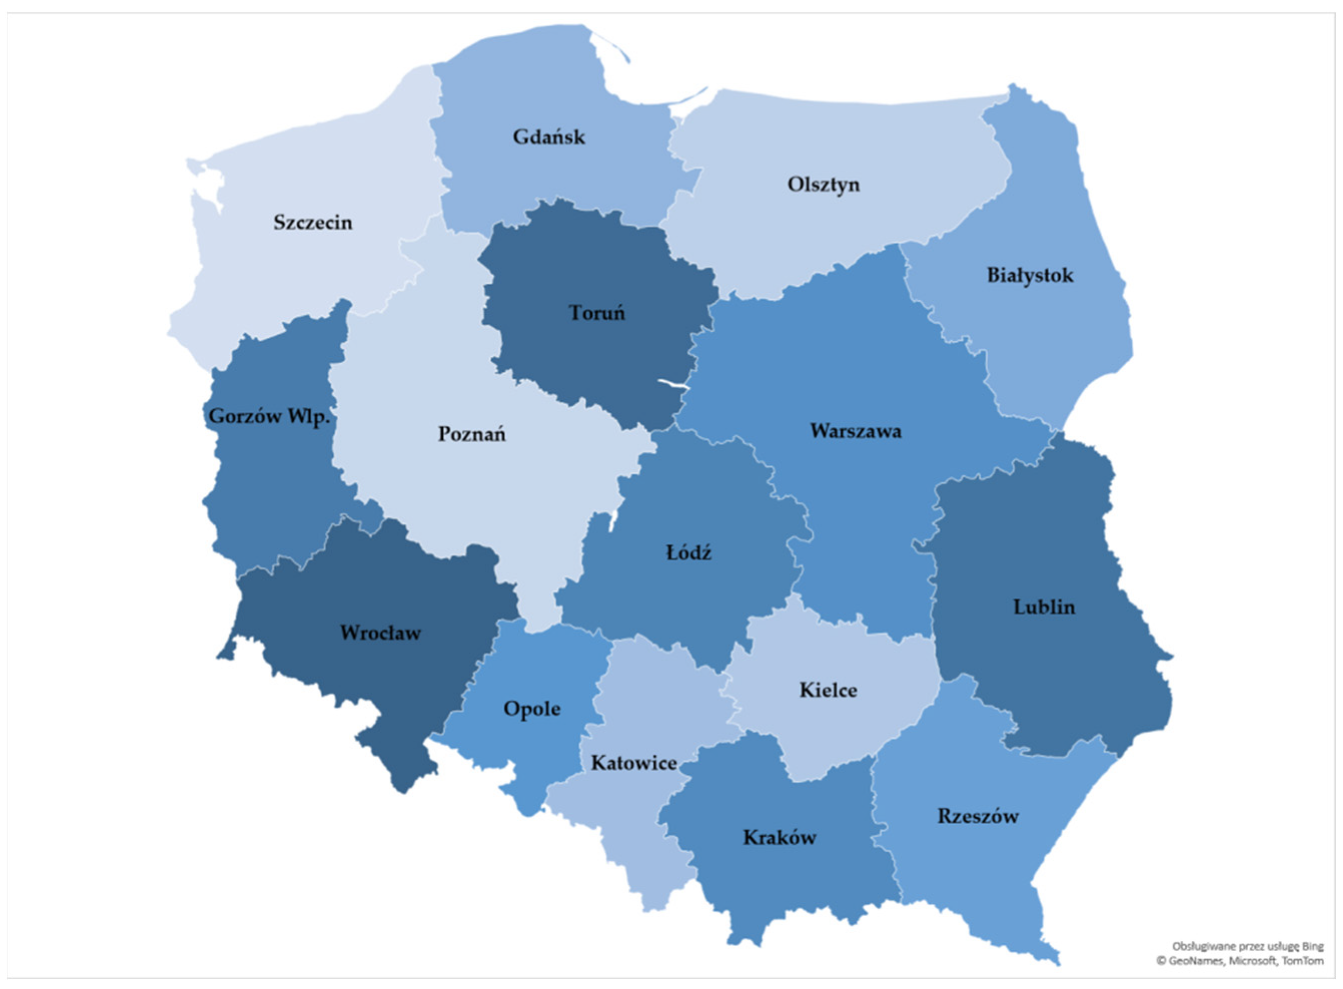
3.2. Research Sample Characteristics
4. Results
4.1. Assessing the Effectiveness of Air Quality Improvement
- P90 percentile indicating up to which limit 90% of daily PM10 concentration measurements were in;
- The maximum values of daily PM10 concentrations;
- The number of days on which PM10 concentrations exceeded the daily average value.
4.2. Benchmarking the Effectiveness of Urban Air Quality Improvements
- Białystok, Gorzów Wlk., Olsztyn—these are cities with low initial PM10 concentrations and a low number of days in which PM10 concentrations exceeded the daily average value; therefore, they are characterized by a low value of changes in total PM10 concentrations (in 2010–2020) and a low average annual rate of change in this parameter;
- Gdańsk, Lublin, Szczecin, Kielce, Poznań, Rzeszów, Szczecin, Kraków, Toruń—these are cities with average baseline parameters and average effectiveness in terms of total and average annual PM10 reduction;
- Opole, Łódź, Katowice—these are cities with fairly high initial PM10 concentrations and a small number of days when PM10 concentrations exceeded the average daily value, which have achieved good—though not the highest—results in terms of improving air quality;
- Warsaw, Wrocław—these are the cities with the highest baseline PM10 levels and the largest range of PM10 reductions over time, both overall and on an annual average basis.
5. Discussion
- Conduct air quality monitoring and keep residents informed of the results, which, according to Borbet et al.’s (2018) [74] findings, can activate residents and positively influence the effectiveness of air quality improvements, and perhaps offset the lack of public involvement in environmental and climate protection reported by Kronenberg et al. (2020) [53];
6. Conclusions
- In 2020 to 2022, all of the cities surveyed on an annual basis met the EU standard for permissible PM10 air concentrations of 20 µg/m3; in addition, 5 of the 16 cities met the more stringent WHO standard of 40 µg/m3 during this period;
- The above conclusion is also confirmed by favorable changes in: the P90 percentile indicating up to what limit 90% of daily PM10 concentration measurements were in, the maximum value of daily PM10 concentrations, and the number of days on which PM10 concentrations exceeded the average daily value;
- The leaders in terms of the effectiveness of PM10 reduction are Warsaw and Wrocław—the Polish cities most often mentioned in international rankings as smart cities, which illustrates their sustainability efforts and ability to effectively care for environmental and climate quality;
- After the COVID-19 pandemic (in 2022), most of the studied cities managed to maintain or improve air quality in the context of PM10 concentrations, which implies the sustainability of the studied environmental results;
- The sustainability of the environmental results after the COVID-19 pandemic is more broadly related to the EU PM10 standard, and less to the number of days on which PM10 concentrations exceeded the daily average value.
- (1)
- Closing the research gap in the long-term evaluation of the effectiveness of air quality improvements in cities aspiring to be smart and located in developing or emerging economies;
- (2)
- A cognitive contribution to the environmental research stream on smart city development (gaining knowledge on the effectiveness of cities’ actions to improve air quality);
- (3)
- The onducting of an analysis of the impact of the COVID-19 pandemic on air quality in Polish provincial cities.
Funding
Informed Consent Statement
Data Availability Statement
Conflicts of Interest
References
- Albino, V.; Berardi, U.; Dangelico, R.M. Smart cities: Definitions, dimensions, performance, and initiatives. J. Urban Technol. 2015, 22, 3–21. [Google Scholar] [CrossRef]
- Bokhari, S.A.A.; Myeong, S. Artificial Intelligence-Based Technological-Oriented Knowledge Management, Innovation, and E-Service Delivery in Smart Cities: Moderating Role of E-Governance. Appl. Sci. 2022, 12, 8732. [Google Scholar] [CrossRef]
- Saadah, M. Artificial Intelligence for Smart Governance; towards Jambi Smart City. IOP Conf. Ser. Earth Environ. Sci. 2021, 717, 012030. [Google Scholar] [CrossRef]
- Vershinin, Y.A.; Pashenko, F.; Olaverri-Monreal, C. Technologies for Smart Cities; Springer: Cham, Switzerland, 2023. [Google Scholar]
- Tripathi, S.L.; Ganguli, S.; Kumar, A.; Magradze, T. Intelligent Green Technologies for Sustainable Cities; Scrivenger Publishing Wiley: New York, NY, USA, 2022. [Google Scholar]
- Barrionuevo, J.M.; Berrone, P.; Ricart, J.E. Smart Cities, Sustainable Progress. IESE Insight 2012, 14, 50–57. [Google Scholar] [CrossRef]
- Bibri, S.E.; Krogstie, J. Smart sustainable cities of the future: An extensive interdisciplinary literature review. Sustain. Cities Soc. 2017, 31, 183–212. [Google Scholar] [CrossRef]
- McFarlane, C.; Söderström, O. On alternative smart cities: From a technology-intensive to a knowledge-intensive smart urbanism. City 2017, 21, 312–328. [Google Scholar] [CrossRef]
- March, H.; Ribera-Fumaz, R. Smart contradictions: The politics of making Barcelona a Self-sufficient city. Eur. Urban Reg. Stud. 2016, 23, 816–830. [Google Scholar] [CrossRef]
- Sharifi, A. A critical review of selected smart city assessment tools and indicator sets. J. Clean. Prod. 2019, 233, 1269–1283. [Google Scholar] [CrossRef]
- Townsend, A.M. Smart Cities: Big Data, Civic Hackers, and the Quest for a New Utopia; W.W. Norton & Company: Berlin, Germany, 2015. [Google Scholar]
- Klimovský, D.; Pinterič, U.; Šaparnienė, D. Human Limitations to Introduction of Smart Cities: Comparative Analysis from Two CEE Cities. Transylv. Rev. Adm. Sci. 2016, 47, 80–96. [Google Scholar]
- Kolotouchkina, O.; Barroso, C.L.; Sánchez, J.L.M. Smart cities, the digital divide, and people with disabilities. Cities 2022, 123, 103613. [Google Scholar] [CrossRef]
- Reuter, T.K. Human rights and the city: Including marginalized communities in urban development and smart cities. J. Hum. Rights 2019, 18, 382–402. [Google Scholar] [CrossRef]
- Natanian, J.; Auer, T. Beyond nearly zero energy urban design: A holistic microclimatic energy and environmental quality evaluation workflow. Sustain. Cities Soc. 2020, 56, 102094. [Google Scholar] [CrossRef]
- Gherbi, M. Problematic of Environment Protection in Algerian Cities. Energy Procedia 2012, 18, 265–275. [Google Scholar] [CrossRef]
- Lin, J.; Long, C.; Yi, C. Has central environmental protection inspection improved air quality? Evidence from 291 Chinese cities. Environ. Impact Assess. Rev. 2021, 90, 106621. [Google Scholar] [CrossRef]
- Wang, Q.; Zhao, Z.; Shen, N.; Liu, T. Have Chinese cities achieved the win–win between environmental protection and economic development? From the perspective of environmental efficiency. Ecol. Indic. 2015, 51, 151–158. [Google Scholar] [CrossRef]
- Mesjasz-Lech, A. Municipal Urban Waste Management—Challenges for Polish Cities in an Era of Circular Resource Management. Resources 2021, 10, 55. [Google Scholar] [CrossRef]
- Baltac, V. Smart Cities—A View of Societal Aspects. Smart Cities 2019, 2, 538–548. [Google Scholar] [CrossRef]
- Freestone, R.; Favaro, P. The social sustainability of smart cities: A conceptual framework. City Cult. Soc. 2022, 29, 100460. [Google Scholar] [CrossRef]
- Capdevila, I.; Zarlenga, M. Smart city or smart citizens? The Barcelona Case. J. Strategy Manag. 2015, 8, 266–282. [Google Scholar] [CrossRef]
- El Hendy, M.; Atalla, S.; Miniaoui, S.; Daradkeh, M.; Mansoor, W.; Bin Hashim, K.F. Hybrid Approach for Developing Strategic ICT Framework for Smart Cities—A Case Study of Dubai’s Toll Gates (Salik). Smart Cities 2022, 5, 1554–1573. [Google Scholar] [CrossRef]
- Alshuwaikhat, H.M.; Adenle, Y.A.; Almuhaidib, T. A Lifecycle-Based Smart Sustainable City Strategic Framework for Realizing Smart and Sustainability Initiatives in Riyadh City. Sustainability 2022, 14, 8240. [Google Scholar] [CrossRef]
- Xiong, N.; Zang, H.; Lu, H.; Yu, R.; Wang, J.; Feng, Z. Performance Analysis of Smart City Governance: Dynamic Impact of Beijing 12345 Hotline on Urban Public Problems. Sustainability 2022, 14, 9986. [Google Scholar] [CrossRef]
- Jonek-Kowalska, I.; Wolniak, R. The influence of local economic conditions on start-ups and local open innovation system. J. Open Innov. Technol. Mark. Complex. 2021, 7, 110. [Google Scholar] [CrossRef]
- Jonek-Kowalska, I.; Wolniak, R. Economic opportunities for creating smart cities in Poland. Does wealth matter? Cities 2021, 114, 103222. [Google Scholar] [CrossRef]
- Jonek-Kowalska, I.; Wolniak, R. Sharing economies’ initiatives in municipal authorities’ perspective: Research evidence from Poland in the context of smart cities’ development. Sustainability 2022, 14, 2064. [Google Scholar] [CrossRef]
- Huynh, C.M.; Nguyen, T.L. Shadow economy and income inequality: New empirical evidence from Asian developing countries. J. Asia Pac. Econ. 2020, 25, 175–192. [Google Scholar] [CrossRef]
- Nguyen, C.V. Problems of developing and transition economies. Int. Trade J. 2019, 33, 80–94. [Google Scholar] [CrossRef]
- Ukil, M.I. Factors Determining Social Entrepreneurial Intention in a Developing Economy. J. Soc. Entrep. 2022, 1–22. [Google Scholar] [CrossRef]
- Buła, R.; Foltyn-Zarychta, M. Declining Discount Rates for Energy Policy Investments in CEE EU Member Countries. Energies 2023, 16, 321. [Google Scholar] [CrossRef]
- Filipiak, B.Z.; Wyszkowska, D. Determinants of Reducing Greenhouse Gas Emissions in European Union Countries. Energies 2022, 15, 9561. [Google Scholar] [CrossRef]
- Costantini, V.; Morando, V.; Olk, C.; Tausch, L. Fuelling the Fire: Rethinking European Policy in Times of Energy and Climate Crises. Energies 2022, 15, 7781. [Google Scholar] [CrossRef]
- Famulska, T.; Kaczmarzyk, J.; Grząba-Włoszek, M. Environmental Taxes in the Member States of the European Union—Trends in Energy Taxes. Energies 2022, 15, 8718. [Google Scholar] [CrossRef]
- Tudor, C.; Sova, R. EU Net-Zero Policy Achievement Assessment in Selected Members through Automated Forecasting Algorithms. ISPRS Int. J. Geo-Inf. 2022, 11, 232. [Google Scholar] [CrossRef]
- Igliński, B.; Pietrzak, M.B.; Kiełkowska, U.; Skrzatek, M.; Gajdos, A.; Zyadin, A.; Natarajan, K. How to Meet the Green Deal Objectives—Is It Possible to Obtain 100% RES at the Regional Level in the EU? Energies 2022, 15, 2296. [Google Scholar] [CrossRef]
- Cezarino, L.O.; Liboni, L.B.; Oliveira Stefanelli, N.; Oliveira, B.G.; Stocco, L.C. Diving into emerging economies bottleneck: Industry 4.0 and implications for circular economy. Manag. Decis. 2021, 59, 1841–1862. [Google Scholar] [CrossRef]
- Wang, H.; Wei, W. Coordinating technological progress and environmental regulation in CO2 mitigation: The optimal levels for OECD countries & emerging economies. Energy Econ. 2020, 87, 104510. [Google Scholar] [CrossRef]
- Almeshqab, F.; Ustun, T.S. Lessons learned from rural electrification initiatives in developing countries: Insights for technical, social, financial and public policy aspects. Renew. Sustain. Energy Rev. 2019, 102, 35–53. [Google Scholar] [CrossRef]
- Senadheera, S.S.; Gregory, R.; Rinklebe, J.; Farrukh, M.; Rhee, J.H.; Ok, Y.S.; You, S. The development of research on environmental, social, and governance (ESG): A bibliometric analysis. Sustain. Environ. 2022, 8, 2125869. [Google Scholar] [CrossRef]
- Moberg, K.R. Environmentally friendly urban development: Changes in decision-makers’ attitudes, problem perceptions and policy preferences over three decades. J. Environ. Plan. Manag. 2022, 1–23. [Google Scholar] [CrossRef]
- Rau, H.; Edmondson, R. Responding to the environmental crisis: Culture, power and possibilities of change. Eur. J. Cult. Political Sociol. 2022, 9, 259–272. [Google Scholar] [CrossRef]
- Cantarero, M.M.V. Of renewable energy, energy democracy, and sustainable development: A roadmap to accelerate the energy transition in developing countries. Energy Res. Soc. Sci. 2020, 70, 101716. [Google Scholar] [CrossRef]
- Neofytou, H.; Nikas, A.; Doukas, H. Sustainable energy transition readiness: A multicriteria assessment index. Renew. Sustain. Energy Rev. 2020, 131, 109988. [Google Scholar] [CrossRef]
- Kim, J.E. Sustainable energy transition in developing countries: The role of energy aid donors. Clim. Policy 2019, 19, 1–16. [Google Scholar] [CrossRef]
- Carley, S.; Konisky, D.M. The justice and equity implications of the clean energy transition. Nat. Energy 2020, 5, 569–577. [Google Scholar] [CrossRef]
- McCauley, D.; Ramasar, V.; Heffron, J.R.; Sovacool, B.K.; Mebratu, D.; Mundaca, L. Energy justice in the transition to low carbon energy systems: Exploring key themes in interdisciplinary research. Appl. Energy 2019, 233–234, 916–921. [Google Scholar] [CrossRef]
- Astuti, S.P.; Day, R.; Emery, S.B. A successful fuel transition? Regulatory instruments, markets, and social acceptance in the adoption of modern LPG cooking devices in Indonesia. Energy Res. Soc. Sci. 2019, 58, 101248. [Google Scholar] [CrossRef]
- Cepeliauskaite, G.; Keppner, B.; Simkute, Z.; Stasiskiene, Z.; Leuser, L.; Kalnina, I.; Kotovica, N.; Andiņš, J.; Muiste, M. Smart-Mobility Services for Climate Mitigation in Urban Areas: Case Studies of Baltic Countries and Germany. Sustainability 2021, 13, 4127. [Google Scholar] [CrossRef]
- Kopacova, H. Reflexion of citizens’ needs in city strategies: The case study of selected cities of Visegrad group countries. Cities 2019, 84, 159–171. [Google Scholar] [CrossRef]
- Erős, N.; Török, Z.; Hossu, C.-A.; Réti, K.O.; Maloș, C.; Kecskés, P.; Morariu, S.-D.; Benedek, J.; Hartel, T. Assessing the sustainability related concepts of urban development plans in Eastern Europe: A case study of Romania. Sustain. Cities Soc. 2022, 85, 104070. [Google Scholar] [CrossRef]
- Kronenberg, J.; Haase, A.; Łszkiewicz, E.; Antal, A.; Baravikova, A.; Biernacka, M.; Dushkova, D.; Filčak, R.; Haase, D.; Ignatieva, M.; et al. Environmental justice in the context of urban green space availability, accessibility, and attractiveness in postsocialist cities. Cities 2020, 106, 102862. [Google Scholar] [CrossRef]
- Kalbarczyk, E.; Kalbarczyk, R. Credibility assessment of municipal climate change adaptation plans using the ex-ante method: A case study of Poland. Sustain. Cities Soc. 2022, 87, 104242. [Google Scholar] [CrossRef]
- Lewandowska, A.; Szymańska, D. Ecologisation of Polish cities in the light of selected parameters of sustainable development. Sustain. Cities Soc. 2021, 64, 102538. [Google Scholar] [CrossRef]
- Serbanica, C.; Constantin, D.-L. Sustainable cities in central and eastern European countries. Moving towards smart specialization. Habitat Int. 2017, 68, 55–63. [Google Scholar] [CrossRef]
- Park, J.; Yoo, S. Evolution of the smart city: Three extensions to governance, sustainability, and decent urbanisation from an ICT-based urban solution. Int. J. Urban Sci. 2023, 27, 10–28. [Google Scholar] [CrossRef]
- Trencher, G. Towards the smart city 2.0: Empirical evidence of using smartness as a tool for tackling social challenges. Technol. Forecast. Soc. Change 2019, 142, 117–128. [Google Scholar] [CrossRef]
- Li, Y.; Zhang, J.; Sailor, D.J.; Ban-Weiss, G.A. Effects of urbanization on regional meteorology and air quality in Southern California. Atmos. Chem. Phys. 2019, 19, 4439–4457. [Google Scholar] [CrossRef]
- Qiu, G.; Song, R.; He, S. The aggravation of urban air quality deterioration due to urbanization, transportation and economic development—Panel models with marginal effect analyses across China. Sci. Total Environ. 2019, 651, 1114–1125. [Google Scholar] [CrossRef]
- Shi, P.; Bai, X.; Kong, F.; Fang, J.; Gong, D.; Zhou, T.; Guo, Y.; Liu, Y.; Dong, W.; Wei, Z. Urbanization and air quality as major drivers of altered spatiotemporal patterns of heavy rainfall in China. Landscape Ecol. 2017, 32, 1723–1738. [Google Scholar] [CrossRef]
- Lin, B.; Zhu, J. Changes in urban air quality during urbanization in China. J. Clean. Prod. 2018, 188, 312–321. [Google Scholar] [CrossRef]
- Anser, M.K.; Alharthi, M.; Aziz, B.; Wasim, S. Impact of urbanization, economic growth, and population size on residential carbon emissions in the SAARC countries. Clean Technol. Environ. Policy 2020, 22, 923–936. [Google Scholar] [CrossRef]
- Anwar, A.; Younis, M.; Ullah, I. Impact of Urbanization and Economic Growth on CO2 Emission: A Case of Far East Asian Countries. Int. J. Environ. Res. Public Health 2020, 17, 2531. [Google Scholar] [CrossRef] [PubMed]
- Yao, J.; Xu, P.; Huang, Z. Impact of urbanization on ecological efficiency in China: An empirical analysis based on provincial panel data. Ecol. Indic. 2021, 129, 107827. [Google Scholar] [CrossRef]
- Karagulian, F.; Barbiere, M.; Kotsev, A.; Spinelle, L.; Gerboles, M.; Lagler, F.; Redon, N.; Crunaire, S.; Borowiak, A. Review of the Performance of Low-Cost Sensors for Air Quality Monitoring. Atmosphere 2019, 10, 506. [Google Scholar] [CrossRef]
- Ameer, S.; Shah, M.A.; Khan, A.B.; Song, H.; Maple, C.; Islam, S.U.; Asghar, M.N. Comparative Analysis of Machine Learning Techniques for Predicting Air Quality in Smart Cities. IEEE Access 2019, 7, 128325–128338. [Google Scholar] [CrossRef]
- Dadhich, P.A.; Goyal, R.; Dadhich, P.N. Assessment of spatio-temporal variations in air quality of Jaipur city, Rajasthan, India. Egypt. J. Remote Sens. Space Sci. 2018, 21, 173–181. [Google Scholar] [CrossRef]
- Johnston, S.J.; Basford, P.J.; Bulot, F.M.J.; Apetroaie-Cristea, M.; Easton, N.H.C.; Davenport, C.; Foster, G.L.; Loxham, M.; Morris, A.K.R.; Cox, S.J. City Scale Particulate Matter Monitoring Using LoRaWAN Based Air Quality IoT Devices. Sensors 2019, 19, 209. [Google Scholar] [CrossRef] [PubMed]
- Molina, L.T.; Velasco, E.; Retama, A.; Zavala, M. Experience from Integrated Air Quality Management in the Mexico City Metropolitan Area and Singapore. Atmosphere 2019, 10, 512. [Google Scholar] [CrossRef]
- Pisoni, E.; Christidis, P.; Thunis, P.; Trombetti, M. Evaluating the impact of “Sustainable Urban Mobility Plans” on urban background air quality. J. Environ. Manag. 2019, 231, 249–255. [Google Scholar] [CrossRef]
- Rodriguez-Rey, D.; Guevara, M.; Casanovas, J.; Armengol, J.M.; Benavides, J.; Soret, A.; Jorba, O.; Tena, C.; García-Pando, C.P. To what extent the traffic restriction policies applied in Barcelona city can improve its air quality? Sci. Total Environ. 2022, 807, 150743. [Google Scholar] [CrossRef]
- Li, S.; Liu, Y.; Purevjav, A.O.; Yang, L. Does subway expansion improve air quality? J. Environ. Econ. Manag. 2019, 96, 213–235. [Google Scholar] [CrossRef]
- Borbet, T.C.; Gladson, L.A.; Cromar, K.R. Assessing air quality index awareness and use in Mexico City. BMC Public Health 2018, 18, 538. [Google Scholar] [CrossRef] [PubMed]
- Rodríguez-Urrego, D.; Rodríguez-Urrego, L. Air quality during the COVID-19: PM2.5 analysis in the 50 most polluted capital cities in the world. Environ. Pollut. 2020, 266, 115042. [Google Scholar] [CrossRef] [PubMed]
- Adam, M.G.; Tran, P.T.M.; Balasubramanian, R. Air quality changes in cities during the COVID-19 lockdown: A critical review. Atmos. Res. 2021, 264, 105823. [Google Scholar] [CrossRef] [PubMed]
- Zangari, S.; Hill, D.T.; Charette, A.T.; Mirowsky, J.E. Air quality changes in New York City during the COVID-19 pandemic. Sci. Total Environ. 2020, 742, 140496. [Google Scholar] [CrossRef]
- Kumari, P.; Toshniwal, D. Impact of lockdown on air quality over major cities across the globe during COVID-19 pandemic. Urban Clim. 2020, 34, 100719. [Google Scholar] [CrossRef]
- Danek, T.; Zaręba, M. The Use of Public Data from Low-Cost Sensors for the Geospatial Analysis of Air Pollution from Solid Fuel Heating during the COVID-19 Pandemic Spring Period in Krakow, Poland. Sensors 2021, 21, 5208. [Google Scholar] [CrossRef]
- Zaręba, M.; Danek, T. Analysis of Air Pollution Migration during COVID-19 Lockdown in Krakow, Poland. Aerosol Air Qual. Res. 2021, 22, 210275. [Google Scholar] [CrossRef]
- Badyda, A.; Brzeziński, A.; Dybicz, T.; Jesionkiewicz-Niedzińska, K.; Olszewski, P.; Osińska, B.; Szagała, P.; Mucha, D. Impact of COVID-19 Mobility Changes on Air Quality in Warsaw. Appl. Sci. 2022, 12, 7372. [Google Scholar] [CrossRef]
- Filonchyk, M.; Hurynovich, V.; Yan, H. Impact of Covid-19 lockdown on air quality in the Poland, Eastern Europe. Environ. Res. 2021, 198, 110454. [Google Scholar] [CrossRef]
- Available online: https://www.gios.gov.pl/pl/aktualnosci/737-podsumowanie-monitoringu-jakosci-powietrza-w-polsce (accessed on 10 January 2023).
- Chief Inspectorate of Environmental Protection. Available online: https://www.gios.gov.pl/pl/stan-srodowiska/monitoring-jakosci-powietrza (accessed on 10 January 2023).


| City | Inhabitants | Surface | Population Density |
|---|---|---|---|
| Białystok | 296,000 | 102 km2 | 2902 persons/km² |
| Gorzów Wlk. | 120,087 | 86 km2 | 1400 persons/km² |
| Gdańsk | 471,000 | 263 km2 | 1787 persons/km² |
| Katowice | 292,000 | 165 km2 | 1756 persons/km² |
| Kielce | 192,500 | 110 km2 | 1686 persons/km² |
| Kraków | 782,000 | 327 km2 | 2450 persons/km² |
| Lublin | 338,000 | 147 km2 | 2270 persons/km² |
| Łódź | 670,42 | 293 km2 | 2287 persons/km² |
| Olsztyn | 170,622 | 83 km2 | 1932 persons/km² |
| Opole | 127,839 | 149 km2 | 858 persons/km² |
| Poznań | 532,000 | 262 km2 | 2031 persons/km² |
| Rzeszów | 198,609 | 129 km2 | 1539 persons/km² |
| Szczecin | 396,472 | 301 km2 | 1319 persons/km² |
| Toruń | 197,812 | 116 km2 | 1511 persons/km² |
| Warsaw | 517,000 | 517 km2 | 3466 persons/km² |
| Wrocław | 643,000 | 293 km2 | 2298 persons/km² |
| City | Years | |||
|---|---|---|---|---|
| 2010 | 2015 | 2020 | 2022 | |
| Białystok | 27 | 25 | 19 | 17 |
| Gdańsk | 30 | 36 | 19 | 17 |
| Gorzów Wlk. | 26 | 19 | 21 | 20 |
| Katowice | 52 | 46 | 34 | 31 |
| Kielce | 42 | 37 | 28 | 26 |
| Kraków | 48 | 52 | 30 | 29 |
| Lublin | 32 | 29 | 21 | 19 |
| Łódź | 61 | 42 | 31 | 32 |
| Olsztyn | 22 | 25 | 18 | 19 |
| Opole | 32 | 31 | 25 | 22 |
| Poznań | 38 | 27 | 20 | 21 |
| Rzeszów | 40 | 30 | 20 | 21 |
| Szczecin | 34 | 26 | 25 | 21 |
| Toruń | 43 | 29 | 23 | 21 |
| Warsaw | 56 | 33 | 22 | 22 |
| Wrocław | 62 | 28 | 23 | 24 |
 —compliance with the WHO requirements;
  —non-compliance with the EU requirements. Source: [84].
| Cities | Parameters | |
|---|---|---|
| Reduction in Average PM10 Concentration in 2022 Compared to 2010 | The Average Annual Rate of Change in PM10 Concentration | |
| Białystok | 37.04% | 3.50% |
| Gdańsk | 43.33% | 4.28% |
| Gorzów Wlk. | 23.08% | 2.00% |
| Katowice | 40.38% | 3.90% |
| Kielce | 38.10% | 3.62% |
| Kraków | 39.58% | 3.80% |
| Lublin | 40.63% | 3.93% |
| Łódź | 47.54% | 4.84% |
| Olsztyn | 13.64% | 1.12% |
| Opole | 31.25% | 2.84% |
| Poznań | 44.74% | 4.46% |
| Rzeszów | 47.50% | 4.84% |
| Szczecin | 38.24% | 3.64% |
| Toruń | 51.16% | 5.36% |
| Warsaw | 60.71% | 6.93% |
| Wrocław | 61.29% | 7.04% |
| City | Change Level | |||
|---|---|---|---|---|
| PM10 Average Concentration (Reduction) | Number of Days on Which PM10 Concentrations Exceeded the Daily Average Value (Reduction) | |||
| 2020/2010 | 2022/2020 | 2020/2010 | 2022/2010 | |
| Białystok | 29.63% | 37.04% | 70.83% | 70.83% |
| Gdańsk | 36.67% | 43.33% | 78.95% | 55.26% |
| Gorzów Wlk. | 19.23% | 23.08% | 73.08% | 69.23% |
| Katowice | 34.62% | 40.38% | 56.59% | 69.77% |
| Kielce | 33.33% | 38.10% | 63.53% | 74.12% |
| Kraków | 37.50% | 39.58% | 27.69% | 43.08% |
| Lublin | 34.38% | 40.63% | 81.25% | 83.33% |
| Łódź | 49.18% | 47.54% | 60.20% | 56.12% |
| Olsztyn | 18.18% | 13.64% | 61.54% | 30.77% |
| Opole | 21.88% | 31.25% | 65.63% | 100.00% |
| Poznań | 47.37% | 44.74% | 87.06% | 88.24% |
| Rzeszów | 50.00% | 47.50% | 85.00% | 81.25% |
| Szczecin | 26.47% | 38.24% | 83.64% | 100.00% |
| Toruń | 46.51% | 51.16% | 85.92% | 76.06% |
| Warsaw | 60.71% | 60.71% | 97.33% | 85.33% |
| Wrocław | 62.90% | 61.29% | 89.07% | 91.26% |
 —better performance during the COVID-19 pandemic.
Disclaimer/Publisher’s Note: The statements, opinions and data contained in all publications are solely those of the individual author(s) and contributor(s) and not of MDPI and/or the editor(s). MDPI and/or the editor(s) disclaim responsibility for any injury to people or property resulting from any ideas, methods, instructions or products referred to in the content. |
© 2023 by the author. Licensee MDPI, Basel, Switzerland. This article is an open access article distributed under the terms and conditions of the Creative Commons Attribution (CC BY) license (https://creativecommons.org/licenses/by/4.0/).
Share and Cite
Jonek-Kowalska, I. Assessing the Effectiveness of Air Quality Improvements in Polish Cities Aspiring to Be Sustainably Smart. Smart Cities 2023, 6, 510-530. https://doi.org/10.3390/smartcities6010024
Jonek-Kowalska I. Assessing the Effectiveness of Air Quality Improvements in Polish Cities Aspiring to Be Sustainably Smart. Smart Cities. 2023; 6(1):510-530. https://doi.org/10.3390/smartcities6010024
Chicago/Turabian StyleJonek-Kowalska, Izabela. 2023. "Assessing the Effectiveness of Air Quality Improvements in Polish Cities Aspiring to Be Sustainably Smart" Smart Cities 6, no. 1: 510-530. https://doi.org/10.3390/smartcities6010024