Article

Semantic Reasoning for Geolocalized Assessment of Crime Risk in Smart Cities

by
Rosario Minardi
1,
Maria Luisa Villani
2 and
Antonio De Nicola
2,*
1
Department of Engineering Science, Guglielmo Marconi University, Via Plinio 44, 00198 Rome, Italy
2
ENEA-Centro Ricerche Casaccia, Via Anguillarese 301, 00123 Rome, Italy
*
Author to whom correspondence should be addressed.
Smart Cities 2023, 6(1), 179-195; https://doi.org/10.3390/smartcities6010010
Submission received: 14 December 2022 / Revised: 27 December 2022 / Accepted: 29 December 2022 / Published: 5 January 2023
(This article belongs to the Topic Peaceful and Secure Cities)

Abstract

:
The increasing number of crimes affecting urban areas requires the adoption of countermeasures to tackle this problem from different perspectives, including the technological one. Currently, there are many research initiatives with the goal of applying machine or deep learning techniques leveraging historical data to predict the occurrence of crime incidents. Conversely, there is a lack of tools aiming at crime risk assessment, in particular, by supporting the police in conceiving what could be the crime incidents affecting a given city area. To this purpose, we propose the Crime Prevention System, a modular software application for qualitative crime risk assessment. This consists of an ontology of crime risk, a module to retrieve contextual data from OpenStreetMap, semantics reasoning functionalities, and a GIS interface. We discuss how this system can be used through a case study related to the Italian city of Syracuse.

1. Introduction

Global risks, such as wars, climate change, and steadily rising energy prices, are expected to have a huge socioeconomic impact on the society that could lead to increased crimes in urban areas. Public security is also hindered by an ever-changing complex city landscape consisting of interconnected smart services and points of interest (POIs), which is difficult to deal with. Currently, predicting criminal events in a urban area is left to the expertise of urban planners and police forces, but there is a lack of automatic support for this [1].
Indeed, there is a need to move from reactive to proactive policing. To that end, there is an increase of research initiatives that, by leveraging novel machine and deep learning techniques and historical data, aim at crime prevention in urban areas. Even if the results are promising, these approaches do not allow to figure out criminal events that did not happen in the past. In this regard, there is a need for a cognitive approach to imagine what criminal events are plausible and can occur at a given site. Indeed, the objective of this paper is to create a novel automatic tool that supports security operators in crime risk assessment activities in smart cities. Furthermore, the research focuses on methods for knowledge representation and usage to identify potential crime situations depending on the specific characteristics of an urban area.
To this aim, we present the Crime Prevention System, a modular software application to predict the occurrence of crime incidents. This system is organized into three modules: a knowledge base, to gather and organize relevant data and knowledge for crime risk assessment; a module for qualitative risk assessment that leverages semantic reasoning and computational creativity [2] to infer plausible crime risks; and a GIS (Geographical Information System) interface for user interaction. The Crime Prevention System ingests data on the points of interest of cities from OpenStreetMap GIS (OpenStreetMap: https://www.openstreetmap.org/, accessed on 1 December 2022) and semantically enriches them by means of the TERMINUS Crime ontology, an ontology on criminal risk that was developed for this purpose. For the aim of qualitative risk assessment, crime risks are specified as risk mini-modes, i.e., fragments of conceptual models representing possible risks of sociotechnical systems [3].
Then, we present a case study related to a medium-sized city to show how the software system can be used for crime risk assessment in daily police work.
The rest of the paper is organized as follows. Section 2 presents the related work on information systems for crime prevention. Section 3 describes the architecture and the components of the Crime Prevention System. A case study related to the usage of the system for prevention of crime in a medium-sized city is presented in Section 4. Finally, Section 5 provides conclusions.

2. Related Work

Due to increasing urbanization, police forces need new instruments to fight crime and improve the security systems of cities. Examples of criminal activities are violence, civil complaints, intrusion, kidnapping, loitering, and throwing [4]. Intelligent video-based surveillance for early threat detection [5], analysis of historical data to elaborate crime risks [6], and usage of deep learning approaches for crime prediction are among the new techniques used to support prevention of criminal activities [7]. All of these techniques require a high level of accuracy and consistency of the collected data and knowledge, as well as some expertise in the usage of the new methods [4].
To the aim of data collection and management, Ahmed et al. [8] proposed a methodology for merging multiple state-wide crime datasets, including crime reports, incident reports, and court records. For data visualization, He et al. [9] focused on Police Geographic Information Systems (PGISs). In detail, they identified as open challenges the adoption of crime maps resulting from theoretical research and mature crime analysis and prediction technology.
Understanding patterns and trends from big volumes of data is attracting the interests of several scientists, such as Cheng et al. [10]. Catlett et al. [11] presented a predictive approach based on spatial analysis and autoregressive models to automatically forecast crime trends in urban areas, and it was experimented in the cities of Chicago and New York. With a similar goal but a different approach, Zhu et al. [12] studied crime distribution evolution by proposing a hierarchical spatiotemporal framework to model and analyze the dynamic community crime relationships. Pandey et al. [13] proposed a Bayesian spatiotemporal methodology to model crime with the goal of identifying the propensity for property crimes.
The increasing interest for machine learning with crime data is due to its ability to analyze voluminous and complex data [14]. Butt et al. [15] investigated the performance of two artificial intelligence techniques in identifying and predicting the highly-reported crime zones in an urban area. In detail, they used the hierarchical density-based spatial clustering of applications with noise (HDBSCAN) to detect areas with a higher risk of crime occurrence and the seasonal autoregressive integrated moving average (SARIMA) to predict the number of crime incidents based on spatial and temporal information. Similarly, Zhu et al. [16] developed a predictive model based on K-means clustering, signal decomposition technique, and neural networks for identifying areas with high crime rates and detecting crime trends. In [17], the author applied the naive Bayes classification algorithm to categorize crime into subgroups of categories with geographical and time aspects using news feeds, and the K-means method to identify crime hotspots. Liang et al. [18] proposed CrimeTensor, a framework aimed at predicting crime incidents via tensor learning with spatiotemporal consistency. In this framework, data are modeled as a tensor and CP decomposition is used to find the optimal solution of the objective function. Dong et al. [19] proposed a crime prediction model based on 2D convolution and long short-term memory neural network, which leverages the temporal and spatial correlations in the crime and other auxiliary data. Muthamizharasan et al. [20] used the CNN (convolutional neural network)-LSTM (long short-term memory) model to forecast the crime rate. Shukla et al. [21] used statistical and mathematical techniques, such as bivariate exploratory analysis, mean absolute error, median squared error, and root mean squared error, to identify crime patterns and forecast the probability of crimes. Brindha et al. [22] proposed to use gradient boost decision tree together with a Geographical Information System to forecast crime. Finally, Wei et al. [23] proposed a deep-learning-based framework called CrimeSTC to learn the intricate spatial–temporal–categorical correlations hidden inside the crime and big urban data and predict crime. Among the different techniques used, we cite convolutional neural network and gated recurrent units.
As in most of the above-mentioned works, we use a Geographic Information System for data management and visualization. However, for both objective and application logic, we propose a completely different approach. Indeed, most of the cited works focus on predicting the rate and time of the crime events. Instead, in this paper, we address the problem of conceiving the possible crime incidents that could pertain a given urban area. In particular, we focus on qualitative, rather than quantitative, risk assessment by using data from OpenStreetMap and knowledge entities from the TERMINUS Crime ontology to imagine possible risk situations.
Instead, ontology-based approaches have been proposed for crime modeling and analysis. Srinivasa and Thilagam proposed Crime Base, a system aimed at extracting and integrating crime-related text and image data from online newspapers by means of a rule-based approach. The extracted entities are correlated by using similarity measures. The system also includes an integrated view of these entities and their relations in the form of an OWL (Web Ontology Language) knowledge base. The system was tested with crime-related articles from popular Indian online newspapers [24]. De Oliveira Rodrigues et al. presented a conceptual model for the representation of crimes against property based on the UFO-B foundational ontology [25], which fits the Brazilian Criminal Code. The model aims at supporting some decision-making process, such as the agents behavior classification and the inference of punishments [26]. Abdul Jalil et al. developed an ontology model to represent the crime investigation information, which focuses on the crime event. Indeed, it includes concepts to represent the place and the time of the event and the modus operandi [27]. Kalemi et al. [28] presented the SMONT ontology covering data about crime, information obtained from online social networks and archives of police entities, and also related to people or events, which may be used by the authorities to solve crime cases. The authors also envisaged possible usages, such as intelligence gathering, reasoning over the data, smarter searches and comparisons, open data publication, and crime prevention process. Aliprandi et al. proposed CAPER, a platform for the prevention of organized crime that supports information sharing and multimodal analysis of open and closed information sources, mainly based on natural language processing and visual analytics technologies [29].
With respect to the existing ontology models above, TERMINUS-CRIME is explicitly targeted at crime risk models and, hence, it includes concepts to analyze vulnerabilities of city POIs. With respect to the existing semantics-based applications, the Crime Prevention System provides reasoning mechanisms for geolocalized crime risk assessment.

3. Crime Prevention System

The system for territorial security and crime prevention in smart cities, called Crime Prevention System, allows to identify risks related to sensitive targets in urban areas. To this aim, it leverages an established qualitative risk assessment methodology [3,30] based on a knowledge base, and enhanced by an interactive GIS (Geographical Information System) user interface. The knowledge base includes a dataset of georeferenced points of interest (POIs) situated in the area under risk assessment, the TERMINUS Crime ontology, gathering knowledge on city services and infrastructures, criminal events, and their potential impact, actors, and stakeholders, and a mapping table, which allows semantic enrichment of POIs with ontology entities. According to the risk assessment methodology, semantic queries are built from a predefined ontology pattern representing the conceptual structure of potential risks and executed on the ontology. Then, the results of these queries are displayed on the user interface together with interactive maps. For instance, if there have been many criminal events in a urban area, the system can be used to identify and locate additional potential targets situated in that part of the city, possible new criminal events, and the associated stakeholders.

3.1. Architectural Framework

The architecture of the Crime Prevention System consists of three modules that realize the pillars of the system: the qualitative risk assessment methodology, the knowledge base, and the GIS interface. The modules of the architecture are shown in Figure 1.

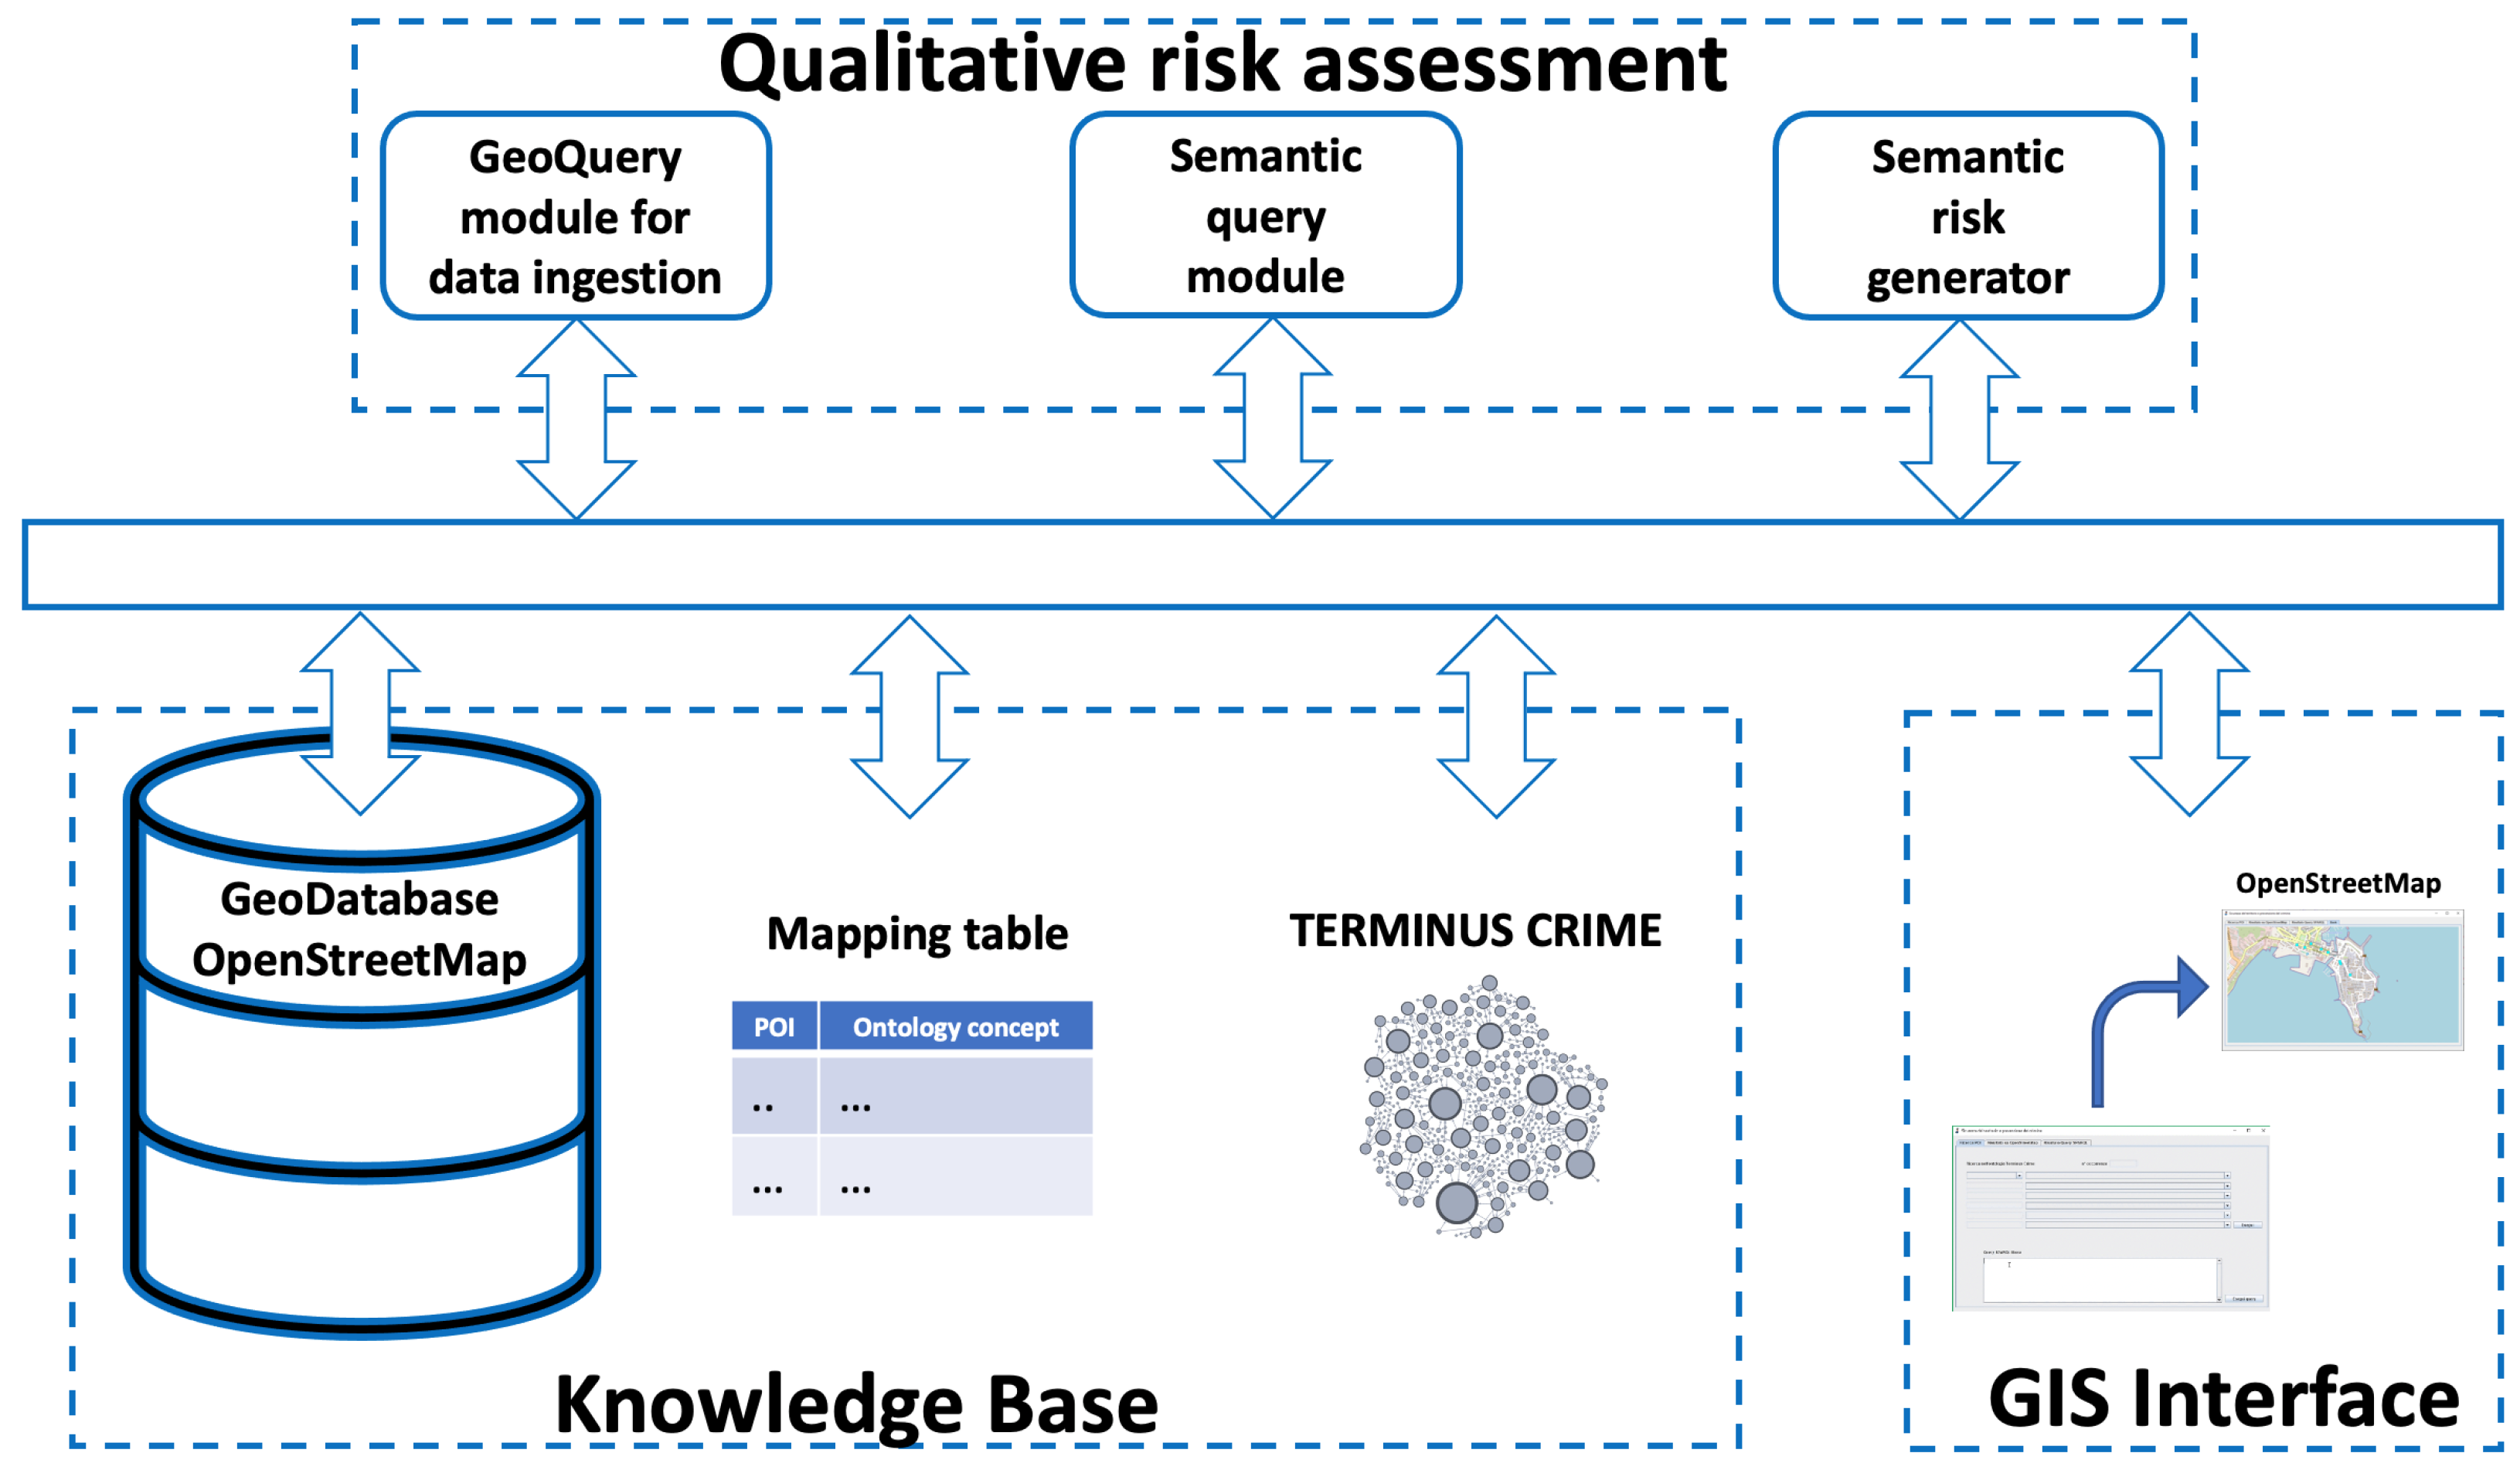
3.1.1. Knowledge Base

The first component of the knowledge base is the OpenStreetMap GeoDatabase, which gathers the information available in the OpenStreetMap GIS. Such information is retrieved as an *.osm file, which contains XML-formatted data. The latter includes retrieval date and time, coordinates, type, and name of each point of interest. The following XML snippet shows an excerpt of an *.osm file concerning a bank in the city of Ragusa. A tag is a label consisting of a <key-value> pair attributed to a node. An example of a tag is the pair <amenity-bank>, which identifies a bank as an amenity.
  •     ...
  •     <node id="5885367886" version="3"
  •      timestamp="2020-11-02T17:24:44Z"
  •      lat="36.9771946" lon="15.1988436">
  •     <tag k="amenity" v="bank"/>
  •     <tag k="atm" v="yes"/>
  •     <tag k="brand:wikidata" v="Q3633687"/>
  •     <tag k="brand:wikipedia"
  •        v="it:Banca Agricola Popolare di Ragusa"/>
  •     <tag k="name" v="Banca Agricola Popolare di Ragusa"/>
  •     <tag k="short\_name" v="Bapr"/>
  •     </node>
  •     ...
The second component of the knowledge base is the TERMINUS Crime ontology, which extends TERMINUS (TERritorial Management and INfrastructures ontology for institutional and industrial Usage) [3] to address the domain of crime in urban areas. While some ontologies addressing cyber crime have been proposed in the literature, there is a lack of ontologies focusing on urban crime [31]. For this reason, we decided to develop a new ontology.
TERMINUS includes knowledge about critical infrastructures, representing risks for city services due to catastrophic events such as earthquakes, floods, and landslides through the risk of system service design pattern. This consists of five high-level concepts:
  • Hazard. Event (e.g., floods, droughts, and rising sea levels) with likely harmful consequences for human systems.
  • Critical_event_of_system. An event that represents one or more effects on systems from exposure to a hazard; the effects are mediated by the strength of the hazard and the vulnerability of the exposed system.
  • Functional_vulnerability. The propensity of a system function to be negatively affected. This results from the balance between sensitivity and adaptive capacity.
  • System_service. Service provided by the system.
  • Stakeholder. A person or organization that is interested in a system or its subsystems.
There are four relationships between the concepts:
  • havingImpact. Conceptual relationship between a hazard and a critical event of system.
  • concerning. Conceptual relationship between a critical system event and one of its provided services (i.e., system service).
  • havingVulnerability. Conceptual relationship between system service and one of its functional vulnerabilities.
  • havingInterestOn. Conceptual relationship between stakeholder of a system and critical event of system.
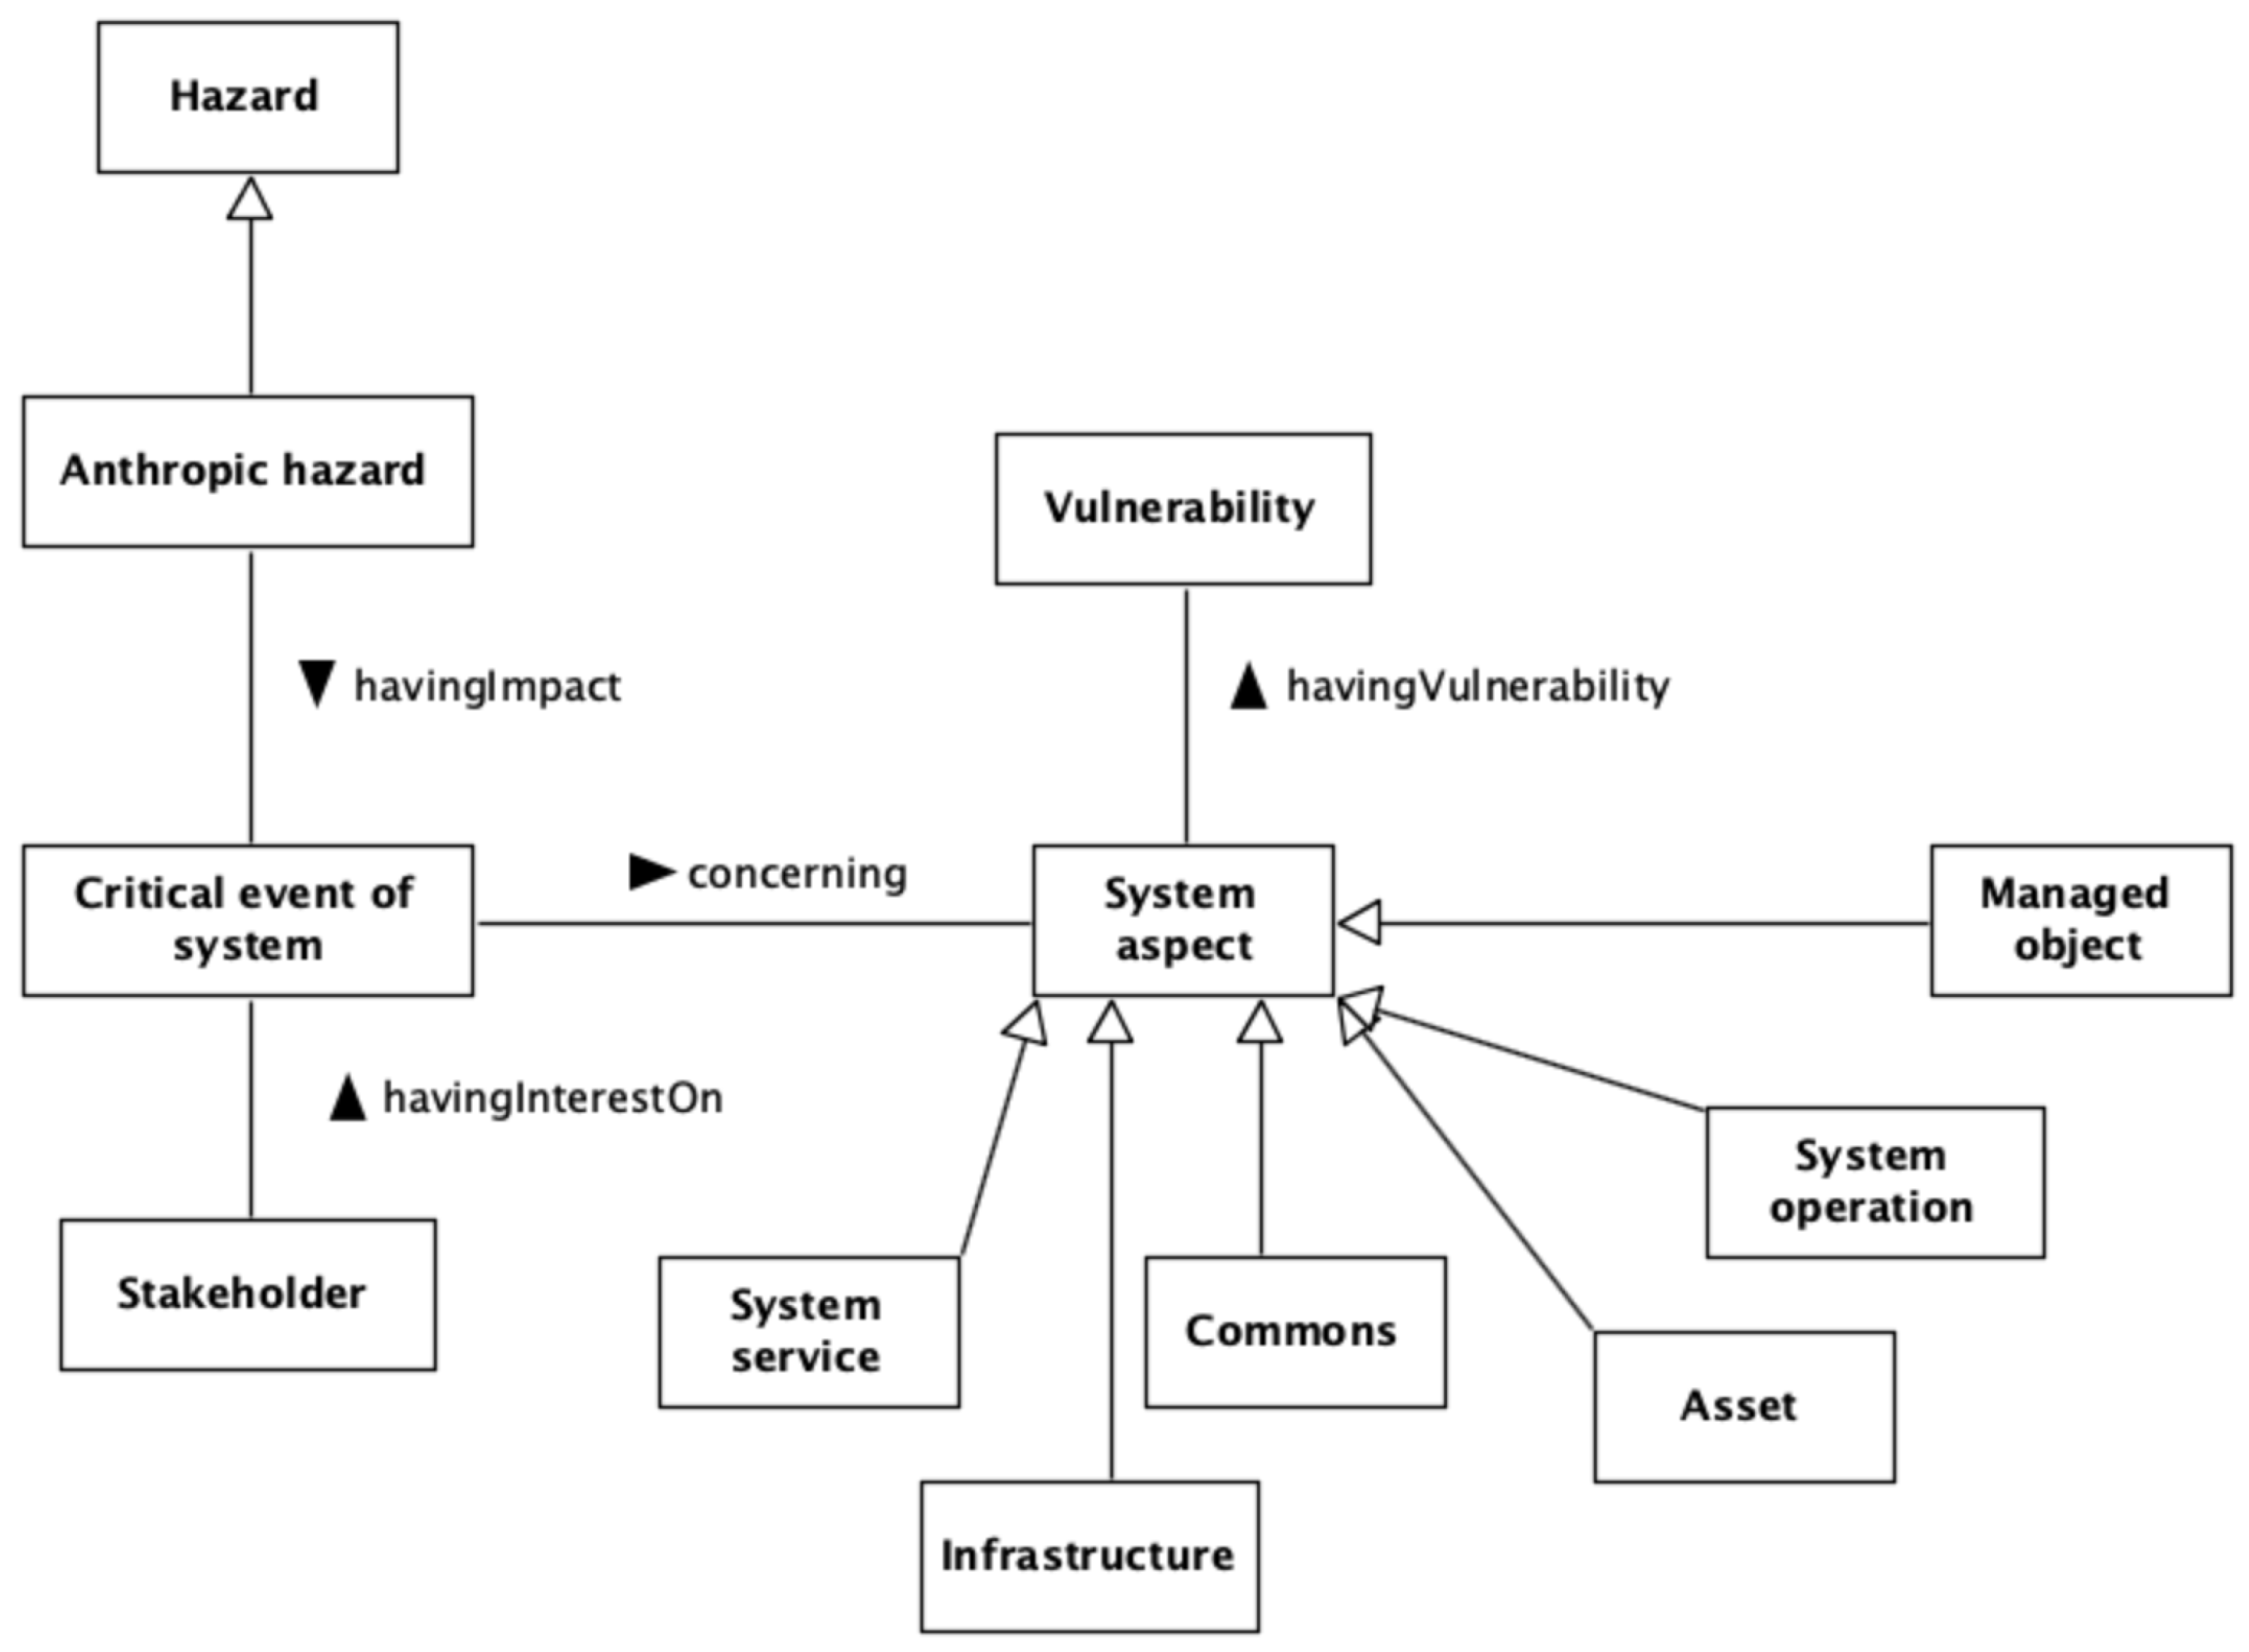
TERMINUS Crime enriches the risk of system service design pattern to address the peculiarities of crime risks related to private and public urban services (see Figure 2). Furthermore, for such type of risk, we consider only anthropic hazards since we focus on criminal events. In this context, a vulnerability is interpreted as the system feature that facilitates the propensity to criminal actions, while a stakeholder is a person or organization, public or private, directly concerned with the aspect of the system affected by the criminal event. Finally, instead of considering only services, other aspects are included, i.e., assets, commons, infrastructures, managed objects, and system operations [32]. Indeed, in the ontology, the system aspect is intended as a conceptual synecdoche, where a concept representing a part of the system is put for the concept representing the whole system. Assets model the items of value owned by the system. Commons refer to the cultural and natural resources accessible to all members of a society, including natural materials such as air, water, and a habitable Earth. Infrastructures model the physical, technological, and organizational structure of a system. Managed objects model the entities that are handled by the system, such as as water in the case of a water system or fuel in the case of an oil system. System operations are the (internal) activities performed in a system that are required preconditions to deliver services. The resulting design pattern is, here, named the risk of system aspect design pattern.
In the following, we describe how the risk of system aspect design pattern was used to build TERMINUS Crime with an example related to the system <petrol station>. In detail, we considered the anthropic hazard <citizen protest over the proximity of petrol station to homes>, which could have as impact the critical event of a system <Petrol station closure>. Possible stakeholders who take care of this event are the <citizen>, the <taxi driver>, and the <owner of the petrol station>. Depending on the specific risk assessment objectives, the <petrol station> can be seen from different perspectives reflected by the ontology concepts modeled as system aspects. For instance, if the petrol station is seen as a system service, one could consider the concept <self-service refueling>. If one is interested in the infrastructural aspect of the system, she/he could consider it as an infrastructure by means of the concept <fuel column>. If one is interested in the benefits to all the members of the society provided by the system, she/he could consider it as commons by means of the concept <freedom of mobility>. If one is interested in the economic value of the system, she/he could consider it as asset by means of the concept <economic value of the fuel storage tank>. If one is interested in the operations to make the system working, she/he could consider the concept <fuel conservation>. Finally, if the system is seen as a managed object, we could consider the concept <fuel>. In addition, vulnerabilities depend on the perspective and, hence, on the system aspect. For instance, the vulnerabilities of <self-service refueling>, <fuel column>, and <freedom of movement> are, respectively, <lack of maintenance>, <petrol station in isolated area>, and <low number of petrol stations in the area>.
TERMINUS Crime was built by domain experts and knowledge engineers by using the UPON-lite ontology engineering methodology [33]. They identified and included sensitive targets and, then, all the risk aspects characterizing them, such as potential crimes, economic and social impacts, vulnerabilities, and stakeholders. It contains 1791 classes, 114 object properties, and 9326 axioms. An axiom is a logical expression that can be used to represent a constraint and is expressed as a statement consisting of a subject, a predicate, and an object. An example of axiom in TERMINUS Crime is <<Hospital theft>> <<havingImpact>> <<Limited or no hospital operations>>. Figure 3 shows the TERMINUS Crime ontology in the Protégé ontology management system.
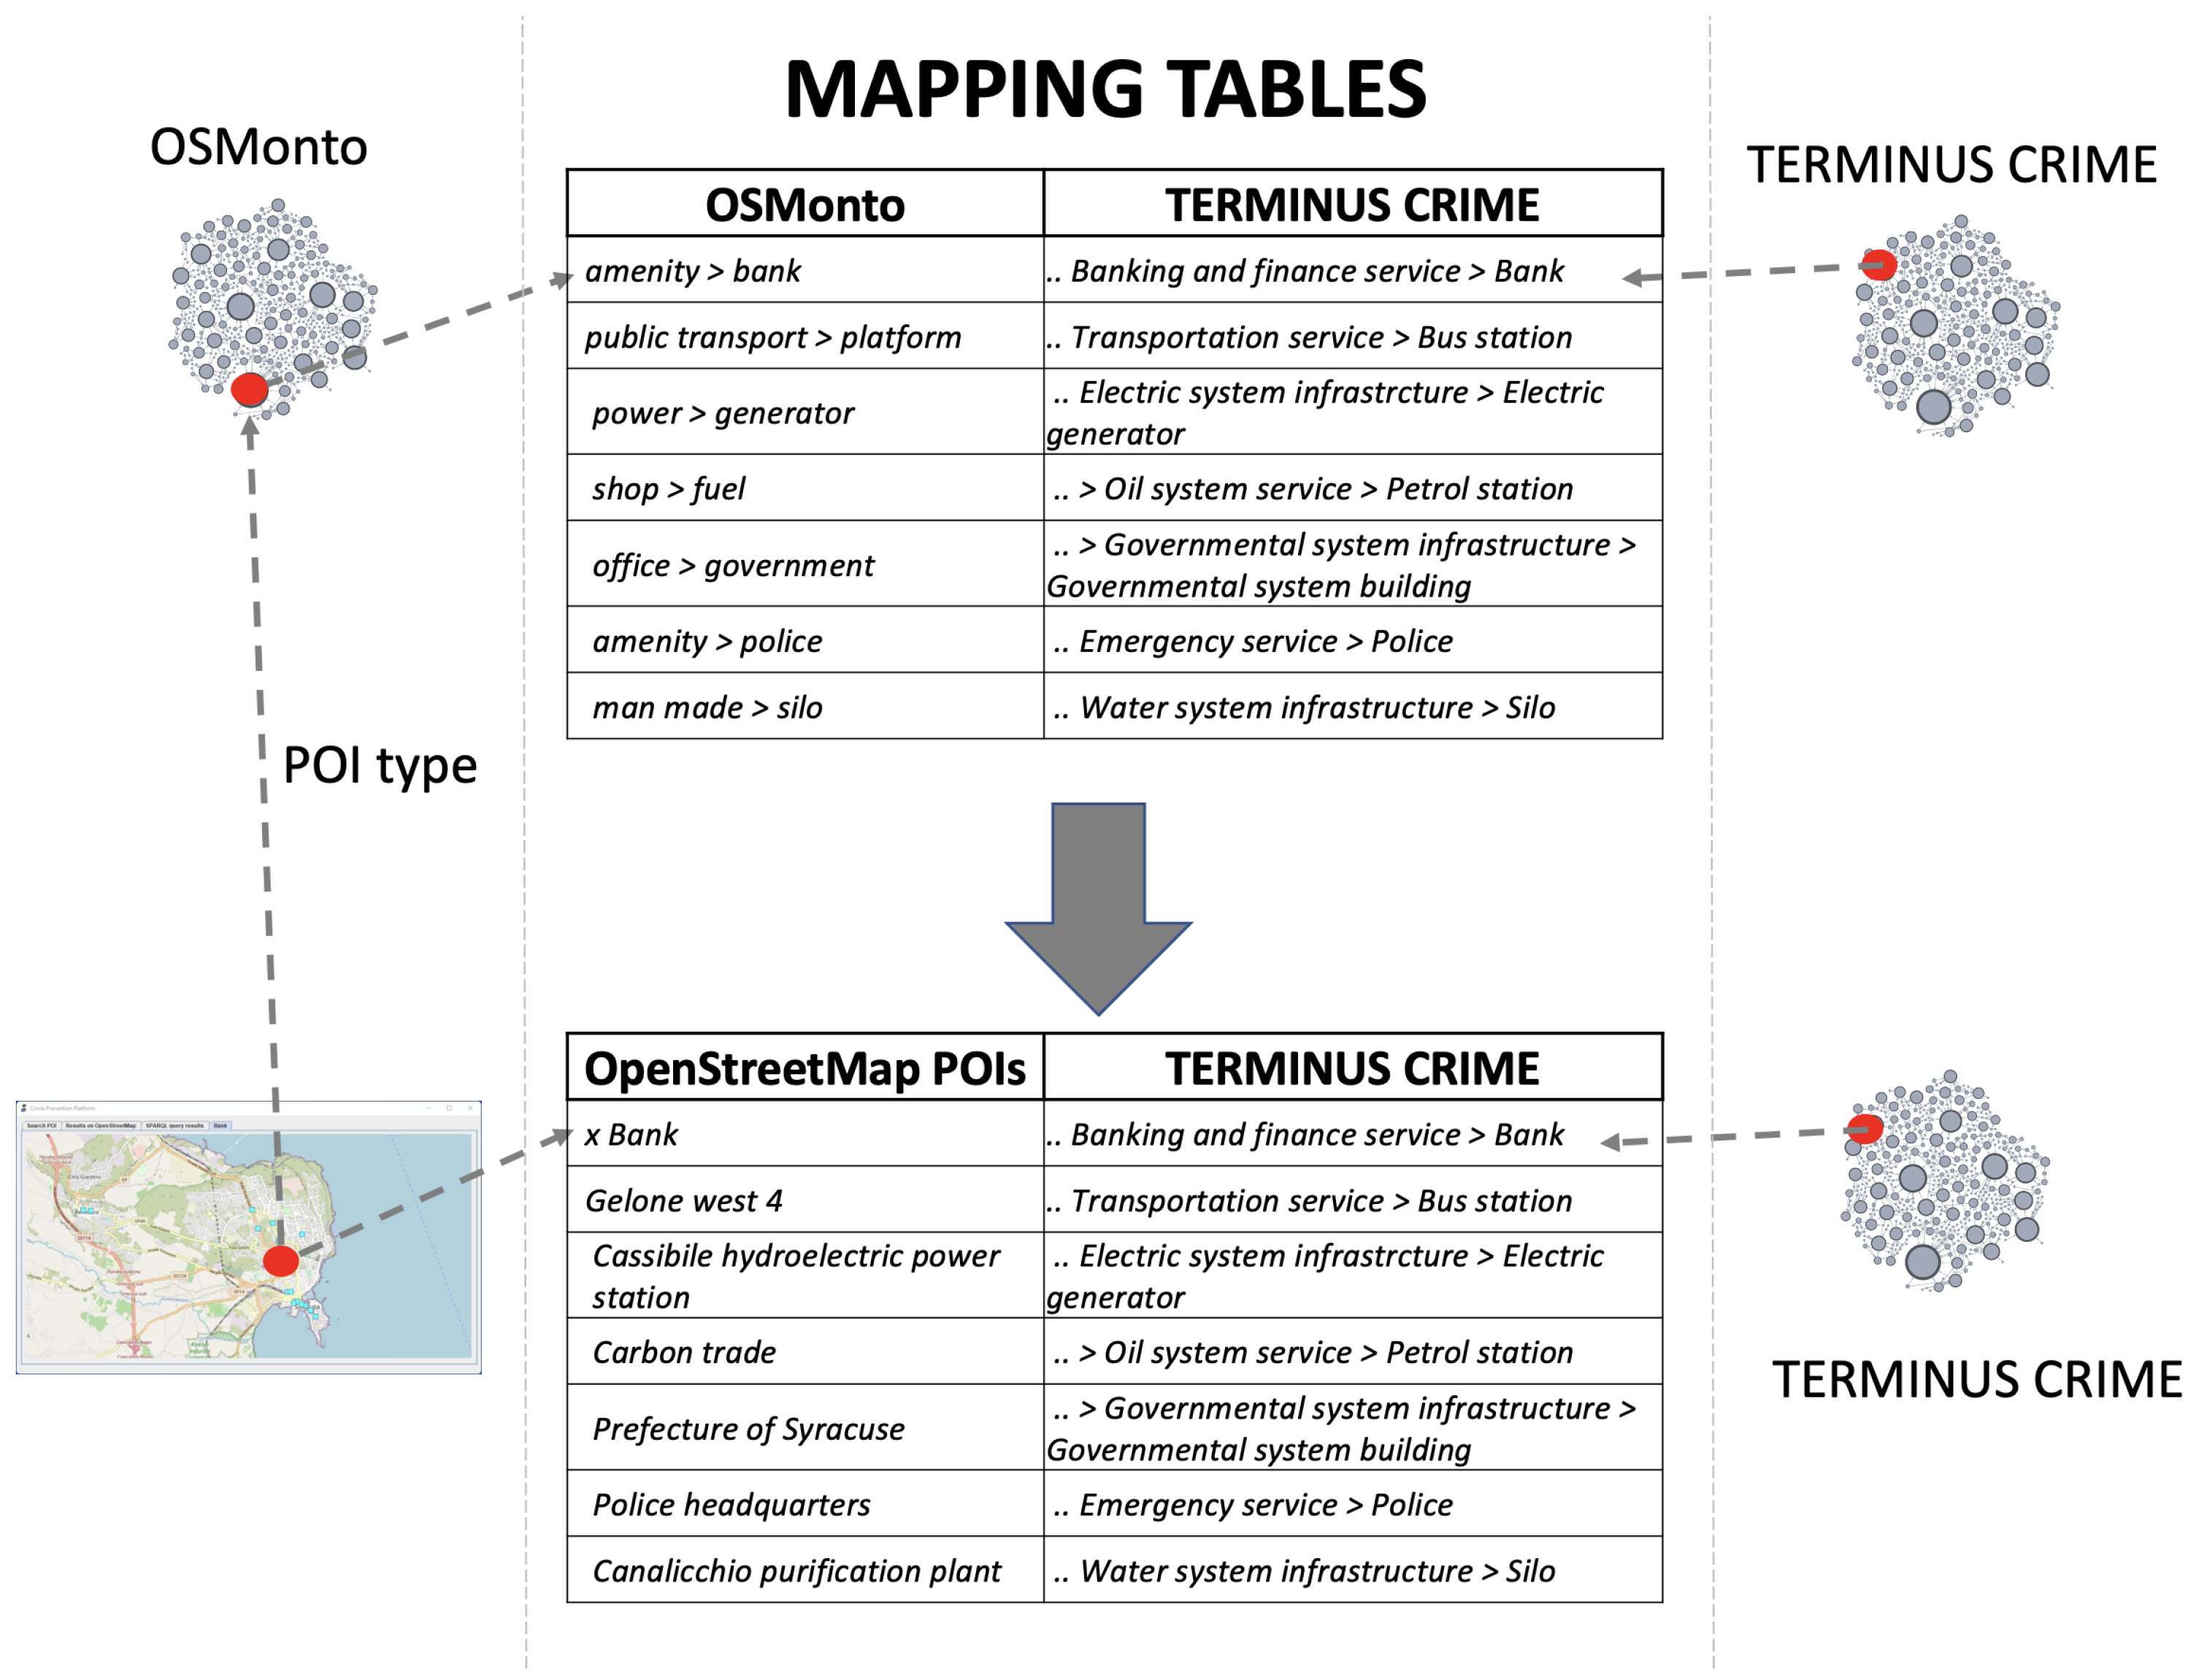
The third component of the knowledge base is a table for semantic annotations of records. A semantic annotation is the process of describing a resource by a collection of ontology concepts [34]. In this work, the semantic annotation table contains the matches between the TERMINUS Crime ontology and the POIs. In order to identify them, we built another mapping table between the concepts of TERMINUS Crime and those of the ontology of OpenStreetMap tags, named OSMonto (OSMonto was developed by the University of Bremen: https://raw.githubusercontent.com/doroam/planning-do-roam/master/Ontology/tags.owl, accessed on 1 December 2022) [35], which is used in OpenStreetMap to specify the type of point of interest. OSMonto is an evolving project, which is extended if a new tag is used in OpenStreetMap at least one hundred times. Figure 4 shows how the semantic annotation process works. POIs in OpenStreetMap are already associated with OSMonto concepts. To allow a dynamic alignment between the POIs and TERMINUS Crime, we built a mapping table between the latter and OSMonto, which is used to automatically feed the mapping table at the bottom of the figure. Currently, the semantic annotation table relating OSMonto concepts and TERMINUS Crime contains 45 rows, one for each binding between the pair of tags <key-value>, identifying a POI at one side and the TERMINUS Crime concept at the other.

3.1.2. Software Modules for Qualitative Risk Assessment

The goals of qualitative risk assessment are either to identify the POIs that are potentially affected by given risks or to predict possible crime risks related to the POIs included in a given urban area. In the proposed framework, given a geographical area in OpenStreetMap, the semantic query module, jointly with the GeoQuery module for data ingestion, allows the conception of new plausible risks and to identify the POIs that could be affected by them. Instead, the semantic risk generator enables reasoning mechanisms that allow crime risks prediction.
The GeoQuery module for data ingestion was implemented by using the Overpass API (Overpass API: http://overpass-api.de, accessed on 1 December 2022) and performs queries on the OpenStreetMap GeoDatabase. These queries are specified according to the Overpass Query Language (QL). The Overpasser framework (Overpasser framework: https://github.com/zsoltk/overpasser, accessed on 1 December 2022) was used to execute queries in the Overpass QL, which was created specifically for Overpass API. The queries retrieve the number of occurrences of a certain type of POI and their locations within OpenStreetMap. This module also allows the selection of the administrative boundaries of the chosen city and the retrieval of the type of result returned: node, road, relation, or all three together. In the Crime Prevention System, the OpenStreetMap queries are performed in real time so that retrieved data are always up-to-date.
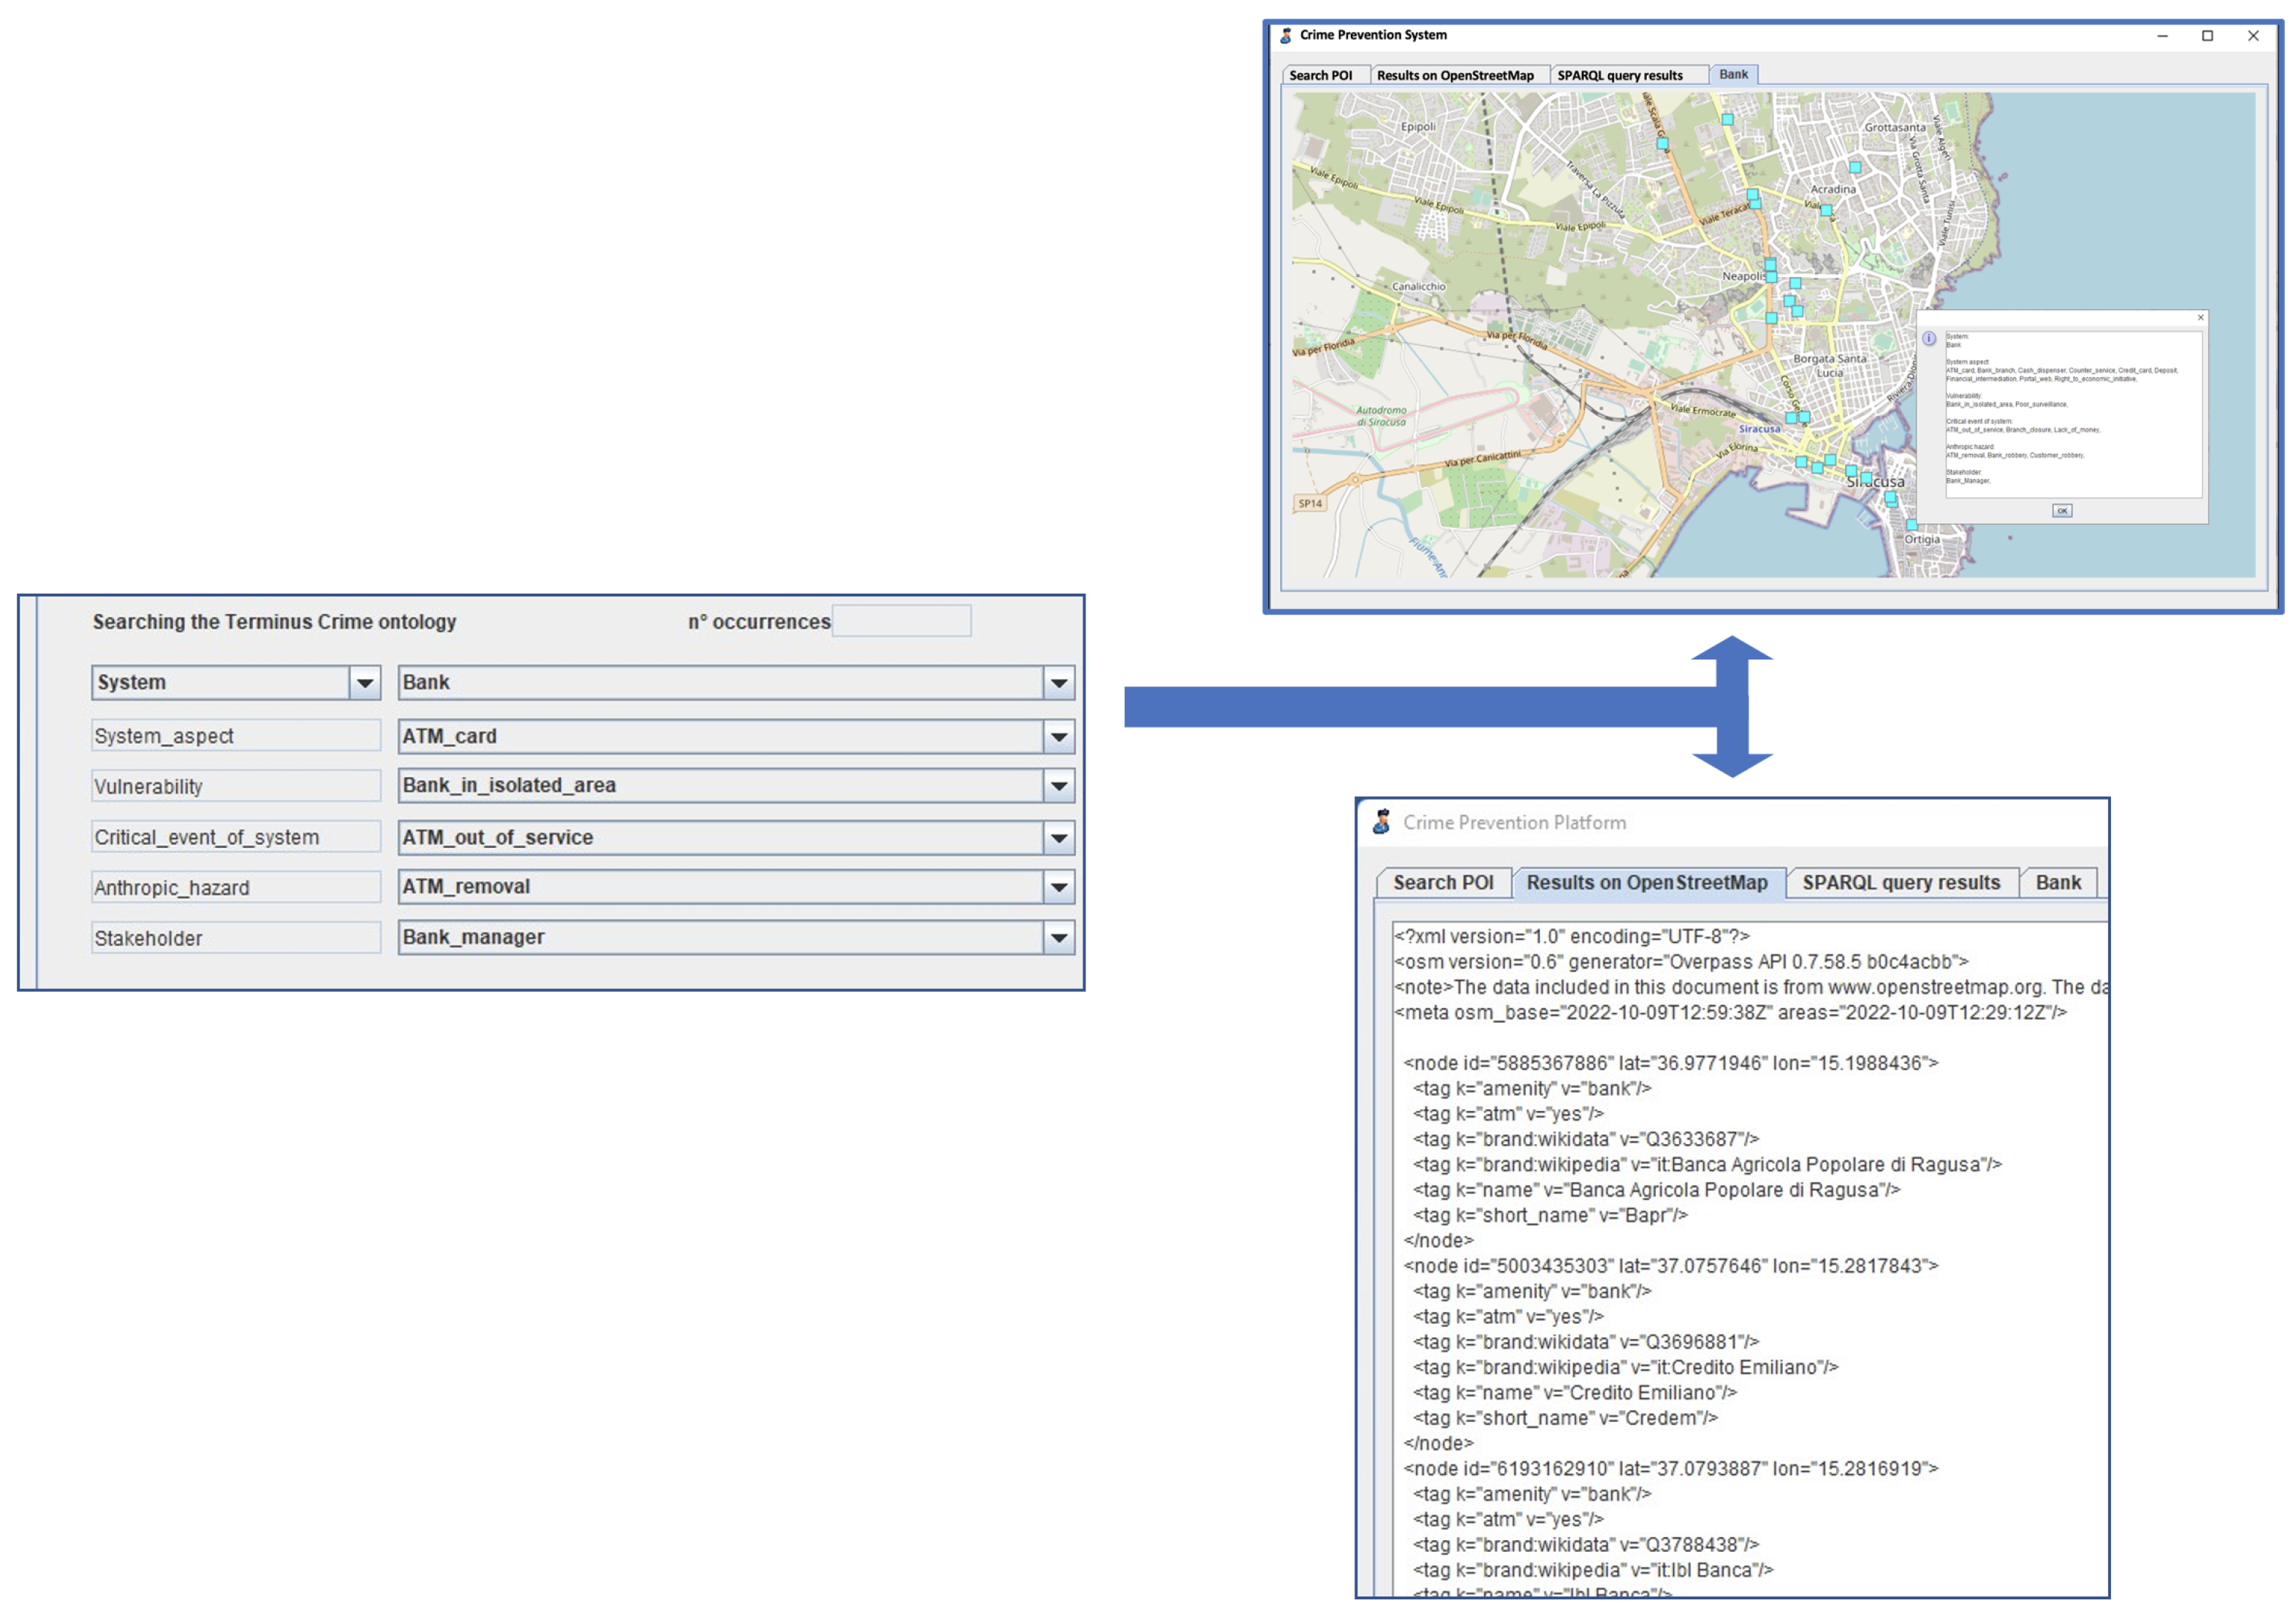
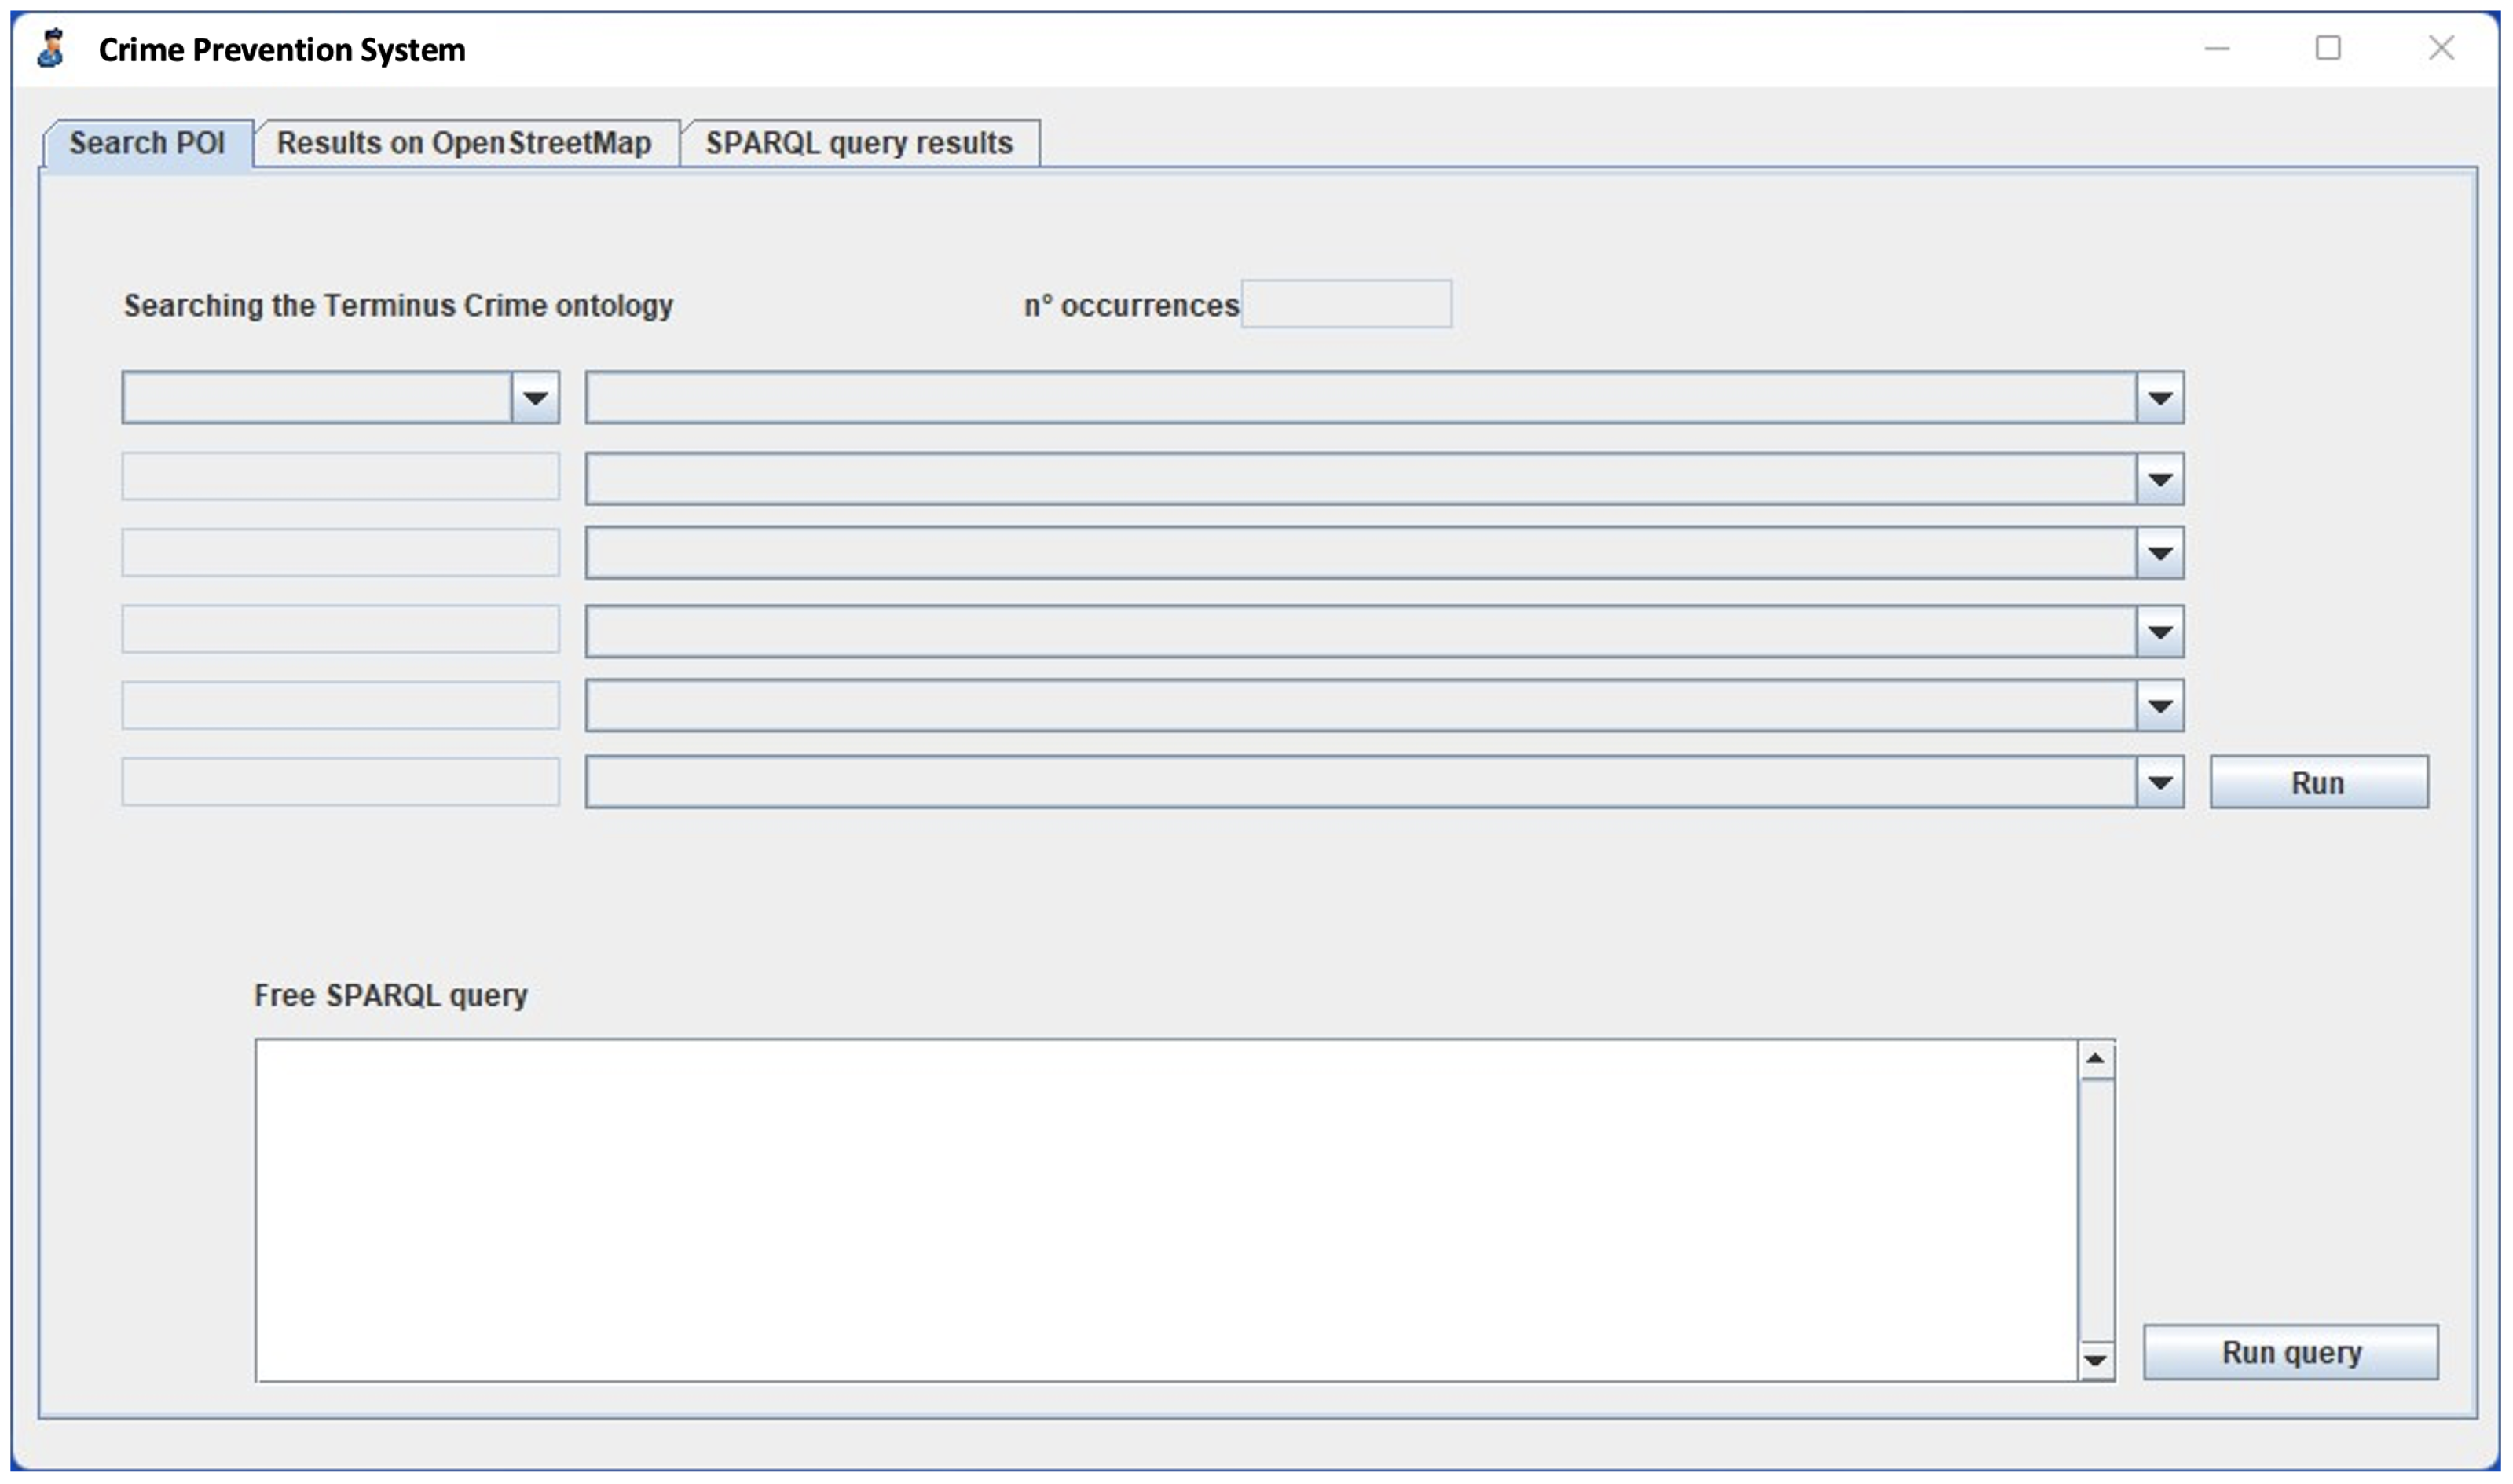
At run time, the semantic query module allows the identification of the POIs in a given area that are potentially affected by crime risks. An analyst is guided in selecting a risk through drop-down lists that are dynamically populated through SPARQL queries (see Figure 5) implemented by using the Apache Jena (Apache Jena: https://jena.apache.org, accessed on 1 December 2022) framework. The SPARQL queries exploit the ontological relationships of TERMINUS Crime to create risk mini-models that are novel, relevant, and plausible.
Afterwords, an Overpass query is executed through the GeoQuery module for data ingestion on the OpenStreetMap GeoDatabase in order to retrieve all the POIs in the area that are potentially affected by such a risk. To this purpose, the previously presented mapping table is also used to write the Overpass query starting from the risks structured according to the TERMINUS Crime terminology. Once the query is executed, POIs are shown in two different windows of the Crime Prevention System. The former displays an interactive map, with placeholders showing the geographical location of POIs (see top of Figure 5). The latter shows the result of the Overpass query structured in XML format with various tags, including the geographical coordinates of the POIs that have been retrieved (see bottom of Figure 5). SPARQL queries are parametric and previously encoded in a Java program. They contain a few variables and their formulation and execution do not require any programming skill of the user of the Crime Prevention System.
Queries can be also used to retrieve information for a selected POI. This can be obtained via SPARQL queries based on rules and properties encoded in the ontology. For instance, the request to know all the events that can compromise the operation of a hospital, carried out by means of an SPARQL query, will have among the resulting events the <<Hospital Theft>> concept, which is mentioned above. Table 1 shows an example of a query to retrieve the system aspect associated with all the POIs in a given area.
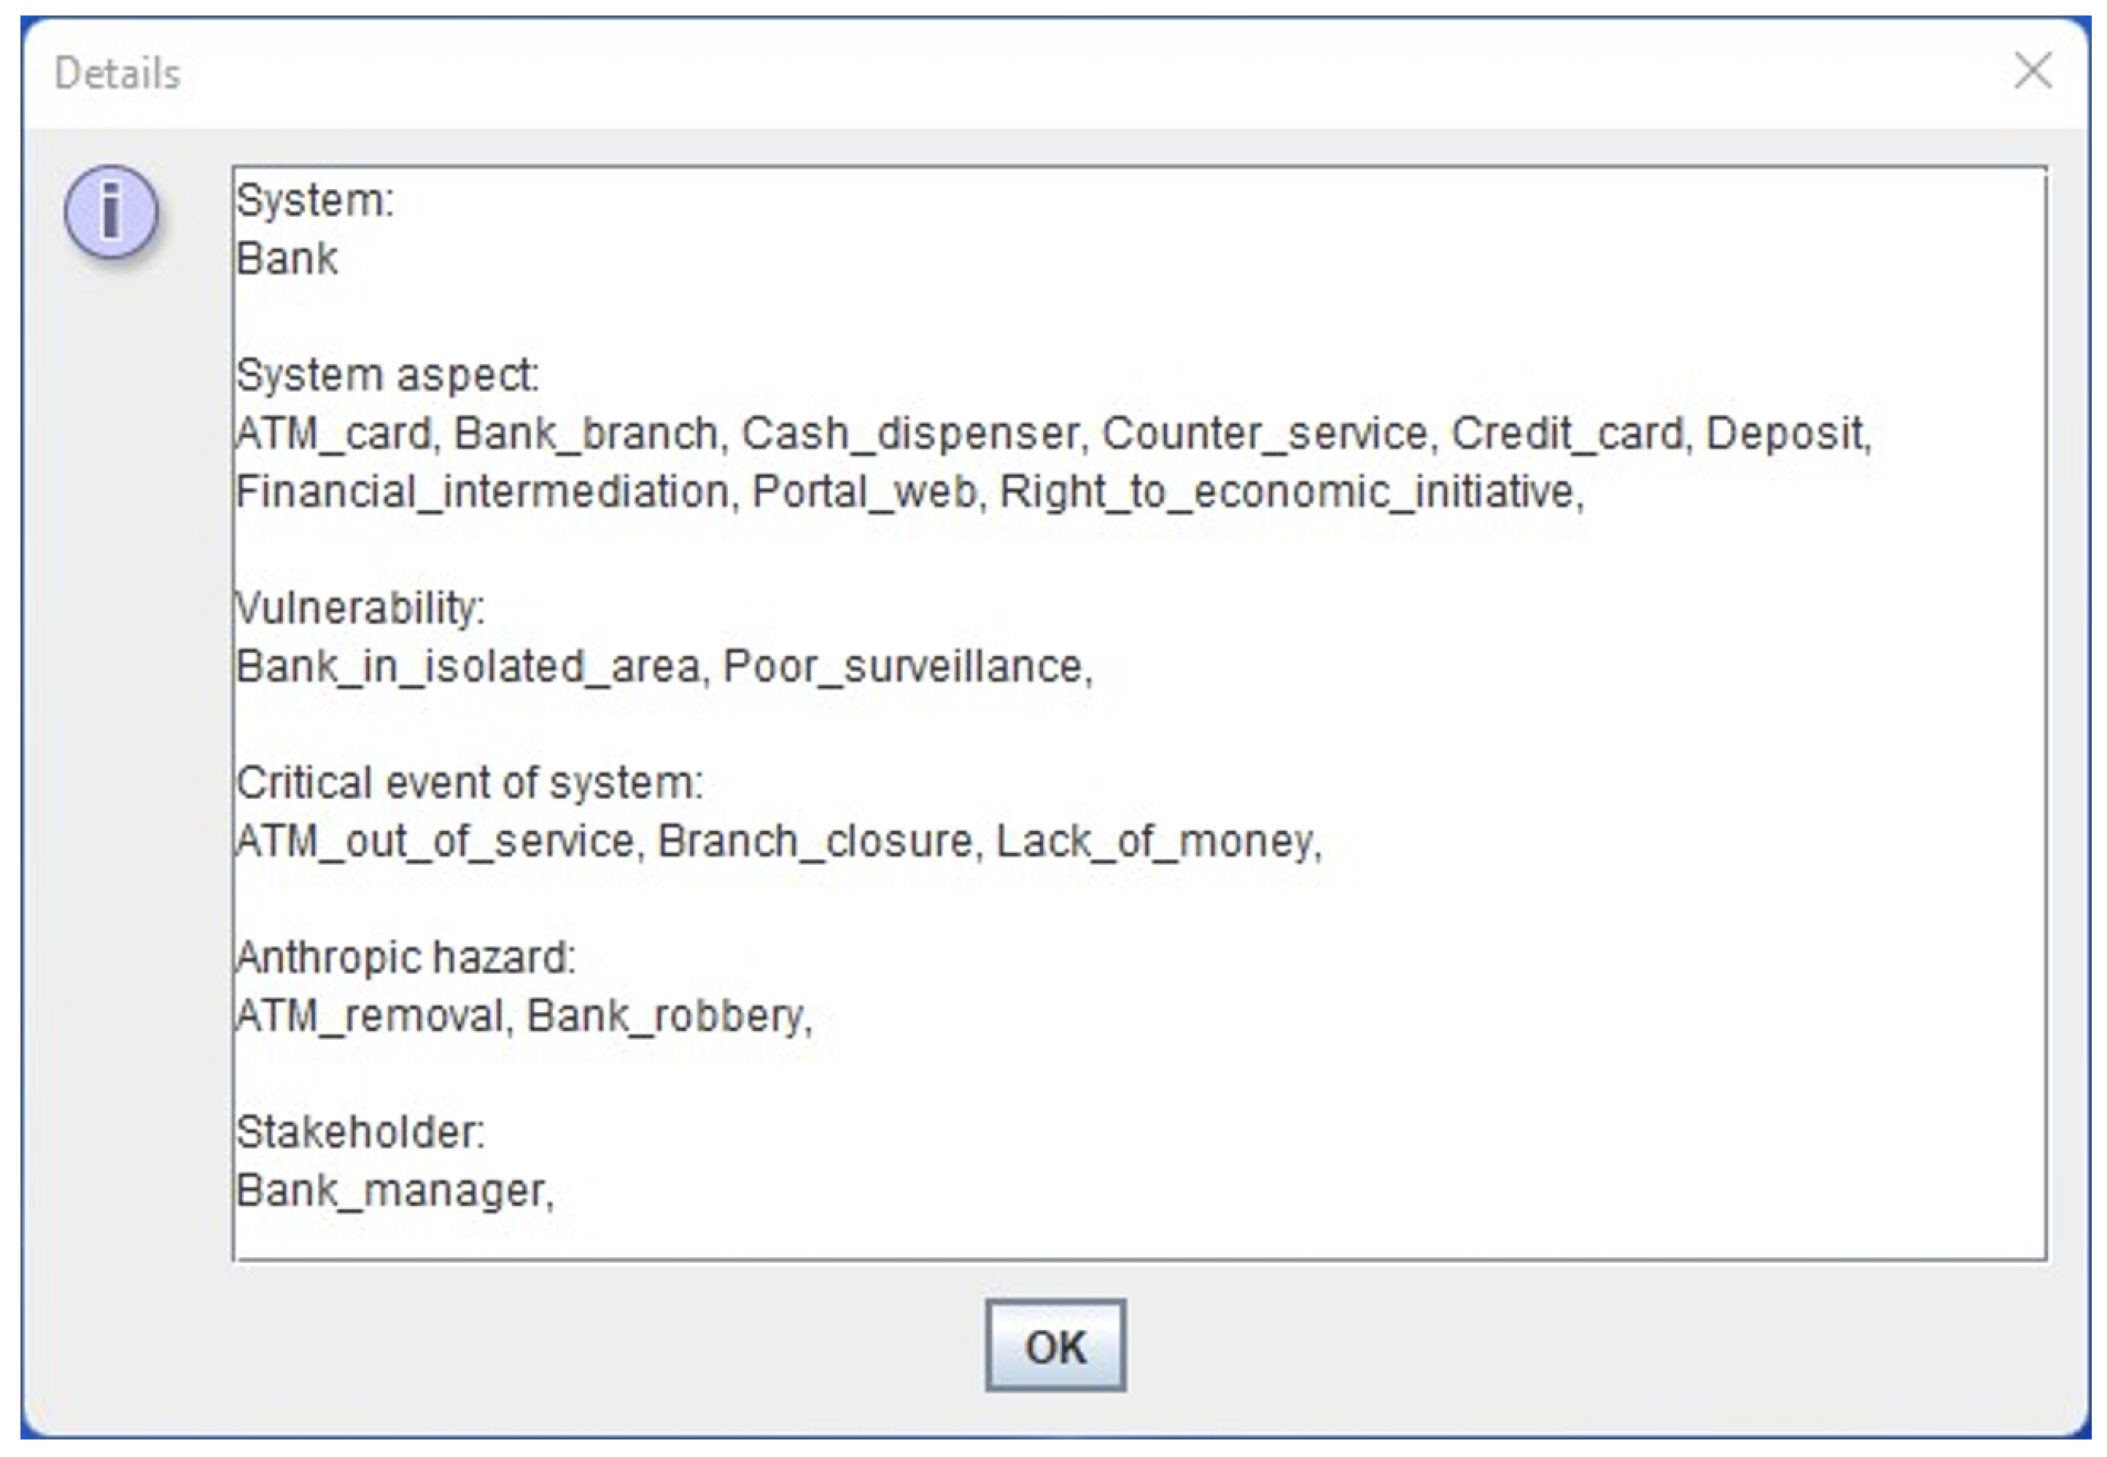
The semantic risk generator is a computational creativity engine [36] that displays risk mini-models as combination of concepts retrieved via predefined generative SPARQL queries from the TERMINUS Crime ontology. Computational creativity is a field of artificial intelligence devoted to defining computational systems that create artifacts and ideas [2]. Clicking on one of the map placemarks displays a window summarizing information on the POI, such as the related vulnerabilities, anthropic hazards, and stakeholders, retrieved from the TERMINUS ontology through SPARQL queries (Figure 6). An example of generative query aimed at figuring out all the possible critical events of system related to an anthropic hazard provided as input via the variable var1 is presented in Table 2.
The GIS interface <<interface>> is built on top of the WindowBuilder and JXMapViewer2 frameworks to display the graphical user interface and the interactive maps embedded within it, respectively. As already mentioned, the maps have placeholders indicating POI locations.
The graphical interface is shown in Figure 7.

3.2. Crime Prevention System Implementation and Deployment

To realize the graphical interface of the Crime Prevention System (the source code of the software project is available on the Github platform at https://github.com/royminardi/OSINT_OSM (accessed on 1 December 2022) together with the unit test object executed through the Eclipse IDE), we used the WindowBuilder Framework. The TERMINUS Crime ontology was built through the Protégé ontology management system, imported through Apache Jena, and queried by means of the SPARQL language. The OpenStreetMap GeoDatabase Server was accessed via the Overpasser Framework and the Overpass Query Language. Finally, we used the JXMapViewer2 Framework to manipulate the OpenStreetMap cartography by creating customized maps.

4. Case Study: Crime Risk Assessment in the City of Syracuse, Italy

In this section, we present a case study aimed at explaining how the Crime Prevention System should be used to assess crime risk in an urban area in daily police work. The case study concerns the city of Syracuse, a medium-sized city (around 100,000 inhabitants and 200 km2) in the south of Italy. Despite having its own territorial features, the example of the city of Syracuse fits with any other similar-sized city. Only a few peculiarities characterize it, such as the absence of an airport.

4.1. Crime Prevention System Setup

First of all, we identified the points of interest (POIs) of the city of Syracuse to be taken into account for crime risk assessment, by taking as reference the sensitive targets defined in the Italian Ministry of the Interior’s implementing regulation [37]. We identified 45 POI types, which are reported in Table 3. All these POI types are included in the OSMonto ontology. They were also assessed and validated by interviewing domain experts. Then, these were matched to the TERMINUS Crime ontology concepts in order to build the mapping tables presented in Figure 4.
It is worthy to note that POIs are not only categorized as nodes in OpenStreetMap but also as streets and relations. An example is the Palace of Justice of Syracuse, which was loaded in OpenStreetMap as a road and, hence, with the boundaries delimited by a closed line. In other cases, a street is represented with an open line to indicate a street.
The Overpasser framework was used within the Crime Prevention System to retrieve data based on the actual boundaries of the specified city, rather than a rectangle defined by geographical coordinates. In the case of the city of Syracuse, the administrative boundary is delimited by 110 nodes and 45 street relations. This change allows all POIs falling within the administrative boundary of the city to be correctly retrieved. In fact, even though the description of each POI includes the “city” field, which could, in principle, discriminate the result by city, this field often has “null” value. A further modification to the Overpasser framework made it possible to choose a node (node), a way (way), a relation (rel), or all three together (nwr).
Then, we checked TERMINUS Crime to verify that all the POI types have a corresponding concept in the ontology. The missing concepts were added, and domain experts from the city of Syracuse were involved to add further concepts categorized as anthropic hazard (e.g., jewelry theft), vulnerability (e.g., few employees), stakeholder (e.g., bank shareholder), asset (e.g., property concession), commons (e.g., cultural activities), infrastructure (e.g., lighthouse tower), managed object (e.g., cash), system operation (e.g., financial intermediation), and system service (e.g., cash dispenser). Then, we checked and added further axioms to represent the connections between the added concepts. Table 4 shows some of the axioms that were defined.

4.2. Risk Assessment of Points of Interest

In this subsection, we present some system usage scenarios to illustrate how security operators may take advantage of the system results in their daily work.
Criminal informants say that a criminal group in the area have planned several coordinated criminal actions in the city center to cause social unrest. Hence, the police officers decide to assess the crime risk for some selected potential targets. They select the following five situations generated by means of the Crime Prevention System and take some actions, such as increasing surveillance and checking that cameras in the area are working properly, to prevent them from occurring.
As a first crime risk situation, the police consider a bank as a point of interest and, specifically, a cash dispenser. This is modeled as a system service in TERMINUS Crime. By means of the semantic risk generator, the following risk is generated. The vulnerability of the cash dispenser, i.e., bank in isolated area, is due to the place where it is located. An anthropic hazard is the removal of the ATM due to thieves. A critical event of system may be the failure to dispense money from the ATM, which is of interest, among others, for the bank manager. This risk is represented by the risk mini-model shown in Table 5.
A second situation concerns the risks related to the presence of explosive material in a police station. In such case, a scenario could be to consider the citizens’ protection, which is modeled as a common good (i.e., commons) in TERMINUS Crime as target for these risks. Citizens are also stakeholders of this system aspect. An anthropic hazard could be the blocking of the road in front of the police station due to a strike, and the critical event of system could be occurrence of casualties. The risk mini-model representing such a risk scenario is shown in Table 6.
A third situation refers to the risks due to the interruption of electricity, originated by an explosion caused by terrorists. Elements of the electricity infrastructure are exposed to these risks, leading to faults to the system operation. The electricity supply is, indeed, modeled as system operation in TERMINUS Crime. The shortage of available workers for maintenance is a vulnerability of the system operation aspect, which may cause delays in the service reactivation. The risk mini-model representing such a risk scenario is shown in Table 7.
A fourth situation concerns the risk to a hospital of damage to interior furnishings due to an intentional human accident. The hospital interior furnishings are modeled as asset in TERMINUS Crime. Physical damages in the asset could cause routes that are normally accessible only to staff to be severely impacted. Thus, the functioning of the hospital operations could be reduced or blocked, causing difficulty to monitor these routes. This type of risk, relevant for a facility manager, is represented by the mini-model shown in Table 8.
A fifth situation regards a risk for a school to experience building damages, which might be caused by vandals. These events could impact the school desks and chairs, which are modeled as infrastructure in TERMINUS Crime. One vulnerability of school infrastructure is that chairs and desks are not in excess. Indeed, the lack of desks and chairs could not guarantee the normal execution of teaching activities for all the students. This type of risk is represented by the mini-model shown in Table 9.
Generated risk mini-models were validated by an expert with more than 30 years of experience in the field of urban security.

5. Conclusions

Currently, most of the software applications for crime prevention aim at exploiting historical data, machine learning, and deep learning techniques. There is a lack of means to support police forces in conceiving the potential crime incidents for a given geographical area.
The Crime Prevention System has two main objectives. The first is to provide a utility for the community in the field of security in smart cities. The second is to build an innovative software application to support public servants in conceiving crime risks. It was tested by some domain experts who validated its objectives, its usability, and its outcome.
The Crime Prevention System has a GIS interface and leverages the OpenStreetMap architecture and data. It was built by following an open and modular architecture, which allows both interoperability and scalability. The system uses TERMINUS Crime, an extensible ontology that allows semantic reasoning. SPARQL queries were defined for this purpose and are already available. The results of the queries can be visualized as points of interest (POIs) together with the information related to their risks. By using the system, it is possible to plan actions to prevent criminal events or to take prompt action and limit damage when they occur.
As future work, we will add historical data sources to the system and we will study how to include verification mechanisms to ensure the veracity of OpenStreetMap data.

Author Contributions

Conceptualization, A.D.N., R.M. and M.L.V.; methodology, A.D.N., R.M. and M.L.V.; software, A.D.N. and R.M.; validation, A.D.N. and R.M.; data curation, R.M.; writing—original draft preparation, A.D.N. and R.M.; writing—review and editing, A.D.N., R.M. and M.L.V.; visualization, R.M.; supervision, A.D.N. All authors have read and agreed to the published version of the manuscript.

Funding

This research is partially supported by the National Centre on HPC, Big Data and Quantum Computing project funded by Italian MUR (Ministry for Universities and Research) in the context of the National Recovery and Resilience Plan—Decreto Direttoriale n.3138 del 16 Dicembre 2021.

Conflicts of Interest

The authors declare no conflict of interest.

Abbreviations

The following abbreviations are used in this manuscript:
ATMAutomated teller machine
CNNConvolutional neural network
GISGeographical information system
LSTMLong short-term memory
POIPoint of interest
QLQuery language
XMLeXtensible Mark up Language

References

  1. Yigitcanlar, T.; Butler, L.; Windle, E.; Desouza, K.C.; Mehmood, R.; Corchado, J.M. Can Building “Artificially Intelligent Cities” Safeguard Humanity from Natural Disasters, Pandemics, and Other Catastrophes? An Urban Scholar’s Perspective. Sensors 2020, 20, 2988. [Google Scholar] [CrossRef] [PubMed]
  2. Colton, S.; Wiggins, G.A. Computational creativity: The final frontier? Front. Artif. Intell. Appl. 2012, 242, 21–26. [Google Scholar] [CrossRef]
  3. Coletti, A.; De Nicola, A.; Di Pietro, A.; La Porta, L.; Pollino, M.; Rosato, V.; Vicoli, G.; Villani, M.L. A comprehensive system for semantic spatiotemporal assessment of risk in urban areas. J. Contingencies Crisis Manag. 2020, 28, 178–193. [Google Scholar] [CrossRef]
  4. Park, M.S.; Lee, H. Smart City Crime Prevention Services: The Incheon Free Economic Zone Case. Sustainability 2020, 12, 5658. [Google Scholar] [CrossRef]
  5. Bouma, H.; Villani, M.L.; van Rooijen, A.; Räsänen, P.; Peltola, J.; Toivonen, S.; De Nicola, A.; Guarneri, M.; Stifini, C.; De Dominicis, L. An Integrated Fusion Engine for Early Threat Detection Demonstrated in Public-Space Trials. Sensors 2023, 23, 440. [Google Scholar] [CrossRef]
  6. Saini, B.; Saini, D.K.; Srivastava, S.; Aggarwal, M. A Study of Lightweight Approaches to Analyze Crime Conditions in India. J. Appl. Secur. Res. 2021. [Google Scholar] [CrossRef]
  7. Thomas, A.; Sobhana, N. A survey on crime analysis and prediction. Mater. Today Proc. 2022, 58, 310–315. [Google Scholar] [CrossRef]
  8. Ahmed, S.; Gentili, M.; Sierra-Sosa, D.; Elmaghraby, A.S. Multi-layer data integration technique for combining heterogeneous crime data. Inf. Process. Manag. 2022, 59, 102879. [Google Scholar] [CrossRef]
  9. He, R.; Xu, Y.; Jiang, S. Applications of GIS in Public Security Agencies in China. Asian J. Criminol. 2022, 17, 213–235. [Google Scholar] [CrossRef]
  10. Cheng, W.; Rao, Y.; Tang, Y.; Yang, J.; Chen, Y.; Peng, L.; Hao, J. Identifying the Spatio-Temporal Characteristics of Crime in Liangshan Prefecture, China. Int. J. Environ. Res. Public Health 2022, 19, 862. [Google Scholar] [CrossRef]
  11. Catlett, C.; Cesario, E.; Talia, D.; Vinci, A. Spatio-temporal crime predictions in smart cities: A data-driven approach and experiments. Pervasive Mob. Comput. 2019, 53, 62–74. [Google Scholar] [CrossRef]
  12. Zhu, Q.; Zhang, F.; Liu, S.; Wang, L.; Wang, S. Static or dynamic? Characterize and forecast the evolution of urban crime distribution. Expert Syst. Appl. 2022, 190, 116115. [Google Scholar] [CrossRef]
  13. Pandey, R.; Tolani, H. Crime patterns in Delhi: A Bayesian spatio-temporal assessment. Int. J. Syst. Assur. Eng. Manag. 2022, 13, 2971–2980. [Google Scholar] [CrossRef]
  14. Jones, G.M.; Winster, S.G. Analysis of Crime Report by Data Analytics Using Python. In Advances in Data Mining and Database Management; IGI Global: Hershey, PA, USA, 2021; pp. 54–79. [Google Scholar] [CrossRef]
  15. Butt, U.M.; Letchmunan, S.; Hassan, F.H.; Ali, M.; Baqir, A.; Koh, T.W.; Sherazi, H.H.R. Spatio-Temporal Crime Predictions by Leveraging Artificial Intelligence for Citizens Security in Smart Cities. IEEE Access 2021, 9, 47516–47529. [Google Scholar] [CrossRef]
  16. Zhu, Q.; Zhang, F.; Liu, S.; Li, Y. An anticrime information support system design: Application of K-means-VMD-BiGRU in the city of Chicago. Inf. Manag. 2022, 59, 103247. [Google Scholar] [CrossRef]
  17. Prathap, B.R. Chapter 7—Geospatial crime analysis and forecasting with machine learning techniques. In Artificial Intelligence and Machine Learning for EDGE Computing; Pandey, R., Khatri, S.K., Singh, N.K., Verma, P., Eds.; Academic Press: Cambridge, MA, USA, 2022; pp. 87–102. [Google Scholar] [CrossRef]
  18. Liang, W.; Wu, Z.; Li, Z.; Ge, Y. CrimeTensor: Fine-Scale Crime Prediction via Tensor Learning with Spatiotemporal Consistency. ACM Trans. Intell. Syst. Technol. 2022, 13, 1–24. [Google Scholar] [CrossRef]
  19. Dong, Q.; Ye, R.; Li, G. Crime amount prediction based on 2D convolution and long short-term memory neural network. ETRI J. 2022, 44, 208–219. [Google Scholar] [CrossRef]
  20. Muthamizharasan, M.; Ponnusamy, R. Forecasting Crime Event Rate with a CNN-LSTM Model. In Proceedings of the Innovative Data Communication Technologies and Application; Raj, J.S., Kamel, K., Lafata, P., Eds.; Springer Nature Singapore: Singapore, 2022; pp. 461–470. [Google Scholar] [CrossRef]
  21. Shukla, A.; Katal, A.; Raghuvanshi, S.; Sharma, S. Criminal Combat: Crime Analysis and Prediction Using Machine Learning. In Proceedings of the 2021 International Conference on Intelligent Technologies (CONIT), Hubli, India, 25–27 June 2021; pp. 1–5. [Google Scholar] [CrossRef]
  22. Brindha, R.; Thillaikarasi, D. Crime Data Forecasting Using Machine Learning and Big Data Analytics. Webology 2021, 18, 591–606. [Google Scholar] [CrossRef]
  23. Wei, Y.; Liang, W.; Wang, Y.; Cao, J. CrimeSTC: A Deep Spatial-Temporal-Categorical Network for Citywide Crime Prediction. In Proceedings of the 2020 The 3rd International Conference on Computational Intelligence and Intelligent Systems, CIIS 2020, Tokyo, Japan, 13–15 November 2020; Association for Computing Machinery: New York, NY, USA, 2021; pp. 75–79. [Google Scholar] [CrossRef]
  24. Srinivasa, K.; Thilagam, P.S. Crime base: Towards building a knowledge base for crime entities and their relationships from online news papers. Inf. Process. Manag. 2019, 56, 102059. [Google Scholar]
  25. Guizzardi, G.; Wagner, G.; De Almeida Falbo, R.; Guizzardi, R.S.S.; Almeida, J.P.A. Towards ontological foundations for the conceptual modeling of events. In Proceedings of the International Conference on Conceptual Modeling 2013, Hong-Kong, China, 11–13 November 2013; Lecture Notes in Computer Science (including Subseries Lecture Notes in Artificial Intelligence and Lecture Notes in Bioinformatics); Springer: Berlin/Heidelberg, Germany, 2013; Volume 8217, pp. 327–341. [Google Scholar]
  26. De Oliveira Rodrigues, C.M.; De Freitas, F.L.G.; De Azevedo, R.R. An Ontology for Property Crime Based on Events from UFO-B Foundational Ontology. In Proceedings of the 2016 5th Brazilian Conference on Intelligent Systems, BRACIS 2016, Recife, Brazil, 9–12 October 2016; pp. 331–336. [Google Scholar]
  27. Abdul Jalil, M.M.; Ling, C.P.; Mohamad Noor, N.M.; Mohd, F. Knowledge Representation Model for Crime Analysis. Procedia Comput. Sci. 2017, 116, 484–491. [Google Scholar] [CrossRef]
  28. Kalemi, E.; Yildirim-Yayilgan, S.; Domnori, E.; Elezaj, O. SMoNt: An ontology for crime solving through social media. Int. J. Metadata Semant. Ontol. 2017, 12, 71–81. [Google Scholar] [CrossRef]
  29. Aliprandi, C.; Arraiza Irujo, J.; Cuadros, M.; Maier, S.; Melero, F.; Raffaelli, M. CAPER: Collaborative Information, Acquisition, Processing, Exploitation and Reporting for the Prevention of Organised Crime. In Proceedings of the International Conference on Human-Computer Interaction 2014, Heraklion, Crete, 22–27 June 2014; Communications in Computer and Information Science; Springer: Cham, Switzerland, 2014; Volume 434, pp. 147–152. [Google Scholar]
  30. Coletti, A.; De Nicola, A.; Villani, M.L. Building Climate Change into Risk Assessments. Nat. Hazards 2016, 84, 1307–1325. [Google Scholar] [CrossRef]
  31. De Nicola, A.; Villani, M.L. Smart City Ontologies and Their Applications: A Systematic Literature Review. Sustainability 2021, 13, 5578. [Google Scholar] [CrossRef]
  32. Coletti, A.; De Nicola, A.; Vicoli, G.; Villani, M.L. Semantic Modeling of Cascading Risks in Interoperable Socio-technical Systems. In Proceedings of the Enterprise Interoperability VIII; Popplewell, K., Thoben, K.D., Knothe, T., Poler, R., Eds.; Springer International Publishing: Cham, Switzerland, 2019; pp. 119–129. [Google Scholar]
  33. De Nicola, A.; Missikoff, M. A Lightweight Methodology for Rapid Ontology Engineering. Commun. ACM 2016, 59, 79–86. [Google Scholar] [CrossRef] [Green Version]
  34. Missikoff, M.; Schiappelli, F.; Taglino, F. A Controlled Language for Semantic Annotation and Interoperability in e-Business Applications. In Proceedings of the 2nd International Semantic Web Conference, Semantic Integration Workshop—ISWC2003, Sanibel Island, FL, USA, 20–23 October 2003; Doan, A., Halevy, A., Noy, N., Eds.; Number 994 in CEUR Workshop Proceedings. CEUR-WS.org: Aachen, Germany, 2003. [Google Scholar]
  35. Codescu, M.; Horsinka, G.; Kutz, O.; Mossakowski, T.; Rau, R. OSMonto—An Ontology of OpenStreetMap Tags. In Proceedings of the State of the Map Europe (SOTM-EU) 2011, Vienna, Austria, 15–17 July 2011. [Google Scholar]
  36. De Nicola, A.; Melchiori, M.; Villani, M.L. Creative Design of Emergency Management Scenarios Driven by Semantics: An Application to Smart Cities. Inf. Syst. 2019, 81, 21–48. [Google Scholar] [CrossRef]
  37. Gazzetta Ufficiale della Repubblica Italiana. All. D—Requisiti Operativi Minimi Degli Istituti di Vigilanza e Regole Tecniche Dei Servizi (Art. 257, Commi 3 e 4 Del Regolamento di Esecuzione)-Supplemento Ordinario Alla “Gazzetta Ufficiale” n. 36 Del 14 Febbraio 2011—Serie Generale. 2011. Available online: https://www.gazzettaufficiale.it/eli/gu/2011/02/14/36/so/37/sg/pdf (accessed on 1 December 2022).
Figure 1. Architecture of the SiTer Crime Prevention System.
Smartcities 06 00010 g001
Figure 2. Deployment of the risk of system aspect design pattern in TERMINUS Crime to address the peculiarities of crime risks of private and public urban services.
Smartcities 06 00010 g002
Figure 3. TERMINUS Crime in the Protégé ontology management system.
Smartcities 06 00010 g003
Figure 4. Semantic annotation process of OpenStreetMap POIs with TERMINUS Crime.
Smartcities 06 00010 g004
Figure 5. Identification of POIs affected by crime risks.
Smartcities 06 00010 g005
Figure 6. Window including information on a POI retrieved from the TERMINUS ontology through SPARQL queries.
Smartcities 06 00010 g006
Figure 7. Graphical software interface.
Smartcities 06 00010 g007
Table 1. Query to retrieve the system aspect associated with all the POIs in a given area.
    Query Description: Retrieve the <<System aspect>> of all the POIs.
    SPARQL code:
     Select Distinct ?aspect
     Where {
     ?event rdfs:subClassOf tr:Critical_event_of_system .
     ?event rdfs:subClassOf ?s1 .
     ?s1 owl:onProperty tr:concerning .
     ?s1 owl:someValuesFrom ?aspect .
     ?aspect rdfs:subClassOf tr:System_aspect .
     }
     Order by ?aspect
    Example of result:
     System aspect
     tr:ATM_card
     tr:Aggregation_and_socialisation_area
     ...
Table 2. Example of generative query aimed at figuring out all the possible <<Critical events of system>> related to an <<Anthropic hazard>> provided as input via the variable var1.
Query Description: Figure out All the Possible <<Critical Events of System>> Related
to an <<Anthropichazard>> Provided as Input via the Variable var1.
SPARQL code:
Select Distinct ?event
Where {
?poi rdfs:subClassOf tr:System .
?poi rdfs:subClassOf ?s2 .
?s2 owl:onProperty tr:havingCriticalEvent .
?s2 owl:someValuesFrom ?event .
?event rdfs:subClassOf tr:Critical_event_of_system .
tr:" + var1 + " rdfs:subClassOf tr:Anthropic_hazard .
tr:" + var1 + " rdfs:subClassOf ?s3 .
?s3 owl:onProperty tr:havingImpact .
?s3 owl:someValuesFrom ?event .
?poi rdfs:subClassOf ?s4 .
?s4 owl:onProperty tr:havingHazard .
?s4 owl:someValuesFrom tr:" + var1 + " .
}
Order by ?event
Example of result:
event
tr:Branch_closure
tr:Branch_with_reduced_operations
...
Table 3. List of POI types identified for the city of Syracuse.
Archaeological siteBankBeach resort
Bus stopsCathedralChurch
CinemaDrinking water systemElectric generator
Electrical substationFire stationFuel sale
Gas cylinder dealerGovernment officeGrandstand
HelipadHighways and junctionsHistorical monument
HospitalJewelryKindergarten
LighthouseMarketplaceMuseum
National policePetrol stationPharmacy
PierPipelinePlace of worship
PlaygroundPost officePrison
Public buildingPyrotechnic material for saleRailway station
SchoolShopping centerSilo
Storage tankTobacco storeTown hall
Transmission lineWarehouseWooded area
Table 4. Examples of ontology axioms included for the Syracuse case study.
Object PropertyAxiom
havingSystemAspectbankhavingSystemAspectsomefinancial intermediation
havingImpactbank robberyhavingImpactsomeATM out of service
concerningpanicconcerningsomereligious celebration
havingVulnerabilitylighthouse towerhavingVulnerabilitysomepoor surveillance
havingInterestOnbank customerhavingInterestOnsomecash dispenser
havingHazardcathedralhavingHazardsometerrorist attack
havingCriticalEventbankhavingCriticalEventsomelack of money
Table 5. Risk mini-model for a bank generated by the Crime Prevention System.
SystemSystem ServiceVulnerability
BankCash dispenserBank in isolated area
Anthropic HazardCritical Event of SystemStakeholder
Removal of ATM due to thievesFailure to dispense money from the ATMBank manager
Table 6. Risk mini-model for a police station generated by the Crime Prevention System.
SystemCommonsVulnerability
Police stationCitizens protectionPresence of explosive material in a police station
Anthropic HazardCritical Event of SystemStakeholder
Blocking of the road in front of the police station due to a strikeCasualtiesCitizens
Table 7. Risk mini-model for an electric generator generated by the Crime Prevention System.
SystemSystem OperationVulnerability
Electric generatorElectricity supplyFew maintenance workers
Anthropic HazardCritical Event of SystemStakeholder
Crime explosionInterruption of electricity supplyElectric service user
Table 8. Risk mini-model for a hospital generated by the Crime Prevention System.
SystemAssetVulnerability
HospitalHospital interior furnishingsFailure to identify routes accessible only to staff
Anthropic HazardCritical Event of SystemStakeholder
Damage in hospitalLimited or no hospital operationsFacility manager
Table 9. Risk mini-model for a school generated by the Crime Prevention System.
SystemInfrastructureVulnerability
SchoolSchool desks and chairsSmall number of school desks and chairs
Anthropic HazardCritical Event of SystemStakeholder
VandalismSuspension of teaching activitiesStudent
Disclaimer/Publisher’s Note: The statements, opinions and data contained in all publications are solely those of the individual author(s) and contributor(s) and not of MDPI and/or the editor(s). MDPI and/or the editor(s) disclaim responsibility for any injury to people or property resulting from any ideas, methods, instructions or products referred to in the content.

