1. Introduction
With the advent of commercial Unmanned Aerial Vehicles (UAVs), drone detection has become more of a necessity in recent years. The remote operative capabilities of UAVs pose threats to security, privacy, and other potential legal issues. Additionally, the number of applications for UAVs has also increased, spanning recreational, commercial, and military uses. Nowadays, state-of-the-art drones even possess wireless networking capabilities. Most modern drones are equipped with video cameras and can even deliver small packages. The relatively cheap costs of UAVs paired with remote operability allows anyone to become a pilot with low risk to their health. If used incorrectly, many hazards may be overlooked and the degree of risk involved increases.
Although guidelines have been created by the FAA for remote pilots, the ease of access to these systems can prove to be dangerous. People with malicious intentions pay no heed to the warnings and rules created by the FAA. For example, in 2018, hundreds of flights were canceled at Gatwick Airport due to a drone sighting close to the runway, causing flight delays of two days [
1]. Methods for detecting drones in the past include acoustic, optical, and radar methods. RCS-based radar methods, such as high-resolution range profiles and synthetic aperture radar, can be difficult when considering the close RCS values of birds and drones. To avoid this, we investigated the benefits of using micro-Doppler signatures from targets using a CW radar system. In addition to detecting the flying target, it is possible to discern the type of target (bird or drone) based on their micro-motions such as propeller blade spinning or bird wing flapping. Using the short-time Fourier transform (STFT), we generated time-frequency plots called spectrograms to observe the individual micro-Doppler characteristics. The classification efforts involved the overall Doppler bandwidth spread, base velocity, and cycle frequency.
Fortunately, the Federal Aviation Administration (FAA) created the Part 107 regulations for commercial small UAVs in June 2016. These regulations require UAV pilots to register their UAVs if they weigh over 250 g [
2]. In addition, the pilot must carry a small UAV operator license, which can be obtained after passing the Part 107 exam. This exam covers a wide range of information regarding UAV safety. Some topics include UAV limitations, flight operations, airspace classification and operating requirements, flight restrictions, weather awareness, emergency procedures, radio communication procedures, and more.
State-of-the-art techniques for detecting drones include acoustic [
3,
4], optical camera [
5,
6], lidar [
7,
8], and radar [
9,
10,
11]. Despite the wide range of sensing practices, there are several trade-offs associated with each method. In
Table 1, the advantages and disadvantages of sensing drones with acoustics, cameras, lidar, and radar sensors are listed.
Some of the advantages of acoustics include no line-of-sight (LOS) requirements, effective performance in low-visibility conditions, and relatively low implementation costs. However, in noisy conditions, such as windy gusts, microphones will not be able to distinguish or detect drones. Using cameras for detecting targets is advantageous due to their high accuracy and easy operability. Although it is easy to detect flying targets, it is difficult to classify the subject further. There is also a high cost associated with using and maintaining cameras. Lidar sensing is an accurate method for detecting targets, but the cons greatly outweigh the pros. They are expensive, have a narrow LOS, and are heavily weather-dependent. Finally, radar sensing provides an effective method for detection due to the low cost of implementation and robustness of operability. The biggest weakness of using radar is that such targets tend to have a low radar cross section (RCS) or visibility, which can hinder their ability to detect them.
RCS-based radar methods such as high-resolution range profiles and synthetic aperture radar (SAR) can be difficult when considering the similar RCS values of birds and drones [
12,
13,
14,
15]. To avoid this, the benefits of leveraging the micro-Doppler signatures from targets were investigated using a continuous-wave (CW) radar system. Through processing algorithms, it was possible to discern the type of target (bird or drone) based on their micro-motions, such as spinning of propeller blades or flapping of bird wings.
For automatic target recognition (ATR) purposes, many recent studies have utilized machine learning to classify images of micro-Doppler signatures between drones and birds. Unfortunately, the lack of real-world data makes improving classification efforts difficult.
The remainder of this paper is structured as follows:
Section 2 discusses the concepts and theory related to the micro-Doppler features of birds and drones.
Section 3 describes our simulation setup and results in order to provide an understanding of the experimental data.
Section 4 discusses the design and operational characteristics of the constructed 10-GHz radar systems.
Section 5 outlines the experimental setup and the results obtained. In
Section 6, the classification setup and processing tactics are described. In
Section 7, the conclusions are presented with possible directions for future research. In this paper, please note that “UAV” and “drone” are used interchangeably.
2. General Characteristics of Micro-Doppler Signatures from Birds and Drones
As is well known, the reflected signal from a target that is in motion relative to a radar contains a frequency shift relative to the transmit frequency due to the well-known Doppler effect [
16]. Quite simply, if
is the transmit frequency of a monostatic radar (i.e., transmitter and receiver collocated, as is the usual case), for a target moving at a speed of
at an angle of
towards the radar, the Doppler frequency shift
is given by
, where
is the transmit wavelength. The radial velocity
is given by
. For directly approaching targets,
, the Doppler shift is positive, whereas for directly receding targets,
, the Doppler shift is negative. For a stationary target (
) or for a target moving at right angles to the LOS to the radar (
), the Doppler shift is zero.
In many cases, a structural component attached to a target may exhibit micromotions in addition to the main motion of the object (including zero bulk motion). Micromotions can be caused by small movements around the rest position, such as vibration, oscillation, rotation, swinging, flapping, flutter, etc. [
17]. The source of micromotion may be a revolving surface, such as the rotor blades of a drone, or a vibrating surface, such as the swinging arms and legs of a walking human, or the flapping wings of a bird, for example.
These micromotions induce frequency modulations in the main Doppler frequency shift caused by the bulk motion of the target. Micromotions consisting of pure periodic vibration or rotation generate Doppler frequency shifts around the central Doppler-shifted carrier frequency and appear as sidebands. The modulation contains harmonic frequencies determined by the carrier frequency, the vibration or rotation rate, and the angle between the direction of vibration and the direction of the incident wave. The time-varying frequency modulations provide unique signatures of the object for further classification, recognition, and identification.
Micro-Doppler signatures of birds and drone targets are characterized by sinusoidal modulation owing to the periodic motion of the rotating blades of drones and UAVs and the flapping wings of birds [
18]. The modulation frequency of drones and UAVs is higher by one order of magnitude compared to that of birds because these targets contain high-speed rotation blades. Since the number of blades on a drone is usually an even number, when a blade approaches the radar, another blade recedes from the radar; thus, its micro-Doppler signature spectrogram is symmetric. In contrast, both wings flap up and down for birds at the same time; thus, their spectrograms are asymmetric.
The main source of micro-Doppler signatures from birds arises from the oscillatory motion of their flapping wings. The frequency of the Doppler fluctuations is primarily related to the wing flapping (or wingbeat) frequency and its harmonics [
19,
20]. Periodic fluctuations in signal intensity are attributed to changes in body shape due to flapping [
19]. In addition, periodic intensity modulations can be caused by the appearance and disappearance of the “corner reflector effect” caused by the wings as they flap to and fro [
20]. Therefore, the unique micro-Doppler signatures of birds are caused by several mechanisms. The micro-Doppler spread of a bird is quite narrow, and its characteristic signature takes the form of periodic flashes corresponding to the wingbeat frequency [
9]. The micro-Doppler signatures of birds depend on their size, wingspan, wing flapping frequency, radar frequency, and viewing angle.
In the case of drones and UAVs, the spinning of the rotor blades is the primary cause of their micro-Doppler signatures [
21,
22]. The rotation is deterministic and controlled, and coupled with the fact that these targets have a high RCS, their micro-Doppler signatures are clean, symmetric, and recognizable compared to those of birds. Assuming pure periodic rotation, the micromotion dynamics generate sideband Doppler frequency shifts about the scattered signal. The modulation contains spectral components that depend on the vibration or rotation rate, the vibration amplitude, and the angle between the direction of vibration and the direction of the incident wave [
23]. A small asymmetry may be due to the asymmetry of the propellers, as the propeller that is moving towards the radar is curved in the opposite way with respect to the propeller moving away from the radar [
24]. The micro-Doppler signatures of drones depend on their size, number of propellers or rotors, rotational frequency, radar frequency, and viewing angle.
The unique signatures of birds and drones can be exploited not only to perform bird vs. drone classification but also to classify birds of different sizes and drones of different structures and types [
25,
26,
27,
28].
3. Simulated Micro-Doppler Signatures
3.1. Theoretical Considerations
The equation for Doppler frequency
for a rotating target is given by
where
is the radial velocity of the target, and
is the radar wavelength. The corresponding
for a 10-GHz carrier frequency is 3 cm. A rotor’s rotational velocity
in revolutions per second is related to the maximum
expected of the blade tip through
where
is the blade length. In the following simulations,
is modeled at 56 revolutions per second, which corresponds to a
value of 35.2 m/s for an
value of 10 cm. This maps to an expected maximum Doppler shift around 2.35 kHz occurring at the blade tips. It is assumed that the blade is along the LOS of the radar. Most UAVs have two or three blades associated with each rotor.
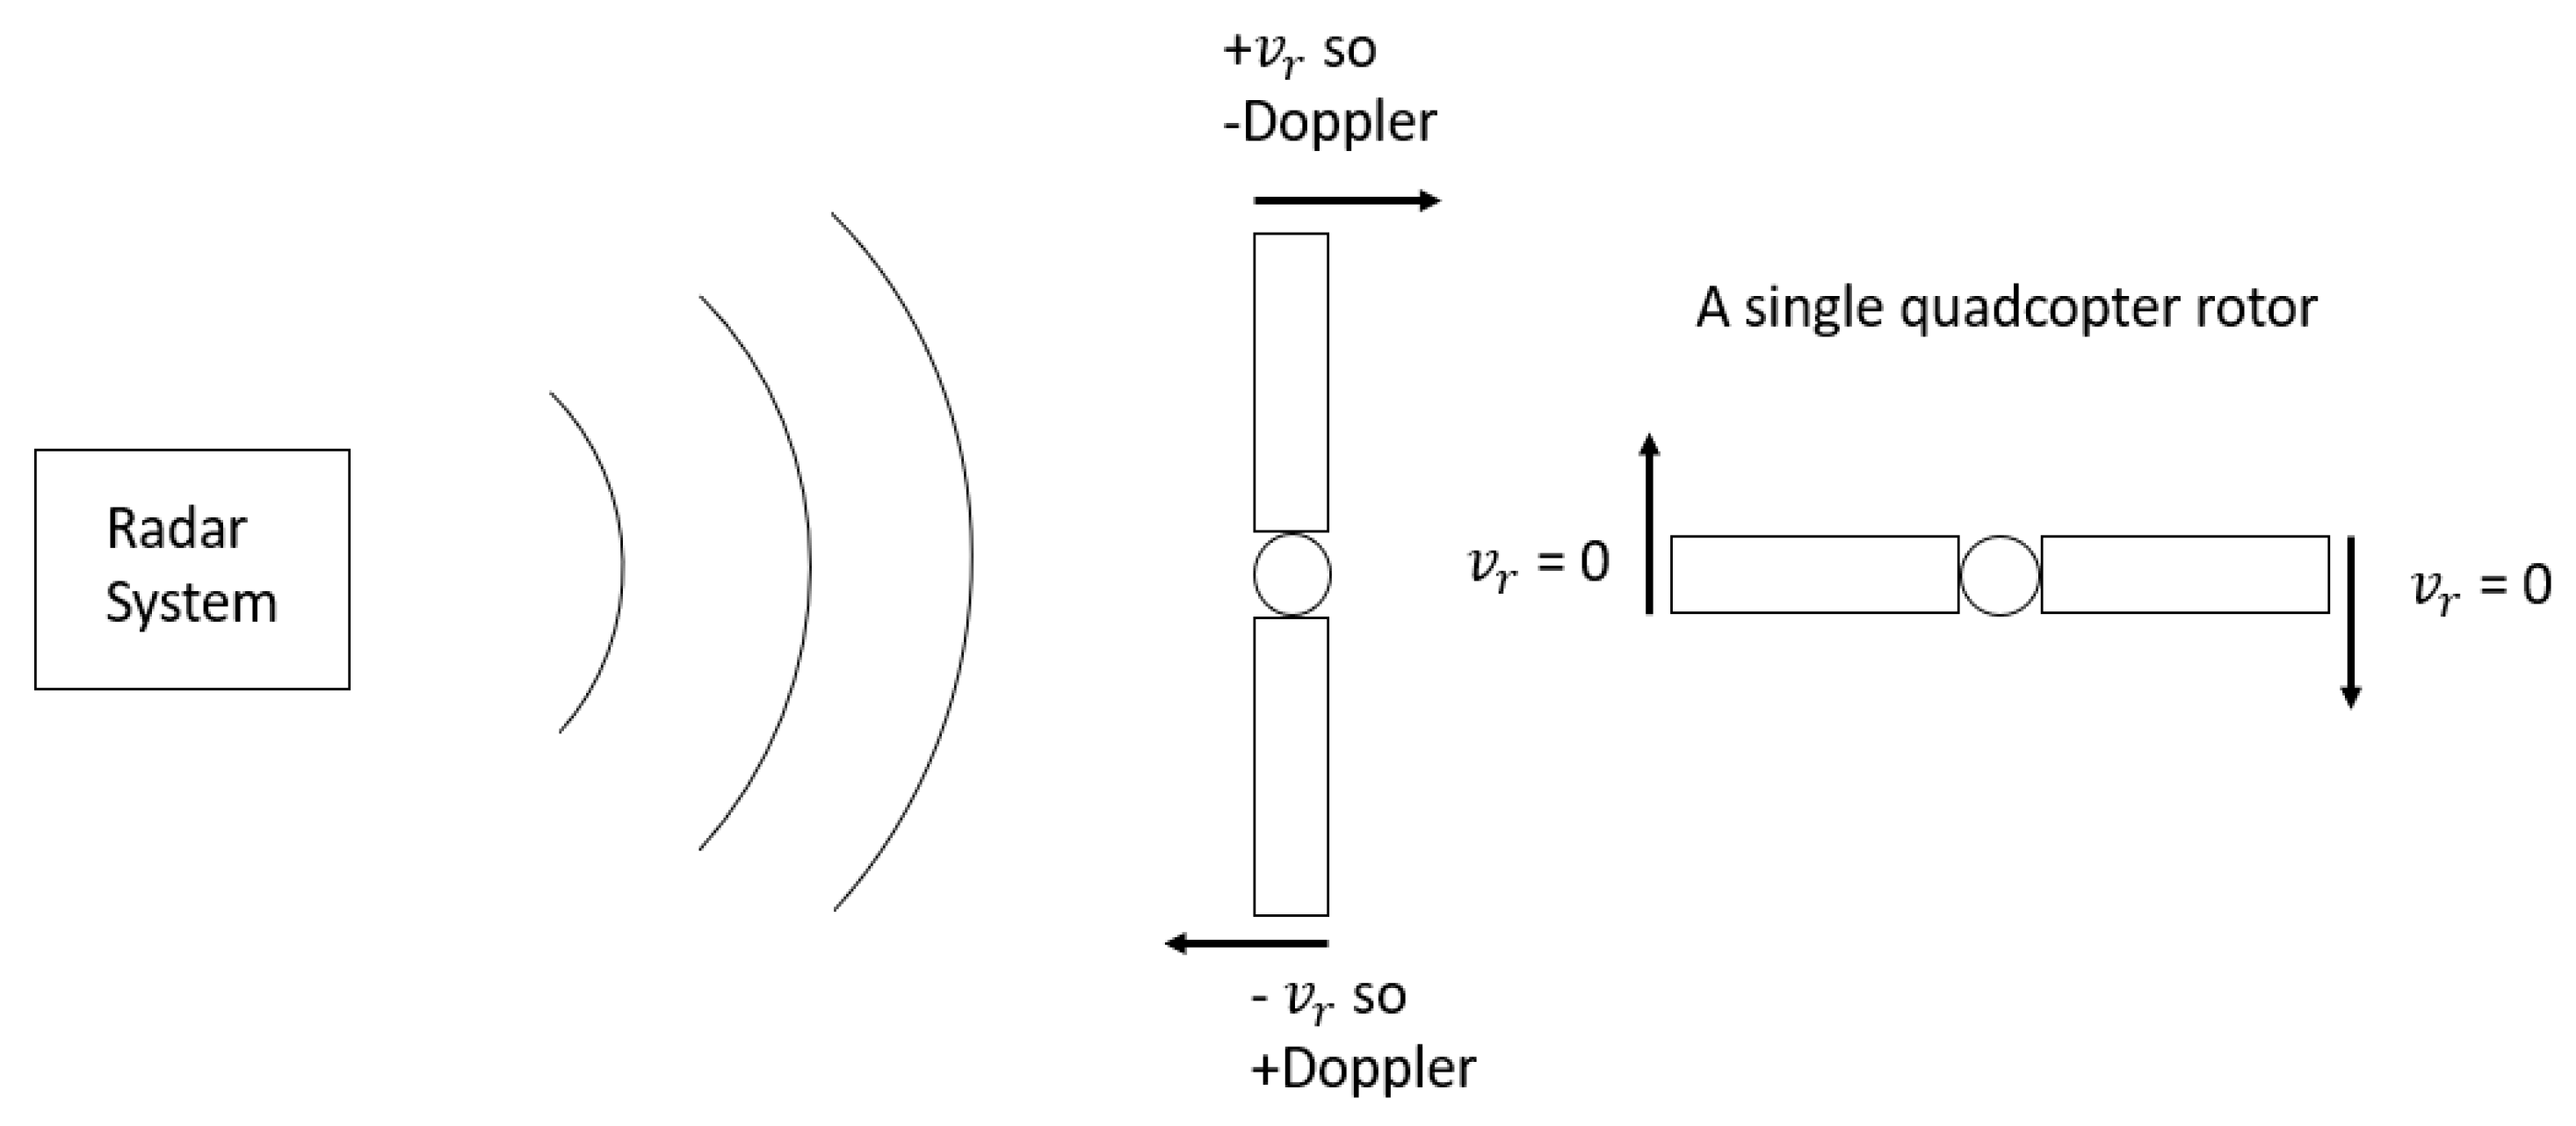
Figure 1 shows how the radial component of the rotating blade changes over time.
The radar system transmits a continuous signal at a single frequency. These signals bounce off the rotating propellers, and the radar receives these reflected signals. The radial velocity
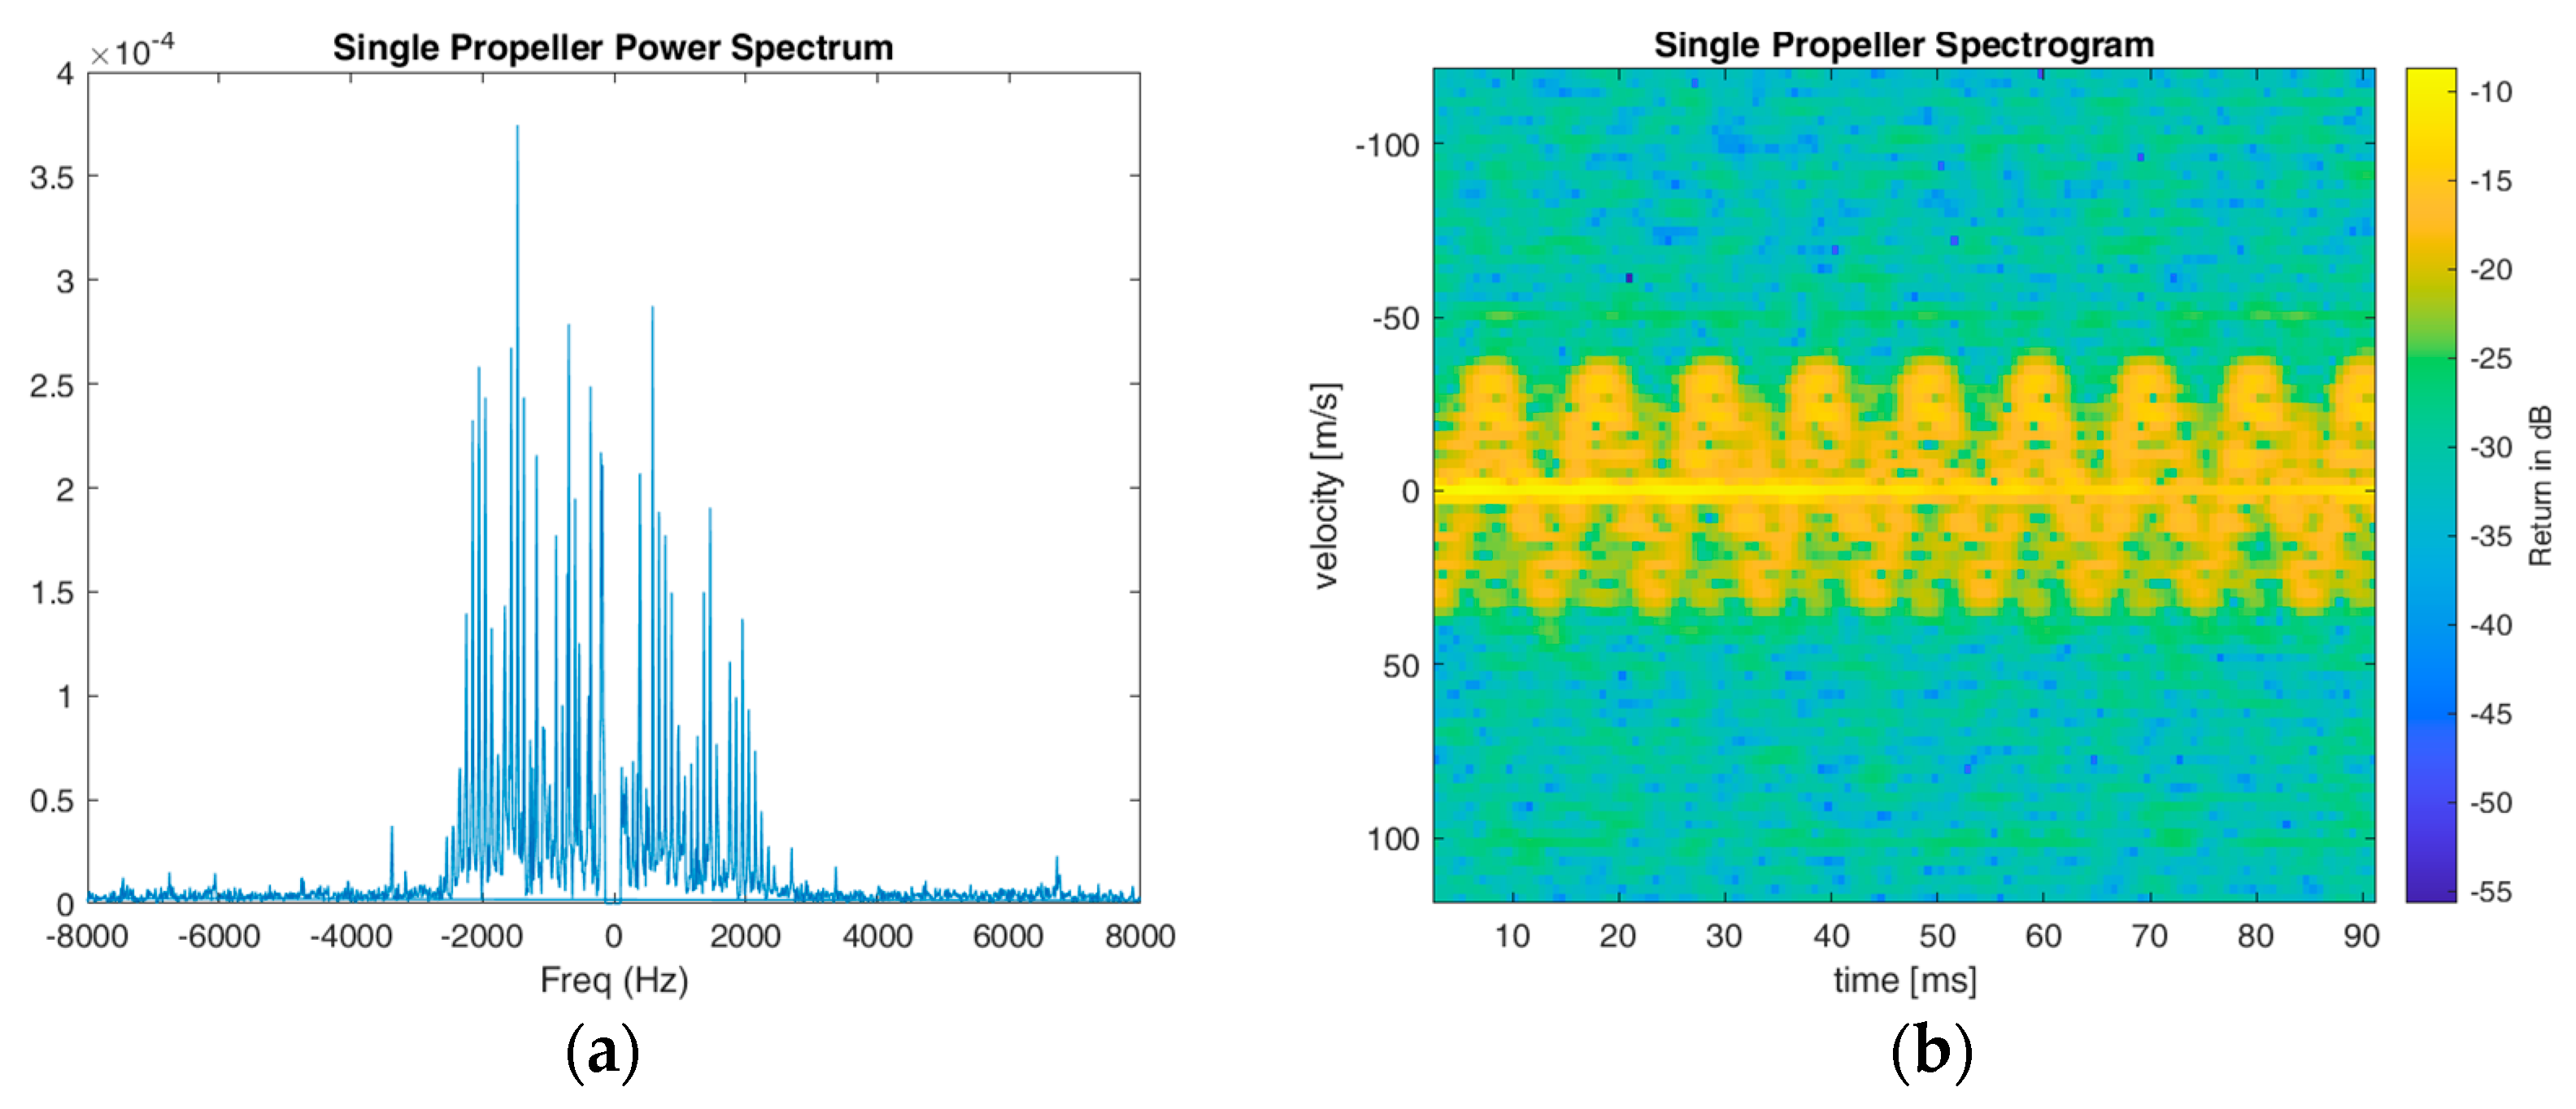
of the spinning blade tips does not remain constant, but the periodicity can be modeled with the use of a velocity-time plot and a spectrogram. In addition, a simple Fast Fourier Transform (FFT) of the raw data provides a power spectral density plot that denotes the peaks of frequencies, corresponding to the radial velocities observed within the recording. An FFT takes a window size of samples and computes the power spectral density of that instance. The spectrogram is known as the Short-Time Fourier Transform (STFT), which computes multiple FFTs and displays them as frequency or velocity over time. In
Figure 2, the power spectral density and the spectrogram of a single propeller are shown.
As the blade moves horizontally along the radar’s LOS, becomes 0. When the blade begins to move directly to or away from the radar, the maximum values are detected. A target moving towards the radar results in a positive (+) Doppler shift, whereas a target moving away results in a negative (−) Doppler shift. The maximum peaks in the power spectrum are around 2.5 kHz. In the resulting spectrogram, the maximum velocity is confirmed to be roughly 37.5 m/s which is per Equation (1).
Additional Doppler frequencies can be caused by the main body movement of the drone. For a moving drone, the maximum Doppler shift is given by
where
is the Doppler shift induced by the main body movement of the drone and
is the micro-Doppler shift due to the rotating blades. Furthermore, because the radar system measures radial velocity, the look angle from the radar to the target plays a vital role in the displayed Doppler frequency. Equation (3) can be rewritten as follows when considering the look angle dependence
where
is the angle between the drone velocity vector and the radar LOS.
The micro-Doppler characteristics of flying objects vary from target to target. For instance, a quadcopter signature will be different from a fixed plane or a helicopter. In addition, many surveillance systems confuse drones with birds due to their similar sizes and speeds. Conveniently, the micro-Doppler phenomenon is a great discriminator between the two classes. In birds, the micro-Doppler of the flapping pattern produces a periodic shape but is not as strong and quick as a drone. The rotation speed for a drone’s blades can exceed 6000 RPM, but the wing flaps of a bird are much slower. Through the implementation of spectrograms, the micro-Doppler signatures of different flying targets can be classified.
The mechanics of drones in flight are unique. By generating thrust through the rotation of the four motors, each with two blades attached, the UAVs can support their weight and ascend. Different combinations of rotation speeds result in different UAV flight motions. In this study, the weight and size of the target are discriminating factors for which the micro-Doppler signature belongs to which target. For heavier UAVs, more thrust is required to lift the drone, resulting in a higher detected micro-Doppler bandwidth.
3.2. Simulation Setup and Results
Before the data were collected experimentally, simulations were created to replicate the micro-Doppler detection scenario. These simulations were created in the MATLAB (R2021a) environment using the Radar Toolbox. The Radar Toolbox expediates and supports the simulation of radar systems through design, deployment, and field data analysis. First and foremost, constants were set for the initial simulation parameters. The simulation parameters are listed in
Table 2, denoting the setup for drone behavior throughout the detection process.
Using the phased toolkit, a rectangular waveform was used to simulate the CW behavior of the 10-GHz signal. The sampling rate and the Pulse Repetition Frequency (PRF) were at the same value of 44.1 kHz, the default sampling rate of a laptop’s audio card. By setting the sampling rate and the PRF to the same value with the pulse width equal to the inverse of the PRF, a 100% duty cycle was simulated.
Two antenna elements were used: one for transmission and one for reception. These antenna elements were spaced at half-wavelength (i.e., ) distances from each other. The transmit power used was 70.79 mW with a gain of 22 dB. The receiver preamplifier was set to a gain of 19 dB and a noise figure of 1.7 dB. The environment was free space, where the propagation speed was 3 × 10⁸ m/s.
The drone body was positioned at (10, 0, 10), where the z-axis is the height. The target velocity was 0 for all axes, meaning the drone was hovering in place. The drone behavior was simulated by consisting of the main body RCS of 0.3 m2 with four accompanying rotors, each evenly positioned 15 cm away from the body.
A for loop was created to simulate each ‘pulse’, sample. With each sample, the drone and each blade position were updated. The sample was transmitted to the target and reflected on the radar. The value was stored in an array until each sample was transmitted and received, summing up to 0.5 s.
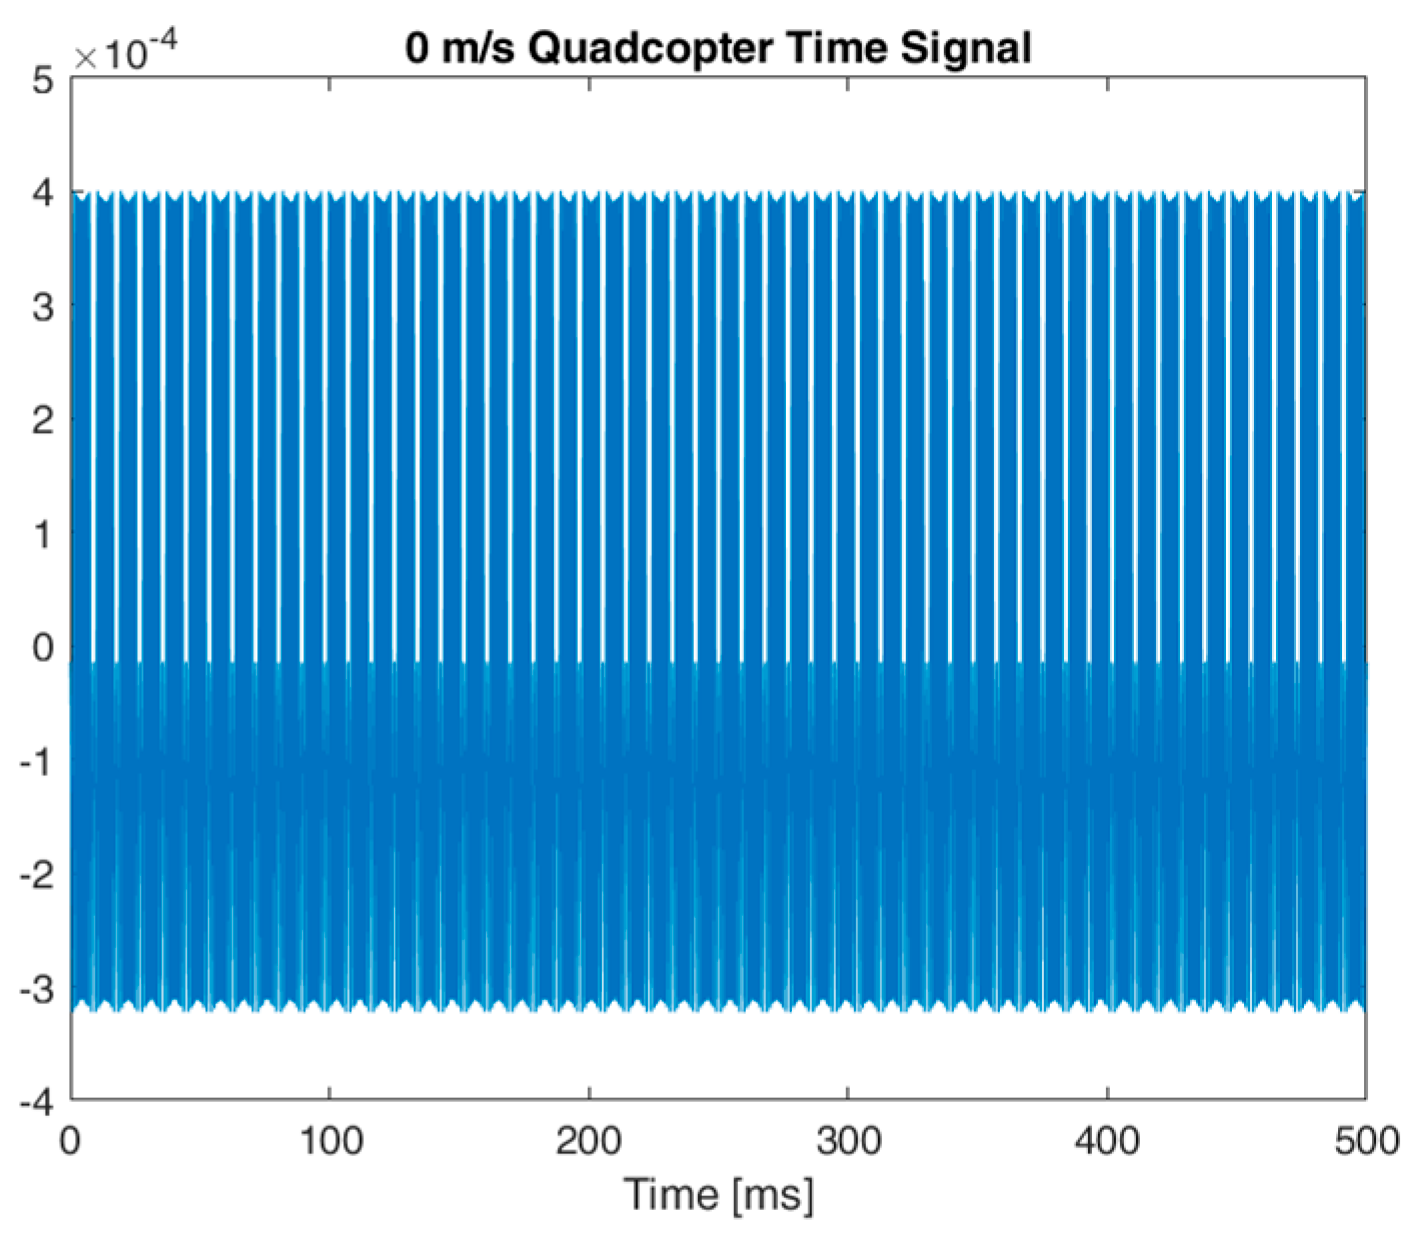
The first plot generated was a time plot shown in
Figure 3. This represents the raw values collected by the radar system.
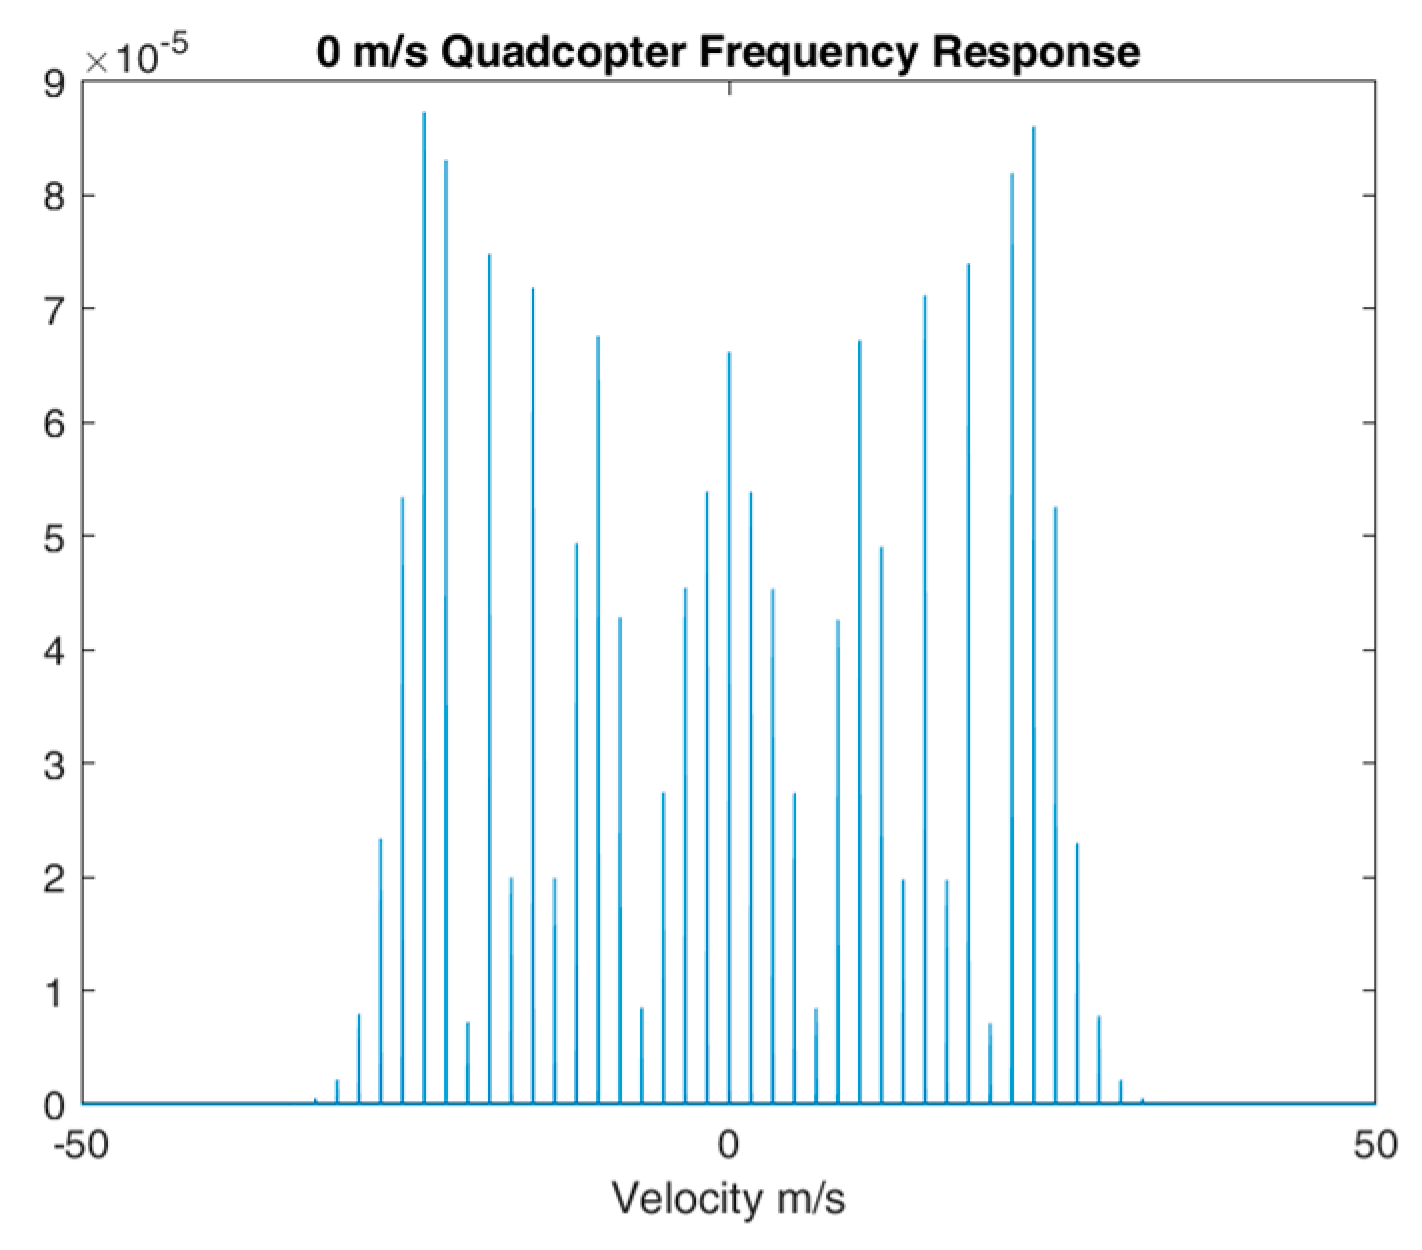
Subsequently, the Fast Fourier Transform (FFT) operation was performed on the time signal. Since the FFT is a cyclical process, the frequency axis was split into negative and positive frequencies. The Doppler frequency
axis was converted to velocity
using
. The frequency response is shown in
Figure 4. The maximum detectable velocity was around ±30.24 m/s but the strongest return was at ±23.52 m/s.
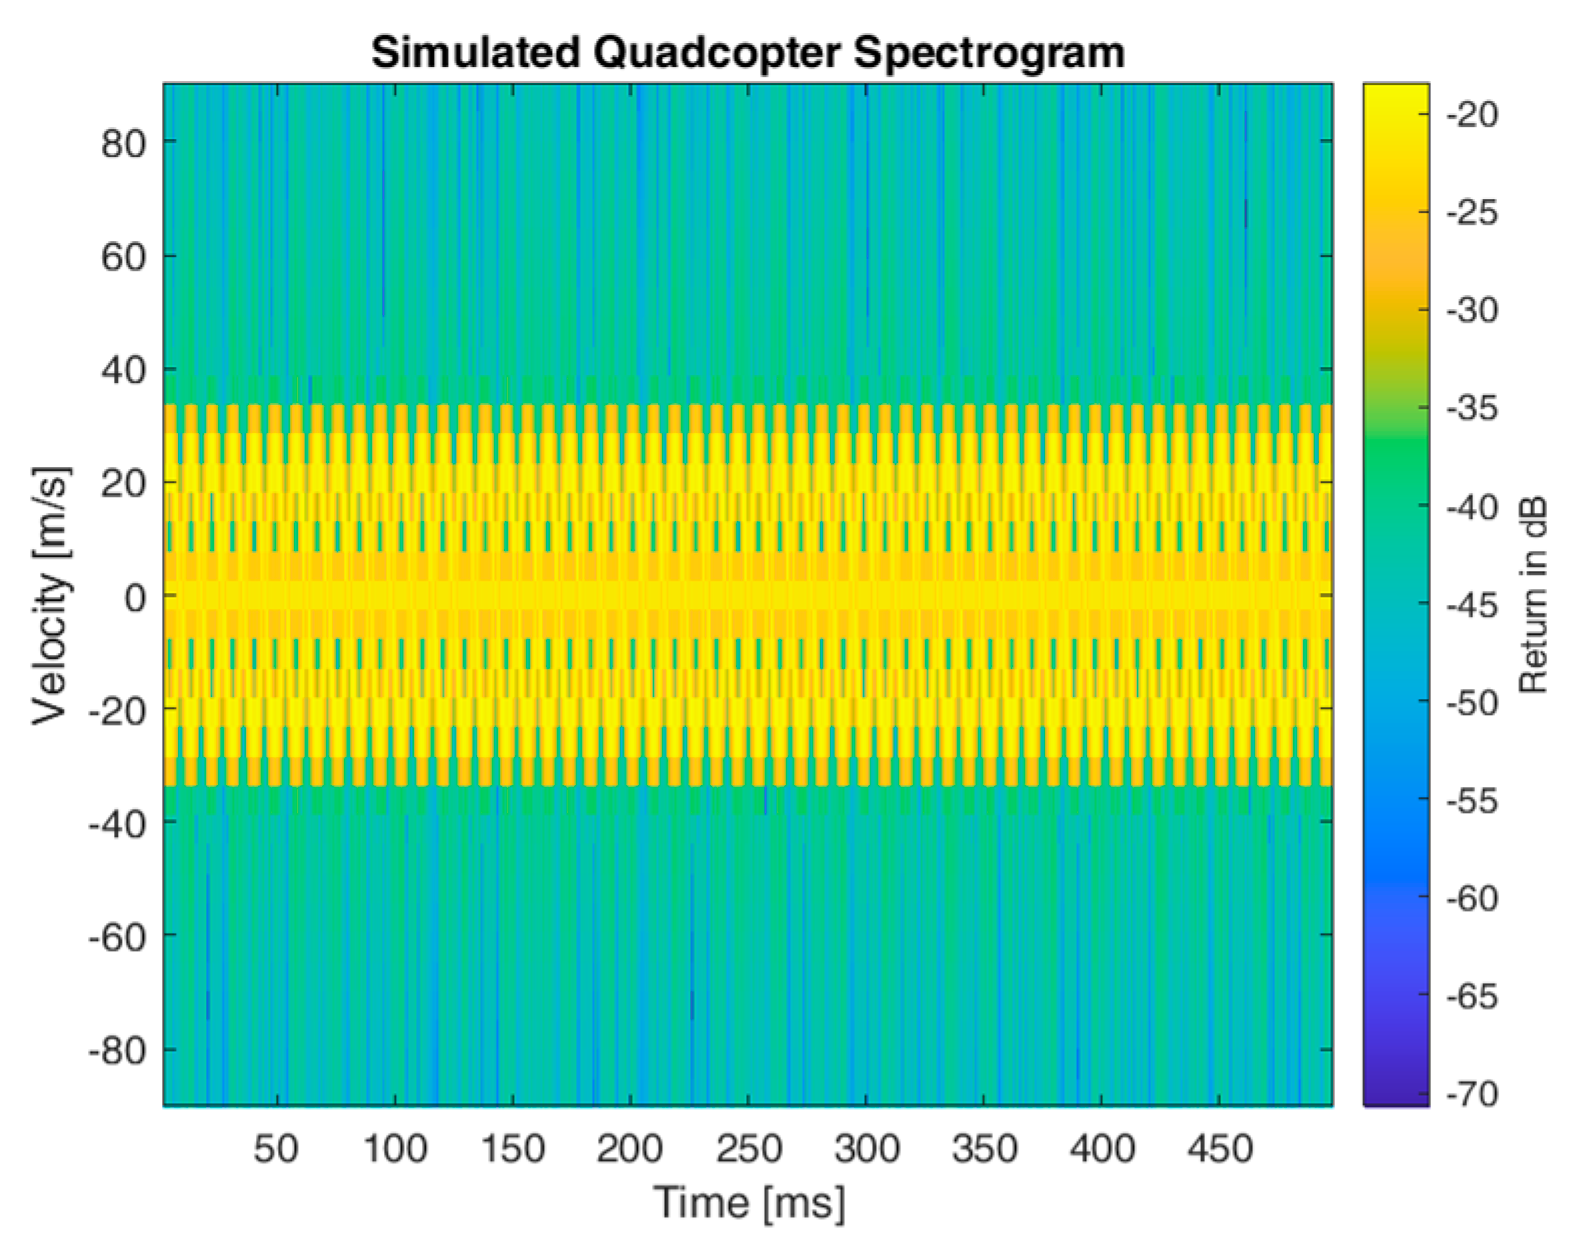
Finally, spectrograms were generated with a window size of 128 segments with 120 overlapping segments. The time axis, originally in seconds, was converted to milliseconds. The frequency axis was converted to velocity. The spectrogram in
Figure 5 accurately displays the micro-Doppler signature of the hovering quadcopter. Periodic maximum velocity values were observed, confirming the cyclical nature of the rotating blades.
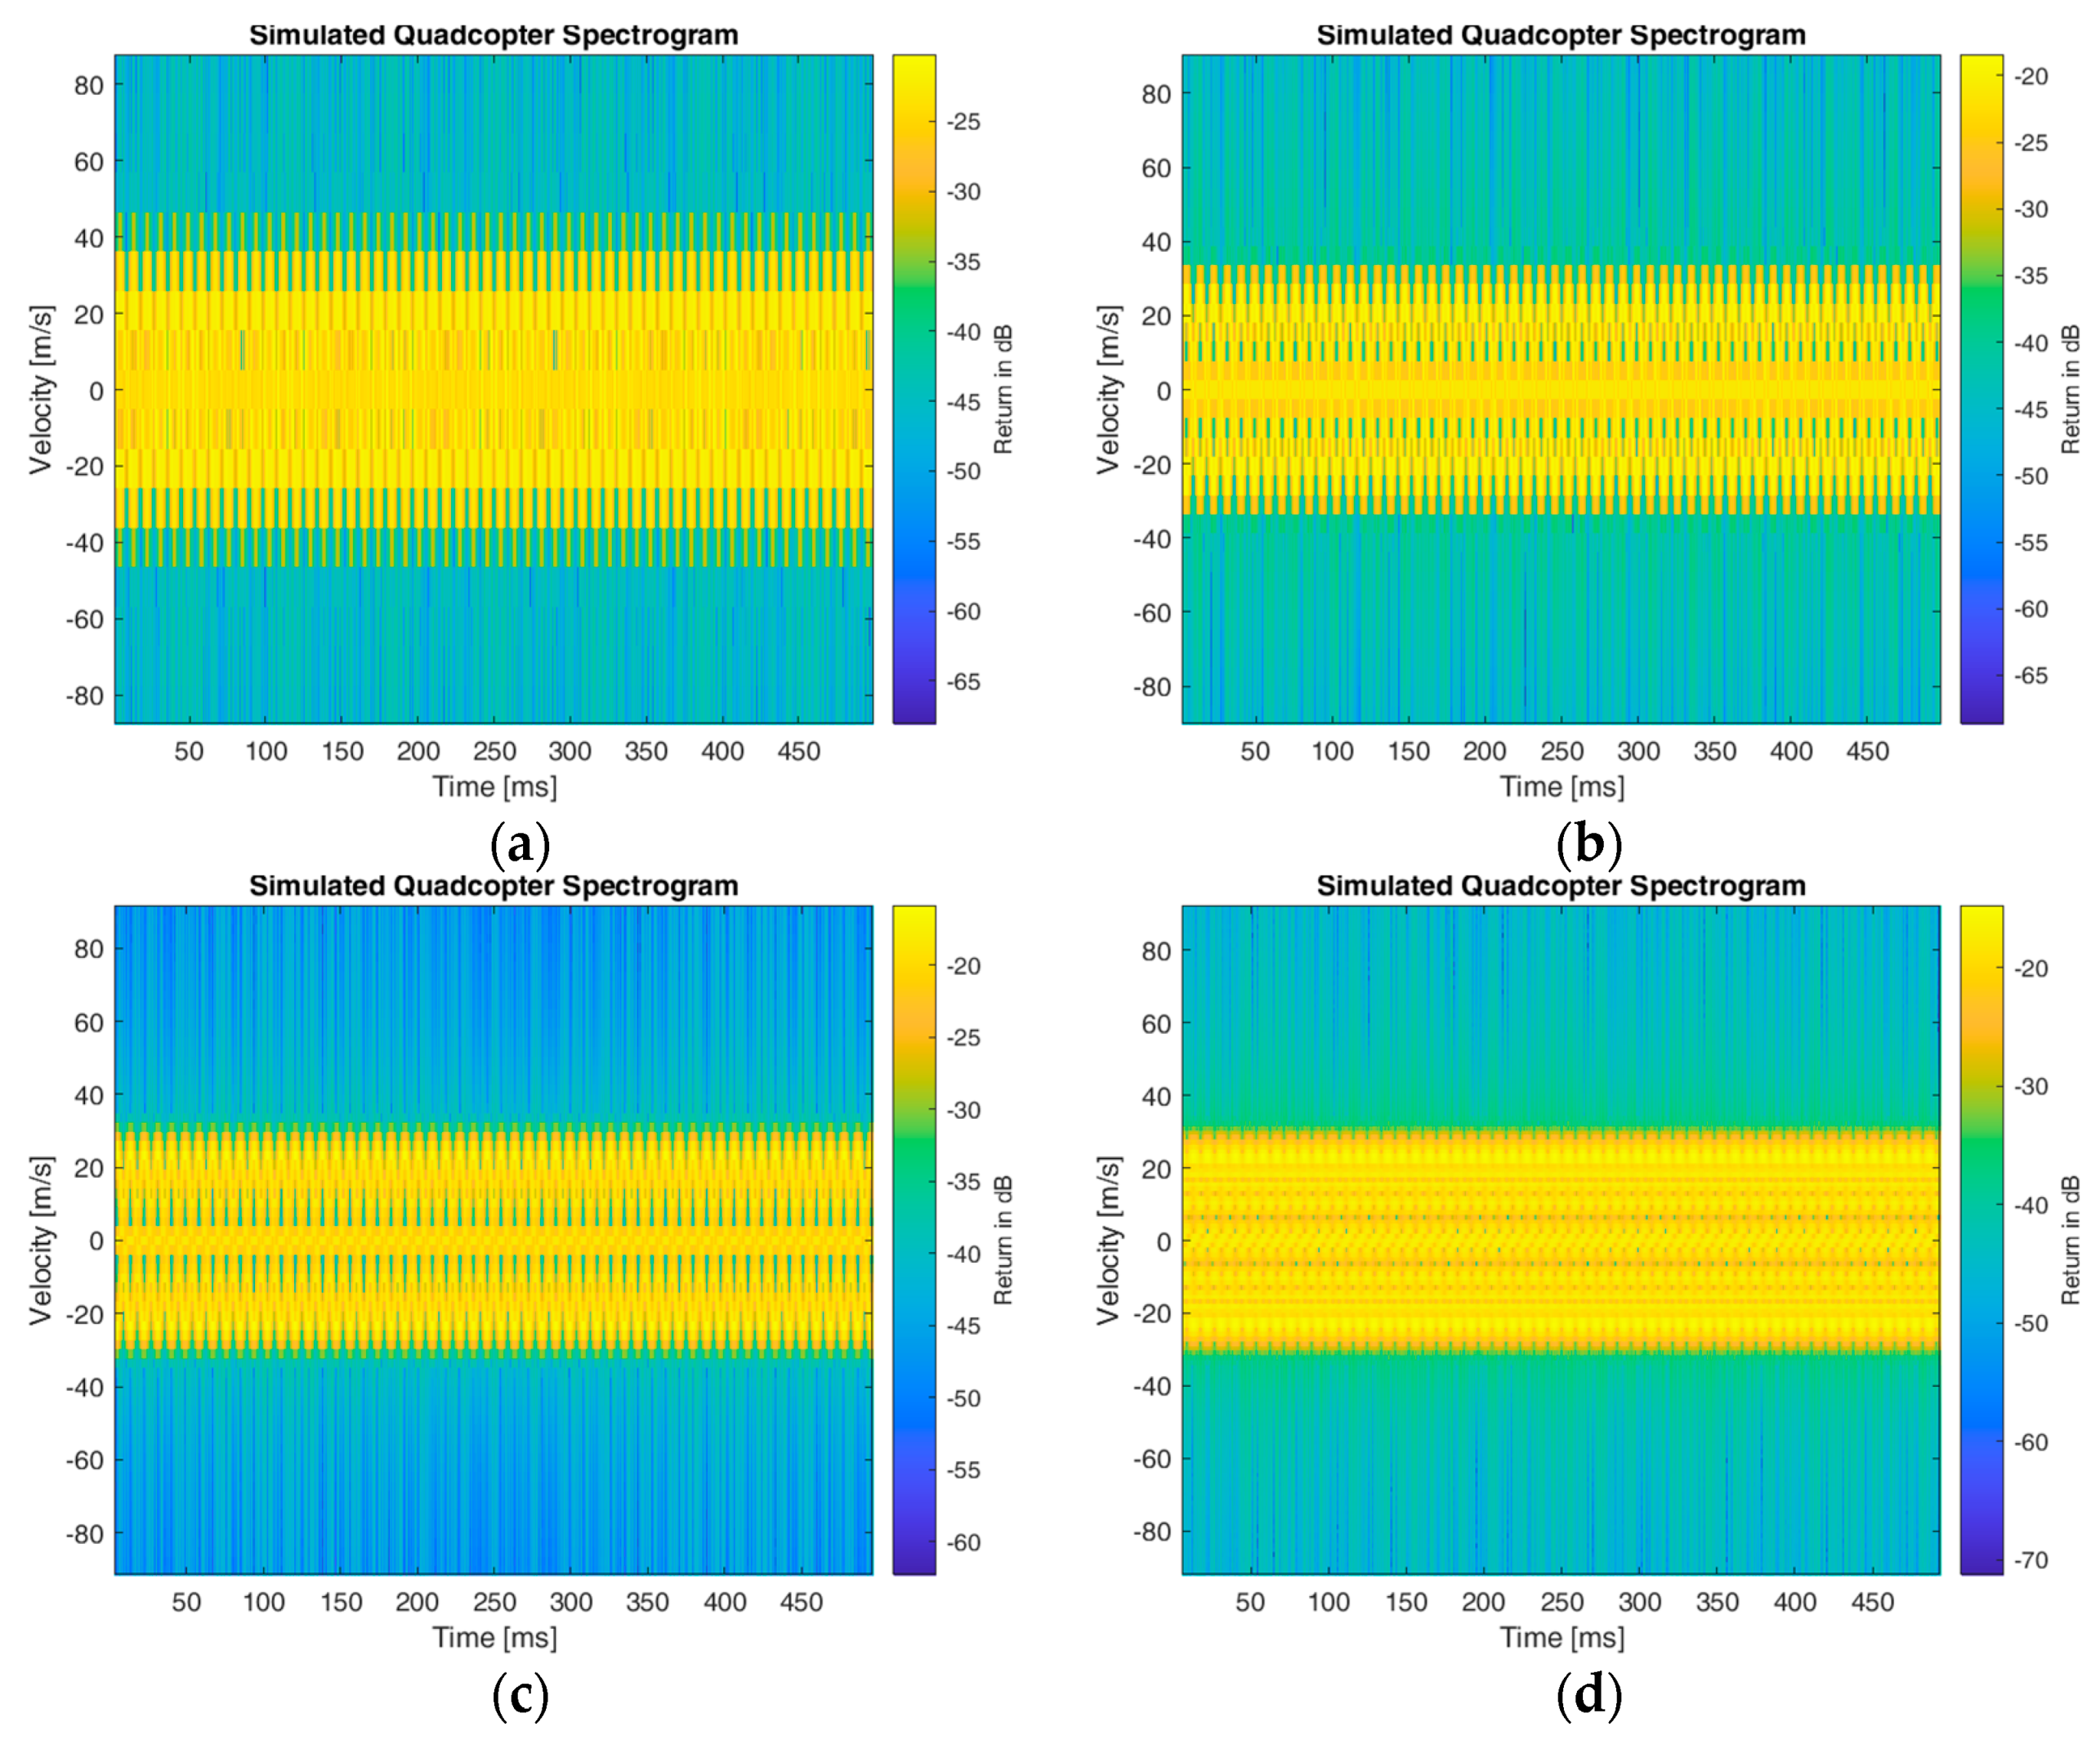
Figure 6 shows the simulated spectrograms for the different window sizes. By adjusting the window size
of the STFT, a tradeoff between the time resolution and Doppler resolution was observed. When the window size was set to 64 samples, the time resolution was very fine, emphasizing the micro-Doppler periodicity of each blade tip. However, the velocity readings spanned a range of values, resulting in ambiguity regarding the true Doppler velocity. On the other hand, with a window size of 512 segments, the time resolution became ambiguous, but the velocity measurements were finer and more precise. For the images generated for the datasets in this work, a window size of 128 segments was utilized.
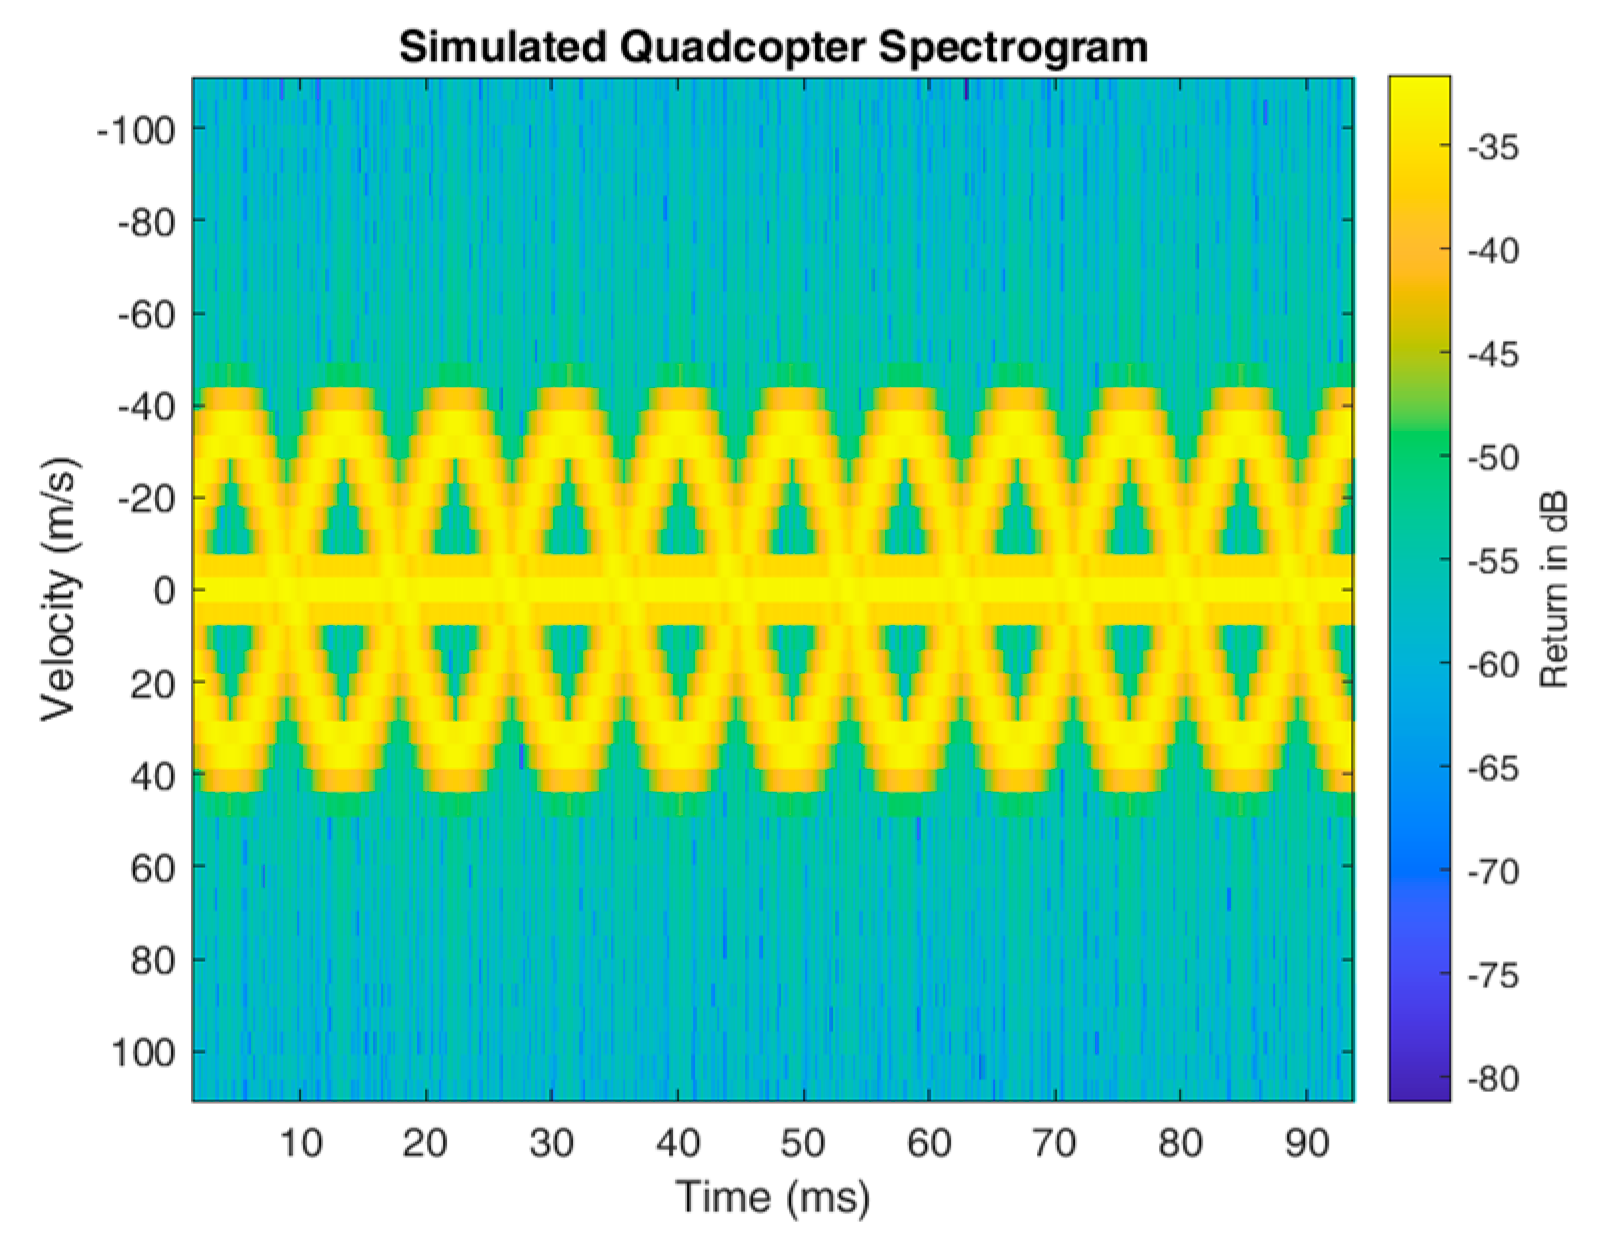
In
Figure 7, the integration time is lowered to emphasize the periodicity within the blade rotations. Peaks are detectable around ±40 m/s.
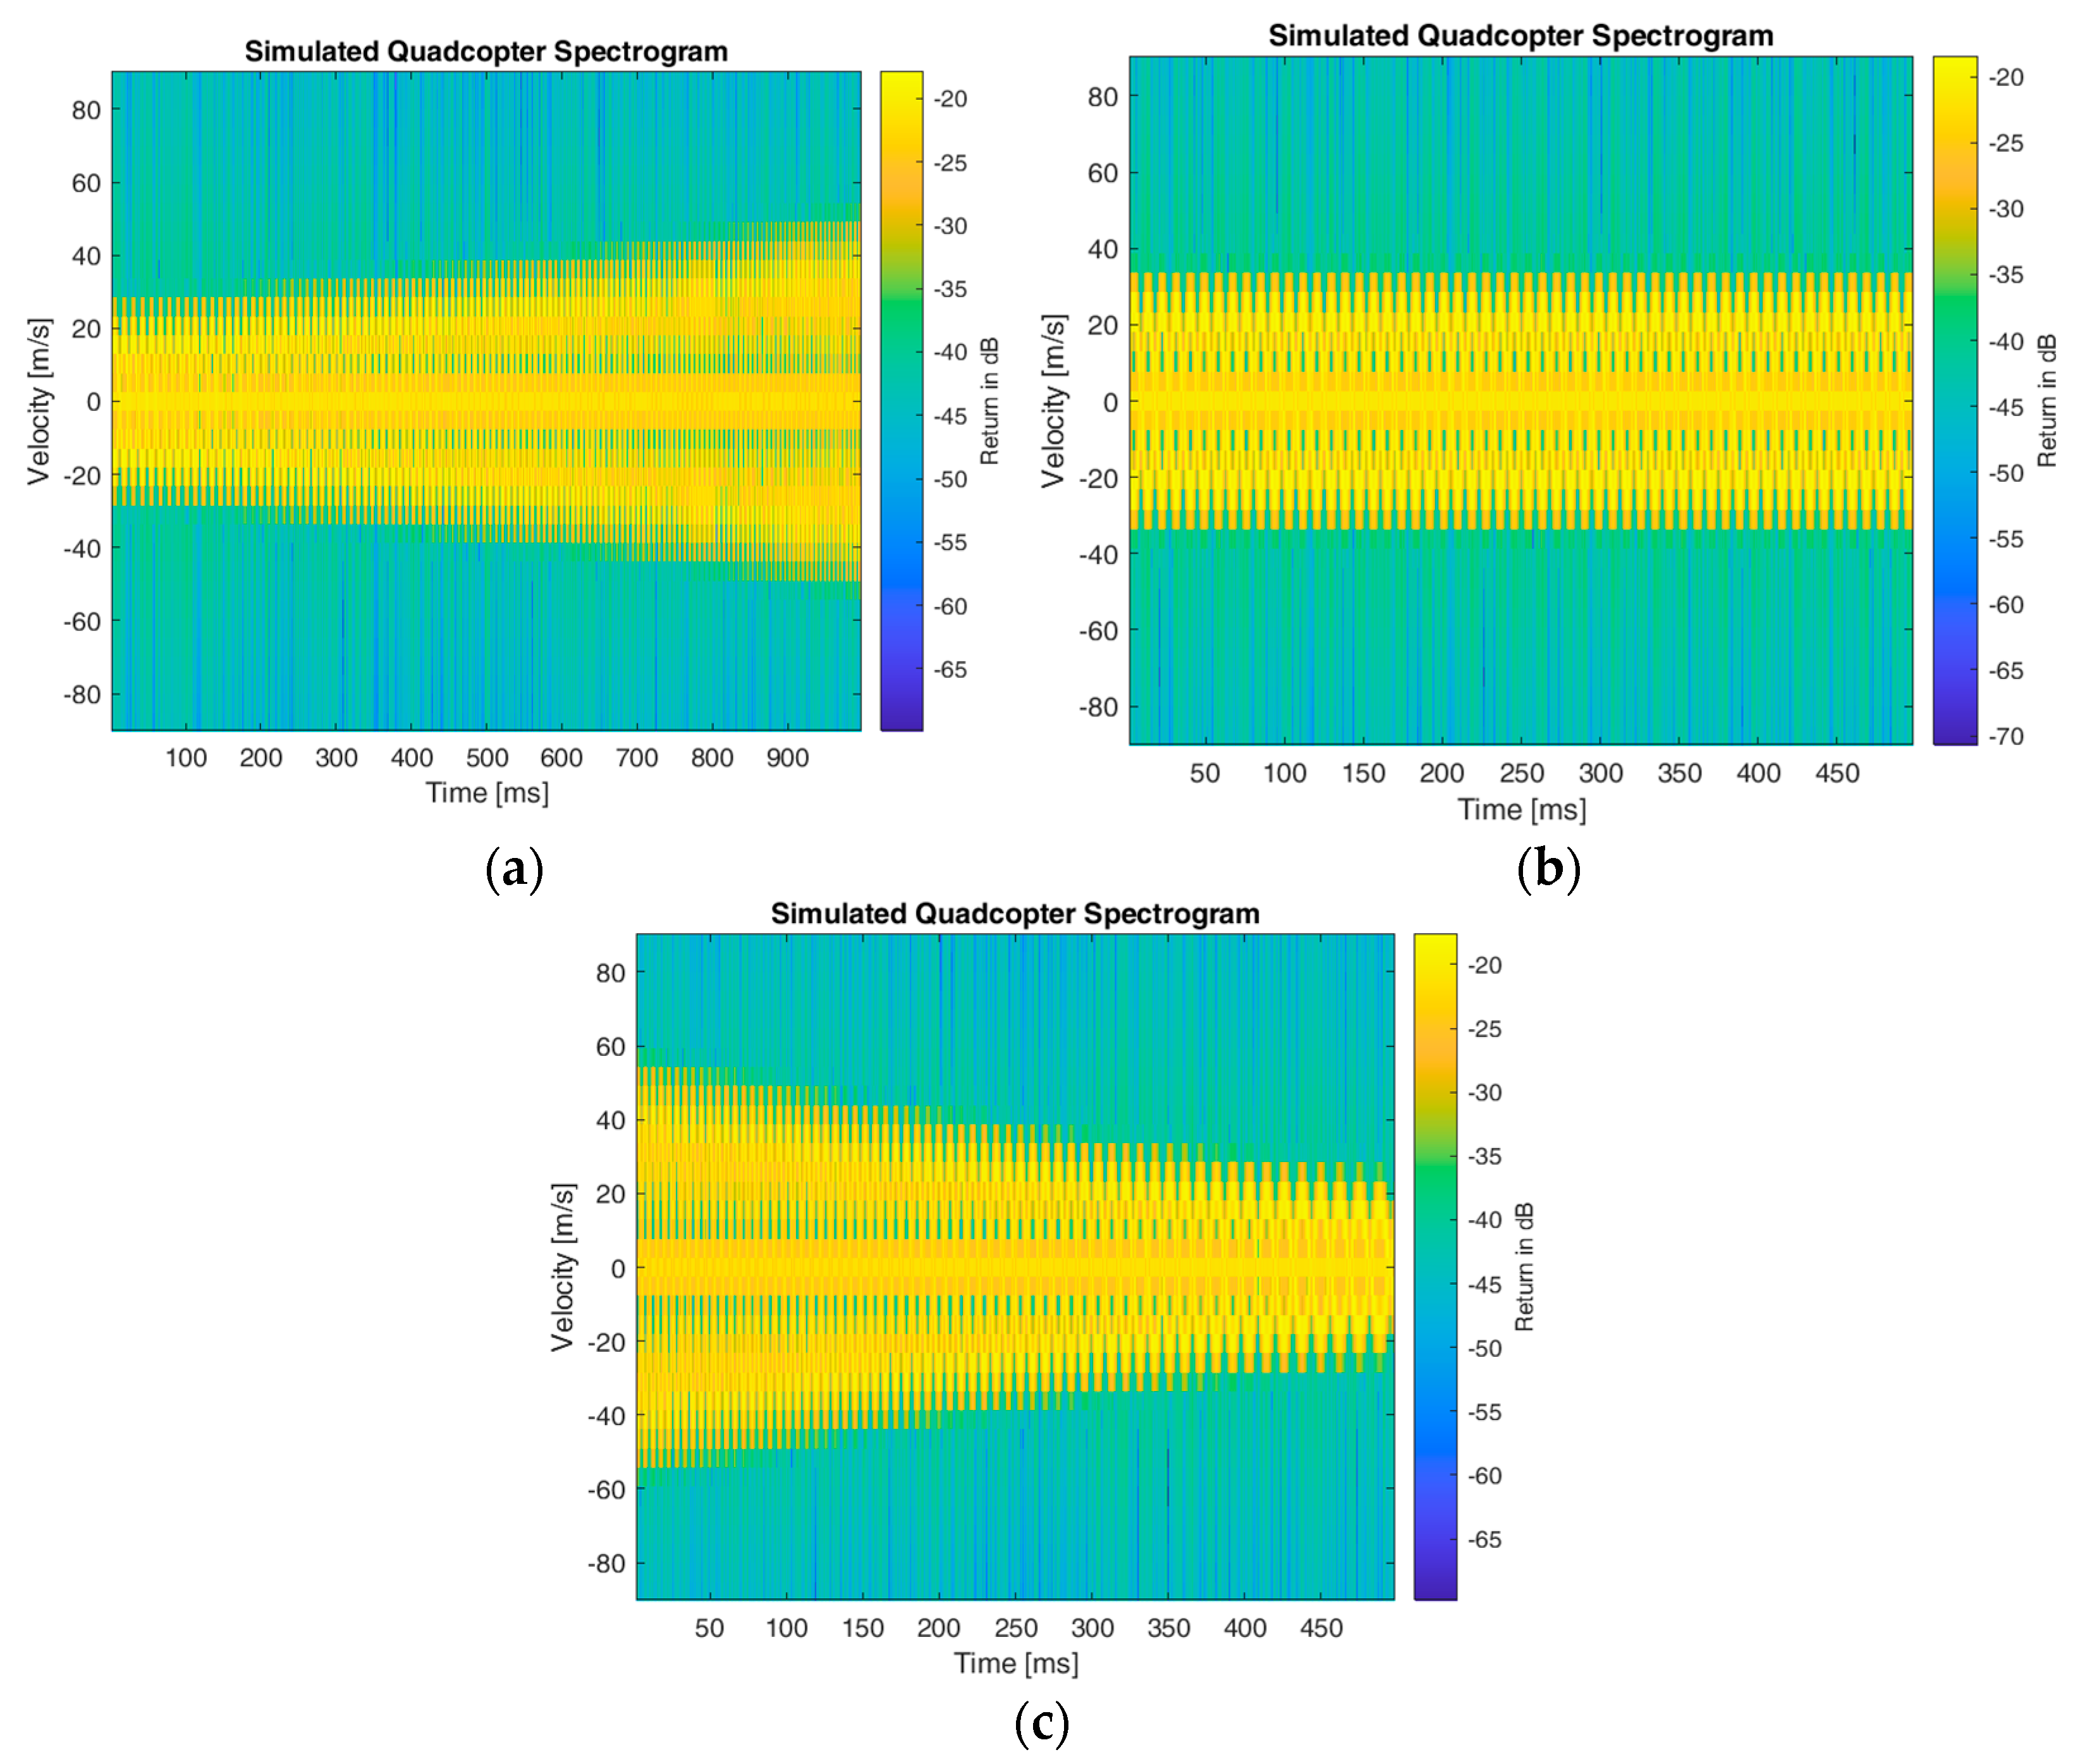
In
Figure 8, simulations are generated to replicate the ascending, hovering, and descending motions of a quadcopter. By increasing the acceleration of the blades through time, the simulation mimics the vertical motions of a quadcopter.
4. Radar System Design and Construction Details
An X-Band 10-GHz CW radar system was designed in-house to perform Doppler measurements. By transmitting a constant frequency signal, the returned signal is received and processed. Since this is a continuous-wave system, there are no ranging capabilities available.
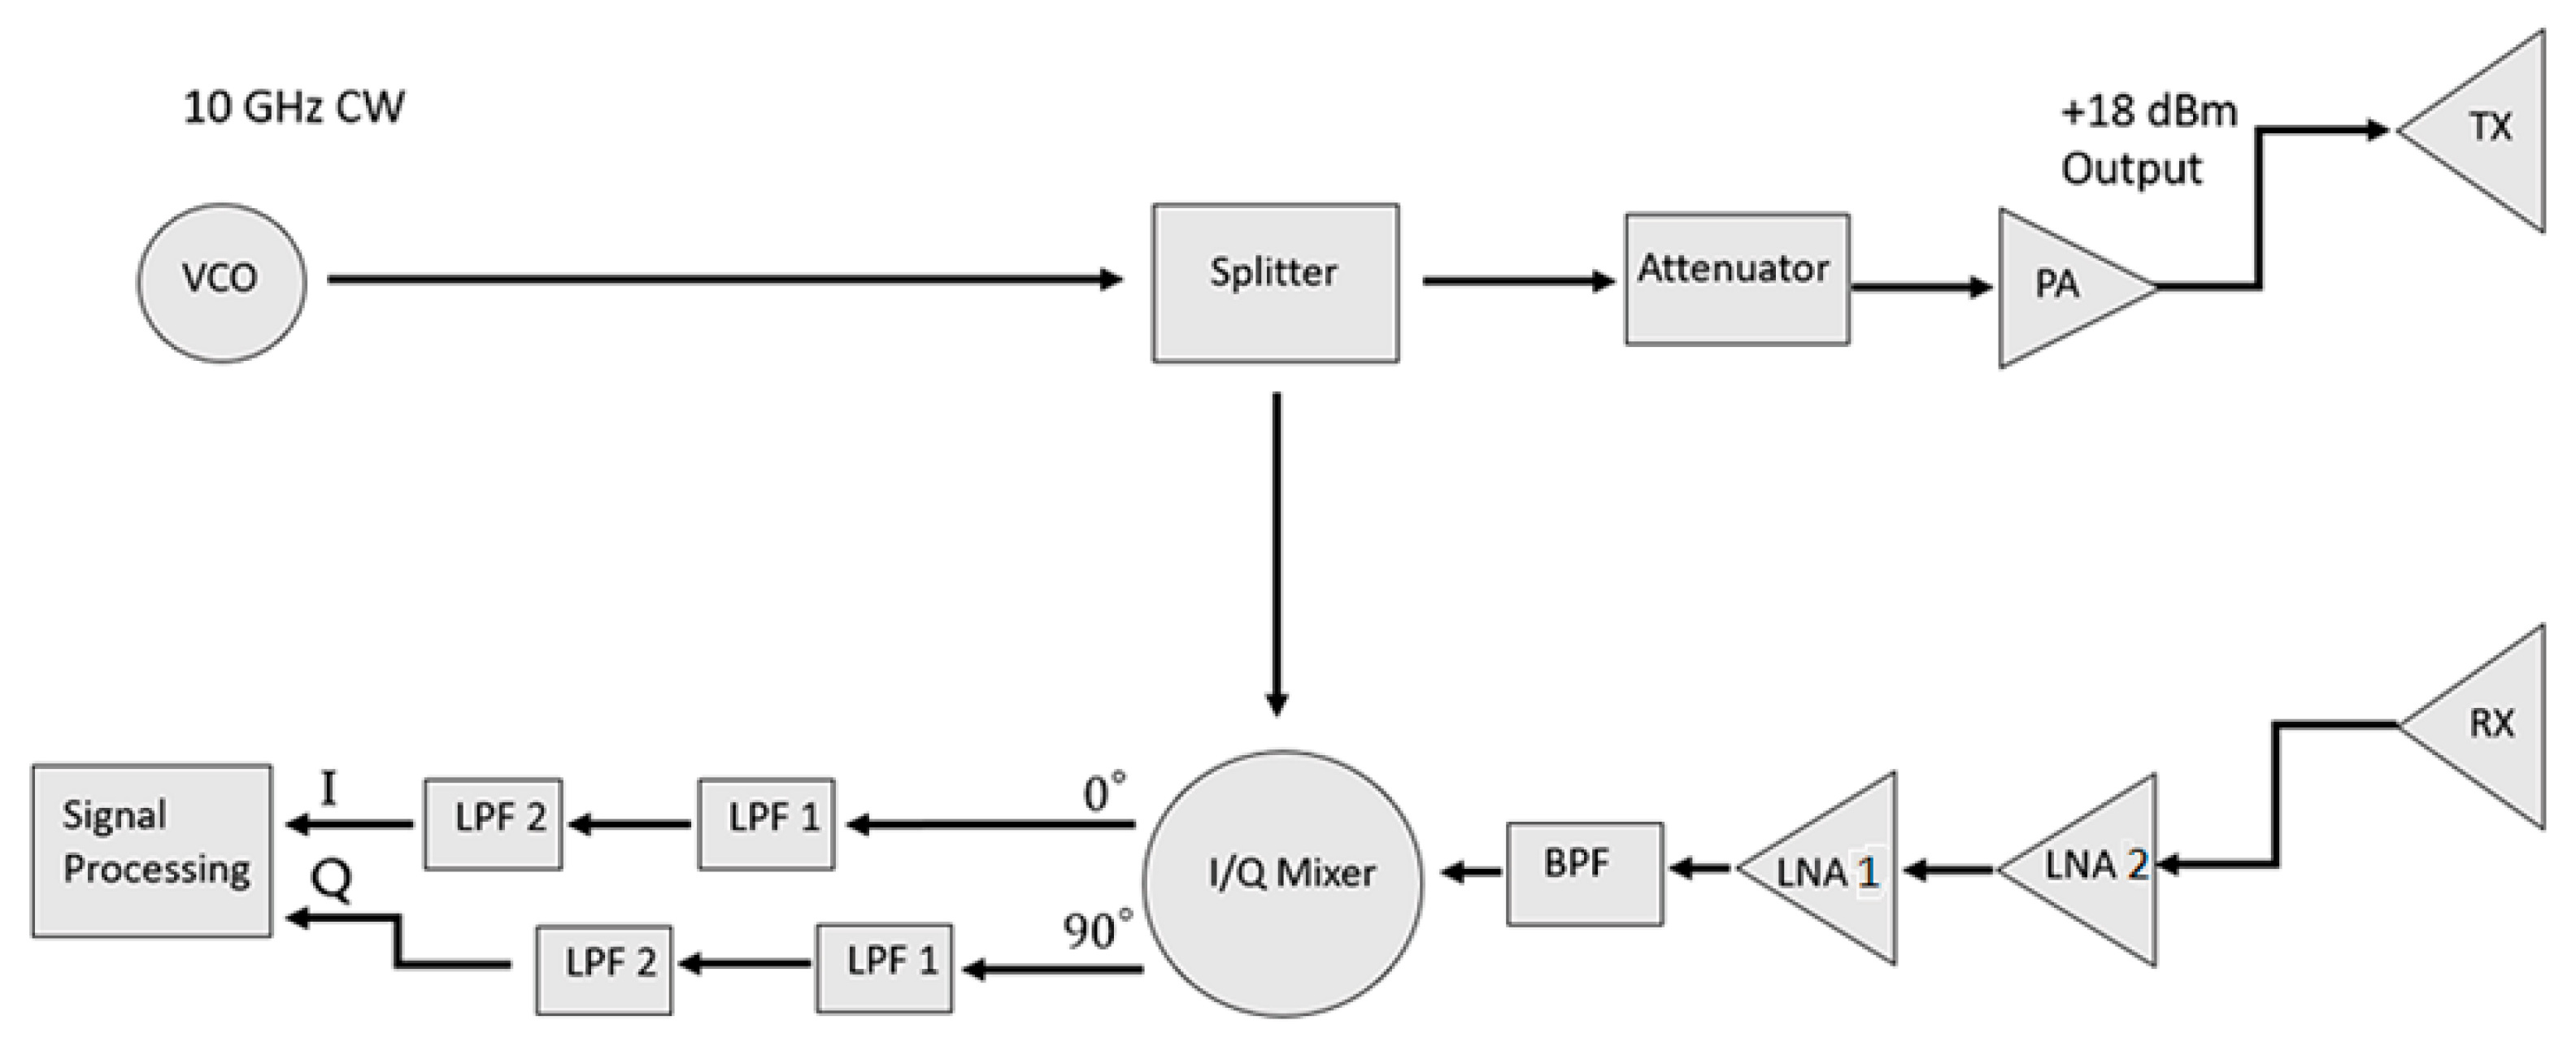
Figure 9 shows the block diagram of the 10-GHz radar system, which was constructed and used for data collection.
The 10-GHz signal is generated by powering the voltage-controlled oscillator (VCO) with a 12-V power supply. This signal is sent to the splitter, where half of the power is sent to the transmit chain and the rest is sent to the In-Phase/Quadrature (I/Q) mixer. In this step, it is necessary to compare and mix the transmitted and received signals to obtain the Doppler frequencies. To avoid saturation within the power amplifier (PA), a 12-dB attenuator was used to reduce the output power before amplification. A +18 dBm power output is transmitted through a 10-dB gain horn antenna.
After the signal is reflected from a target, it is received through an identical horn antenna and fed through two low-noise amplifiers (LNA2 and LNA1). Next, the signal passes through a bandpass filter (BPF) to filter any undesired reflections or clutter. This filtered signal is mixed with the local oscillator signal to produce the Doppler frequency in two channels. The inphase channel maintains a pure Doppler signal, while the quadrature channel implements a 90° phase shift. Both signals are passed through two low-pass filters (LPF1 and LPF2) before going through an auxiliary cable to be processed within a laptop environment through MATLAB.
Table 3 lists the overall parameters of the radar system, while
Table 4 lists the relevant component specifications.
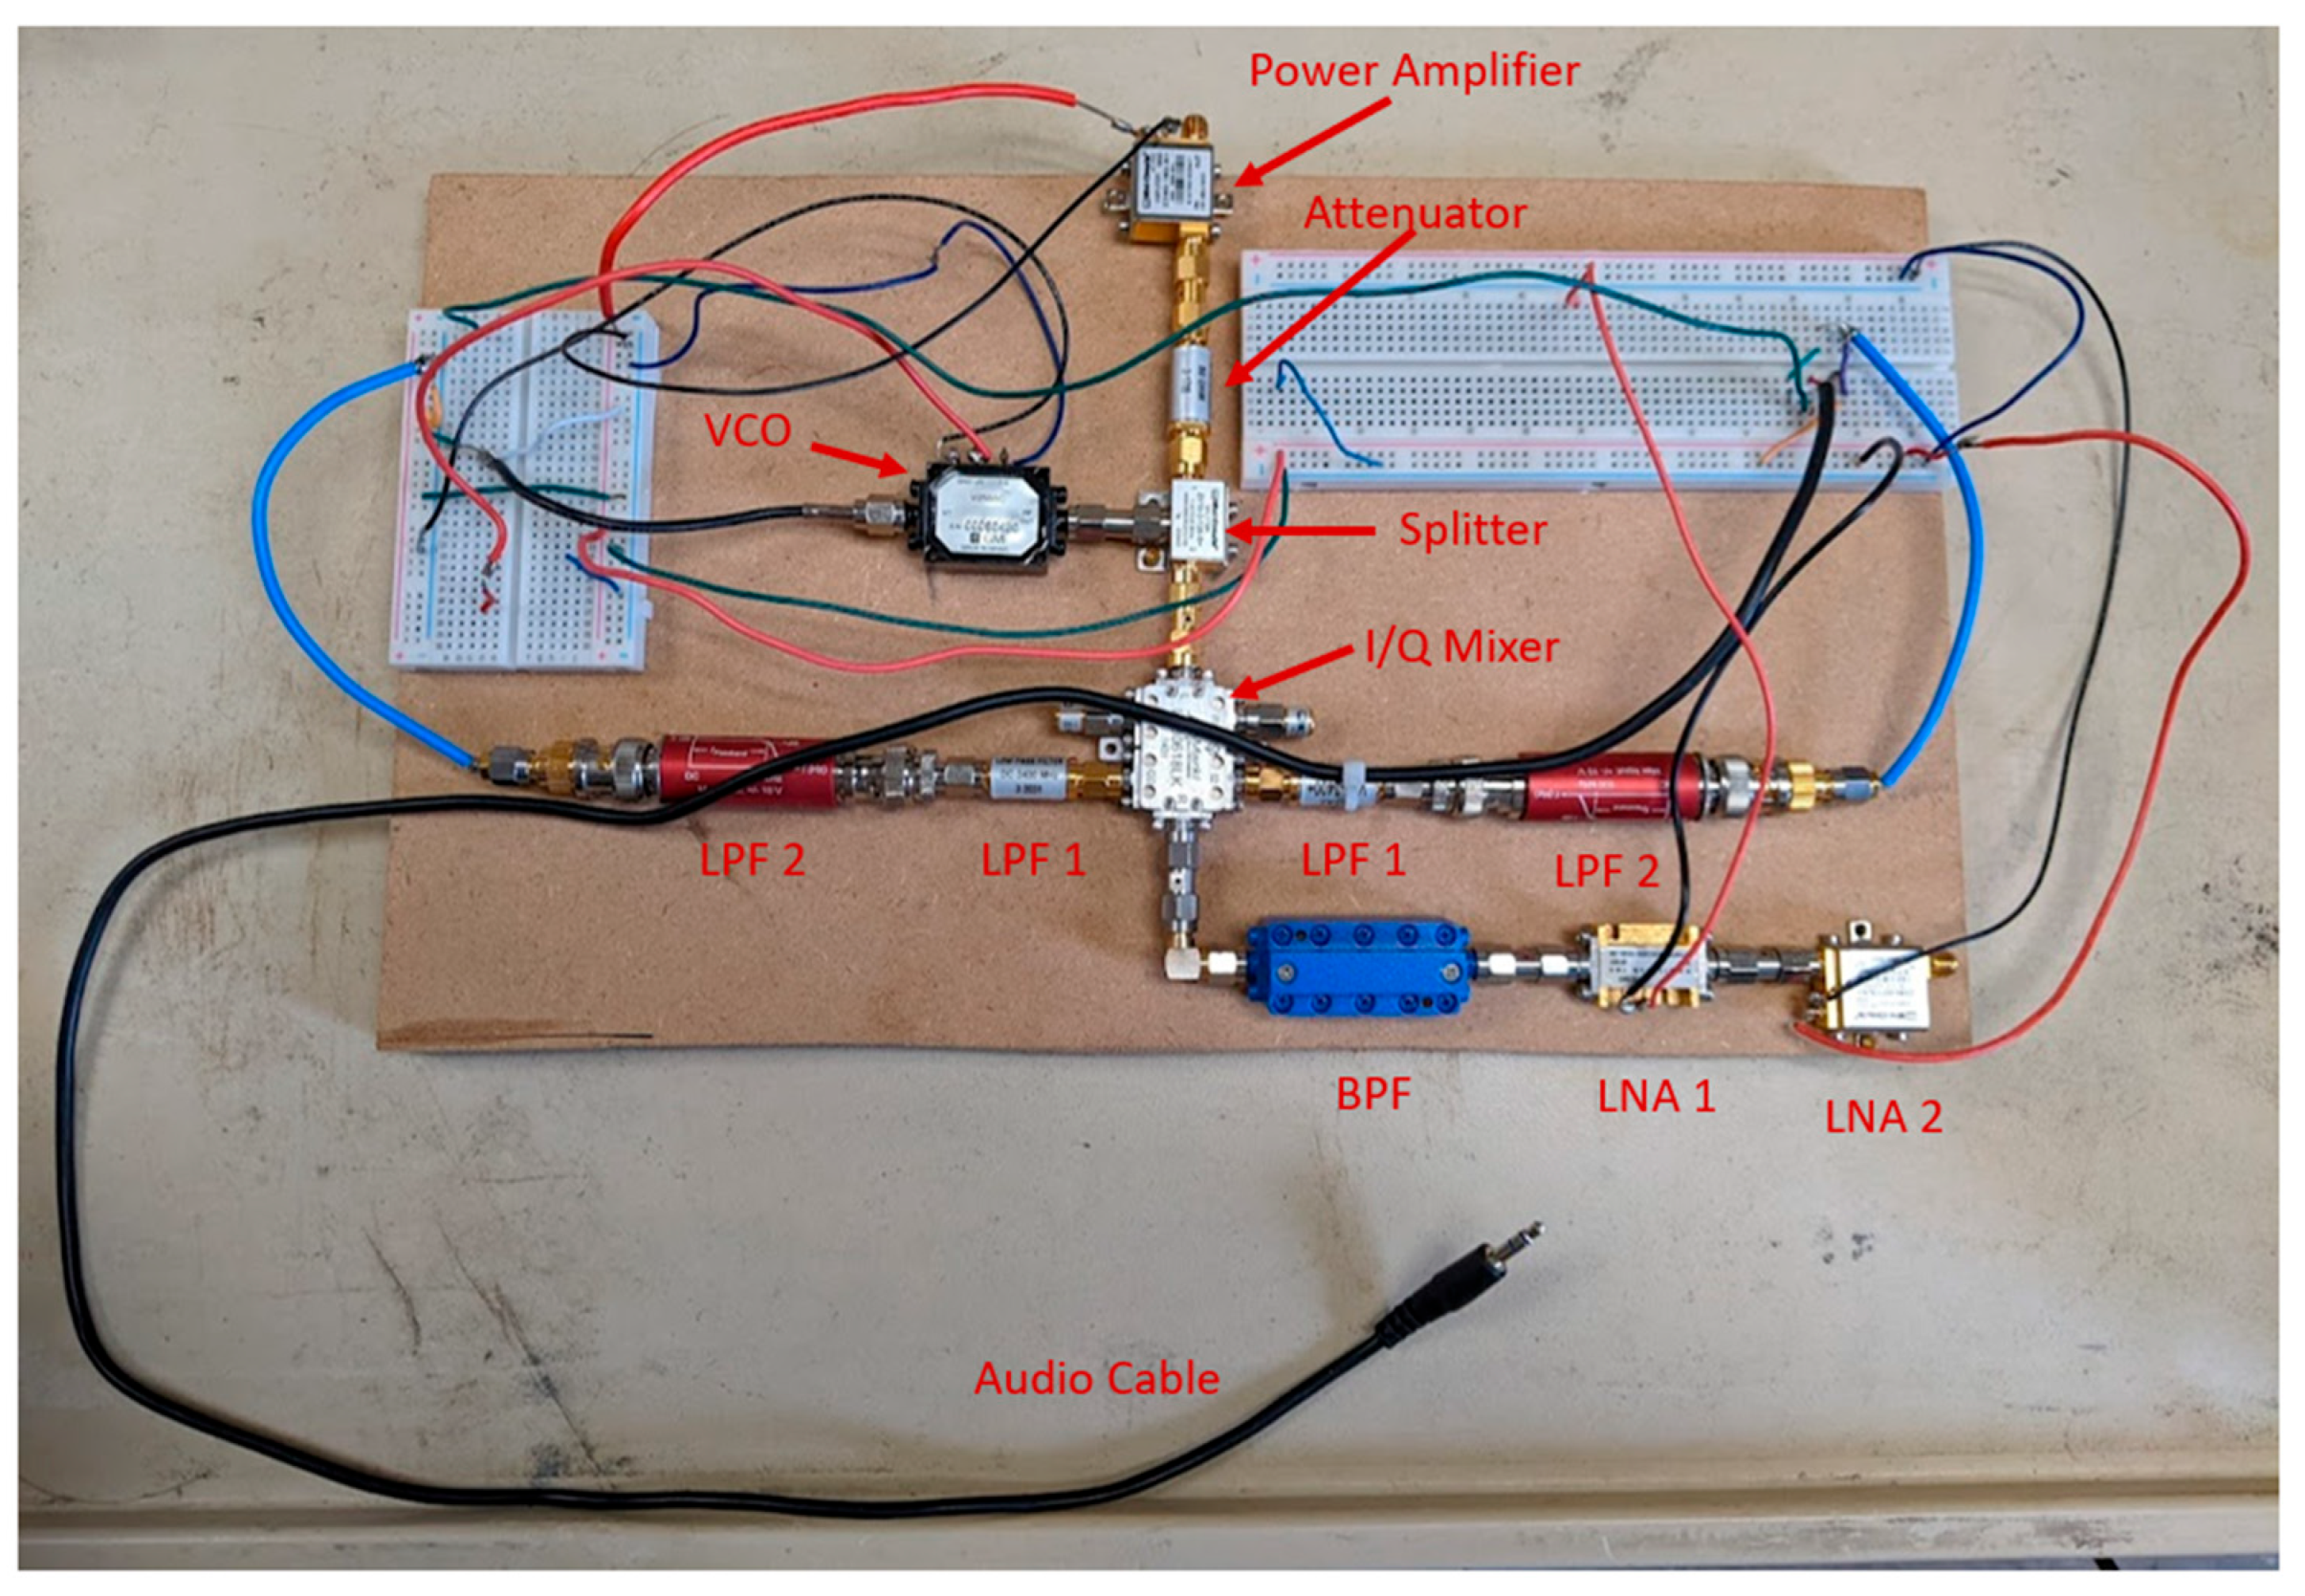
A photograph of the breadboard radar system is shown in
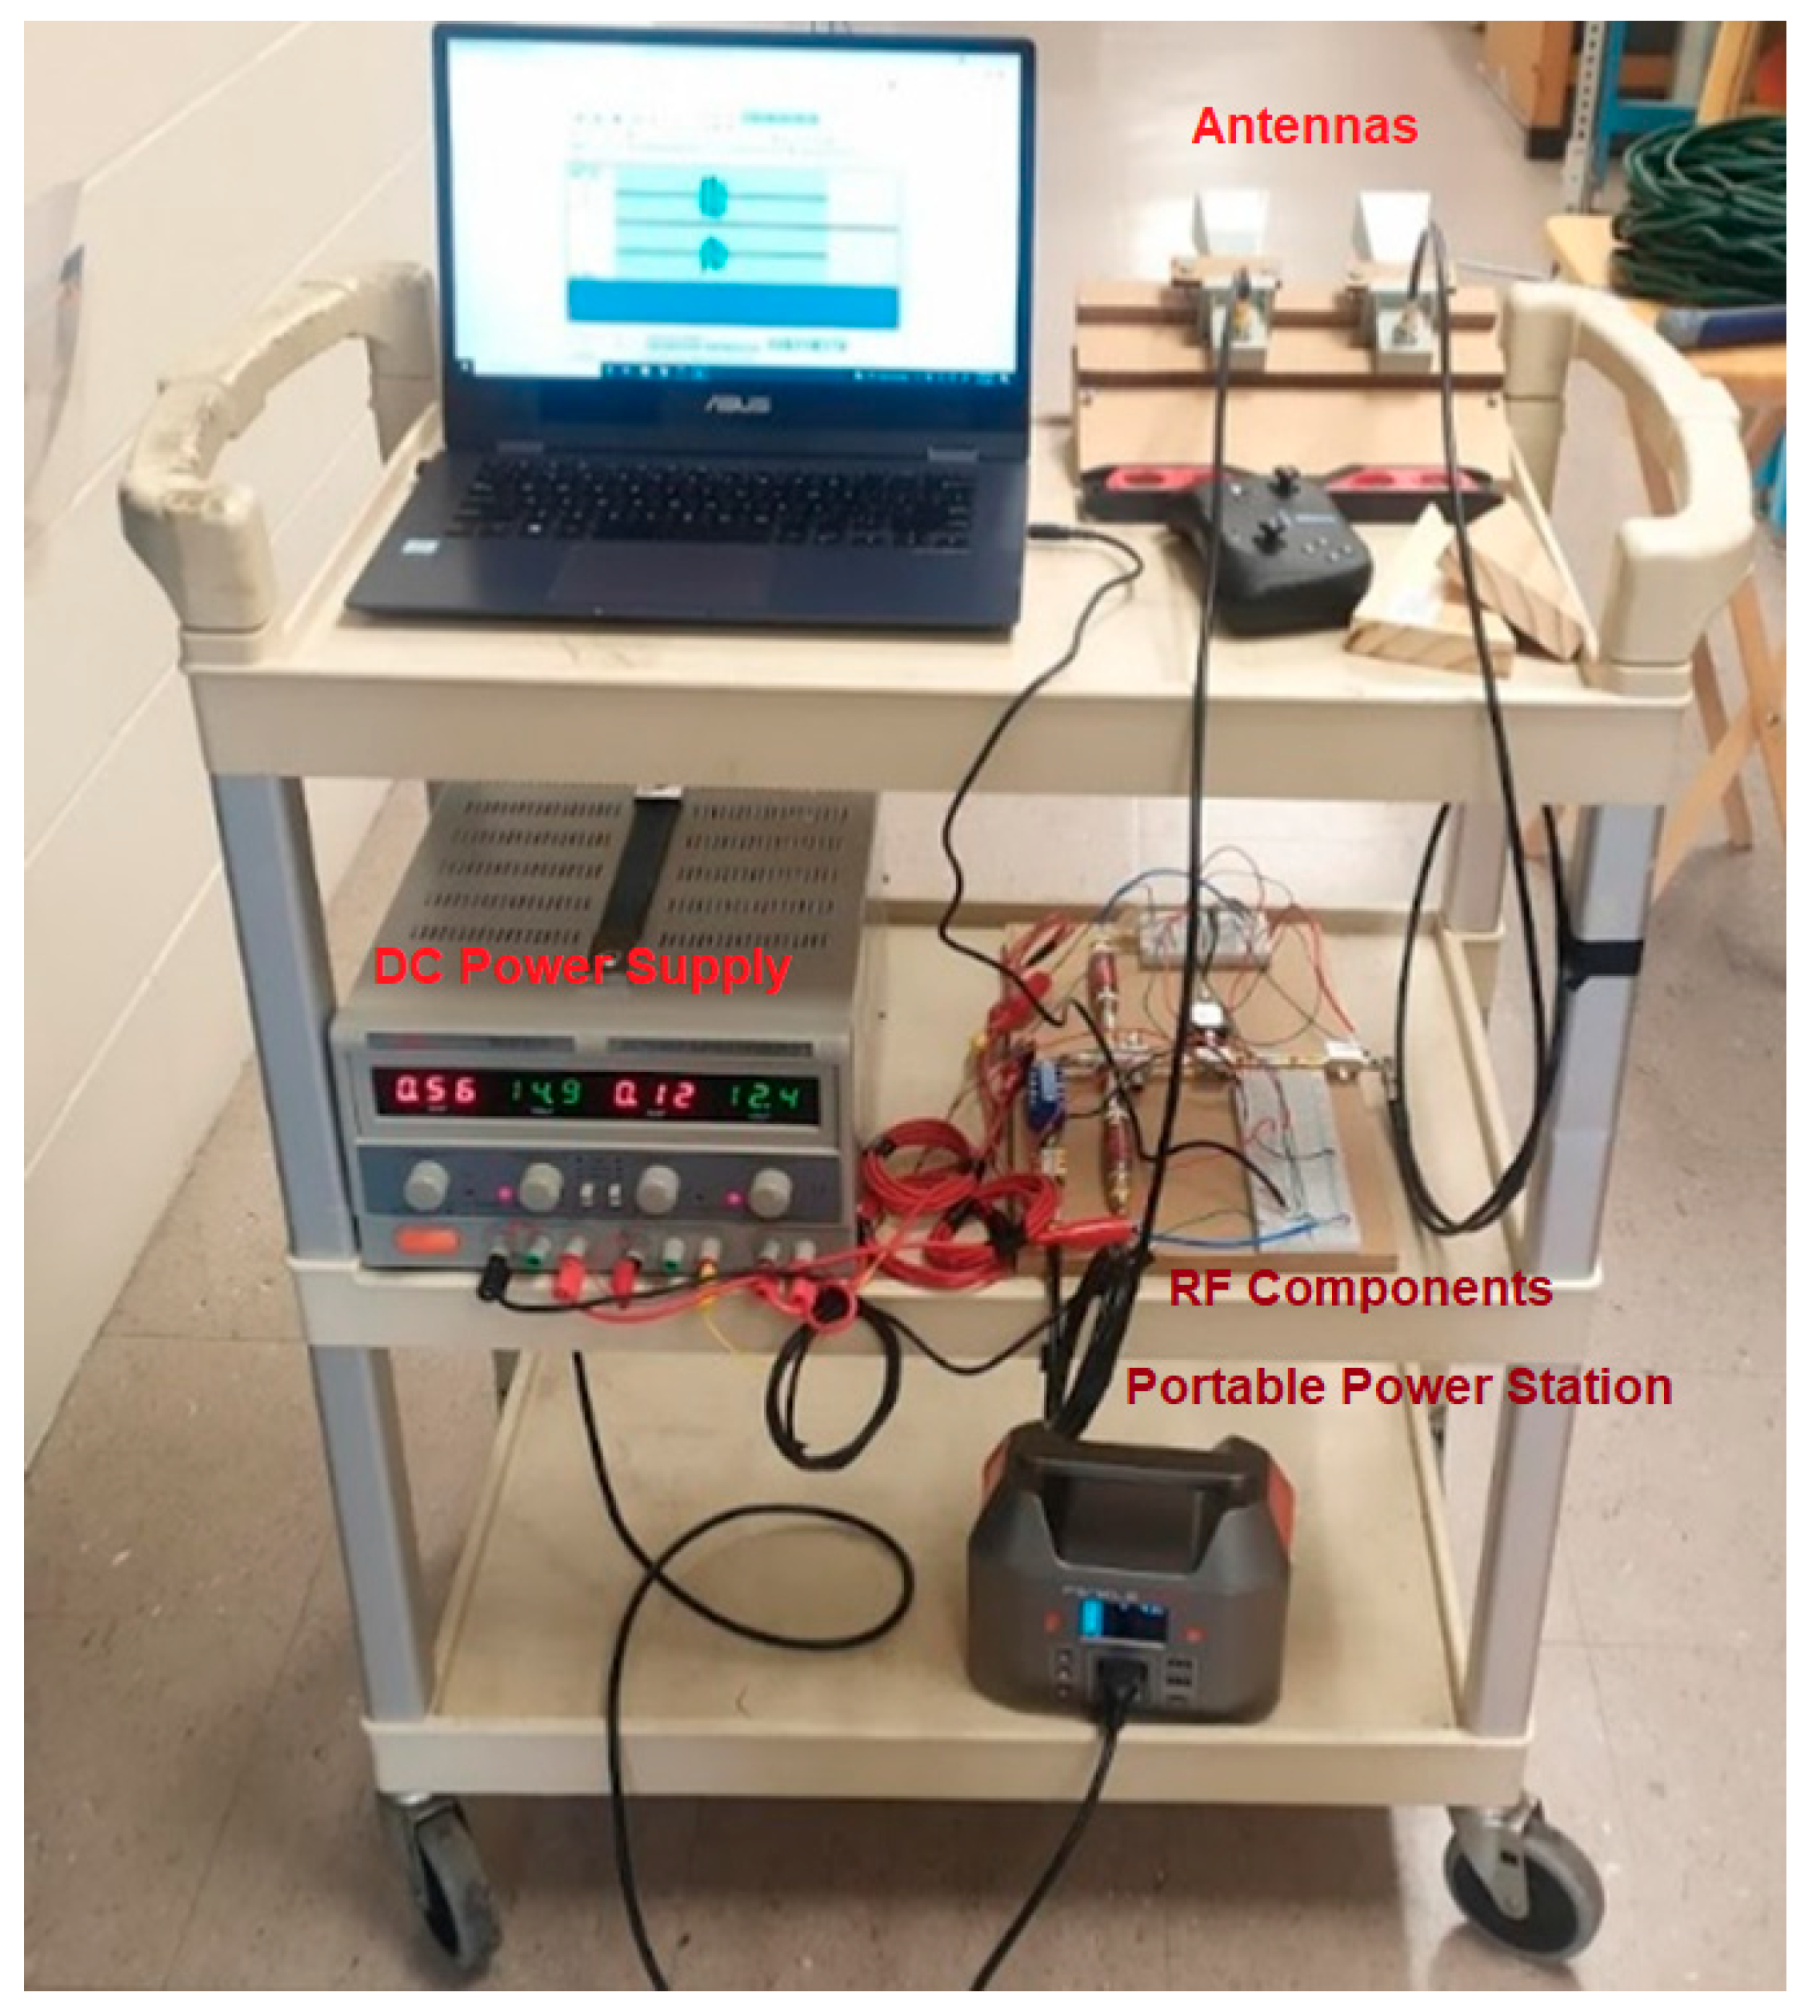
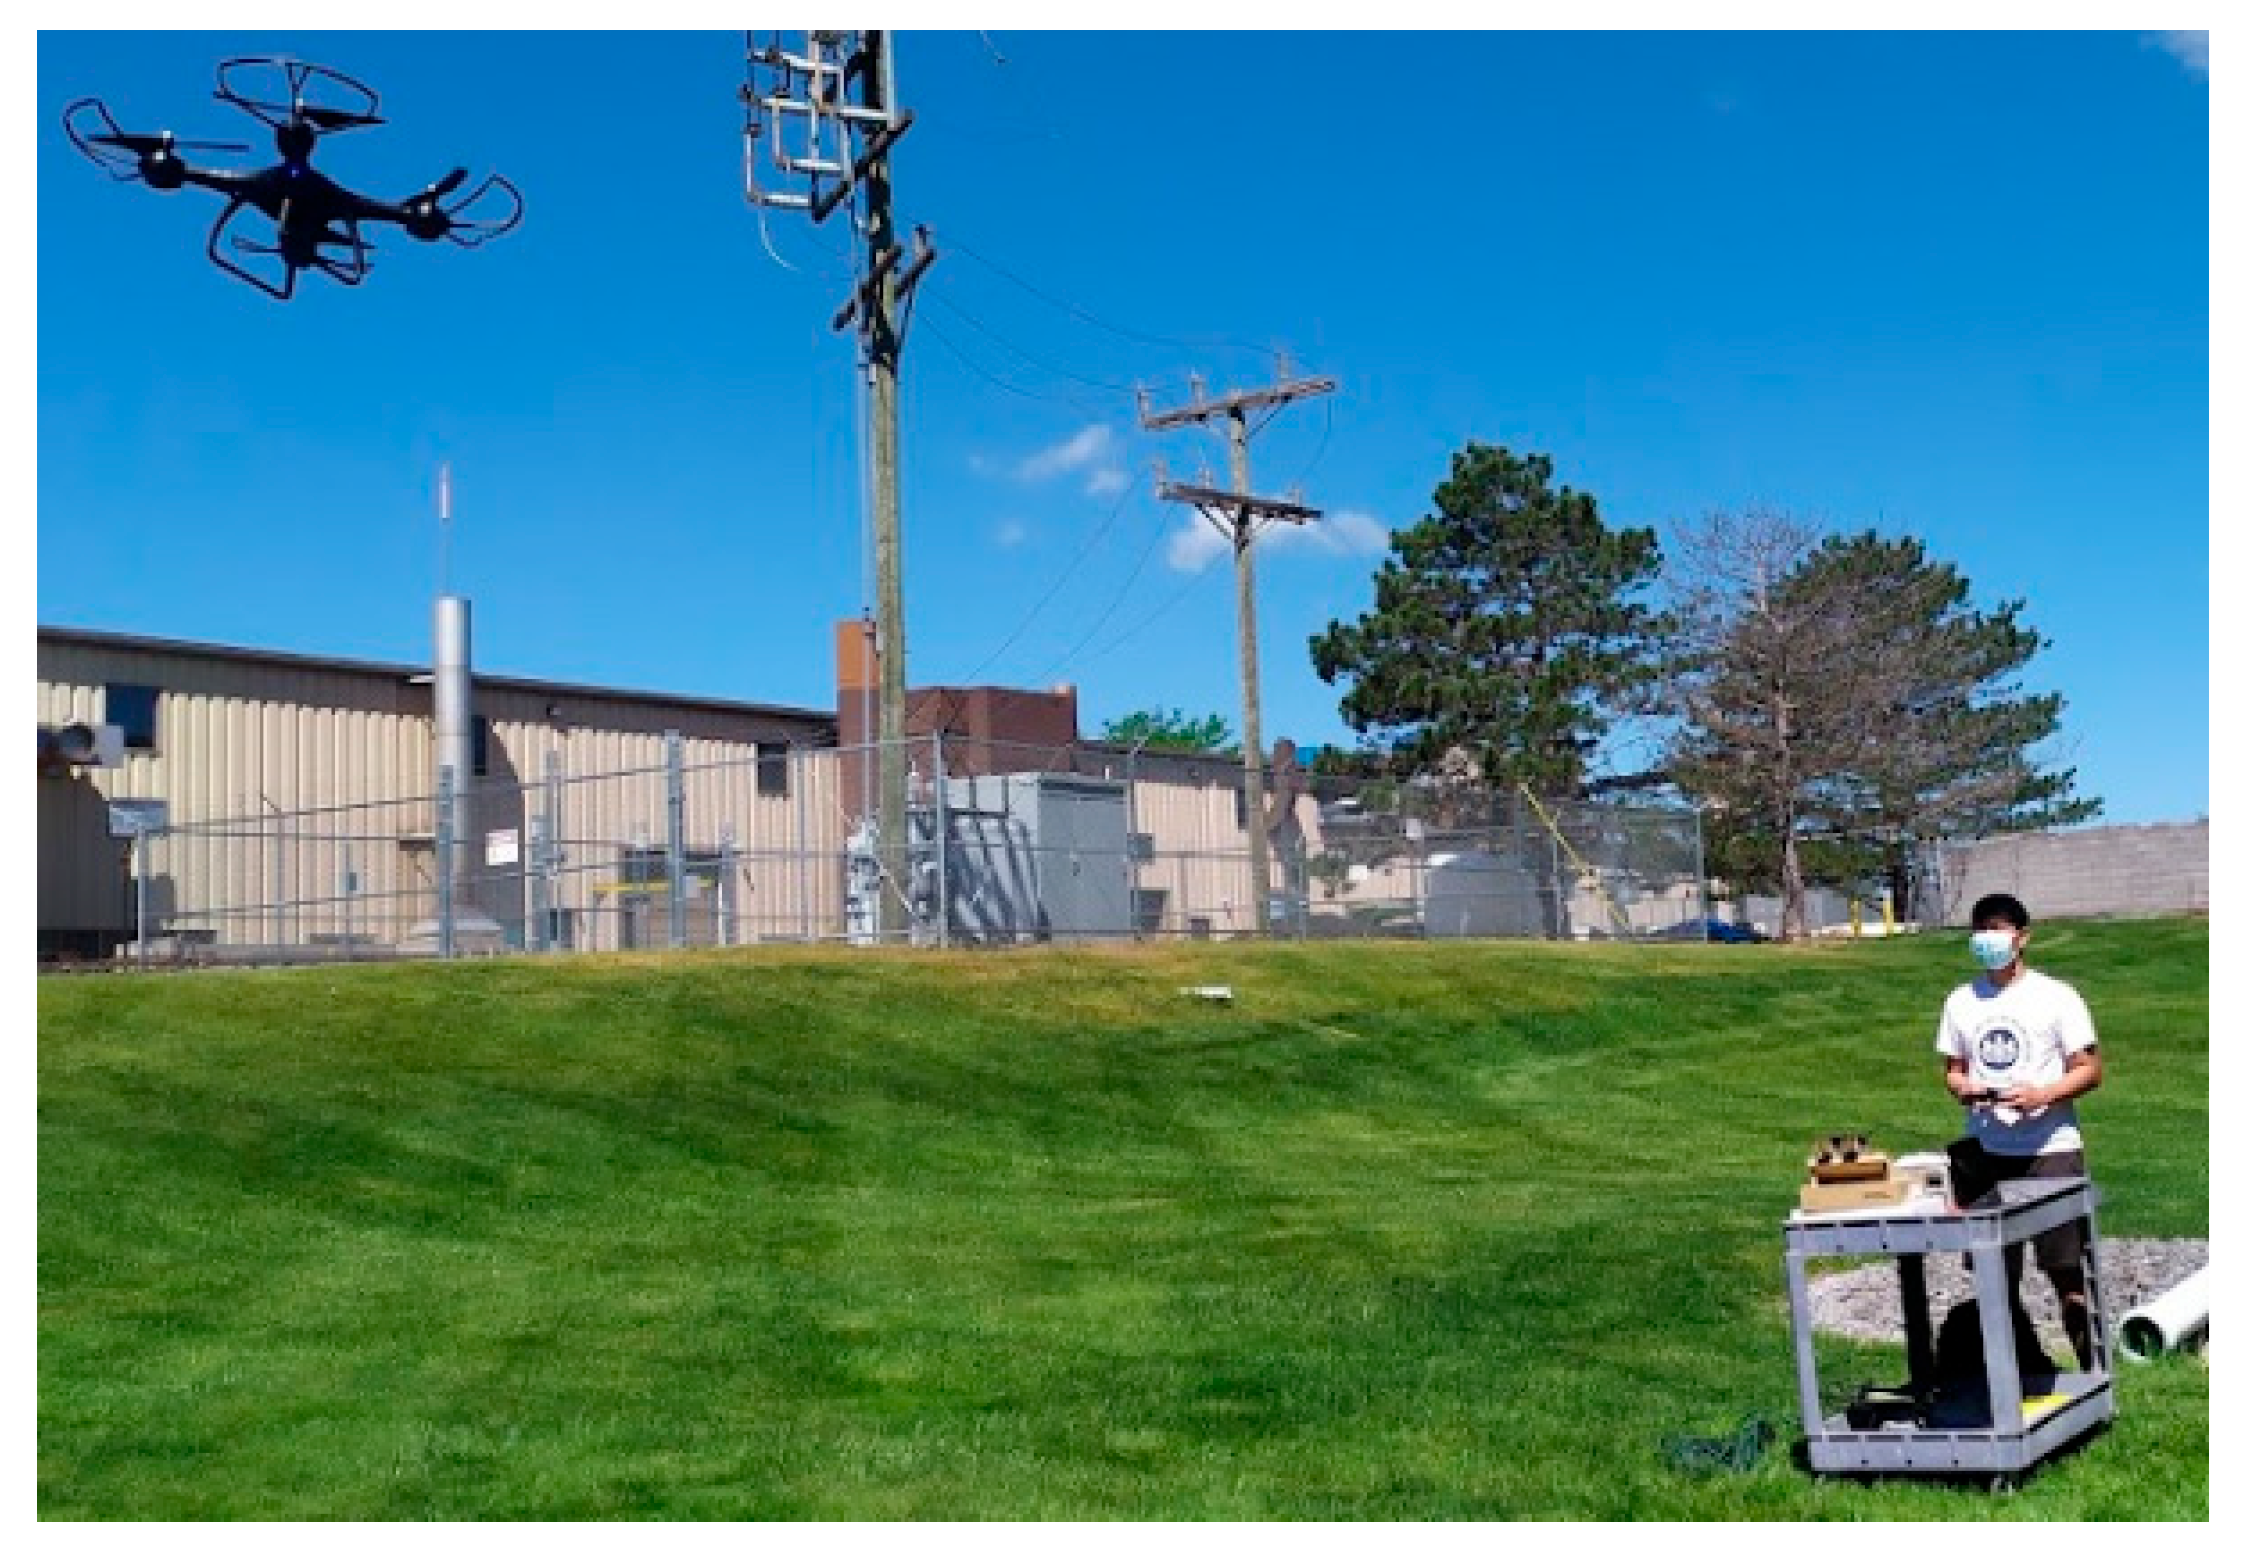
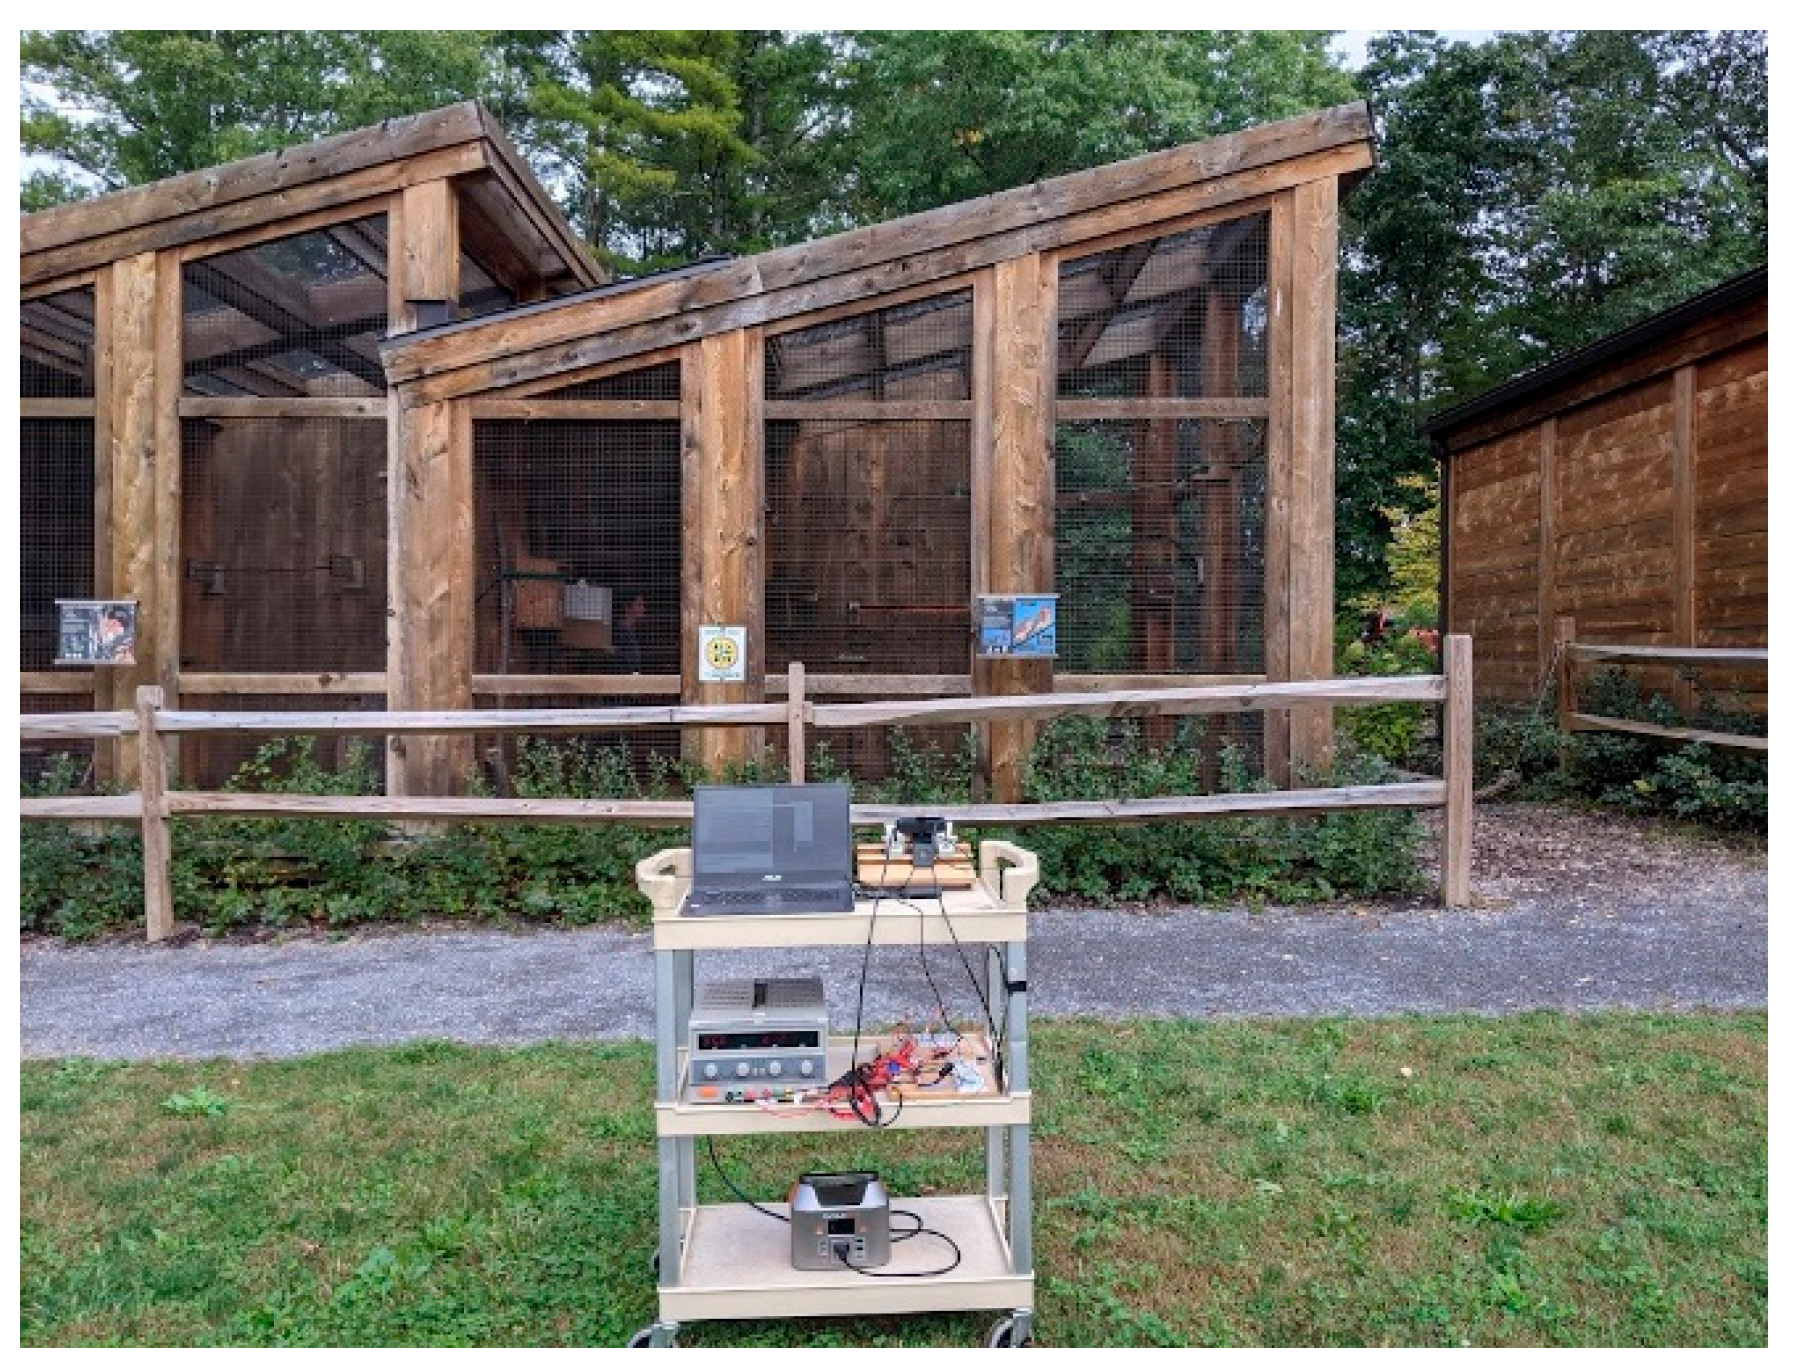
Figure 10. The radar system was mounted on a cart, as shown in
Figure 11. The 10-GHz radar system setup consists of three shelves. The top shelf contains the laptop and the horn antennas. The middle shelf is home to the DC power supply and the RF components of the 10-GHz system. The bottom shelf carries the portable power station that supports the DC power Supply.
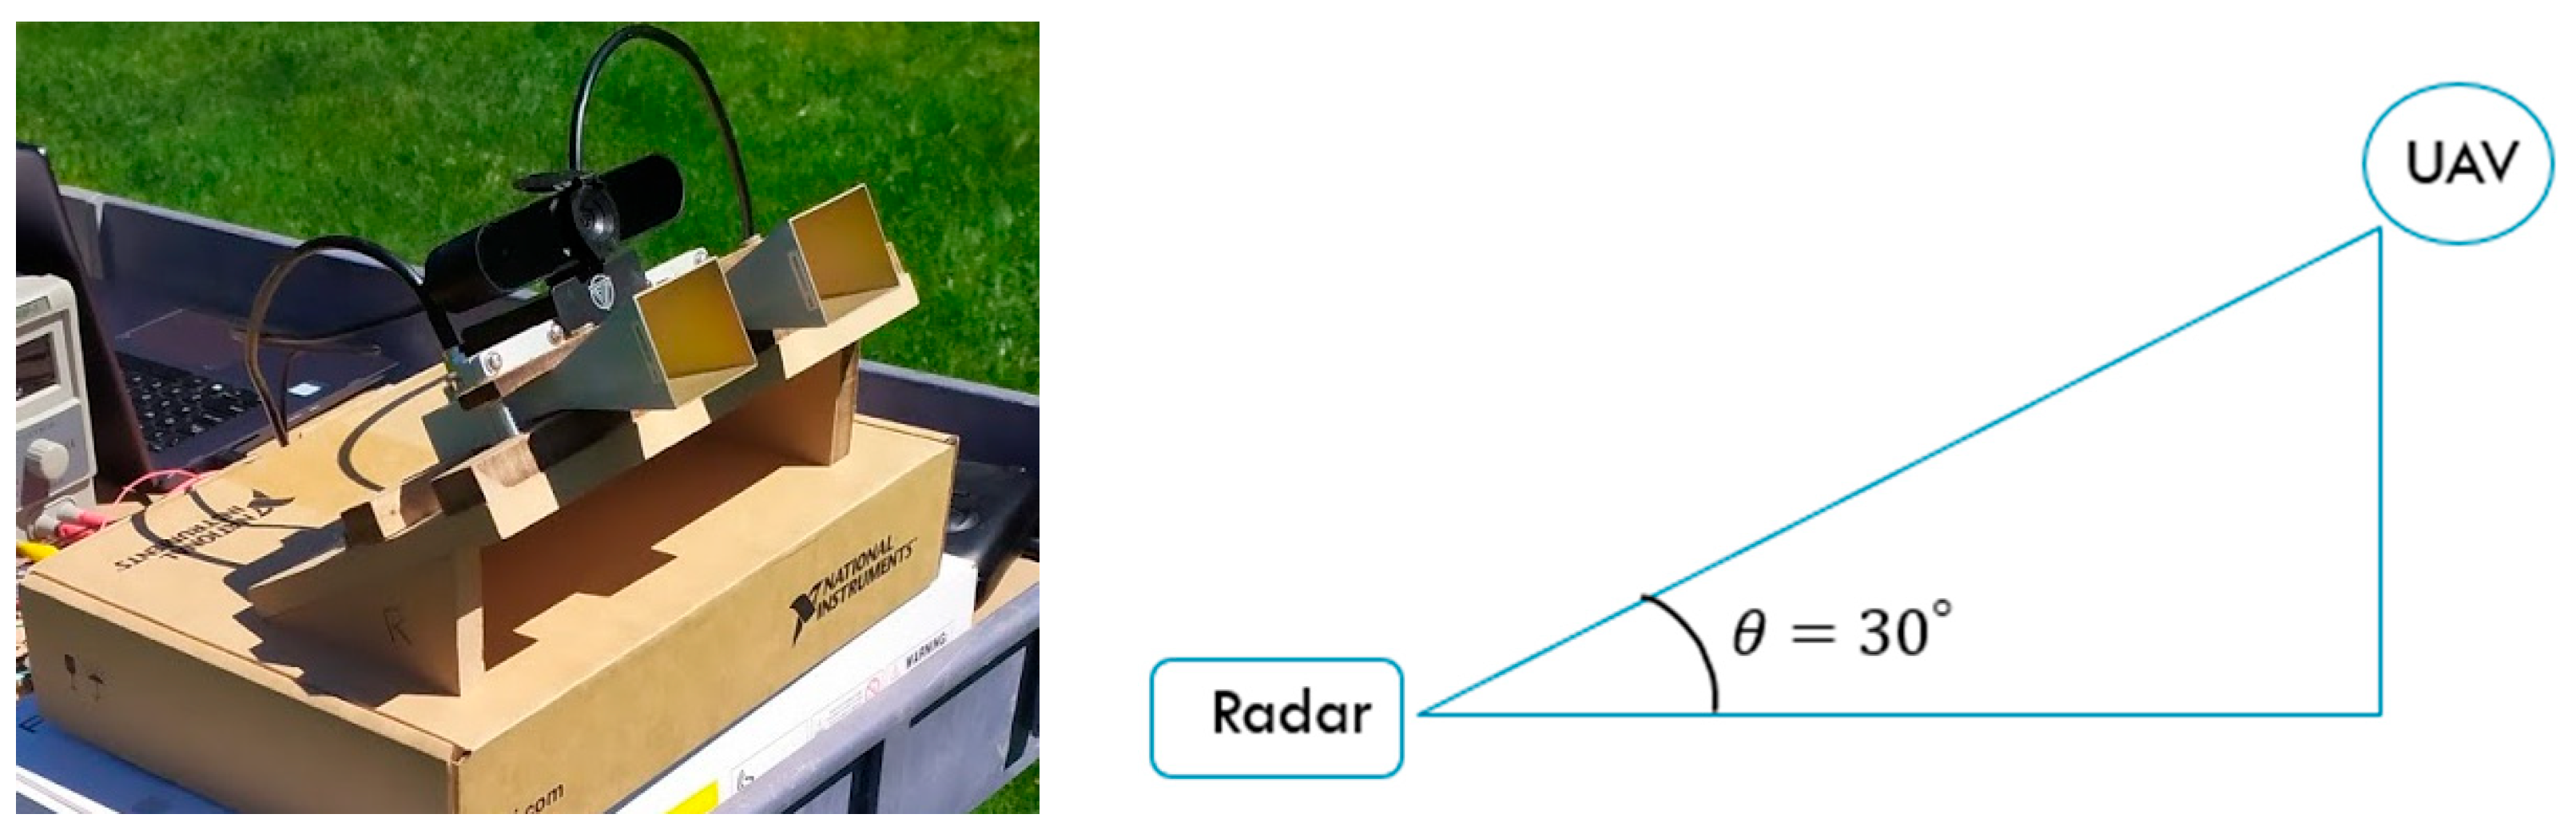
The horn antennas were configured on a wooden mount pointed at 30° above the horizon, as shown in
Figure 12. There is also a webcam placed above the horn antennas for ground truth when recording data. By using a 30° look angle, the micro-Doppler signatures of the drones were more pronounced, which will be discussed in greater depth in
Section 5. The polarization used was horizontal-transmit horizontal-receive (HH), which is expected to provide the best UAV detection results at far ranges because the blade faces are wider horizontally than vertically when viewed afar at low grazing angles. Similar conclusions were drawn using forward-scattering data under different polarizations [
29].
5. Experimental Micro-Doppler Signatures
5.1. Data Collection Process
Outdoor data were collected by placing the drone 3–15 m away from the radar system and performing different flight motions, as shown in
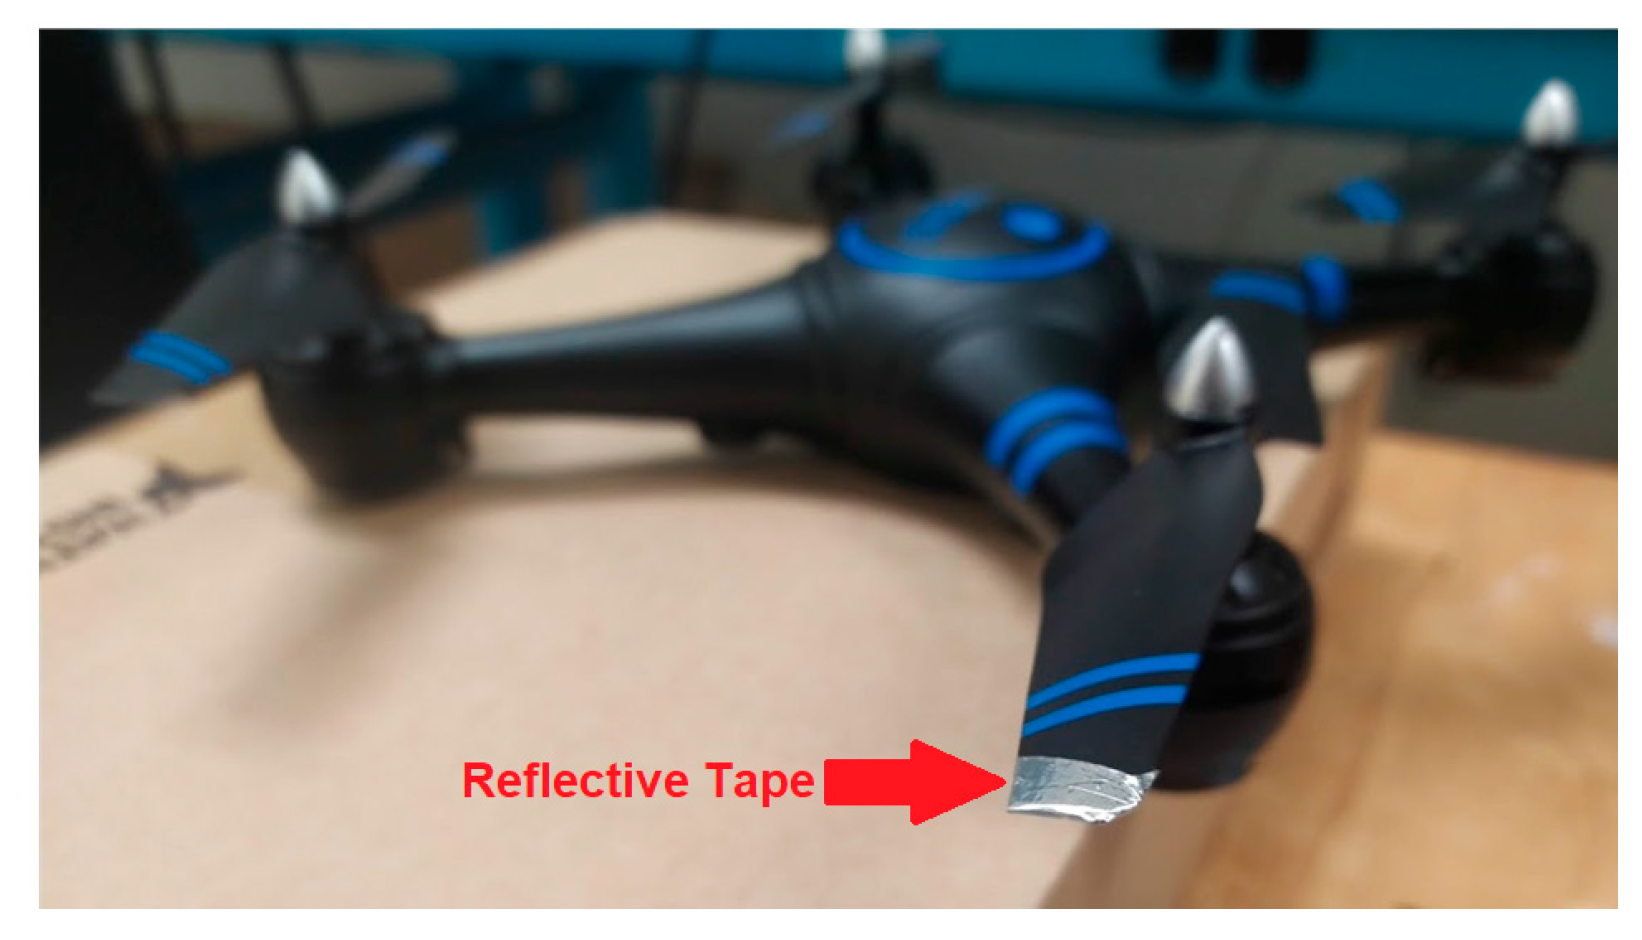
Figure 13. There were a few difficulties when trying to obtain the micro-Doppler signatures of the drones. The RCS of the blades was too low; therefore, methods for increasing the detectability were conducted.
The micro-Doppler signature was enhanced by adding reflective tape onto the blade tips of the quadcopter rotors, as shown in
Figure 14. This significantly improved its detectability.
5.2. UAV Characteristics
The description of each UAV is provided in
Table 5.
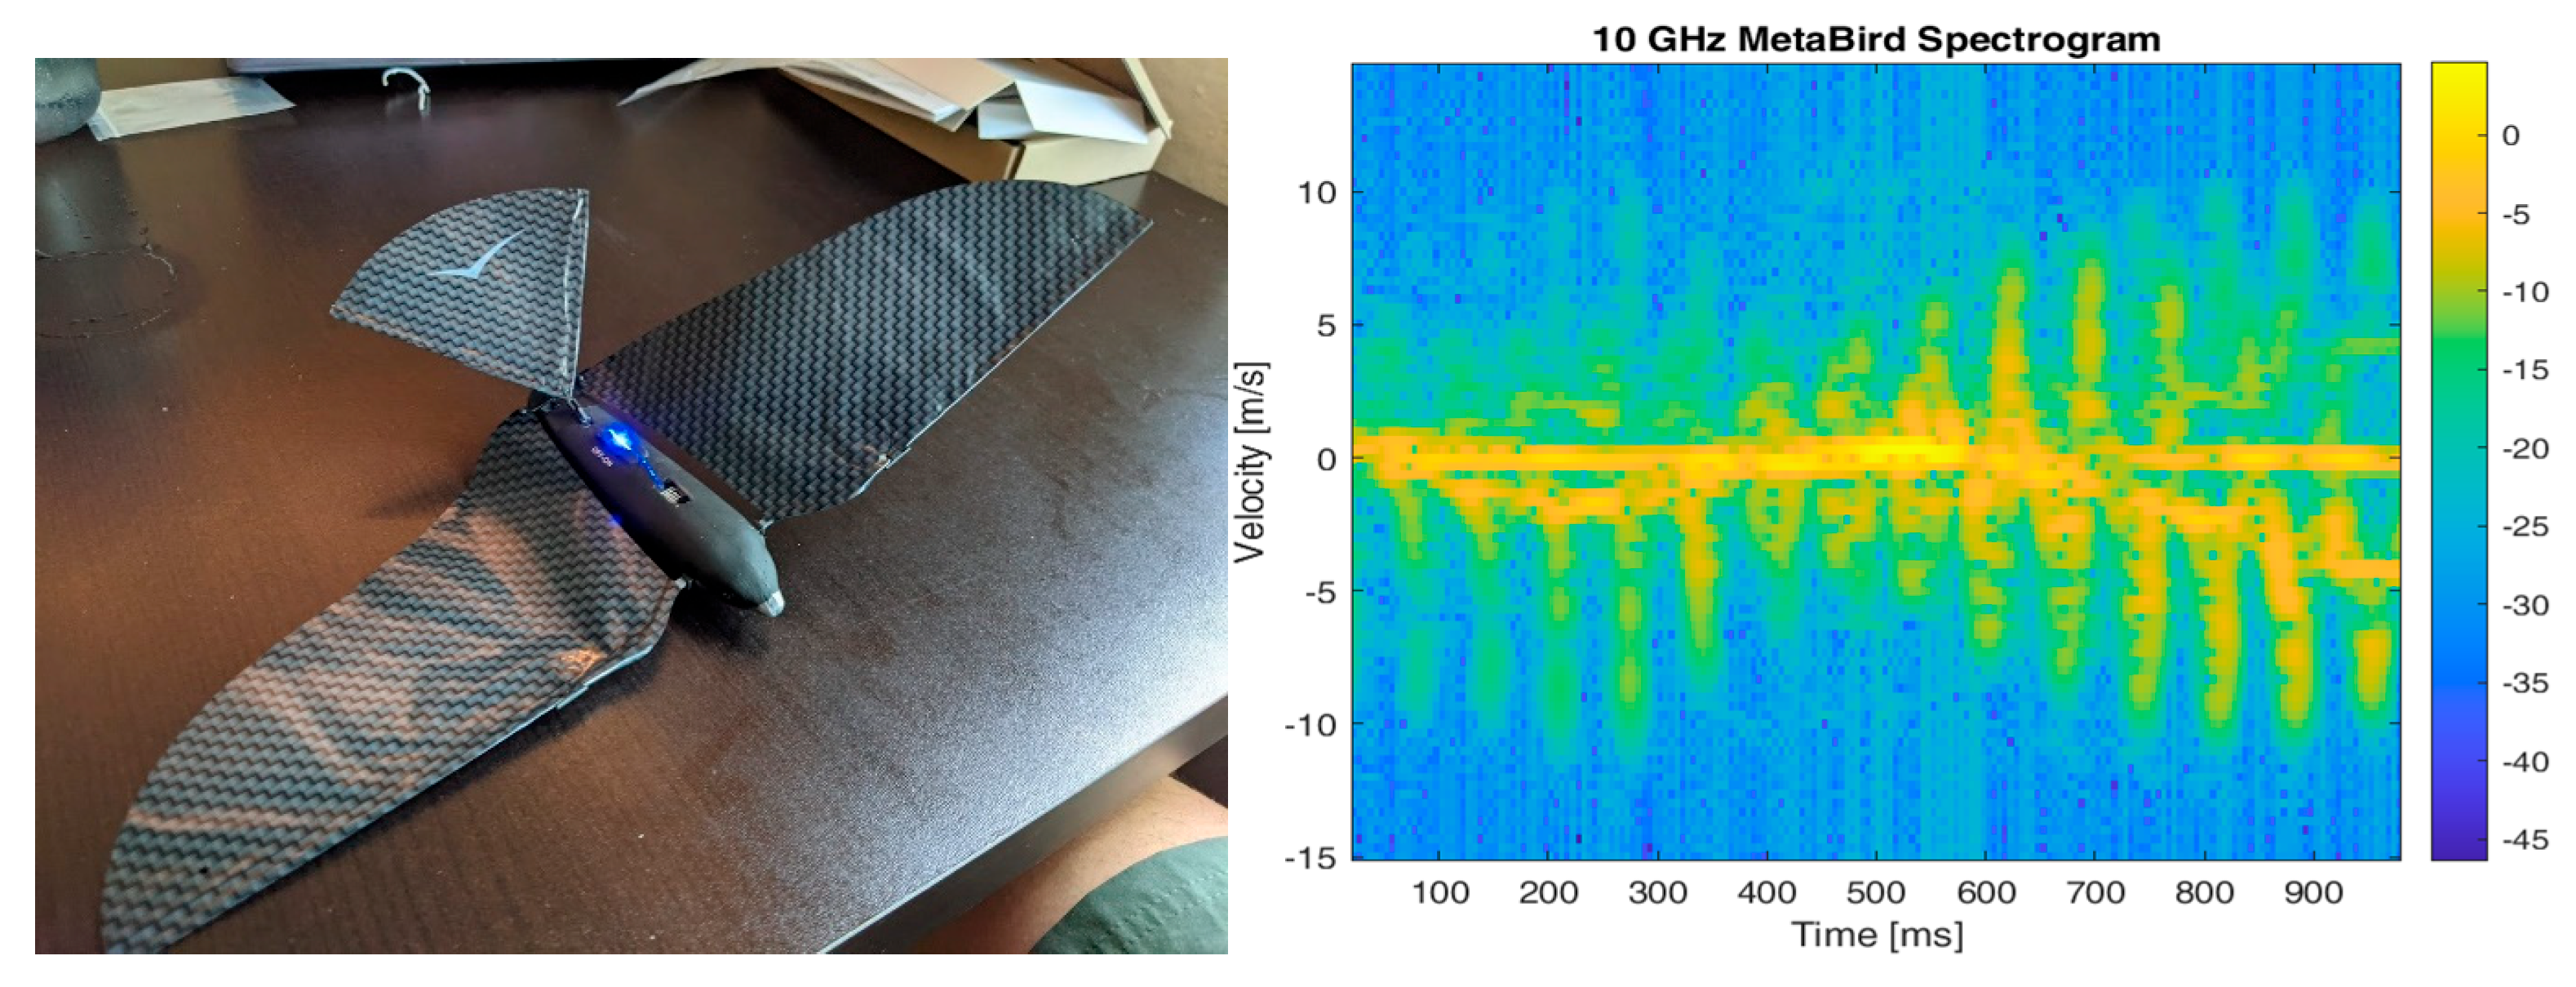
Figure 15 shows the smallest UAV, a Metabird, and its spectrogram. The Metabird mimics a flying bird and is controlled by a smartphone. It is equipped with flexible wings made of carbon fiber, liquid crystal polymers, and an indestructible foam body. It flies by flapping its wings without the aid of a propeller. The micro-Doppler signature of the Metabird consists of periodic flaps of consistent velocities. The body has an undulating nature as it flies. The Doppler bandwidth changes over time due to the rotational behavior of the UAV. The Metabird does not always travel perpendicular to the radar.
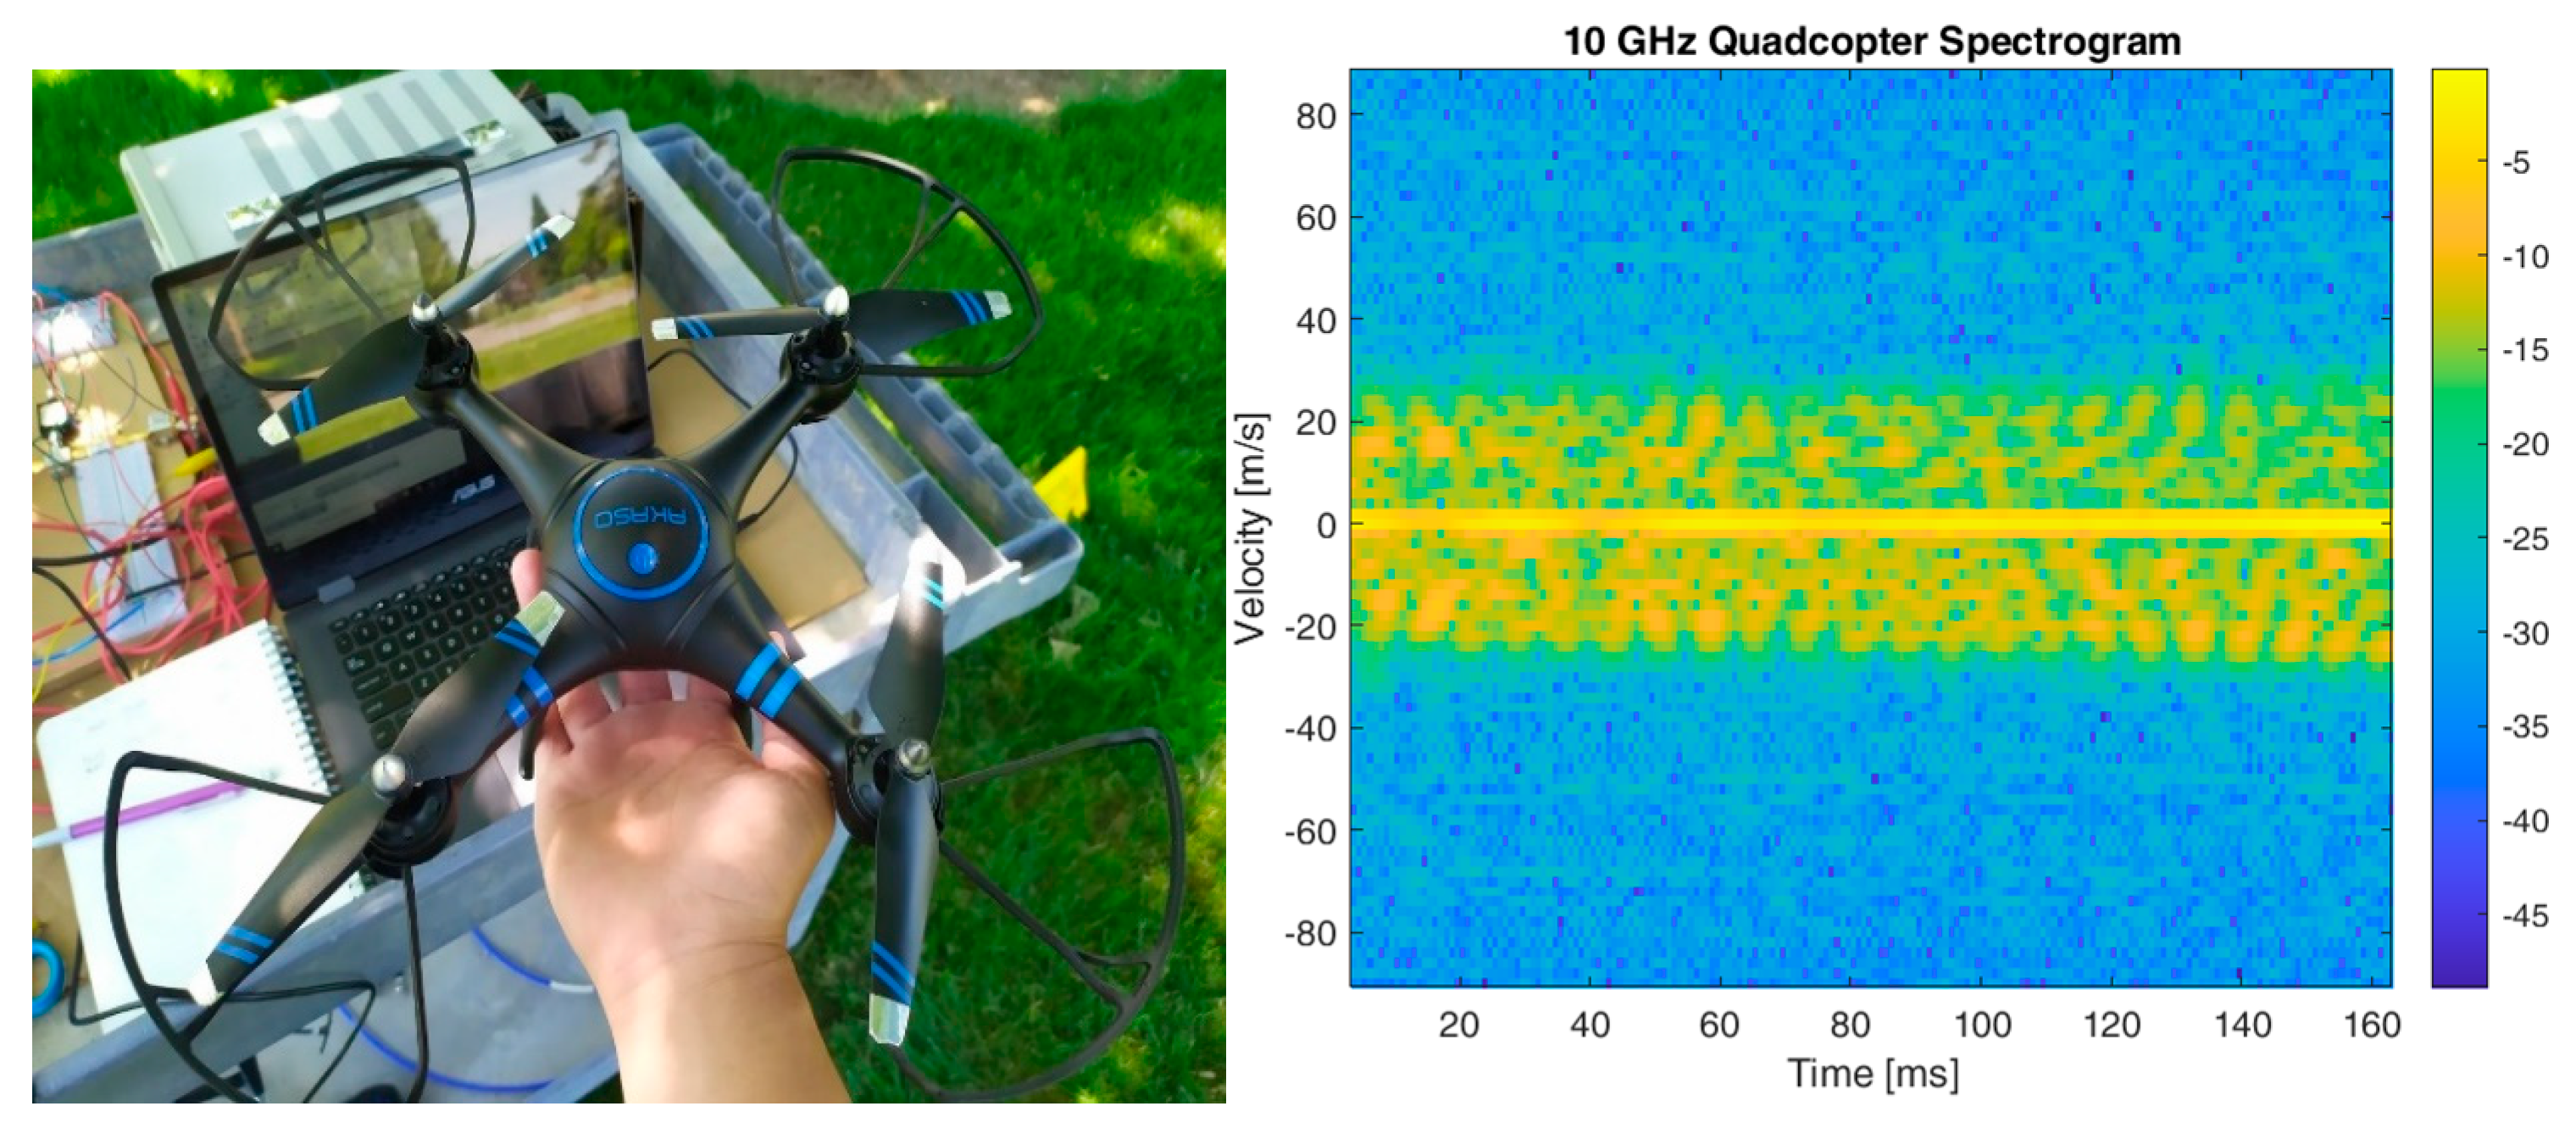
Figure 16 shows the medium-sized AKASO drone and its associated spectrogram. In this spectrogram, periodic shapes are present that are similar to the simulations. This spectrogram shows the behavior of a drone slowly descending in the vertical direction. This was observed through the maximum velocity of the blade tips, which was around 26 m/s.
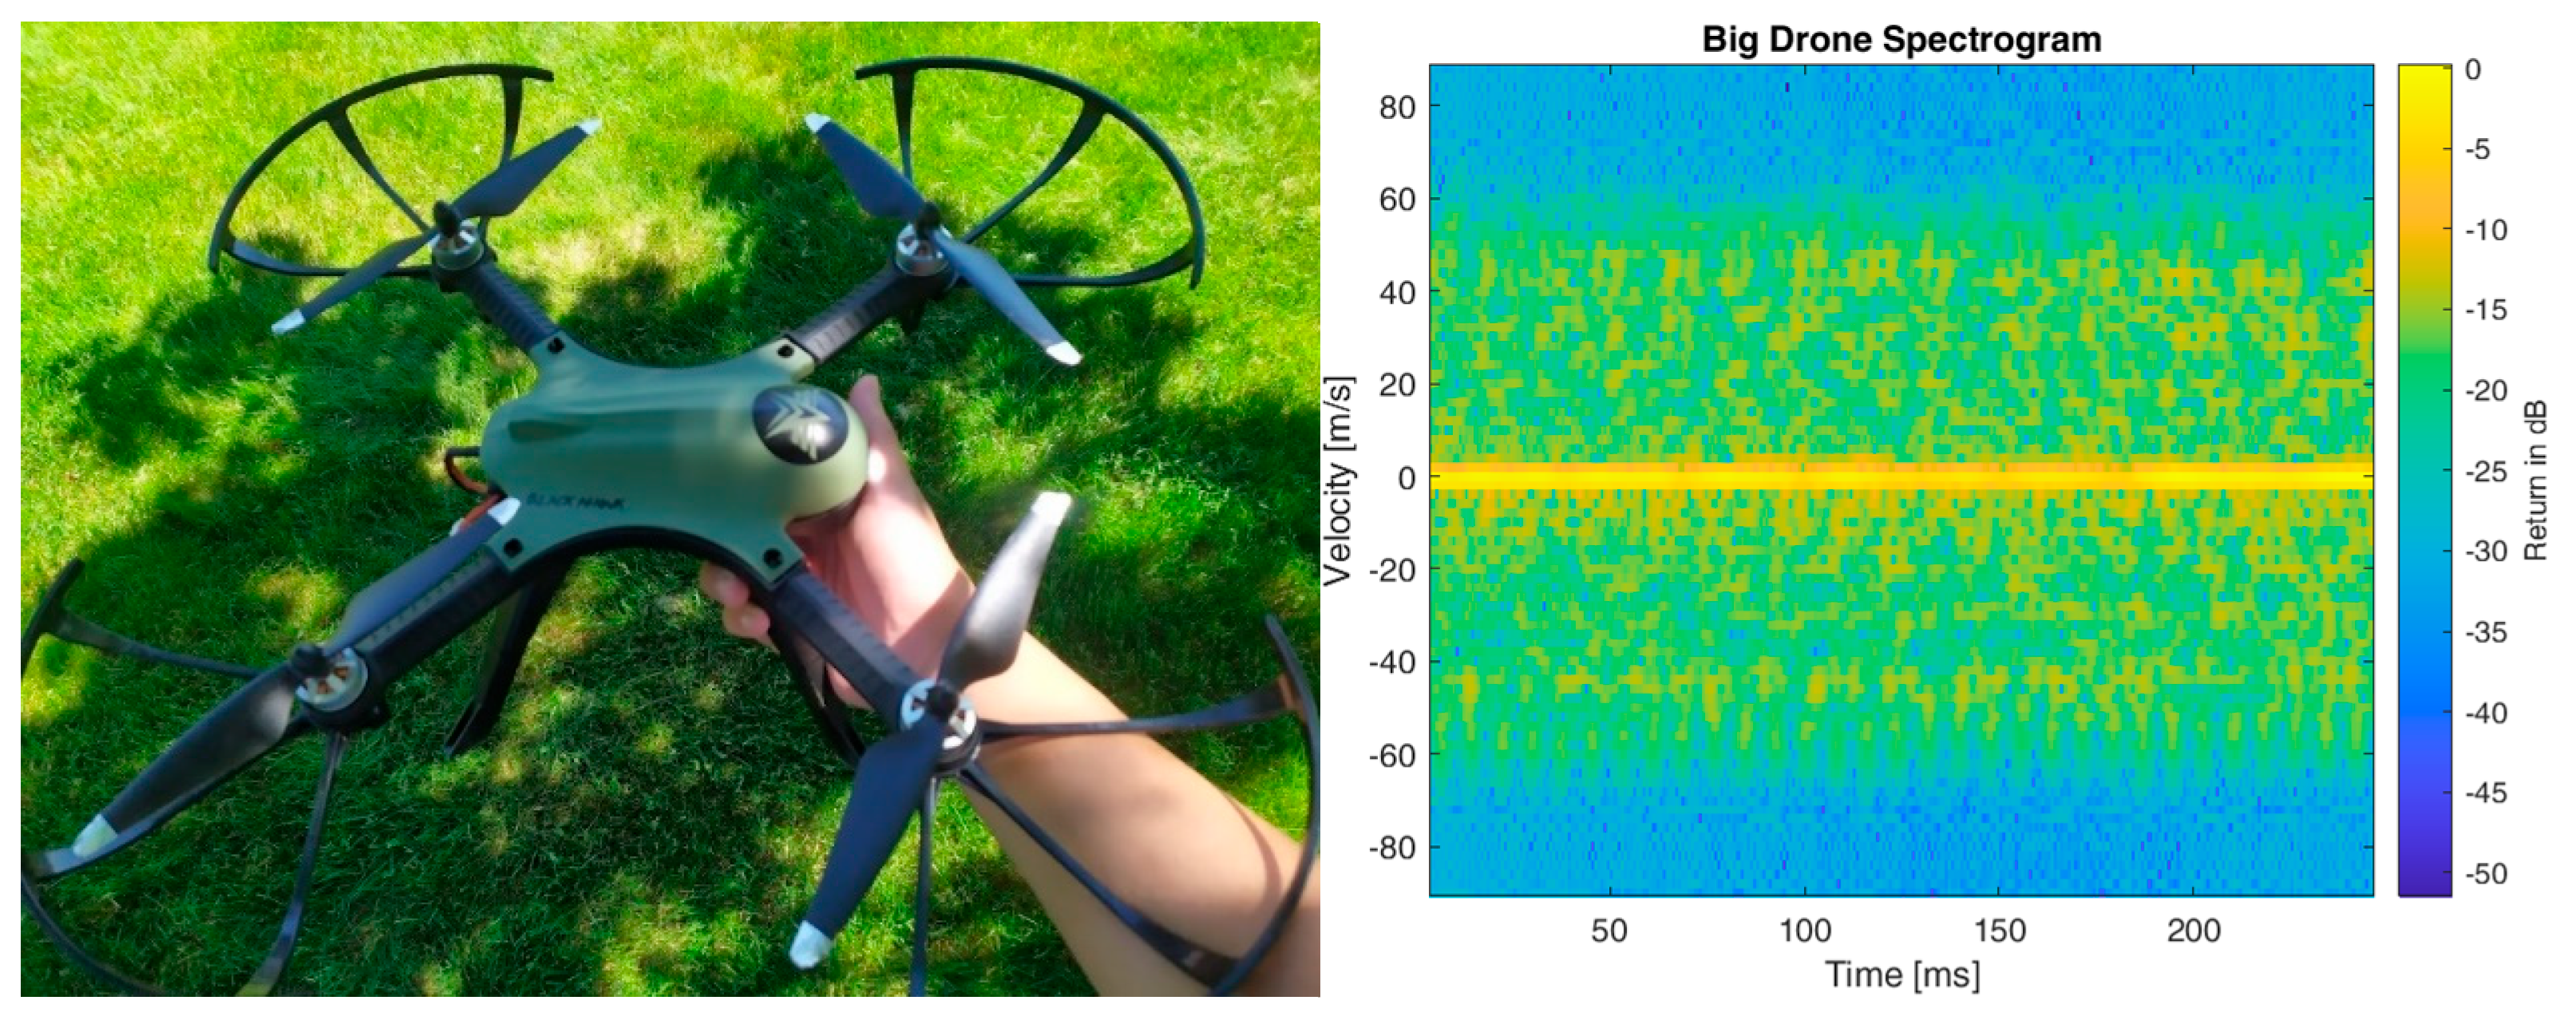
Figure 17 shows the large BlackHawk drone and its associated spectrogram. The maximum blade tip velocity was much higher compared to the AKASO drone. This is due to the overall weight of the UAV being higher than the AKASO. We observed that the negative velocities showed more pronounced micro-Doppler peaks compared to the positive side. This was because the positive peaks were hidden behind the arms of the drone, concealing the sharp micro-Doppler pattern.
5.3. Bird Characteristics
In this section, the setup for collecting data on birds is explained. Bird flights were collected with a 10-GHz radar at Shaver’s Creek, a bird sanctuary near Penn State University. Most of the birds in this aviary are disabled, but this did not significantly affect their flight patterns. Through the help of the trainers at Shaver’s Creek, birds flew from perch to perch, as the radar system recorded the induced Doppler shifts. The enclosure was wooden with wire meshing in between columns. Since the radar system only tracks radial movement, the enclosure did not play a role in the spectrogram quality. The reflections from the wall behind the bird did not affect its micro-Doppler signature. However, this was not verified by a bird flight outside of the enclosure.
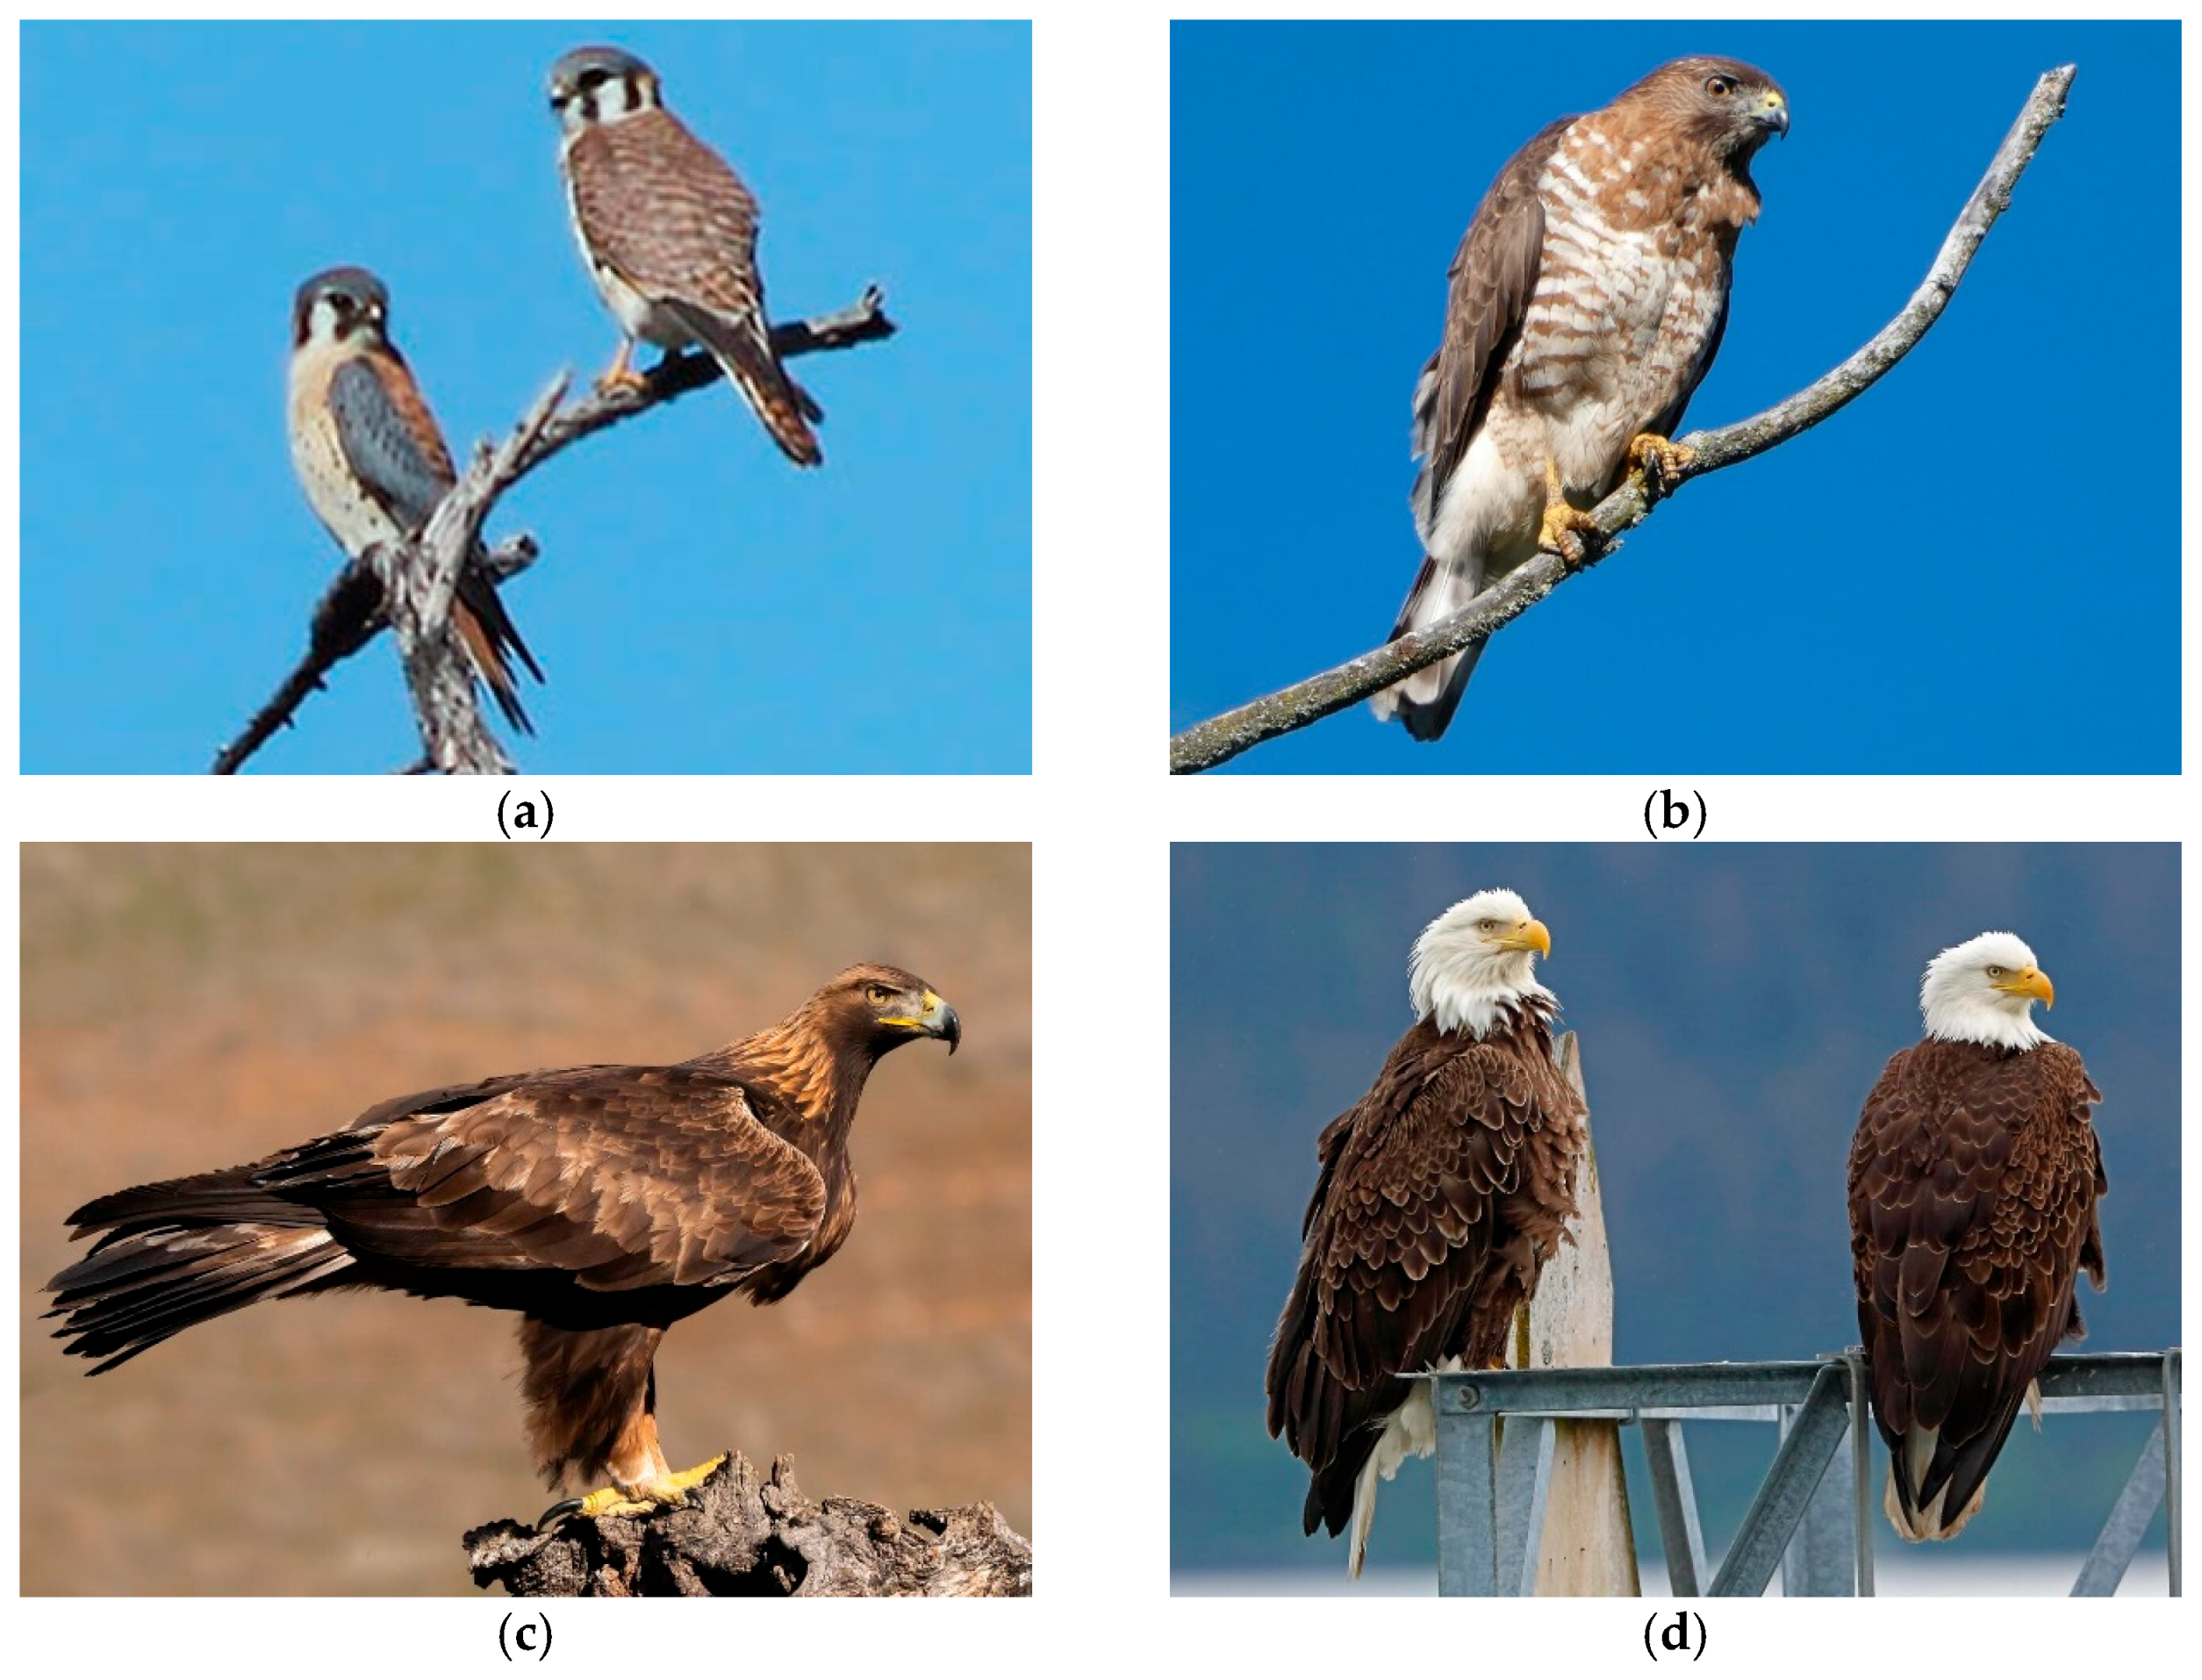
Figure 18 shows the bird enclosure and radar system. Four different birds were used in this experiment: a bald eagle, golden eagle, broad-winged hawk, and American kestrel. These are shown in
Figure 19 (obtained from
https://www.allaboutbirds.org/guide/, accessed on 11 March 2022).
The physical characteristics of each bird are provided in
Table 6.
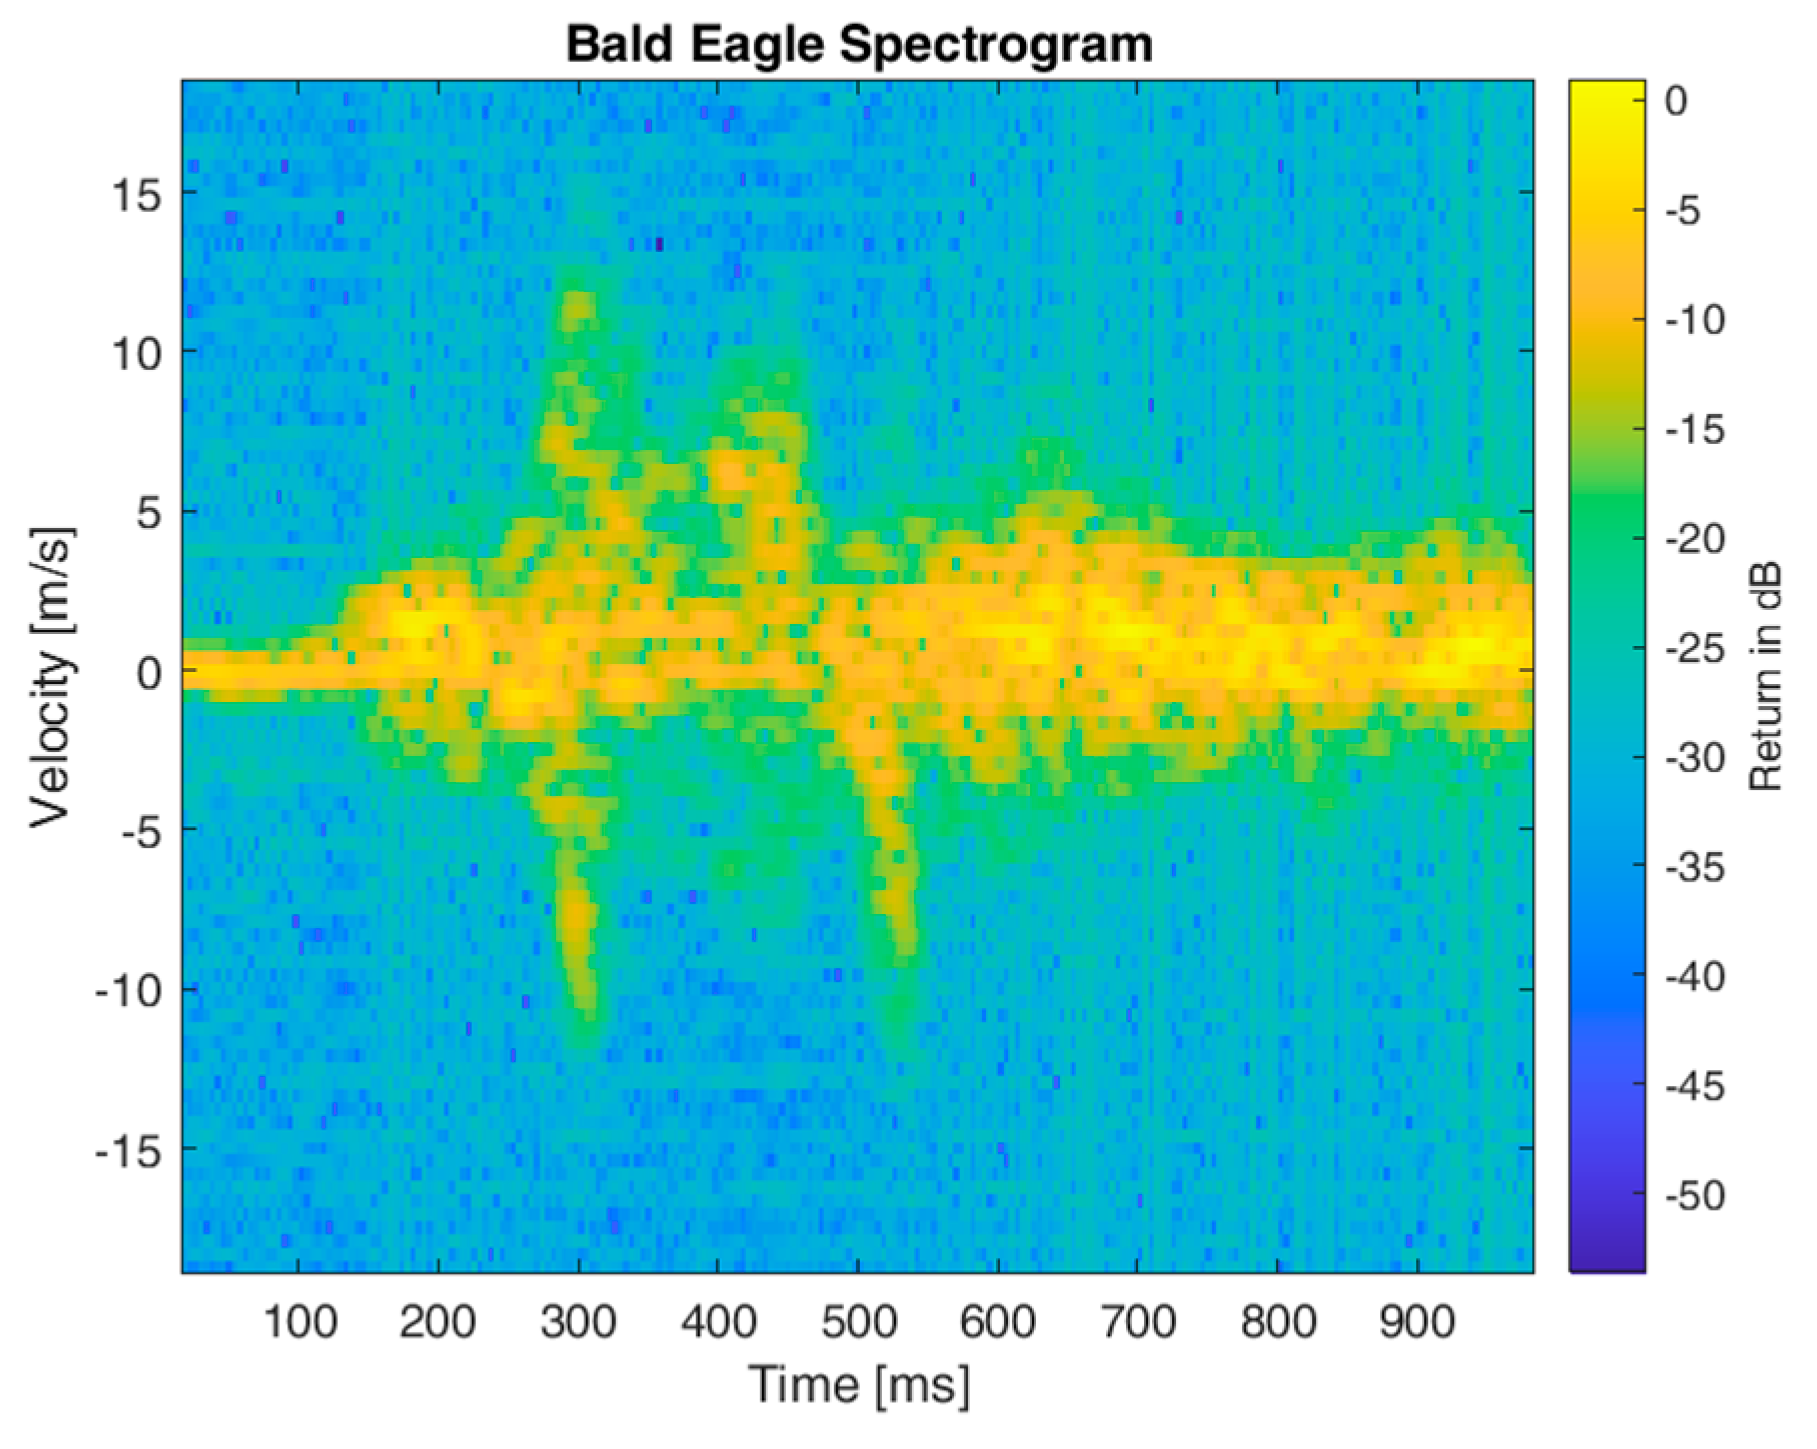
Figure 20 shows the bald eagle spectrogram. Within this spectrogram, a large velocity bandwidth is initially observable at around 300 ms. This represents the downstroke of the bird, quickly followed by an upward flap. The back half of the spectrogram shows the soaring of the bird, as it mechanically controls the rest of the flight.
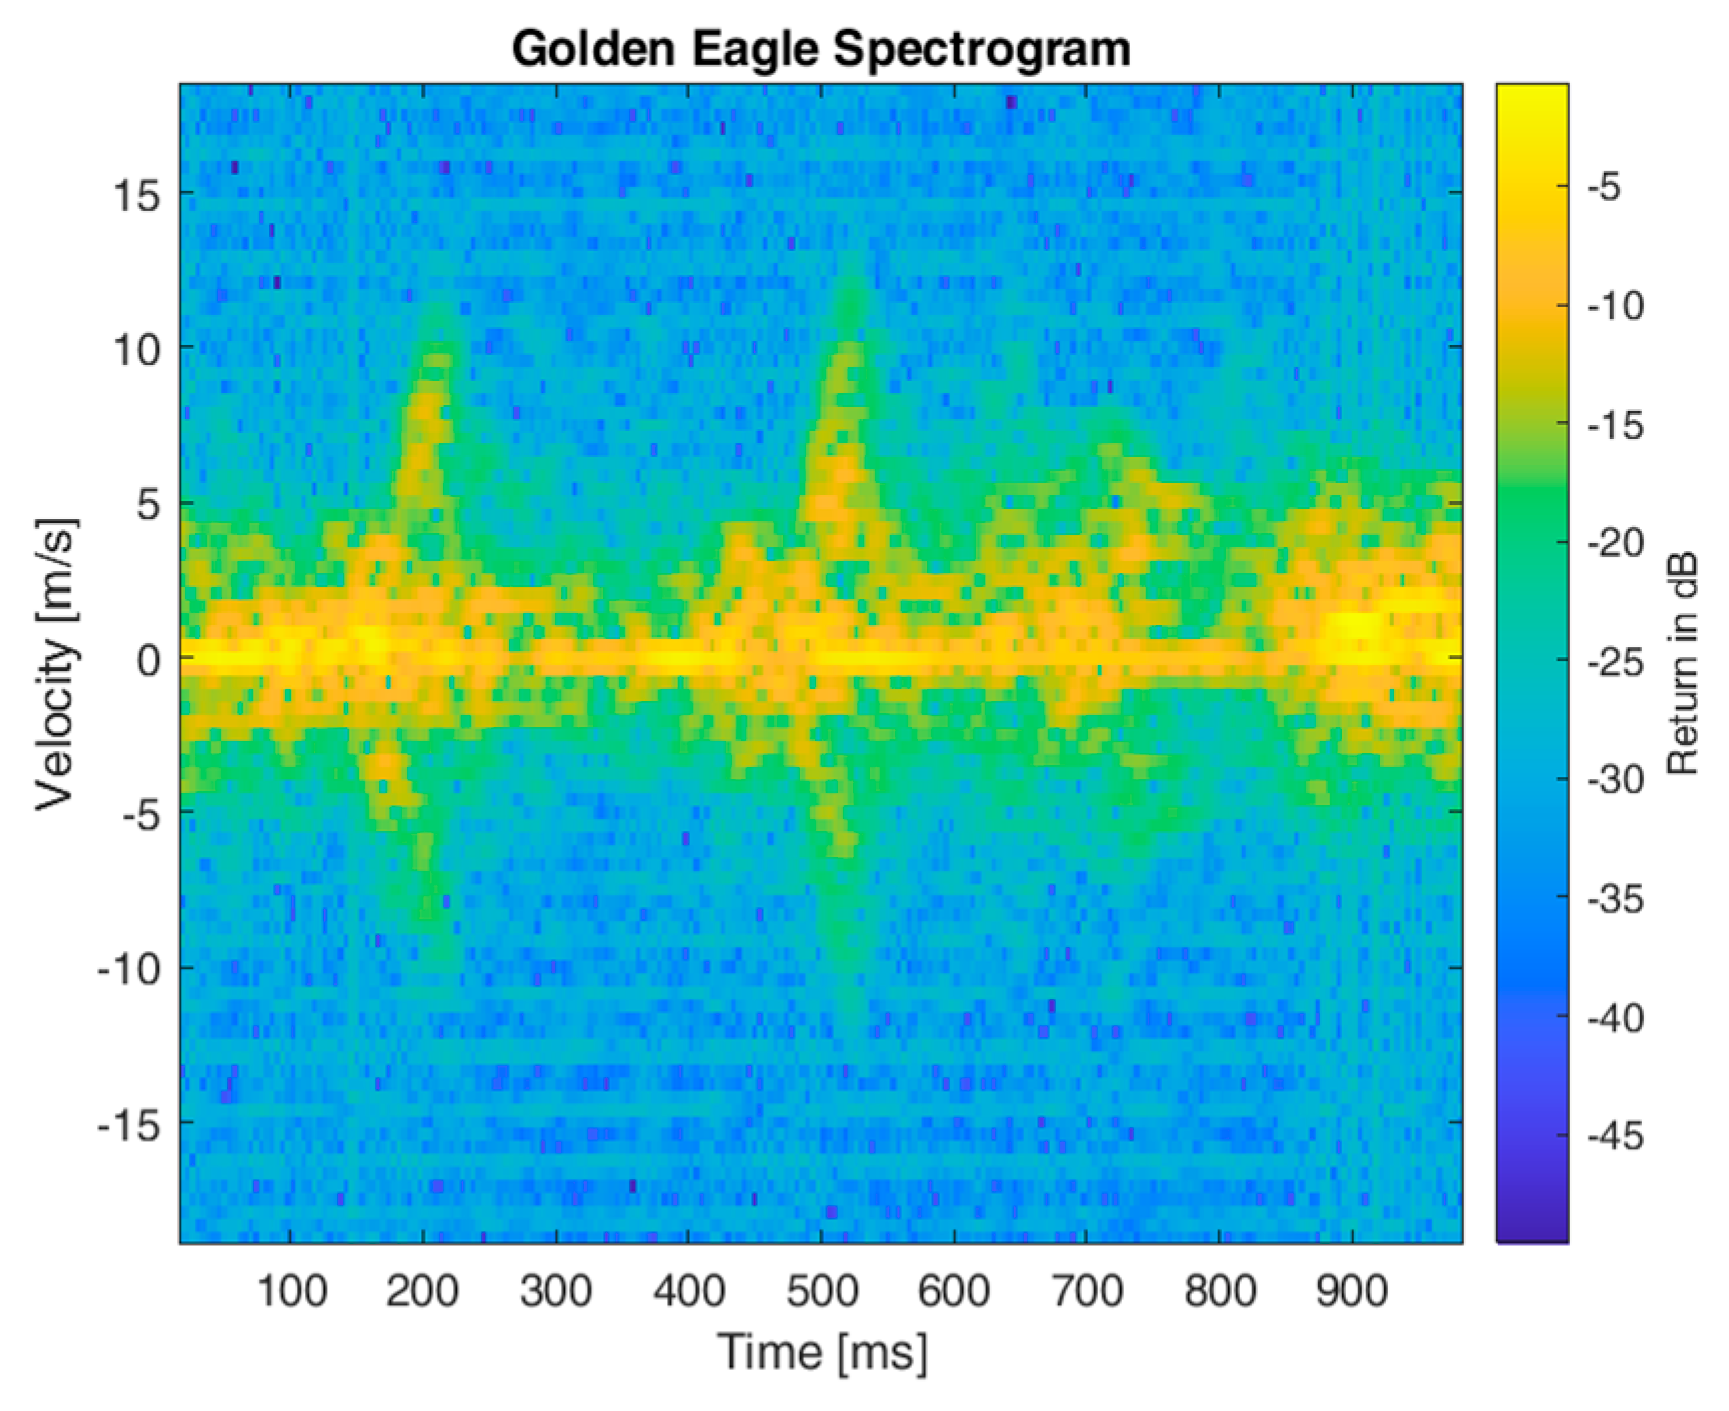
Figure 21 shows the golden eagle spectrogram. The golden eagle spectrogram is quite similar to the bald eagle, with strong flaps present at 200 and 500 ms. Unlike the UAVs, the flapping is not consistently periodic because flapping requires large amounts of energy. If the birds had a larger environment to fly in, the micro-Doppler signatures may look quite different because soaring would be more viable.
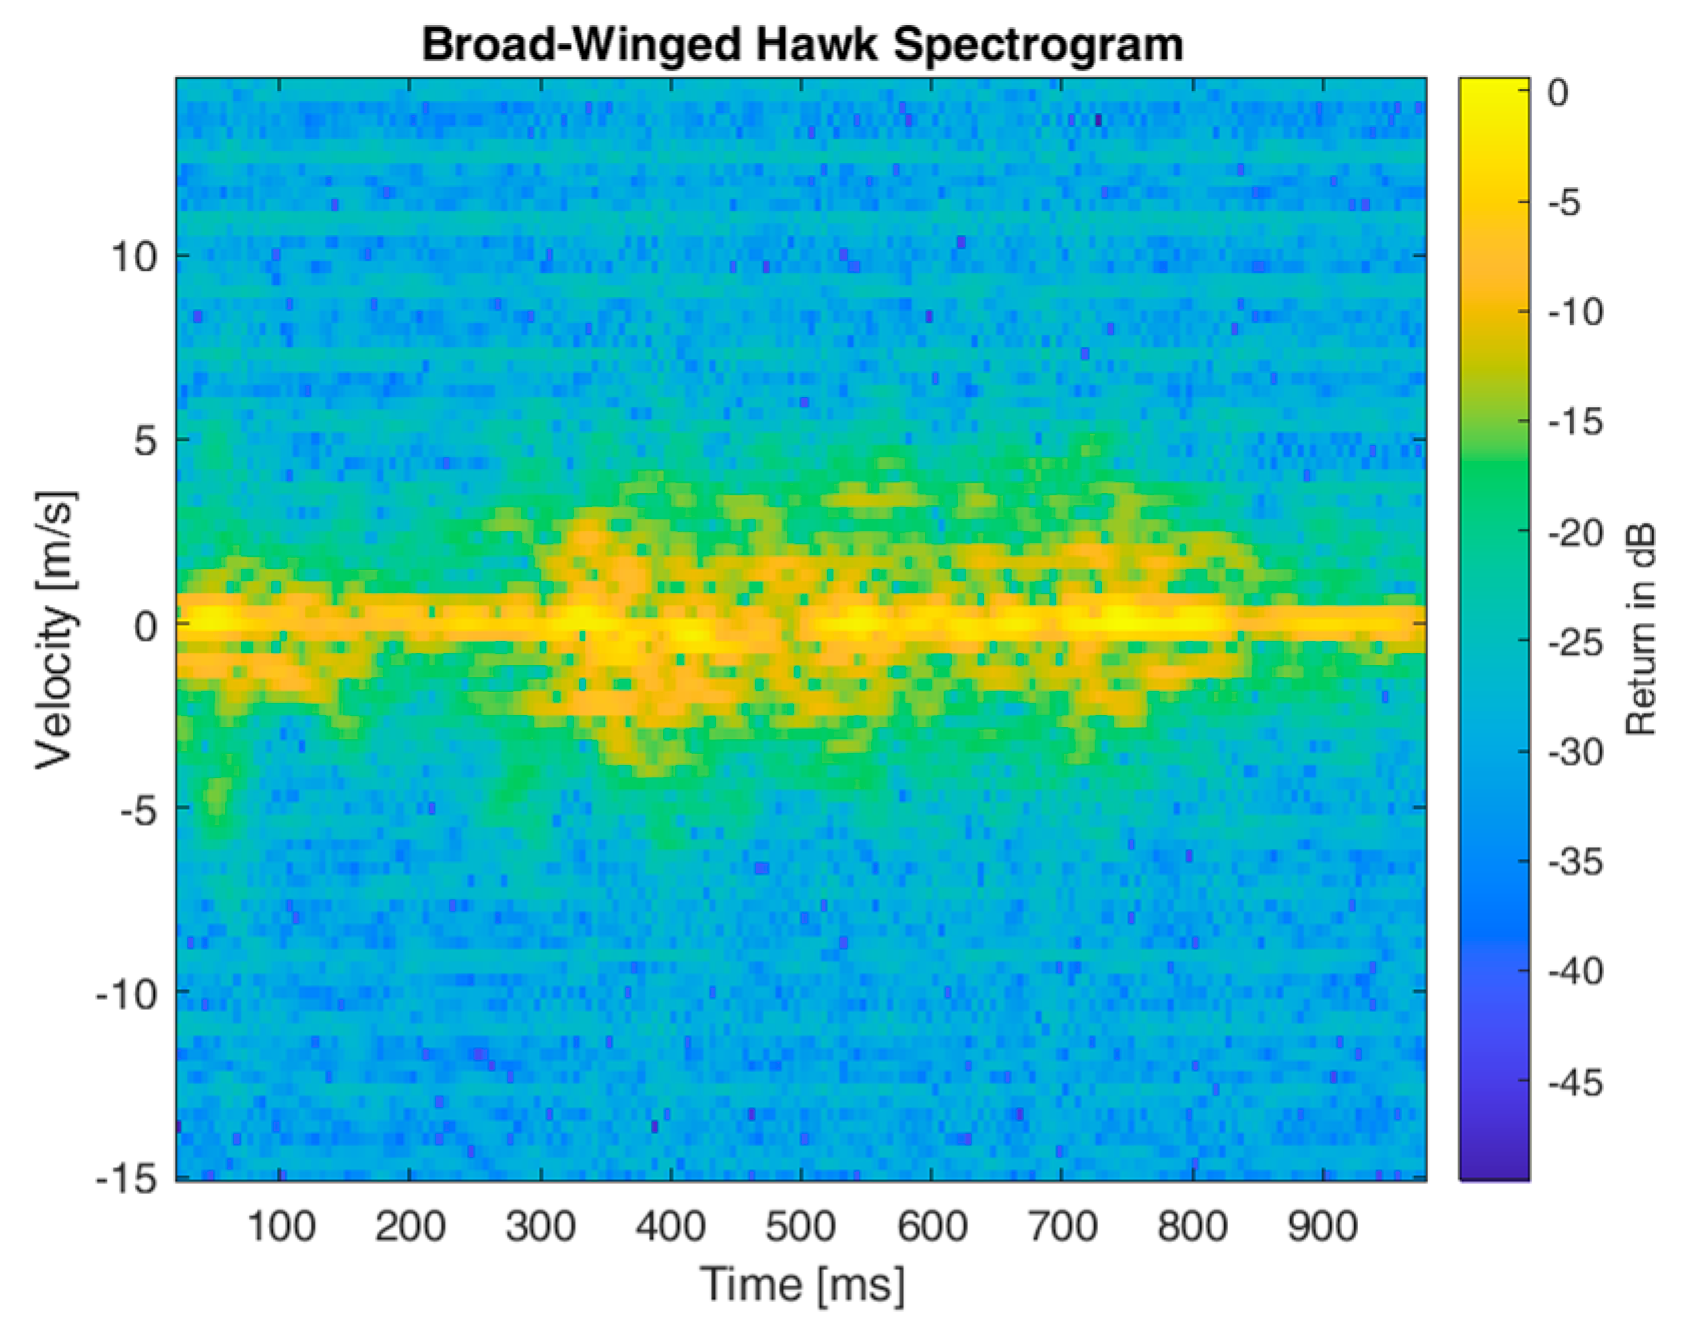
Figure 22 shows the spectrogram for the broad-winged hawk. The broad-winged hawk is the second smallest bird. Smaller birds require a higher periodicity in flaps compared to eagles, but their flaps do not need to be as strong because they are supporting a smaller payload. The micro-Doppler signature is quite cluttered because the body of the bird undulates. This makes the peaks of the wing flaps less pronounced. The maximum velocity achieved by the broad-winged hawk was around 5 m/s.
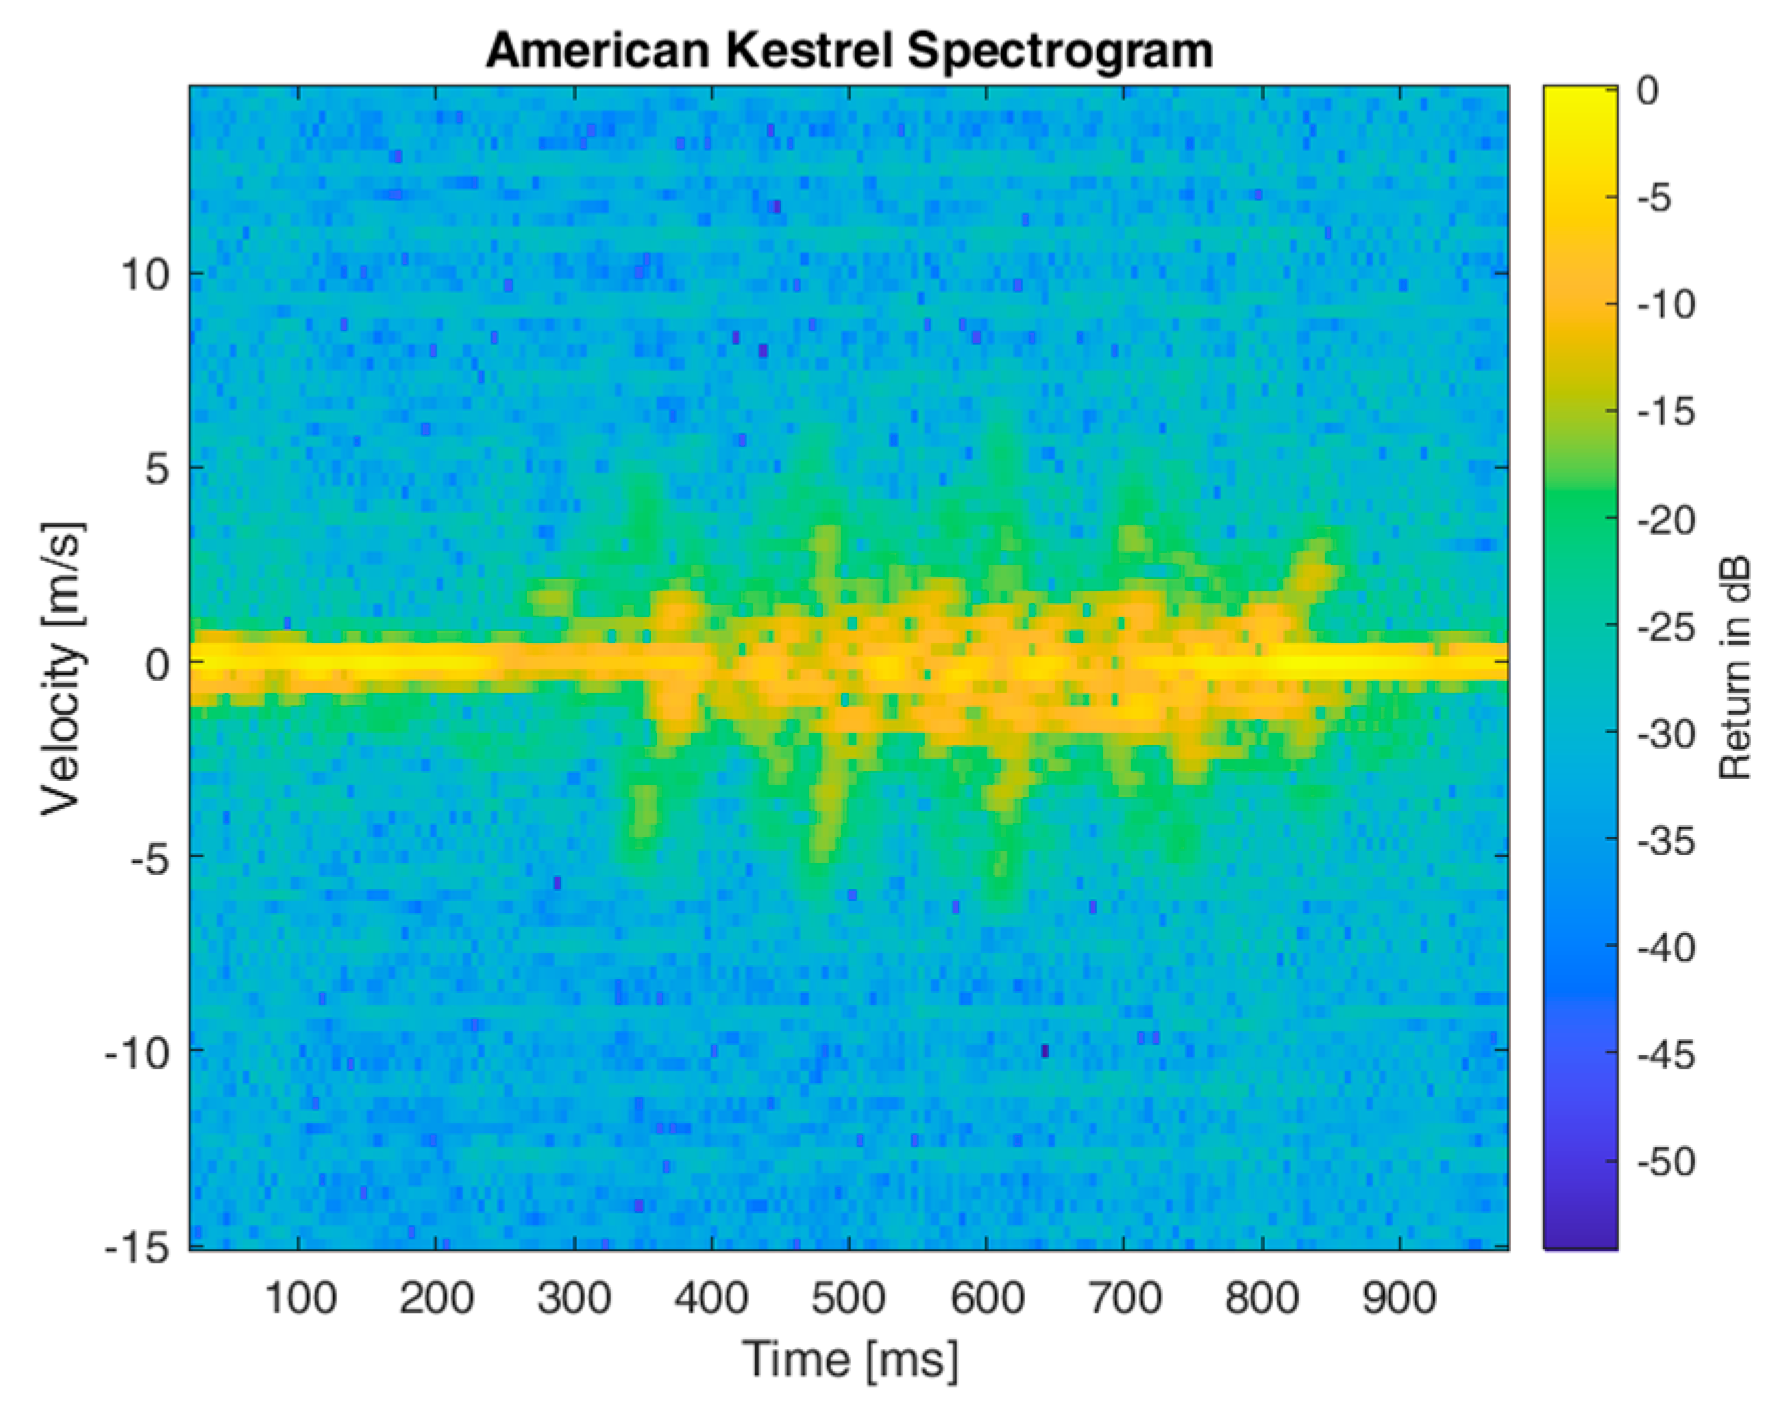
Figure 23 is the spectrogram of an American kestrel. Similar to the broad-winged hawk, the total Doppler bandwidth was quite small, but the flapping periodicity was higher than the big birds.
While
Figure 20,
Figure 21,
Figure 22 and
Figure 23 depict the spectrograms of each bird flying almost horizontally from one end of its enclosure to the other,
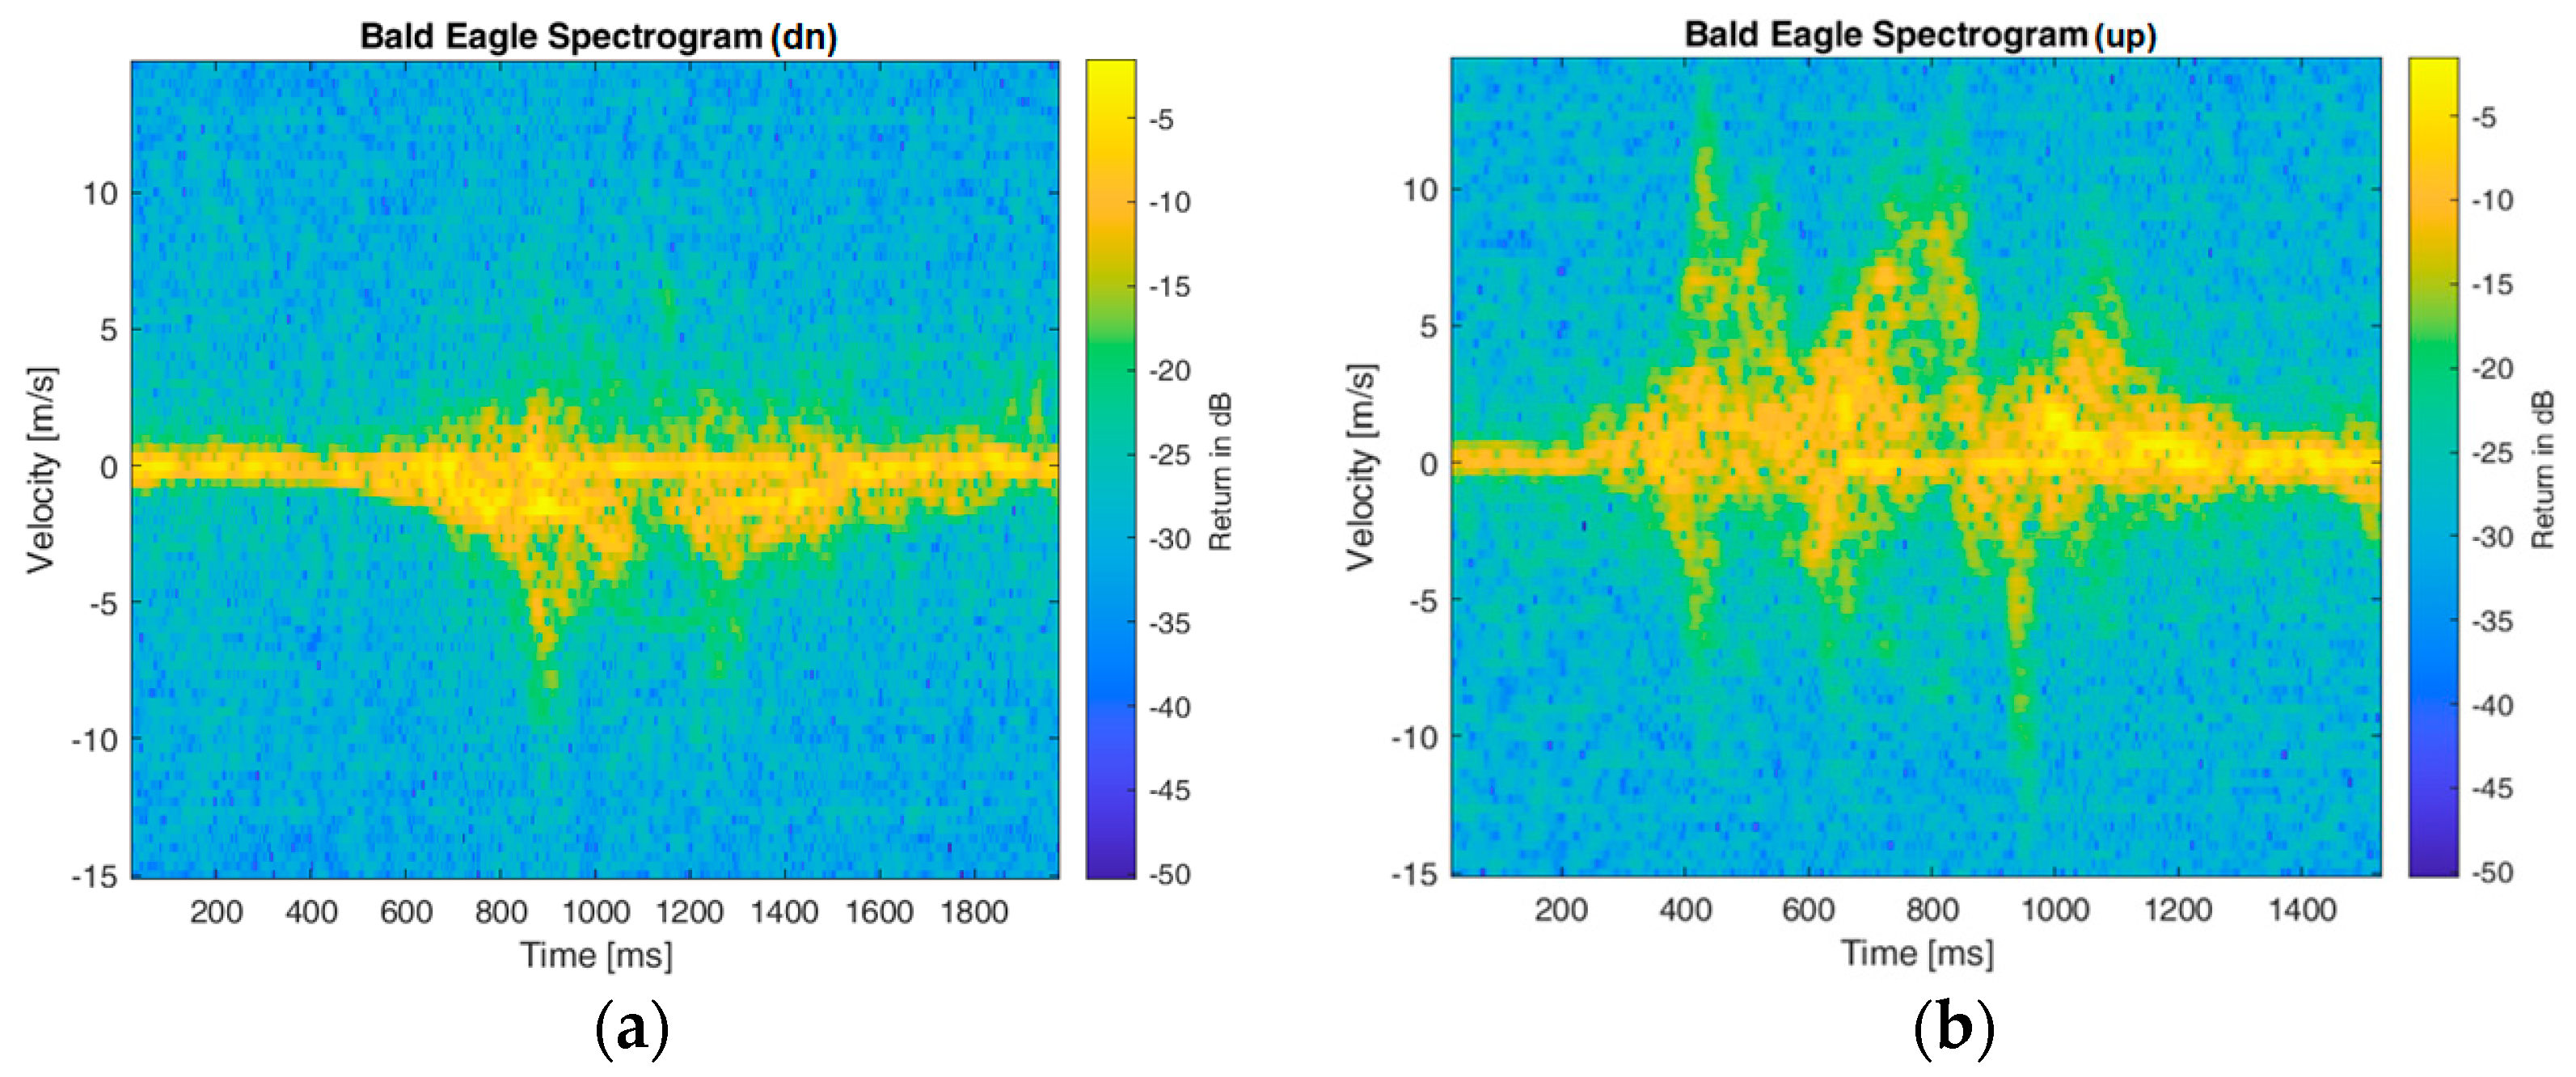
Figure 24 shows a comparison between a bald eagle flying down vs. flying up. Both flight types (flying down and flying up) were collected independently and separately, as the bird flew from one end of its enclosure to the other. The micro-Doppler bandwidth is larger when flying up, which makes sense because the wings need to flap harder to generate more thrust (similar to the quadcopter). Through bird data collection, the biggest challenge was getting the birds to fly. On hot days, the birds did not want to cooperate. This resulted in large recordings (5–10 min) for only a couple of recorded flights.
6. Target Classification
For classification, the main features of interest are the total Doppler bandwidth and the micro-Doppler periodicity. With drones, the micro-Doppler bandwidth is much larger than the birds due to the high RPM of the spinning blades. In terms of periodicity, the drones have a constant micro-Doppler pattern because it is necessary to stay in flight. However, birds are not constantly flapping their wings.
6.1. Spectrogram Generation and Curation
For classification, a large dataset was essential for providing confident results. To achieve this, many flights of each drone and bird were recorded. For the UAVs, the flights were snipped into equal segments. The radar-reflected data from the targets (UAVs and birds) were processed to generate spectrograms. Only the spectrograms that contained the micro-Doppler signatures were retained for further analysis.
A MATLAB script was used to read every WAV file within a folder and generate spectrograms. The titles and axis labels were removed for each spectrogram, saved as PNG files, and stored in the database.
Before the images were classified within the TensorFlow environment, each image was set to 128 × 128 with a batch size of 32 and converted to grayscale.
6.2. Support Vector Machine
For classification efforts, a Support Vector Machine (SVM) was utilized [
30]. The SVM algorithm produces relatively high accuracy with low computational power. SVM is typically used in binary classification problems by separating two classes with an optimal hyperplane or decision boundary. This implies maximizing the distance between data points from the separate classes. By maximizing the distance between data points, images can be classified with higher confidence.
For classification efforts, the main features of concern are the micro-Doppler bandwidth and the micro-Doppler periodicity. The micro-Doppler bandwidth describes the maximum velocity achieved by the micro-motions, whereas the periodicity provides insight into how often the motion occurs.
6.3. UAV Classification
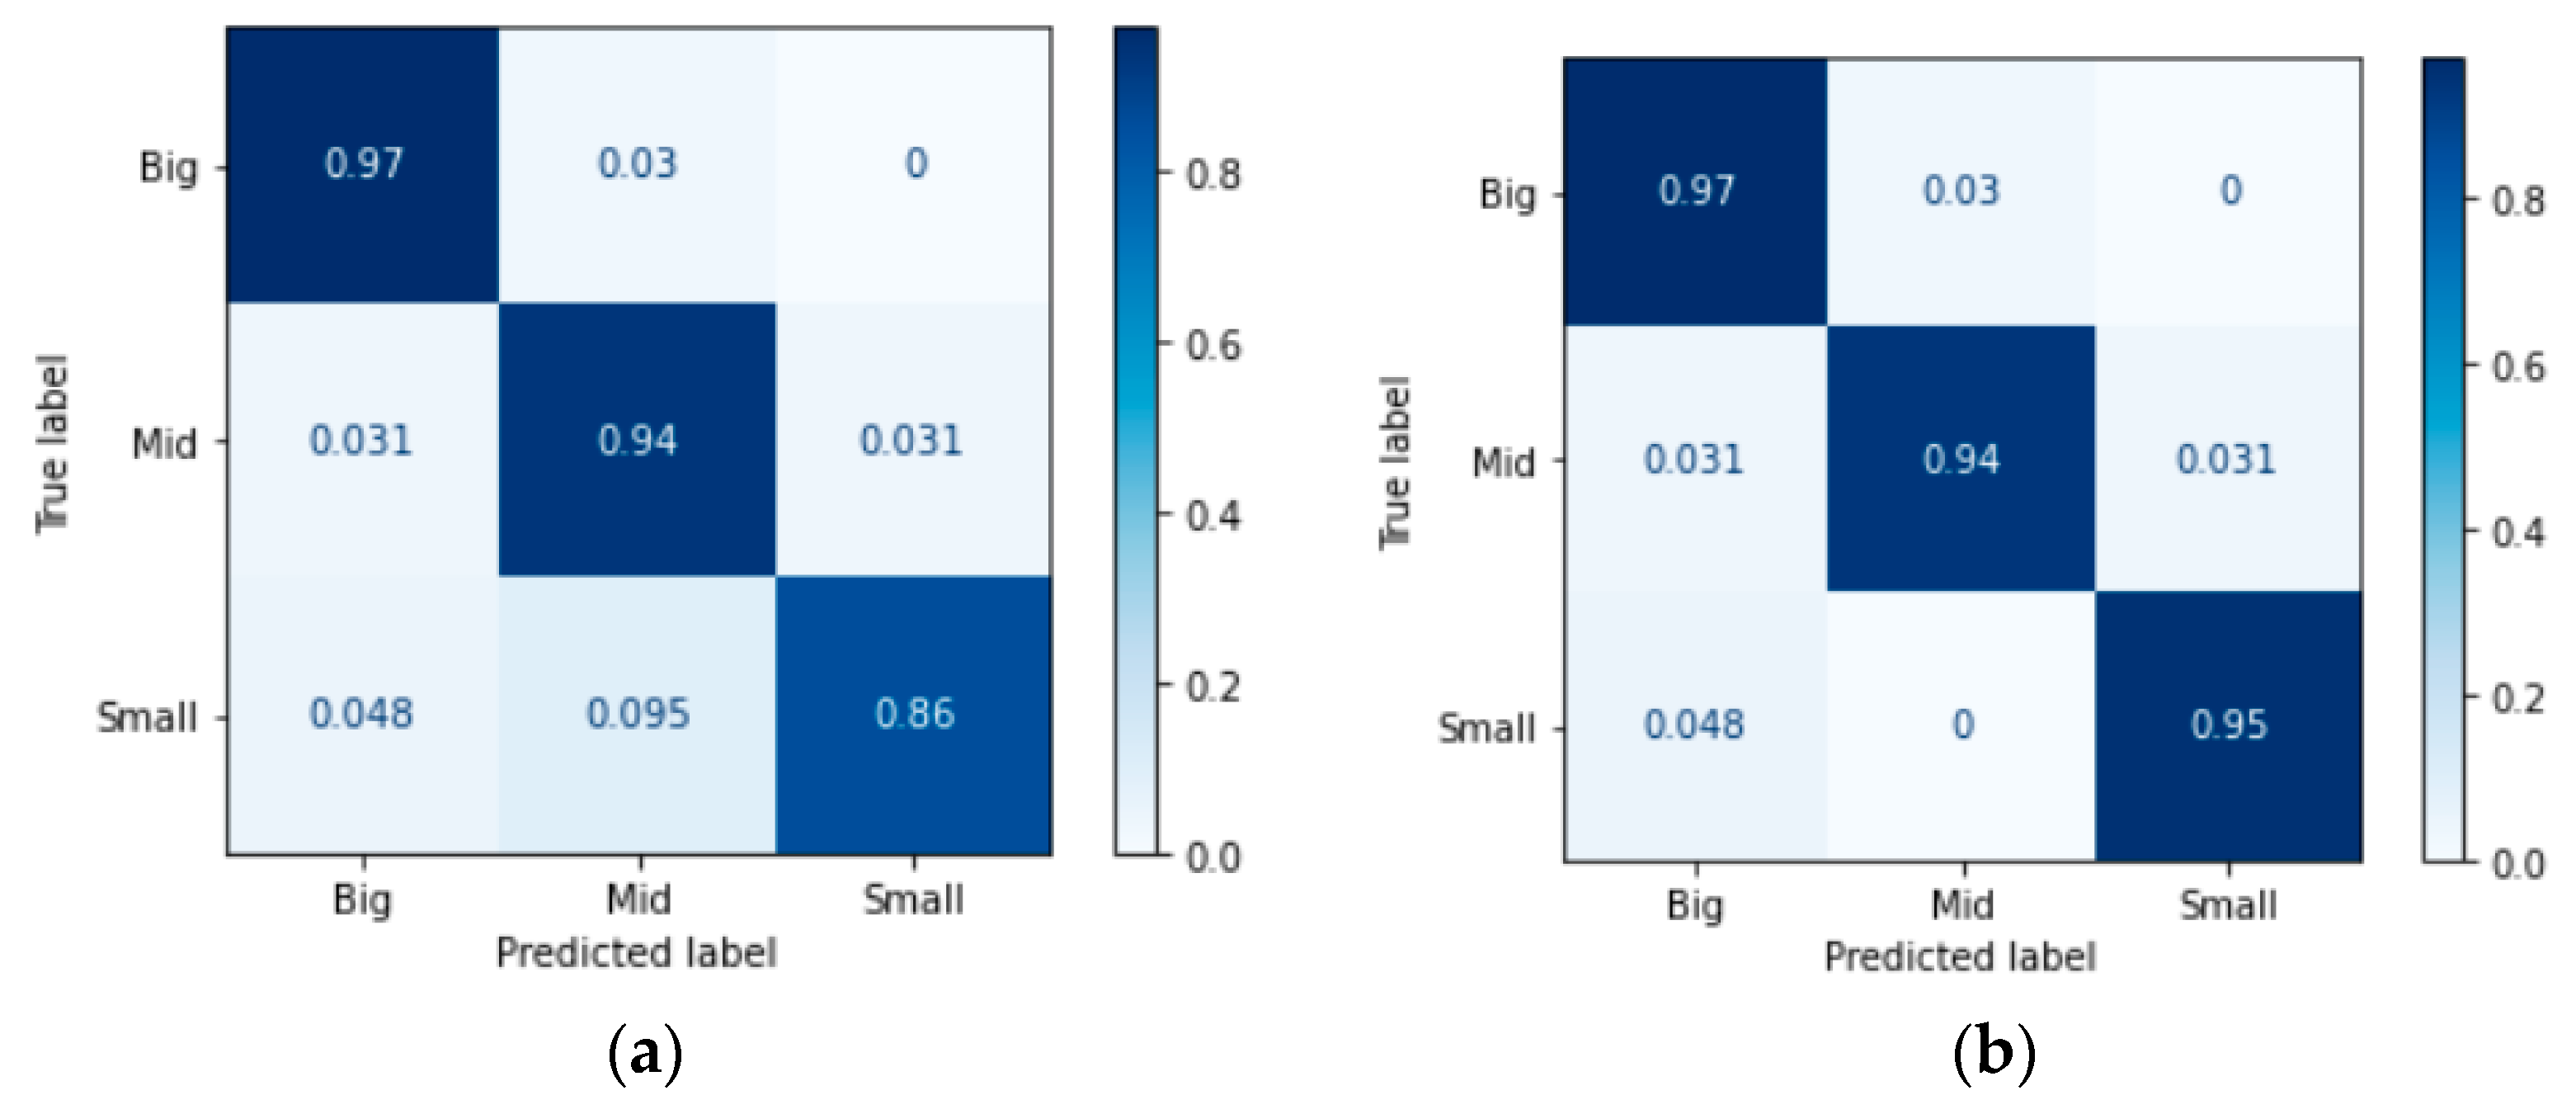
The first classification effort was conducted to distinguish between the three types of UAVs: small (Metabird), medium or mid (Akaso), and big (BlackHawk). The dataset was split into 80% for training and 20% for testing. For testing, 86 UAV images were used. 10-Fold cross-validation was utilized to test the performance of multiple classifiers. Eight different classifiers were tested, which were: Logistic Regression, K-Nearest Neighbor (KNN), Support Vector Machine (SVM), Linear SVM, Multi-layer Perceptron Classifier, Random Forest Classifier, Gaussian Naïve Bayes Classifier, and Adaboost Classifier. Among the above eight candidates, the top three performers were Logistic Regression, SVM, and Random Forest. Overall, each class was distinguished with a high confidence above 90%. In
Figure 25, the confusion matrices display the results of the classifiers. Out of the three top performers, the SVM classifier performed the best.
6.4. Binary (UAV vs. Bird) Classification
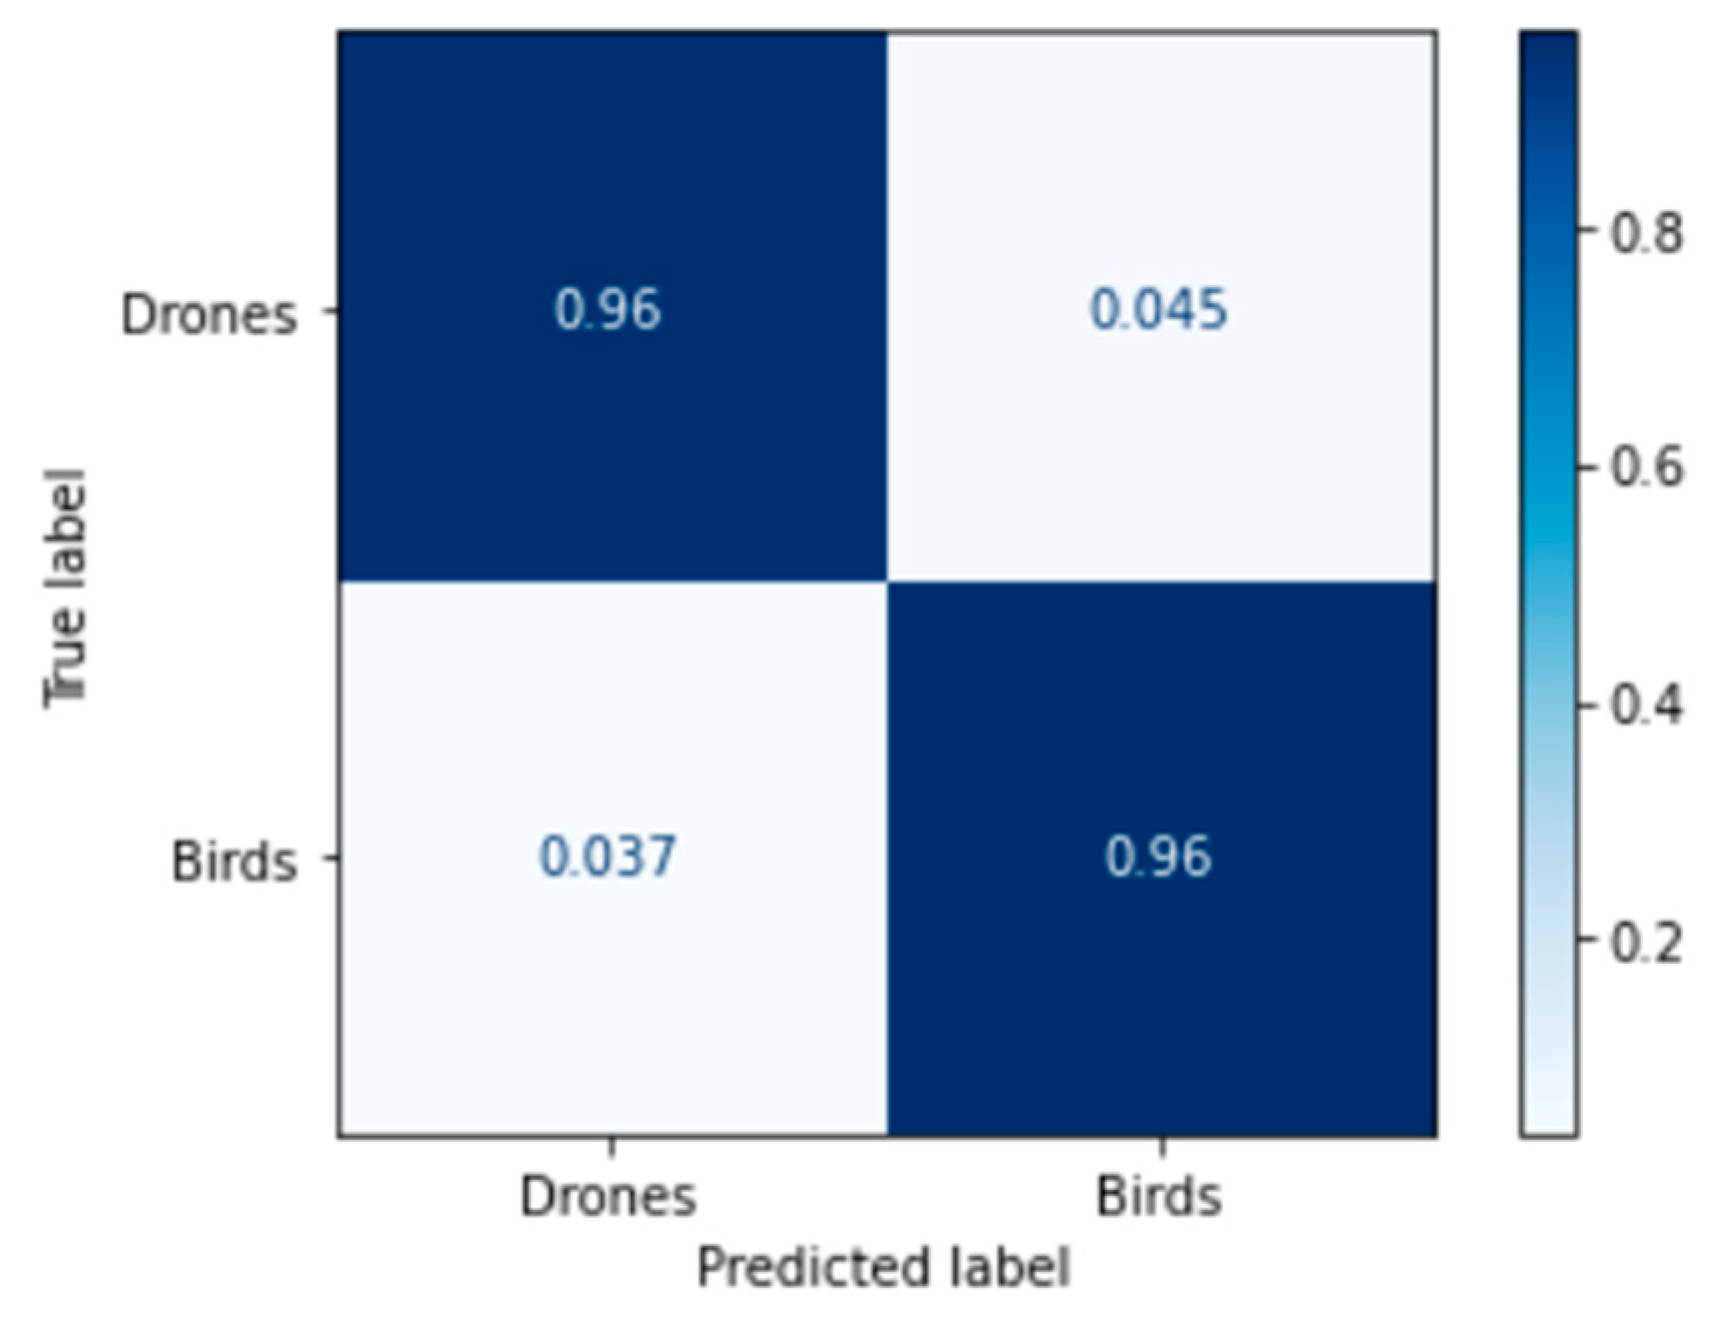
Subsequently, bird micro-Doppler images were included in the classification efforts. Initially, a binary classification task for distinguishing UAVs and birds was conducted. The sklearn.svm toolkit was utilized with the linear SVC classifier with a maximum iteration of 1000. The linear SVC uses the l2 penalty and a squared-hinge loss function with 0.0001 tolerance.
With a 2/3 training and 1/3 testing split, 152 drone images and 86 bird images were used for testing. The confusion matrix in
Figure 26 shows high accuracy in classifying between drones and birds with 96% accuracy. The precision for drones is 98% and for birds is 92%.
6.5. 5-Class Classification
For multiclass classification, the SVM classifier utilizes a one-versus-rest scheme. This strategy splits a five-class dataset into multiple binary-classification problems. In this classification problem, the three separate UAVs are considered in addition to the two categories of birds, namely, big and small bird categories. The big birds consist of the bald and golden eagles, while the small birds pertain to the broad-winged hawk and American kestrel.
Figure 27 shows the confusion matrix for the 5 classes.
It is noted that the quadcopters and small birds are classified with strong confidence, while the Metabird and the big birds have a harder time. For the big birds, the confusion is across the board, but is mostly mistaken for a small bird. The inaccuracy within the small UAV class, the Metabird, may be due to the smaller number of images available for training and testing. Most of the mispredictions of the Metabird were from the other drones.
7. Conclusions
In this paper, we analyzed micro-Doppler data collected by a custom-designed radar system utilized in different scenarios with a variety of targets, such as UAVs and birds. A dataset was created based on the micro-Doppler images obtained, and classification results were achieved with high confidence. Different characteristics of target detection were explored, including the landscape and the behavior of the target. Using a custom-built 10-GHz CW radar, over 700 images were collected and used for target distinction. For classification between UAV sizes, an accuracy of 90% was observed, whereas for the binary classification of two classes, namely birds and UAVs, an accuracy of 96% was obtained. More specific classification among the five classes showed an accuracy of 85%.
Some limitations of our work include the fact that the bird data were obtained under non-natural conditions because the birds were caged and could not be observed in full flight. In addition, the data were limited to the observation angles that were available at the test site. Furthermore, drone data were acquired under limited conditions of flying towards and away from the radar, but not performing maneuvers. Future work should address some of the limitations stated above.
Future work in this field would also include methods for automating a method for detecting targets with a low-powered SDR, then notifying and turning on the 10-GHz radar to collect the micro-Doppler signature. This would allow for more efficient automatic target recognition.
Another avenue for future work would involve the distinction of UAV motion as the target rolls and pitches in different directions. Due to the cluttered motions in the varying velocities, it would be of interest to design an algorithm for separating these rotor velocities and characterizing the overall target motion. Detecting micro-Doppler signatures in urban or cluttered areas would also be beneficial.
Using micro-Doppler images, classification efforts regarding UAV motions and target recognition can be confidently characterized.
Author Contributions
Conceptualization, R.M.N. and R.B.; methodology, B.T.; software, B.T.; validation, R.M.N., B.T. and R.B.; formal analysis, R.M.N., B.T. and R.B.; investigation, B.T.; resources, R.M.N. and R.B.; data curation, B.T.; writing—original draft preparation, R.M.N.; writing—review and editing, R.M.N., B.T. and R.B.; visualization, B.T. and R.B.; supervision, R.M.N.; project administration, R.M.N. and R.B.; funding acquisition, R.M.N. All authors have read and agreed to the published version of the manuscript.
Funding
This research was funded by U.S. Office of Naval Research, grant number N00014-20-1-2064. We appreciate the assistance provided by the following individuals at Shaver’s Creek: Abigail Flanders, Joseph Whitehead, Shannon Davidow, Jon Kauffman, Jack Meyer, and Joshua Potter.
Data Availability Statement
The data are not publicly available due to sponsor restrictions.
Conflicts of Interest
The authors declare no conflict of interest. The funders had no role in the design of the study; in the collection, analyses, or interpretation of data; in the writing of the manuscript; or in the decision to publish the results.
References
- O’Malley, J. The no drone zone. Eng. Technol. 2019, 14, 34–38. [Google Scholar] [CrossRef]
- Federal Aviation Administration. How to Register Your Drone. Available online: https://www.faa.gov/uas/getting_started/register_drone (accessed on 20 March 2023).
- Pham, T.; Srour, N. TTCP AG-6: Acoustic detection and tracking of UAVs. In Proceedings of the SPIE Conference on Unattended/Unmanned Ground, Ocean, and Air Sensor Technologies and Applications VI, Orlando, FL, USA, 12–16 April 2004; pp. 24–30. [Google Scholar] [CrossRef]
- Bernardini, A.; Mangiatordi, F.; Pallotti, E.; Capodiferro, L. Drone detection by acoustic signature identification. In Proceedings of the 2017 IS&T International Symposium on Electronic Imaging (EI 2017), Burlingame, CA, USA, 29 January–2 February 2017; pp. 60–64. [Google Scholar] [CrossRef]
- Liu, H.; Qu, F.; Liu, Y.; Zhao, W.; Chen, Y. A drone detection with aircraft classification based on a camera array. IOP Conf. Ser. Mater. Sci. Eng. 2018, 322, 052005. [Google Scholar] [CrossRef]
- Omkar, S.N.; Asogekar, N.; Rathi, S. Detection, tracking and classification of rogue drones using computer vision. Int. J. Eng. Appl. Sci. Technol. 2022, 7, 11–19. [Google Scholar] [CrossRef]
- Hammer, M.; Hebel, M.; Borgmann, B.; Laurenzis, M.; Arens, M. Potential of lidar sensors for the detection of UAVs. In Proceedings of the SPIE Conference on Laser Radar Technology and Applications XXIII, Orlando, FL, USA, 15–19 April 2018; pp. 1063605-1–1063605-7. [Google Scholar] [CrossRef]
- Salhi, M.; Boudriga, N. Multi-array spherical lidar system for drone detection. In Proceedings of the 22nd International Conference on Transparent Optical Networks (ICTON), Bari, Italy, 19–23 July 2020; pp. 1–5. [Google Scholar] [CrossRef]
- de Wit, J.J.M.; Harmanny, R.I.A.; Prémel-Cabic, G. Micro-Doppler analysis of small UAVs. In Proceedings of the 9th European Radar Conference, Amsterdam, The Netherlands, 31 October–2 November 2012; pp. 210–213. [Google Scholar]
- Rahman, S.; Robertson, D.A. Radar micro-Doppler signatures of drones and birds at K-band and W-band. Sci. Rep. 2018, 8, 17396. [Google Scholar] [CrossRef] [PubMed]
- Zhang, Y.D.; Xiang, X.; Li, Y.; Chen, G. Enhanced micro-Doppler feature analysis for drone detection. In Proceedings of the 2021 IEEE Radar Conference (RadarConf21), Online, 7–14 May 2021; pp. 1–4. [Google Scholar] [CrossRef]
- Molchanov, P.; Egiazarian, K.; Astola, J.; Harmanny, R.I.A.; de Wit, J.J.M. Classification of small UAVs and birds by micro-Doppler signatures. In Proceedings of the 10th European Radar Conference, Nuremberg, Germany, 9–11 October 2013; pp. 172–175. [Google Scholar]
- Harmanny, R.I.A.; de Wit, J.J.M.; Cabic, G.P. Radar micro-Doppler feature extraction using the spectrogram and the cepstrogram. In Proceedings of the 11th European Radar Conference, Rome, Italy, 8–10 October 2014; pp. 165–168. [Google Scholar] [CrossRef]
- Markow, J.; Balleri, A. Examination of drone micro-Doppler and JEM/HERM signatures. In Proceedings of the 2020 IEEE Radar Conference (RadarConf20), Online, 21–25 September 2020; pp. 1–6. [Google Scholar] [CrossRef]
- Gérard, J.; Tomasik, J.; Morisseau, C.; Rimmel, A.; Vieillard, G. Micro-Doppler signal representation for drone classification by deep learning. In Proceedings of the 28th European Signal Processing Conference (EUSIPCO), Online, 18–21 January 2021; pp. 1561–1565. [Google Scholar] [CrossRef]
- Doppler, C. Über das farbige Licht der Doppelsterne und einiger anderer Gestirne des Himmels. Abh. Königlich Böhmischen Ges. Wiss. 1843, 5, 465–482. [Google Scholar]
- Chen, V.C. The Micro-Doppler Effect in Radar, 2nd ed.; Artech House: Norwood, MA, USA, 2019; p. 19. [Google Scholar]
- Wu, Q.; Zhao, J.; Zhang, Y.; Huang, Y. Radar micro-Doppler signatures model simulation and feature extraction of three typical LSS targets. In Proceedings of the 6th International Conference on Information Science and Control Engineering (ICISCE), Shanghai, China, 20–22 December 2019; pp. 1103–1108. [Google Scholar] [CrossRef]
- Zaugg, S.; Saporta, G.; Van Loon, E.; Schmaljohann, H.; Liechti, F. Automatic identification of bird targets with radar via patterns produced by wing flapping. J. R. Soc. Interface 2008, 5, 1041–1053. [Google Scholar] [CrossRef]
- Gong, J.; Li, D.; Yan, J.; Hu, H.; Kong, D. Measurement and analysis of radar signals modulated by flapping wings of birds. IEEE Access 2022, 10, 85137–85145. [Google Scholar] [CrossRef]
- Fang, X.; Xiao, G. Rotor blades micro-Doppler feature analysis and extraction of small unmanned rotorcraft. IEEE Sens. J. 2020, 21, 3592–3601. [Google Scholar] [CrossRef]
- Kolev, N.; Sivkov, Y.; Sirakov, E. K band radar drone signatures. Inf. Secur. Int. J. 2020, 47, 349–354. [Google Scholar] [CrossRef]
- Passafiume, M.; Rojhani, N.; Collodi, G.; Cidronali, A. Modeling small UAV micro-Doppler signature using millimeter-wave FMCW radar. Electronics 2021, 10, 747. [Google Scholar] [CrossRef]
- Petrović, P.Z.; Savić, S.V.; Ilić, M.M. Electromagnetic modelling of micro-Doppler Signatures of commercial airborne drones. In Proceedings of the 29th Telecommunications Forum (TELFOR), Online, 23–24 November 2021; pp. 1–4. [Google Scholar] [CrossRef]
- Torvik, B.; Gusland, D.; Olsen, K.E. Signatures of small drones and birds as emerging targets. In Micro-Doppler Radar and Its Applications; Fioranelli, F., Griffiths, H., Ritchie, M., Balleri, A., Eds.; SciTech Publishing: Stevenage, UK, 2020; pp. 257–290. [Google Scholar]
- Chen, X.; Chen, W.; Rao, Y.; Huang, Y.; Guan, J.; Dong, Y. Progress and prospects of radar target detection and recognition technology for flying birds and unmanned aerial vehicles. J. Radars 2020, 9, 803–827. [Google Scholar] [CrossRef]
- Liu, J.; Xu, Q.Y.; Chen, W.S. Classification of bird and drone targets based on motion characteristics and random forest model using surveillance radar data. IEEE Access 2021, 9, 160135–160144. [Google Scholar] [CrossRef]
- Palamà, R.; Fioranelli, F.; Ritchie, M.; Inggs, M.; Lewis, S.; Griffiths, H. Measurements and discrimination of drones and birds with a multi-frequency multistatic radar system. IET Radar Sonar Navig. 2021, 15, 841–852. [Google Scholar] [CrossRef]
- Musa, S.A.; Abubakar, S.A.; Girei, S.H.; Habush, A.H.H. A preliminary investigation of copter drone detection by using forward scattering radar. J. Aerosp. Eng. Mech. 2022, 6, 588–595. [Google Scholar] [CrossRef]
- Cortes, C.; Vapnik, V. Support-vector networks. Mach. Learn. 1995, 20, 273–297. [Google Scholar] [CrossRef]
Figure 1.
Radar signal interaction with a single quadcopter rotor.
Figure 1.
Radar signal interaction with a single quadcopter rotor.
Figure 2.
Plots related to a single propeller drone. (a) power spectral density; (b) spectrogram.
Figure 2.
Plots related to a single propeller drone. (a) power spectral density; (b) spectrogram.
Figure 3.
Simulated quadcopter time signal.
Figure 3.
Simulated quadcopter time signal.
Figure 4.
Simulated quadcopter frequency response, converted to velocity response.
Figure 4.
Simulated quadcopter frequency response, converted to velocity response.
Figure 5.
Simulated quadcopter spectrogram.
Figure 5.
Simulated quadcopter spectrogram.
Figure 6.
Spectrograms with different window sizes. (a) ; (b) ; (c) ; (d) .
Figure 6.
Spectrograms with different window sizes. (a) ; (b) ; (c) ; (d) .
Figure 7.
Simulated quadcopter results with shortened integration time.
Figure 7.
Simulated quadcopter results with shortened integration time.
Figure 8.
Different rotation accelerations. (a) Ascending; (b) Hovering; (c) Descending.
Figure 8.
Different rotation accelerations. (a) Ascending; (b) Hovering; (c) Descending.
Figure 9.
Block diagram of X-Band 10-GHz radar system.
Figure 9.
Block diagram of X-Band 10-GHz radar system.
Figure 10.
Photograph of X-Band 10-GHz breadboard radar system.
Figure 10.
Photograph of X-Band 10-GHz breadboard radar system.
Figure 11.
Photograph of field portable cart-mounted radar system.
Figure 11.
Photograph of field portable cart-mounted radar system.
Figure 12.
30° LOS antenna setup.
Figure 12.
30° LOS antenna setup.
Figure 13.
Outdoor drone data collection setup.
Figure 13.
Outdoor drone data collection setup.
Figure 14.
Akaso UAV with reflective tape on the blade tip.
Figure 14.
Akaso UAV with reflective tape on the blade tip.
Figure 15.
Metabird (small UAV) and its associated spectrogram.
Figure 15.
Metabird (small UAV) and its associated spectrogram.
Figure 16.
Akaso drone (medium UAV) and its associated spectrogram.
Figure 16.
Akaso drone (medium UAV) and its associated spectrogram.
Figure 17.
BlackHawk drone (large UAV) and its associated spectrogram.
Figure 17.
BlackHawk drone (large UAV) and its associated spectrogram.
Figure 18.
Bird data collection setup.
Figure 18.
Bird data collection setup.
Figure 19.
Bird types. (a) Small Bird 1: American kestrel; (b) Small Bird 2: Broad-winged hawk; (c) Big Bird 1: Golden eagle; (d) Big Bird 2: Bald eagle.
Figure 19.
Bird types. (a) Small Bird 1: American kestrel; (b) Small Bird 2: Broad-winged hawk; (c) Big Bird 1: Golden eagle; (d) Big Bird 2: Bald eagle.
Figure 20.
Spectrogram of the bald eagle.
Figure 20.
Spectrogram of the bald eagle.
Figure 21.
Spectrogram of the golden eagle.
Figure 21.
Spectrogram of the golden eagle.
Figure 22.
Spectrogram of the broad-winded hawk.
Figure 22.
Spectrogram of the broad-winded hawk.
Figure 23.
Spectrogram of the American kestrel.
Figure 23.
Spectrogram of the American kestrel.
Figure 24.
Bald eagle spectrograms. (a) Flying down; (b) Flying up.
Figure 24.
Bald eagle spectrograms. (a) Flying down; (b) Flying up.
Figure 25.
Confusion matrix results of classifier comparison for UAV classification. (a) Logistic Regression; (b) SVM; (c) Random Forest.
Figure 25.
Confusion matrix results of classifier comparison for UAV classification. (a) Logistic Regression; (b) SVM; (c) Random Forest.
Figure 26.
Drones vs. birds confusion matrix.
Figure 26.
Drones vs. birds confusion matrix.
Figure 27.
5-class confusion matrix. In the class description labels, “B_”, “M_”, and “S_” refer to big, medium, and small, respectively.
Figure 27.
5-class confusion matrix. In the class description labels, “B_”, “M_”, and “S_” refer to big, medium, and small, respectively.
Table 1.
Sensing methods advantages and disadvantages.
Table 1.
Sensing methods advantages and disadvantages.
| Sensor Type | Advantages | Disadvantages |
|---|
| Acoustic | No LOS
Low visibility
Low cost | Ineffective in noisy conditions
Ineffective in windy conditions |
| Camera | Easy operability
High accuracy | Very sensitive operability
High cost
Ineffective in darkness |
| Lidar | High accuracy | Expensive
Ineffective in foggy and rainy conditions
Very narrow FOV |
| Radar | Low-cost
Weather resistant
Robust | Targets have small visibility
Large FOV |
Table 2.
Simulation setup parameters.
Table 2.
Simulation setup parameters.
| Parameter | Value |
|---|
| Environment | Free space |
| Range | 10 m |
| Dwell time | 0.5 s |
| Sampling rate | 12 ksps |
| Number of rotors on drone | 4 |
| Blades per rotor | 2 |
| Average blade rotation rate () | 56 rps |
| Blade length | 0.1 m |
| Radar cross section | 0.3 m2 |
Table 3.
Radar system parameters.
Table 3.
Radar system parameters.
| Parameter | Value |
|---|
| Frequency | 10 GHz |
| Waveform | CW |
| Transmit power | +18 dBm |
| Antenna gain | 10 dBi |
| Receiver noise figure | 1.8 dB |
| Sampling rate | 12 ksps |
| Sampling interval | 500 ms |
Table 4.
Component specifications.
Table 4.
Component specifications.
| Component | Part # | Operating
Frequency | Gain | Noise
Figure | Power
Output | VDC | Current | Supplier |
|---|
| VCO | V2555C | 9.95–10.66 GHz | – | – | +12 dBm | 12 V | 150 mA | GMI |
| Power Splitter | ZX10-2-126-S+ | 7.4–12.6 GHz | – | – | – | – | – | Mini-Circuits |
| Attenuator | FW-12+ | DC–12 GHz | – | – | – | – | – | Mini-Circuits |
| Power Amplifier | ZX60-183-S+ | 6–18 GHz | 23 dB | – | +18.5 dBm | 5 V | 260 mA | Mini-Circuits |
| Horn Antenna | WR90 | 8.2–12.4 GHz | 10 dBi | – | – | – | – | A-InfoMW |
| Low Noise Amplifier 1 | APTMP5-08001200-3025-D6 | 8–12 GHz | 40 dB | 3 dB | +25 dBm 1 | 15 V | 450 mA | AmpliTech |
| Low Noise Amplifier 2 | ZX60-05113LN+ | 5–11 GHz | 19 dB | 1.8 dB | +12.2 dBm 1 | 5 V | 42 mA | Mini-Circuits |
| Band Pass Filter | ZVBP-10R5G-S+ | DC–40 GHz | – | – | – | – | – | Mini-Circuits |
| Frequency Mixer | IQB0618LK | 6–18 GHz | – | – | – | – | – | Marki Microwave |
| Low Pass Filter 1 | VLF-3400+ | DC–3.4 GHz | – | – | – | – | – | Mini-Circuits |
| Low Pass Filter 2 | EF502 | DC–100 kHz | – | – | – | – | – | Thorlabs |
Table 5.
UAV characteristics.
Table 5.
UAV characteristics.
| Dimension | Metabird | Akaso
Quadcopter | BlackHawk
Quadcopter |
|---|
| Weight | 10 gm (0.022 lb) | 750 gm (1.65 lb) | 1775 gm (3.87 lb) |
| Body length | 16 cm (6.3 in) | – | – |
| Wingspan | 33 cm (13 in) | 38.9 cm (15.3 in) | 77.7 cm (30.6 in) |
| End-to-end span | – | 19.5 cm (7.7 in) | 26.0 cm (10.2 in) |
| Blade axis to blade axis | – | 16.3 cm (6.4 in) | 22.0 cm (8.7 in) |
| Blade length | – | 7.0 cm (2.8 in) | 9.5 cm (3.7 in) |
| Height | – | 10.5 cm (4.1 in) | 12.0 cm (4.7 in) |
Table 6.
Bird characteristics.
Table 6.
Bird characteristics.
| Bird Feature | American
Kestrel | Broad-Winged Hawk | Golden Eagle | Bald Eagle |
|---|
| Weight | 68–163 gm (0.15–0.36 lb) | 340–454 gm (0.75–1 lb) | 2.95–6.12 kg (6.5–13.5 lb) | 3.00–6.30 kg (6.6–13.9 lb) |
| Length | 21.0–31.8 cm (8.25–12.5 in) | 34.3–44.5 cm (13.5–17.5 in) | 69.9–83.8 cm (27.5–33 in) | 71.1–96.5 cm (28–38 in) |
| Wingspan | 50.8–61.0 cm (20–24 in) | 81.3–101.6 cm (32–40 in) | 1.83–2.13 m (6–7 ft) | 1.83–2.29 m (6–7.5 ft) |
| Disclaimer/Publisher’s Note: The statements, opinions and data contained in all publications are solely those of the individual author(s) and contributor(s) and not of MDPI and/or the editor(s). MDPI and/or the editor(s) disclaim responsibility for any injury to people or property resulting from any ideas, methods, instructions or products referred to in the content. |
© 2023 by the authors. Licensee MDPI, Basel, Switzerland. This article is an open access article distributed under the terms and conditions of the Creative Commons Attribution (CC BY) license (https://creativecommons.org/licenses/by/4.0/).


