
The Use of Instantaneous Overcurrent Relay in Determining the Threshold Current and Voltage for Optimal Fault Protection and Control in Transmission Line


Abstract
:1. Introduction
- The use of wavelet transforms to determine the threshold voltage and current of faulty transmission lines;
- A designed model to determine the tripping time and the operating time of instantaneous over current relay at different fault-resistant values;
- A protection scheme was designed to evaluate and determine the response time of relays in different zones.
Contribution of the Proposed Algorithm
2. Proposed Algorithm
2.1. Wavelet Transform
2.2. Data Acquisition
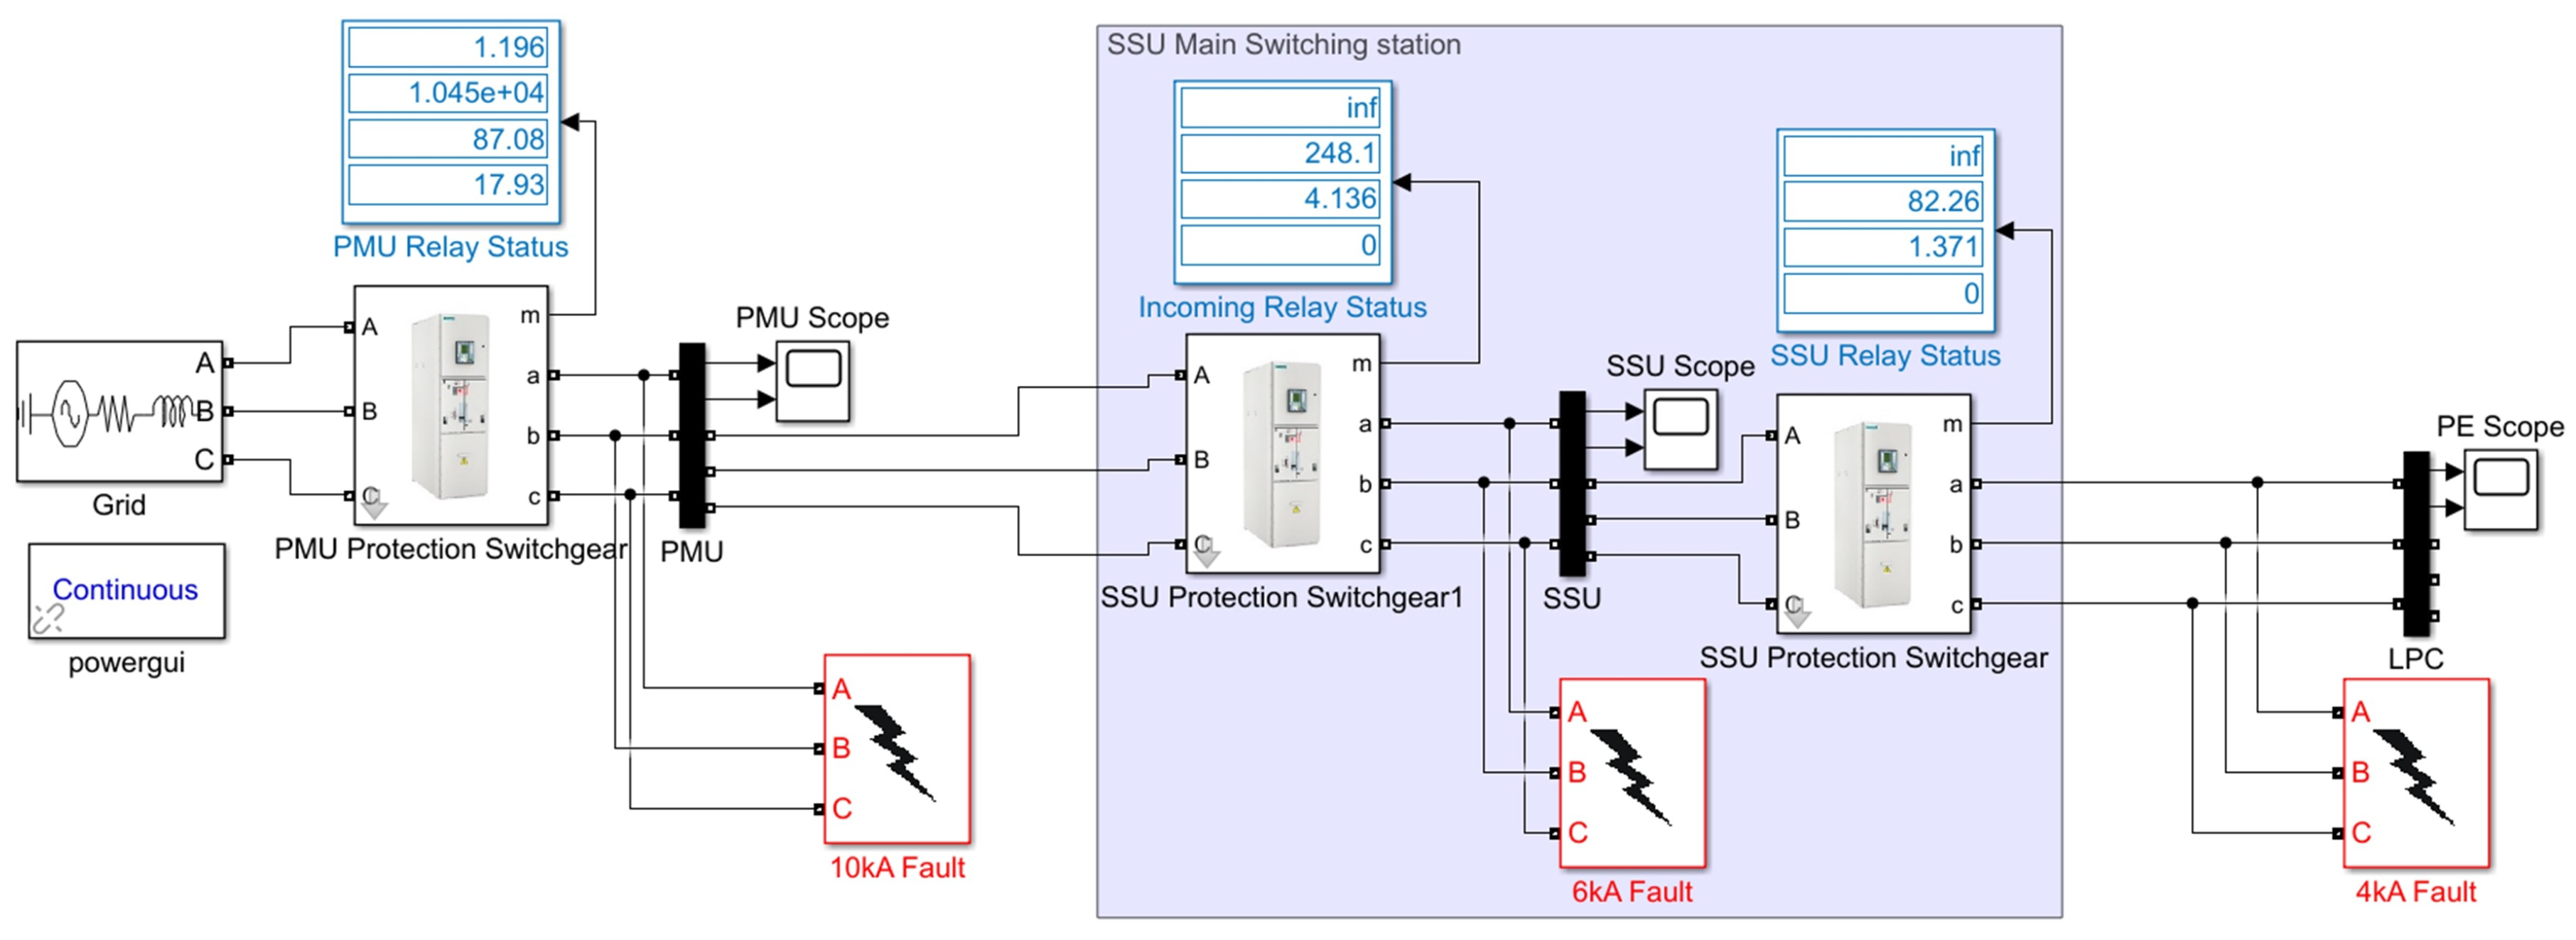
3. Modelling of the High Sensitive Overcurrent Relay
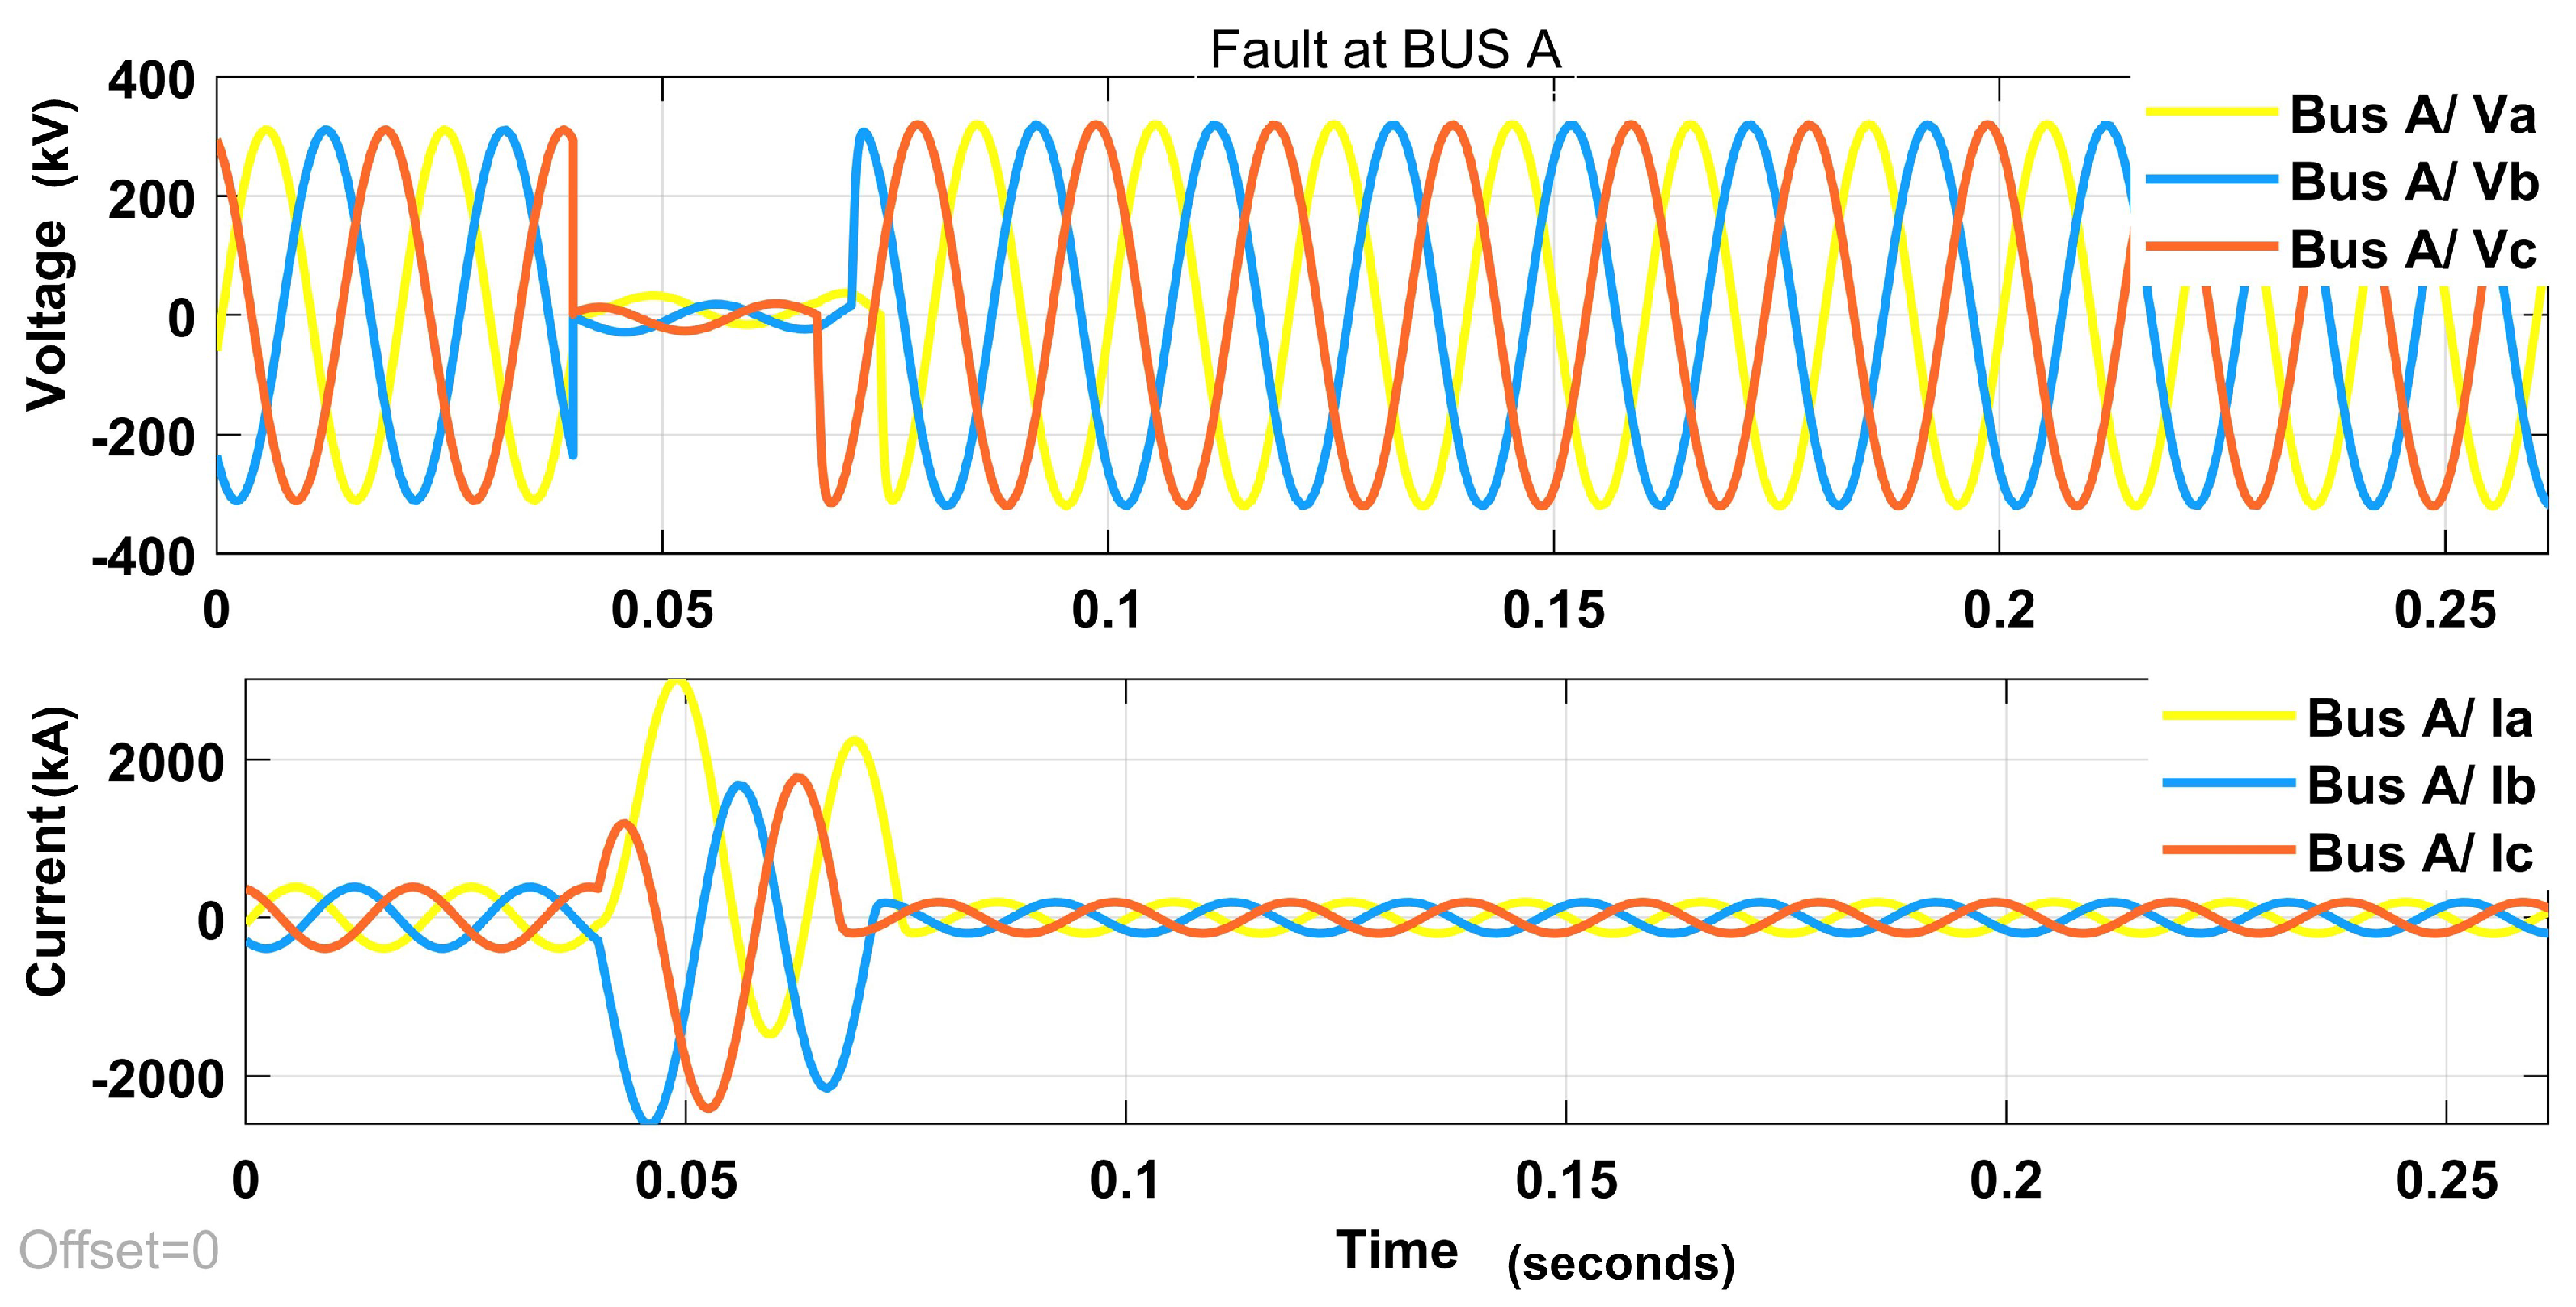
4. Results and Discussion
4.1. Validation of the Result Using the Threshold Current and Voltage with Other Models for the Sensitivity of TMS
4.2. Comparison of the Proposed Algorithm with the Deep Learning-Based Results
5. Conclusions
Author Contributions
Funding
Data Availability Statement
Conflicts of Interest
List of Acronyms
| TL | Transmission Line |
| TEC | Thevenin Equivalent Circuit |
| WT | Wavelet Transform |
| DWT | Discrete Wavelet Transform |
| CWT | Continuous Wavelet Transform |
| SSU | Supply and Switching Unit |
| IDMT | Inverse Definite Minimum Time |
| PMU | Phasor Measurement Unit |
| TMS | Time Multiplier Setting |
| L-G | Single Phase to Ground Fault |
| LL-G | Double Phase to Ground Fault |
| LLL-G | Three Phase to Ground Fault |
| RBFNN | Radial Bias Function Neural Network |
References
- Matthewman, S.; Byrd, H. Blackouts: A sociology of electrical power failure. Soc. Space (Przestrz. Społeczna) 2013, 31–55. [Google Scholar]
- Suliman, M.Y.; Ghazal, M. Design and implementation of overcurrent protection relay. J. Electr. Eng. Technol. 2020, 15, 1595–1605. [Google Scholar] [CrossRef]
- Rojnić, M.; Prenc, R.; Bulat, H.; Franković, D. A Comprehensive Assessment of Fundamental Overcurrent Relay Operation Optimization Function and Its Constraints. Energies 2022, 15, 1271. [Google Scholar] [CrossRef]
- Xu, Z.; Voloh, I.; Khanbeigi, M. Evaluating the impact of increasing system fault currents on protection. In Proceedings of the 2017 70th Annual Conference for Protective Relay Engineers (CPRE), College Station, TX, USA, 3–6 April 2017; pp. 1–20. [Google Scholar]
- Ledesma, J.J.G.; de Araujo, L.R.; Penido, D.R.R. A method for evaluation of overcurrent protection in unbalanced distribution systems. Int. Trans. Electr. Energy Syst. 2016, 26, 412–428. [Google Scholar] [CrossRef]
- Draz, A.; Elkholy, M.M.; El-Fergany, A. Over-Current Relays Coordination Including Practical Constraints and DGs: Damage Curves, Inrush, and Starting Currents. Sustainability 2022, 14, 2761. [Google Scholar] [CrossRef]
- Comassetto, L.; Bernardon, D.; Canha, L.; Abaide, A. Software for automatic coordination of protection devices in distribution system. IEEE Trans. Power Deliv. 2008, 23, 2241–2246. [Google Scholar] [CrossRef]
- Chen, C.R.; Lee, C.H.; Chang, C.J. Optimal overcurrent relay coordination in power distribution system using a new approach. Int. J. Electr. Power Energy Syst. 2013, 45, 217–222. [Google Scholar] [CrossRef]
- Andruszkiewicz, J.; Lorenc, J.; Staszak, B.; Weychan, A.; Zięba, B. Overcurrent protection against multi-phase faults in MV networks based on negative and zero sequence criteria. Int. J. Electr. Power Energy Syst. 2022, 134, 107449. [Google Scholar] [CrossRef]
- Jimenez, S.; Vázquez, E.; Gonzalez-Longatt, F. Methodology of Adaptive Instantaneous Overcurrent Protection Setting. Electronics 2021, 10, 2754. [Google Scholar] [CrossRef]
- Esmaili, P.; Zin, A.A.B.M.; Shariati, O. On-line overcurrent relays setting approach in distribution networks by implementing new adaptive protection algorithm. In Proceedings of the 2015 IEEE Tenth International Conference on Intelligent Sensors, Sensor Networks and Information Processing (ISSNIP), Singapore, 7–9 April 2015; pp. 1–6. [Google Scholar]
- Guillen, D.; Paternina, M.R.A.; Ortiz-Bejar, J.; Tripathy, R.K.; Zamora-Mendez, A.; Tapia-Olvera, R.; Tellez, E.S. Fault detection and classification in transmission lines based on a PSD index. IET Gener. Transm. Distrib. 2018, 12, 4070–4078. [Google Scholar] [CrossRef]
- Navyasri, G.S.; Deepa, K.; Sailaja, V.; Manitha, P.V. Fault Analysis in Three Phase Transmission Lines using Wavelet Method. In Proceedings of the 2022 6th International Conference on Trends in Electronics and Informatics (ICOEI), Tirunelveli, India, 28–30 April 2022; pp. 248–254. [Google Scholar]
- Hemmati, R.; Mehrjerdi, H. Non-standard characteristic of overcurrent relay for minimum operating time and maximum protection level. Simul. Model. Pract. Theory 2019, 97, 101953. [Google Scholar] [CrossRef]
- Erişti, H.; Uçar, A.; Demir, Y. Wavelet-based feature extraction and selection for classification of power system disturbances using support vector machines. Electr. Power Syst. Res. 2010, 80, 743–752. [Google Scholar] [CrossRef]
- Ahmarinejad, A.; Hasanpour, S.M.; Babaei, M.; Tabrizian, M. Optimal overcurrent relays coordination in microgrid using cuckoo algorithm. Energy Procedia 2016, 100, 280–286. [Google Scholar] [CrossRef]
- So, C.; Li, K.; Lai, K.; Fung, K. Application of genetic algorithm to overcurrent relay grading coordination. In Proceedings of the IEE Conference Publication, Edinburgh, UK, 15 May 1998; pp. 283–287. [Google Scholar]
- He, L.; Rong, S.; Liu, C. An Intelligent Overcurrent Protection Algorithm of Distribution Systems with Inverter based Distributed Energy Resources. In Proceedings of the 2020 IEEE Energy Conversion Congress and Exposition (ECCE), Virtual, 11–15 October 2020; pp. 2746–2751. [Google Scholar]
- Saldarriaga-Zuluaga, S.D.; López-Lezama, J.M.; Muñoz-Galeano, N. Optimal coordination of over-current relays in microgrids using unsupervised learning techniques. Appl. Sci. 2021, 11, 1241. [Google Scholar] [CrossRef]
- Chen, Y.; Zhang, D.; Zhang, H.; Wang, Q.G. Dual-Path Mixed-Domain Residual Threshold Networks for Bearing Fault Diagnosis. IEEE Trans. Ind. Electron. 2022, 69, 13462–13472. [Google Scholar] [CrossRef]


| Fault Types | Coeff of | Coeff of | Coeff of | Coeff of | Coeff of | Coeff of |
|---|---|---|---|---|---|---|
| ABC-G | 533.0974 | 495.1115 | 575.3335 | 0.0000 | 0.0000 | 0.0000 |
| ABC | 395.1943 | 587.4911 | 474.7873 | −0.0001 | 0.0000 | 0.0001 |
| (AB-G) | 338.5069 | 531.6202 | 32.9732 | 0.6655 | −1.6882 | 1.0227 |
| (AC-G) | 306.5768 | 22.3418 | 620.4303 | 1.5501 | −0.1691 | −1.3810 |
| (BC-G) | 26.1066 | 608.8079 | 294.0561 | −1.2685 | 1.6153 | −0.3468 |
| (A-B) | 855.3816 | 385.9281 | 17.8156 | −1.2792 | 1.6102 | −0.3311 |
| (A-C) | 299.0803 | 19.8595 | 574.5684 | −1.2897 | 1.6050 | −0.3154 |
| (B-C) | 15.3783 | 420.5652 | 355.8047 | −1.3001 | 1.5996 | −0.2996 |
| (A-G) | 307.6007 | 39.5083 | 20.8305 | −1.3103 | 1.5941 | −0.2838 |
| (B-G) | 32.6032 | 199.6292 | 28.3545 | −1.3205 | 1.5885 | −0.2680 |
| (C-G) | 15.1679 | 28.6647 | 364.3873 | 0.4383 | −1.6423 | 1.2040 |
| No Fault | 10.6870 | 15.1958 | 23.0105 | 1.4530 | 0.0390 | −1.4920 |
| Fault Types | Threshold of (kA) | Threshold of (kA) | Threshold of (kA) | Threshold of Ground Current (kA) | |||
|---|---|---|---|---|---|---|---|
| Max | Min | Max | Min | Max | Min | ||
| ABC-G | 18.6876 | ||||||
| ABC | 56.9488 | ||||||
| AB-G | 531.6202 | 32.9732 | 25.7012 | ||||
| AC-G | 620.4303 | 22.3418 | 15.5710 | ||||
| BC-G | 608.8079 | 26.1066 | 20.9355 | ||||
| A-B | 855.3816 | 17.8156 | 28.2445 | ||||
| A-C | 574.5684 | 19.8595 | 34.5217 | ||||
| B-C | 420.5652 | 15.3783 | 16.8326 | ||||
| A-G | 307.6007 | 39.5083 | 307.6007 | 20.8305 | 18.3399 | ||
| B-G | 199.6292 | 32.6032 | 199.6292 | 28.3545 | 24.7174 | ||
| C-G | 364.3873 | 15.1679 | 364.3873 | 28.6647 | 15.5710 | ||
| No-Fault | 23.0105 | 10.6870 | 23.0105 | 15.1958 | 23.0105 | 23.0105 | 13.0455 |
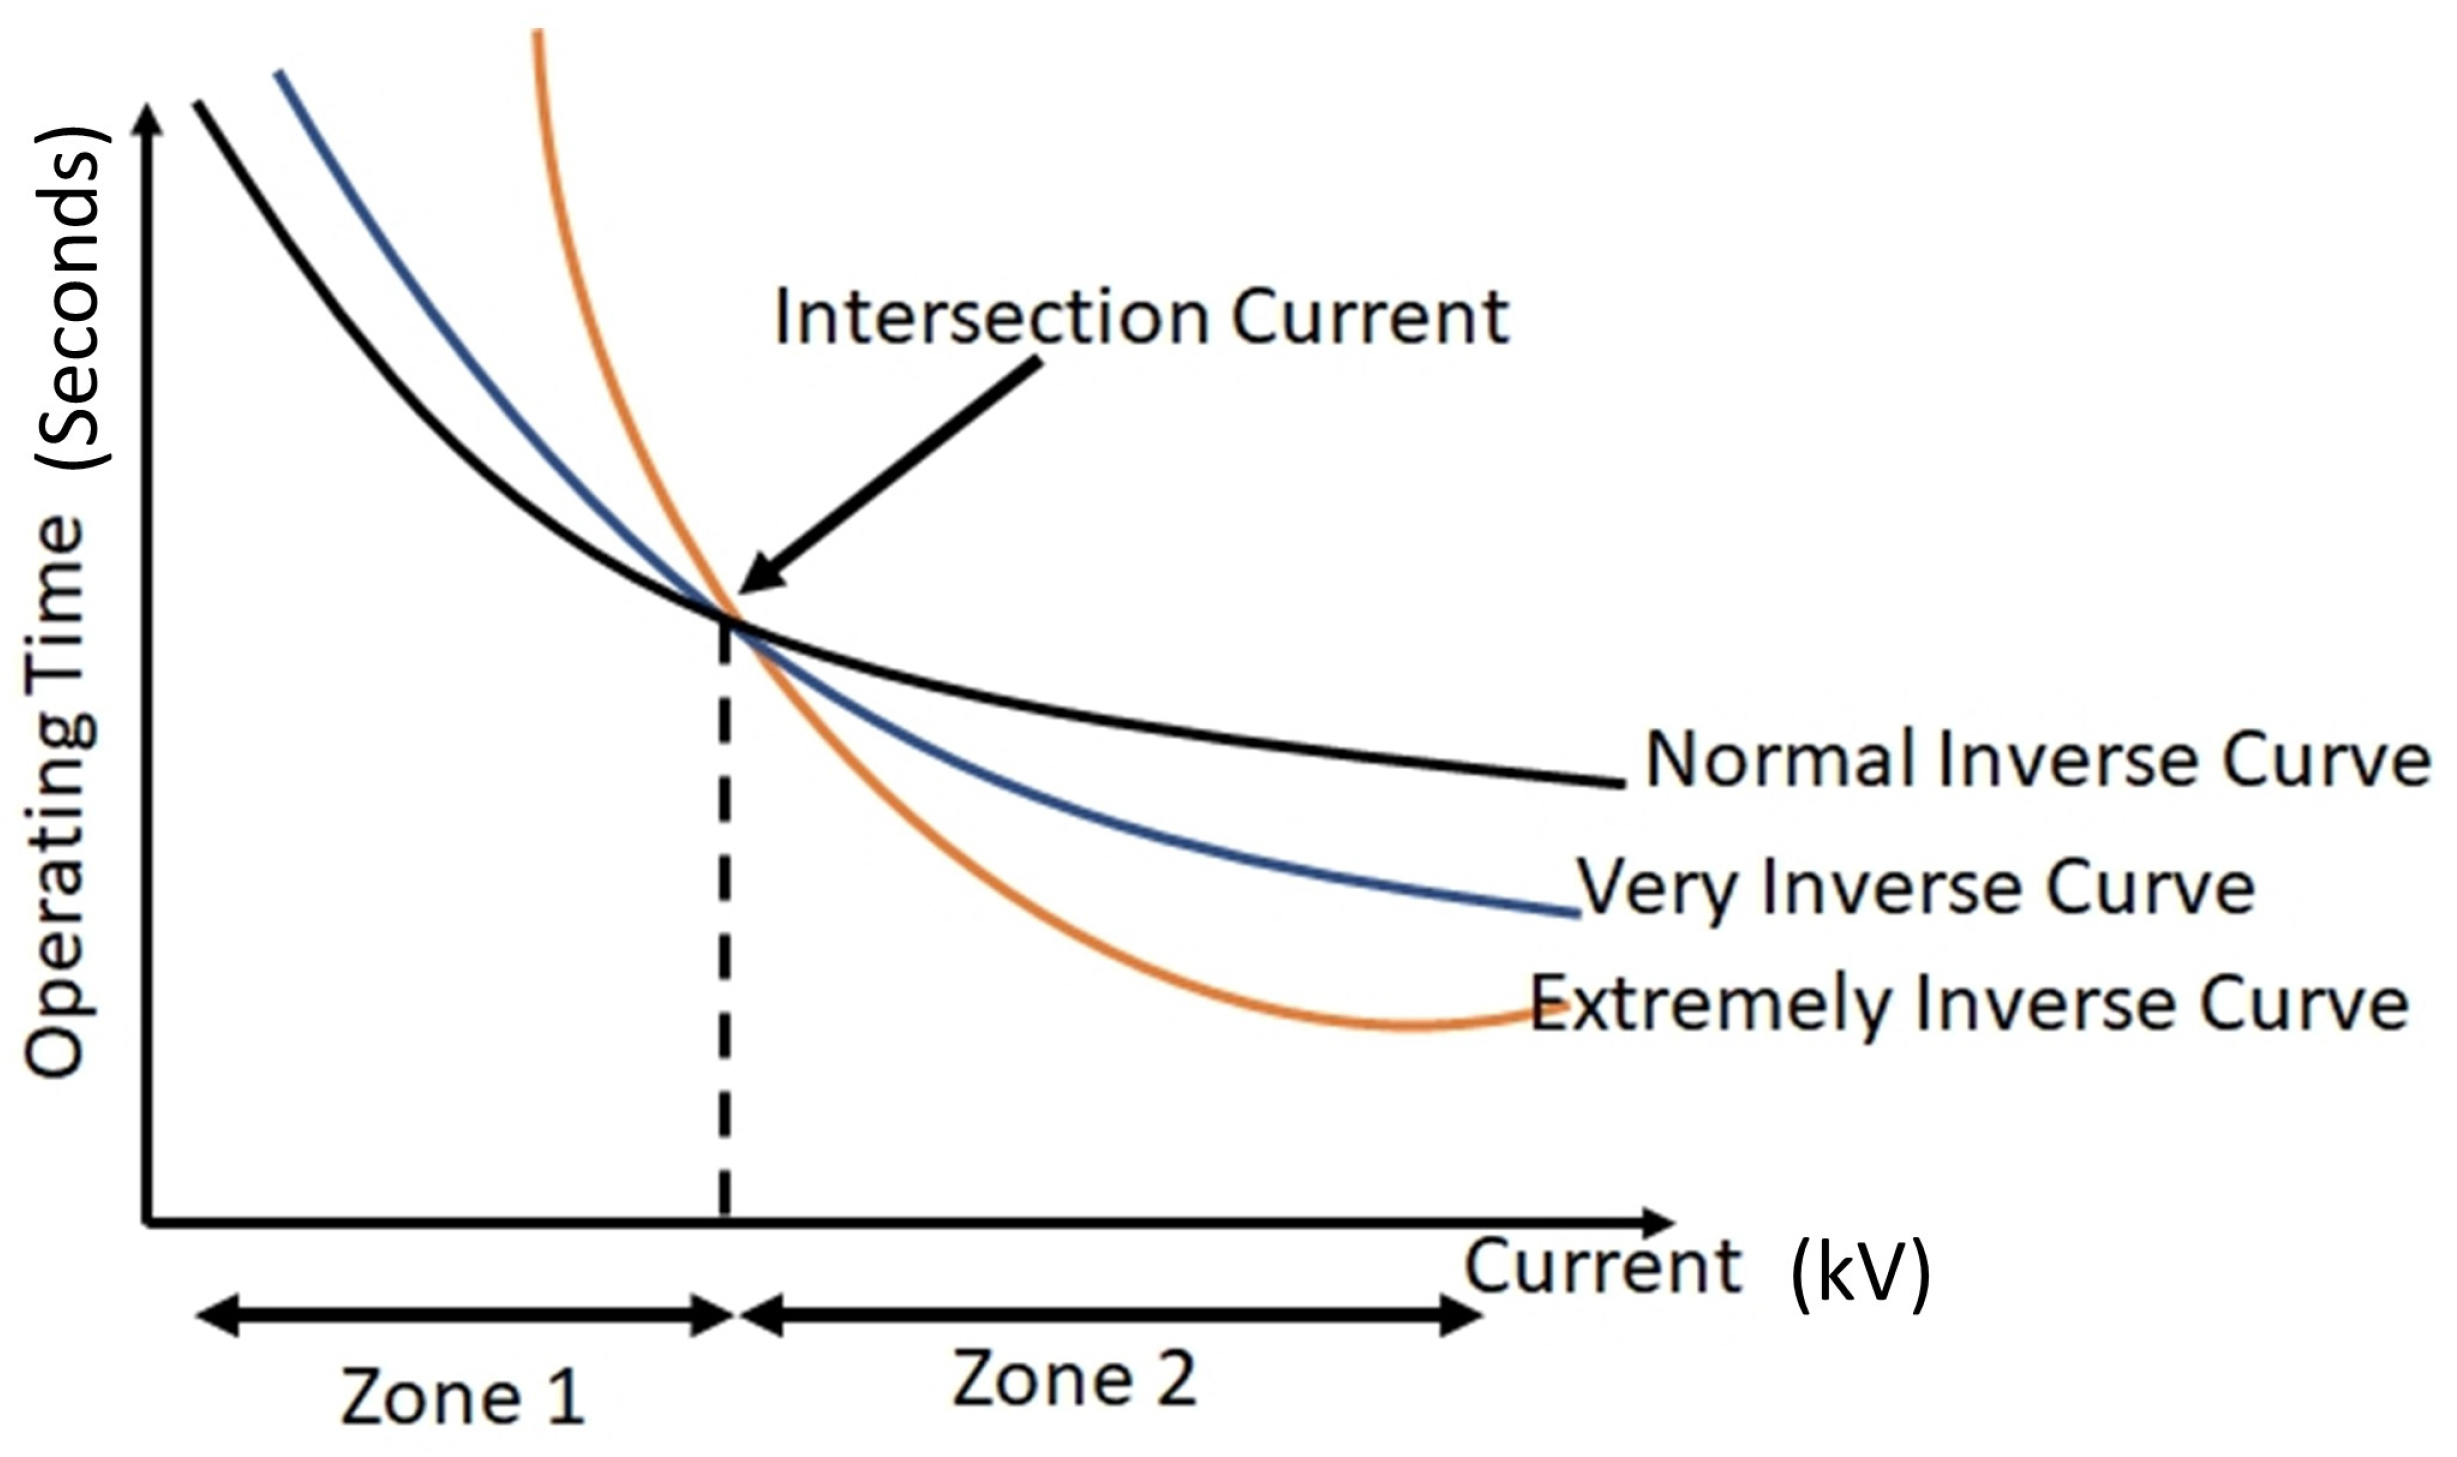
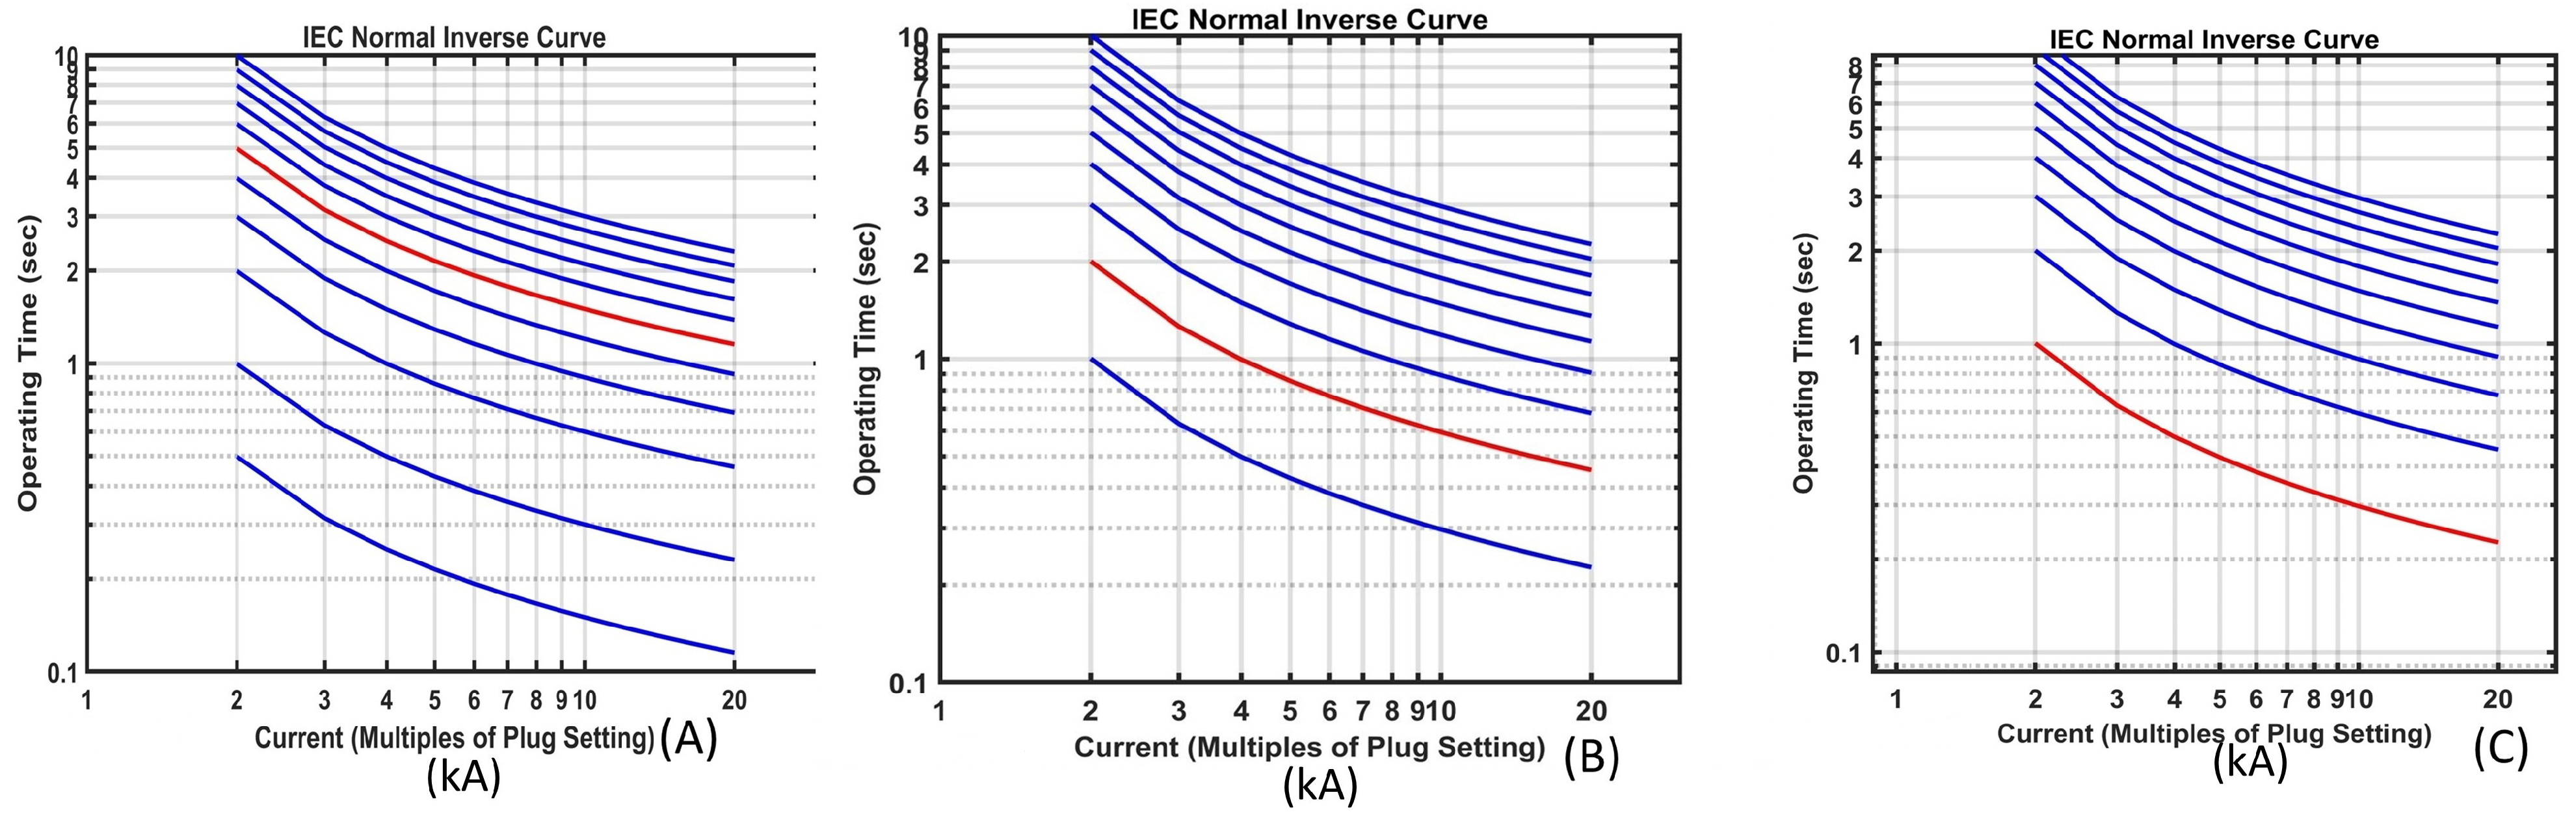
| Curve Types | K | |
|---|---|---|
| Normal Inverse Curve | 0.140 | 0.020 |
| Very Inverse Curve | 13.5 | 1 |
| Extremely Inverse Curve | 80 | 2 |
| Long-time Standard Curve | 120 | 1 |
| Fault Types | Fault Resistance = 0.01 Ω | ||
|---|---|---|---|
| Three-phase to ground fault | Relay 1 | Relay 2 | Relay 3 |
| Threshold Current (kA) | 259 | 8.524 | 2.826 |
| TMS (Seconds) | 2.991 | 0.1421 | 0.04709 |
| Trip Time (Seconds) | 0.01 | 0.01 | 0.01 |
| Double phase to ground fault | Relay 1 | Relay 2 | Relay 3 |
| Threshold Current (kA) | 358.9 | 13.25 | 4.424 |
| TMS (Seconds) | 2.991 | 0.2208 | 0.07373 |
| Trip Time (Seconds) | 0.01 | 0.01 | 0.01 |
| Single line to ground fault | Relay 1 | Relay 2 | Relay 3 |
| Threshold Current (kA) | 358.8 | 16.43 | 5.478 |
| TMS (Seconds) | 2.99 | 0.2739 | 0.0913 |
| Trip Time (Seconds) | 0.01 | 0.01 | 0.01 |
| Fault Types | Fault Resistance = 50 Ω | ||
|---|---|---|---|
| Three-phase to ground fault | Relay 1 | Relay 2 | Relay 3 |
| Threshold Current (kA) | 358.7 | 355.8 | 117.9 |
| TMS (Seconds) | 2.989 | 5.93 | 1.966 |
| Trip Time (Seconds) | 0.01 | 0.9198 | 0.01 |
| Double phase to ground fault | Relay 1 | Relay 2 | Relay 3 |
| Threshold Current (kA) | 358.7 | 355.7 | 118.3 |
| TMS (Seconds) | 2.989 | 5.929 | 1.971 |
| Trip Time (Seconds) | 0 | 0.9193 | 0 |
| Single line to ground fault | Relay 1 | Relay 2 | Relay 3 |
| Threshold Current (kA) | 358.5 | 355.5 | 118.5 |
| TMS (Seconds) | 2.987 | 5.925 | 1.975 |
| Trip Time (Seconds) | 0 | 0.9185 | 0 |
| Fault Types | Fault Resistance = 100 Ω | ||
|---|---|---|---|
| Three-phase to ground fault | Relay 1 | Relay 2 | Relay 3 |
| Threshold Current (kA) | 358.2 | 353.9 | 117.9 |
| TMS (Seconds) | 2.985 | 5.899 | 1.966 |
| Trip Time (Seconds) | 0 | 0.9149 | 0.9039 |
| Double phase to ground fault | Relay 1 | Relay 2 | Relay 3 |
| Threshold Current (kA) | 358.1 | 353.8 | 118.3 |
| TMS (Seconds) | 2.984 | 5.897 | 1.971 |
| Trip time (Seconds) | 0 | 0.9145 | 0.9035 |
| Single line to ground fault | Relay 1 | Relay 2 | Relay 3 |
| Threshold Current (kA) | 358 | 353.7 | 349.5 |
| TMS (Seconds) | 2.984 | 5.895 | 5.824 |
| Trip Time (Seconds) | 0 | 0.9136 | 0.9026 |
| Fault Types | Trip Time without Proposed Model (Seconds) | Trip Time with Proposed Model (Seconds) | % Increase in Accuracy |
|---|---|---|---|
| L-G | 0.25 | 0.03 | 85.00 |
| L-L-G | 0.38 | 0.05 | 99.87 |
| L-L-L-G | 0.10 | 0.04 | 60.00 |
| Fault Types | Trip Time without Proposed Model (Seconds) | Trip Time with Proposed Model (Seconds) | % Increase in Accuracy |
|---|---|---|---|
| L-G | 0.10 | 0.03 | 70.00 |
| L-L-G | 0.32 | 0.05 | 84.38 |
| L-L-L-G | 0.20 | 0.04 | 80.00 |
Disclaimer/Publisher’s Note: The statements, opinions and data contained in all publications are solely those of the individual author(s) and contributor(s) and not of MDPI and/or the editor(s). MDPI and/or the editor(s) disclaim responsibility for any injury to people or property resulting from any ideas, methods, instructions or products referred to in the content. |
© 2023 by the authors. Licensee MDPI, Basel, Switzerland. This article is an open access article distributed under the terms and conditions of the Creative Commons Attribution (CC BY) license (https://creativecommons.org/licenses/by/4.0/).
Share and Cite
Ogar, V.N.; Hussain, S.; Gamage, K.A.A. The Use of Instantaneous Overcurrent Relay in Determining the Threshold Current and Voltage for Optimal Fault Protection and Control in Transmission Line. Signals 2023, 4, 137-149. https://doi.org/10.3390/signals4010007
Ogar VN, Hussain S, Gamage KAA. The Use of Instantaneous Overcurrent Relay in Determining the Threshold Current and Voltage for Optimal Fault Protection and Control in Transmission Line. Signals. 2023; 4(1):137-149. https://doi.org/10.3390/signals4010007
Chicago/Turabian StyleOgar, Vincent Nsed, Sajjad Hussain, and Kelum A. A. Gamage. 2023. "The Use of Instantaneous Overcurrent Relay in Determining the Threshold Current and Voltage for Optimal Fault Protection and Control in Transmission Line" Signals 4, no. 1: 137-149. https://doi.org/10.3390/signals4010007