
Diagnosis of Noise Inside Neonatal Incubators under Free-Field Conditions

 and
and
Abstract
:1. Introduction
2. Materials and Methods
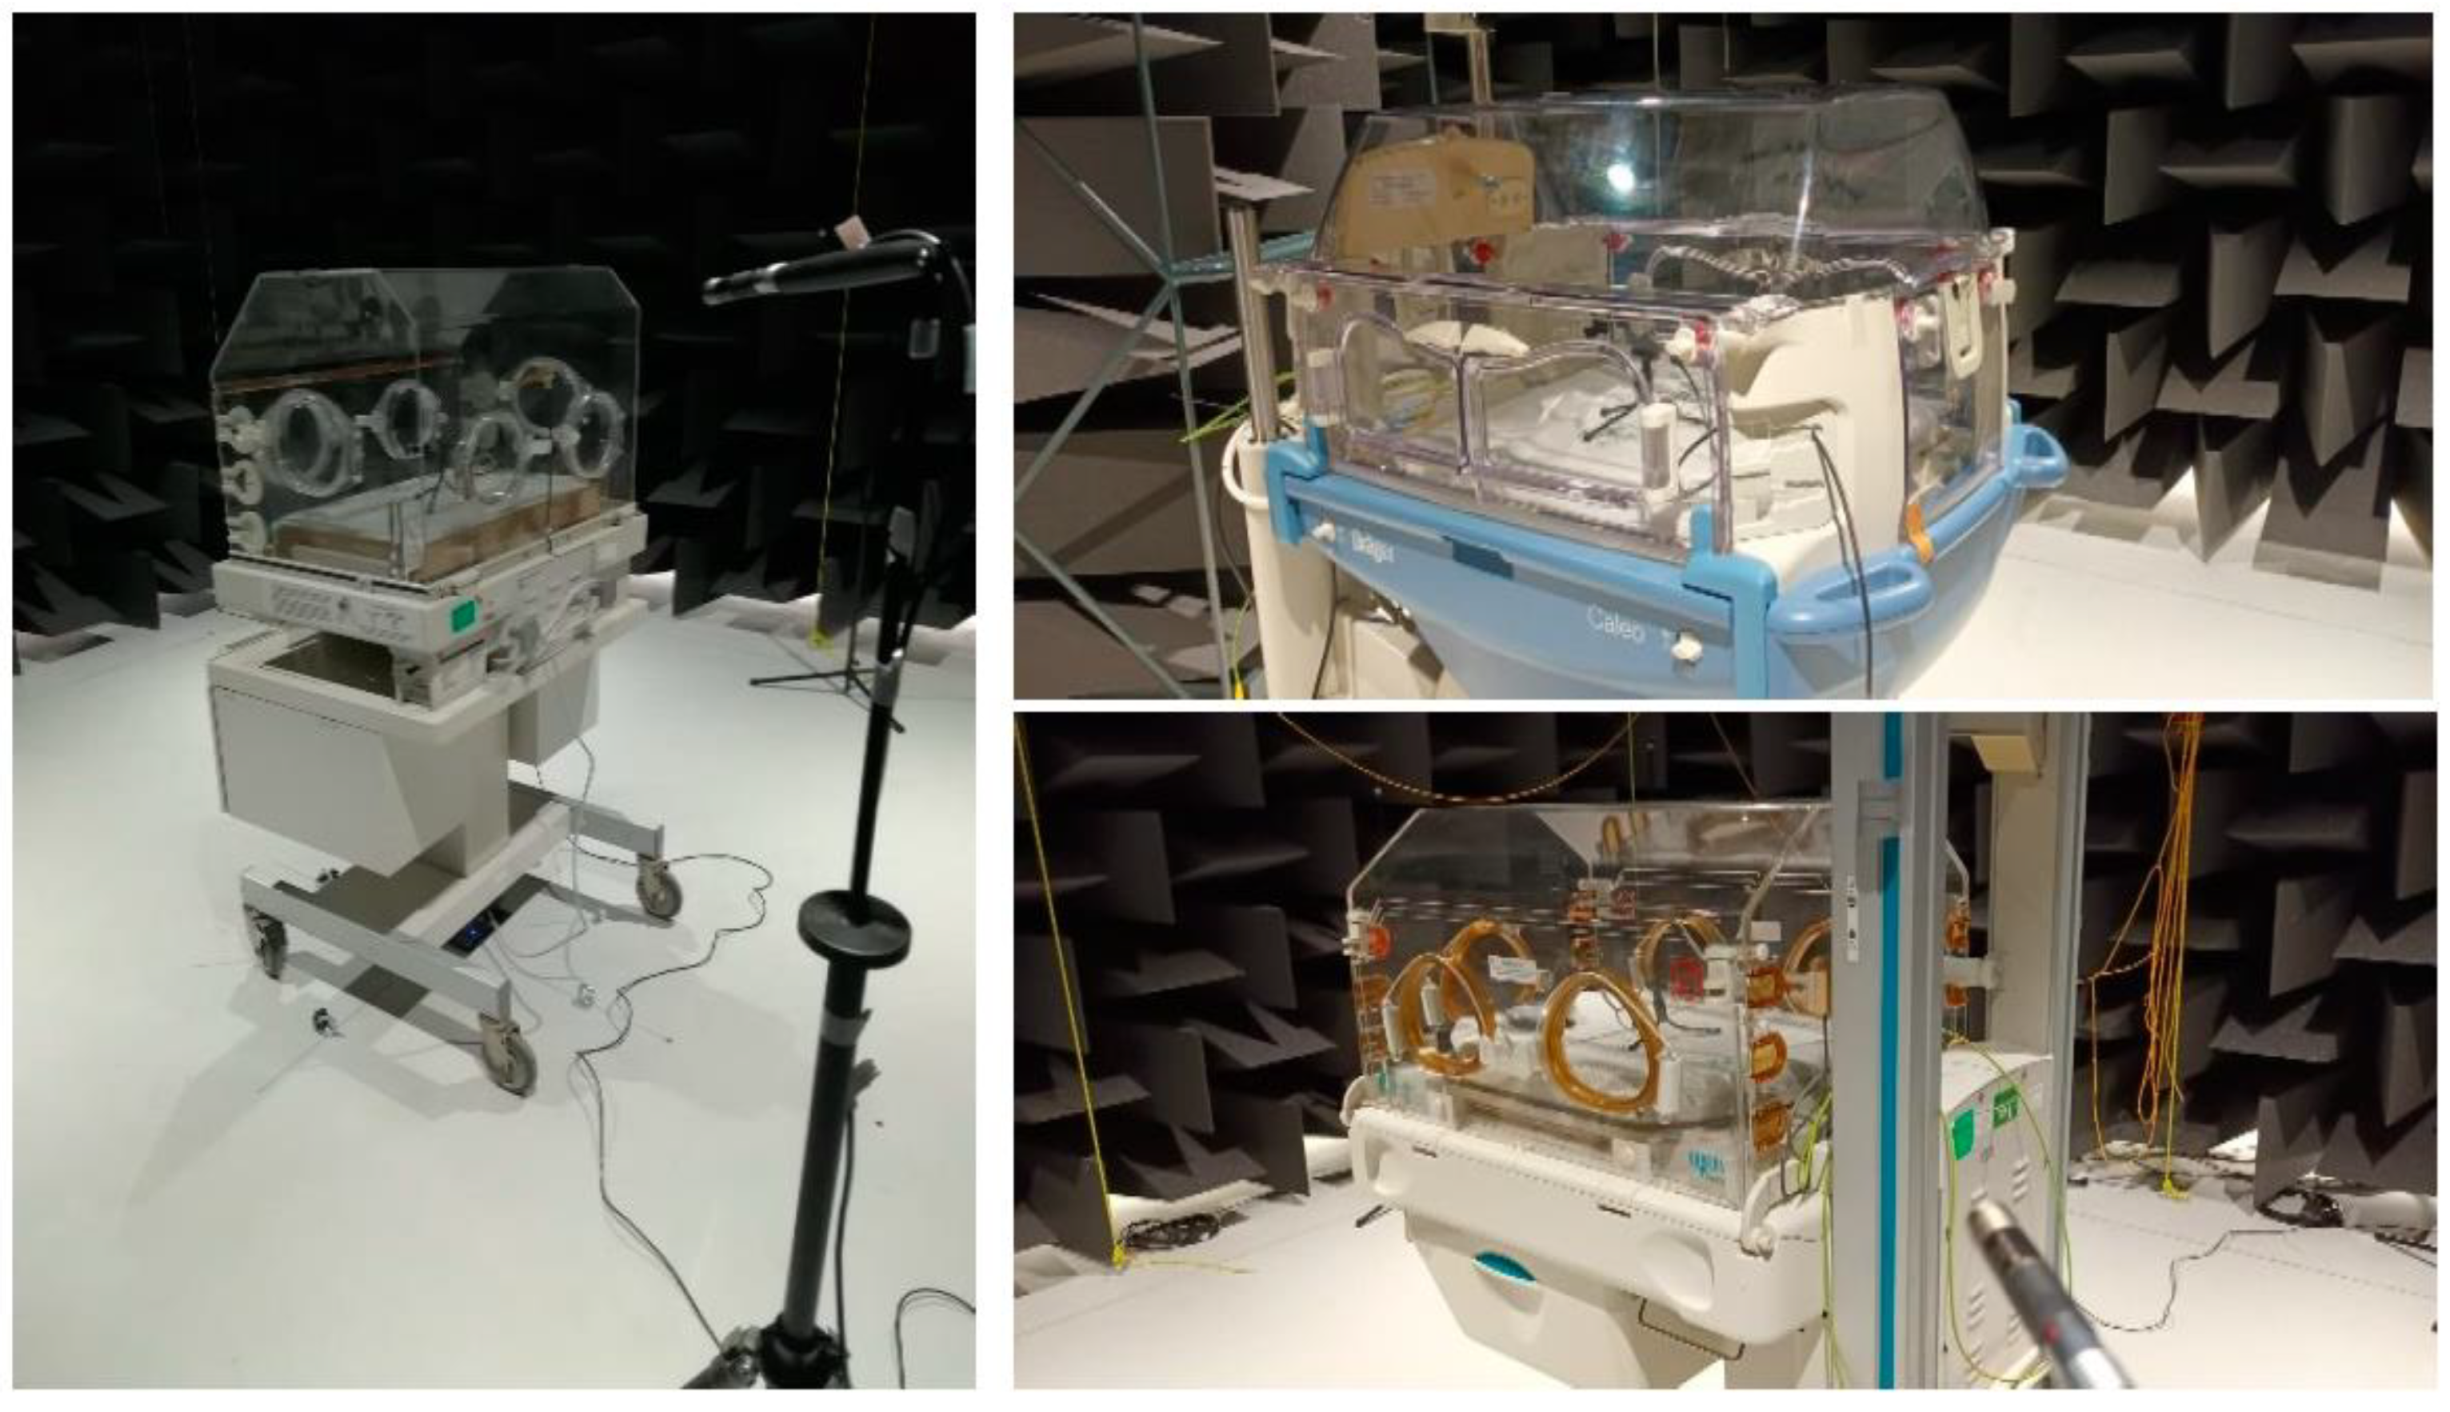
2.1. Measuring Equipment
2.2. Sample
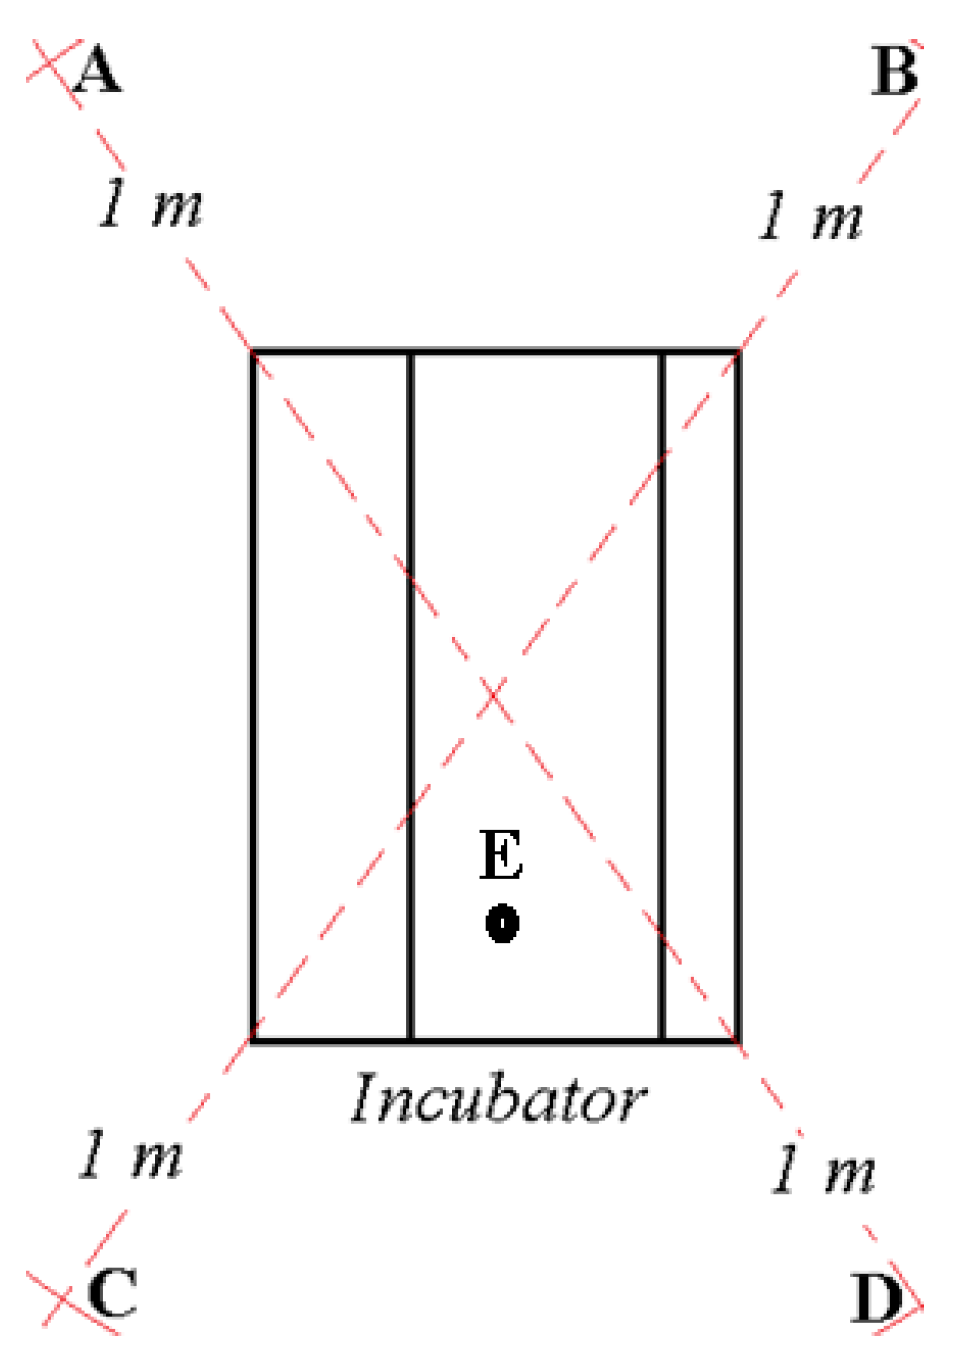
2.3. Measurement Procedure
- LAeq: A-weighted equivalent continuous sound level;
- LCeq: C-weighted equivalent continuous sound level;
- LAIeq: A-weighted equivalent continuous sound level, measured with an impulse time constant;
- LAFmax: A-weighted maximum sound level, measured with a fast time constant;
- LAFmin: A-weighted minimum sound level measured with a fast time constant;
- L10: the level just exceeded for 10% of the time;
- L50: the level just exceeded 50% of the time;
- L90: the level just exceeded 90% of the time.
- Emerging tonal components: tonality is considered to exist if, in the spectral analysis in one-third octave, with Z weighting (i.e., in linear), it is verified that the difference in dB between the tonal band and the adjacent bands is at least 8 dB for frequencies between 20 and 125 Hz; at least 5 dB for frequencies between 150 and 400 Hz; and at least 3 dB for frequencies between 500 and 10,000 Hz;
- Low-frequency component: the presence of a low-frequency component is taken into account if the difference in dB between LCeq and LAeq measurements is at least 10 dB, with the values properly corrected for background noise;
- Impulsive components: the existence of impulsivity is taken into account if the difference between LAIeq and LAeq is at least 10 dB, with the values properly corrected for background noise.
3. Results
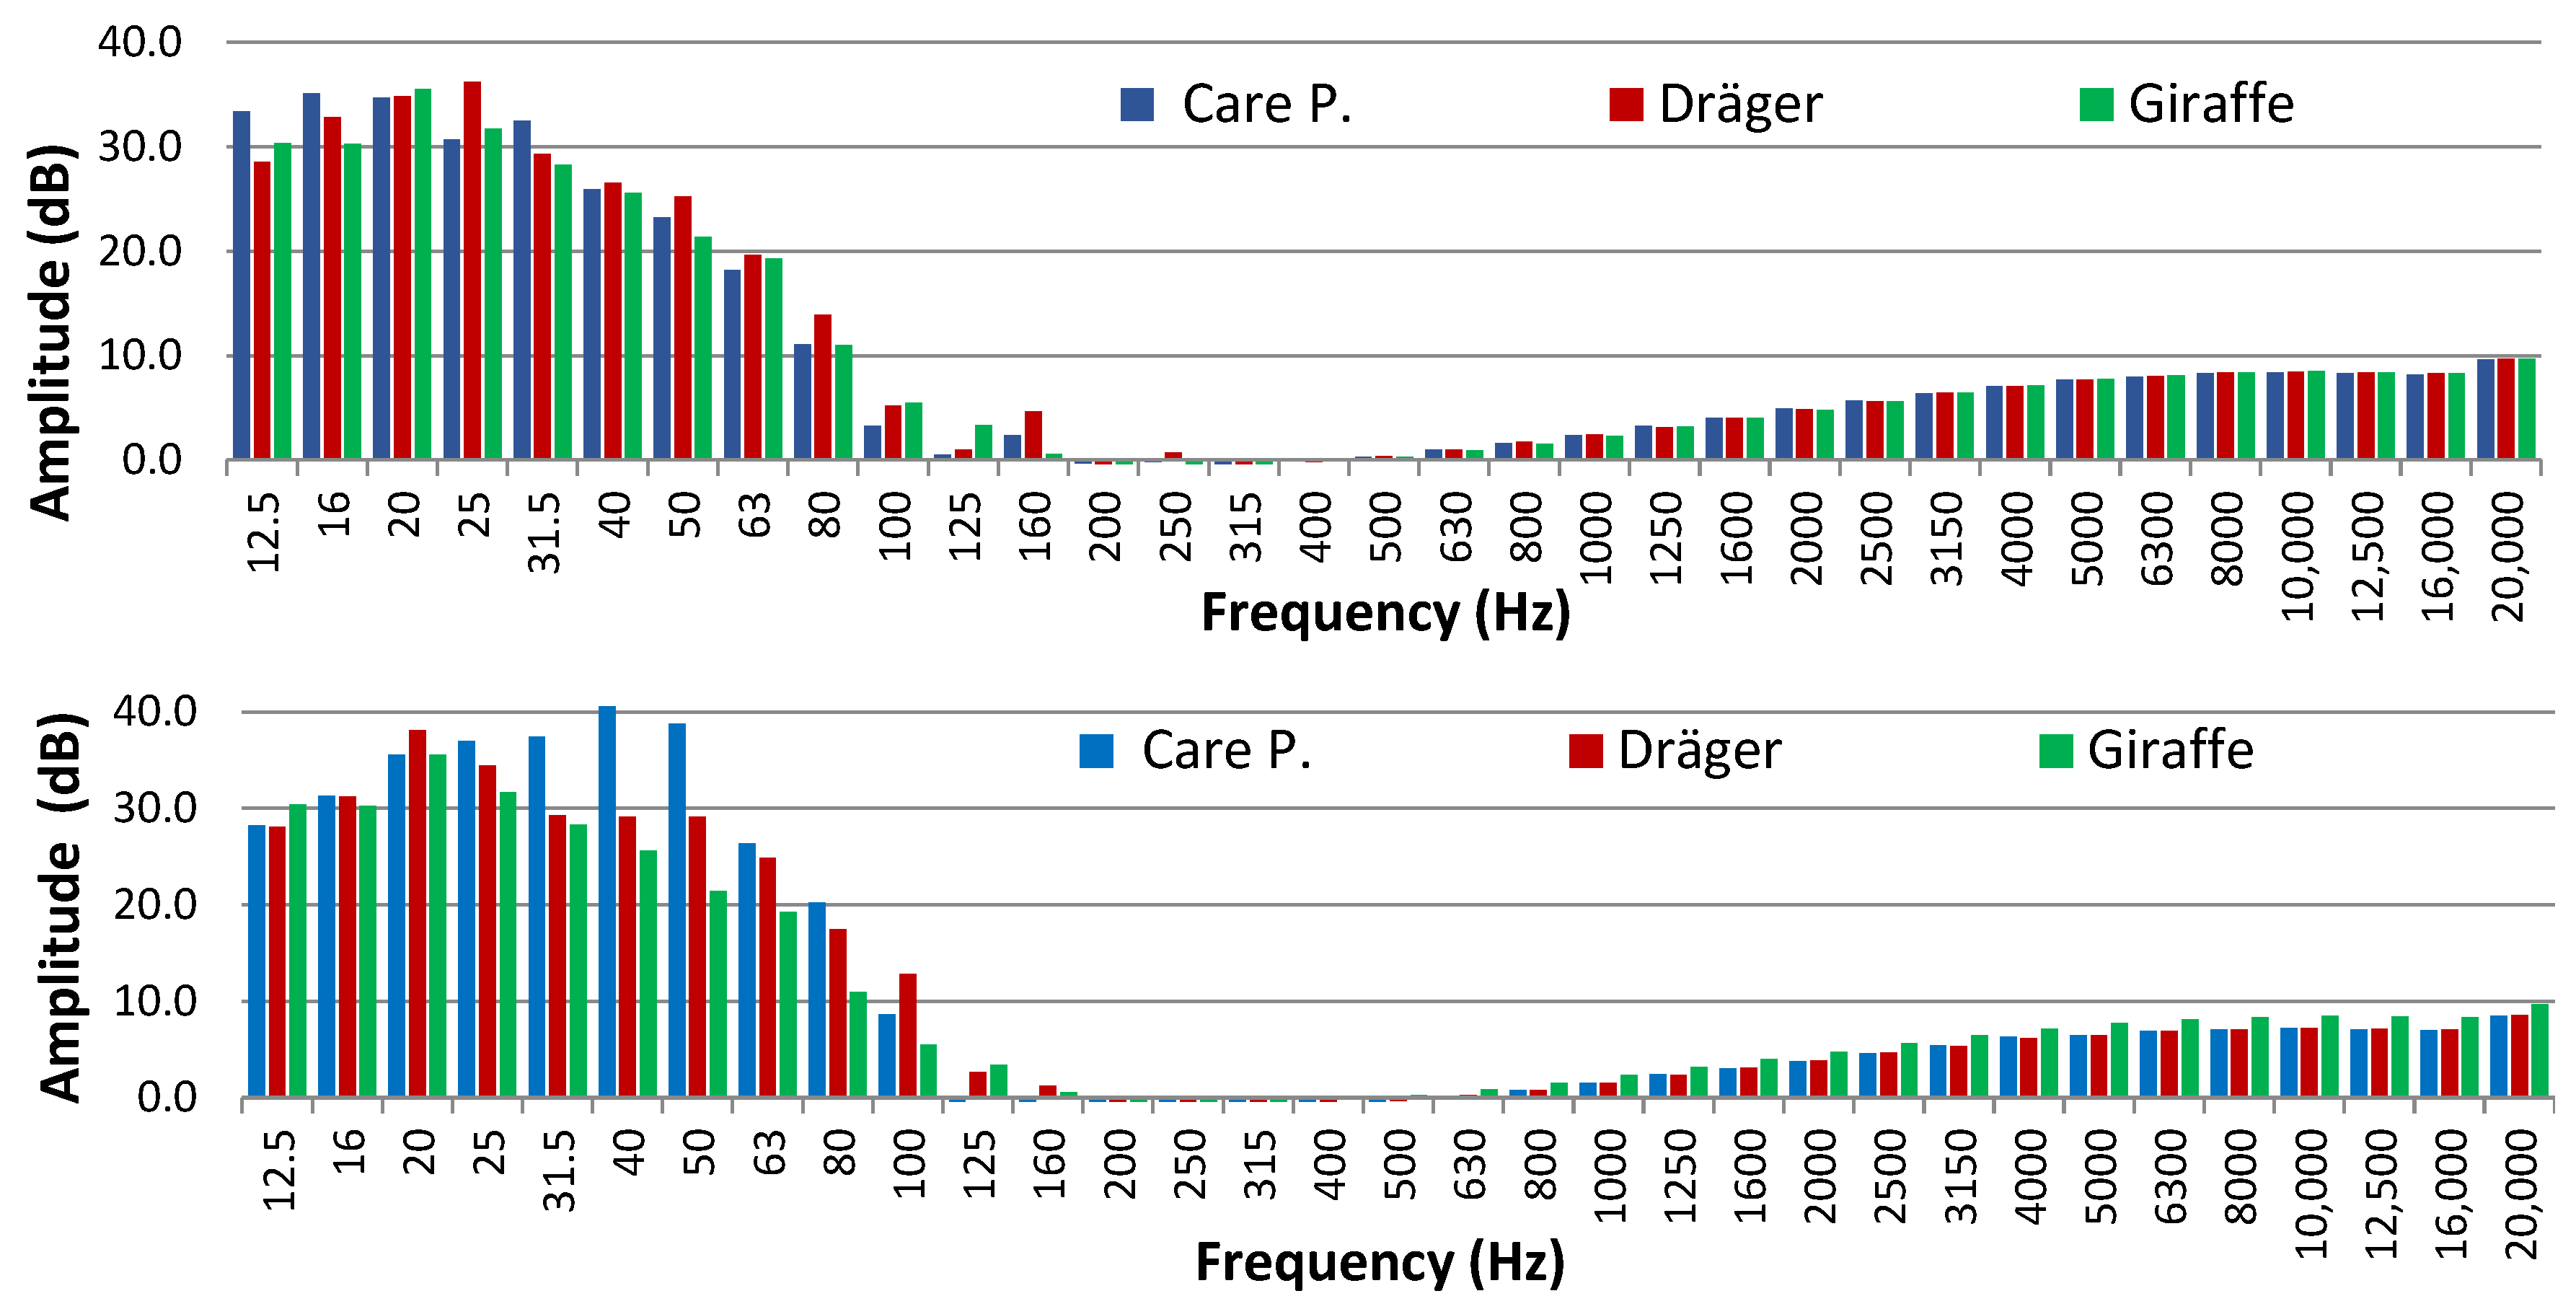
3.1. Incubator Off
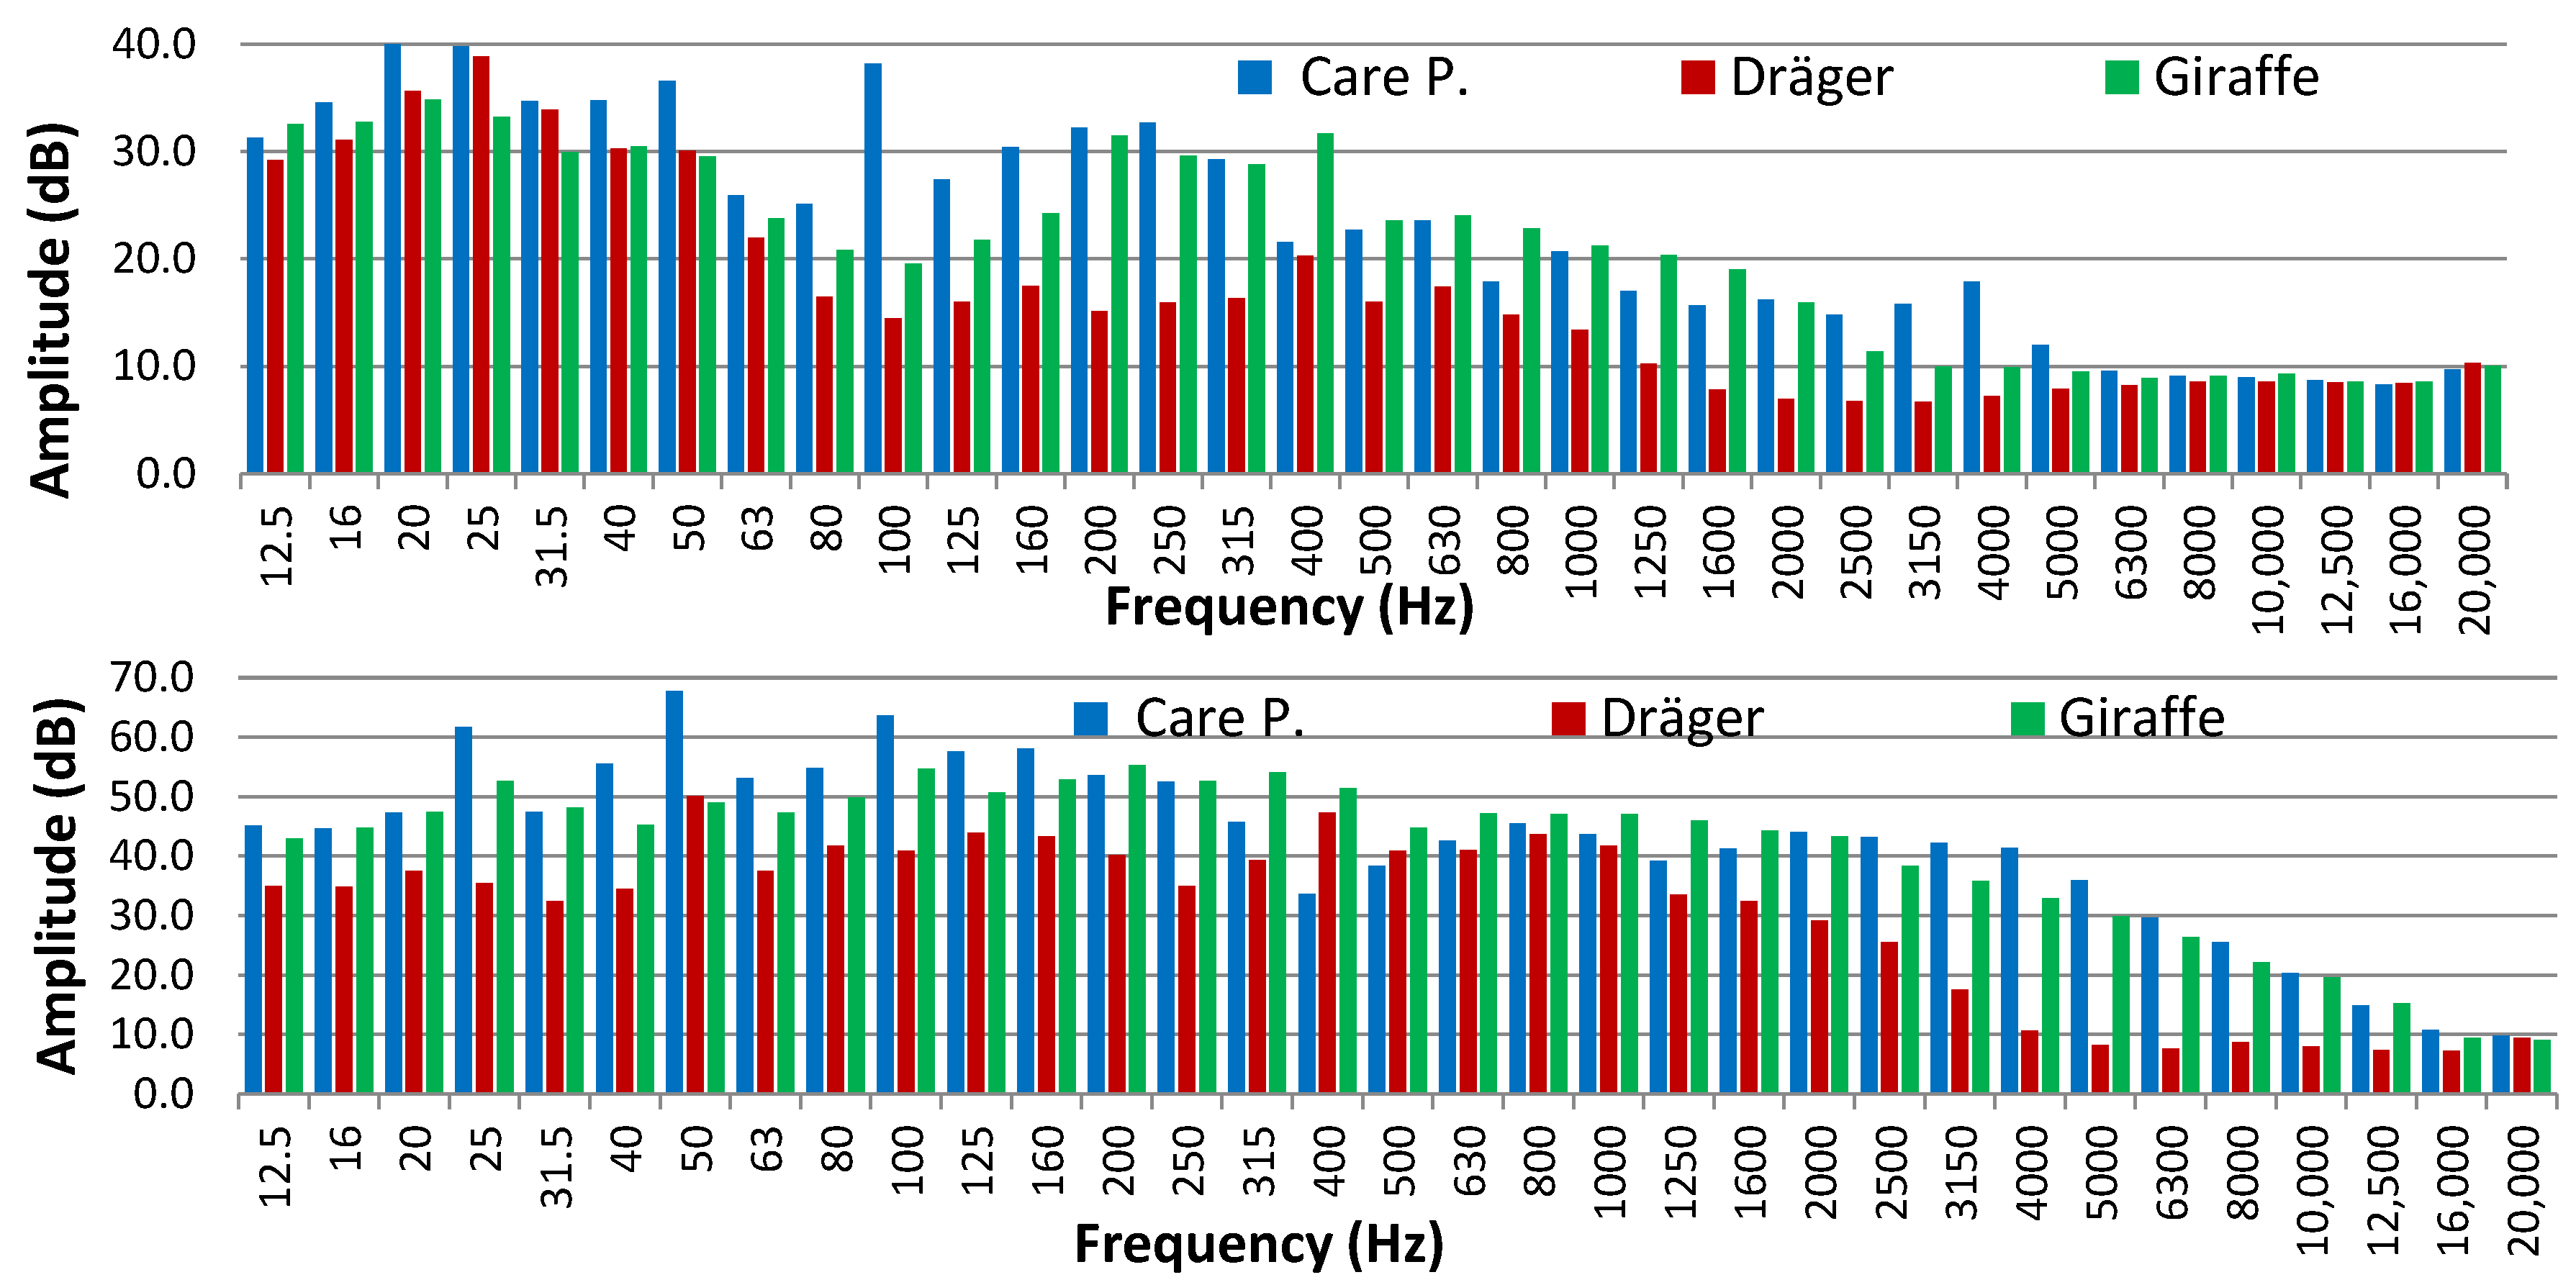
3.2. Incubator On
3.3. Incubator on with Temperature Alarm Triggered
3.4. Equivalent Continuous Level Corrected (Lk) for the Presence of Low-Frequency, Tonal, and Impulsive Components
4. Discussion
5. Conclusions
- (i)
- The incubator itself represents an important source of noise for the newborn, exceeding in all cases inside the cabin the noise level of 45 dBA recommended by international organizations;
- (ii)
- The noise emitted by the incubator to the outside is relatively contained; however, when the alarms are activated, the noise increase is significant, reaching, in some cases, LAeq values of 72.5 dBA;
- (iii)
- Tonal components were detected in all cases, and, in some cases, also low-frequency components. These components accentuate noise nuisance and should be taken into account by international organizations in the future;
- (iv)
- In addition to those described above, it would be convenient to introduce some kind of index to assess the annoyance caused by several repetitive, noisy, transient events, thus, recommending to alarm manufacturers what is the appropriate duration of the alarm sound in the total cycle time.
Author Contributions
Funding
Data Availability Statement
Acknowledgments
Conflicts of Interest
References
- Almadhoob, A.; Ohlsson, A. Sound Reduction Management in the Neonatal Intensive Care Unit for Preterm or Very Low Birth Weight Infants. Cochrane Database Syst. Rev. 2015, CD010333. [Google Scholar] [CrossRef]
- Hernández-molina, R.; Jiménez, J.L.B.; Rodriguez-montaño, V.; Zacarías, F.F.; Bienvenido-huertas, D.; Lubián, S.; Cueto-ancela, J.L. Characterizing the Acoustic Environment in a Neonatal Intensive Care Unit. Appl. Acoust. 2020, 165, 107301. [Google Scholar] [CrossRef]
- Zacarías, F.F.; Molina, R.H.; Ancela, J.L.C.; López, S.L.; Ojembarrena, A.A. Noise Exposure in Preterm Infants Treated with Respiratory Support Using Neonatal Helmets. Acta Acust. United Acust. 2013, 99, 590–597. [Google Scholar] [CrossRef]
- Kellam, B.; Bhatia, J. Sound Spectral Analysis in the Intensive Care Nursery: Measuring High-Frequency Sound. J. Pediatr. Nurs. Nurs. Care Child. Fam. 2008, 23, 317–323. [Google Scholar] [CrossRef] [PubMed]
- Miller, R.W.; Brendel, W.B.; Brent, R.L.; Chisolm, J.J., Jr.; Doyle, J.L.; Ebbin, A.J.; Fagan, E.L.; Finberg, L.; Mendez-Cashion, D.; Mulvihill, J.J.; et al. Noise Pollution: Neonatal Aspects. Pediatrics 1974, 54, 476–479. [Google Scholar] [CrossRef]
- Qutub, H.; El-Said, K. Assessment of Ambient Noise Levels in the Intensive Care Unit of a University Hospital. J. Fam. Community Med. 2009, 16, 53–57. [Google Scholar]
- Krueger, C.; Horesh, E.; Crossland, B.A. Safe Sound Exposure in the Fetus and Preterm Infant. JOGNN J. Obstet. Gynecol. Neonatal Nurs. 2012, 41, 166–170. [Google Scholar] [CrossRef] [PubMed] [Green Version]
- Chang, E.F.; Merzenich, M.M. Environmental Noise Retards Auditory Cortical Development. Science 2003, 300, 498–502. [Google Scholar] [CrossRef] [PubMed] [Green Version]
- Lai, T.T.; Bearer, C.F. Iatrogenic Environmental Hazards in the Neonatal Intensive Care Unit. Clin. Perinatol. 2008, 35, 163–181. [Google Scholar] [CrossRef] [Green Version]
- Thomas, K.A.; Uran, A. How the Nicu Environment Sounds to a Preterm Infant: Update. MCN Am. J. Matern. Nurs. 2007, 32, 250. [Google Scholar] [CrossRef]
- Wroblewska-Seniuk, K.; Greczka, G.; Dabrowski, P.; Szyfter-Harris, J.; Mazela, J. Hearing Impairment in Premature Newborns—Analysis Based on the National Hearing Screening Database in Poland. PLoS ONE 2017, 12, e0184359. [Google Scholar] [CrossRef] [PubMed] [Green Version]
- Brown, G. NICU Noise and the Preterm Infant. Neonatal Netw. NN 2009, 28, 165–173. [Google Scholar] [CrossRef]
- Neff, W.D. Prenatal Effects of Exposure to High-Level Noise; National Academies Press: Washington, DC, USA, 1982; ISBN 978-0-309-32941-5. [Google Scholar]
- Morris, B.H.; Philbin, M.K.; Bose, C. Physiological Effects of Sound on the Newborn. J. Perinatol. 2000, 20, S55–S60. [Google Scholar] [CrossRef] [Green Version]
- Lasky, R.; Trickey, A. Noise and Light Exposures for Extremely Low Birth Weight Newborns During Their Stay in the Neonatal Intensive Care Unit. Pediatrics 2009, 123, 540–546. [Google Scholar] [CrossRef]
- Matook, S.; Sullivan, M.; Salisbury, A.; Miller, R.; Lester, B. Variations of NICU Sound by Location and Time of Day. Neonatal Netw. 2010, 29, 87–95. [Google Scholar] [CrossRef]
- Darcy, A.E.; Hancock, L.E.; Ware, E.J. A Descriptive Study of Noise in the Neonatal Intensive Care Unit Ambient Levels and Perceptions of Contributing Factors. Adv. Neonatal Care 2008, 8, 165. [Google Scholar] [CrossRef]
- Fortes-Garrido, J.C.; Velez-Pereira, A.M.; Gázquez, M.; Hidalgo-Hidalgo, M.; Bolívar, J.P. The Characterization of Noise Levels in a Neonatal Intensive Care Unit and the Implications for Noise Management. J. Environ. Health Sci. Eng. 2014, 12, 104. [Google Scholar] [CrossRef] [Green Version]
- Graven, S.N. Sound and the Developing Infant in the NICU: Conclusions and Recommendations for Care. J. Perinatol. 2000, 20, S88–S93. [Google Scholar] [CrossRef] [PubMed]
- Antonucci, R.; Porcella, A.; Fanos, V. The Infant Incubator in the Neonatal Intensive Care Unit: Unresolved Issues and Future Developments. J. Perinat. Med. 2009, 37, 587–598. [Google Scholar] [CrossRef] [PubMed]
- Gerhardt, K.J.; Abrams, R.M. Fetal Exposures to Sound and Vibroacoustic Stimulation. J. Perinatol. Off. J. Calif. Perinat. Assoc. 2000, 20, S21–S30. [Google Scholar] [CrossRef] [PubMed]
- Gerhardt, K.J.; Abrams, R.M. Fetal Hearing: Characterization of the Stimulus and Response. Semin. Perinatol. 1996, 20, 11–20. [Google Scholar] [CrossRef]
- Ohgami, N.; Oshino, R.; Ninomiya, H.; Li, X.; Kato, M.; Yajima, I.; Kato, M. Risk Assessment of Neonatal Exposure to Low Frequency Noise Based on Balance in Mice. Front. Behav. Neurosci. 2017, 11, 30. [Google Scholar] [CrossRef] [PubMed] [Green Version]
- Berglund, B.; Lindvall, T.; Schwela, D.H.; World Health Organization. Guidelines for Community Noise; World Health Organization: Geneva, Switzerland, 1999; pp. 1–161. [Google Scholar]
- Leventhall, G.; Pelmear, P.; Benton, S. A Review of Published Research on Low Frequency Noise and Its Effects. Available online: http://www.defra.gov.uk/environment/noise/research/lowfrequency/pdf/lowfreqnoise.pdf (accessed on 14 January 2023).
- Schust, M. Effects of Low Frequency Noise up to 100 Hz. Noise Health 2004, 6, 73. [Google Scholar]
- Hernández-Molina, R.; Fernández-Zacarías, F.; Benavente-Fernández, I.; Jiménez-Gómez, G.; Lubián-López, S. Effect of Filters on the Noise Generated by Continuous Positive Airway Pressure Delivered via a Helmet. Noise Health 2017, 19, 20–23. [Google Scholar] [CrossRef] [PubMed]
- Fernández-Zacarías, F.; Puyana-Romero, V.; Hernández-Molina, R. The Importance of Noise Attenuation Levels in Neonatal Incubators. Acoustics 2022, 4, 821–833. [Google Scholar] [CrossRef]
- de Oliveira Rodarte, M.D.; Fujinaga, C.I.; Leite, A.M.; Salla, C.M.; da Silva, C.G.; Scochi, C.G.S. Exposure and Reactivity of the Preterm Infant to Noise in the Incubator. CoDAS 2019, 31, e20170233. [Google Scholar] [CrossRef]
- Rodríguez-Montaño, V.M.; Beira-Jiménez, J.L.; Puyana-Romero, V.; Cueto-Ancela, J.L.; Hernández-Molina, R.; Fernández-Zacarías, F. Acoustic Conditioning of the Neonatal Incubator Compartment: Improvement Proposal. Front. Pediatr. 2022, 10, 955553. [Google Scholar] [CrossRef]
- Hutchinson, G.; Du, L.; Ahmad, K. Incubator-Based Sound Attenuation: Active Noise Control In A Simulated Clinical Environment. PLoS ONE 2020, 15, e0235287. [Google Scholar] [CrossRef]
- Bertsch, M.; Reuter, C.; Czedik-Eysenberg, I.; Berger, A.; Olischar, M.; Bartha-Doering, L.; Giordano, V. The “Sound of Silence” in a Neonatal Intensive Care Unit—Listening to Speech and Music Inside an Incubator. Front. Psychol. 2020, 11, 1055. [Google Scholar] [CrossRef]
- Puyana-Romero, V.; Núñez-Solano, D.; Fernández-Zacarías, F.; Jara-Muñoz, E.; Hernández-Molina, R. The Importance of Reverberation for the Design of Neonatal Incubators. Front. Pediatr. 2021, 9, 584736. [Google Scholar] [CrossRef]
- Casado, A.R.; Larrodé-díaz, M.; Zacarias, F.F.; Molina, R.H. Experimental and Computational Model for a Neonatal Incubator with Thermoelectric Conditioning System. Energies 2021, 14, 5278. [Google Scholar] [CrossRef]
- Puyana-romero, V.; Núñez-solano, D.; Hernández, R.; Fernández-zacarías, F.; Beira-jiménez, J.L.; Garzón, C.; Jara-muñoz, E. Reverberation Time Measurements of a Neonatal Incubator. Appl. Acoust. 2020, 167, 107374. [Google Scholar] [CrossRef]
- Fernández Zacarías, F.; Beira Jiménez, J.L.; Bustillo Velázquez-Gaztelu, P.J.; Hernández Molina, R.; Lubián López, S. Noise Level in Neonatal Incubators: A Comparative Study of Three Models. Int. J. Pediatr. Otorhinolaryngol. 2018, 107, 150–154. [Google Scholar] [CrossRef]
- Karadağ, Ö.; Balci, S. The Effect of an Incubator Cover Designed to Prevent Noise and Light on Physiological Parameters of Preterm Infants in a Neonatal Intensive Care Unit. Health Probl. Civiliz. 2022, 16, 173–180. [Google Scholar] [CrossRef]
- Pinheiro, E.M.; Guinsburg, R.; Nabuco, M.A.D.A.; Kakehashi, T.Y. Noise at the Neonatal Intensive Care Unit and inside the Incubator. Rev. Lat.-Am. Enferm. 2011, 19, 1214–1221. [Google Scholar] [CrossRef] [PubMed] [Green Version]
- Sound Fields, Terms and Definitions—Acoustic Glossary. Available online: https://www.acoustic-glossary.co.uk/sound-fields.htm (accessed on 28 January 2023).
- EN IEC 60601-2-2:2018; Medical Electrical Equipment—Part 2-2: Particular Requirements for the Basic Safety and Essential Performance of High Frequency Surgical Equipment and High Frequency Surgical Accessories. IEC: London, UK, 2018. Available online: https://standards.iteh.ai/catalog/standards/clc/bd56ff83-1df5-41e8-89aa-f89f5abdf25d/en-iec-60601-2-2-2018 (accessed on 20 September 2022).
- ISO 1996-2:2017; Acoustics—Description, Measurement and Assessment of Environmental Noise—Part 2: Determination of Sound Pressure Levels. ISO: London, UK, 2017. Available online: https://www.iso.org/standard/59766.html (accessed on 25 January 2023).
- BOE-A-2007-18397; Real Decreto 1367/2007, de 19 de Octubre, Por El Que Se Desarrolla La Ley 37/2003, de 17 de Noviembre, Del Ruido, En Lo Referente a Zonificación Acústica, Objetivos de Calidad y Emisiones Acústicas. BOE.es: Madrid, Spain, 2007. Available online: https://www.boe.es/buscar/pdf/2007/BOE-A-2007-18397-consolidado.pdf (accessed on 26 January 2023).
- Avery, G.B.; Fletcher, M.A.; MacDonald, M.G. Neonatología: Fisiopatología y Manejo Del Recién Nacido, 5th ed.; Médica Panamericana: Montevideo, Uruguay, 2001. [Google Scholar]


| Incubator Model | Outside (Model 2250) dBA | Inside (Model 2270) dBA | ||||||||||||||
|---|---|---|---|---|---|---|---|---|---|---|---|---|---|---|---|---|
| LAeq | LCeq | LAIeq | LAFmax | LAFmin | L10 | L50 | L90 | LAeq | LCeq | LAIeq | LAFmax | LAFmin | L10 | L50 | L90 | |
| Care Plus Rever | 17.8 | 35 | 17.8 | 18.2 | 17.5 | 17.9 | 17.5 | 17.1 | 17.7 | 42.7 | 18.9 | 27.6 | 16.5 | 17.8 | 17 | 16.2 |
| Dräger Medical | 17.8 | 35.7 | 17.8 | 18.8 | 17.5 | 18.0 | 17.8 | 17.6 | 16.9 | 36.6 | 17.1 | 19.9 | 16.5 | 17.1 | 16.8 | 16.6 |
| Giraffe | 17.8 | 34.0 | 17.8 | 18.4 | 17.5 | 18.0 | 17.8 | 17.6 | 17.0 | 34.3 | 17.1 | 19.1 | 15.8 | 17.2 | 17.0 | 16.8 |
| Incubator Model | Outside (Model 2250) dBA | Inside (Model 2270) dBA | ||||||||||||||
|---|---|---|---|---|---|---|---|---|---|---|---|---|---|---|---|---|
| LAeq | LCeq | LAIeq | LAFmax | LAFmin | L10 | L50 | L90 | LAeq | LCeq | LAIeq | LAFmax | LAFmin | L10 | L50 | L90 | |
| Care Plus Rever | 31.9 | 44.3 | 32.9 | 33.3 | 30.4 | 32.8 | 32.0 | 31.2 | 55.2 | 69.7 | 56.2 | 56.9 | 53.7 | 55.9 | 55.5 | 55.1 |
| Dräger Medical | 23.7 | 38.6 | 24.3 | 24.8 | 22.8 | 24.1 | 23.7 | 23.3 | 48.8 | 54.8 | 49.8 | 50.3 | 47.5 | 49.3 | 48.8 | 48.3 |
| Giraffe | 32.6 | 40.1 | 33.3 | 33.6 | 32.1 | 33.0 | 32.6 | 32.1 | 56.3 | 63.2 | 56.9 | 57.2 | 55.2 | 56.7 | 56.3 | 55.9 |
| Incubator Model | Outside (Model 2250) dBA | Inside (Model 2270) dBA | ||||||||||||||
|---|---|---|---|---|---|---|---|---|---|---|---|---|---|---|---|---|
| LAeq | LCeq | LAIeq | LAFmax | LAFmin | L10 | L50 | L90 | LAeq | LCeq | LAIeq | LAFmax | LAFmin | L10 | L50 | L90 | |
| Care Plus Rever | 56.6 | 55.5 | 63.6 | 65.2 | 29.9 | 56.9 | 56.5 | 56.1 | 59.1 | 71.8 | 62.4 | 64.1 | 55.7 | 59.9 | 59.5 | 59.1 |
| Dräger Medical | 72.6 | 76.0 | 78.2 | 79.9 | 22.7 | 78.1 | 51.8 | 23.5 | 58.4 | 62.3 | 66.3 | 68.8 | 47.6 | 61.1 | 50.8 | 48.6 |
| Giraffe | 58.0 | 58.0 | 64.3 | 64.3 | 31.0 | 62.0 | 56.9 | 31.7 | 56.6 | 63.2 | 57.5 | 58.0 | 54.9 | 57.2 | 56.7 | 55.8 |
| Incubator Model | Outside (Model 2250) dBA | Inside (Model 2270) dBA | ||||||||||||
|---|---|---|---|---|---|---|---|---|---|---|---|---|---|---|
| LAeq | LCeq | LAIeq | Kt | Kf | Ki | LKeq | LAeq | Lceq | LAIeq | Kt | Kf | Ki | LKeq | |
| Care Plus Rever | 31.7 | 43.8 | 32.8 | 6.0 | 3.0 | 0.0 | 41 | 56.1 | 69.0 | 57.9 | 6.0 | 3.0 | 0.0 | 65 |
| Dräger Medical | 23.0 | 45.4 | 23.7 | 6.0 | 6.0 | 0.0 | 32 | 48.8 | 54.7 | 49.7 | 6.0 | 0.0 | 0.0 | 55 |
| Giraffe | 32.4 | 38.9 | 33.1 | 3.0 | 0.0 | 0.0 | 35 | 56.3 | 63.2 | 56.9 | 6.0 | 0.0 | 0.0 | 62 |
| Incubator Model | Outside (Model 2250) dBA | Inside (Model 2270) dBA | ||||||||||||
|---|---|---|---|---|---|---|---|---|---|---|---|---|---|---|
| LAeq | LCeq | LAIeq | Kt | Kf | Ki | LKeq | LAeq | Lceq | LAIeq | Kt | Kf | Ki | LKeq | |
| Care Plus Rever | 56.6 | 55.5 | 63.6 | 6.0 | 0.0 | 0.0 | 63 | 59.1 | 71.8 | 62.4 | 6.0 | 3.0 | 0.0 | 68 |
| Dräger Medical | 72.5 | 76.0 | 78.2 | 6.0 | 0.0 | 0.0 | 79 | 58.4 | 62.3 | 66.3 | 6.0 | 0.0 | 0.0 | 64 |
| Giraffe | 58.0 | 58.0 | 64.3 | 6.0 | 0.0 | 0.0 | 64 | 56.6 | 63.2 | 57.5 | 6.0 | 0.0 | 0.0 | 63 |
Disclaimer/Publisher’s Note: The statements, opinions and data contained in all publications are solely those of the individual author(s) and contributor(s) and not of MDPI and/or the editor(s). MDPI and/or the editor(s) disclaim responsibility for any injury to people or property resulting from any ideas, methods, instructions or products referred to in the content. |
© 2023 by the authors. Licensee MDPI, Basel, Switzerland. This article is an open access article distributed under the terms and conditions of the Creative Commons Attribution (CC BY) license (https://creativecommons.org/licenses/by/4.0/).
Share and Cite
Fernández-Zacarías, F.; Beira-Jiménez, J.L.; Puyana-Romero, V.; Hernández-Molina, R. Diagnosis of Noise Inside Neonatal Incubators under Free-Field Conditions. Acoustics 2023, 5, 354-366. https://doi.org/10.3390/acoustics5020021
Fernández-Zacarías F, Beira-Jiménez JL, Puyana-Romero V, Hernández-Molina R. Diagnosis of Noise Inside Neonatal Incubators under Free-Field Conditions. Acoustics. 2023; 5(2):354-366. https://doi.org/10.3390/acoustics5020021
Chicago/Turabian StyleFernández-Zacarías, Francisco, Juan Luis Beira-Jiménez, Virginia Puyana-Romero, and Ricardo Hernández-Molina. 2023. "Diagnosis of Noise Inside Neonatal Incubators under Free-Field Conditions" Acoustics 5, no. 2: 354-366. https://doi.org/10.3390/acoustics5020021