Article

Extra-Auditory Effects from Noise Exposure in Schools: Results of Nine Italian Case Studies

by
Franco Cotana
1,
Francesco Asdrubali
2,*,
Giulio Arcangeli
3,
Sergio Luzzi
4,
Giampietro Ricci
5,
Lucia Busa
3,
Michele Goretti
1,
Alfonso Antonio Vincenzo Tortorella
6,
Paola Pulella
4,
Piergiovanni Domenighini
1,
Valeria Gambacorta
5,
Claudia Guattari
7,
Federica Cirimbilli
6,
Andrea Nicolini
1,
Pietro Nataletti
8,
Diego Annesi
8,
Filippo Sanjust
8 and
Luigi Cerini
8
1
CIRIAF, University of Perugia, 06125 Perugia, Italy
2
Department of Industrial, Electronics and Mechanical Engineering, Roma Tre University, 00146 Rome, Italy
3
Department of Experimental and Clinical Medicine, University of Florence, 50134 Florence, Italy
4
Vie en.ro.se. Ingegneria S.r.l., 50127 Florence, Italy
5
Department of Medicine and Surgery, Section of Otorhinolaryngology, University of Perugia, 06129 Perugia, Italy
6
Department of Medicine and Surgery, School of Specialisation in Psychiatry, 06129 Perugia, Italy
7
Department of Philosophy, Communication and Performing Arts, Roma Tre University, 00146 Rome, Italy
8
National Institute for Insurance against Accidents at Work, Department of Medicine, Epidemiology, Occupational and Environmental Hygiene, Monte Porzio Catone, 00078 Rome, Italy
*
Author to whom correspondence should be addressed.
Acoustics 2023, 5(1), 216-241; https://doi.org/10.3390/acoustics5010013
Submission received: 27 December 2022 / Revised: 4 February 2023 / Accepted: 21 February 2023 / Published: 24 February 2023
(This article belongs to the Special Issue Classroom Acoustics: Creating Efficient Learning Environments)

Abstract

:
Noise exposure may cause auditory and extra-auditory effects. School teachers and students are exposed to high noise levels which have an impact on perceptual-cognitive and neurobehavioral aspects. The latter influence teaching conditions and student school performance. A Protocol was defined and parameters to be investigated were identified for acoustic characterization of unoccupied and occupied school environments, assessment of users by means of questionnaires completed by teachers and students, and vocal effort evaluation. Classrooms, laboratories, auditoriums, gymnasiums, common areas, canteens and outdoor areas were analysed in terms of acoustic features and identification of the origin of noise. The Protocol was tested in three kindergartens, three primary schools and three secondary schools placed in Rome, Florence and Perugia. Results of nine case studies are presented, including comparisons of objective and subjective investigations. Generally, the acoustic performances of the spaces under investigation do not meet the requirements of current Italian legislation. In particular, student activity determines high noise levels in laboratories, gymnasiums, and canteens. Students notice that noise mainly causes loss of concentration, fatigue, boredom, and headache. The outcomes of this research will be the starting point to define strategies and solutions for noise control and mitigation in schools and to draft guidelines for the acoustical school design.

1. Introduction

According to the Environmental Noise guidelines published by the World Health Organization’s Regional Office for Europe in October 2018, the importance of population noise exposure and the consequent annoyance is highlighted as a public health issue [1]. Noise produces auditory and extra-auditory effects on humans, affecting the hearing organ and other organs and systems [2]. Occupational noise exposure may determine disorders which interest cognitive performance, attention and motivation at work, followed by irritation, stress, mood changes, with depression or increased aggression, and sleep [3,4,5].
Several studies have demonstrated that the presence of high levels of background noise in classrooms, in association with high reverberation, induces issues in speech comprehension and perception to arise in school-age children [6,7,8]. Research about the effect of classroom acoustic conditions on children’s physical health has been carried out by Mealings [9], assessing that noise may induce a stress response that results in asthma, fatigue and headaches. Moreover, noise and reverberation in primary school classrooms may affect attention and memory in children [10]. An interesting outcome has been observed from a study of 142 London primary schools [11], where external noise influenced internal noise levels only when children were engaged in the quietest classroom activities.
On the other hand, teachers are forced to speak at least 10–15 dB louder than the background noise and this leads to conditions of vocal fatigue that causes stress or psycho-emotional alterations in prolonged periods [12,13]. Systematic review of papers published in recent decades dealing with issues related to noise exposure have been analysed [14,15]. These papers regard the acoustical parameters that have the greatest influence on students’ performance and the impact of classroom noise generated by chatter on students’ comprehension performance. The values of the acoustical parameters which determine better or worse learning performance were reported in [14].
The BRIC 2019-ID14 Project [16] analysed school environments as workplaces characterised by high noise, which students and teachers are subject to. The project was funded by INAIL—the Italian National Institute for Insurance against Accidents at Work. The research aimed at determining the evolution of acoustics applied to workplaces including both the extra-auditory effects of noise exposure and the acoustic quality of the environments. Noise generated by students chatting, equipment, desks, chairs, etc., is identifiable as unwanted sound and has negative impacts on people’s health and well-being. The Project defined an Investigation Protocol and carried out measurements and experiments in order to produce a guideline concerning evaluation and control of extra-auditory effects on teachers and students, from kindergarten to secondary schools.

2. Materials and Methods

Nine case studies schools were employed to define and implement of a Protocol for acoustic and subjective measurements in schools. Seven types of typical school scenarios were considered: classroom (S1), laboratory (S2), auditorium (S3), gymnasium (S4), common area (S5), canteen (S6), and outdoor area (S7).
Experience from previous literature studies were taken into consideration to better define the Investigation Protocol. It is noted that the analyses carried out in the articles presented in the Introduction do not include all the education and recreation scenarios which are present in the schools but underline the consequences of noise exposure focusing on school classrooms.
Proof of this Protocol can be found in the literature [17,18]. Objective acoustic parameters from standards were used in the school environments for both the occupied and unoccupied configurations, and they were considered as essential for the assessment of the acoustic quality in enclosed spaces designed for teaching, with stress exerted on the voice, speech listening conditions and challenging building acoustic requirements. Objective parameters were chosen according to the investigated enclosed room typology and the results of implemented parameters were compared with the subjective test results. The subjective opinion of the investigated spaces was gathered by providing questionnaires to students and teachers.
Besides the measurements of occupied and unoccupied environments by objective parameters, vocal effort measurements and soundscape analysis were performed.
The vocal effort measurements aim at establishing correlations between the acoustical characteristics of school spaces and the increasing of vocal diseases in teachers. Measurements were performed to assess the vocal load during teaching hours and understand the severity and frequency of the teacher’s need to increase the intensity of speech in response to increased background noise.
The soundscape analyses allowed the study to be improved by providing more data to evaluate the external environment and its noise level than the acquisition of the outdoor sound pressure level.
In each measurement report, it was necessary to describe the building characteristics, any significant peculiarities of the environments in which the investigations were carried out and their boundary conditions (e.g., presence of sources not related to the specific context, special characteristics from the acoustic point of view of finishes and furnishings, etc.).
The Protocol presented survey scenarios, legislative and regulatory references, as well as operational guidance, divided into four categories: measurements and indicators, questionnaires, vocal effort and soundscape analysis.
Each category included a number of items corresponding to the individual measurements and analyses to be carried out. Due to the pandemic event, for each Protocol item, the parameters, measurement methodology and some notes on context-related data acquisition criticalities, health emergency from COVID-19 guidelines, were included.

2.1. Investigation Protocol for the Acoustic and Subjective Analysis of School Environments

2.1.1. Acoustic Measurements in Unoccupied Environments

Acoustic measurements were carried out in furnished but unoccupied rooms, and they included the following parameters:
-
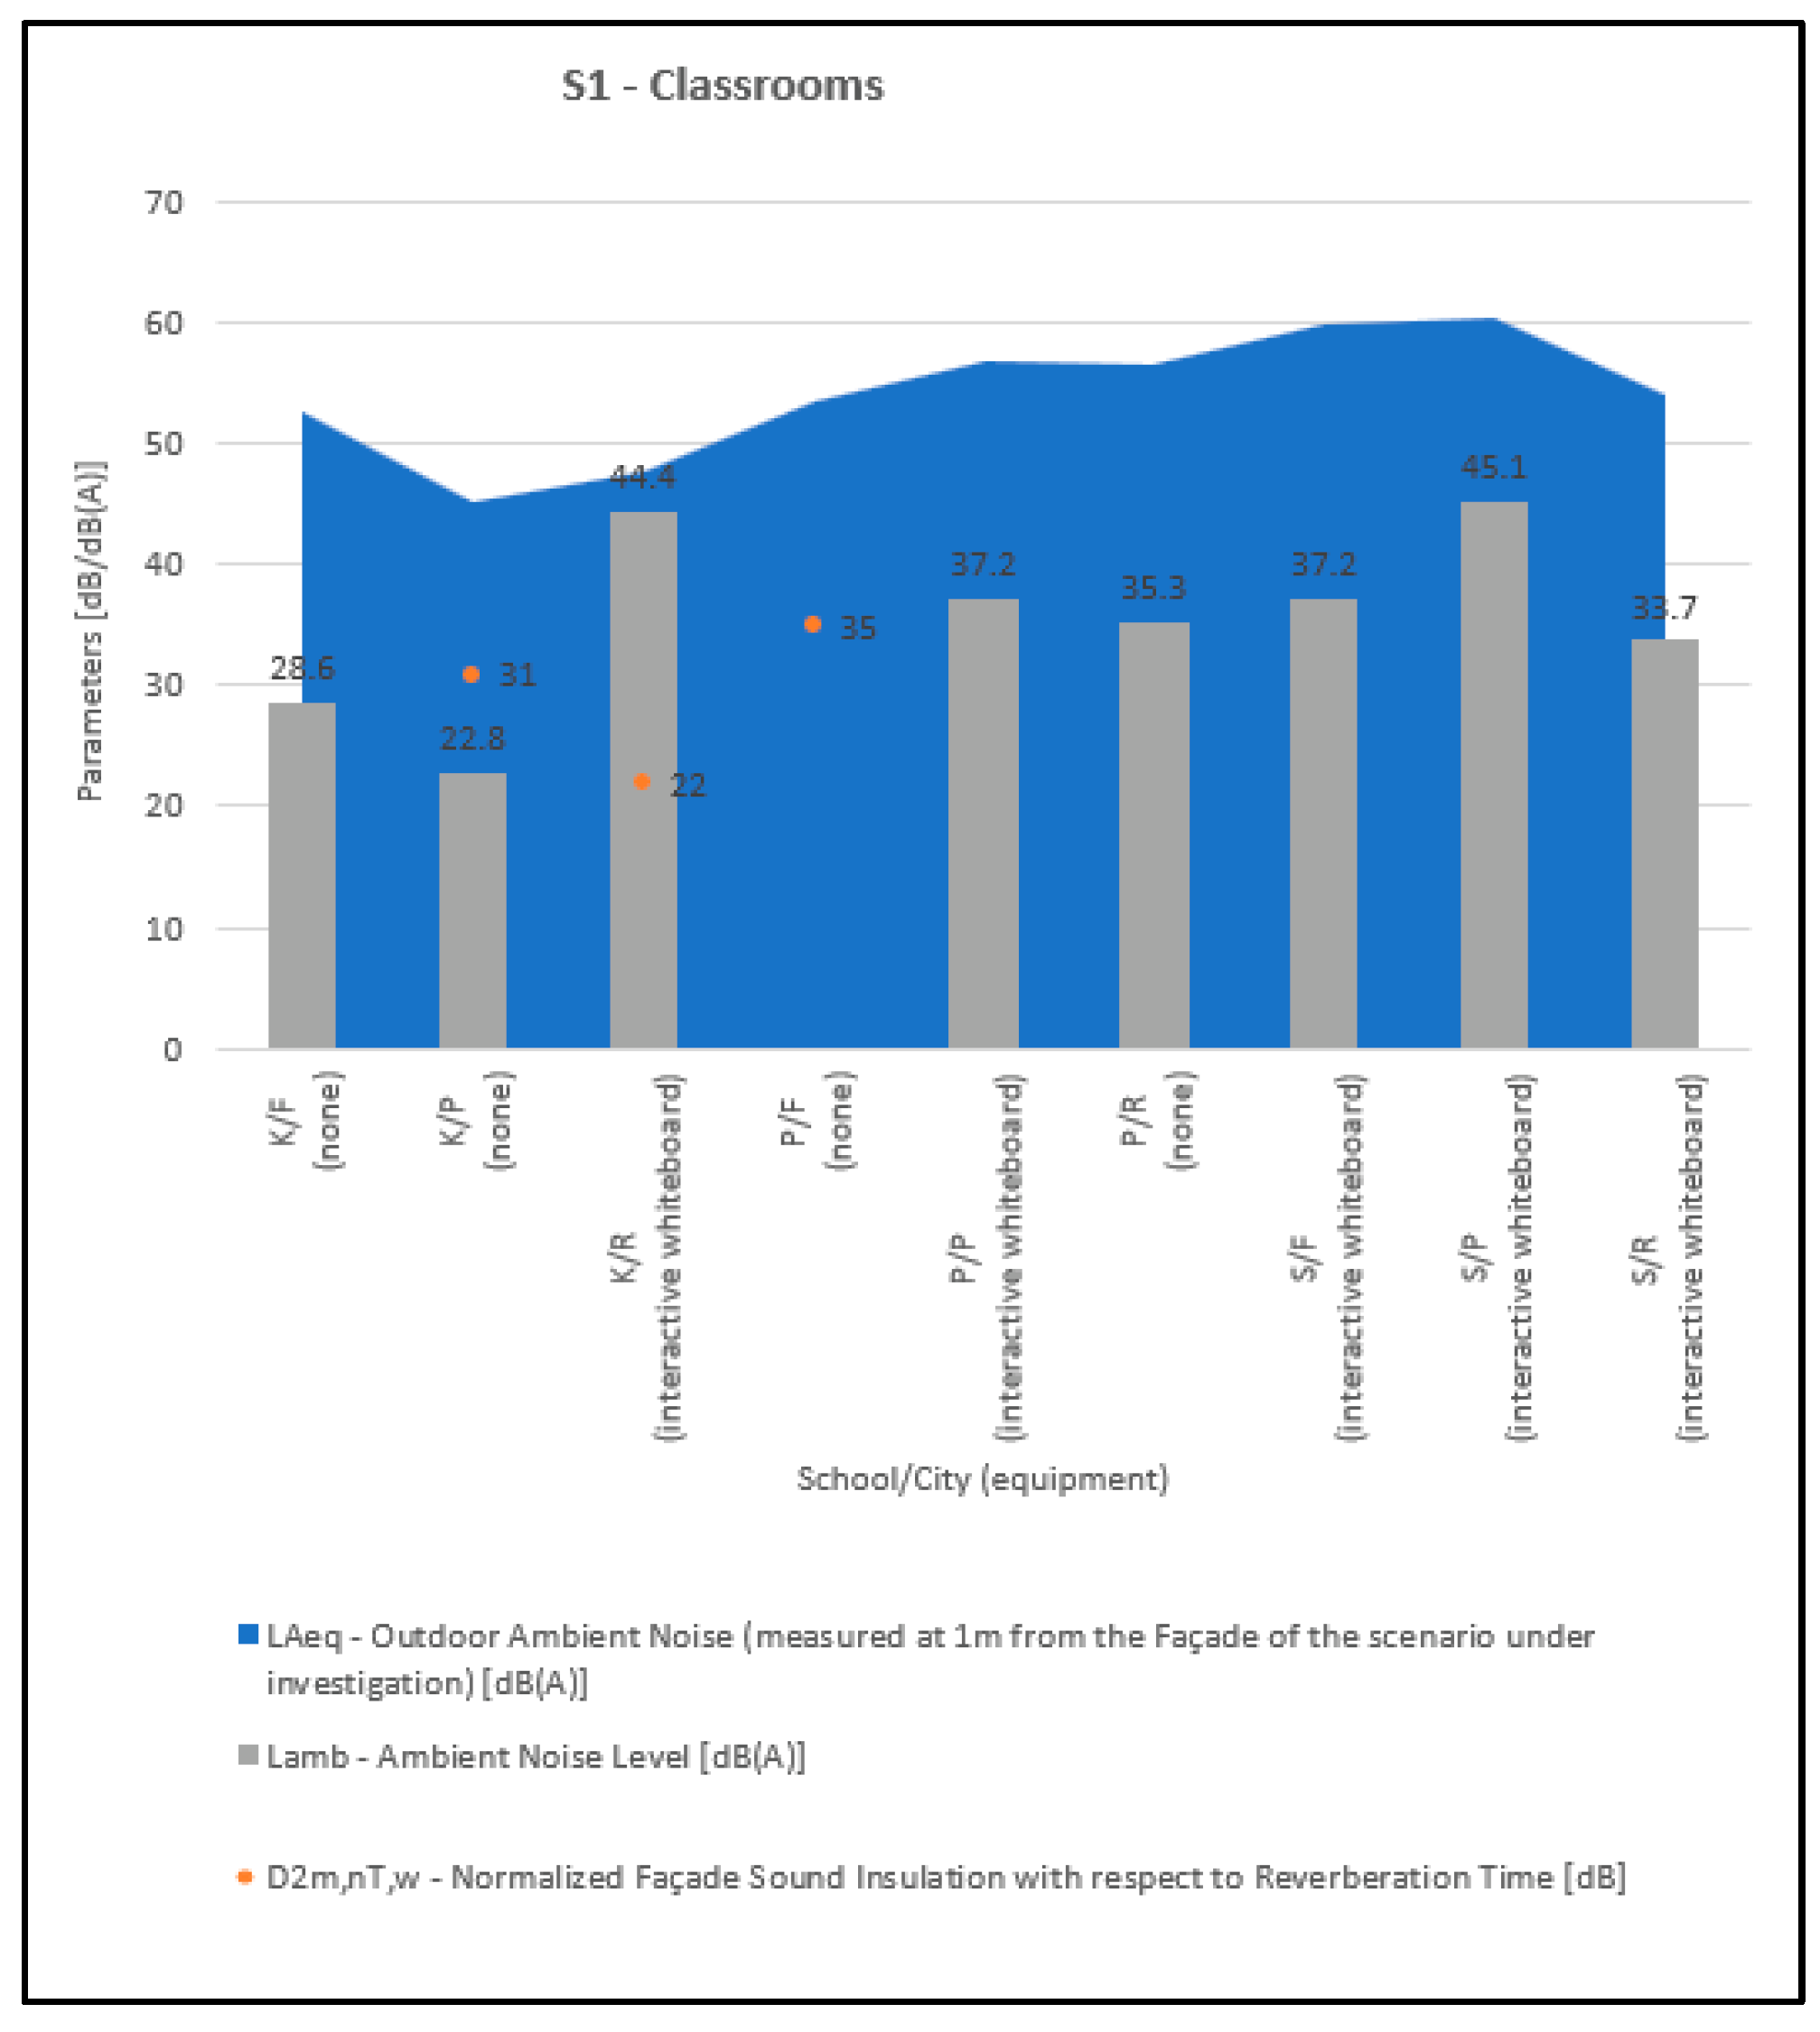
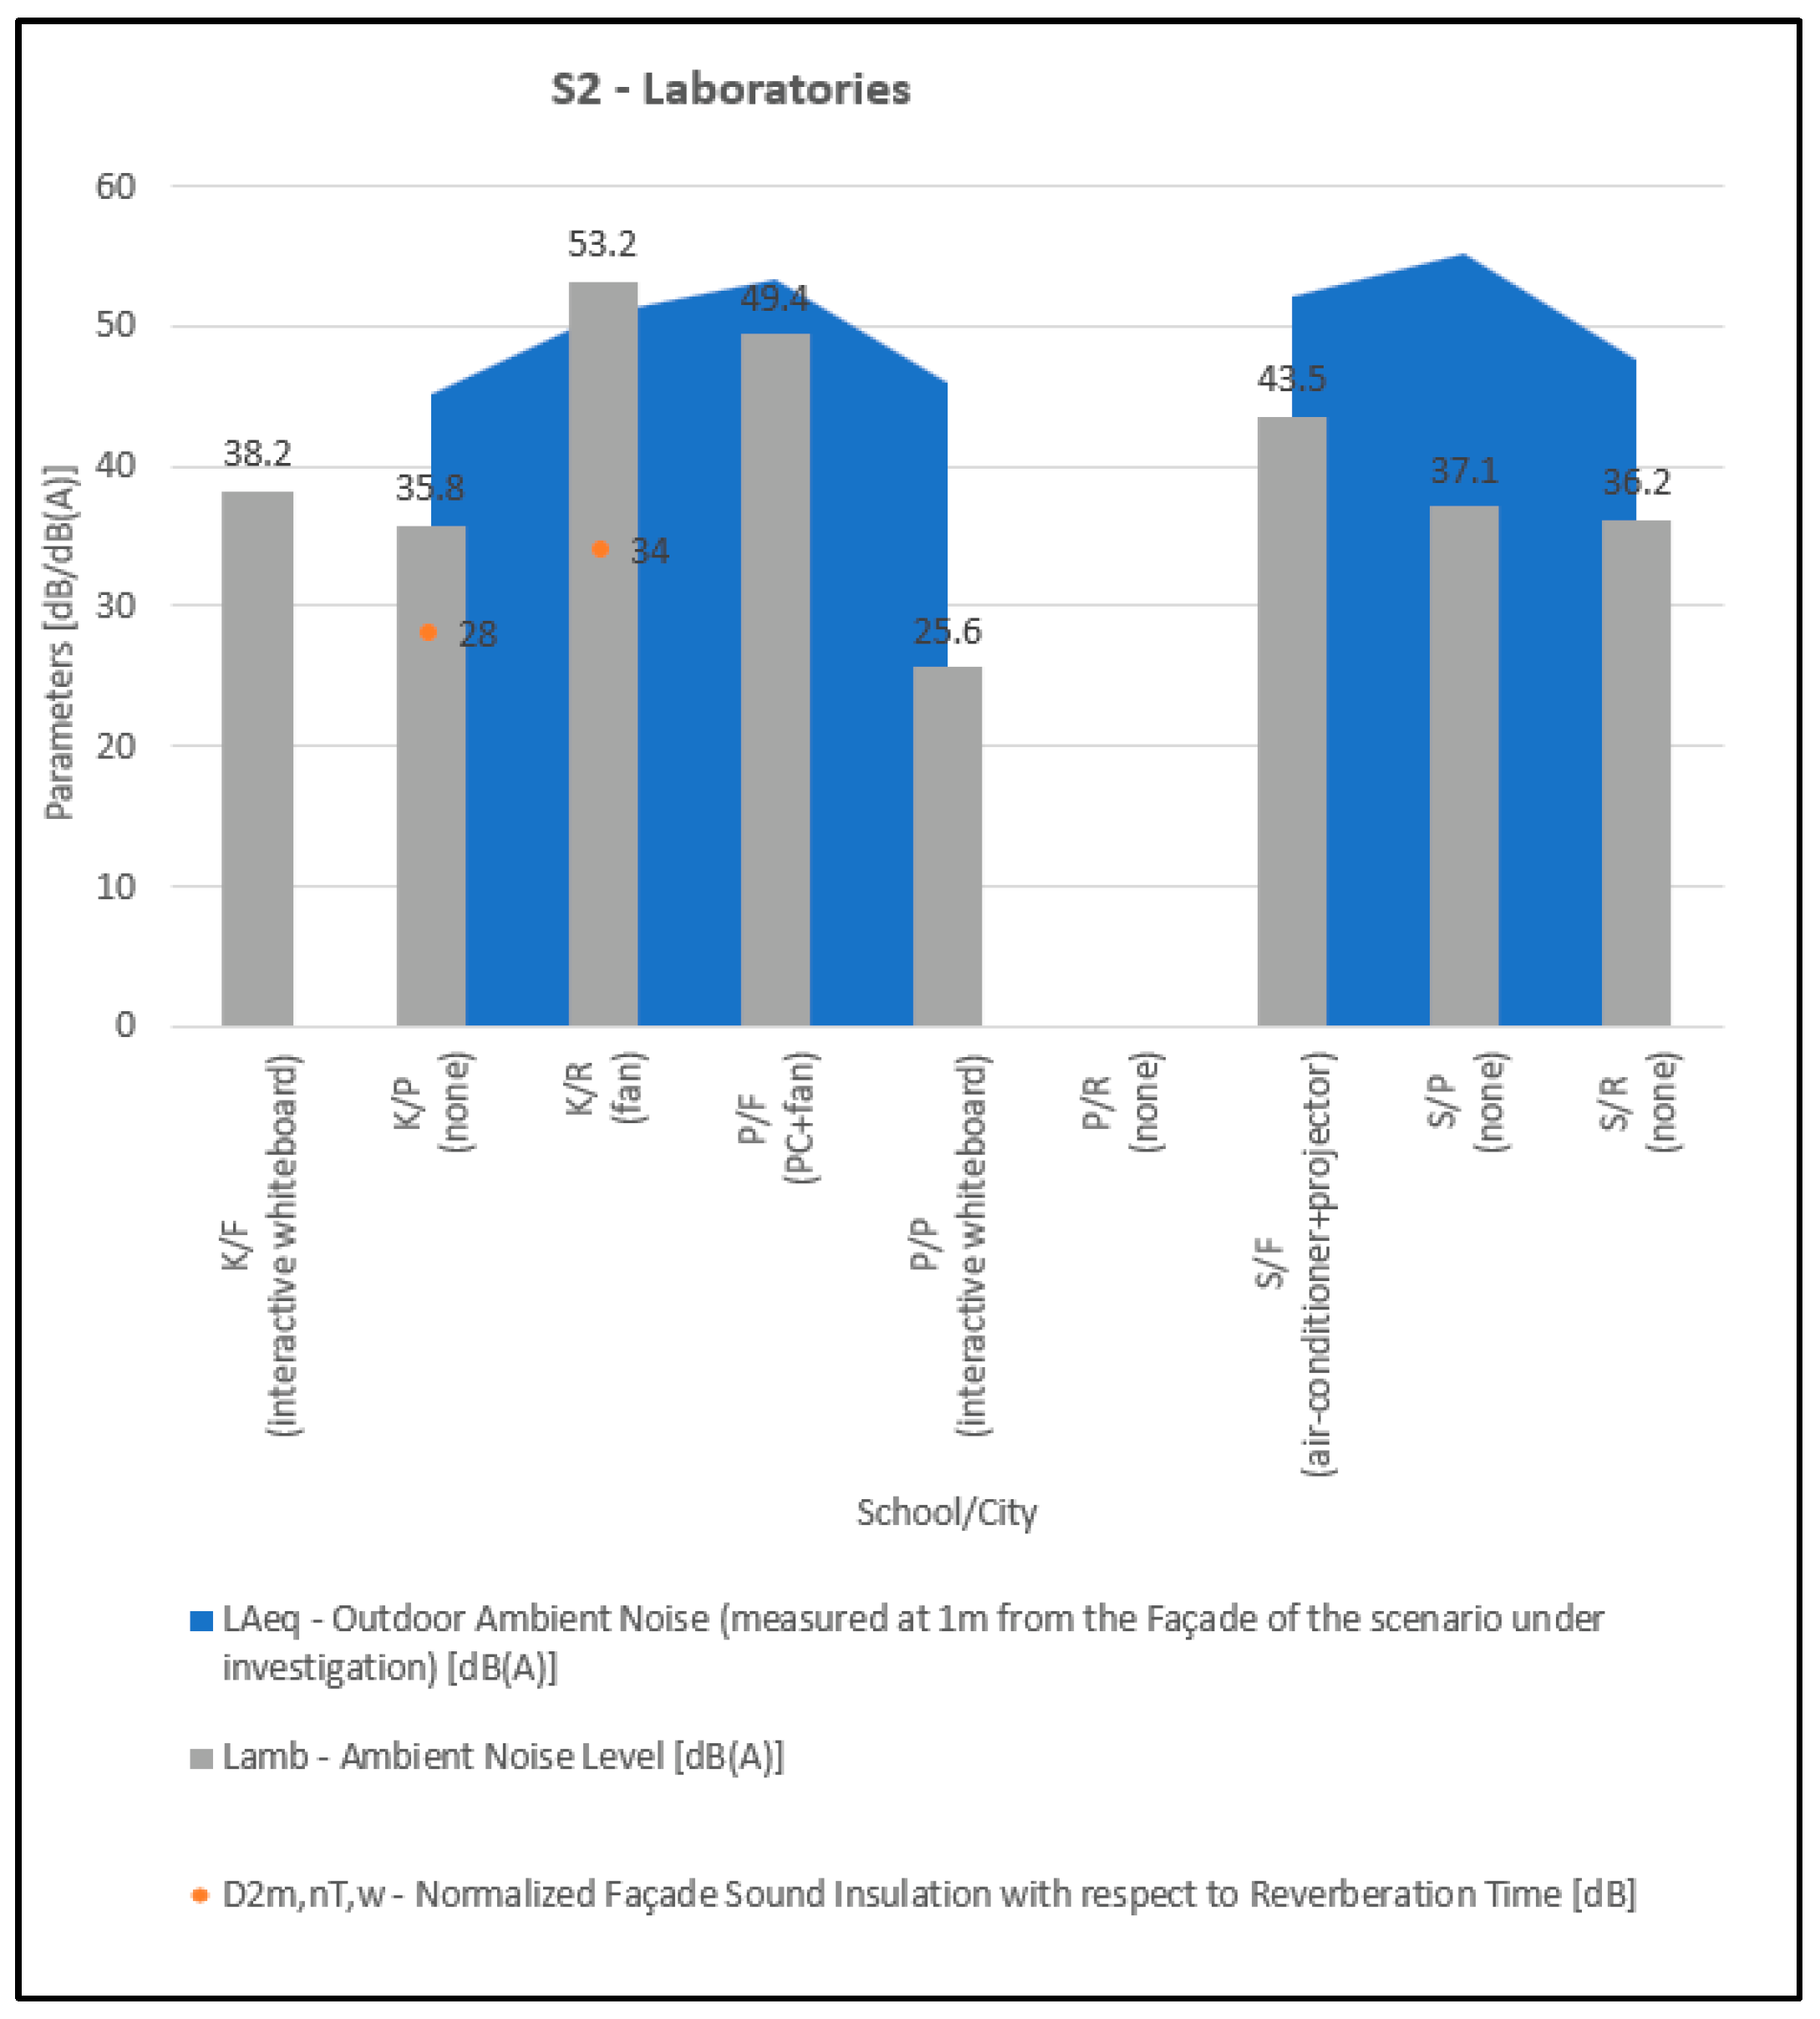
Acoustic climate/outdoor ambient noise LAeq with reference to [19]. Measurement positions were considered at 1 m from the facade of the investigated environment, whereas one was located in the centre of the outdoor area under investigation. The measurement period corresponded to the common use of the school, generally the time slot was 8 am to 4 pm. LAeq measurements were carried out at 1 h intervals. If the school had reduced hours (such as high school), the measurement period was reduced accordingly.
-
Normalised facade sound insulation with respect to reverberation time D2m,nT,w with reference to [20]. The measurements were carried out for the facades of the rooms under investigation, performing multiple measurements in case of different shape of the facade or different views.
-
Ambient noise level Lamb with reference to [21]: this parameter was measured as much as possible at the same time as the outdoor noise climate. Furthermore, it was required to evaluate the types of systems present within the spaces and ensure that they were functioning during measurements (e.g., in classrooms: interactive whiteboards, air conditioning systems, ceiling fans, etc.); measurement time was at least 0.5 h, in the 9 am to 11 am time slot, with two measurement points in case of the room volume V < 250 m3 or four measurement points if V > 250 m3, in accordance with [21].
-
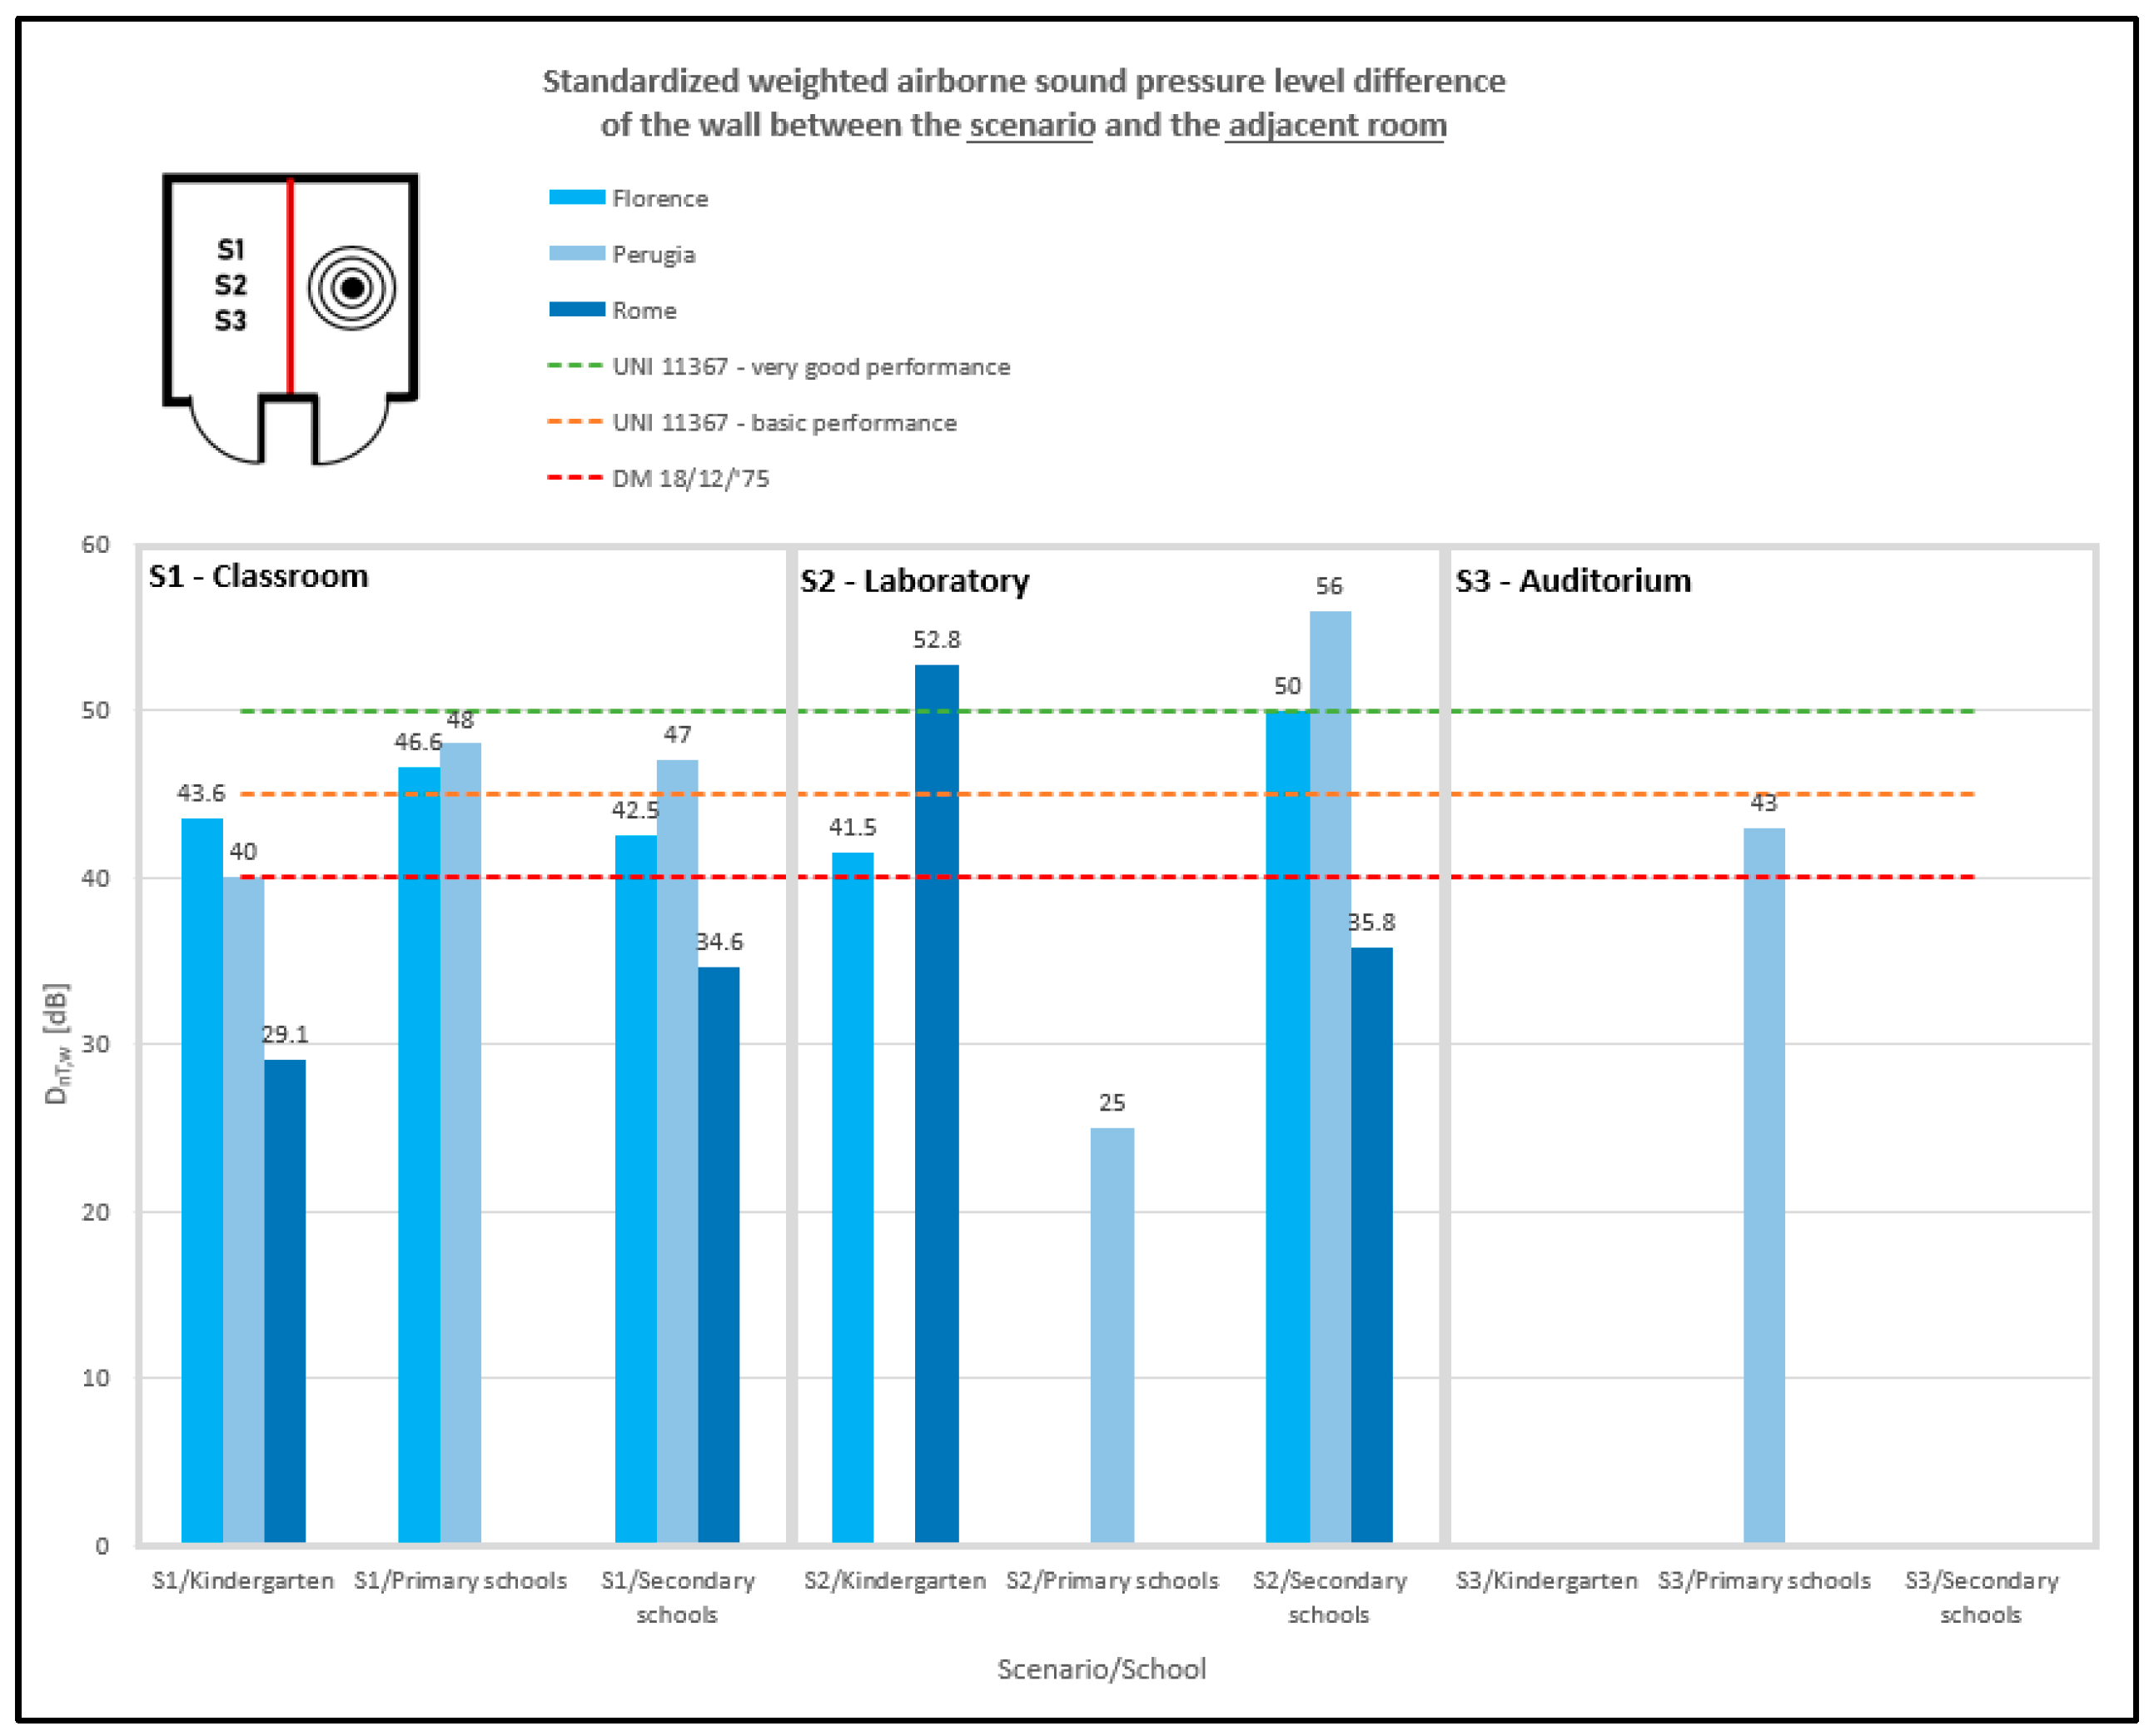
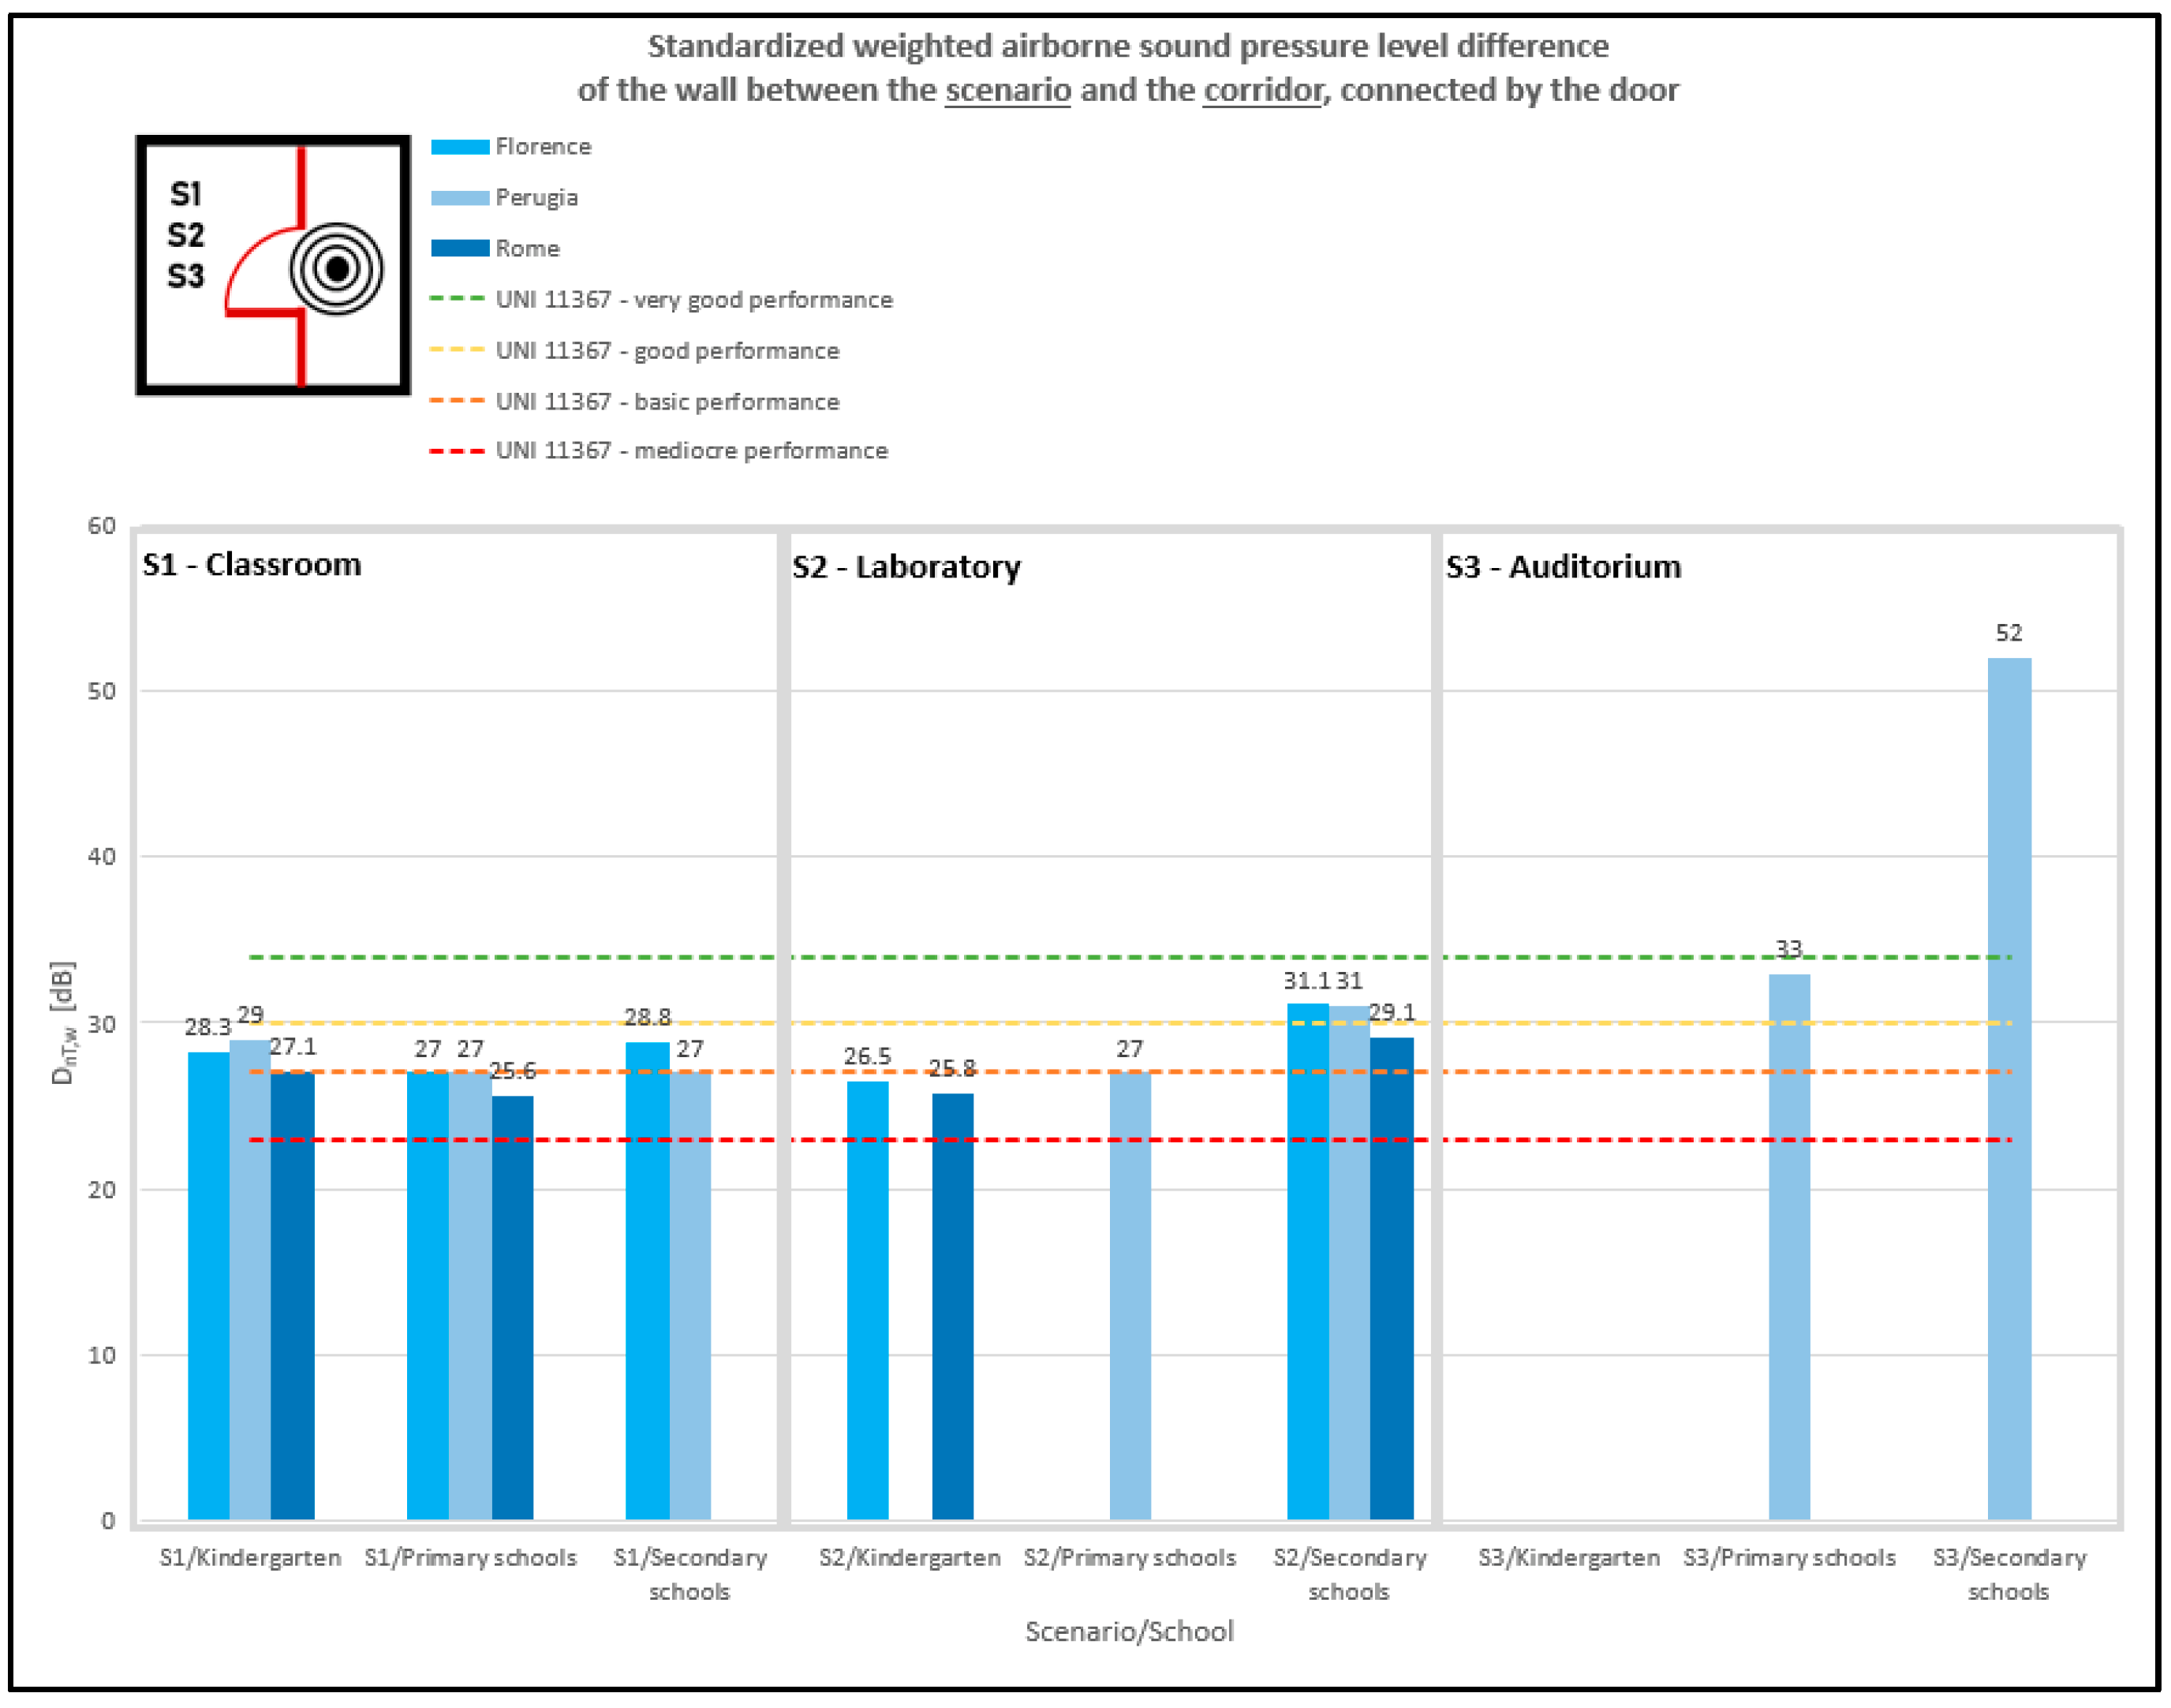
Indoor noise from neighbouring indoor spaces, with reference to [20,22]. These parameters are the standardised weighted airborne sound pressure level difference DnT,w and the weighted normalised impact sound pressure level L’n,w. DnT,w is used to determine the airborne sound insulation of horizontal partitions between overlapping environments, vertical partitions between adjacent rooms, walls bordering common spaces and provided with access (if the conformation of the space makes it feasible). Moreover, the weighted normalised impact sound pressure level L’n,w of the horizontal partition is used to determine impact sound insulation (if applicable). The sound insulation of the partitions in the rooms under investigation was measured in order to gain information on the contribution to noise from external sound sources (from the adjacent rooms and the hallway). Partitions with poor sound insulation determine noise introduction into the study environment.
-
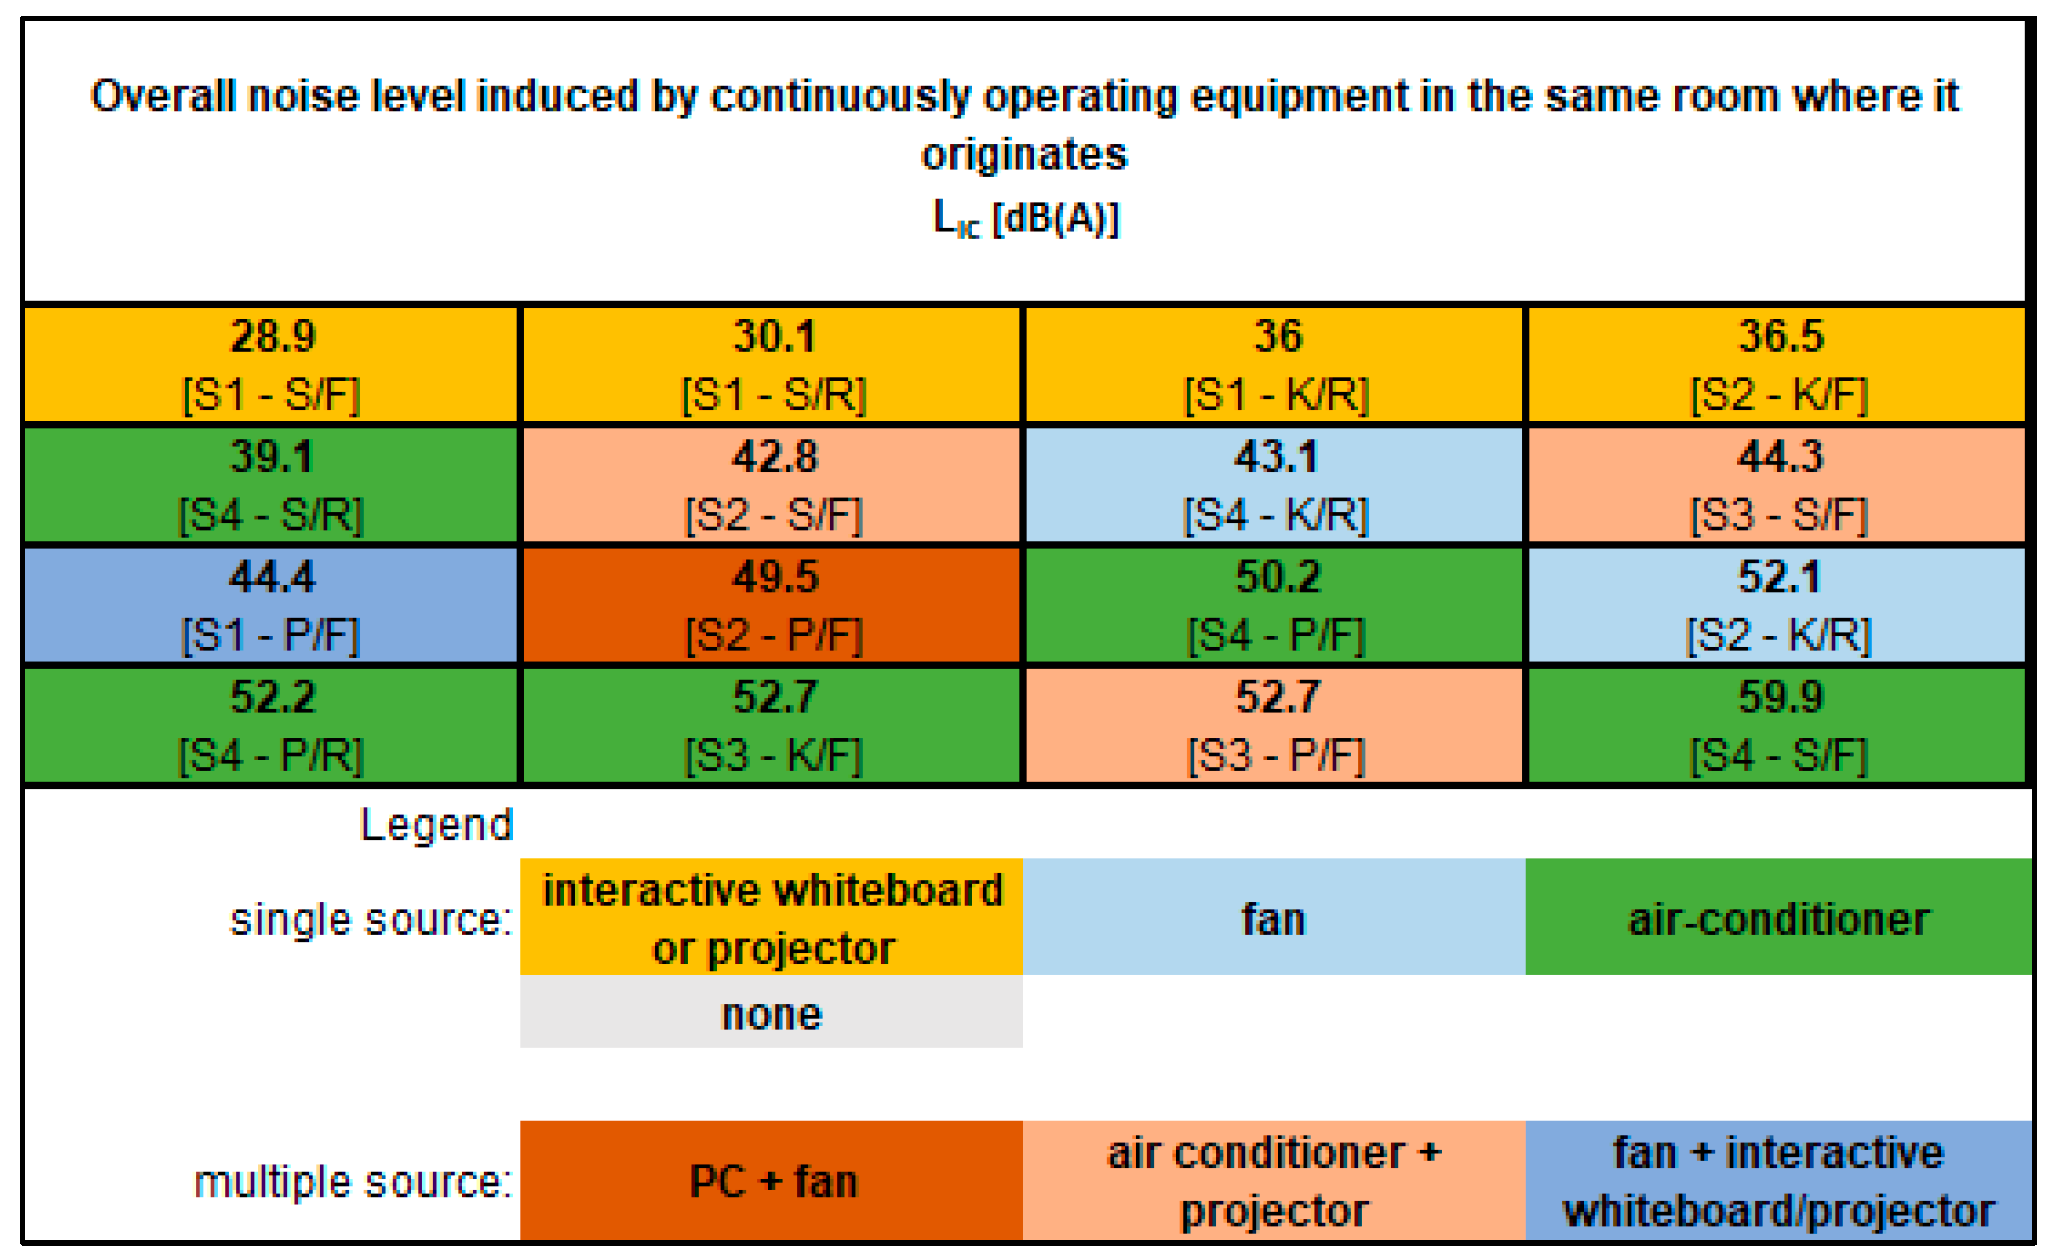
Sound pressure level from service equipment, with reference to [21,23]. This descriptor is used to determine the overall noise level induced by continuously operating facilities in the same environment where it originates (the parameter is called LIC,int) and the maximum noise level induced by the discontinuously operating systems placed in a different environment (the parameter is called LID). Classroom tech facilities were considered in the study (e.g., electronic facilities or projected board). Regarding the Lamb, two measurement points were investigated in the case of room volume V < 250 m3 or four measurement points if V > 250 m3, in accordance with [21].
-
Reverberation time RT with reference to [24,25] and room criteria: Early-to-late index C50 with reference to [24] and speech transmission index (STI) with reference to [26]. The choice of the pertinent parameter for the speech intelligibility depends on the volume of the room: C50 was used if the volume was lower than 250 m3, whereas STI was used in case where the volume was higher than 250 m3.
The acoustic measurements were carried out using sound level meters, acoustic calibrators, omni-directional sound sources and tapping machines. For the post-processing of passive acoustic requirements, specific software was used (e.g., dBBati v4.902).

2.1.2. Acoustic Measurements in Occupied Environments

Acoustic measurements must be made in furnished and occupied rooms during normal school activities. Indoor acoustic climate/ambient noise under regular room use conditions LAeq of at least one hour’s duration for each of the following scenarios was measured:
-
In the classroom (S1), the microphone was located in the centre of the occupied space, placing the acquisition instrumentation at an appropriate distance from the students, and sound level measurements were carried out during two types of activities: a taught class, in which the lecturer predominantly speaks (1 h), and an interactive class, with plurality of voices and possible audiovisual support (1 h).
-
In the laboratory (S2), auditorium (S3) and gymnasium (S4), the microphone was located in the centre of the occupied space, detecting a single condition of room use for 1 h.
-
In the common area (S5), the microphone was located in the centre of the occupied space, without an operator, detecting a single condition of use of the environment for 1 h (or for the average duration of use).
-
In the canteen (S6), measurements were taken by the operator for at least 1 h during mealtime at the area where there was the most seating.
The acoustic measurements were carried out using sound level meters.

2.1.3. Subjective Investigation

The study was carried out by administering questionnaires to the users of the environments under investigation, both teachers and students. Three questionnaires were drawn based on a model adopted by the University of Ferrara (for student surveys) and a form provided by INAIL (for teacher surveys).
The main contents concern questions on the type and origin of perceived sounds, difficulties in communication and understanding, acoustic and overall comfort of the environments, evidence of consequences having an extra-auditory nature.
Questions were defined involving occupational health physician from the University of Perugia, the University of Florence and INAIL, according to the measured parameters to be compared with. In fact, the purposes of the study were:
-
To link the subjective responses of the users of the school rooms with the objective acoustic data;
-
To determine the personal perception regarding the measured values as well as the limits for workers in the schools, subjected to high noise levels which vary over time and in the intensity of exposure.
An initial administration of the questionnaires was tested on a class of students and on some teachers of the same class in a school in Florence to identify any critical issues.
The subsequent administration of the questionnaires took place during the COVID-19 restrictions, so students and teachers were asked to answer the questions taking into account the particular conditions of using face masks and other protective equipment.
The specific questionnaires defined for students and teachers were implemented on Google Forms to allow them to be filled in from personal devices.
Questionnaire 1 is addressed to students and concerns their own classroom scenario (S1). It is structured as follows:
-
General data: General information, questions related to noise annoyance in life out of school and personal noise sensitivity.
-
Sounds and noises in the classroom: This section includes questions on the perception of noise in the classroom with closed doors and windows and related extra-auditory consequences.
-
Sounds coming from the outside: In this section, questions were included concerning the external sources with impact on school activities when windows are open.
-
Sounds coming from nearby environments: Questions concerning the perception of the sources located in the surrounding areas.
-
Sounds produced in the same classroom: This section includes questions concerning the perception of sources that are within the same classroom.
-
Listening to the teacher: This section analyses a specific context related to listening to a reference teacher, identified as the Italian teacher. The questions concern the perception of the teacher’s voice with closed doors and windows.
-
Comfort in the classroom: This section investigates other aspects of the perception of the quality of the environment, other than the acoustic ones: thermo-hygrometric comfort, air quality, light comfort, ergonomics and the perception of the pleasantness of the environment in general.
Questionnaire 2 is for students but applies to all the scenarios under investigation, except for the classroom (studied in Questionnaire 1). The survey includes the general data section and specific parts about sound and noises in the laboratory (S2), auditorium (S3), gymnasium (S4), common area (S5), canteen (S6) and outdoor area (S7).
Finally, Questionnaire 3 is intended for teachers and deals with their main working environment; their perception of acoustic comfort, the sources considered most disturbing and the needed vocal effort are analysed. In addition to general data, the other sections of the form investigate a second working environment used by teachers, auditory and extra-auditory effects and risks from noise exposure, the perception of discomfort and personal noise sensitivity.
For questions including a rating, a Likert 9-point scale was proposed. The answers were analysed converting the 9-point scale to a 5-point scale, for an easier interpretation and visualization of results.
A summary comparison between the three questionnaires is shown in Table 1.

2.1.4. Vocal Effort Investigations on Teachers
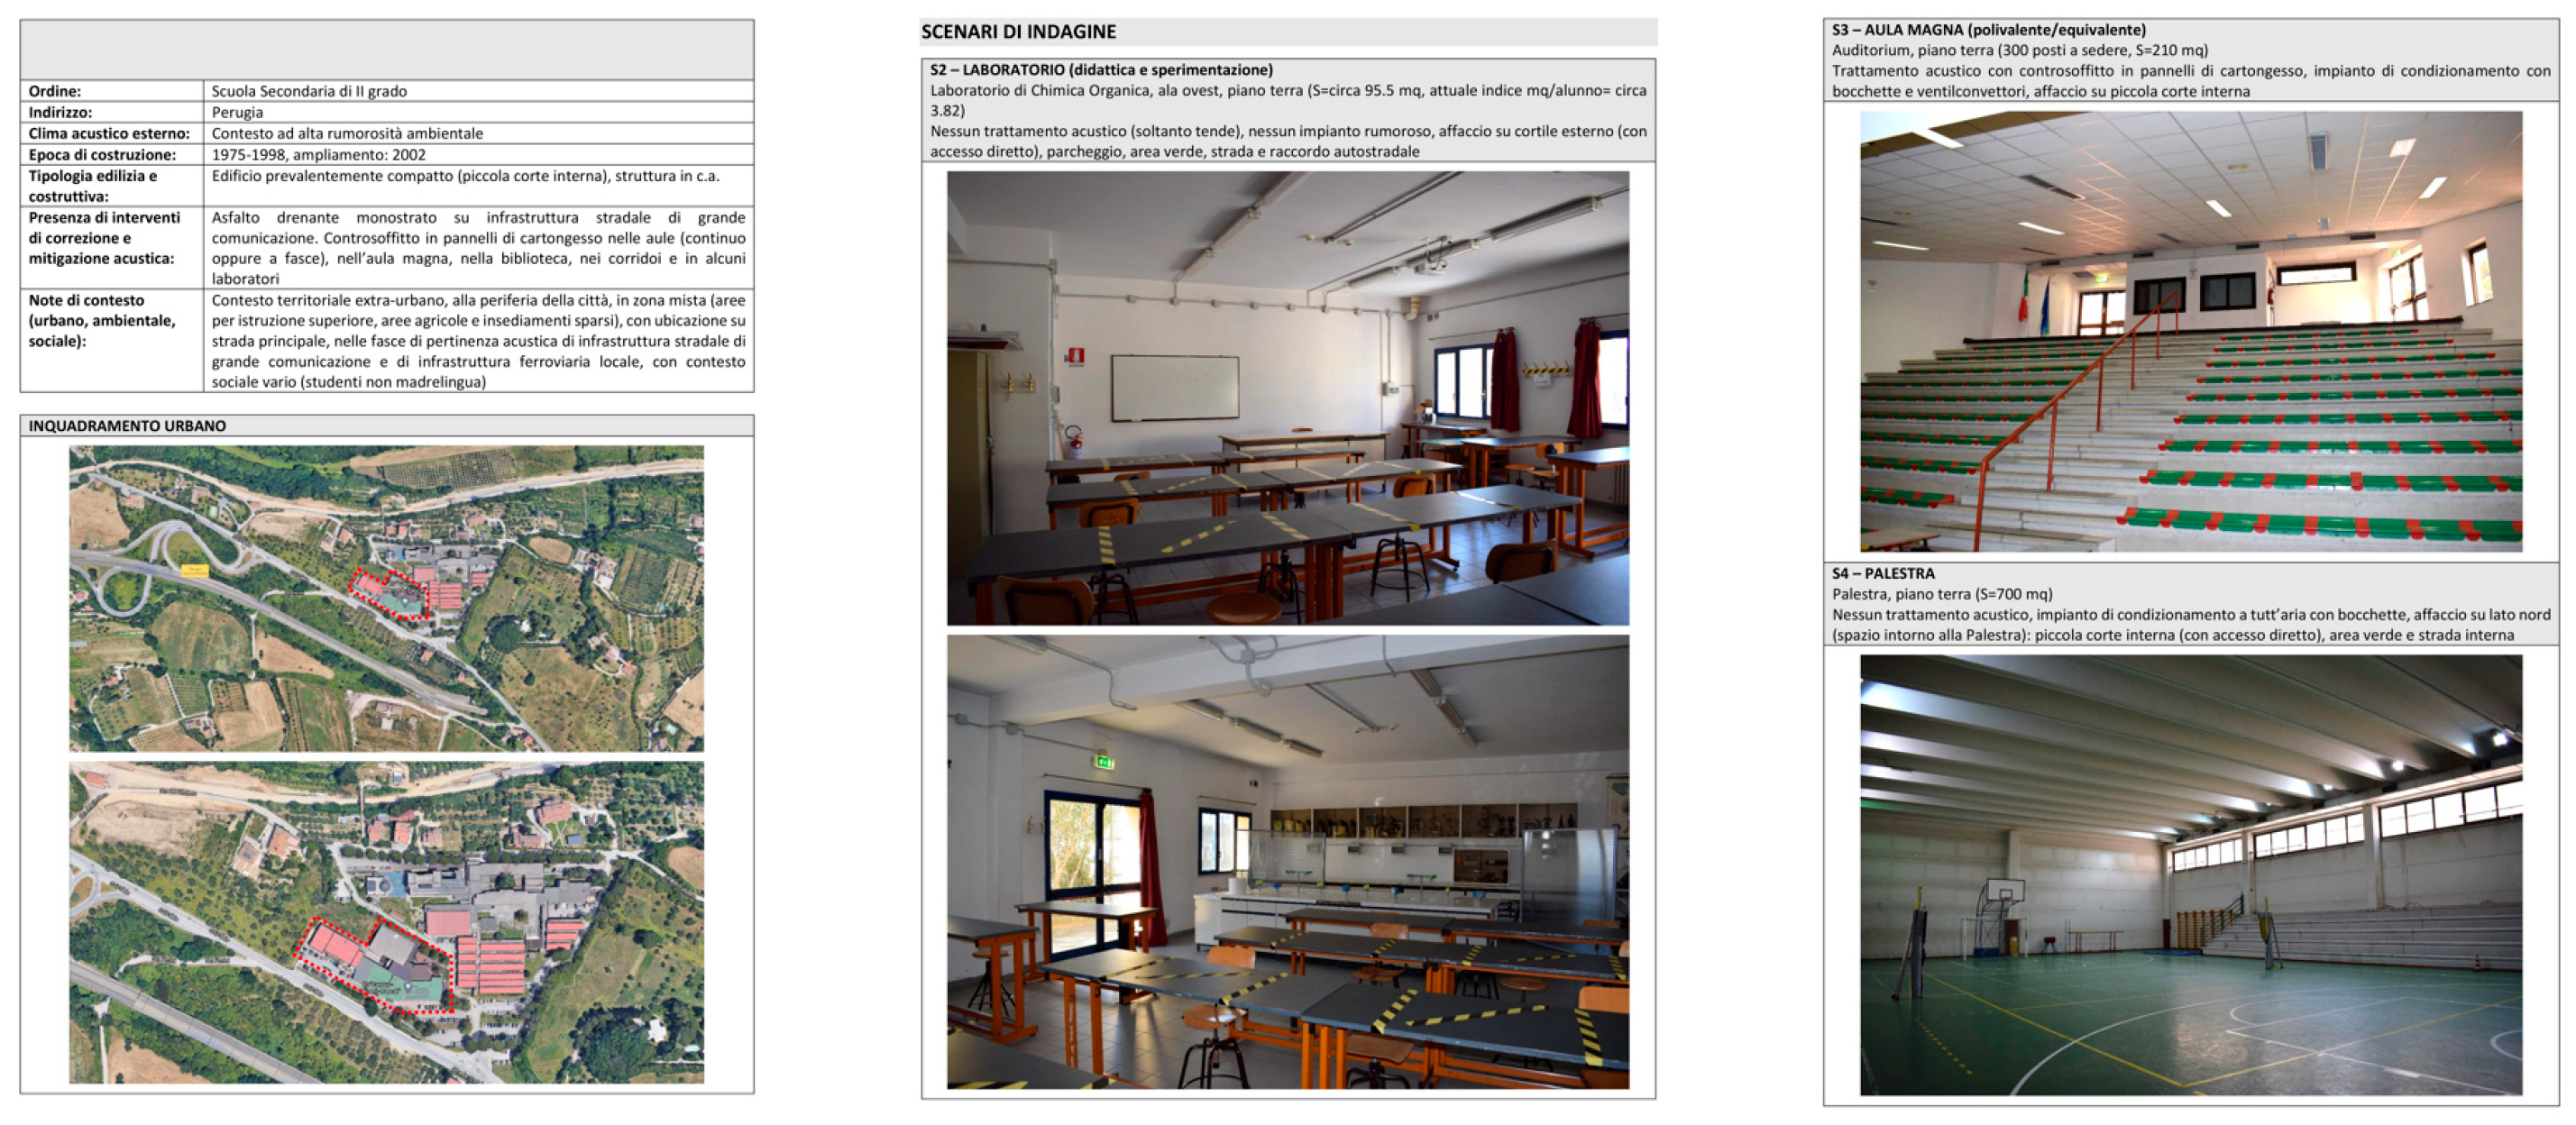
A group of 29 teachers, working in the nine schools, were informed about the project, and asked for voluntary participation. Additionally, teachers were requested to choose a working day for the test administration. Teachers could not be registered for more than two hours straight due to their schedules and the COVID-19 health emergency’s restrictions. Data were collected between March and May 2022, with an ambulatory phonation monitor (APM) 3200 (Kay-Pentax, Lincoln Park, NJ, USA). This device is designed to collect phonatory data on a client during normal daily activity; specific variables in the APM include the duration of phonation, the time of phonation, as well as the client’s vocal intensity (dB SPL), fundamental frequency (F0) and the number of vibratory cycles from skin vibrations. Starting from sound pressure level and fundamental frequency, it is possible to calculate the vocal doses, represented by time dose (Dt), vocal loading index (VLI), distance dose (Dd), energy dissipation dose (De), radiated energy dose (Dr). Through an accelerometer (throat sensor) mounted on a silicone pad on the client’s neck, at the jugular level, APM extracts data that is transferred to a specialised, portable hardware module (microprocessor) worn as a waistpack. Data are extracted 20 times per second throughout the day and stored in the hardware module’s memory. All procedures followed the manufacturer’s recommendations. Simultaneously with the APM recordings, the ambient noise levels (SPL) were measured with a sound level meter.

2.2. Case Studies

Nine schools (three kindergarten, three primary schools and three secondary schools) were selected as case studies to be checked according to the Investigation Protocol. One for each level was chosen in the cities of Florence, Perugia and Rome. Students of different age were involved (from 3 to 18 years old).
The case studies were chosen among 29 schools, including 8 kindergarten, 9 primary schools and 12 middle/high schools.
Each school was inspected by the authors, who identified the possible survey scenarios by filling a specific descriptive form. Along with the availability of school workers, different aspects were taken into account as selection criteria, such as the following:
-
Urban context: Environmental characteristics and any additional information about the site.
-
Outdoor acoustic climate: Low, medium and high environmental noise and the presence of any sources characterising the soundscape (e.g., infrastructure, industry, plant engineering, etc.).
-
Construction period: Before ‘900, 1900–1950 and referring to the publication of the Italian laws about acoustic issues, i.e., ante [27], ante [28], ante [29] and post 2017 [29].
-
Type of building and construction: Courtyard or compact buildings, load-bearing masonry, reinforced concrete frame, etc.
-
External and/or internal acoustic mitigation interventions: Presence of noise barriers, sound-absorbing asphalts, sound-insulating frames, indoor sound-absorbing treatments, etc.
-
Scenarios: Presence of the seven environments identified in the Protocol.
An example of the descriptive sheets drawn up during the inspections is provided in Figure 1.
In order to analyse the different situations and to have a representative sample of the Italian schools, the choice of the case studies for each city, depending on building characteristics, context and acoustic climate, enabled the typological variety of the schools.
Starting from the forms written for each case study, further inspections were carried out to check the presence of the different scenarios, the use of the spaces and the feasibility of the various types of investigations.
An overview of the characteristics of the schools is reported in Table 2.

3. Results

The Investigation Protocol for the Acoustic and Subjective Analysis was implemented in the selection of nine schools distributed in the Italian territory and defined as case studies. The environments were studied in order to identify the parameters to be measured, relevant to the considered scenario. These took into account the main factors with acoustic effects, including the presence of facilities, adjacent rooms, exposure to the road or other external sound sources.
In Table S1, all carried-out investigations are summarised and reported, based on acoustic parameters measured in unoccupied environments, noise levels in occupied environments, vocal effort and subjective investigation through the administration of questionnaires (Q1 = Questionnaire 1, Q2 = Questionnaire 2 and Q3 = Questionnaire 3). During the investigations in the analysed schools (from June 2021 to December 2021), partial restrictions aimed at limiting the spread of COVID-19 were still in force. The pandemic condition has affected the participation and availability of the school environments.

3.1. Acoustic Measurements in Unoccupied Environments

The parameters reported in Table S1 were measured and calculated. Each reported value was then compared with current and past reference limits reported in the Italian legislation [27,28,29], in order to assess the acoustic conditions of the different environments compared with the instructions at the time of construction. In the following paragraphs, the main outcomes of the investigation are reported.
The criteria, selected with the aim of assessing acoustic quality of the environments used for the various school activities, concern the following aspects: noise produced by sources located outside the building (e.g., infrastructures, production buildings and school gardens), noise generated by sources placed in the investigation scenario (e.g., equipment), noise coming from the building, but not within the investigated scenario (e.g., activity of adjacent rooms, equipment of adjacent rooms, etc.), and proper acoustic characteristics of the analysed scenario that depend on finishing materials and furnishings.
  • Noise produced by sources located outside the building
The schools selected as case studies are placed in areas assessed in classes from I to IV, according with the Municipal Noise Classification Plans of the three cities. Mainly, the school layouts favour the exposure of school environments on courtyards or noise-reduced streets. In order to assess the noise due to sound sources located outside the building (e.g., infrastructures, production buildings, school gardens, etc.), the Protocol defines different types of measurements, alternative to each other: outdoor ambient noise at 1 m from the facade of the scenario under investigation, LAeq; ambient noise level, Lamb; and normalised facade sound insulation with respect to reverberation time, D2m,nT. In Figure 2 and Figure 3, the parameters measured to assess the external noise transmitted within the different scenarios are reported, respectively, for classroom (S1) and laboratory (S2). Since the ambient noise parameter, Lamb, takes into account noise coming from the outside, together with that produced by the equipment inside the rooms, the system in operation during the measurement is reported in the figures.
  • Noise produced by sources placed inside the investigated scenario
The noise generated within inside the scenario may be due to student activities or equipment located within the room. The systems found more often in the investigated environments were multimedia interactive whiteboards, projectors, fans, and air conditioners.
The SPL measurements were carried when all the sources potentially operating at the same time in the room were switched on at nominal speed.
It is observed that the operation of the interactive whiteboard results in a highly variable noise level depending on the type of fan of the projector system. In particular, the noise level (LIC) of an interactive whiteboard can vary in a range of less than 30 dB(A), for the most silent systems, to above 35 dB(A), for the noisier ones, as reported in Figure 4. Each box indicates the noise level of the source or multiple sources, where colours correspond to different combinations of sound sources in the scenario under investigation, as shown in the legend: the scenario (e.g., “S1” for the classroom) and its location (e.g., “S/F” for the secondary school in Florence) are reported in square brackets. It should be noted that this type of equipment is used during many teaching activities that take place mainly in classrooms, laboratories and the auditorium.
  • Noise coming from the building, but not within the investigated scenario
Regarding noise transmission, passive acoustic requirements of the building elements for classrooms (S1), laboratories (S2) and auditorium (S3) were investigated and are reported in this paragraph. The standardised weighted airborne sound pressure level difference of the walls between scenarios S1, S2 and S3 and the adjacent rooms is on average above 40 dB, except for four scenarios where it is between 25 dB and 35 dB. These latter performances mainly refer to partitions installed later to split the room into two or more separate rooms. In Figure 5, the sound insulation of the wall between the scenario and the adjacent room is reported together with the reference limits, whereas Figure 6 shows the values of standardised weighted airborne sound pressure level difference of the wall between the scenario and the corridor.
The weighted normalised impact sound pressure level of the floor between scenarios S1, S2 and S3 and the above rooms are reported in Figure 7. The values vary greatly, ranging from 48 to 82 dB.
  • Proper acoustic characteristics of the analysed scenario that depend on finishing materials and furnishings.
In Table 3, reverberation time (RT), the pertinent parameter for the speech intelligibility depending on the volume of the room (C50 in the case where the volume is lower than 250 m3, STI in the case where volume is higher than 250 m3), and the sound-absorbing interventions noted regarding the room are reported.
Concerning the auditorium, the sample is limited to four rooms as it is not present in some schools or not accessible because of COVID-19 restrictions.
It can be noted that some of the scenarios cannot be compared: gymnasiums in kindergartens have a smaller volume than the primary and secondary school gymnasiums, and are equipped with finishes to reduce the consequences of children’s impacts (carpets, cushions, etc.). Moreover, the selected common areas have different volumes, layout characteristics and uses (transit, recreative, etc.).

3.2. Acoustic Measurements in Occupied Environments

The acoustic measurements in occupied environments were carried out during regular teaching activities, according to the restrictions related to the containment of the COVID-19 pandemic. The latter involve limited capacity in the canteen, with an increase in the number of turns for serving meals, and changes in the use of some study environments that resulted in the impossibility of carrying out acoustic measurements in all occupied scenarios. The results of acoustic measurements in occupied environments are reported in Table 4.
The highest SPL, consistently above 70 dB(A), was found in scenarios where activities involve more interaction and involvement of occupants, such as in gymnasiums (between 74 dB(A) and 85 dB(A)), canteens (between 78 dB(A) and 83 dB(A)) and laboratories (between 70 dB(A) and 86 dB(A)). In particular, the SPL detected in the gymnasium is above 80 dB(A) for activities involving the use of the ball, reaching peaks that exceed 90 dB(A), whereas for activities that do not involve the use of the ball, regardless of the reverberation time of the room, the sound levels are below 80 dB(A).
In the canteens, SPL are always above 75 dB(A), even in rooms with acoustic treatments and reverberation times of less than 1 s.
In classrooms, a difference within a range of 4–7 dB(A) is noted between SPL measured during the interactive activities (group activities, interactive classes with audio/video support, etc.) compared to the taught class: interactive classes cause higher noise levels.

3.3. Subjective Investigation

The three questionnaires, presented in Section 2.1.3, were administered to students and teachers attending the nine schools under investigation. A total of 293 people were involved in the subjective analysis of the school scenarios, in order to analyse the potential extra-auditory effects of noise exposure and the vocal effort of teaching activity. For the representativeness of the sample, Questionnaire 1 and Questionnaire 2 were administered to primary school students aged between 9 and 11 years and secondary school students aged between 13 and 16 years, considering the use of the scenarios under investigation. A sample of teachers was selected according to the teaching subject for the filling-in of Questionnaire 3. At least three teachers working in S1 (one teaching Italian and one teaching Physical Education) and another Physical Education teacher at the school were involved. In Table 5, the number of completed questionnaires is reported. The main results are presented in this paragraph.
  • Questionnaire 1
The sample consists of a total of 90 students, made up of 59% male and 41% female subjects. Students showed moderate sensitivity to noise: 58% of the sample declares they become used to most noises without any difficulty and 68% consider themselves “little” or “moderately” disturbed by noise.
  • Perception of noise in the classroom (S1)
Less than 30% of the respondents perceive noise in the classroom with closed doors and windows as “loud” and “annoying”. This percentage remains unchanged even though the SPLs measured during class activities differ between primary schools, being 76–77 dB(A), and secondary schools, being 67–74 dB(A).
For 41% of the sample, the main noise source is caused by the activities taking place in the schoolyard, and for 39%, it is the transit of vehicles, even assessed as most disturbing (for 49% of the sample). Other sources (trains and aircraft) were not detected by respondents.
Considering only the Perugia secondary school, located in the most exposed context to the transport infrastructures noise, this is perceived by 60% of the students and the one produced by courtyard activities is perceived by 30% of the users. In this case, the percentage of students who say they are disturbed by road noise is equal to 70%.
With reference to sounds coming from indoor environments close to the classroom under investigation, about 35–40% of the subjects declare that they often hear noise coming from the corridor and neighbouring classrooms. The main source of disturbance is the dragging of furniture in neighbouring classrooms, perceived as disturbing by 44% of the students.
The main sources produced within the same classroom are identified as students chatting (assessed as “very frequent” by 84% of the students and “very annoying” by 59%), falling objects (assessed as “very frequent” by 73% of the students and “very annoying” by 44%), the dragging of chairs and desks in the classroom (assessed as “very frequent” by 46% of students and “very annoying” by 51%).
  • Listening to the teacher in the classroom (S1)
A total of 81% of students consider the Italian teacher’s voice as “clear” and 93% consider that they listen without difficulty to the teacher’s explanations at the blackboard while looking at the class. This percentage drops to 69% when the teacher explains with his or her face turned to the blackboard.
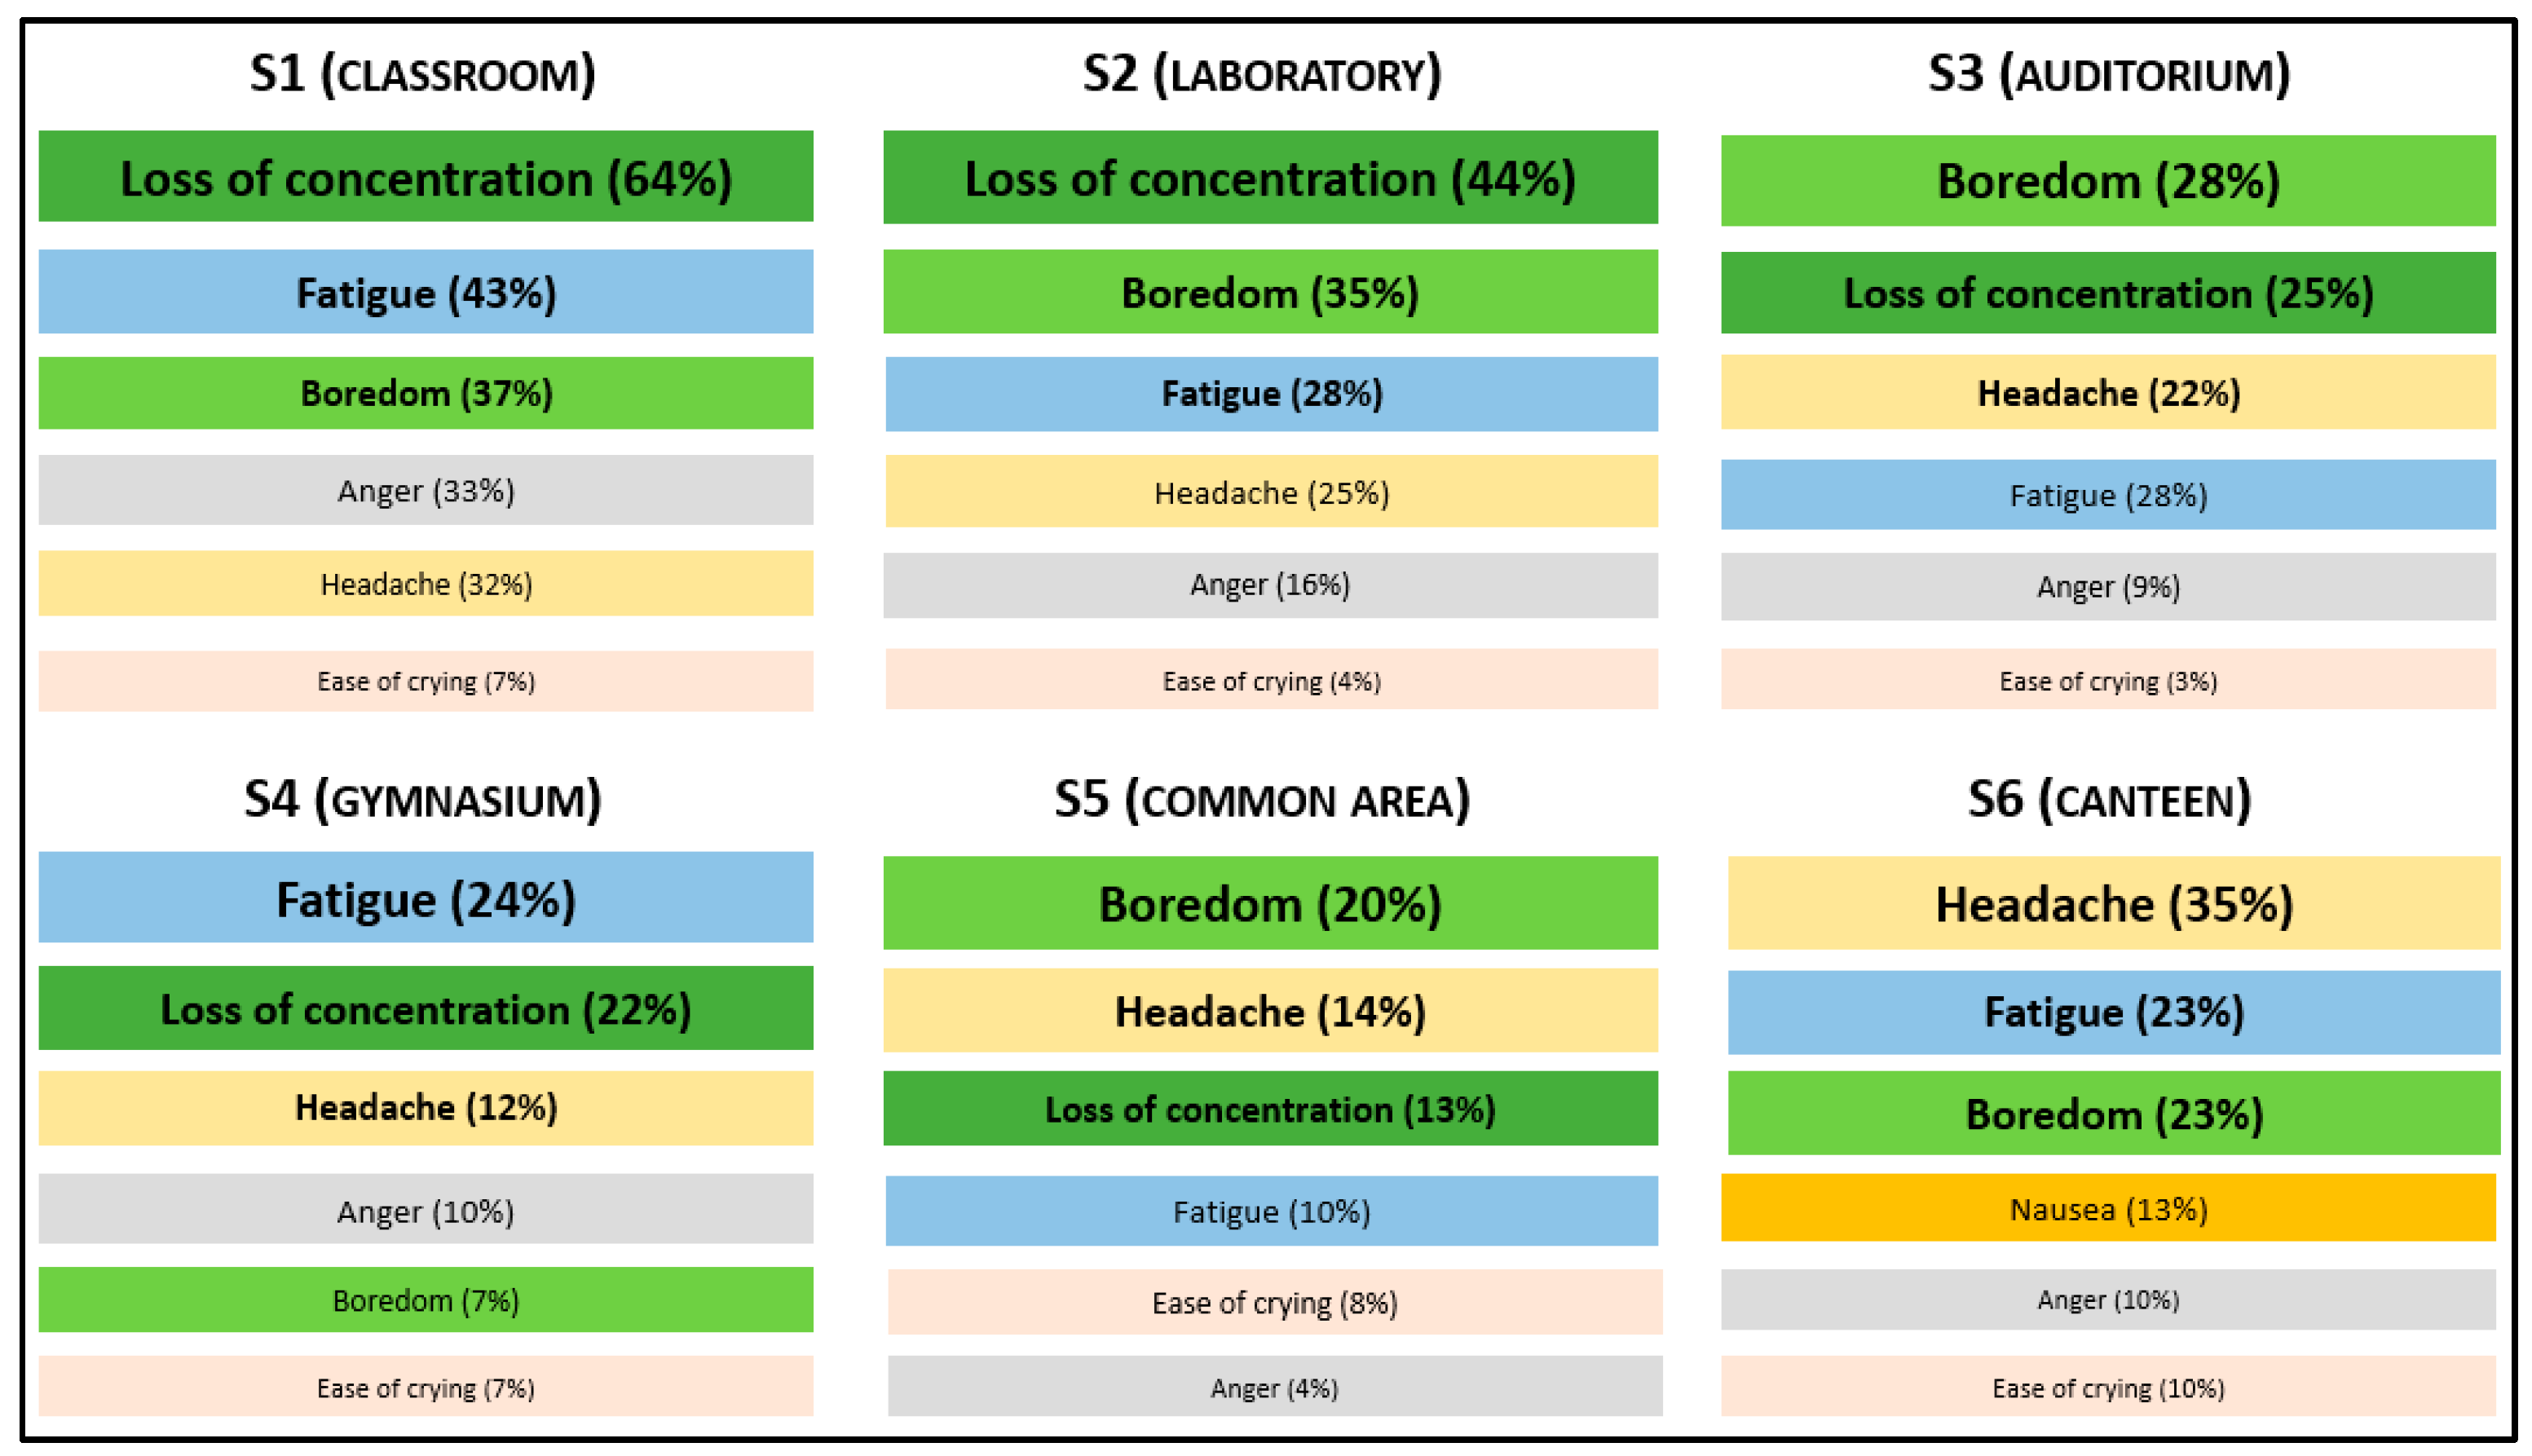
  • Extra-auditory effect due to noise exposure in the classroom (S1)
The extra-auditory effect that occurs most frequently from noise exposure in the classroom is the loss of concentration (64%). This percentage increases slightly as age decreases. The second aspect that emerges most frequently is fatigue (43%), followed by boredom (37%). All the investigated effects are reported in Figure 8.
For the majority of the sample, the presence of noise in the classroom frequently leads to greater commitment to a task (59%), greater loss of concentration (53%) and greater fatigue (52%). Moreover, a percentage of the sample varying from 51% to 62% stated that they were frequently disturbed when carrying out the following activities: reading (62%), working with numbers (61%), hearing what another classmate says (56%), listening to the teacher’s explanation (53%) and writing (51%).
  • Questionnaire 2
This questionnaire is divided into sections, and it consists of many questions related to the evidence of noise correlated effects in the seven scenarios. The answers related to the main used environments are reported. In Figure 9, the extra-auditory effects reported in consequence of noise exposure for the indoor scenarios are presented.
The sample consists of 91 students (52% females and 48% males) and it shows a moderate sensitivity to noise (66% of the sample is “sometimes” disturbed by noise).
  • Perception of noise and listening to the teacher’s voice in the laboratory (S2)
The activities that are carried out in the laboratory are predominantly group activities (58%) and the noise is perceived as “low” (48%) and “not annoying” (58%).
The results referring to the typology of noise sources in the laboratory are the same as the ones observed in the classroom. A total of 92% of the sample listen without difficulty to the teacher explaining at the blackboard while looking at the class, whereas this percentage is reduced to 72% when the teacher gives explanations facing the blackboard. These values are in line with the results found in the classroom.
  • Extra-auditory effects due to noise exposure in the laboratory (S2)
The loss of concentration is indicated as a consequence of noise in the laboratory by 44% of the students. The second aspect that emerges most frequently is boredom (35%), followed by fatigue (28%). The other aspects considered less frequent are headaches (25%), anger (16%) and increased ease of crying (4%).
Concerning the annoyance produced by noise, a percentage of the sample varying from 46% to 58% declares to be frequently disturbed when carrying out the following activities: working with numbers (58%), listening to another classmate (58%), reading (54%), listening the teacher’s explanation (50%) and writing (46%).
  • Perception of noise and listening to the teacher’s voice in the gymnasium (S4)
The main noise sources perceived are the shouting of teammates inside the gymnasium (31%), the noise produced by sporting activity (23%), the noise from the courtyard (15%) and the dragging of equipment inside the gymnasium (15%). External noise sources, as well as technical installations serving the gymnasium, were considered as negligible sources of noise. A total of 90% of the sample considered the gymnasium to be “loud” and “very loud”.
  • Extra-auditory effects due to noise exposure in the gymnasium (S4)
The extra-auditory impairments occurring most frequently and resulting from noise exposure in the gymnasium are fatigue (24%), followed by loss of concentration (22%) and headaches (12%). The other aspects considered less frequent are anger (10%), boredom (7%) and ease of crying (7%).
  • Perception of noise and listening to the teacher in the canteen (S6)
A total of 38% of users perceive the sounds and noises in the refectory with closed doors and windows as “loud” and “annoying”.
A total of 44% of the sample defines the voices of other students inside the canteen as the main noise source, followed by noise from activities taking place in the school courtyard (30%) and noise from the dragging of furniture in the canteen (12%).
A total of 87% of the sample stated that noise in the canteen allows them to hear what the other students say; however, this requires an increase in voice volume for 72% of the students.
  • Extra-auditory effects due to noise exposure in the canteen (S6)
Extra-auditory effects resulting from noise exposure that occur most frequently in the refectory are headaches (35%), fatigue and boredom (23%). Other aspects considered less frequent are nausea (13%), anger and increased ease of crying (10%).
  • Questionnaire 3
The sample of teachers shows a clear predominance of women (82%), with 82% of participants being older than 40 years. Almost everyone in the sample (92%) is in full-time employment.
As an aspect of interest, the smokers’ percentages are noticed: 66% of the respondents have never been smokers, 20% have quit and the remaining 14% are currently smokers. The subjects showed a marked sensitivity to noise, unlike the students. In particular, the need for a quieter classroom is a priority for teachers, but it is not required for students.
  • Perceived vocal effort and noise exposure in the working place
A total of 81% of teachers believe their professional activity entails an increased risk of damage to the phonatory apparatus, with 67% of teachers having suffered from disorders of the vocal apparatus, such as hoarseness, aphonia and dysphonia. This percentage is different according to the school grade investigated: in kindergarten, 82% of the sample claims to have suffered from disorders of the vocal apparatus; at primary school, it is 71%; and at secondary school, it is 45%. A 63% portion of the sample notes that professional activity entails an increased risk of damage to the auditory apparatus, although 87% declares not to suffer from hearing disorders. A total of 65% of the sample notes that high vocal effort is required without wearing a face mask: this percentage becomes 99% if one considers the use of the face mask during normal teaching activities.
Considering pre-pandemic conditions without the use of face masks, the interviewed teachers stated that the high vocal effort they are subjected to resulted in physical fatigue (27%), mental fatigue (14%) and both physical and mental fatigue (59%). With the face mask, 74% of the subjects showed both physical and mental fatigue.
With reference to the assessment of perceptual/cognitive aspects, 60% of the sample had the perception of these worsening due to noise in the working environment.
A 65% portion of the sample stated that they had never experienced a perception of reduced motivation and confidence in themselves and their work due to the level of noise within the working environment. On the other hand, 79% of the sample declare having had a perception of greater stress in the conditions indicated above.

3.4. Comparison of Subjective Investigation and Acoustics Measurements

It can be noticed that the subjective investigation regarding the listening to the teacher in primary school classrooms is not comparable with the acoustic characteristics of the school environment: the percentage of students who consider the Italian teacher’s voice as “clear” is unvaried (81%) among the analysed scenarios S1, although C50 in classrooms varies from −2.9 to 2.2. It can be observed that students have chosen between five options, which were unusual terms for them, and for which they needed explanation: “very booming (as in the gymnasium)”, “booming”, “quite dry/quite clear”, “dry/clear (as in your bedroom)” and “very dry/very clear (as in the courtyard)”. This aspect may have influenced the answers. Conversely, in secondary schools, where RT is 1.91 s in both the classrooms, this percentage is reasonably reduced to 62%.
The presence of noise in the classroom does not determine differences in the perception of the commitment to perform a task between students of primary and secondary schools. The loss of concentration related to noise in the classroom is more evident in primary schools, while greater fatigue is complained of in secondary schools. The results observed for the laboratory are in line with the analysis of activities affected by noise in classrooms. However, it can be noticed that the school activities performed in the laboratory are usually in group and/or interactive.
Reverberation time measured in the six gymnasiums of the primary and secondary schools varies from a minimum of 2.54 s to a maximum of over 5.5 s. This result seems to be contradictory to the judgement that students express about listening to the teacher in the gymnasium. Only 11% of the sample state that they hear the teacher “badly” or “very badly”. Several aspects contribute to this finding, including the short duration of phonation, the high vocal effort to which PE teachers are subjected, the reduced distance between the teacher and students during the explanation of activities, and the use of systems for drawing attention (e.g., whistles).
The sample of the subjective investigation related to the canteens is limited. However, it can be noted that the assessment on the intensity and annoyance of perceived noise is unchanged although the acoustic characteristics of the two analysed rooms are very different. In the primary school case, sound-absorbing material is placed on the walls and the ceiling, and the reverberation time is lower than 0.8 s, whereas in the secondary school case, there are no acoustic treatments and RT is higher than 2 s.
Having a conversation in the canteen requires raising the voice for 66% of the primary school sample (acoustic treatment, RT < 0.8 s, SPL in occupied conditions = 78.5 dB(A)), whereas this percentage reaches 100% in the secondary school (without acoustic treatment, RT > 2 s, SPL in occupied conditions = 83.5 dB(A)).

3.5. Correlation of Acoustic Parameters and Vocal Effort of Teachers

A total of 29 teachers (25 females and 4 males) were recruited: 12 in Florence, 12 in Perugia and 5 in Rome. Table 6 shows the main vocal parameters measured in teachers.
From the data analysis, it was assessed that, according to the [30] standard, 17% of teachers use a relaxed voice, 10% use a normal voice level, 24% show slight vocal effort, 17% use a high voice level (with a greater vocal effort) and 31% of teachers declare a high vocal effort.
Table 7 reports gender differences for the following parameters: fundamental frequency, vocal effort (SPL) and ambient noise (SPL). The only statistically significant difference (p = 0.0001) is found for the fundamental frequency values, with clearly lower fundamental frequency values for the male gender. In women, the mean values are 243.40 ± 27.12; in men they are 158.75 ± 32.27. To confirm this, Figure S1 shows the distribution of the fundamental frequency, and the distribution of the sound pressure levels (SPL) emitted by the speaker.
The study does not reveal any statistically significant correlation between the following parameters: F0 and Vocal effort (LAeq 1 m [dB(A)]) (Figure S2); F0 and noise (LAeq [dB(A)]) (Figure S2); F0 and distance dose m/s (DDose) (Figure S3); noise (LAeq [dB(A)]) and DDose m/s (Figure S3). The only statistically significant correlation (p = 0.000675) is found between the values of vocal effort (LAeq 1 m [dB(A)] and DDose m/s) (Figure S3).

4. Discussion

The case studies showed that the prominent noise source which characterises the investigated scenarios is related to student activities, which determines an increase in terms of SPLs. Regarding the noise produced by sources located outside the building, it was noticed that the acoustic performance of the facades is poor, ranging between 22 and 35 dB, regardless of the school’s construction period. However, this performance did not affect the noise levels inside the rooms (Lamb), as the SPL of the areas under investigation is not remarkable.
The noise generated inside the scenario may be due to student activities or to equipment within the room. In rooms where a ceiling fan system is present, noise levels of continuously operating systems vary according to the number and size of the blades, but always exceed 40 dB(A) and the minimum reference limits for the different uses of the rooms. The air conditioner determines a variation of the LIC parameter between a minimum of 43 dB(A) and a maximum of 60 dB(A). Considering all the equipment sound sources inside the room, the presence of a continuously operating system always leads to a higher noise level compared to the reference limits for a specific use.
In general, more than half of the investigated sample shows insufficient sound insulation performance of walls between adjacent rooms to guarantee minimum conditions of acoustic comfort. The sound insulation of walls between S1, S2 and S3 and corridors ranges from 26 to 31 dB, approximately in line with the “basic” performance defined by [31], but still below the minimum performance required by [29].
The weighted normalised impact sound pressure level has been measured in eleven rooms of three different scenarios (S1, S2, S3). Out of the eleven, only one case complied with the “very good” performance, six complied with the “basic” performance, whereas the remaining four scenarios were characterised by a “mediocre” performance between 63 and 82 dB.
Regarding sound insulation of building partition elements, the results showed that their acoustic quality is not high, regardless of the era of construction. The answers to Questionnaire 1 confirm this data, as students often hear noise coming from the corridor and neighbouring classrooms.
Comparison between acoustic measurements and subjective investigations are not reported for scenarios S2, S5 and S6, where the number of completed questionnaires was small.
Concerning the investigated classrooms (S1), among the nine scenarios analysed, only three classrooms are characterised by a RT and a C50 within the optimal limits for their intended use. C50 is higher than 2 dB [29] only in acoustically treated rooms, where the reverberation time is less than 1 s. Without treatments, acoustic comfort is worse in secondary and primary school classrooms than in kindergarten classrooms. This is thanks to a smaller size, a significant presence of furniture, and play equipment. The optimal distribution layout influences the C50, even with a higher RT: in the classroom of the secondary school in Rome (RT = 1.07 s) it is higher than that measured in the classroom of the primary school in Florence (RT = 0.81 s), owing to the layout, which is particularly favourable for minimising the source–receiver distance.
The main sound sources detected by students inside the classrooms are related to noise generated by student activity within the room, such as students chatting and objects falling, and to noise coming from adjacent rooms and the corridor. These results are in line with the detected insufficient acoustic performances. The students state that noise exposure in classrooms mainly determines loss of concentration, fatigue and headaches.
Out of the eight scenarios investigated, only three laboratories (S2) are equipped with acoustic treatments, resulting in an optimal RT and C50. The variability of the measured parameters depends not only on the presence of the acoustic treatments, but also on the use of laboratories (art, music, computer science, science), which significantly influences its equipment and furnishings. On average, the acoustic comfort in the laboratories of the secondary schools, with an RT between 0.7 and 1.4 s, is worse than in primary schools, where the RT is 1.3–2.7 s.
The sample considered for the auditorium (S3) is small. It can be noted that the presence of acoustic treatments determines a variable RT between 0.9 s and 1.2 s and an STI equal to or greater than 0.6, in contrast to the untreated scenario, where the RT is greater than 2 s and the STI is less than 0.5. The main sound sources detected by students inside the auditorium are related to noise generated by student activity within the room. Moreover, the rooms are defined as reverberant. The students state that noise exposure in classrooms mainly determines boredom, loss of concentration and headaches. Therefore, optimal reverberation time is required to reduce high noise levels.
Regarding the gymnasium scenario (S4), the case studies with sound-absorbing treatments are only those in more recently constructed school buildings. In general, the sound-absorbing treatments on the ceiling in kindergarten gyms allows optimal reverberation time values to be achieved. For primary and secondary school gyms, ceiling treatments are not sufficient. The main sound sources detected by students inside the gyms are shouting students and noise generated by physical activities. The students reported fatigue, loss of concentration and headache as a consequence of noise exposure. It can be stated that high reverberation times, which characterise gyms, negatively influence noise levels inside the rooms.
Among the nine common areas (S5) investigated, only three do not have acoustic treatments: in these cases, the reverberation time is close to or greater than 2 s. In the remaining six, sound-absorbing panel are located on the ceilings and the RT ranges between 0.5 and 1.1 s, in line with the optimum values for this specific use.
As well as for the auditorium, the sample of canteens (S6) is limited to only five school environments, as this scenario is not present for all school grades. It can be stated that the lowest reverberation time values were found in the canteens that, together with sound-absorbing interventions on the ceiling, are divided into two or more small rooms, even though they are connected with each other.
The results of acoustic measurements in occupied environments show a variability and difficulty in correlating parameters such as reverberation time, clarity and number of occupants, as they are strongly influenced by the type of activity and related materials used, which are extremely varied. Considering the canteens, it can be stated that, regarding the same activity carried out, the SPL is dependent on the number of occupants and the RT. In classrooms, the SPL difference between the taught class and interactive class is approximately 4–6 dB(A), regardless of the type of school (kindergarten, primary and secondary school), the acoustic conditions of the classroom and the number of students.
The presented study analysed the vocal effort of 29 teachers during a real 2 h teaching lesson. The most important fact is that for 31% of teachers, the vocal effort is high. It is known that the prevention of occupational risks for all those who use their voice for their profession is a need increasingly expressed by workers: this need is also contemplated by the Italian legislation on the protection of health and safety in the workplace [32], in particular regarding the health consequences related to stress and work itself. Voice-related impairments in teachers are widely recognised as a result of their work [33].
The analysis of the voice allows us to correlate the dosimetric parameters to the risk of onset of functional pathologies of the phonatory apparatus for those who use their voice for professional purposes.
This research found a statistically significant correlation (p = 0.000675) between vocal effort and distance dose values. This last parameter is particularly interesting because it allows a safety limit to be calculated, beyond which, any exposure to vibrations is considered a risk factor. This parameter is currently used in industries to evaluate the vibrations transmitted to the operators’ hands. The safe limit for hand tissue is approximately 520 yards of accumulated distance. Similarly, in the future, it will be possible to establish safety limits for vocal cords exposed to vibrations in order to reduce the risk of voice disturbances.
Such objective information is critical for developing a more clinically useful understanding of what constitutes “safe boundaries” for voice use and, conversely, identifying the vocal functioning that places the voice user at an increased risk of developing a vocal pathology related to the use of the voice.

5. Conclusions

As highlighted in the previous Sections, the investigated sample is often insufficient to draw general considerations on the school scenarios. For this reason, it seems to be necessary to increase the number of case studies in order to obtain a wider perspective of the acoustic features of Italian schools.
From the analysed results, it seems appropriate to suggest acoustic interventions of the investigated scenarios in order to reach the required limit values indicated by the regulations in force.
However, the results show that this typology of intervention is not sufficient as the main noise source, which generates discomfort and high noise levels within the rooms, is determined by student activities.
For this reason, the Guidelines that will be published by INAIL aim at defining not only architectural and acoustic interventions for the improvement of school environments, but also behaviours for optimal living environments from an acoustic point of view. This specific section will be addressed to the users (students and teachers) and will consist of awareness on the themes of acoustics and exposure to noise and providing good behavioural rules.
In particular, the analysis of the questionnaires underlines the need to define direct and indirect interventions aimed at noise containment and the reduction of vocal effort for users of school environments.

Supplementary Materials

The following are available online at https://www.mdpi.com/article/10.3390/acoustics5010013/s1, Table S1: The Acoustic and Subjective Analysis of the Investigation Protocol implemented in the nine case study schools; Figure S1: A histogram showing how the fundamental frequency is distributed (on the left). A histogram showing the distribution of the levels of the acoustic signal (SPL) emitted by the speaker at 1 m (vocal effort) (on the right); Figure S2: Scatter plots representing the linear regression between two variables. The relationship between F0 and vocal effort (on the left): linear regression x = F0 [Hz], y = SPL voice [dB(A)]; r = 0.03, p = 0.89. The relationship between F0 and noise (on the right): linear regression x = F0 [Hz], y = SPL noise [dB(A)]; r = 0.05, p = 0.84; Figure S3: Scatter plots representing the linear regression between two variables. The relationship between F0 and DDose (top left): linear regression x = F0 [Hz], y = DDose [m/s]; r = 0.05, p = 0.81. The relationship between noise and DDose (top right): linear regression x = SPL noise [dB(A)], y = DDose [m/s]; r = -0.01, p = 0.97. The relationship between Vocal effort and DDose (bottom left): linear regression x = SPL voice [dB(A)]; y = DDose [m/s]; r = 0.62, p = 0.001.

Author Contributions

Conceptualization, F.A., S.L., G.R., G.A., A.A.V.T.; methodology, A.A.V.T., F.S., L.C., L.B.; validation, F.C. (Franco Cotana), F.A., S.L., G.R., G.A., A.A.V.T.; investigation, D.A., A.N., M.G., L.B., C.G., F.C. (Federica Cirimbilli); data curation, L.B., P.P., V.G.; visualisation, P.D., P.P., V.G.; writing—original draft preparation, M.G., P.D., P.P., V.G.; writing—review and editing, P.P., V.G.; supervision, F.C. (Franco Cotana), P.N., F.A., S.L., G.R., G.A., A.A.V.T.; project administration, F.C. (Franco Cotana), P.N.; funding acquisition, P.N. All authors have read and agreed to the published version of the manuscript.

Funding

This research was funded by INAIL—the Italian National Institute for Insurance against Accidents at Work—within the BRIC INAIL 2019-ID14 Project.

Data Availability Statement

Data reported results will be available after the publishing of the INAIL Official Guidelines.

Acknowledgments

The authors thank INAIL, the Italian National Institute for Insurance against Accidents at Work, for financially supporting the BRIC INAIL 2019-ID14 Project and all the partners for their collaboration.

Conflicts of Interest

The authors declare no conflict of interest.

References

  1. WHO Regional Office for Europe. Environmental Noise Guidelines for European Region; WHO Regional Office for Europe: Copenhagen, Denmark, 2018; ISBN 978-92-890-5356-3. [Google Scholar]
  2. Luzzi, S.; Giuliano, V. Manuale di Acustica Forense: Giurisprudenza, Scenari e Metodiche per l’accertamento delle Immissioni di Rumore e la Valutazione del Danno; ETS: Pisa, Italy, 2018; ISBN 978-88-467-5447-9. [Google Scholar]
  3. Mucci, N.; Traversini, V.; Lulli, L.G.; Vimercati, L.; Rapisarda, V.; Galea, R.P.; De Sio, S.; Arcangeli, G. Neurobehavioral Alterations in Occupational Noise Exposure: A Systematic Review. Sustainability 2021, 13, 12224. [Google Scholar] [CrossRef]
  4. Tortorella, A.; Cirimbilli, F. Effetti diretti e indiretti dell’inquinamento acustico sulla salute mentale. In Proceedings of the Atti del 38° Congresso Nazionale di Igiene Industriale e Ambientale, Cagliari, Italy, 22–24 June 2022. [Google Scholar]
  5. Arcangeli, G.; Traversini, V.; Lulli, L.G.; Baldassarre, A.; Mucci, N. Alterazioni neurocomportamentali correlate con l’esposizione a rumore: Stato dell’arte nell’uomo e nell’animale. In Proceedings of the Atti del 38° Congresso Nazionale di Igiene Industriale e Ambientale, Cagliari, Italy, 22–24 June 2022. [Google Scholar]
  6. Stansfeld, S.; Clark, C. Health Effects of Noise Exposure in Children. Curr. Environ. Health Rep. 2015, 2, 171–178. [Google Scholar] [CrossRef] [PubMed] [Green Version]
  7. Basner, M.; Babisch, W.; Davis, A.; Brink, M.; Clark, C.; Janssen, S.; Stansfeld, S. Auditory and non-auditory effects of noise on health. Lancet 2014, 383, 1325–1332. [Google Scholar] [CrossRef] [PubMed] [Green Version]
  8. Jonsdottir, V.; Rantala, L.; Oskarsson, G.; Sala, E. Effects of pedagogical ideology on the perceived loudness and noise levels in preschools. Noise Health 2015, 17, 282. [Google Scholar] [CrossRef] [PubMed]
  9. Mealings, K. A Scoping Review of the Effects of Classroom Acoustic Conditions on Primary School Children’s Physical Health. Acoust. Aust. 2022, 50, 373–381. [Google Scholar] [CrossRef]
  10. Mealings, K. Classroom acoustics and cognition: A review of the effects of noise and reverberation on primary school children’s attention and memory. Build. Acoust. 2022, 29, 401–431. [Google Scholar] [CrossRef]
  11. Shield, B.; Dockrell, J.E. External and internal noise surveys of London primary schools. J. Acoust. Soc. Am. 2004, 115, 730–738. [Google Scholar] [CrossRef] [PubMed] [Green Version]
  12. Fernandes, R.A.; Vidor, D.C.G.M.; Oliveira, A.A. de The effect of noise on attention and performance in reading and writing tasks. CoDAS 2019, 31, e20170241. [Google Scholar] [CrossRef] [PubMed] [Green Version]
  13. Gokdogan, O.; Gokdogan, C. Determination of the level of noise in nurseries and pre-schools and the teachers′ level of annoyance. Noise Health 2016, 18, 256. [Google Scholar] [CrossRef] [PubMed]
  14. Minelli, G.; Puglisi, G.E.; Astolfi, A. Acoustical parameters for learning in classroom: A review. Build. Environ. 2022, 208, 108582. [Google Scholar] [CrossRef]
  15. Lamotte, A.-S.; Essadek, A.; Shadili, G.; Perez, J.-M.; Raft, J. The Impact of Classroom Chatter Noise on Comprehension: A Systematic Review. Percept. Mot. Skills 2021, 128, 1275–1291. [Google Scholar] [CrossRef] [PubMed]
  16. “Bando Bric 2019”. Available online: https://www.inail.it/cs/internet/attivita/ricerca-e-tecnologia/finanziamenti-per-la-ricerca/bando-bric-2019.html (accessed on 20 December 2022).
  17. Asdrubali, F.; Guattari, C.; Busa, L.; Luzzi, S.; Pulella, P.; Cotana, F.; Goretti, M.; Domenighini, P.; Annesi, D.; Nataletti, P.; et al. A Study on Noise Exposure in School Environments. In Proceedings of the EAA–Euronoise, Online, 25–27 October 2021. [Google Scholar]
  18. Luzzi, S.; Busa, L.; Pulella, P.; Arcangeli, G.; Traversini, V. Extra-auditory effects from exposure to noise in classrooms. In Proceedings of the EAA–Euronoise, Online, 25–27 October 2021. [Google Scholar]
  19. Decreto Ministeriale 16 Marzo 1998—Tecniche di Rilevamento e di Misurazione Dell’Inquinamento Acustico; Gazzetta Ufficiale: Rome, Italy, 1998.
  20. UNI EN ISO 16283-3:2016; Acoustics-Field Measurement of Sound Insulation in Buildings and of Building Elements-Part 3: Façade Sound Insulation. ISO: Geneva, Switzerland, 2016.
  21. UNI 11532-2:2020; Caratteristiche Acustiche Interne di Ambienti Confinati-Metodi di Progettazione e Tecniche di Valutazione-Parte 2: Settore Scolastico. Ente Italiano di Normazione: Milano, Italy, 2020.
  22. UNI EN ISO 16283-2:2020; Acoustics—Field Measurement of Sound Insulation in Buildings and of Building Elements—Part 2: Impact Sound Insulation. ISO: Geneva, Switzerland, 2020.
  23. UNI EN ISO 16032:2005; Acoustics-Measurement of Sound Pressure Level from Service Equipment in Buildings-Engineering Method. ISO: Geneva, Switzerland, 2005.
  24. UNI EN ISO 3382-1:2009; Acoustics-Measurement of Room Acoustic Parameters-Part 1: Performance Spaces. ISO: Geneva, Switzerland, 2009.
  25. UNI EN ISO 3382-2:2008; Acoustics—Measurement of Room Acoustic Parameters—Part 2: Reverberation Time in Ordinary Rooms. ISO: Geneva, Switzerland, 2008.
  26. IEC 60268-16; Sound System Equipment–Part 16: Objective Rating of Speech Intelligibility by Speech Transmission Index. International Electrotechnical Commission: Geneva, Switzerland, 2003.
  27. Decreto Ministeriale 18 Dicembre 1975 Norme Tecniche Aggiornate Relative All’Edilizia Scolastica, ivi Compresi Gli Indici di Funzionalità Didattica, Edilizia ed Urbanistica, da Osservarsi Nella Esecuzione di Opere di Edilizia Scolastica; Gazzetta Ufficiale: Rome, Italy, 1975.
  28. Decreto del Presidente del Consiglio dei Ministri 5 Dicembre 1997; Requisiti Acustici Passivi Degli Edifici. Gazzetta Ufficiale: Rome, Italy, 1997.
  29. Decreto Ministeriale 11 Ottobre 2017; Criteri Ambientali Minimi per L’affidamento di Servizi di Progettazione e Lavori per La Nuova Costruzione, Ristrutturazione e Manutenzione di Edifici Pubblici. Gazzetta Ufficiale: Rome, Italy, 2017.
  30. UNI EN ISO 9921:2004; Ergonomics-Assessment of Speech Communication. ISO: Geneva, Switzerland, 2004.
  31. UNI 11367:2010; Acustica in Edilizia-Classificazione Acustica Delle Unità Immobiliari-Procedura di Valutazione e Verifica in Opera. UNI: Milan, Italy, 2010.
  32. Decreto legislativo 9 Aprile 2008, n. 81 Attuazione Dell’articolo 1 Della Legge 3 Agosto 2007, n. 123, in Materia di Tutela Della Salute e Della Sicurezza Nei Luoghi di Lavoro; Gazzetta Ufficiale: Rome, Italy, 2008.
  33. Roy, N.; Merrill, R.; Gray, S.; Smith, E. Voice disorders in the general population: Prevalence, risk factors, and occupational impact. Laryngoscope 2005, 115, 1988–1995. [Google Scholar] [CrossRef] [PubMed]
Figure 1. An extract from the descriptive sheets of a school.
Acoustics 05 00013 g001
Figure 2. Acoustic measurement results of the nine classrooms (outdoor ambient noise measured at 1 m from the facade, ambient noise level, and normalised facade sound insulation with respect to reverberation time) regarding noise produced by sources placed outside the building.
Acoustics 05 00013 g002
Figure 3. Acoustic measurement results of the laboratories (outdoor ambient noise measured at 1 m from the facade, ambient noise level, and normalised facade sound insulation with respect to reverberation time) regarding noise generated by sources located outside the building.
Acoustics 05 00013 g003
Figure 4. Overall noise level induced by continuously operating equipment in the same room where it originates carried out in scenarios S1, S2, S3, and S4, regarding noise due to sound sources inside the investigated room. Each box indicates the noise level of the source or multiple sources; colours correspond to different combinations of sound sources in the scenario under investigation, as shown by the legend: in square brackets, the scenario (e.g., “S1” for the classroom) and its location (e.g., “S/F” for the secondary school in Florence) are reported.
Acoustics 05 00013 g004
Figure 5. Standardised weighted airborne sound pressure level difference (DnT,w) of the wall between the scenario and the adjacent room carried out for scenarios S1, S2 and S3. DnT,w has been analysed to determine the noise due to external sound sources.
Acoustics 05 00013 g005
Figure 6. Standardised weighted airborne sound pressure level difference (DnT,w) of the wall between the scenario and the corridor carried out for the scenarios S1, S2 and S3. DnT,w has been analysed to determine the noise due to external sound sources.
Acoustics 05 00013 g006
Figure 7. Weighted normalised impact sound pressure level (L’n,w) of the partition between the scenario and the room above carried out for scenarios S1, S2 and S3. L’n,w has been analysed to determine the noise due to impact sound.
Acoustics 05 00013 g007
Figure 8. Answers to the question “How often does the noise inside the classroom cause you an increased ease of crying/boredom/anger/headache/loss of concentration/fatigue?” from Questionnaire 1, administered to students. The figure shows the frequency of occurrence of extra-auditory effects due to noise exposure in the classroom (S1).
Acoustics 05 00013 g008
Figure 9. Main extra-auditory effects due to noise exposure in scenarios S1, S2, S3, S4, S5 and S6.
Acoustics 05 00013 g009
Table 1. The three questionnaires: addresses and environments under investigation.
QuestionnaireAddresseesEnvironments under Investigation
Questionnaire 1Students:
  • Primary school
  • Secondary school (middle and high school)
S1—classroom
Questionnaire 2Students:
  • Primary school
  • Secondary school (middle and high school)
S2—laboratory
S3—auditorium
S4—gymnasium
S5—common area
S6—canteen
S7—outdoor area
Questionnaire 3Teachers:
  • Kindergarten
  • Primary school
  • Secondary school (middle and high school)
  • Main working environment (S1, S2, S3, S4 or S7)
  • Minor working environment (S1, S2, S3, S4 or S7)
Table 2. The description of the selected case studies.
SchoolCityContextYears of
Construction
Acoustic Interventions
KindergartenFlorence
  • Urban, early suburbs
  • Residential/commercial area
  • Moderate noise
2015
  • No external acoustic intervention
  • Sound-absorbing treatment in interior rooms
Perugia
  • Suburban
  • Residential and rural area
  • Low noise
1975–1998 (extension in 2006–2008)
  • Acoustic ceiling panels in various rooms
  • Acoustic ceiling in part of the canteen
Rome
  • Urban
  • Low noise
1980–1990
  • Acoustic ceiling in a classroom and in the corridor
PrimaryFlorence
  • Urban, early suburbs
  • Moderate noise
2010
  • No external acoustic intervention
  • Sound-absorbing treatment in rooms
Perugia
  • Suburban
  • Low-medium noise
1950–1975
  • Acoustic ceiling in two laboratories
Rome
  • Urban
  • Low noise
1970–1980
  • None
SecondaryFlorence
  • Urban
  • Residential area
  • Moderate noise
Before 900
  • No external acoustic intervention
  • Sound-absorbing treatment in the auditorium
Perugia
  • Suburban
  • High noise
1975–1998(extension in 2002)
  • Sound-absorbing treatment in most rooms
Rome
  • Urban
Before 900
  • No external acoustic intervention
  • Sound-absorbing treatment in some classrooms
Table 3. Room acoustics results and sound-absorbing interventions in the case study schools. RT and C50 are the mean values of octave bands between 250 Hz and 2000 Hz.
School/CityScenarioRoom Acoustics
RT [s]Intelligibility
C50 [dB] or STI [-]
Sound-Absorbing
Interventions
K/FS10.71C50 = 5.3 dBOn the ceiling
S20.80C50 = 2.8 dBOn the ceiling
S31.06STI = 0.64On the ceiling
S40.83n/a 1On the ceiling
S50.63n/a 1On the ceiling
S61.08n/a 1On the ceiling
K/PS11.01C50 = −1.7 dBNone
S21.44C50 = −1.0 dBNone
S51.10n/a 1On the ceiling
S61.24n/a 1On the ceiling
K/RS11.05n/a 1None
S21.06n/a 1On the ceiling
S41.75n/a 1None
S50.46n/a 1On the ceiling
S61.66n/a 1None
P/FS10.81C50 = 2.2 dBOn the ceiling
S20.68C50 = 3.5 dBOn the ceiling
S31.06STI = 0.64On the ceiling
S42.46n/a 1On the ceiling
S50.74n/a 1On the ceiling
S60.84n/a 1On the ceiling
P/PS11.70C50 = -2.3 dBNone
S21.40C50 = -2.7 dBNone
S32.10STI = 0.49None
S44.07n/a 1None
S50.73n/a 1On the ceiling
P/RS11.80C50 = -2.9 dBNone
S43.01n/a 1None
S51.9n/a 1None
S/FS11.88C50 = -2.3 dBNone
S21.24C50 = 0.4 dBNone
S31.20STI = 0.57On the ceiling
S44.78n/a 1None
S52.42n/a 1None
S62.10n/a 1None
S/PS11.91C50 = -2.2 dBNone
S21.76C50 = -2.5 dBNone
S30.92STI = 0.68On the ceiling
S45.51n/a 1None
S50.51n/a 1On the ceiling
S/RS11.07C50 = 3.5 dBOn the ceiling
S22.66C50 = -0.3 dBNone
S43.49n/a 1None
S52.48n/a 1None
1 This parameter was not pertinent for the investigated scenario. Note: Room acoustics measurements were not carried out in the scenarios not reported in the table, because this is not present in the school, not accessible or not used.
Table 4. Results of the acoustic measurements in occupied environments for the case study schools (SPL, occupancy of the room and activity carried out).
School/CityScenarioConditions of Measurements
SPL [dB(A)]Occupancy
No. of Students|Age
Activity
K/FS171.218 students|3–5 y.o.Playing
S273.16 students|5 y.o.Practical activities
S467.411 students|4–5 y.o.Drum exercises
S568.214 students|3–5 y.o.Taught class
S677.740 students|3–5 y.o.Having lunch
K/PS174.8 */81.0 **17 students|3–5 y.o.Taught class */
playing **
S286.517 students|3–5 y.o.Physical education
S566.618 students|3–5 y.o.Playing
S677.830 students|3–5 y.o.Having lunch
P/FS171.1 */77.1 **24 students|9 y.o.Taught class */
interactive class **
S273.820 students|7 y.o.Computer science lesson
S479.020 students|9 y.o.Physical education
S568.315 students|7–8 y.o.Playing
S678.518 students|6–10 y.o.Having lunch
P/PS168.7 */76.0 **18 students|10–11 y.o.Taught class */
interactive class **
S276.318 students|10–11 y.o.Group activities
S377.518 students|10–11 y.o.Music class
S485.118 students|10–11 y.o.Physical education (using ball)
S574.43 students|9–10 y.o.Studying
P/RS170.720 students|9–10 y.o.Taught class
S574.113 students|6–10 y.o.Playing
S/FS163.8 */67.8 **14 students|14–15 y.o.Taught class */
interactive class **
S270.024 students|17–18 y.o.Studying
S368.732 students|18–19 y.o.Taught class
S482.421 students|11 y.o.Physical education (using ball)
S683.564 students|11–18 y.o.Having lunch
S/PS168.7 */73.7 **10 students|14–16 y.o.Taught class */
interactive class **
S275.010 students|14–16 y.o.Taught class
S474.221 students|14–17 y.o.Physical education
S550.23 students|16 y.o.studying
(*) Acoustic measurements have been carried out during the lecture given by the teacher. (**) Acoustic measurements have been carried out during student activities. Note: Acoustic measurements in occupied environments were not carried out in the scenarios not reported in the table, because they are not present in the school, not accessible or not used.
Table 5. Number of completed questionnaires in the case study schools.
SchoolCityNumber of Completed Questionnaires
Questionnaire 1Questionnaire 2Questionnaire 3
KindergartenFlorencen/a 1n/a 119
KindergartenPerugian/a 1n/a 19
KindergartenRomen/a 1n/a 10 2
Primary schoolFlorence242513
Primary schoolPerugia181315
Primary schoolRome222327
Secondary schoolFlorence161915
Secondary schoolPerugia101113
Secondary schoolRome0 20 21
Total number9091112
1 The questionnaire was not administered to children attending kindergarten. 2 The questionnaire was not administered due to lack of participation.
Table 6. Average SPL values measured at 15 cm and average LAeq 1 m [dB(A)] from the speaker for the entire measurement duration. Average LAeq [dB(A)] values referred to measurements with a sound level meter in the classroom. Mean values of the fundamental frequency (F0). Classification of the degree of vocal effort carried out by comparing the calculated values of LAeq 1 m [dB(A)] shown in the table with the vocal effort values specified in the UNI EN ISO 9921:2004 standard is also reported.
GenderSPL 15 cmF0LAeq [dB (A)]LAeq 1 m [dB(A)]Vocal Effort UNI EN ISO 9921
f87.9211.067.181.0Very loud
m72.5144.380.256.8Relaxed
m85.5139.370.667.6Raised
f78.8228.682.894.1Very loud
f80.3294.771.473.0Loud
m75.9145.172.157.2Relaxed
f94.7248.077.196.3Very loud
f80.8247.074.361.7Normal
f85.7274.576.181.3Very loud
f106.3281.376.1102.1Very loud
f80.8181.271.466.1Raised
f72.8238.876.768.9Raised
f74.5235.67652.9Relaxed
f75.0276.575.751.9Relaxed
f68.4250.67154.6Normal
f85.9224.379.767.2Raised
f70.5253.374.384.3Very loud
m85.0206.582.577Loud
f81.7223.966.170Raised
f81.5271.270.474.2Loud
f68.7254.1/79.7Very loud
f86.5263.163.770.2Raised
f58.9272.075.445.5Relaxed
f83.0239.673.966.6Raised
f78.6205.2/63.9Normal
f95.2245.2/84.8Very loud
f89.7211.8/77Loud
f90.9221.2/79.1Very loud
f83.4226.7/74.3Loud
Table 7. Gender differences in fundamental frequency, vocal effort (SPL), and ambient noise are reported.
FemaleMalep Value
Fundamental frequency243.40 ± 27.12158.75 ± 32.270.0001
SPL (vocal effort)72.88 ± 13.7564.75 ± 9.670.2683
SPL (noise)73.642 ± 4.67876.350 ± 5.8810.3234
Disclaimer/Publisher’s Note: The statements, opinions and data contained in all publications are solely those of the individual author(s) and contributor(s) and not of MDPI and/or the editor(s). MDPI and/or the editor(s) disclaim responsibility for any injury to people or property resulting from any ideas, methods, instructions or products referred to in the content.

