Article

Development of an In Situ Micro-Corrosion Cell for the Investigation of Pitting Corrosion on Austenitic and Ferritic Stainless Steels

1
Bielefeld Institute for Applied Materials Research, Faculty of Engineering and Mathematics, Bielefeld University of Applied Sciences, Interaktion 1, 33619 Bielefeld, Germany
2
Thin Films & Physics of Nanostructures, Faculty of Physics, Bielefeld University, Universitätsstraße 25, 33615 Bielefeld, Germany
3
Experimental Biophysics and Applied Nanoscience, Faculty of Physics, Bielefeld University, Universitätsstraße 25, 33615 Bielefeld, Germany
*
Authors to whom correspondence should be addressed.
Corros. Mater. Degrad. 2023, 4(1), 104-119; https://doi.org/10.3390/cmd4010007
Submission received: 28 November 2022 / Revised: 29 December 2022 / Accepted: 23 January 2023 / Published: 31 January 2023

Abstract

:
In order to investigate the electrochemical pitting corrosion in more detail, a micro-corrosion cell was developed, allowing real-time in situ optical observations of steel surfaces in direct correlation with electrochemical measurement results. In this study, the austenitic 1.4301–X5CrNi18-10 and the ferritic 1.4016–X6Cr17 stainless steel grades were examined in electrolytes containing chloride ions. The micro-corrosion cell revealed a stable pitting corrosion of the ferritic 1.4016 and metastable pitting corrosion of the austenitic 1.4301. The pits were characterized by means of scanning electron microscopy (SEM) and atomic force microscopy (AFM) in detail. A clear correlation between current peaks in the current density-potential curve and the growth of many small pits on the test surface was established and was identified as metastable pit growth. In general, the pitting corrosion potential increased as the diameter of the test surface decreased for both stainless steels. In contrast to the complex precipitates of 1.4301, chromium precipitates with a significantly higher amount was detected on the entire surface of the 1.4016. The corrosion initiation was identified at the interface between the precipitates and the base material for both stainless steels. By comparing both materials, the ferritic 1.4016 had a lower pitting corrosion potential than the austenitic 1.4301 under all test conditions.

1. Introduction

Stainless steels are well known for their excellent corrosion resistance. However, the quality of corrosion resistance depends on a large extent on the environment in which the stainless steels are used [1]. Corrosion resistance is based on the passive chromium oxide layer, which has diffusion-inhibiting and thus corrosion-inhibiting properties. This layer is a few nanometers thin, transparent and is built up on the surface of a material [2,3,4,5]. McBee and Kruger showed that low chromium contents lead to a passive layer with a crystalline structure. By increasing the chromium content, the crystallinity decreases. Above about 19 wt% of chromium, the chromium oxide layer is predominantly amorphous [6]. Under specific service conditions, the existence of media containing halides can impair the corrosion-inhibiting properties. In this case, halogen ions, such as chloride ions (Cl), attack the passive layer and thereby weaken it, which leads to pitting corrosion [7,8,9]. If the stainless steel contains precipitates reaching up to the top surface of the material, it is possible that the passive chromium oxide layer cannot be built up homogeneously to cover the entire surface. These defects of the passive chromium oxide layer may represent nucleation sites for pitting corrosion, which is a specific problem of stainless steels [10,11].
Two different types of pitting corrosion can occur during anodic polarization in electrochemical corrosion tests. The first type is stable pitting corrosion, i.e., pitting that grows because a repassivation of the locally destroyed passive layer has not taken place. The second type is metastable pitting, which is characterized by an immediate repassivation of the pits, resulting in no continuous pit growing anymore [12,13]. In order to measure the corrosion and pitting potential of the stainless steels, current density-potential curves were recorded in this work using potentiodynamic polarization.
Many electrochemical methods are based on large-scale (macro-corrosion) experiments with test areas in centimeter range in order to investigate localized corrosion, i.e., pit initiation and pit growth. In recent years, a lot of different microelectrochemical techniques were applied to investigate the pit initiation. By decreasing the testing area, it is possible to identify small fluctuations of the measured current density-potential curves as well as analyzing local defects on the test surface which are maybe responsible for pit initiation. For example, Suter et al. used a microelectrochemical cell to measure metastable pitting events by analyzing the current in the picoampere range and thus were able to show a direct correlation between metastable pitting events and the sulfur content of the investigated stainless steel 1.4301 [14]. Muto et al. also studied the anodic polarization behavior of stainless steels and the influence of the inclusions with a microelectrochemical cell. They investigated the pit initiation at inclusions and the anodic dissolution of sulfide inclusions and showed that different inclusions dissolved at different potentials in the passive region of the current density-potential curve [15]. Additionally, Webb et al. performed electrochemical measurements on single sulfide inclusions with a microcell in order to show the influence of different electrolytes and the geometry of the inclusion on the dissolution behavior. Furthermore, they investigated the influence of the inclusion on the initiation of pitting corrosion of the stainless steel 1.4301 [16].
An optical analysis of the test surface during polarization is usually not possible, thus the tested surface can only be examined microscopically after the corrosion has occurred. The disadvantage of these methods is that neither the pit formation nor the pit growth can be evaluated, since the test surface can be investigated only after the polarization measurement, which means after the pit initiation, formation and growth.
For this reason, a micro-corrosion cell for electrochemical corrosion measurements was developed within this work, which differs significantly from a classical electrochemical measuring cell, or the so-called macro-corrosion cell, in terms of design and dimensions. Due to its compact design, the micro-corrosion cell can be used to perform in situ electrochemical polarization experiments using an optical microscope or an AFM in order to correlate the measured current density-potential curve with the corrosion events on the test surface. In addition, it is possible to record the entire corrosion process and store it as a video for subsequent evaluation. One aim of this work was to validate the micro-corrosion cell by comparing the electrochemical measurement results at different chloride ion concentrations of the electrolyte. The measured current density-potential curve of the new micro-corrosion cell was compared with former results of a macro-corrosion cell. In addition, the current density-potential curves were correlated with the in situ optical microscope videos/pictures of the tested surface. Finally, first investigations of the damage mechanisms causing the pitting corrosion were carried out by SEM and AFM.
All corrosion investigations in this work were performed using the austenitic stainless steel 1.4301–X5CrNi18-10 and the ferritic stainless steel 1.4016–X6Cr17. The mentioned materials were selected in order to investigate one material with a stable and one with a metastable pit growth as representatives. For this reason, 1.4301 was chosen due to its well-known metastable pit growth caused by its manganese sulfide (MnS) inclusions [17]. On the other hand, 1.4016 was chosen because it contains no inclusions which cause metastable pit growth [18].

2. Materials and Methods

2.1. Materials

The compositions of the austenitic 1.4301–X5CrNi18-10 and of the ferritic 1.4016–X6Cr17 steels are shown comparatively in Table 1. The values were determined by means of spark spectrometry using the LAB S (SPECTRO Analytical Instruments GmbH, Kleve, Germany).
The materials were used as cold-rolled and bright annealed sheets in as-received condition. The plates were 0.5 mm thin and the specimens were water-jet cut to a diameter of 32.10 mm. Before starting the electrochemical measurements, the specimens were metallographically prepared in order to ensure the same defined initial surface conditions for all tested specimens. The samples were ground and polished with grit sizes of 15.3 µm (SiC), 9 µm, 3 µm and 1 µm (diamond suspensions) before final polishing with a grain size of 0.06 µm using colloidal silica. As a final step, all samples were exposed to ambient air with a humidity of approximate 50% for 72 h. The specimens for the macro- and the micro-corrosion cell had the same outer diameter and were metallographically prepared with the same procedure. Only the examined test area varied between a diameter of 11.28 mm for the macro-corrosion cell and 4 mm or 0.5 mm for the micro-corrosion cell, respectively.

2.2. Macro-Corrosion Cell for Electrochemical Corrosion Testing

The macro-corrosion cell for electrochemical polarization measurements was based on the three-electrode setup shown in Figure 1. A classical electrochemical macro-corrosion cell was used consisting of a working electrode (WE), a reference electrode (RE) and a counter electrode (CE), as depicted in Figure 1. These electrodes were immersed in a beaker containing 800 mL of electrolyte and were connected to a potentiostat (MLab 100, Bank Elektronik–Intelligent Controls GmbH, Pohlheim, Germany). The WE represented the tested material and served as the anode in this setup. The circular test area was confined by a screwed-on mask defining the test area of 1 cm2, which corresponds to a diameter of approximately 11.28 mm. The RE consisted of silver/silver chloride (Ag/AgCl) in a 3 mol L−1 potassium chloride (KCL) solution with a potential of +207 mV referred to a standard hydrogen electrode. To protect the RE from contaminations and to measure the potential as closely as possible to the surface of the WE, the RE was immersed in the Haber-Luggin capillary (HL), which had a conical shape at the tip. The CE represented the cathode of the system and was made of platinized titanium.

2.3. Micro-Corrosion Cell for In Situ Electrochemical Corrosion Testing

The micro-corrosion cell developed within this work is based on a standard electrochemical corrosion cell with a three-electrode configuration using the potentiostat as presented in the paragraph before. In Figure 2, the micro-corrosion cell is shown as an exploded drawing (2a) as well as an optical image (2b). The plastic bottom-part (1) was the base of the cell with dimensions of 48.5 mm × 48.5 mm. The WE consisted of the brass electrode (3), the specimen (2) to be examined and the mask (4) for defining the test surface. The specimen was a flat piece of the tested material, which was placed into a circular pocket of the brass electrode with a depth of 0.5 mm. The mask consisted of an electroforming tape (Galvanic-Tape 470, 3M Deutschland GmbH, Neuss, Germany). A paper drill was used to punch a hole of 0.5 or 4 mm diameter into the tape in order to create the desired test area. The upper plastic part (5) was filled with 2 mL electrolyte solution, used for both investigated diameters. Due to its flat cylinder shape, the upper part can be used under an optical microscope. To align the sealing ring (6), a circular groove was inserted in the upper plastic part. The CE (7) was made of a circular 99.5% platinum wire and was placed in the electrolyte between the mask of the WE and the upper part. It had a diameter of 0.5 mm and a length of 100 mm. The reference electrode RE (8) consisted of a Ag/AgCl wire with a diameter of 0.2 mm and a length of 52 mm. It was placed on the RE stand (9) at a defined flat angle. The flat angle is needed to prevent contact between the electrode and the lens of an optical microscope. The bottom and upper parts, as well as the RE stand, were 3D-printed in stereolithography process using a photopolymer (Somos® Watershed XC 11122, Covestro AG, Leverkusen, Germany). The reference electrode used in the micro-corrosion cell was compared by an open-circuit-potential measurement (OCP) to the reference electrode of the macro-corrosion cell. The result showed that the reference electrode of the micro-corrosion cell had a higher potential of +89 mV in a 3000 mg/L chloride solution compared to the reference electrode of the macro-corrosion cell. A possible reason for a higher potential could be the different geometry and manufacture of the reference electrodes, but could also come about due to the different environmental conditions at the electrodes.
During electrochemical measurements, the test surface was recorded by an Olympus DP-23 camera (Olympus Europa Holding GmbH, Hamburg, Germany) mounted on a Zeiss optical microscope using a 10× magnification.

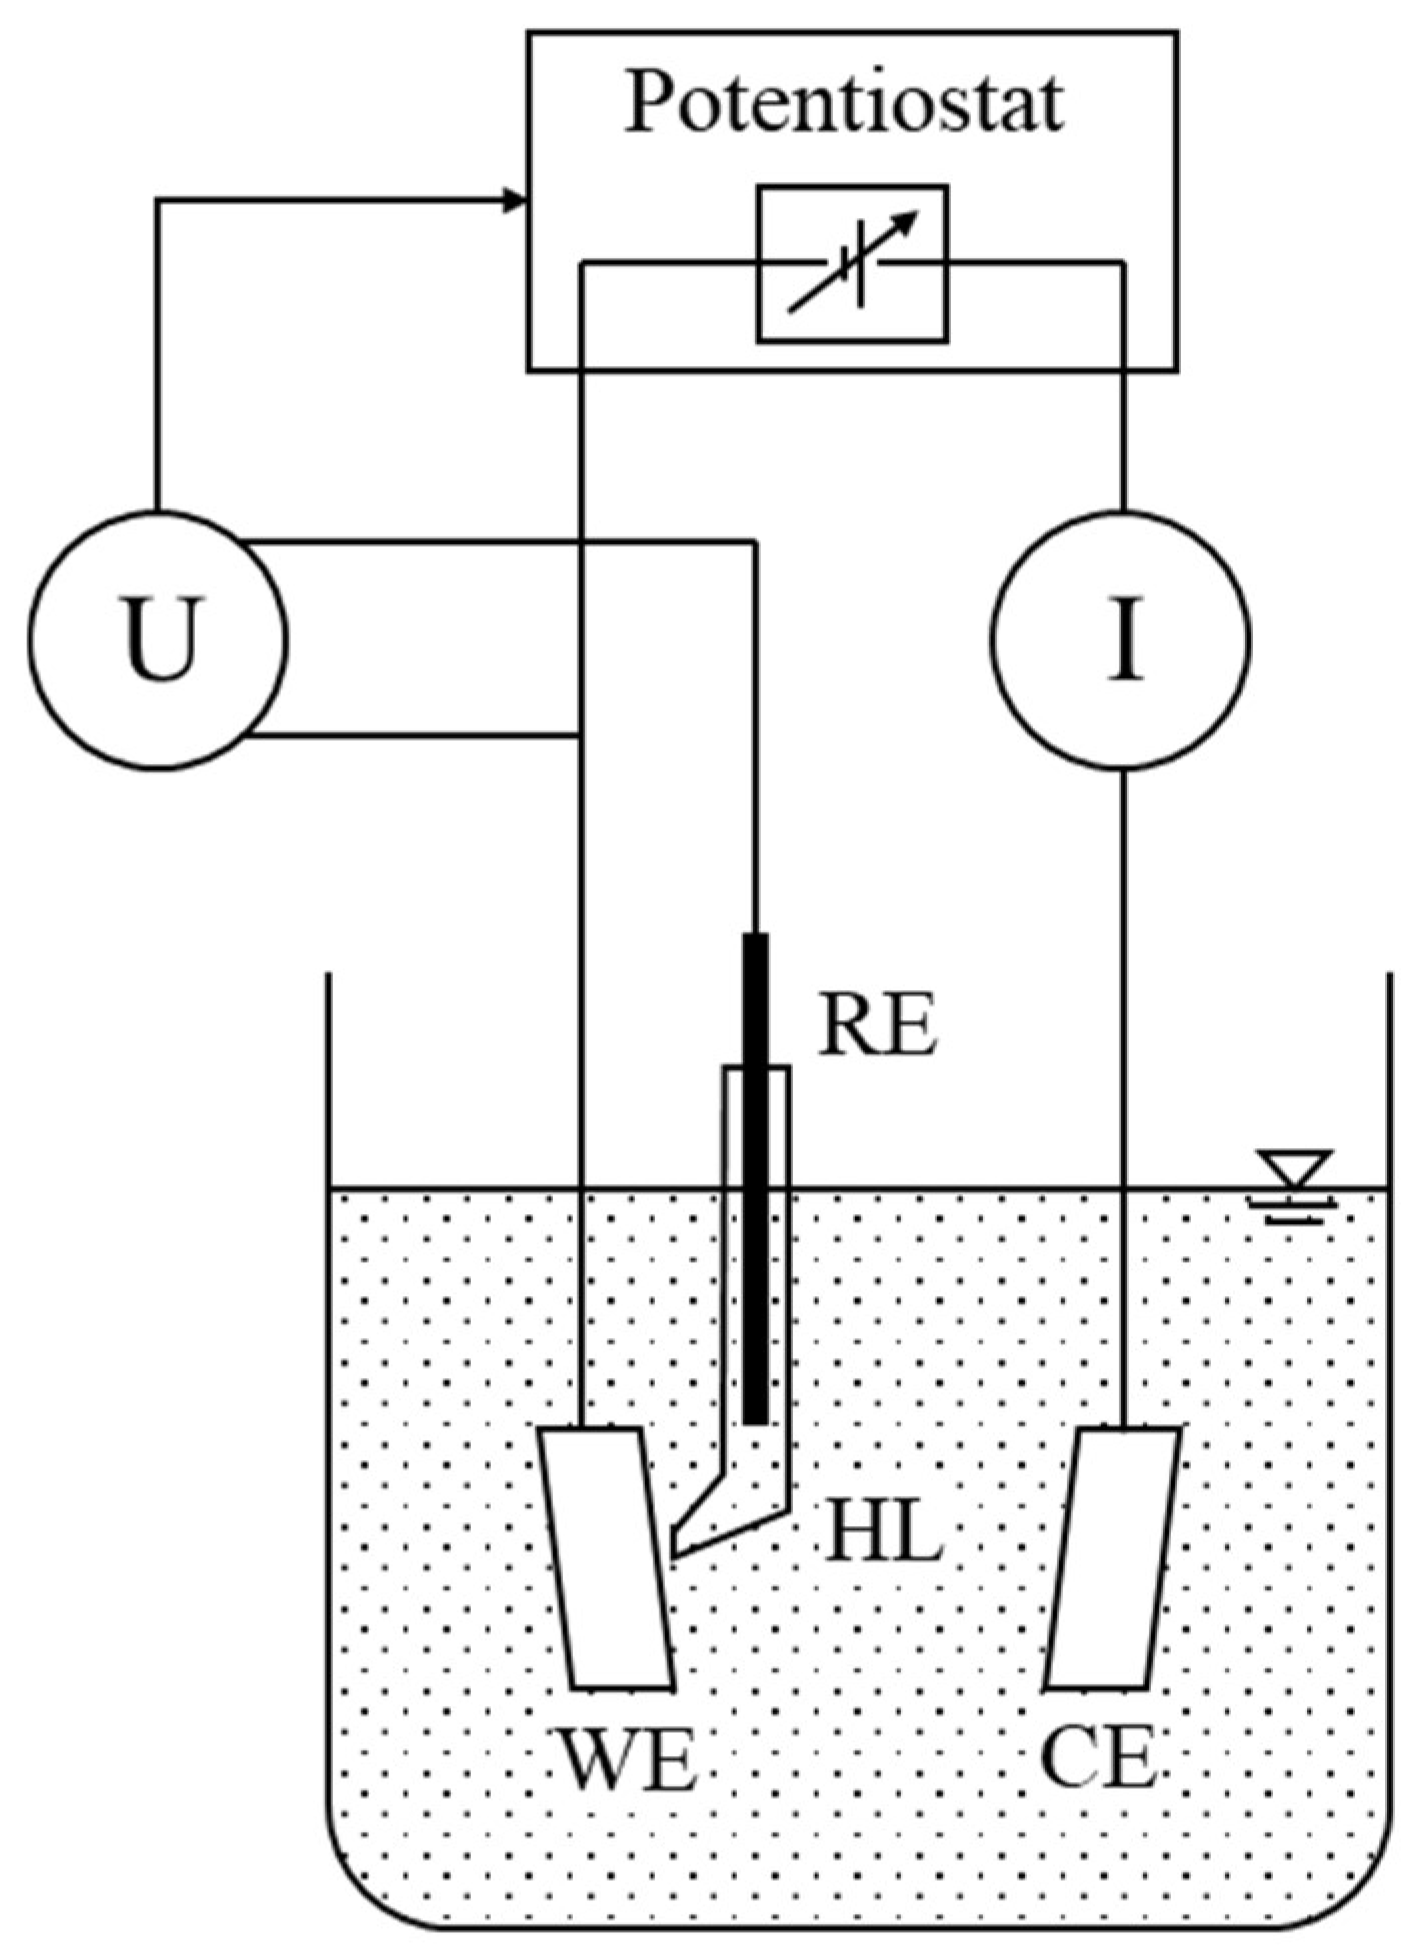
2.4. Electrochemical Test Setup

Before starting the electrochemical polarization, OCP measurements were carried out for 300 s to obtain a comparable initial state of the tests. The electrochemical polarization was performed in anodic direction starting from −400 mV and ending either reaching a current of 100 µA, with a potential change of 1 mV/s.
In order to investigate the influence of the test area diameter on the current density-potential curve results, mask diameters of 0.5 and 4 mm were used in the micro-corrosion cell and these results were compared to results using the commercial macro-corrosion cell with a 11.28 mm diameter of the test area.
The OCP and anodic polarization were carried out in NaCl solutions using deionized water at a pH value of 5.9 on average. Chloride ion concentrations were set to 500 mg/L or 3000 mg/L.

2.5. High-Resolution Microscopy

The SEM investigations were carried out with a Sigma 300 VP (Carl Zeiss AG, Oberkochen, Germany). The energy dispersive X-ray spectroscopy (EDS) examinations were conducted with an X-Max 80 mm2 (Oxford Instruments, Abingdon, UK). The EDS software Aztec (version 4.4) was used to analyze the data.
The AFM measurements were conducted with a NanoWizard™ UltraSpeed 2 (JPK-Bruker, Berlin, Germany) and an AR5-NCHR Cantilever (Nanosensors ™, Neuchâtel, Switzerland, 42 N/m, 330 kHz) in tapping mode. The open-source software Gwyddion was used to post-process the data [20].

3. Results and Discussion

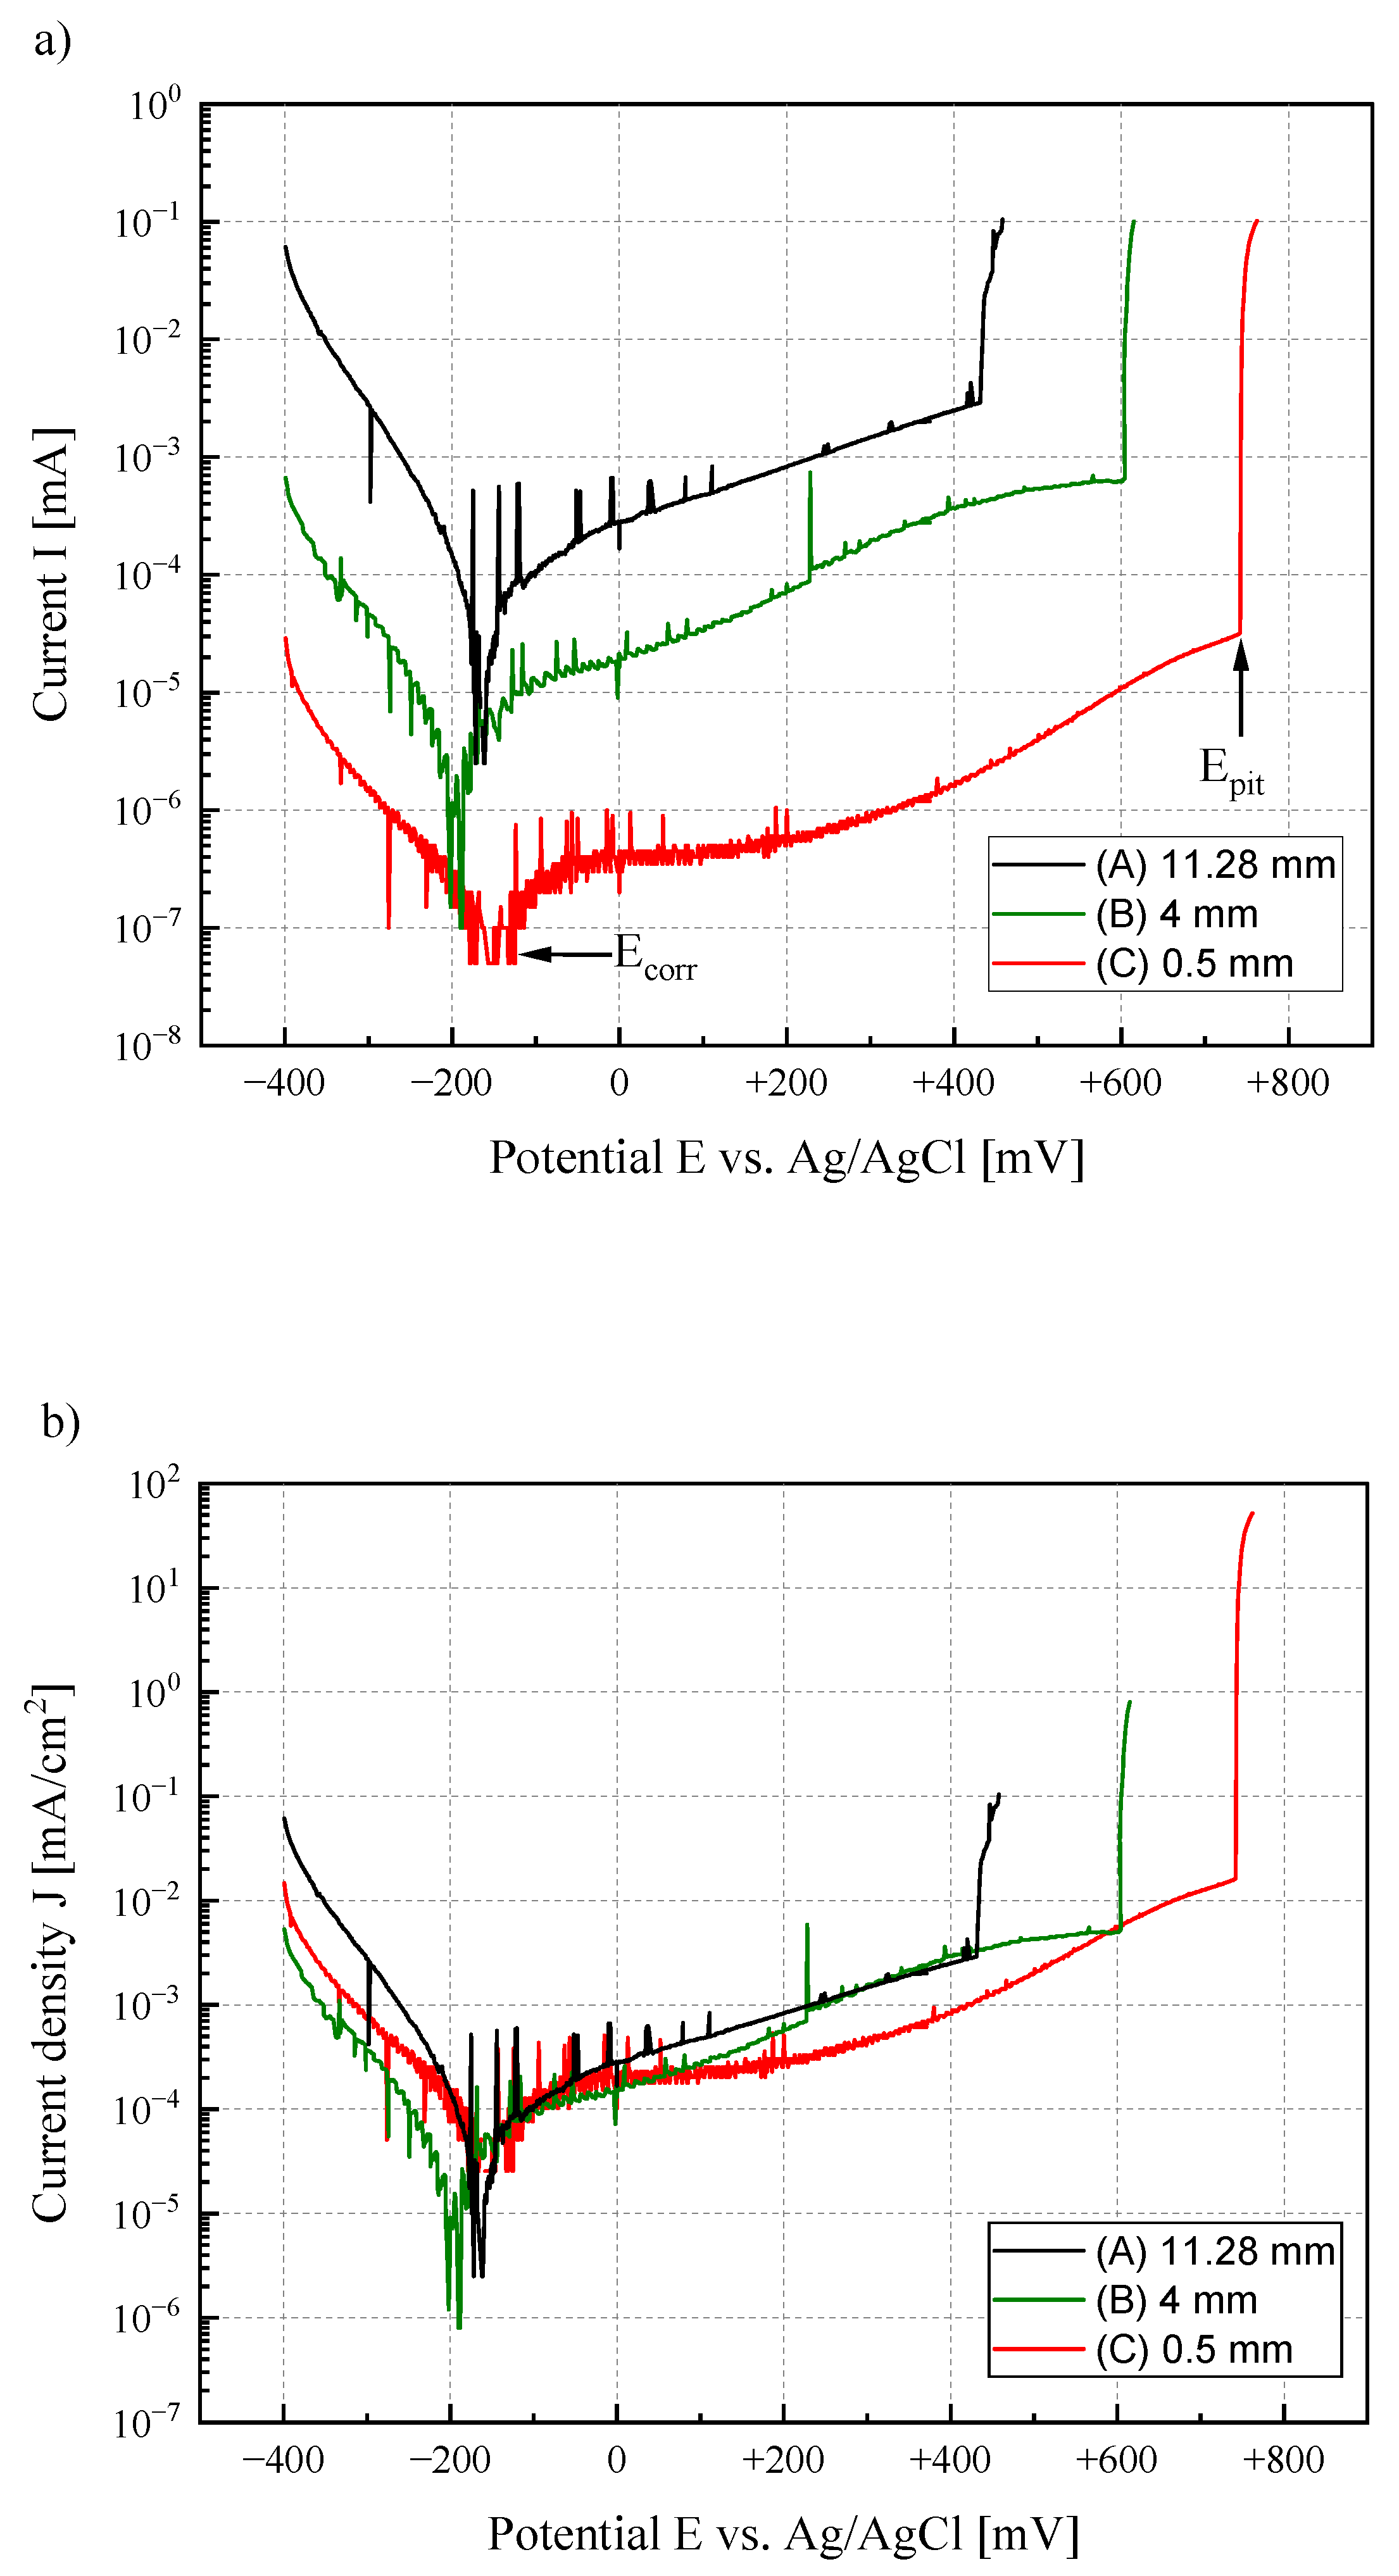
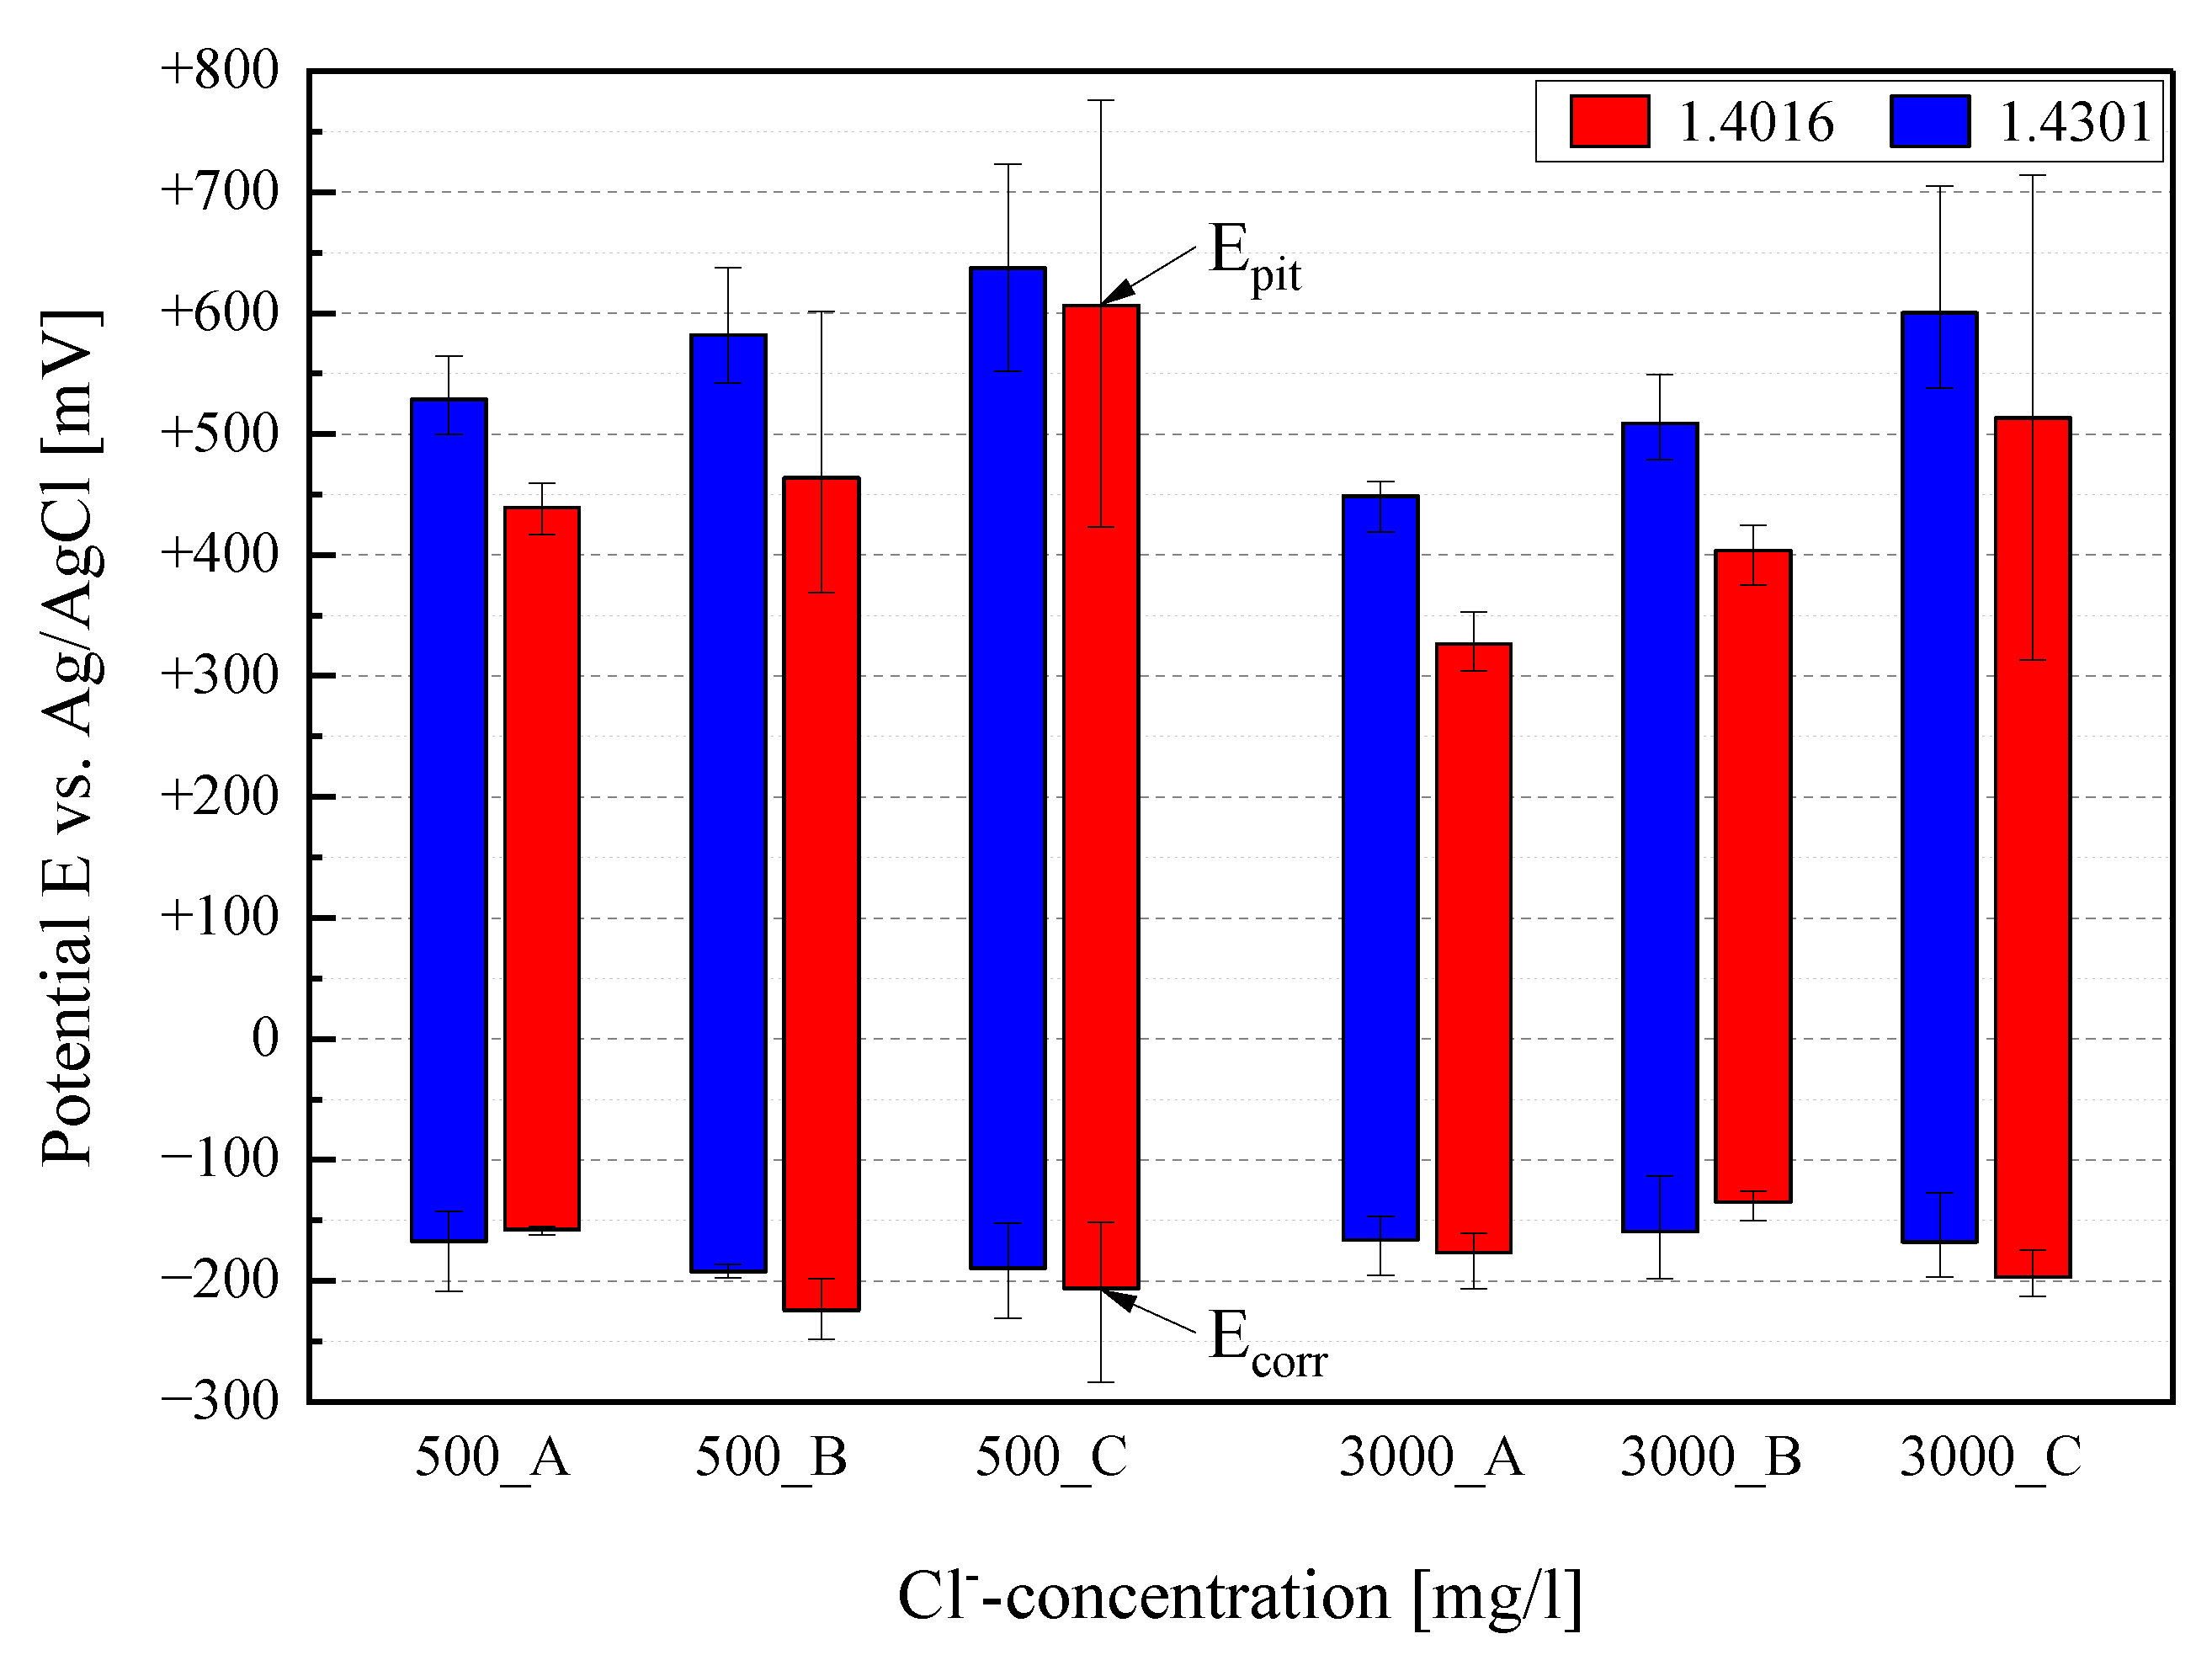
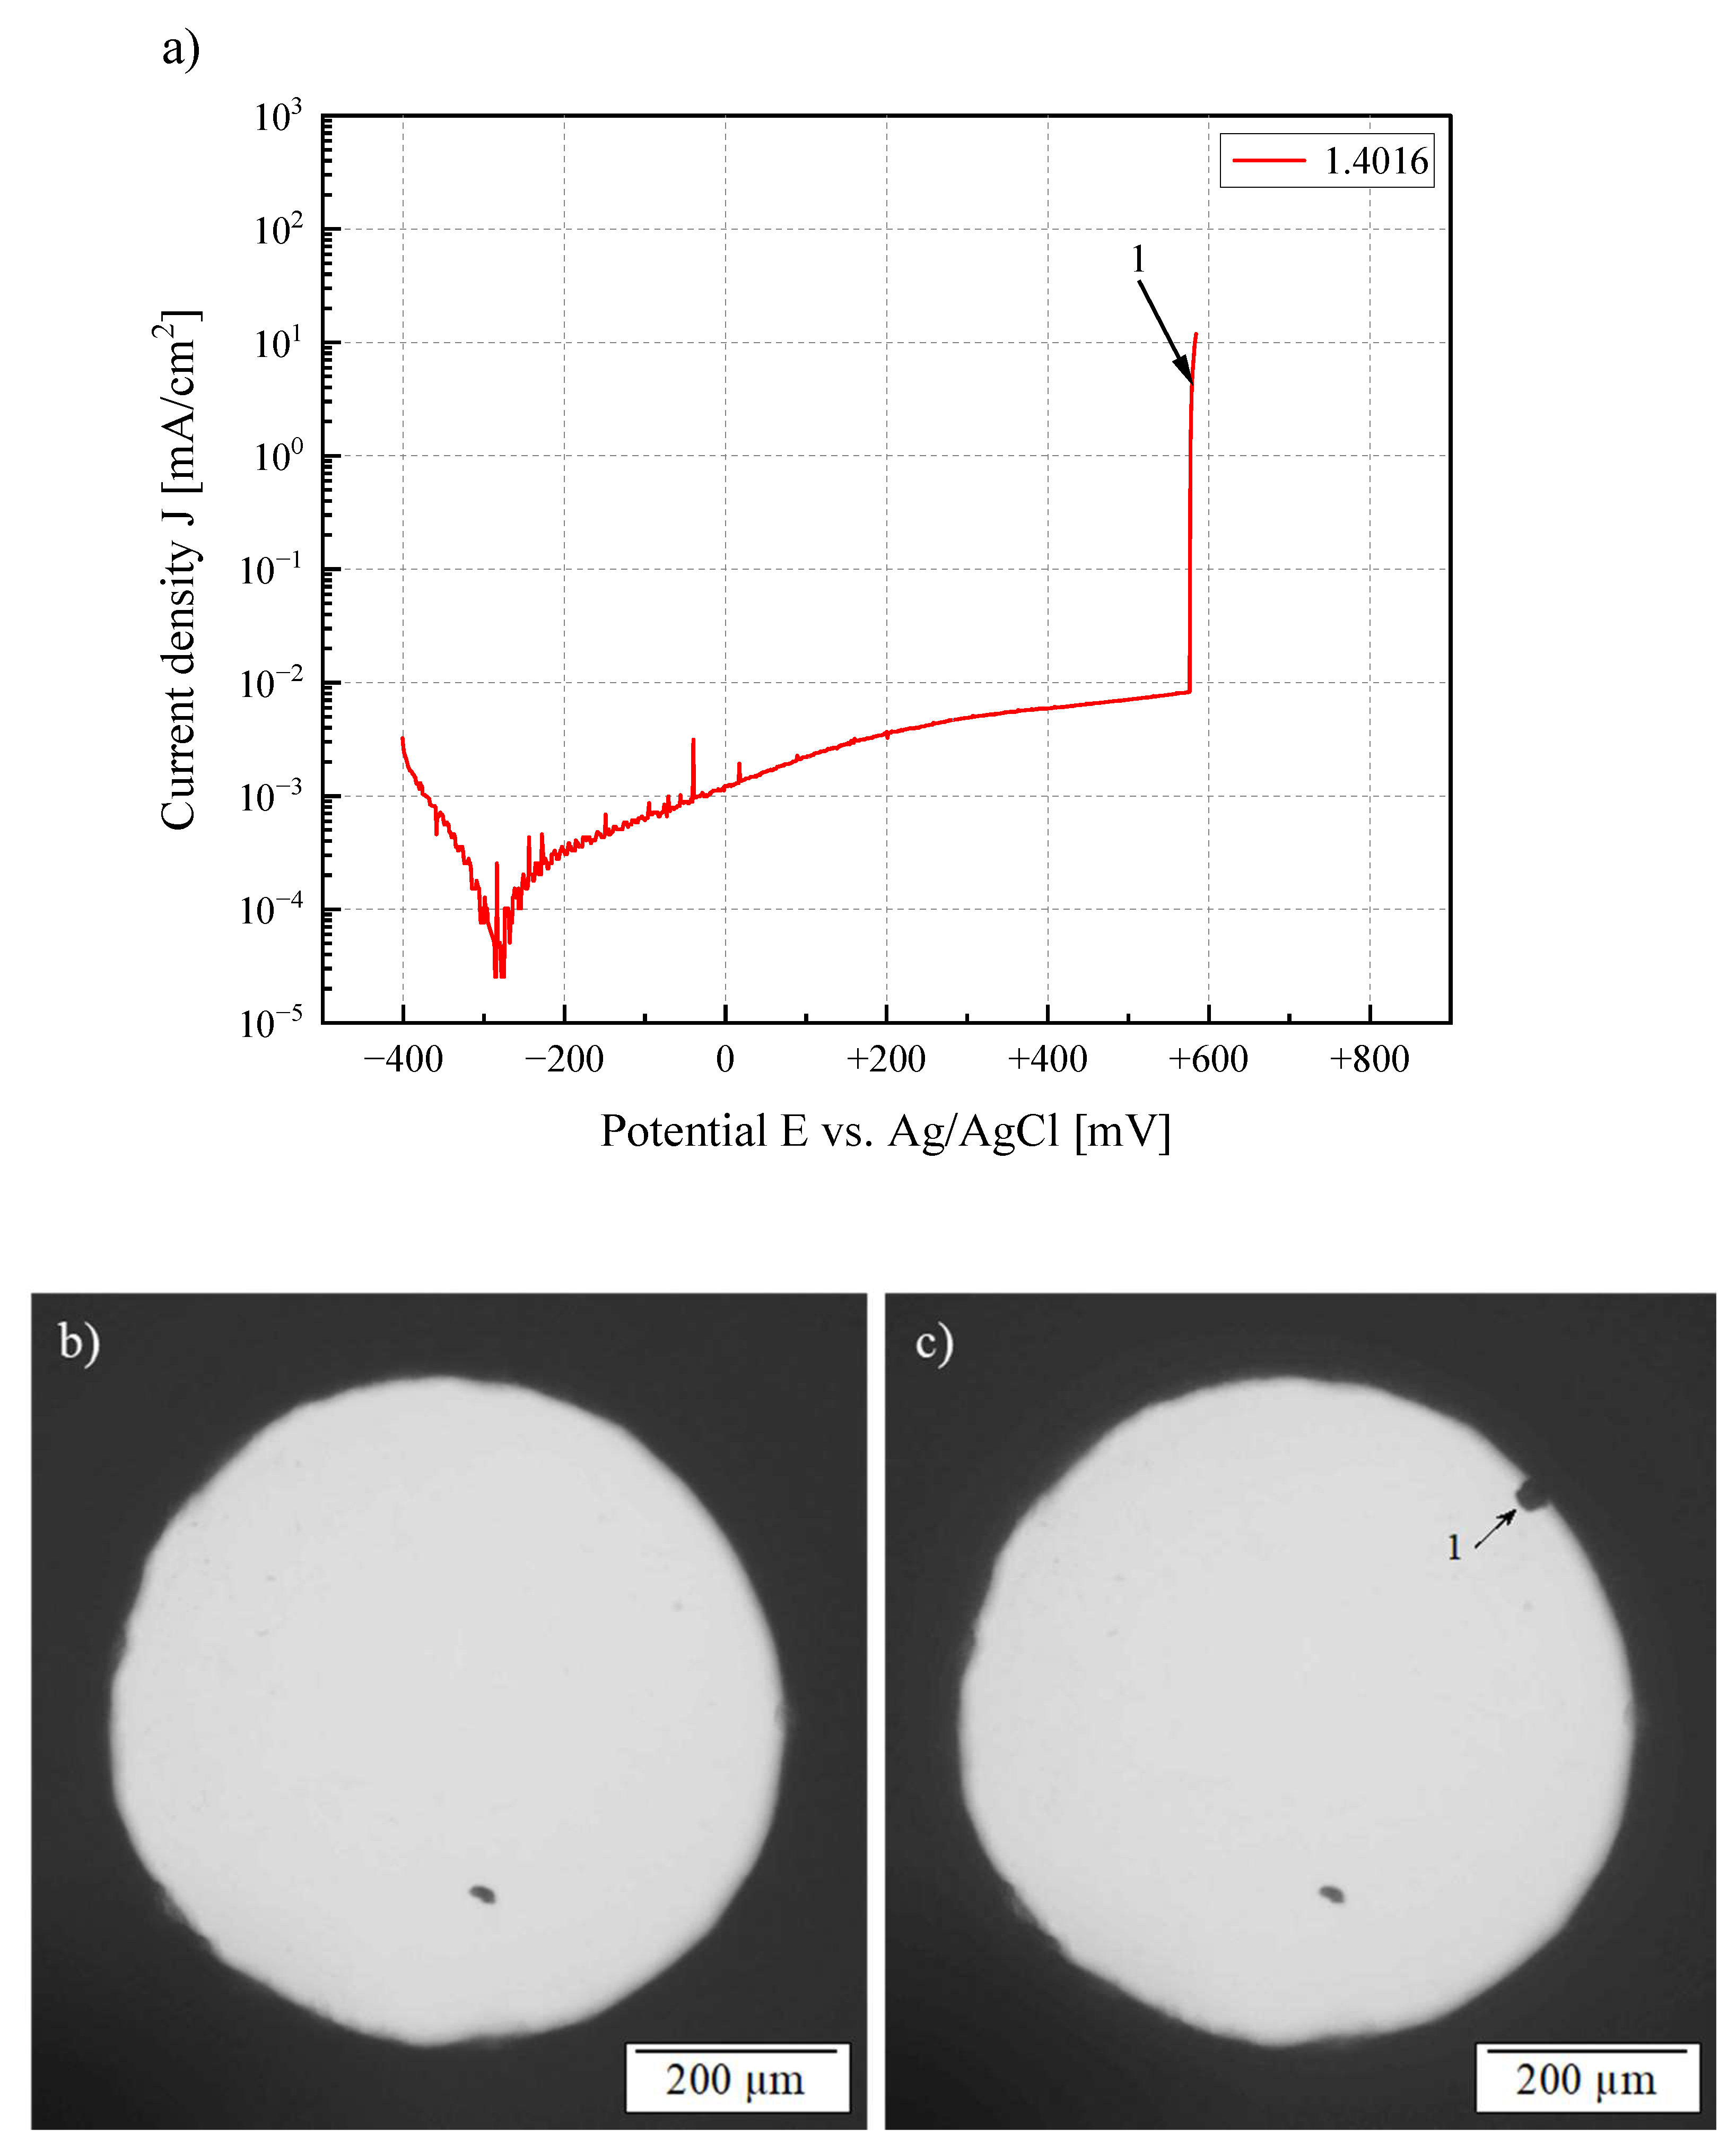
3.1. Electrochemical Investigation

Both used corrosion cells (macro- and micro-) had slightly different setup conditions, i.e., a different electrolyte amount, position and potential of the reference electrodes. Therefore, the results in the following section of the macro- and micro-corrosion cells were always compared by using the originally measured data. Figure 3 shows representative current-potential curves (3a) and current density-potential curves (3b) of 1.4016 at a chloride ion concentration of 500 mg/L. The diameters of the test areas shown in Figure 3 were 11.28 mm (A) (macro-corrosion cell), 4 mm (B) and 0.5 mm (C) (micro-corrosion cell). Figure 3a shows that the measured current was much lower for the test diameters used in the micro-corrosion cell than those used in the macro-corrosion cell, because the diameter itself directly influenced the current. Dividing the current by the test area lead to the current density curves depicted in Figure 3b. The same trend occurred in all diameters, except for the pitting corrosion potential. This indicates that the newly developed micro-corrosion cell showed similar results compared to the macro-corrosion cell and is therefore appropriate for electrochemical testing.
The bar chart presented in Figure 4 and Table 2 shows the influence of the test area diameter on the current density-potential curve for both materials at the chloride ion concentrations of 500 mg/L and 3000 mg/L. The diameters of the test areas shown in Figure 4 are 11.28 mm (A), 4 mm (B) and 0.5 mm (C). The upper end of each bar represents the mean value of the pitting corrosion potential (Epit) and the lower end represents the mean value of the corrosion potential (Ecorr). The corrosion potential (Ecorr) and the corresponding current density (Jcorr) were determined by using the Tafel-line method (MLabSci 487, Bank Elektronik–Intelligent Controls GmbH, Pohlheim, Germany). Each mean value was derived from three repeated measurements. The error bar shows the min. and max. values of the pitting corrosion potential Epit and of the corrosion potential Ecorr, respectively. The pitting corrosion potential increased with a decreasing test surface for both materials. One reason for this could be a statistical size effect. As the size of the tested surface decreased, the number of possible defects promoting an initiation of the pitting corrosion decreased as well. Ida et al. studied the influence of the test surface diameter on pitting corrosion potential and obtained similar results [21]. Comparing both materials, it can be concluded that the ferritic 1.4016 had a lower pitting corrosion potential than the austenitic 1.4301 one under all test conditions, and thus a lower corrosion resistance. The corrosion potential Ecorr and the corresponding current density (Jcorr) were not significantly influenced by the different test diameters, considering the normal scatter in determining Ecorr/Jcorr with the Tafel-line method out of electrochemical measurements. The corrosion potential Ecorr represents the corrosion behavior at which the anodic and cathodic current have the same value, i.e., the total current density (anodic minus cathodic current) is zero.
The well-known influence of the chloride content on the current density-potential curve can be seen in Figure 4 as well. Previous studies have already shown this extensively. A linear dependence could be assumed, showing that the pitting corrosion potential in the current density-potential curve was shifted towards lower potentials with increasing chloride ion concentrations [22,23,24]. The bar chart presented in Figure 4 shows the same influence of the chloride content on the pitting corrosion potential for both materials and for all three investigated test areas.

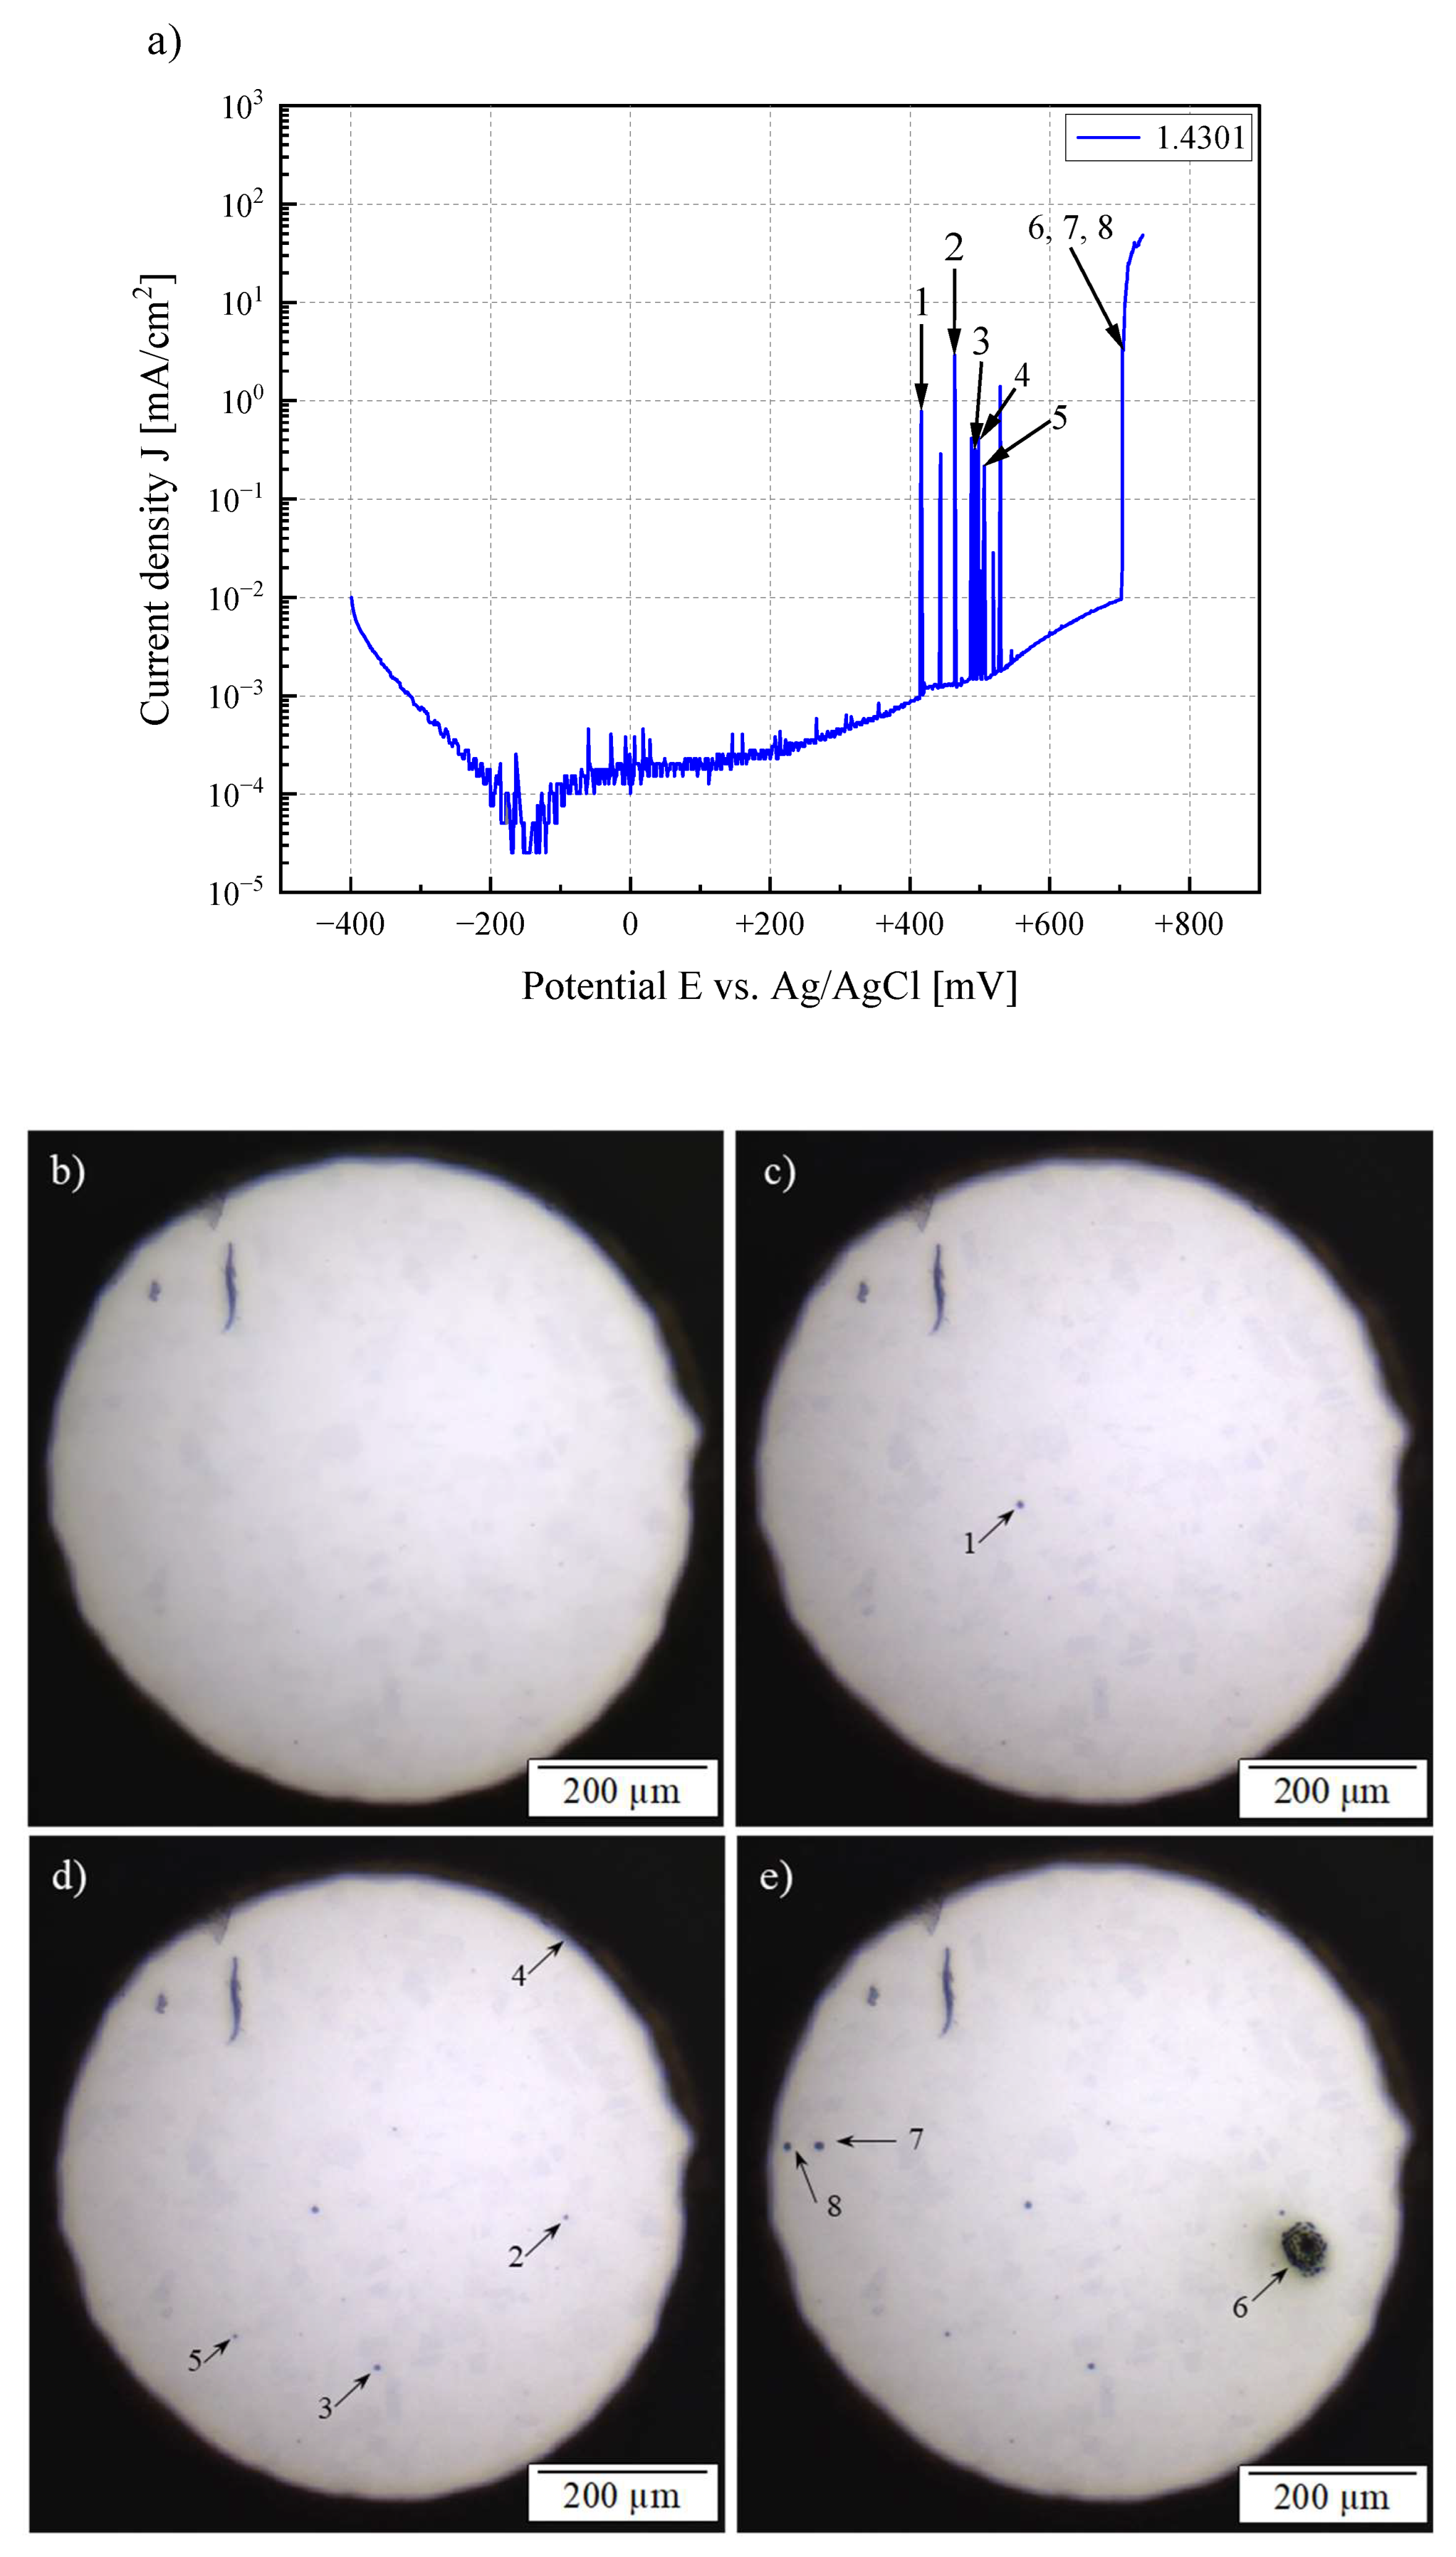
3.2. In Situ Microscopic Analysis

In Figure 5, the current density-potential curve (5a) of the 1.4301 at a chloride ion concentration of 500 mg/L and four frames of the corresponding video (Supplementary Material) are depicted showing the appearance of the tested surface during polarization. The beginning of the video is shown in Figure 5b and was at 220 mV (0 s). Figure 5c shows the tested surface at 416 mV (196 s), Figure 5d after 580 mV (360 s) and Figure 5e after 735 mV (515 s). Analyzing the curve, current peaks could be seen in the passive region just before reaching the pitting corrosion potential. These peaks could only be detected by using the micro-corrosion cell. Due to the small test area, the measured current was much lower compared to the macro-corrosion cell. Therefore, small fluctuations of the measured current could be detected. Such peaks were also recorded for the 1.4301 by Ida et al. who explained the current peaks with metastable pit growth. However, after their experiments, no grown pits could be found on the test surface [21]. The most important advantage of the micro-corrosion cell is that, by analyzing the video recordings and comparing them to the current density-potential curve, a correlation between metastable pit growth and the current peaks could be found. In the current-density curve shown in Figure 5a, in total, 9 peaks were detected.
In Figure 5b, only two surface impurities were found on the test surface. In Figure 5c, next to the two surface impurities, the first evidence of a corrosion pit was found. Figure 5d shows the formation of further small corrosion pits on the test surface. In Figure 5e, various small pits, as well as one large pit, were visible after reaching the abort criterion of 100 µA. Based on the video analysis, the small pits were formed independently of each other at different times. The first pit in the video was detected after 196 s corresponding to a potential of 416 mV, taking into account the start time of the video and the potential change rate of 1 mV/s. Analyzing the measured current density-potential curve, a peak was recorded exactly at 416 mV. The existing pit obviously repassivated because the pit did not grow any further until the end of the measurement proved by the optical inspection, although the potential was continuously increased. In the further course of testing time, additional pits were detected by the optical inspection after 245 s (465 mV), 273 s (493 mV), 279 s (499 mV) and 286 s (506 mV). To each of these specific pits, a corresponding current-density peak in the current density-potential curve was measured. The metastable pits no. 7 and 8, after 493 s (713 mV) and 496 s (716 mV), respectively, occurred in the same time frame in which the current density increased very fast, mainly caused by the fast growth of the stable pit no. 6. Thus, six out of nine detected current peaks could be correlated exactly to the metastable pits imaged by the microscope. The three remaining peaks were also representative for metastable pits, but these were either too small to be detected with the used light microscope or positioned in the edge region close to the adhesive mask, such as pit no. 4, for example.
Figure 6 shows two single frames of the tested surface recorded in situ by an anodic polarization measurement of the 1.4016 sample at a chloride ion concentration of 500 mg/L and the corresponding current density-potential curve (6a). In Figure 6b, only one surface impurity was found on the test surface during polarization. After polarization, only one pit (no. 1) was detected in Figure 6c, which represented a stable pit growth during the polarization. The abort current of 100 µA was reached at a potential of 585 mV. During the entire corrosion testing of this specimen, no further peaks in the current density-potential curve could be detected, in fact no metastable pits existed. This observation was proved by two further tests. Compared to 1.4301, 1.4016 did not show any metastable pit growth.

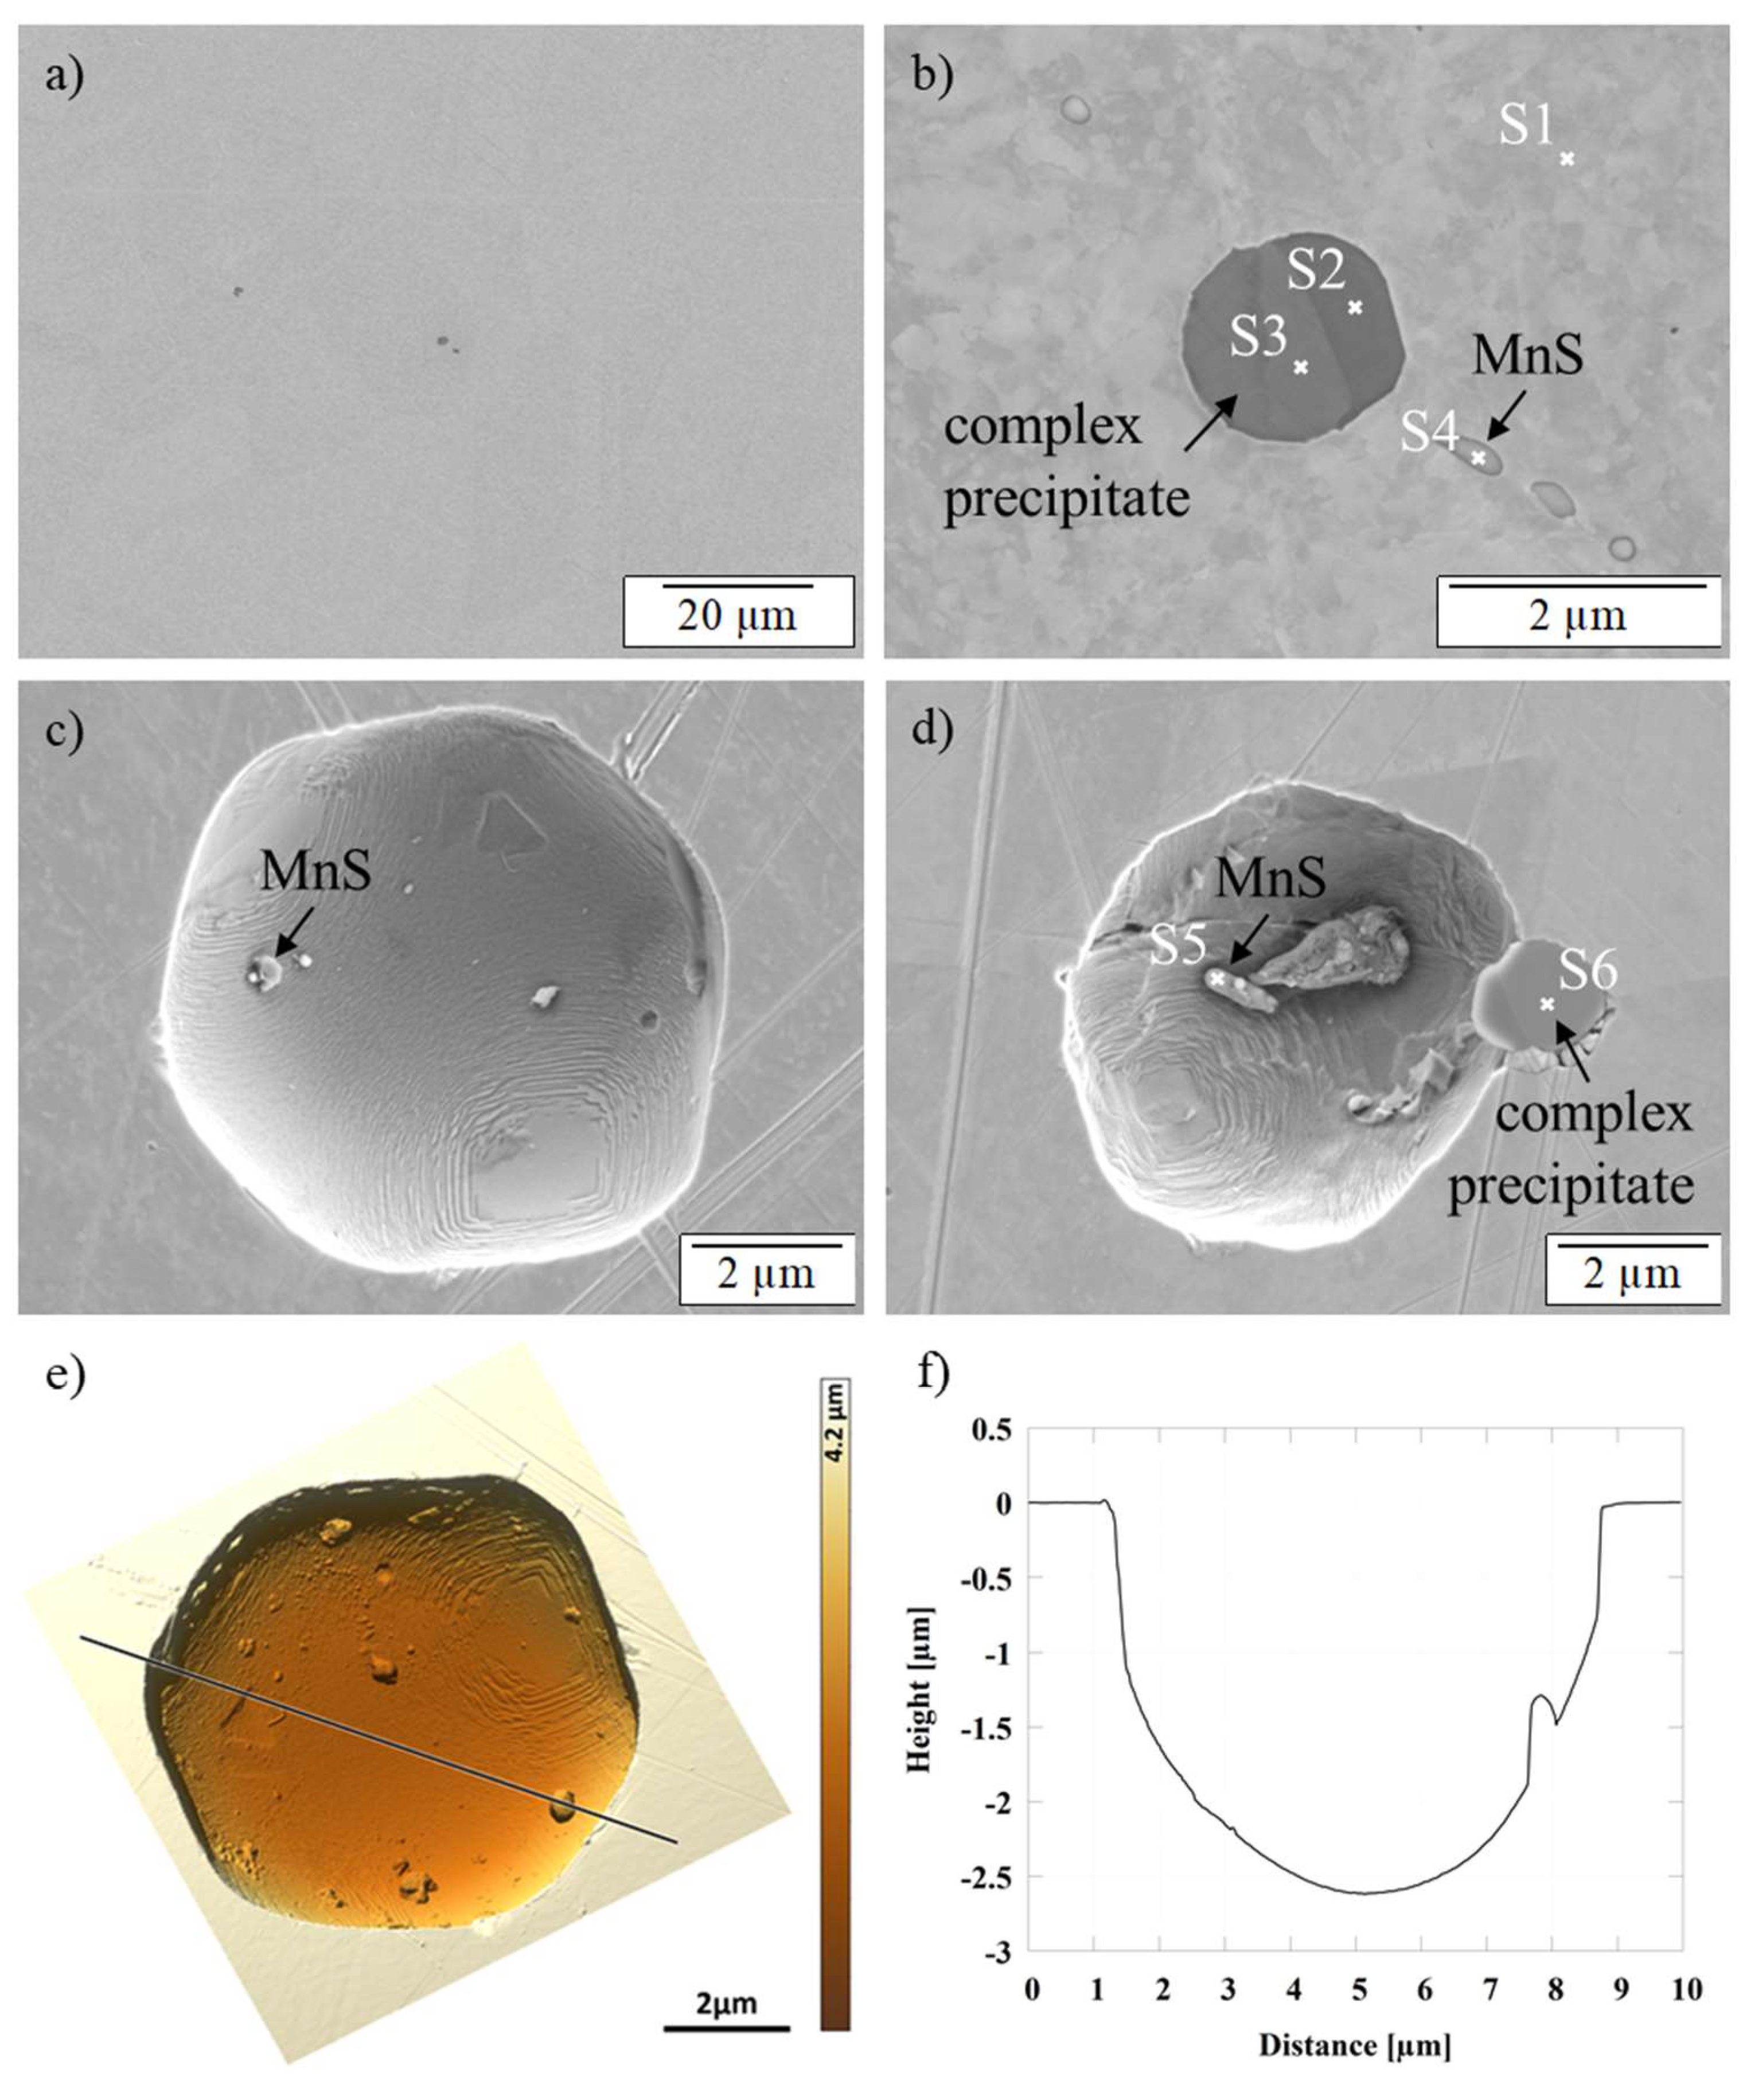
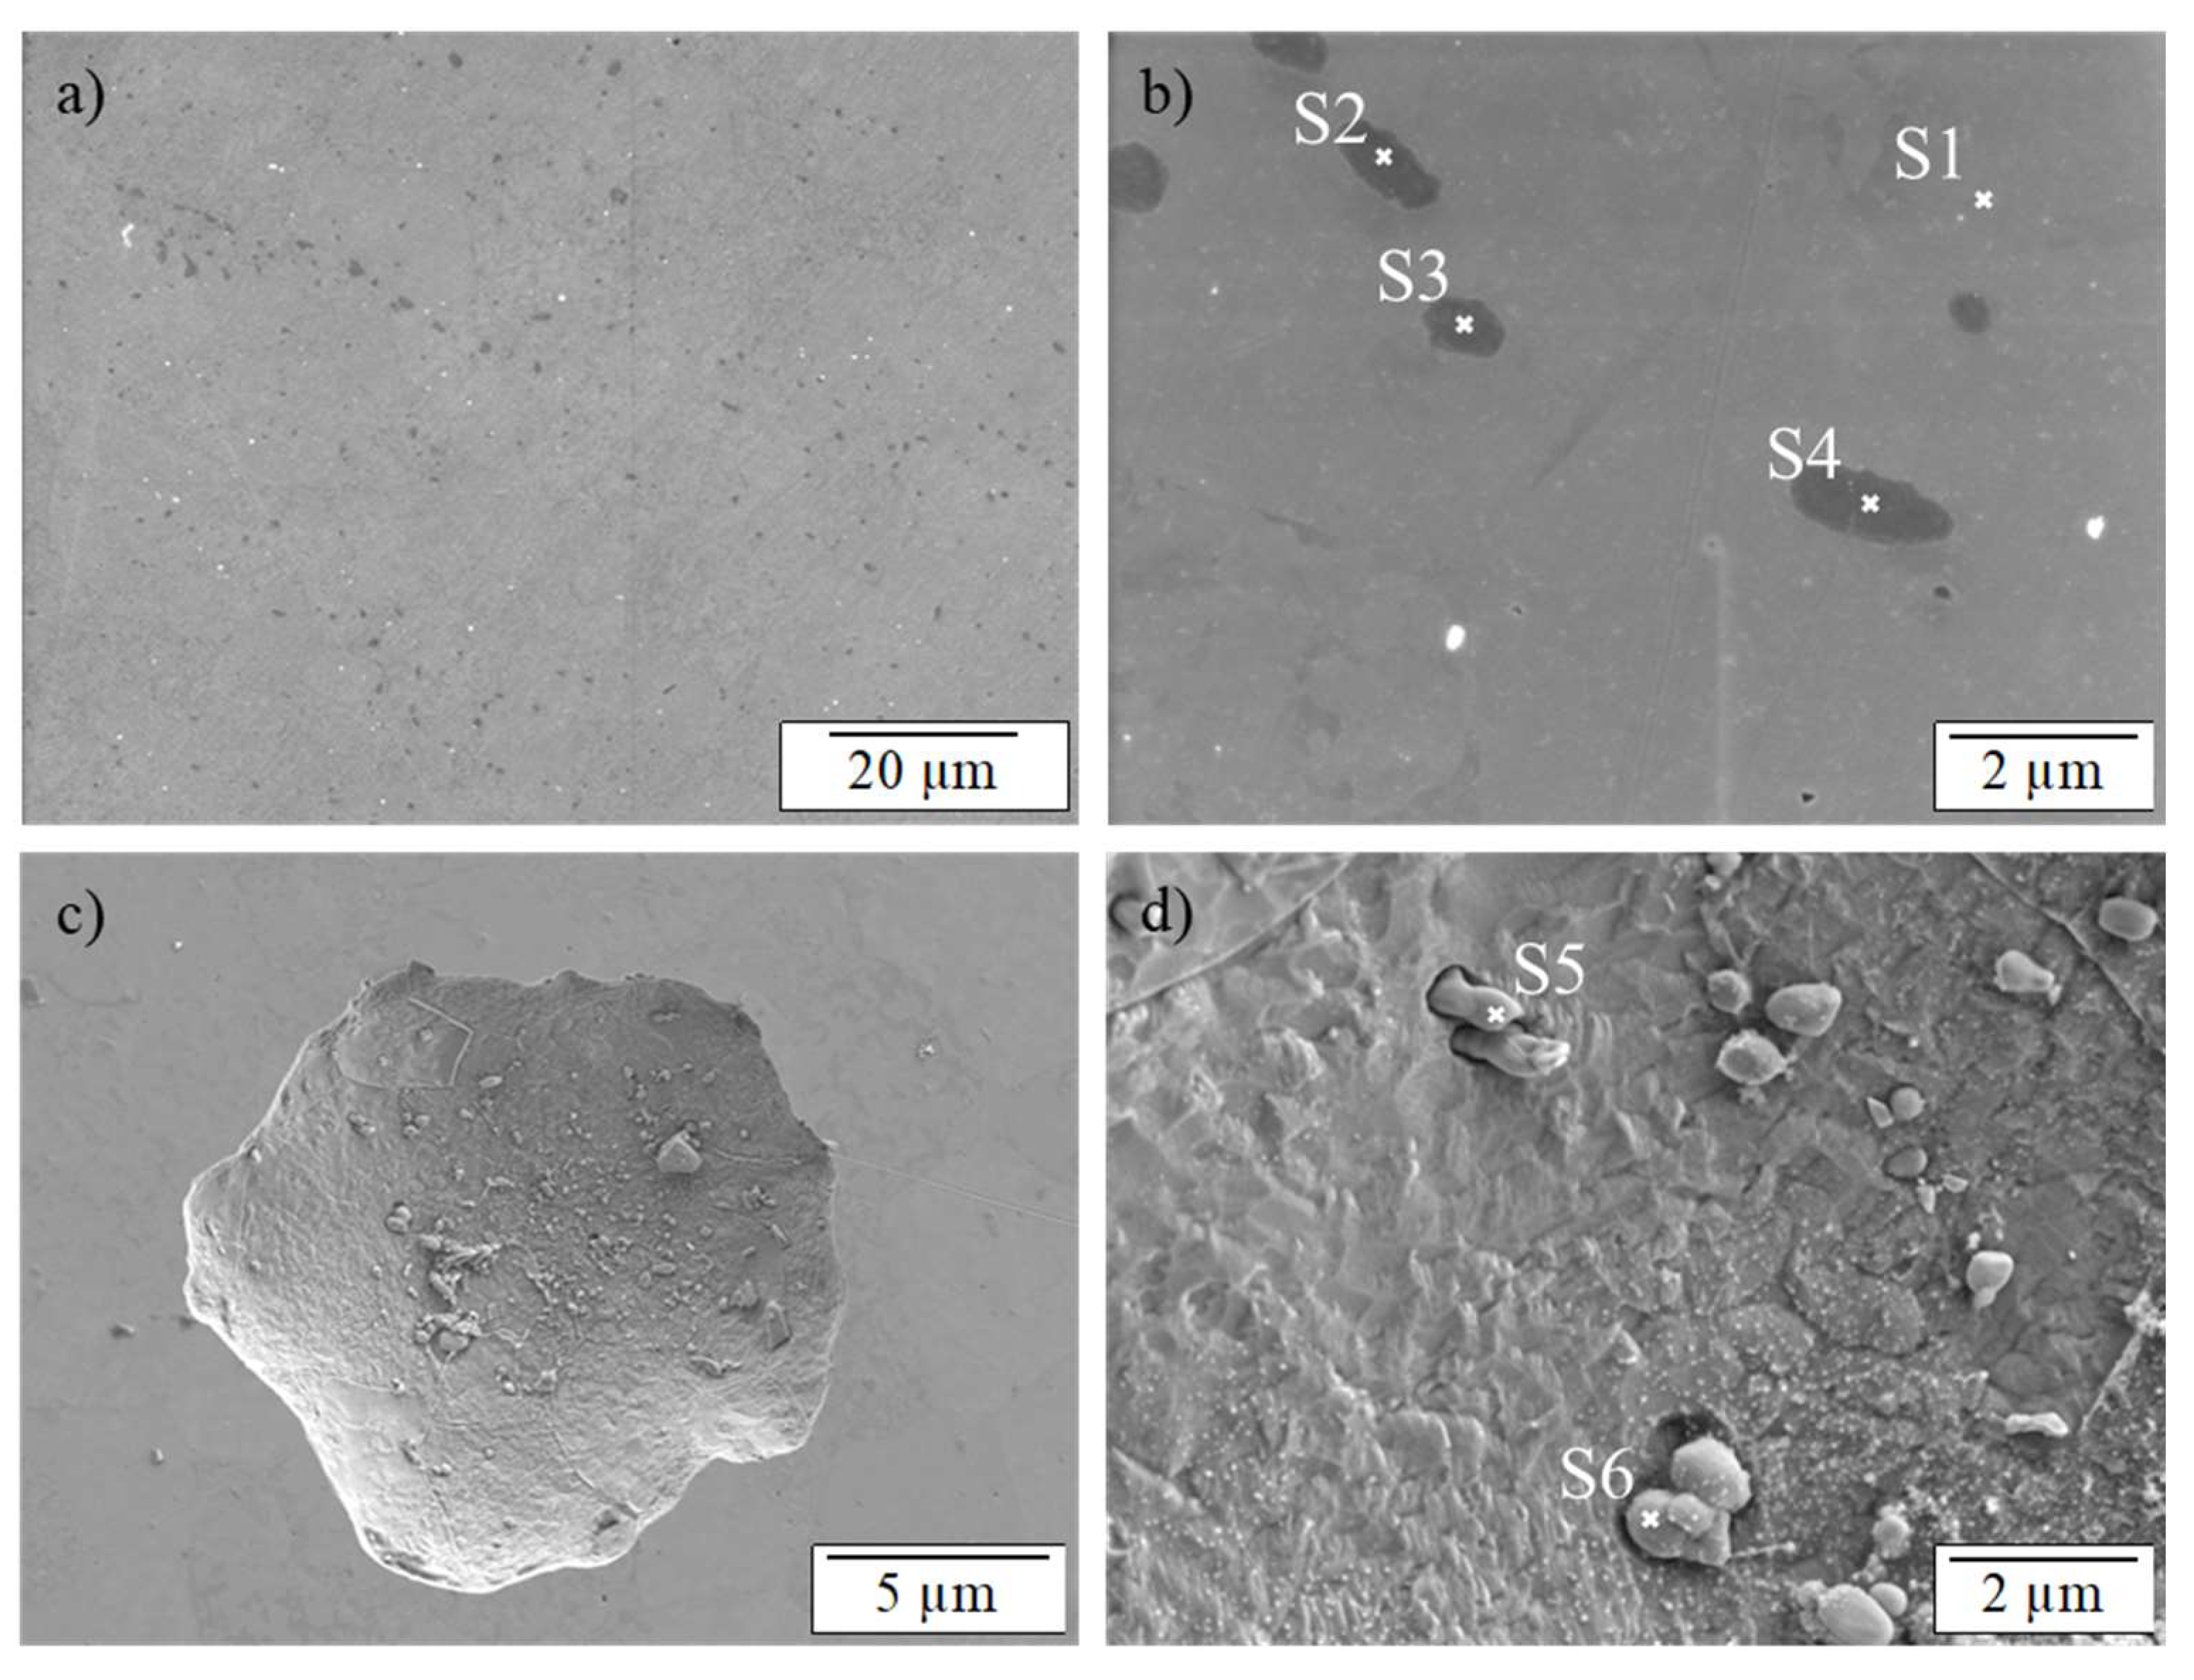
3.3. SEM/EDS and AFM Investigations

With the purpose of characterizing the pitting initiation mechanisms, both materials 1.4301 and 1.4016 were analyzed by SEM and AFM. Within this work, microstructural defects such as inclusions and precipitates were characterized by means of EDS analysis, in order to characterize the initial state of both materials before corrosion testing. In a next step, corroded samples were analyzed using EDS to find correlations between the precipitates and the corrosion phenomena.
Figure 7a shows the distribution of precipitates on the 1.4301 surface after metallographic polishing before testing at 1000× magnification. Only three precipitates were detected within the shown specific area represented by the SEM image. Figure 7b shows two characteristic precipitates of 1.4301. The large precipitate with a size of 1–2 µm in the middle of Figure 7b (S2 + S3) exhibited a structure consisting of two different parts, which will be named “complex precipitate” in this paper. The different chemical composition of this precipitate could be measured by the EDS analysis as shown in Table 3. Based on the EDS results, it could be seen that the dark area S2 of the precipitate contained a significantly larger amount of aluminum, manganese, oxygen and titanium compared to the base material, analyzed in point S1 as a reference. In addition, less carbon, chromium and iron were detected in this precipitate, but no nickel. Generally, the analysis of carbon, chromium and iron could be influenced by EDS measurement itself considering partly the base material as well. According to the EDS analysis, the brighter part S3 of the precipitate contained less carbon, chromium and iron than the darker area S2. Furthermore, the brighter area showed significantly less aluminum and manganese, as well as slightly more oxygen and much more titanium than S2. The fact that the brighter areas were dominated by titanium and oxygen and the darker ones by aluminum and manganese was confirmed by analyzing many other precipitates on the test surface. Most precipitates showed a mixture of bright and dark areas, as discussed before. Tokuda et al. found comparable complex precipitates in 1.4301 with a mixed structure. They explained the dark area (S2) and the bright area (S3) by different aluminum, titanium and manganese oxides (Al2O3, TiO2, MnO2) [25]. Spectrum S4 shows the analysis of one of the small precipitates (approximate 0.5–1 µm) that could be visually distinguished from the larger precipitates. These precipitates were often found near the large ones. The analysis of S4 showed that, in addition to the content of carbon, chromium, iron and nickel picked up by the excitation of the bulk material, a significant amount of manganese and sulfur was found which refers to manganese sulfide precipitates.
Figure 7c,d shows metastable-grown pits after corrosion testing. In Figure 7c, a pit with a hexagonal outer shape is visible. On the left side within the pit, spherical precipitates can be seen, with a size and a shape comparable to the small precipitates identified as manganese sulfide in Figure 7b. Figure 7d shows a metastable grown pit where spherical manganese sulfide precipitates (S5) can be seen inside the pit. In other metastable pits, EDS analysis of the manganese sulfide precipitates revealed a higher copper content as shown in S5. Webb et al., Lillard et al. and Sourisseau et al. have already noticed similar findings and explained them with the formation of a copper layer on the manganese sulfides caused by an anodic polarization. This explanation was confirmed by the fact that the investigated manganese sulfides became larger after polarization than before polarization [16,26,27]. This explains why the manganese sulfides found in the pits remained uncorroded after polarization [15]. In Figure 7d, to the right of the pit, a complex precipitate (S6) can be seen, showing that a corrosion process occurred mainly around this precipitate. Radojkovich et al. found comparable results showing that the initiation point of the pitting corrosion of the 1.4301 stainless steel was located at the boundary between the manganese sulfide and the base material [28]. In addition to the manganese sulfides, in the work of Radojkovich et al., complex precipitates were detected as well, which also represented an initiation point of pitting corrosion. This leads to the main conclusion that the corrosion initiation is located at the boundary between the precipitates and the base material. During the anodization process, the area around the precipitate corrodes, and the precipitate may fall out of the pit during or after the testing. This assumption is supported by Figure 7c, noting the fact that many of the metastable pits had an outer shape similar to the complex precipitates. It is assumed that this shape of the pits was formed during the corrosion process around the precipitates, which had a final outer shape similar to the complex precipitates.
After the SEM/EDS analysis of the 1.4301, AFM measurements were performed to determine the exact morphology of the formed metastable pits, including the determination of the depth and the volume of each of the eight pits that developed (Figure 7e,f). The average maximum depth of the metastable grown pits was 2.4 ± 0.3 µm, the average equivalent disc diameter 6.4 ± 1.1 µm and the average volume 52 ± 28 µm3. This corresponds to a material loss of 0.4 ± 0.2 ng per pit (ρ1.4301 = 7.9 kg/dm3). The resolution of such a minute material loss, together with the correlation to the current peaks of the polarization curve, underlines the indispensable usefulness of the micro-corrosion cell for corrosion investigations. It should be noted that the depth was about 2.7 times smaller than the diameter of each metastable grown pit, suggesting that the pits were growing faster in width than in depth.
Figure 8 shows the SEM images taken at selected areas on 1.4016 before and after corrosion testing at 1000× magnification. Figure 8a presents the distribution of precipitates on the 1.4016 sample. In contrast to the complex precipitates of 1.4301, significantly more precipitates could be detected on the entire surface of the 1.4016. More than 100 small (app. 1–2 µm) precipitates were detected within the area shown in Figure 8a.
Due to the face-centered cubic (fcc) lattice structure, the austenitic stainless steels, so-called Cr-Ni steels, can dissolve about 100 times more carbon than the body-centered cubic (bcc) lattice of the ferritic stainless steels. Thus, compared to ferritic steels, Cr-Ni steels show less formation of corrosion-promoting chromium carbides, which can cause chromium depletion adjacent to the grain boundaries. This chromium depletion area can result in an intergranular corrosion, due to the lower level of corrosion resistance of this area around the chromium carbides [29]. Because of the much lower carbon solubility of the body-centered lattice, the carbon content is responsible for the formation of pitting corrosion-promoting chromium carbides in 1.4016. In addition, the body-centered lattice is characterized by a very high diffusion rate of dissolved atoms, which promotes the formation of chromium carbides [29].
Figure 8b shows an enlarged view of the characteristic precipitates of 1.4016 which were analyzed by EDS. The EDS results of all four locations are given in Table 4. Spectrum S1 represents the base material and S2–S4 show the characteristic precipitates. It should be noted that particularly high amounts of chromium and carbon were found in all three precipitates, which identified them as corrosion-promoting chromium carbides. In addition, a relatively high amount of nitrogen was detected, indicating the presence of chromium carbonitrides as well. Further investigations of the 1.4016 sample confirmed the presence of chromium carbides and chromium carbonitrides. Figure 8c shows a grown pit on a 1.4016 surface and Figure 8d shows an enlarged section of the pit surface. Some precipitates were found in the base material adjacent to the surface of the pit, classified as chromium carbides (S6) or chromium carbonitrides (S5) according to the EDS analysis. The dark areas around these precipitates could be attributed to a potential loss of base material caused by the pitting corrosive damage.
Both materials showed significant differences in manganese, chromium, molybdenum, nickel, copper and titanium content. The clearly higher manganese content in the 1.4301 was particularly remarkable. Generally, manganese and sulfur form MnS precipitates, which represent potential corrosion starting points [21]. They have a very high specific conductivity, which favors electrode processes and thus corrosive events. In addition, copper deposits can be formed on the MnS precipitates as a result of anodic polarization, which refine the sulfides and transform them into a local cathode compared to the base material [26].

4. Conclusions

In summary, the newly developed micro-corrosion cell provided comparable results in the current density-potential curve as the classic macro-corrosion cell, except the pitting corrosion potential (Epit). For this validation, different diameters of the test area were investigated on austenitic 1.4301 and ferritic 1.4016 stainless steels. A diameter of 11.28 mm was investigated by the macro-corrosion cell, while the micro-corrosion cell used test areas with a diameter of 4 mm and of 0.5 mm. The results showed a clear relationship between the pitting corrosion potential (Epit) and the diameter of the test area. As the diameter of the test area was increased, the pitting potential decreased, while the corrosion potentials (Ecorr) remained at a similar level. The main advantages of the micro-corrosion cell are that small fluctuations in the current density-potential curve can be detected and that a real-time in situ optical observation is possible. Based on the in situ observation, a complete video of the test area can be recorded, showing the pit initiation and growth which can be directly correlated with the electrochemical measurement results (current density-potential curve). Analyzing the current density-potential curves of 1.4301 measured with the micro-corrosion cell, peaks of the current were detected. These peaks could be confirmed within this work as being responsible for metastable pit growth. AFM measurements enabled a quantitative topographical characterization of the metastable pits formed on the 1.4301 surface and showed an average material loss of 0.4 ng per pit.
The phenomenon of metastable pit growth was not detected in 1.4016, only stable pit growth was identified. In addition, both materials were examined by SEM/EDS analysis, with the finding that 1.4016 contained more precipitates than 1.4301.
The EDS analysis of the manganese sulfide precipitates in the 1.4301 showed that they became richer in copper after anodic polarization and operated as a local cathode. Furthermore, the precipitates in 1.4016 showed very high chromium contents leading to a chromium depletion of the surrounding areas.

Supplementary Materials

The following supporting information can be downloaded at: https://www.mdpi.com/article/10.3390/cmd4010007/s1.

Author Contributions

All authors made a significant contribution. Conceptualization, S.K. and A.S.; methodology, S.K. and T.K.; software, S.K.; validation, S.K., A.S. and Y.S.; formal analysis, Y.S., S.K., M.K. and J.C.; investigation, Y.S., S.K., M.K. and J.C.; resources, S.K.; data curation, S.K.; writing—original draft preparation, S.K., Y.S. and J.C.; writing—review and editing, S.K., J.C., T.K., D.A. and A.H.; visualization, S.K. and J.C.; supervision, S.K. and T.K.; project administration, T.K., A.H. and D.A.; funding acquisition, T.K., A.H. and D.A. All authors have read and agreed to the published version of the manuscript.

Funding

We would like to express our special thanks to the European Regional Development Fund (34.EFRE-0300151) for funding this research project (Center for Interdisciplinary Materials Research and Technology Development). The publication was funded by Deutsche Forschungsgemeinschaft (DFG, German Research Foundation)-490988677-and Bielefeld University of Applied Sciences.

Data Availability Statement

The data presented in this study are available from the corresponding authors on request.

Conflicts of Interest

The authors declare no conflict of interest. The funders had no role in the design of the study; in the collection, analyses, or interpretation of data; in the writing of the manuscript.

References

  1. Kumar, A.M.; Adesina, A.Y.; Veeramani, J.; Rahman, M.M.; Nirmal Ram, J.S. Hybrid Polyurethane/Polypyrrole Composite Coatings on Passivated 316L SS for Surface Protective Action against Corrosion in Saline Medium. Corros. Mater. Degrad. 2022, 3, 612–627. [Google Scholar] [CrossRef]
  2. DIN EN 10088-1; Stainless Steels—Part 1: List of Stainless Steels; German Version. European Committee for Standardization: Brüssel, Belgium, 2014.
  3. Loto, R.T.; Mater, J. Pitting corrosion evaluation of austenitic stainless steel type 304 in acid chloride media. J. Mater. Environ. Sci. 2013, 4, 448–459. [Google Scholar]
  4. Frankenthal, P.; Kruger, J. Passivity of Metals. In Proceedings of the 4th International Symposium on Passivity, The Electrochemical Society, Airlie House Conference Center, Warrenton, VA, USA, 17–21 October 1977. [Google Scholar]
  5. Elsener, B.; Fantauzzi, M.; Rossi, A. Stainless steels: Passive film composition, pitting potentials, and critical chloride content in concrete. Mater. Corros. 2020, 71, 797–807. [Google Scholar] [CrossRef]
  6. McBee, C.L.; Kruger, J. Nature of passive films on iron-chromium alloys. Electrochim. Acta 1972, 17, 1337–1341. [Google Scholar] [CrossRef]
  7. Akpanyung, K.V.; Loto, R.T. Pitting corrosion evaluation: A review. J. Phys. Conf. Ser. 2019, 1378, 022088. [Google Scholar] [CrossRef]
  8. Bohni, H. Localized corrosion of passive metals. In Uhlig’s Corrosion Handbook, 3rd ed.; Winston Revie, R., Ed.; John Wiley & Sons, Inc.: Hoboken, NJ, USA, 2011; pp. 157–169. [Google Scholar]
  9. Brownlie, F.; Hodgkiess, T.; Pearson, A.; Galloway, A. Electrochemical Evaluation of the Effect of Different NaCl Concentrations on Low Alloy- and Stainless Steels under Corrosion and Erosion-Corrosion Conditions. Corros. Mater. Degrad. 2022, 3, 101–126. [Google Scholar] [CrossRef]
  10. Williams, D.E.; Zhu, Y.Y. Explanation for Initiation of Pitting Corrosion of Stainless Steels at Sulfide Inclusions. J. Electrochem. Soc. 2000, 147, 1763–1766. [Google Scholar] [CrossRef]
  11. Örnek, C.; Davut, K.; Kocabas, M.; Bayatlı, A.; Ürgen, M. Understanding Corrosion Morphology of Duplex Stainless Steel Wire in Chloride Electrolyte. Corros. Mater. Degrad. 2021, 2, 397–411. [Google Scholar] [CrossRef]
  12. Soltis, J. Passivity breakdown, pit initiation and propagation of pits in metallic materials—Review. Corros. Sci. 2015, 90, 5–22. [Google Scholar] [CrossRef]
  13. Strehblow, H.H. Nucleation and Repassivation of Corrosion Pits for Pitting on Iron and Nickel. Mater. Corros 1976, 27, 792–799. [Google Scholar] [CrossRef]
  14. Suter, T.; Böhni, H. Microelectrodes for corrosion studies in microsystems. Electrochim. Acta 2001, 47, 191–199. [Google Scholar] [CrossRef]
  15. Muto, I.; Kurokawa, S.; Hara, N. Microelectrochemical Investigation of Anodic Polarization Behavior of CrS Inclusions in Stainless Steels. J. Electrochem. Soc. 2009, 156, C395–C399. [Google Scholar] [CrossRef]
  16. Webb, E.G.; Alkire, R.C. Pit Initiation at Single Sulfide Inclusions in Stainless Steel: I. Electrochemical Microcell Measurements. J. Electrochem. Soc. 2002, 149, B272–B279. [Google Scholar] [CrossRef]
  17. Stewart, J.; Williams, D.E. The initiation of pitting corrosion on austenitic stainless steel: On the role and importance of sulphide inclusions. Corros. Sci. 1992, 33, 457–474. [Google Scholar] [CrossRef]
  18. Streicher, M.A.; Grubb, J.F. Austenitic and Ferritic Stainless Steels. In Uhlig’s Corrosion Handbook, 3rd ed.; Winston Revie, R., Ed.; John Wiley & Sons, Inc.: Hoboken, NJ, USA, 2011; pp. 657–693. [Google Scholar]
  19. Xie, Y.; Ju, Y.; Toku, Y.; Morita, Y. Fabrication of Fe2O3 nanowire arrays based on oxidation-assisted stress-induced atomic-diffusion and their photovoltaic properties for solar water splitting. RSC Adv. 2017, 7, 30548–30553. [Google Scholar] [CrossRef]
  20. Nečas, D.; Klapetek, P. Gwyddion: An open-source software for SPM data analysis. Cent. Eur. J. Phys. 2012, 10, 181–188. [Google Scholar] [CrossRef]
  21. Ida, N.; Muto, I.; Sugawara, Y.; Hara, N. Local Electrochemistry and In Situ Microscopy of Pitting at Sensitized Grain Boundary of Type 304 Stainless Steel in NaCl Solution. J. Electrochem. Soc. 2017, 164, C779–C787. [Google Scholar] [CrossRef]
  22. Kiremit, S.; Stallmeier, Y.; Klöcker, M.; Kordisch, T. Analysis of the corrosion behavior of stainless steel in aqueous electrolyte with different compositions. In Proceedings of the Tagung Werkstoffprüfung 2020, Online, 3–4 December 2020. [Google Scholar]
  23. Ibrahim, M.A.M.; Abd El Rehim, S.S.; Hamza, M.M. Corrosion behavior of some austenitic stainless steels in chloride environments. Mater. Chem. Phys. 2009, 115, 80–85. [Google Scholar] [CrossRef]
  24. Malik, A.U.; Mayan Kutty, P.C.; Siddiqi, N.A.; Andijani, I.N.; Ahmed, S. The influence of pH and chloride concentration on the corrosion behaviour of AISI 316L steel in aqueous solutions. Corros. Sci. 1992, 33, 1809–1827. [Google Scholar] [CrossRef]
  25. Tokuda, S.; Muto, I.; Sugawara, Y.; Hara, N. Pit initiation on sensitized Type 304 stainless steel under applied stress: Correlation of stress, Cr-depletion, and inclusion dissolution. Corros. Sci. 2020, 167, 108506. [Google Scholar] [CrossRef]
  26. Lillard, R.S.; Kashfipour, M.A.; Niu, W. Pit Propagation at the Boundary between Manganese Sulfide Inclusions and Austenitic Stainless Steel 303 and the Role of Copper. J. Electrochem. Soc. 2016, 163, C440–C451. [Google Scholar] [CrossRef]
  27. Sourisseau, T.; Chauveau, E.; Baroux, B. Mechanism of copper action on pitting phenomena observed on stainless steels in chloride media. Corros. Sci. 2005, 47, 1097–1117. [Google Scholar] [CrossRef]
  28. Radojković, B.; Kovačina, J.; Jegdić, B.; Bobić, B.; Alić, B.; Marunkić, D.; Simović, A. Influence of inhibitors on the corrosion behavior of welded joint X5CrNi18 10 stainless steel. Mater. Corros. 2021, 72, 694–707. [Google Scholar] [CrossRef]
  29. Sumita, M.; Hanawa, T.; Teoh, S.H. Development of nitrogen-containing nickel-free austenitic stainless steels for metallic biomaterials—Review. Mater. Sci. Eng. C 2004, 24, 753–760. [Google Scholar] [CrossRef]
Figure 1. Schematic representation of a three-electrode macro-corrosion cell consisting of a working electrode (WE), reference electrode (RE), counter electrode (CE) and a potentiostat, own figure according to [19].
Cmd 04 00007 g001
Figure 2. Exploded drawing (a) and optical image (b) of the micro-corrosion cell consisting of a working electrode (WE) (2, 3, 4), reference electrode (RE) (8), counter electrode (CE) (7), sealing ring (6), upper part (5), mask (4), brass electrode (3), specimen (2) and a bottom part (1).
Cmd 04 00007 g002
Figure 3. Representative current-potential curves (a) and current density-potential curves (b) for different diameters of the test area of the 1.4016 at a chloride ion concentration of 500 mg/L.
Cmd 04 00007 g003
Figure 4. Bar chart of 1.4301 and 1.4016 representing the mean pitting and corrosion potential for different diameters of the test area based on three repeated tests for each condition. A = 11.28 mm; B = 4 mm, C = 0.5 mm and two different chloride ion concentrations of 500 mg/L and 3000 mg/L.
Cmd 04 00007 g004
Figure 5. Electrochemical results and four frames out of a video of the in situ microscopic analysis of the 1.4301 at a chloride ion concentration of 500 mg/L and a test area diameter of 0.5 mm. (a) Current density-potential curve; (b) start of the video at 0 s (220 mV); (c) video after 196 s (416 mV); (d) video after 360 s (580 mV); (e) video after 515 s (735 mV).
Cmd 04 00007 g005
Figure 6. Electrochemical results and two frames out of a video of the in situ microscopic analysis of the 1.4016 at a chloride ion concentration of 500 mg/L and a test area diameter of 0.5 mm. (a) Current density-potential curve, (b) start of the video 0 s (225 mV); (c) after 360 s at the end of the video (585 mV).
Cmd 04 00007 g006
Figure 7. SEM image of the 1.4301 taken by the SE detector (secondary electron detector). (a,b) show precipitates on a not tested specimen; (c,d) show metastable pits after corrosion testing; (e) represents a shaded AFM height image of the pit shown in (c), the black line indicates the position of the height profile depicted in (f).
Cmd 04 00007 g007
Figure 8. SEM image of the 1.4016 taken using the in-lens detector. (a,b) show chromium carbide/carbonitrides precipitates of a not-tested specimen; (c) a stable corrosion pit; (d) a view inside the pit shown in (c).
Cmd 04 00007 g008
Table 1. Chemical composition of the 1.4301–X5CrNi18-10 and the 1.4016–X6Cr17 in wt%.
MaterialCSiMnPSCrMoNiCuTiN
1.43010.04570.44941.530.04380.001617.770.33539.160.31430.01050.0555
1.40160.06110.42390.32480.0309<0.001015.960.05720.45930.15280.00470.0458
Table 2. Mean values of the corrosion potential (Ecorr) and the corresponding current density (Jcorr) of the 1.4301 and 1.4016 for different diameters of the test area based on three repeated tests for each condition. A = 11.28 mm; B = 4 mm, C = 0.5 mm and two different chloride ion concentrations of 500 mg/L and 3000 mg/L.
MaterialTafel-Line
Values
500 mg/L Cl3000 mg/L Cl
11.28 mm4 mm0.5 mm11.28 mm4 mm0.5 mm
1.4301Ecorr [mV]−167−192−190−166−159−168
Jcorr [mA/cm2]1.91 × 10−41.45 × 10−54.68 × 10−51.28 × 10−41.34 × 10−53.93 × 10−5
1.4016Ecorr [mV]−158−224−206−177−135−197
Jcorr [mA/cm2]7.30 × 10−52.24 × 10−55.08 × 10−59.40 × 10−51.19 × 10−54.81 × 10−5
Table 3. Selected results of the EDS analysis of the points S1–S6 in Figure 7b, wt% assumed with relative scatter of ±5%.
SpectrumAl CCrCuFeMnNiOSTi
S10617063211000
S2153120122502706
S3226058033044
S405131338174090
S50511363054090
S6128576028139
Table 4. Selected results of the EDS analysis of the points S1–S6 in Figure 8b, wt% assumed with relative scatter of ±5%.
SpectrumC CrFeN
S1219790
S2147178
S31164177
S4108109
S5442456
S6752390
Disclaimer/Publisher’s Note: The statements, opinions and data contained in all publications are solely those of the individual author(s) and contributor(s) and not of MDPI and/or the editor(s). MDPI and/or the editor(s) disclaim responsibility for any injury to people or property resulting from any ideas, methods, instructions or products referred to in the content.

