
Investigation via Electron Microscopy and Electrochemical Impedance Spectroscopy of the Effect of Aqueous Zinc Ions on Passivity and the Surface Films of Alloy 600 in PWR PW at 320 °C

Abstract
:1. Introduction
2. Materials and Methods
2.1. Materials and High-Temperature, High-Pressure Test Facility
2.2. Electrochemical Measurements
2.3. SEM and TEM/EDS
3. Results
3.1. Electron Microscopy
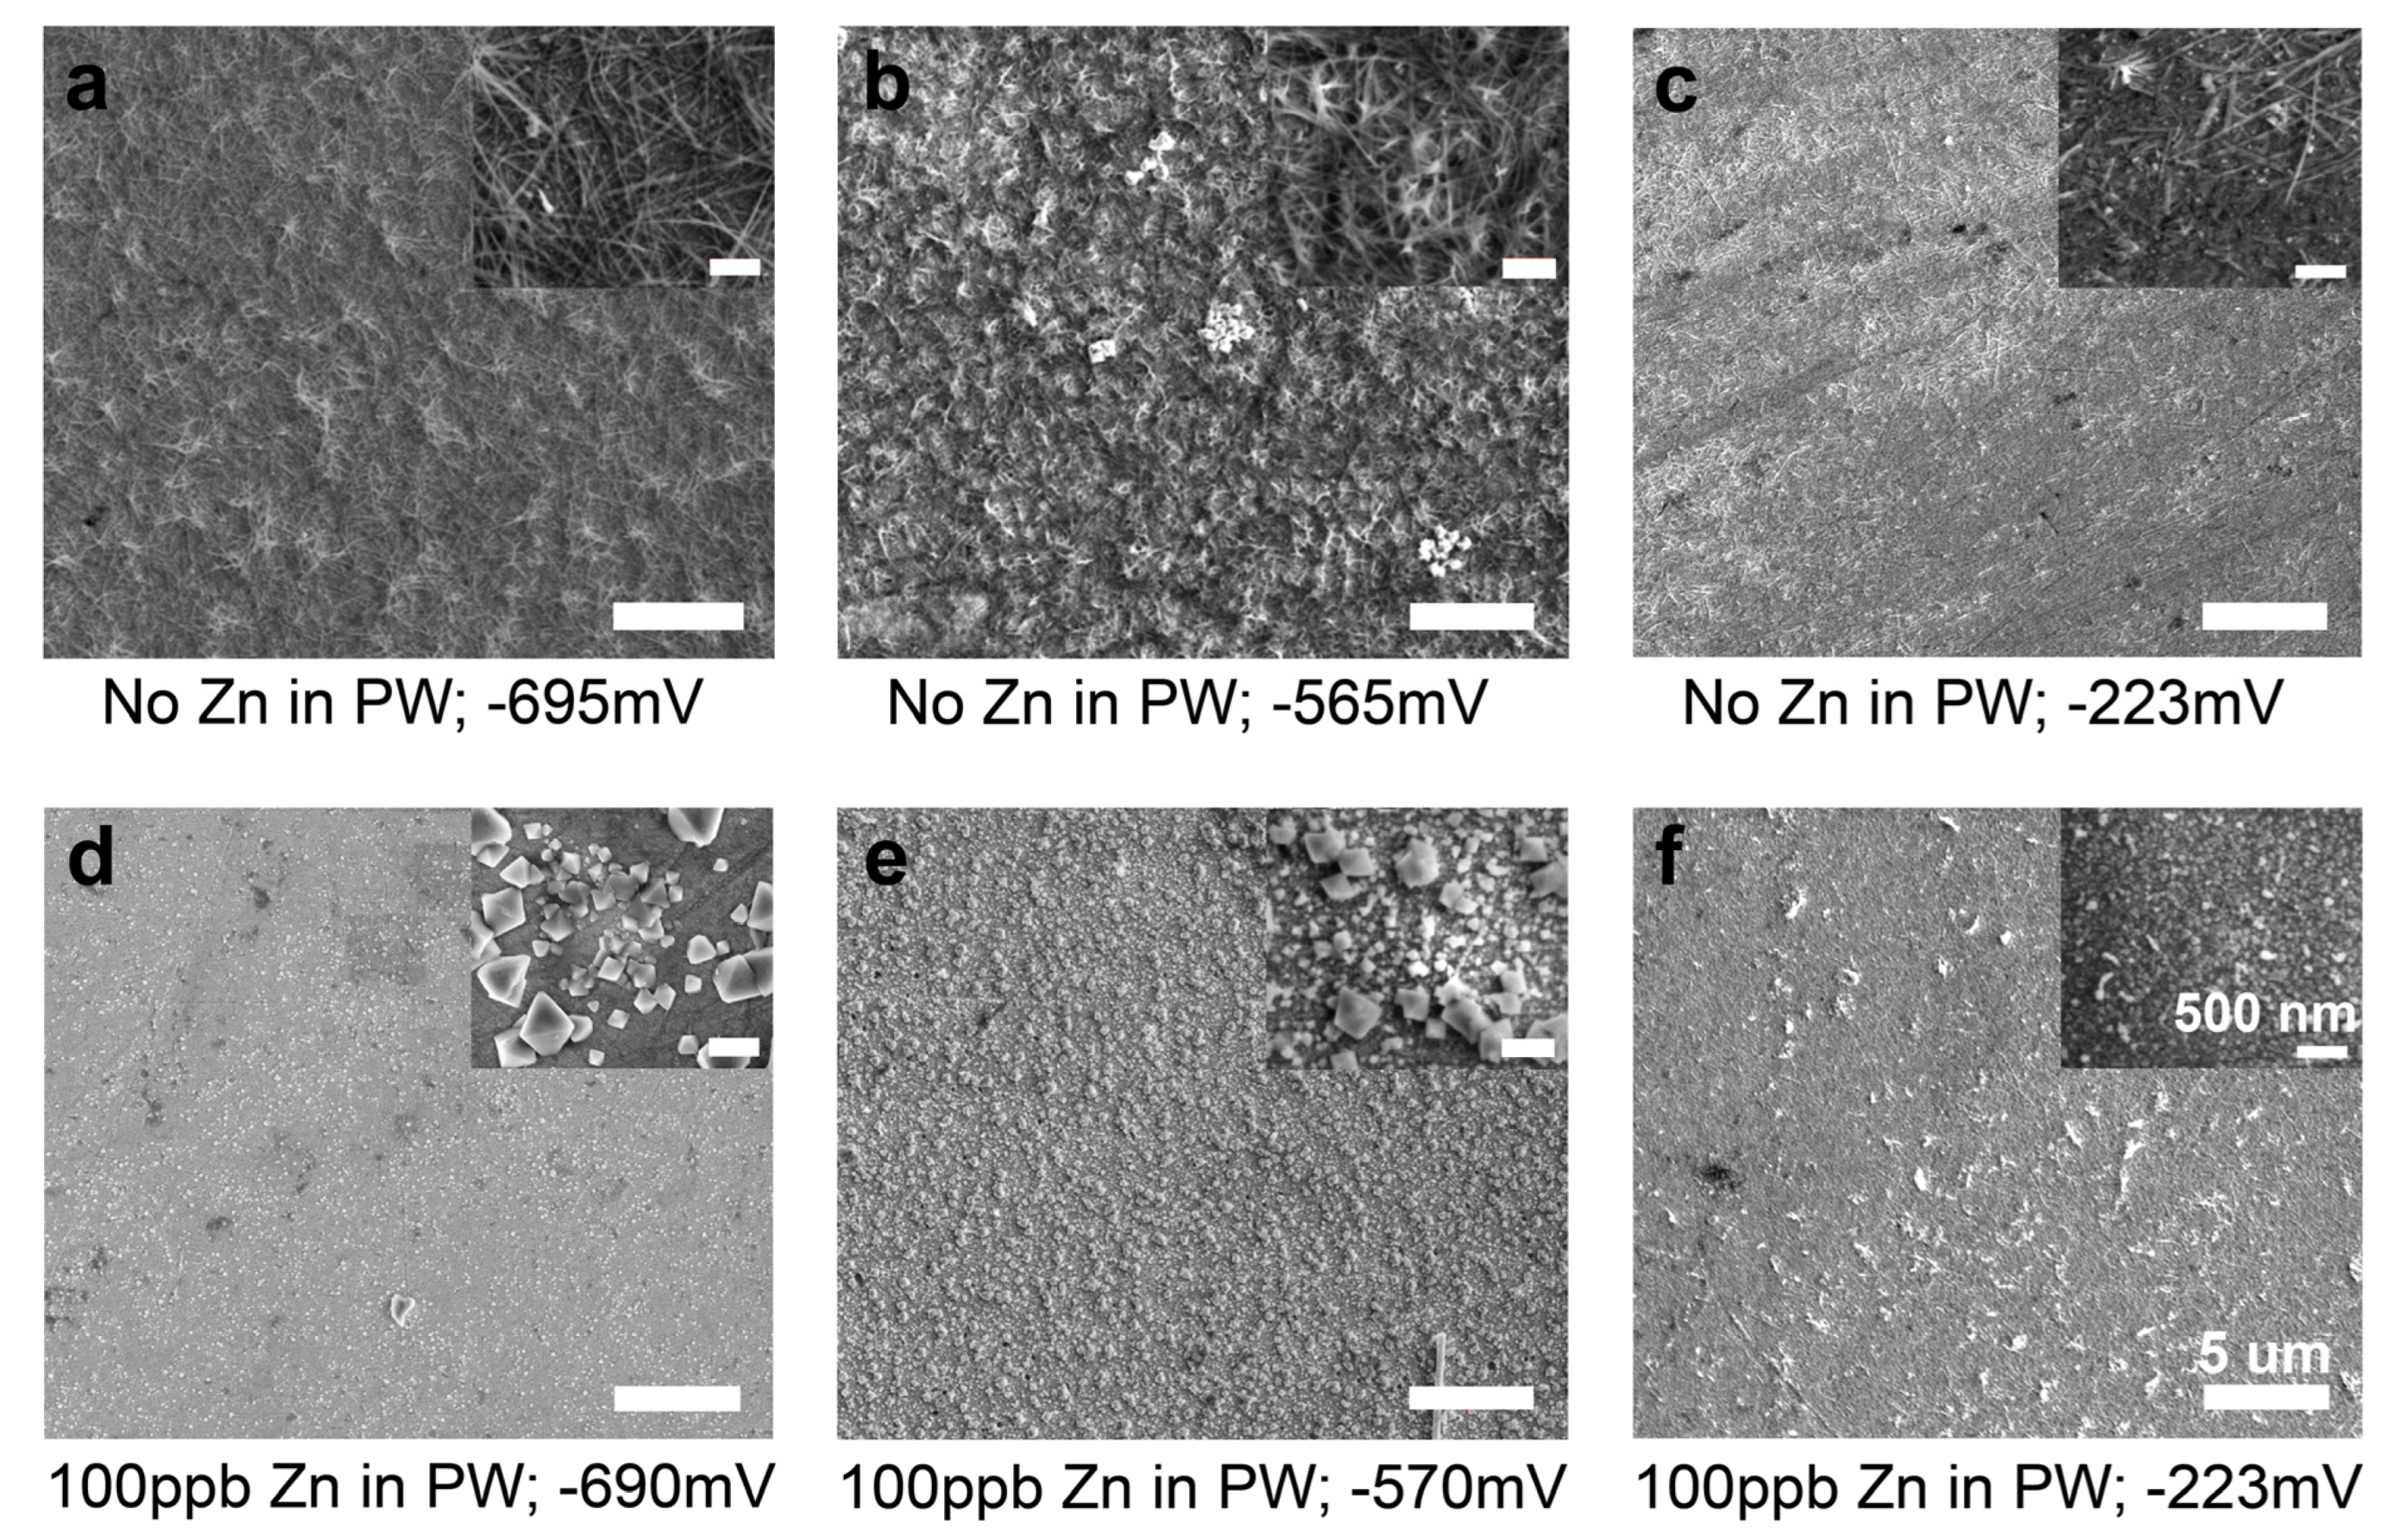
3.1.1. Outer Layer—SEM Results
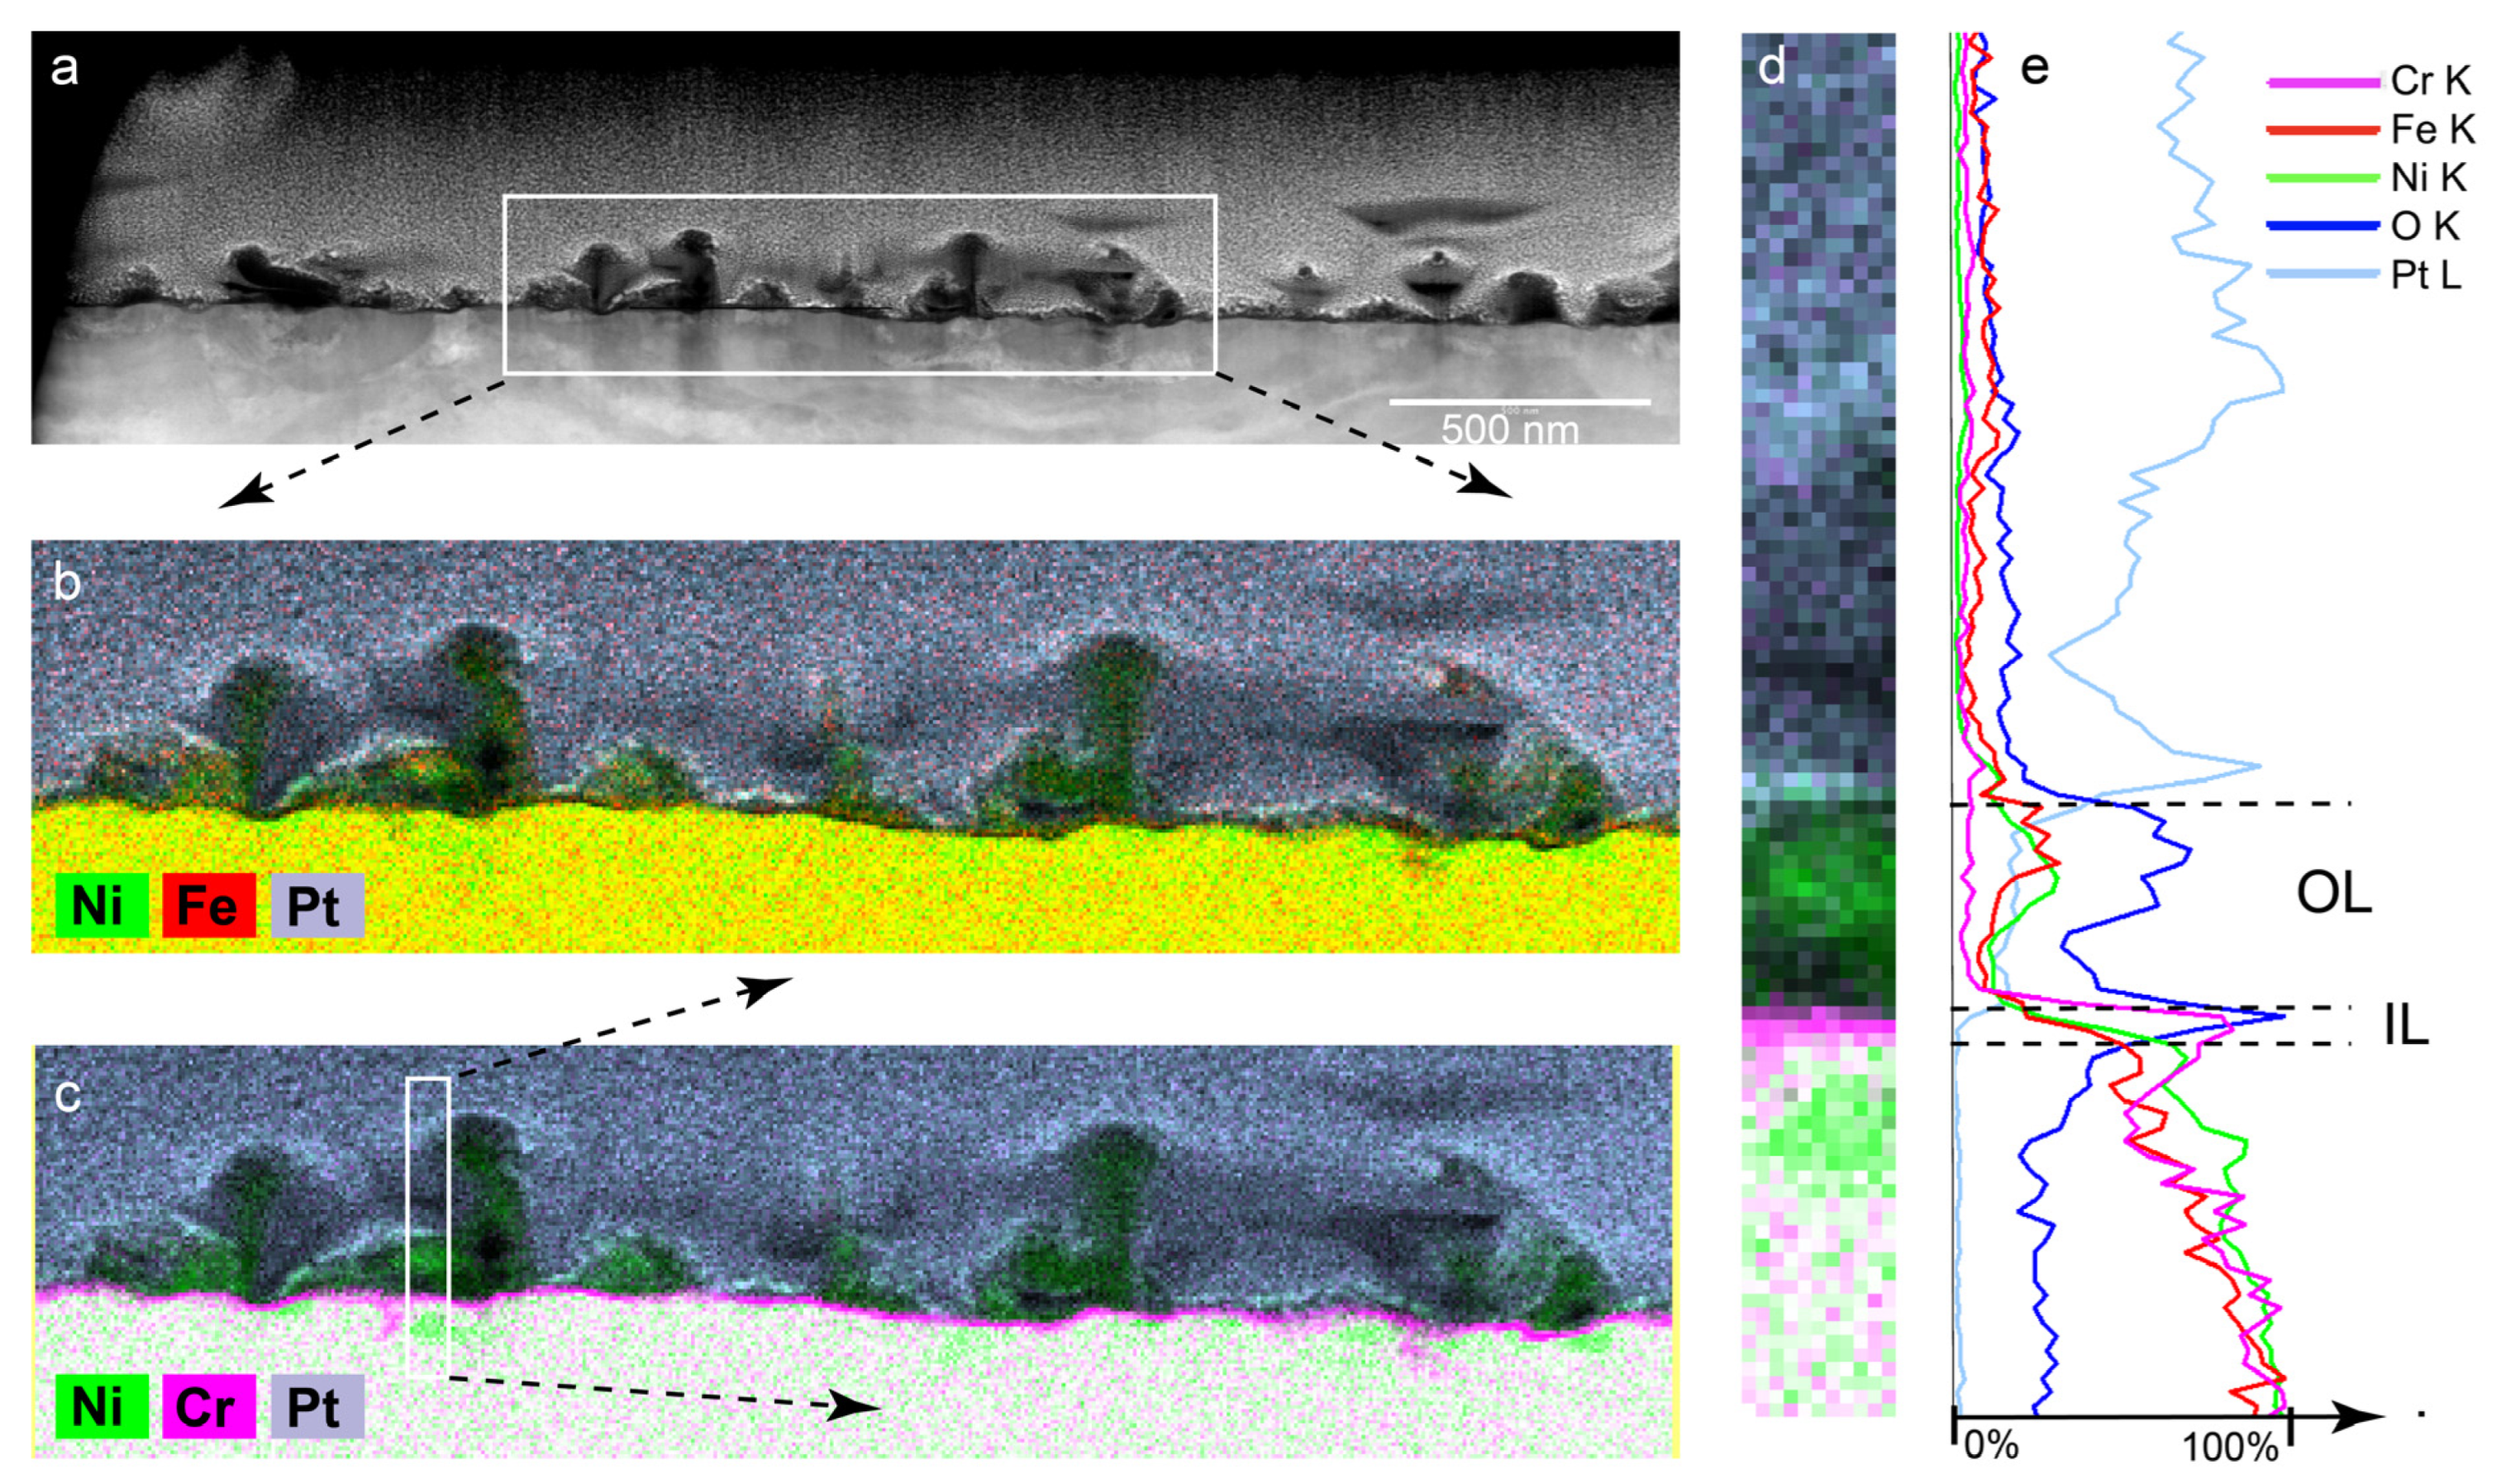
3.1.2. Outer Layer—TEM Results PWR PW no Zn
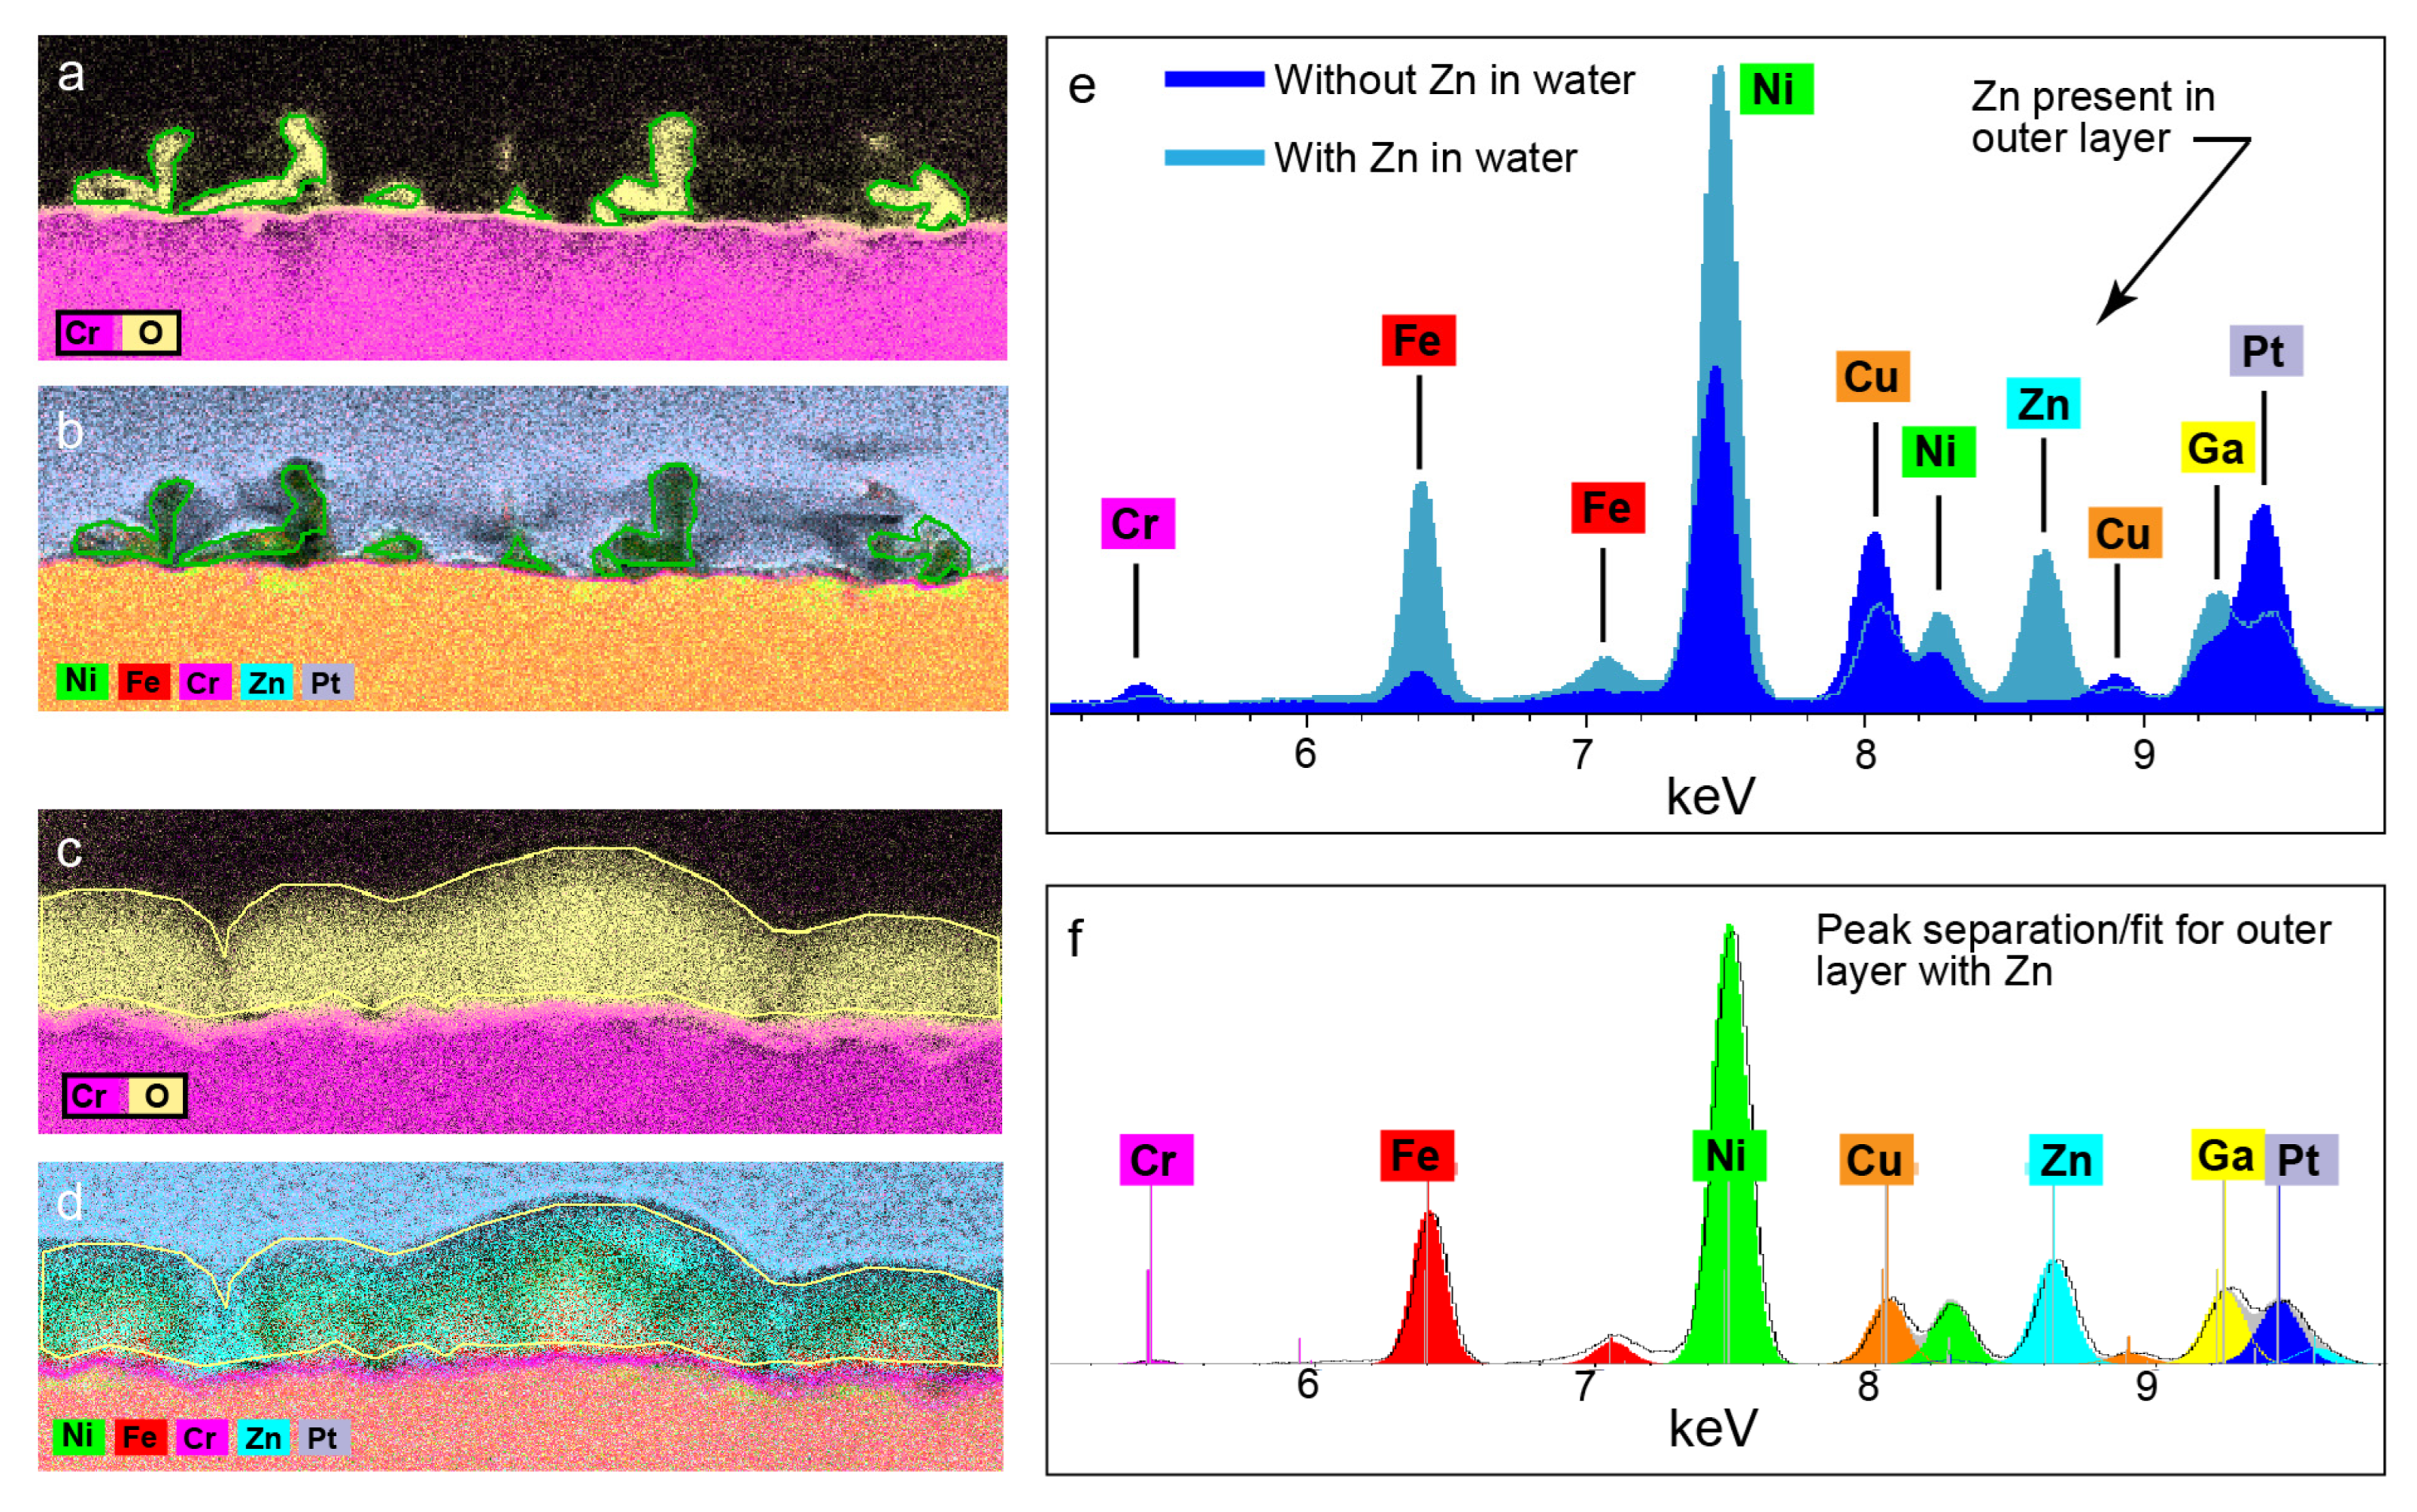
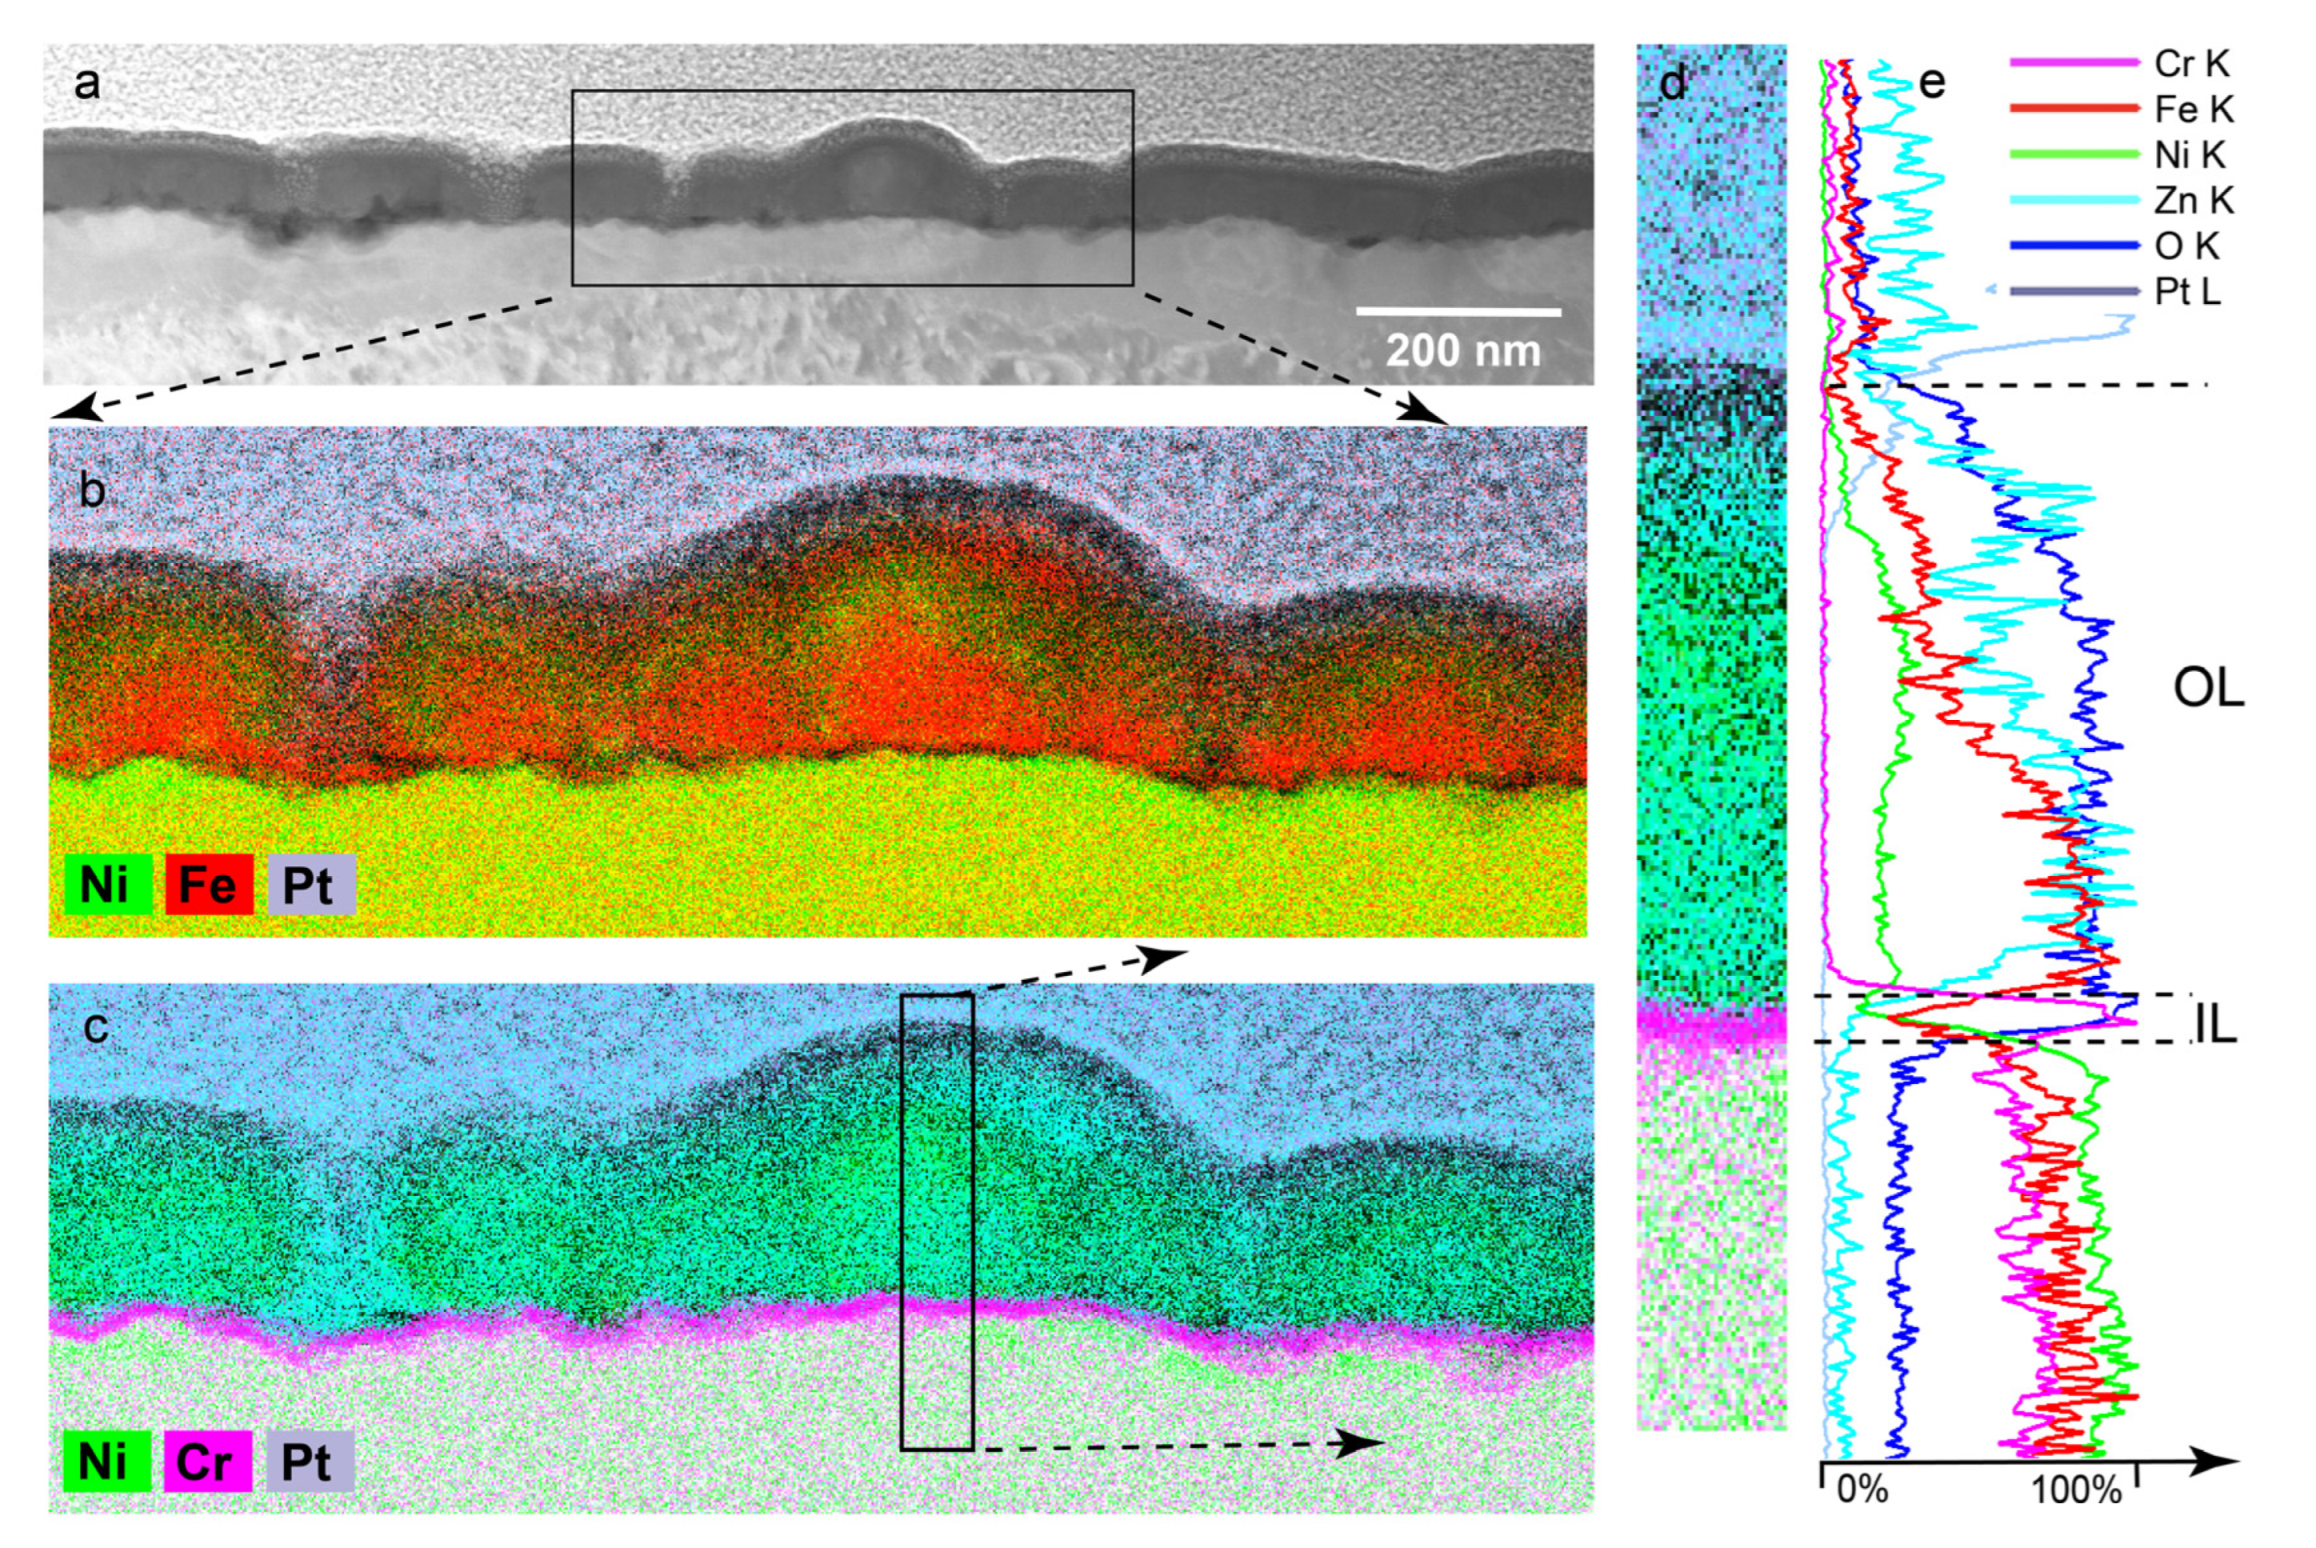
3.1.3. Outer Layer—TEM Results for PWR PW with 100 ppb of Zinc
3.1.4. Inner Layer
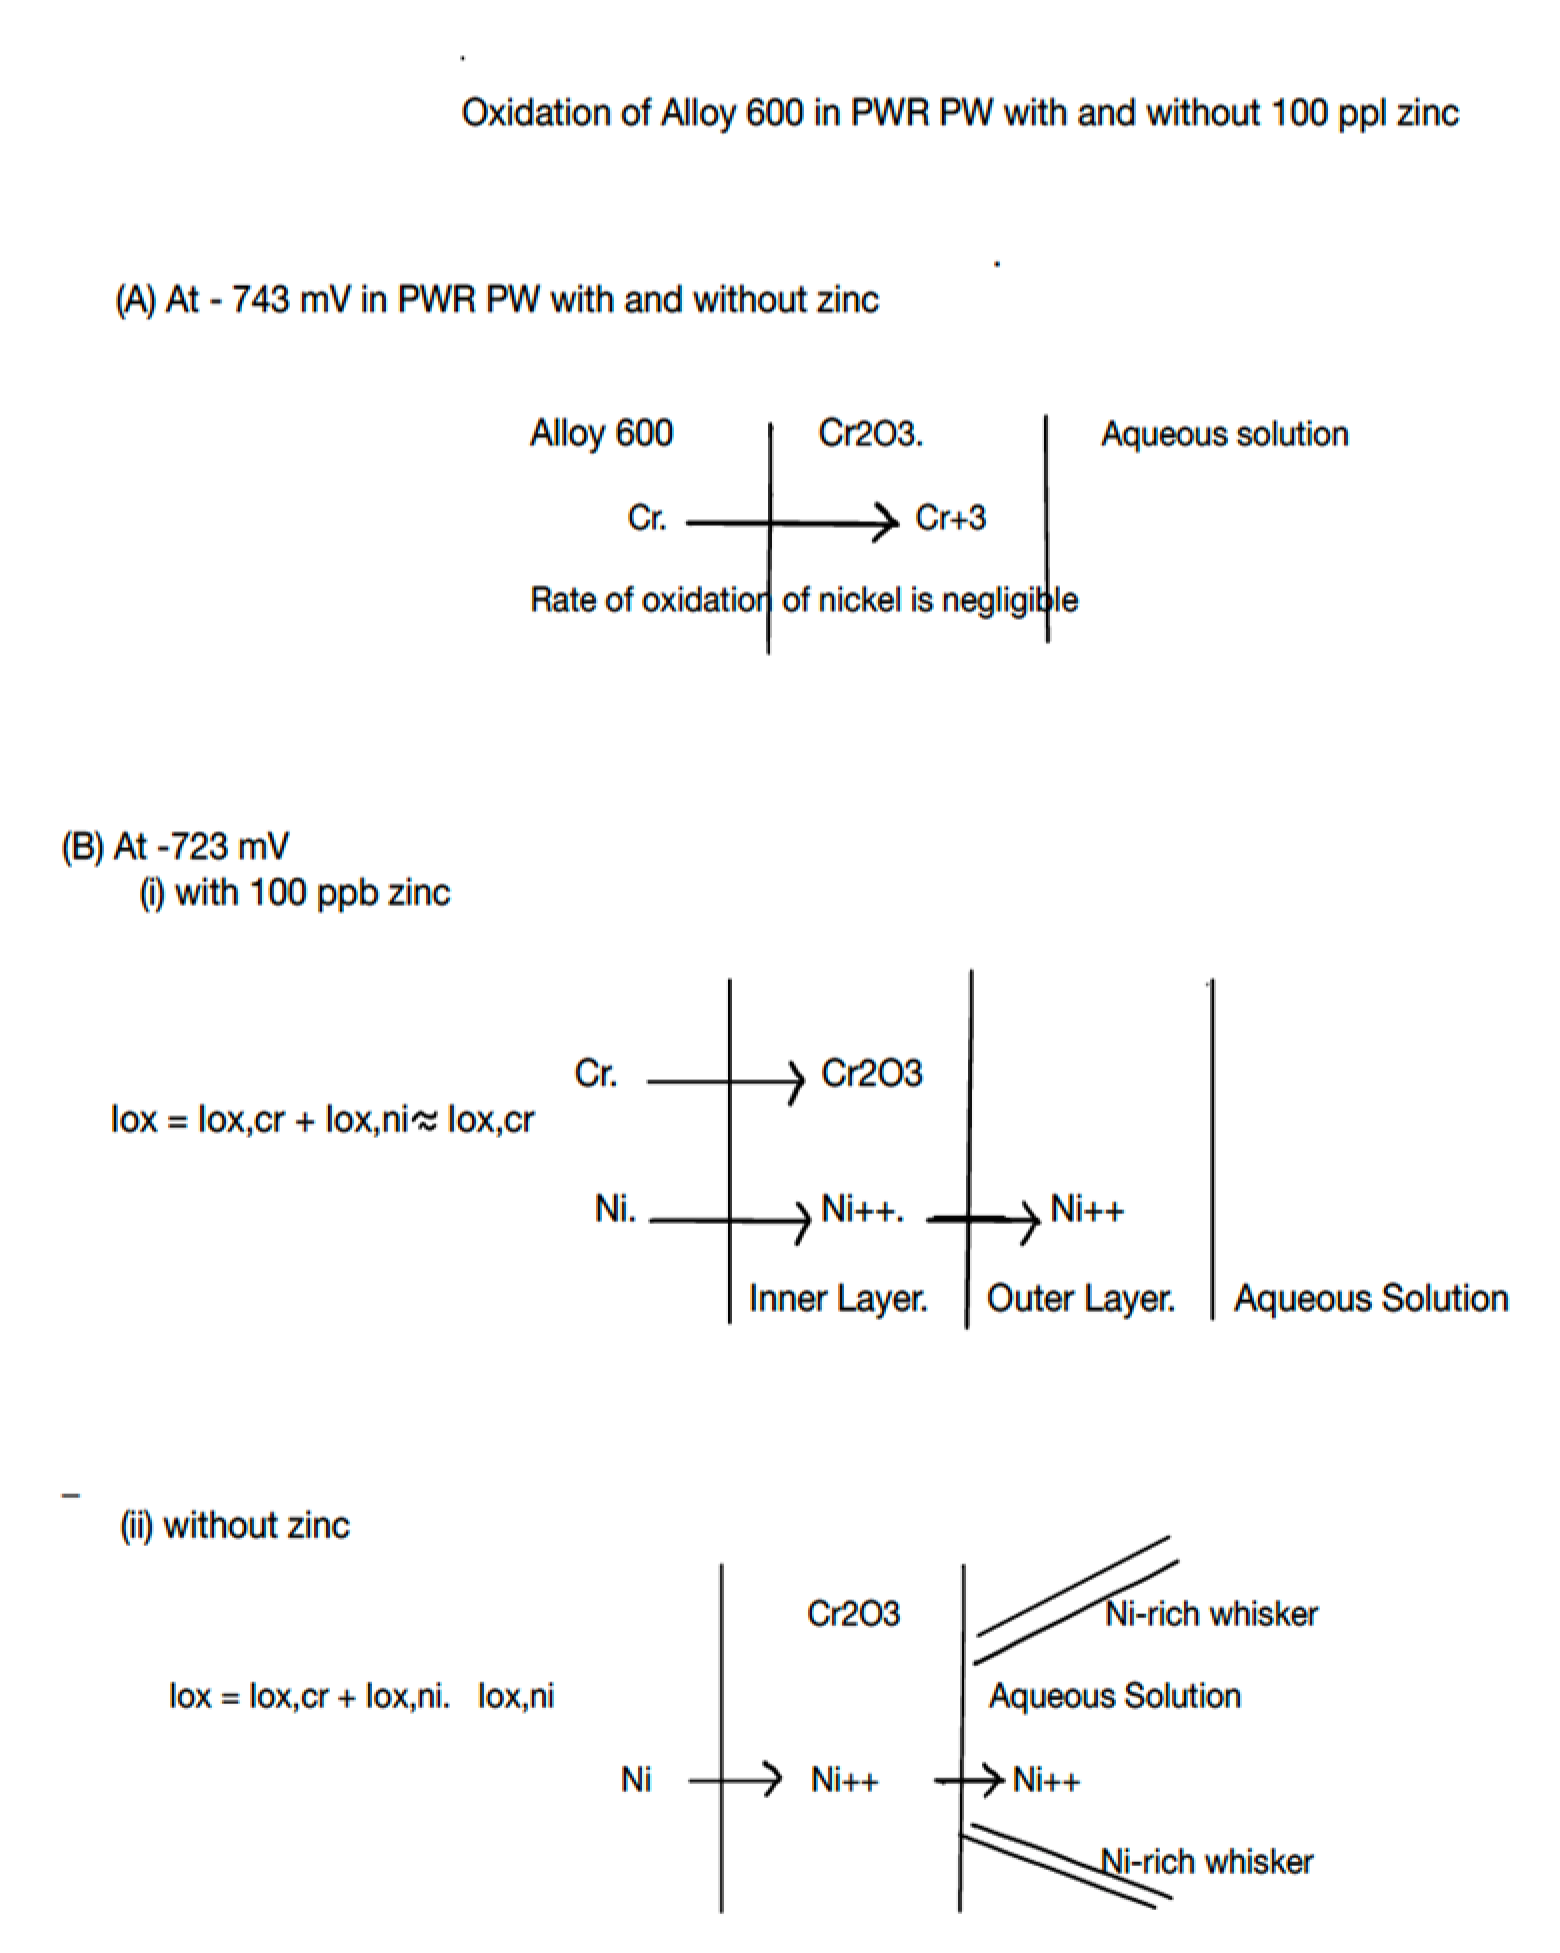
- Surface films of Alloy 600 in PWR PW with and without 100 ppb of zinc were duplex structures with a chromium-rich inner layer (IL) and a nickel-rich outer layer (OL).
- The thickness (≈6–20 nm) and composition of the chromium-rich IL were the same in both the zinc-free and zinc-containing solutions.
- The IL was Cr-rich and presumed to be Cr2O3 and/or CrOOH; and narrow, discontinuous chromium-depleted zones were in the alloy beneath the IL (evident as green nickel-rich regions in the alloy substrate).
- The structures and compositions of the OL were very different for the zinc-containing and zinc-free PWR PW.
- In the zinc-free electrolyte at potentials of −695 mV and −565 mV, the OL was mostly composed of nickel-rich oxide whiskers with relatively small concentrations of iron and very small concentrations of chromium. The whiskers were structurally equivalent to a highly porous or discontinuous layer. At an applied potential of −223 mV, the OL was nearly free of whiskers.
- In the zinc-containing electrolyte, there were no whiskers and the OL contained a significant amount of zinc and had only half the amounts of nickel and iron found in the whiskers, which formed the OL in zinc-free PWR PW. The OL formed in the zinc-containing PWR PW was relatively thick and compact and provided near-continuous coverage of the IL.
- Thus, zinc’s main effect was to alter the composition and the structure of the OLs formed at ≈ −700 mV and ≈ −550 mV.
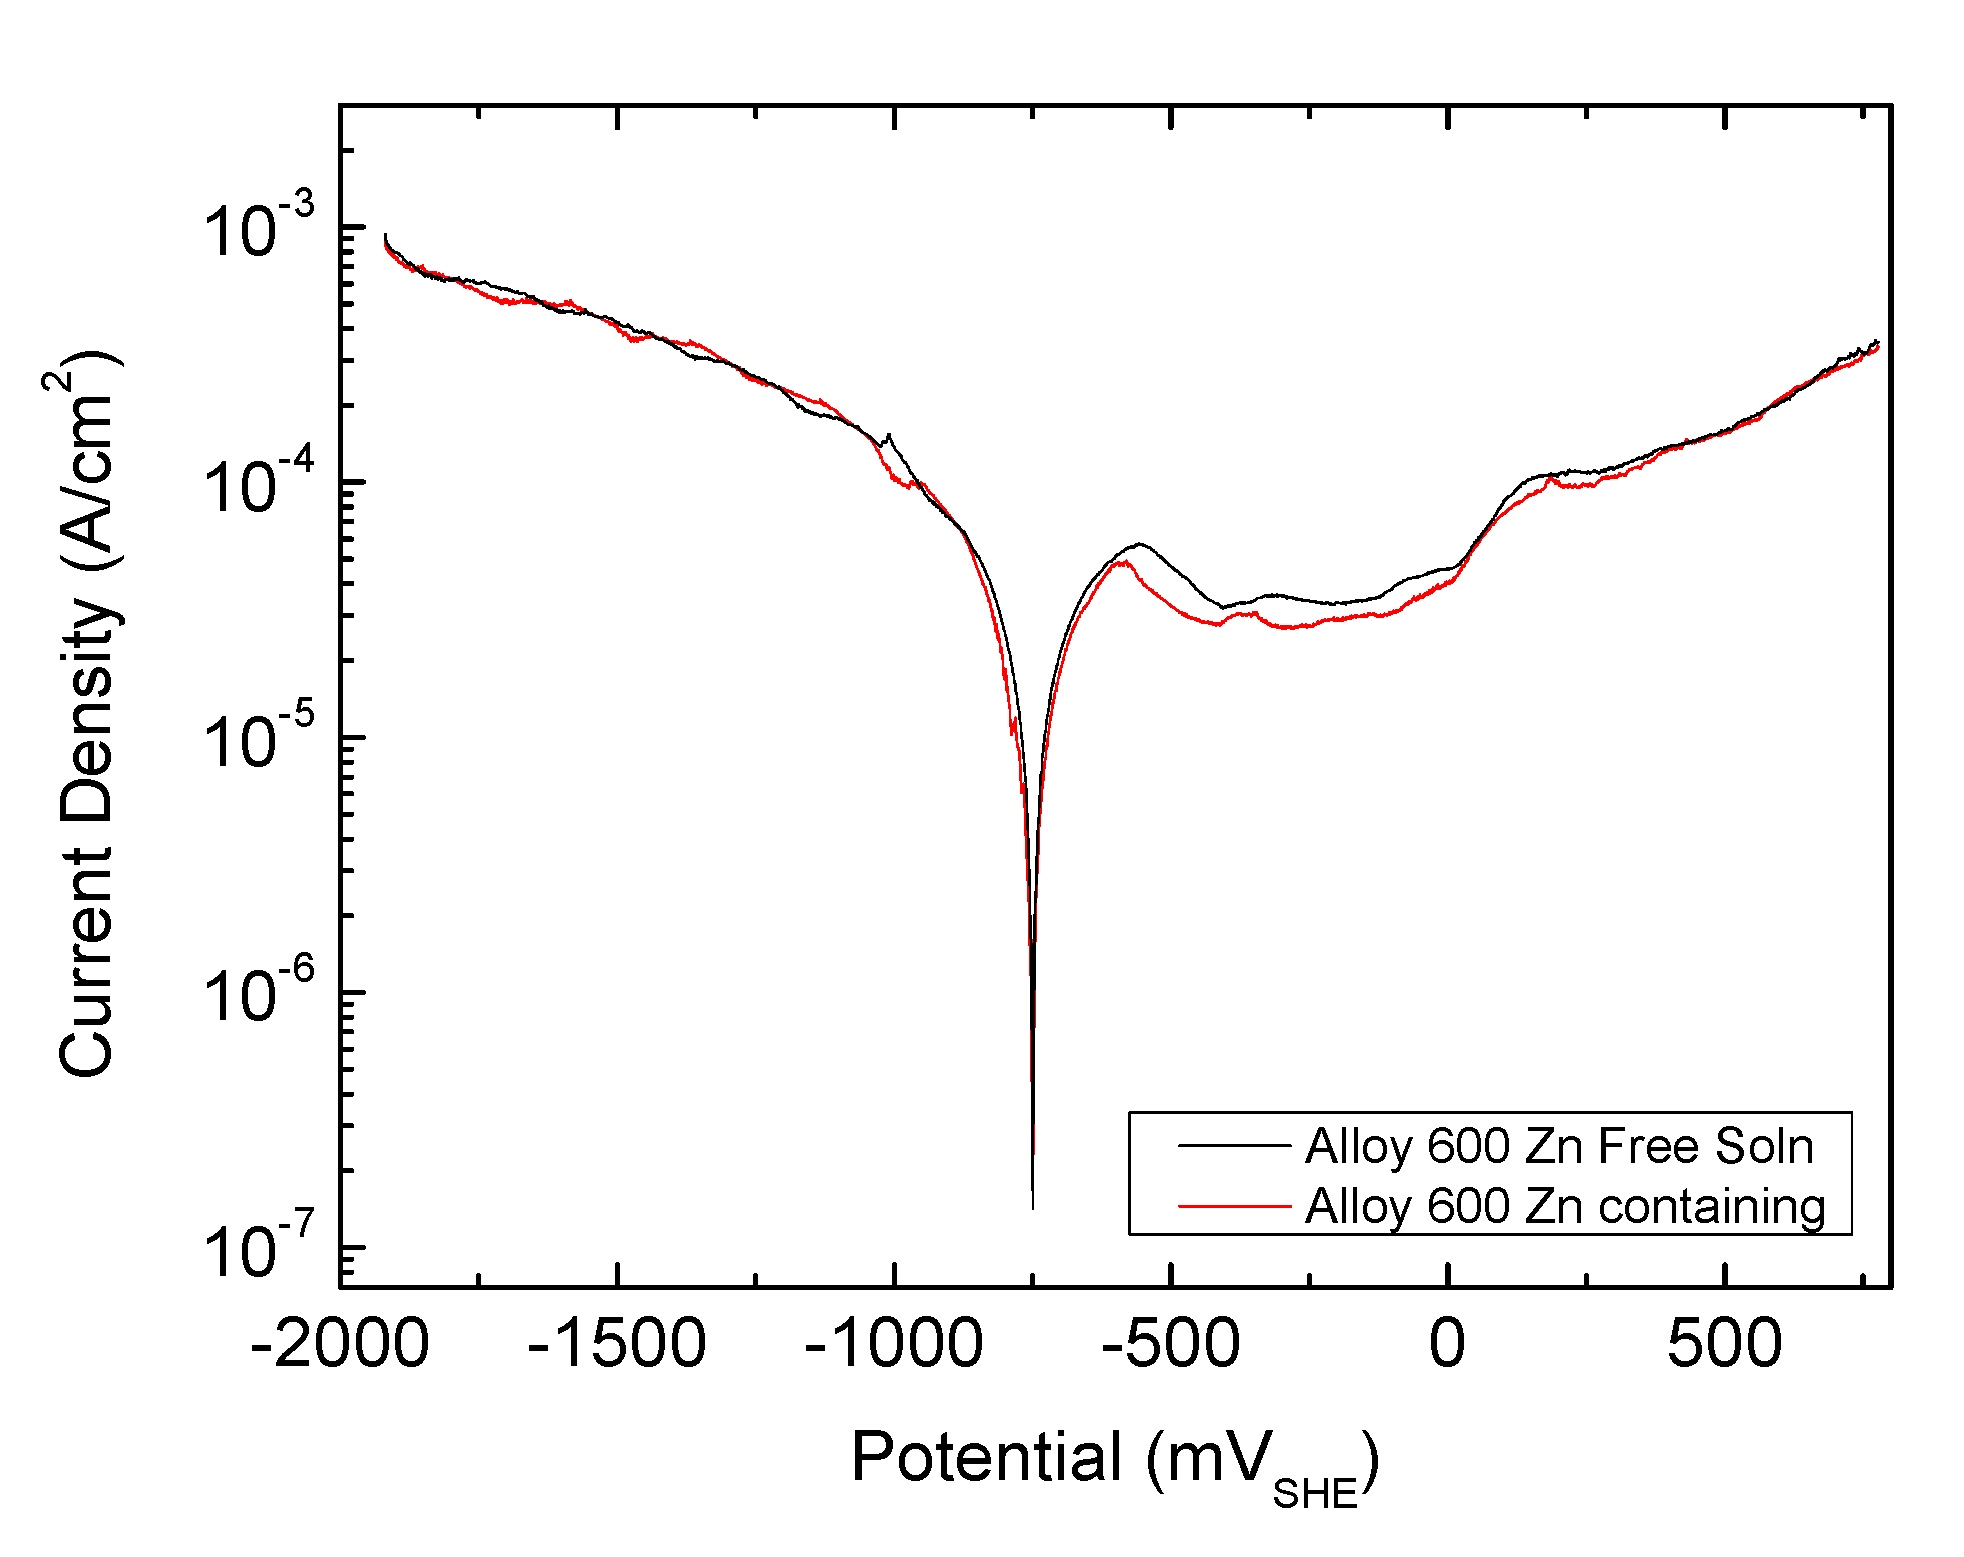
3.2. Potentiodynamic Polarization Tests
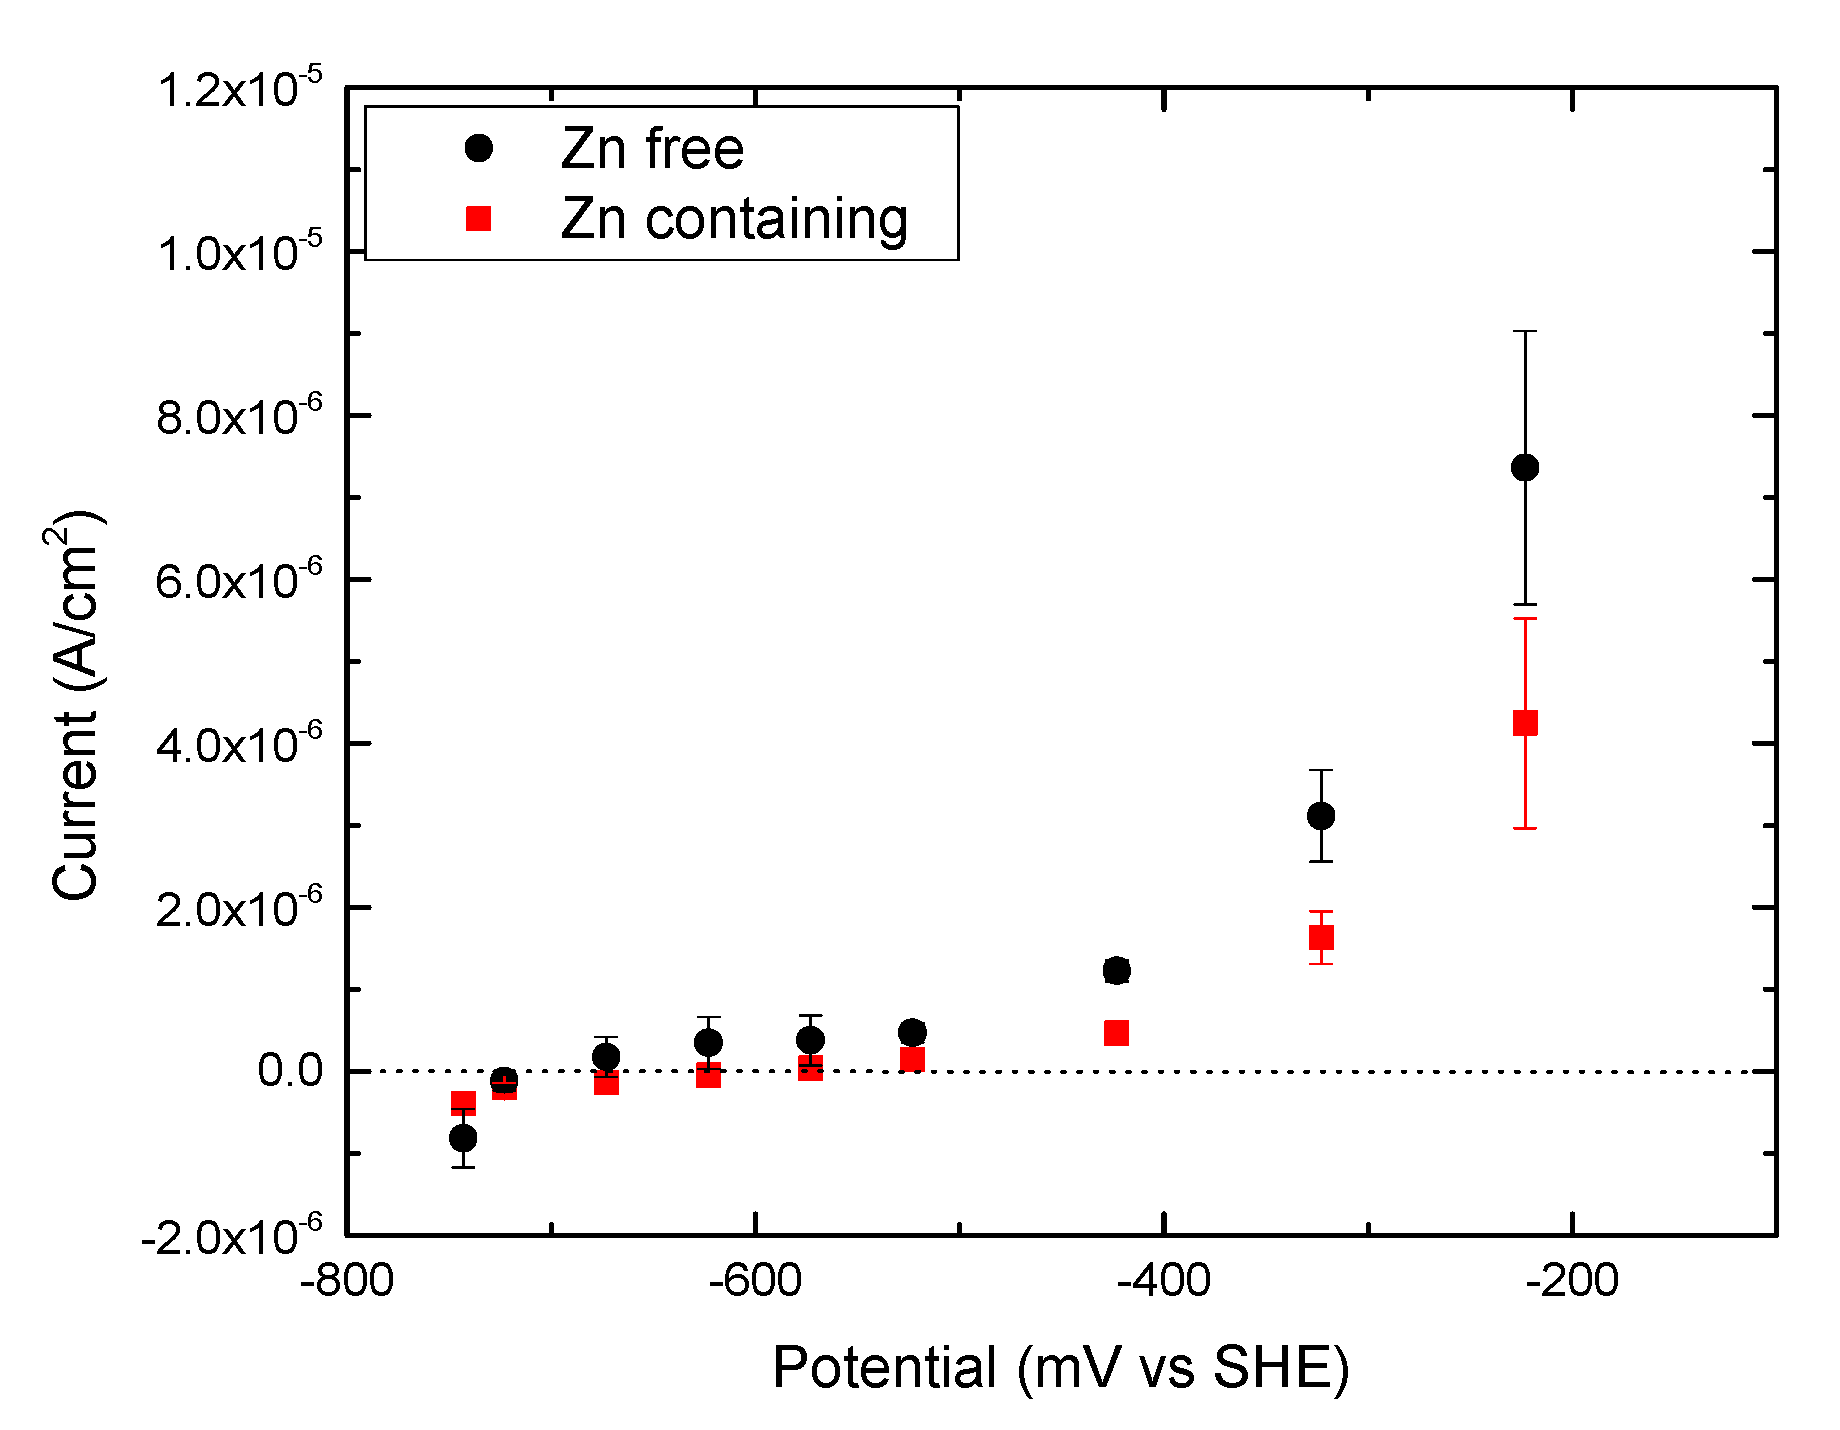
3.3. Potentiostatic Polarization Tests
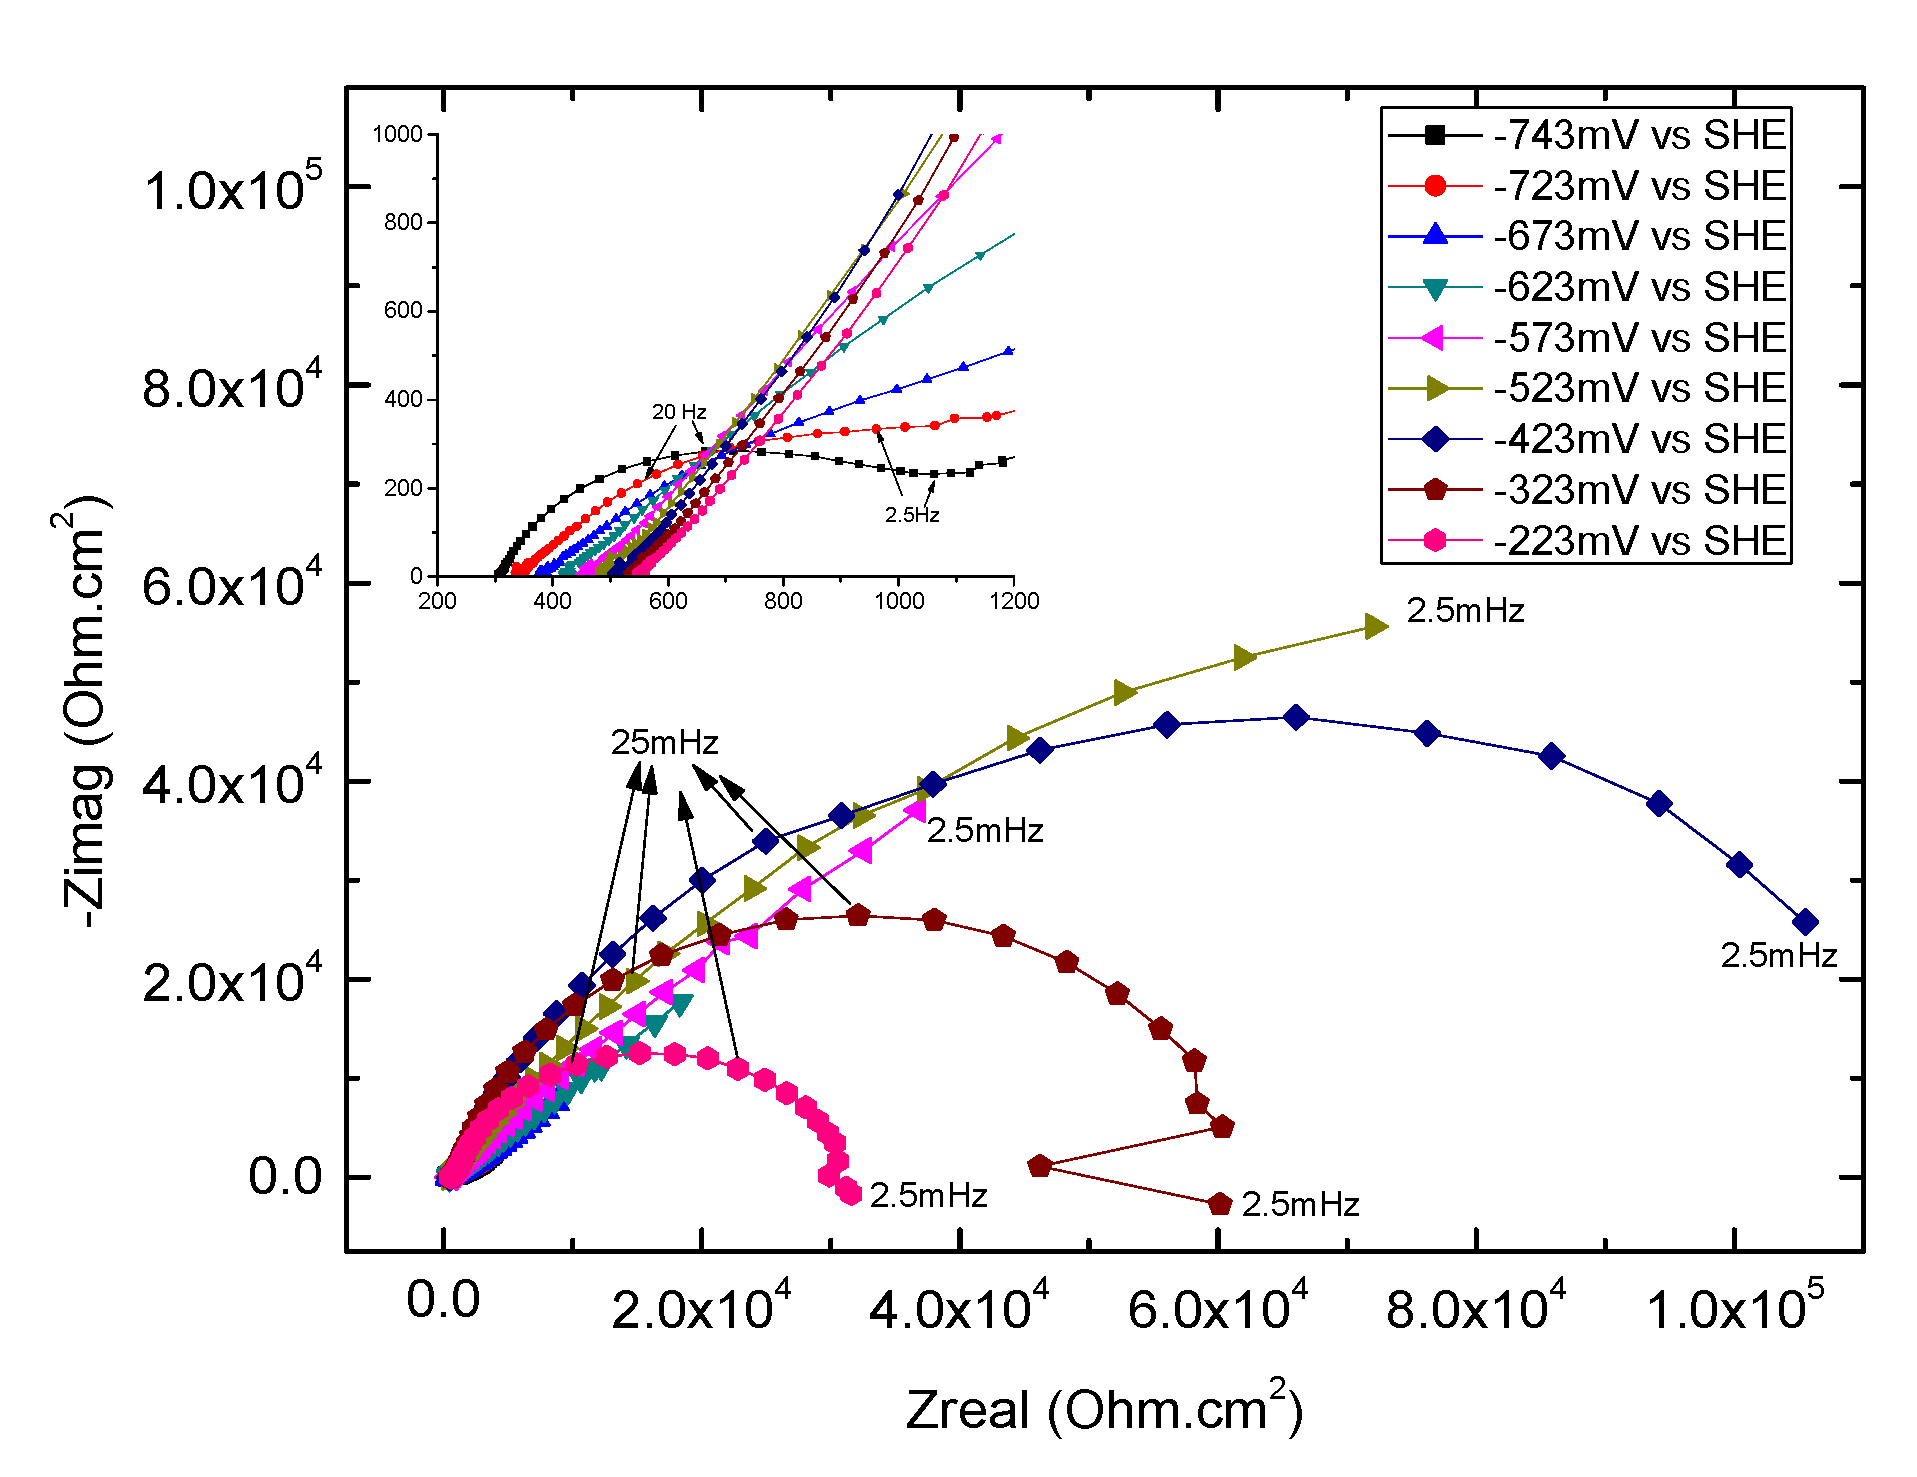
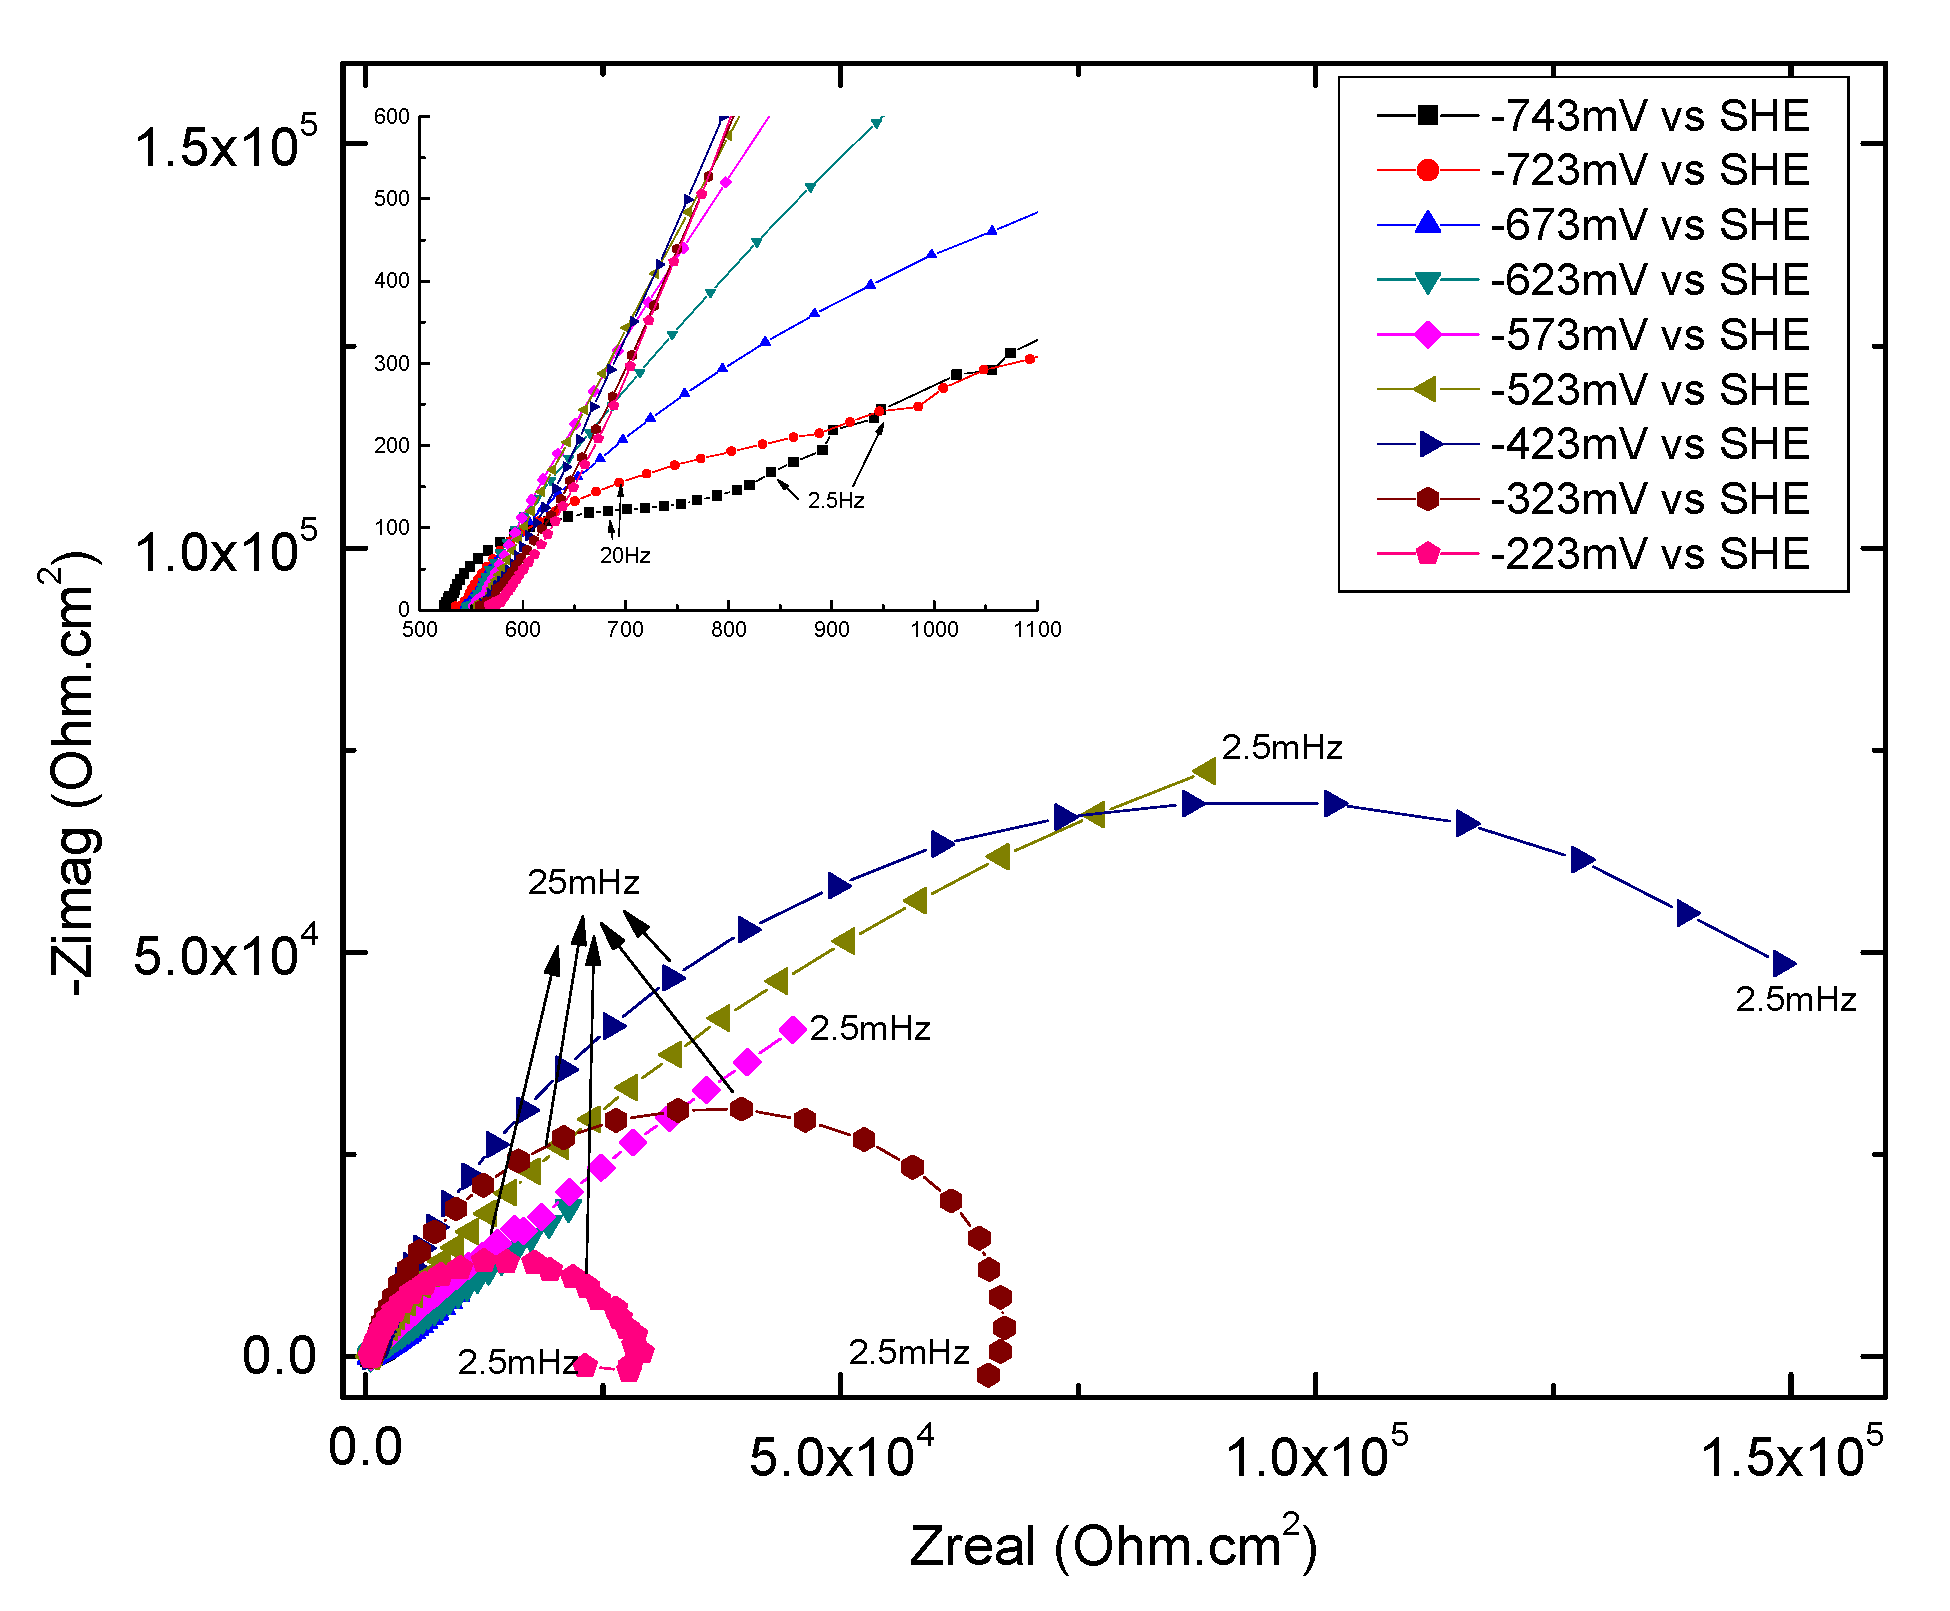
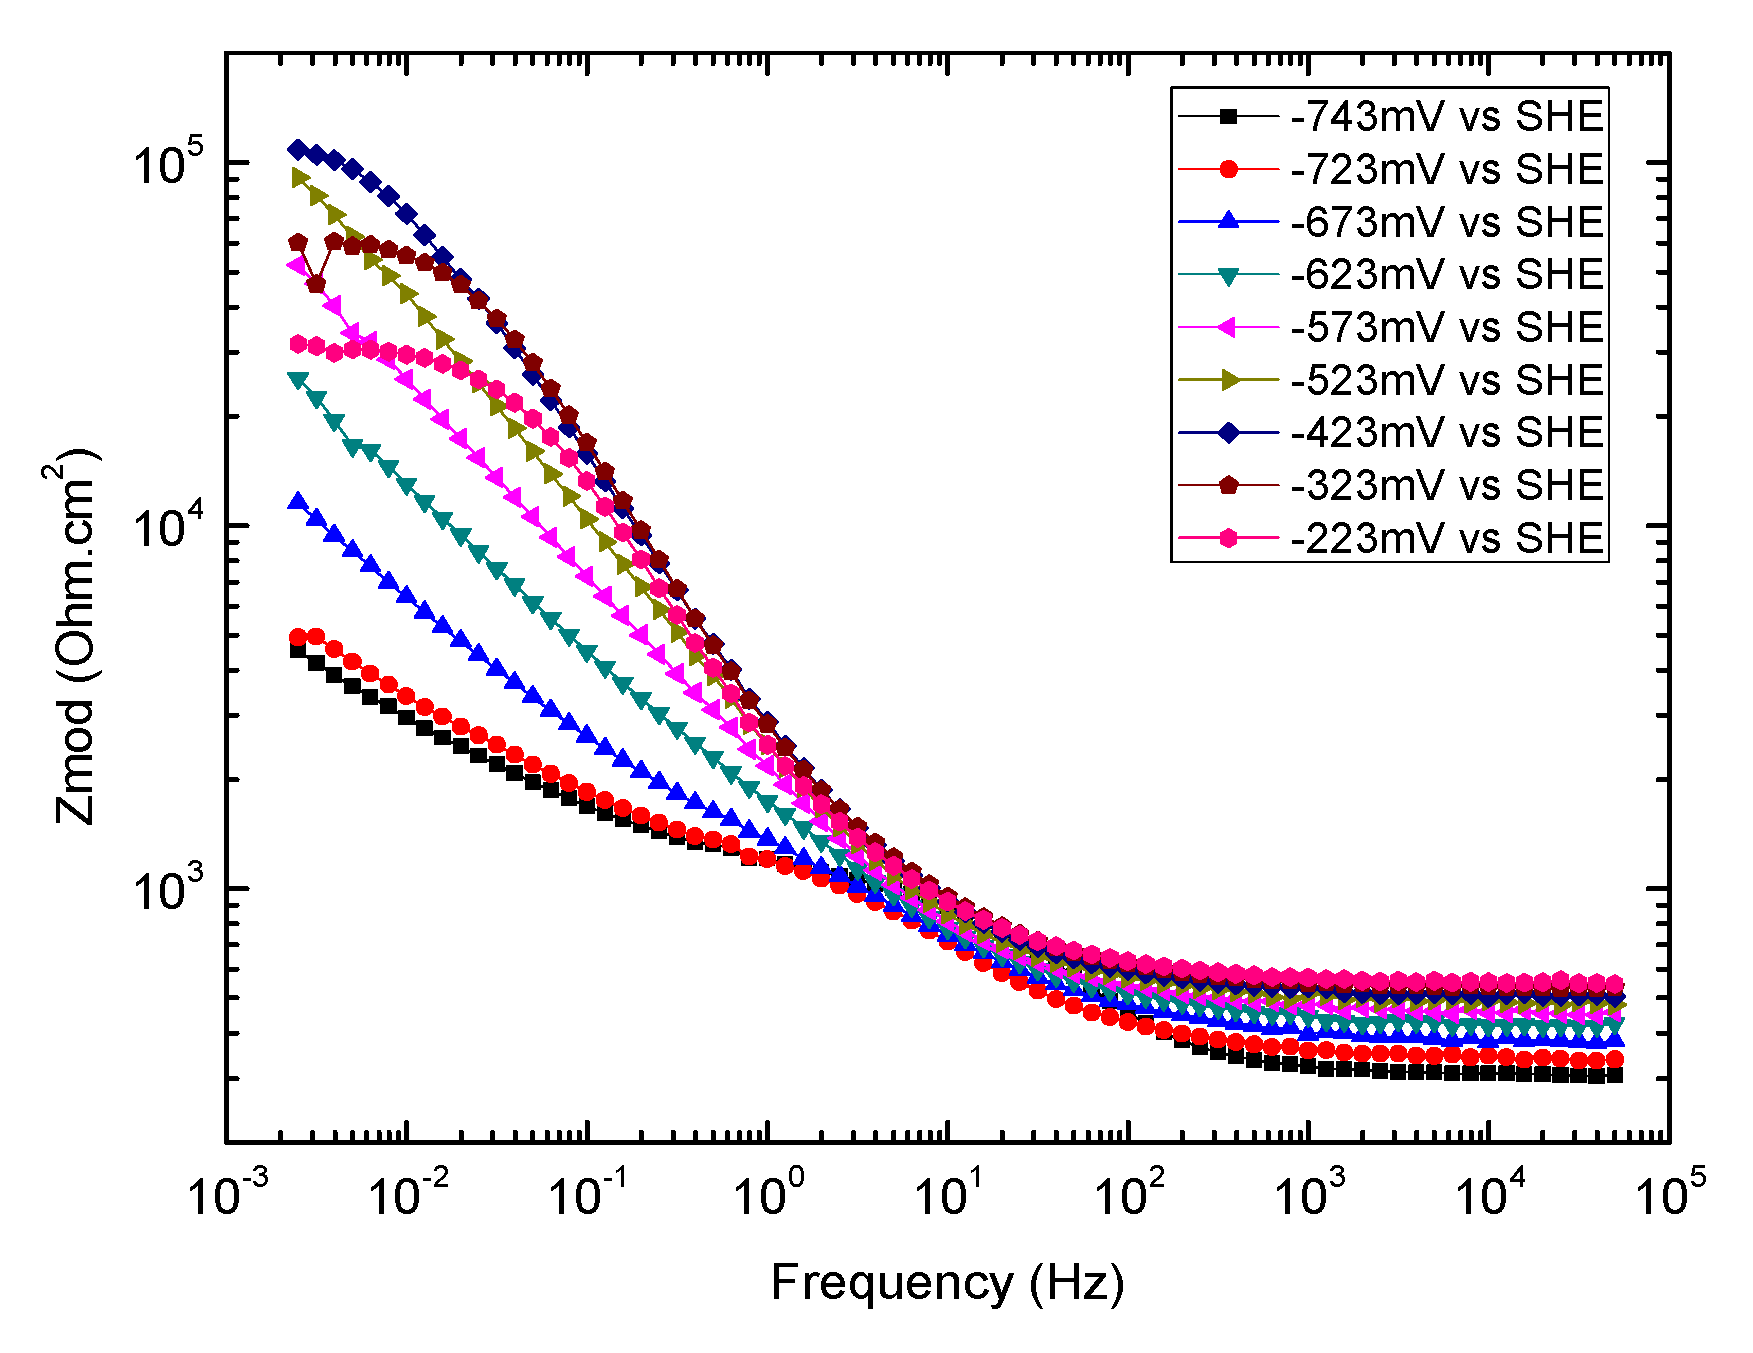
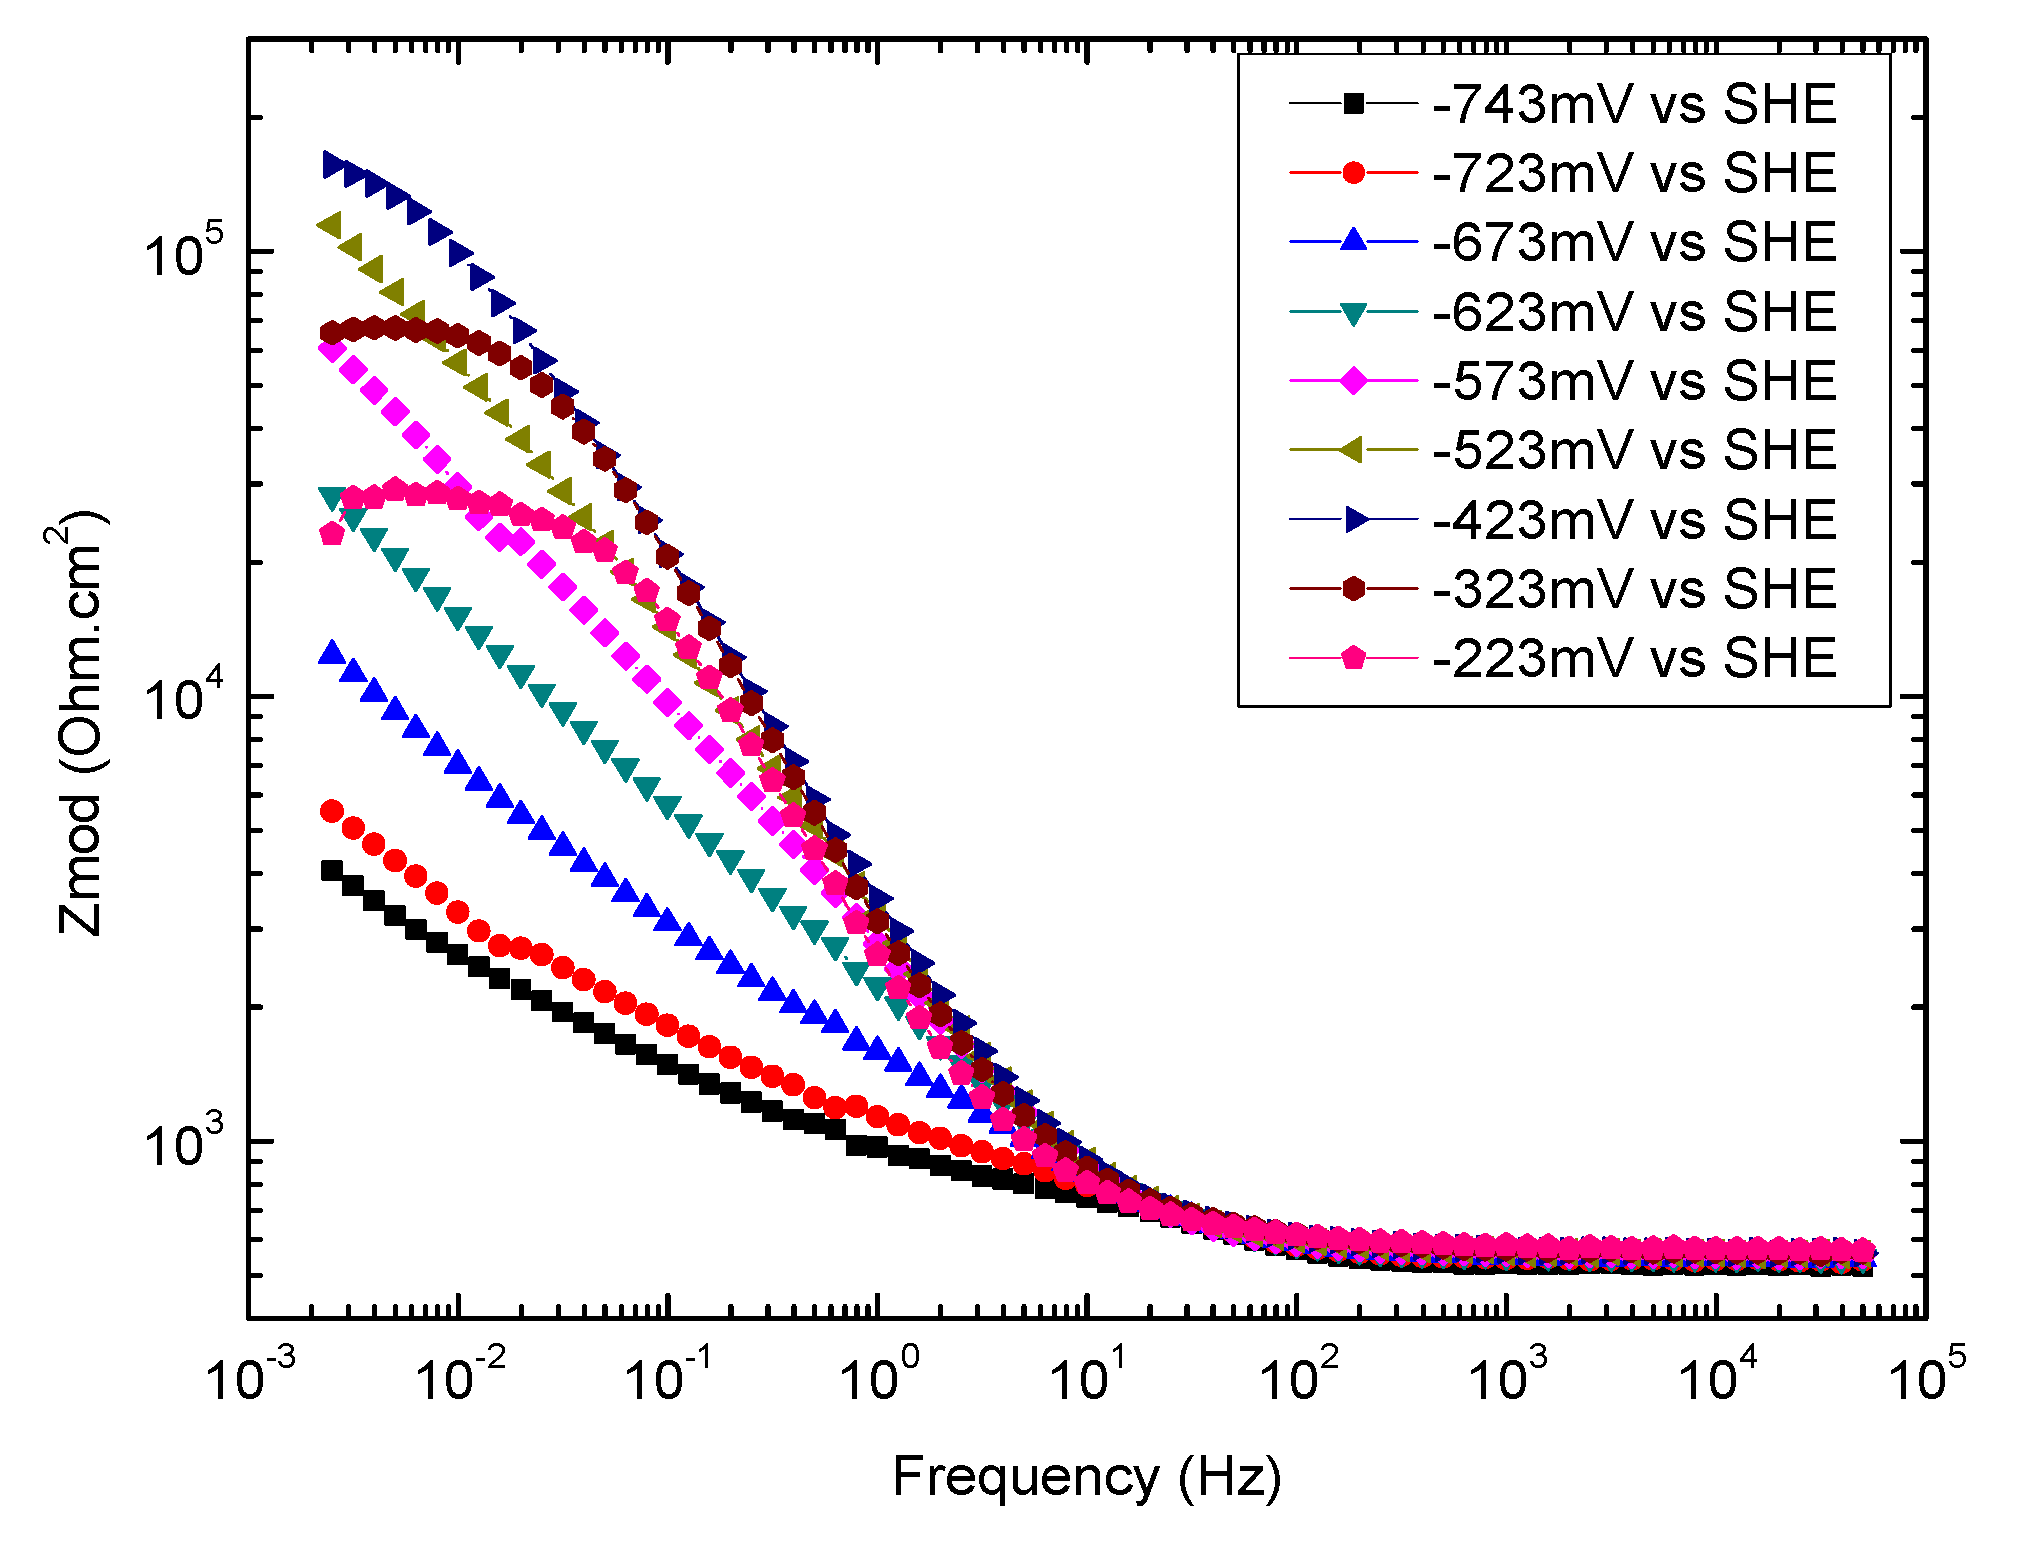
3.4. Electrochemical Impedance Spectroscopy
3.4.1. Introduction
3.4.2. Overview of EIS Results
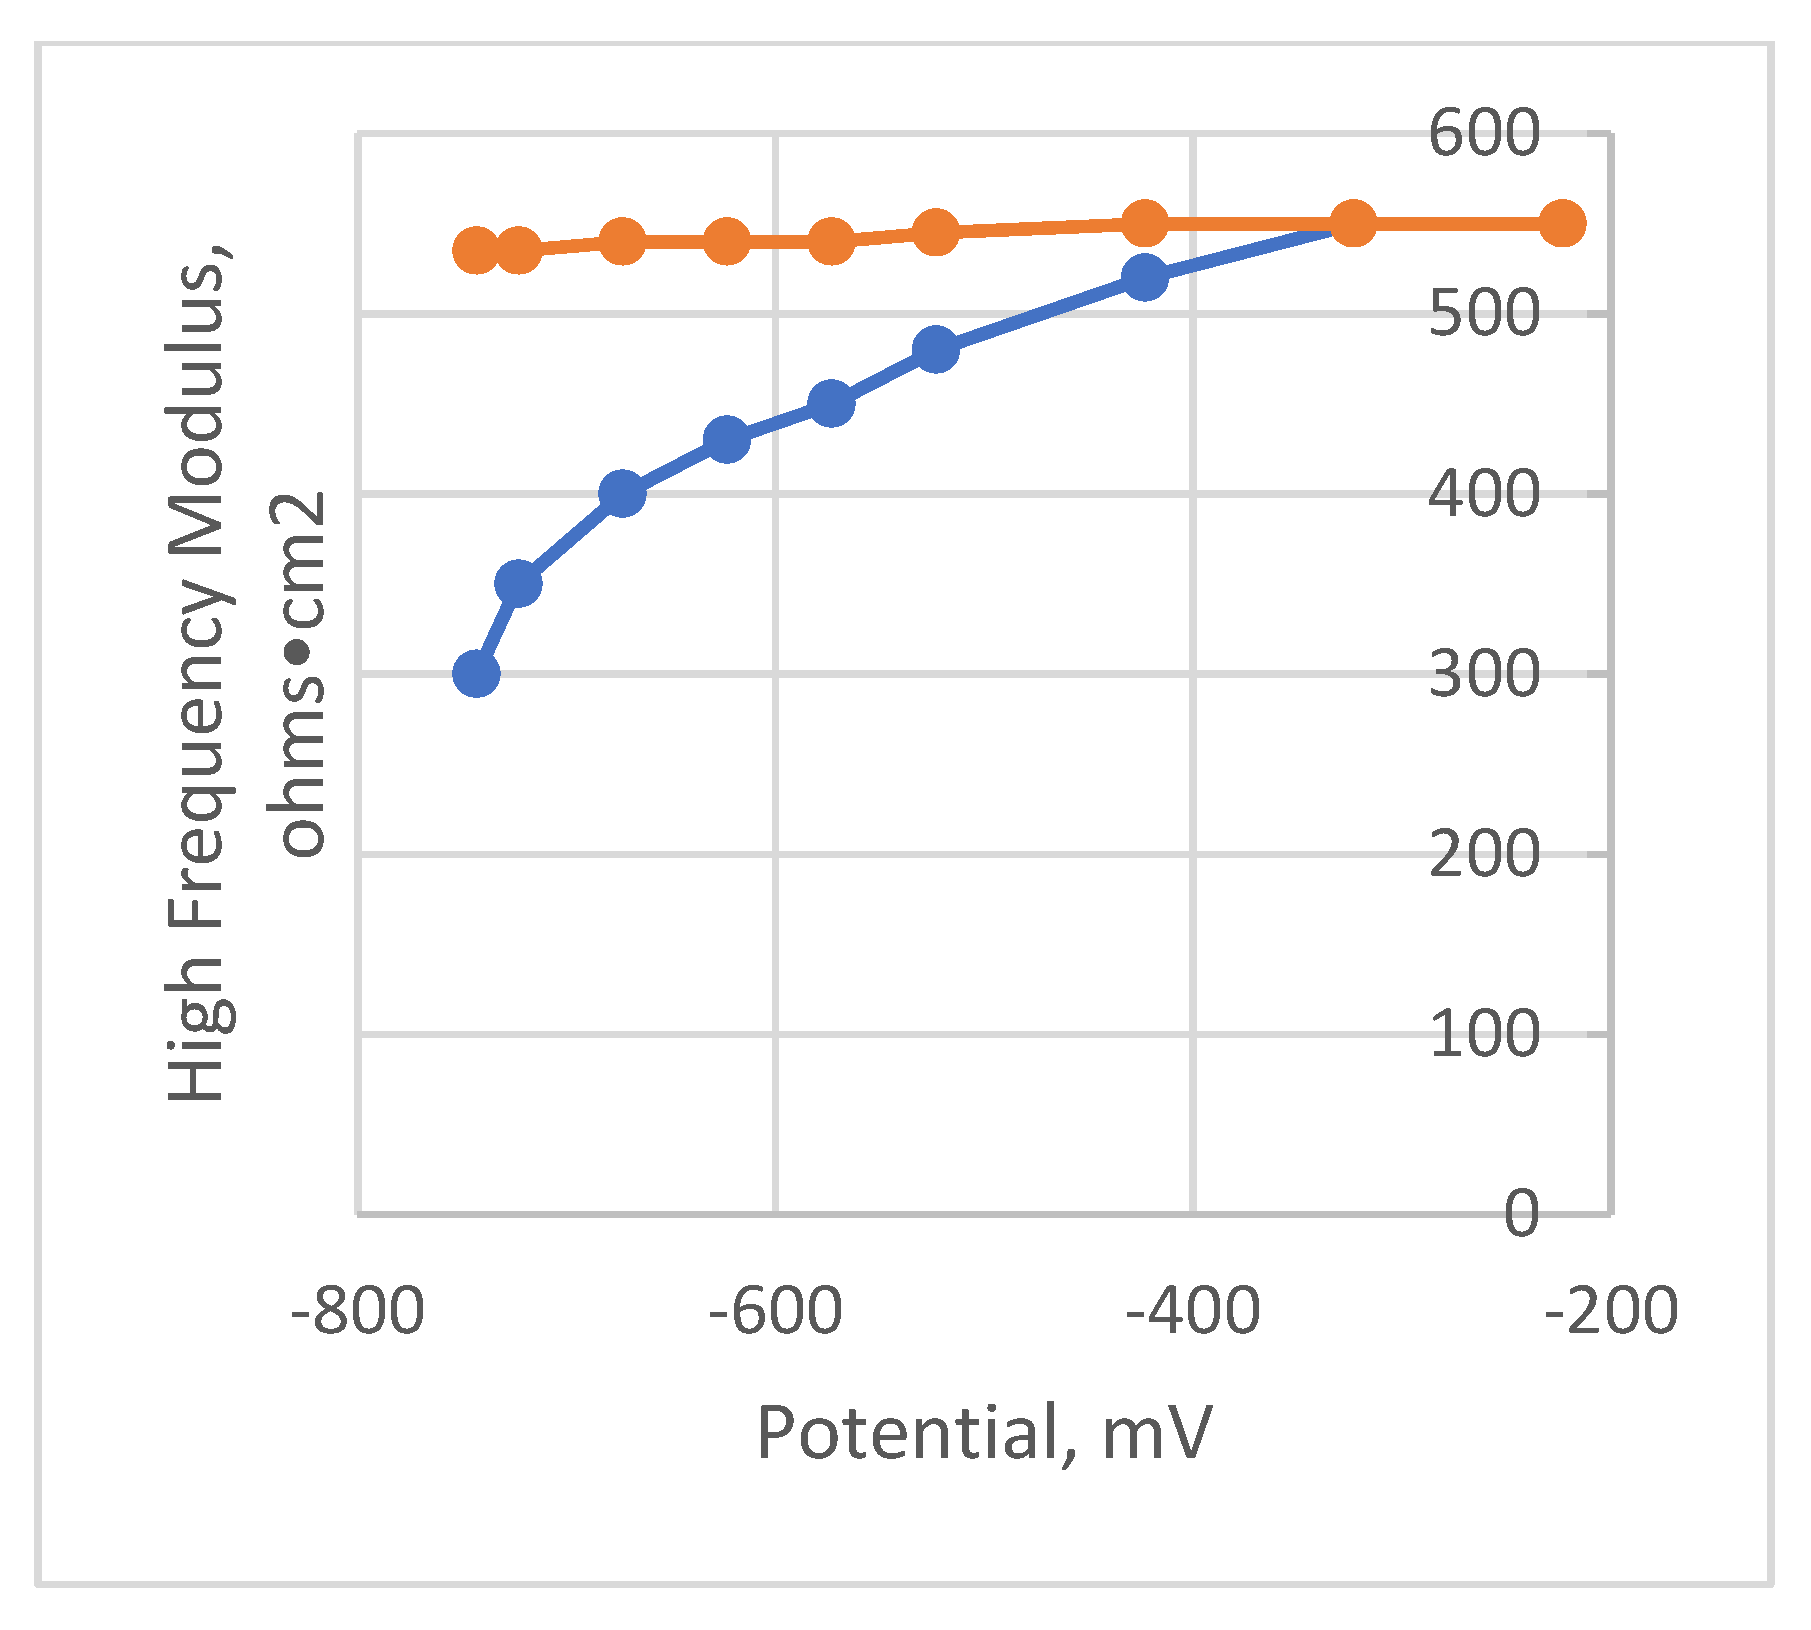
3.4.3. High-Frequency Impedance of Groups 700, 550, and 223
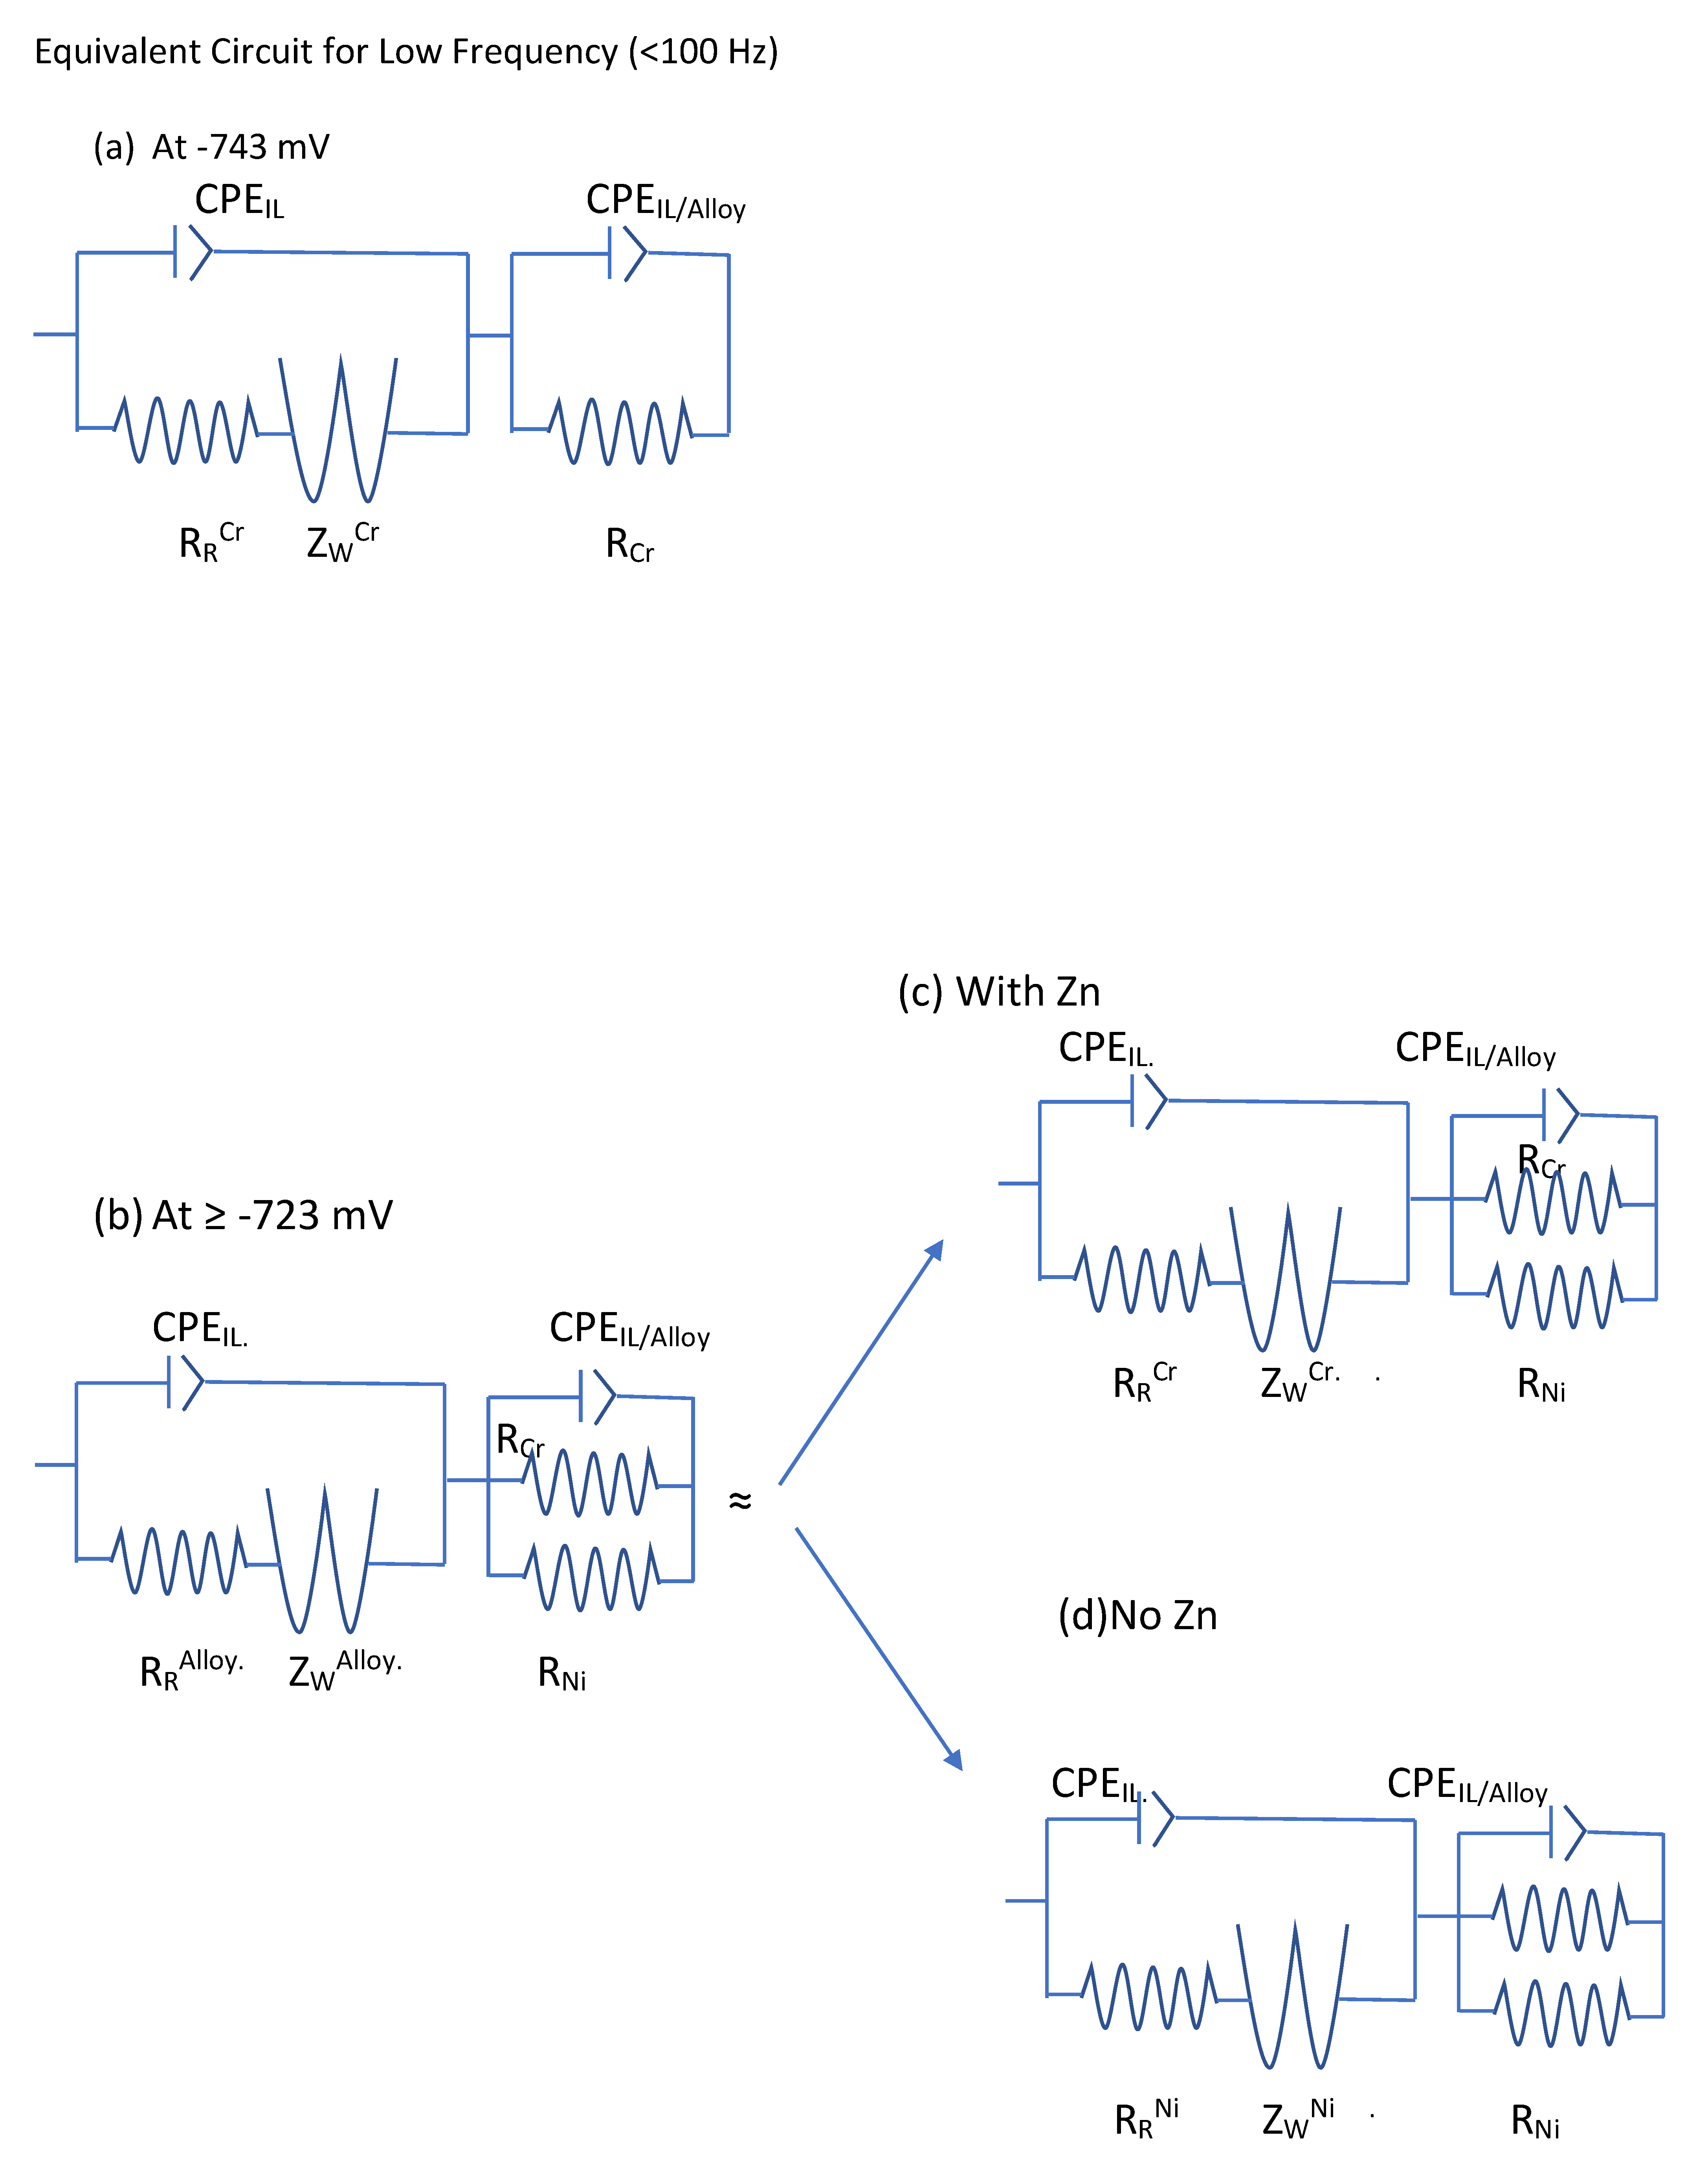
3.4.4. Low-Frequency Impedance of Groups 700, 550, and 223
4. Discussion
Low-Frequency Impedance
5. Summary and Conclusions
Supplementary Materials
Author Contributions
Funding
Data Availability Statement
Acknowledgments
Conflicts of Interest
Appendix A. Preliminary Examination of EIS: Graphical Analyses, DC Current Density during EIS, and Equilibrium Potentials
Appendix A.1. Preliminary Inspection of Impedance Spectra

| Run 1 | Run 2 | Run 3 | |
|---|---|---|---|
| Potential (mV vs. SHE) | A/cm2 | A/cm2 | A/cm2 |
| −743 | −1.77 × 10⁻⁷ | −8.70 × 10⁻⁷ | −1.40 × 10⁻⁶ |
| −723 | −1.90 × 10⁻⁷ | −2.70 × 10⁻⁷ | 1.07 × 10⁻⁷ |
| −673 | −9.63 × 10⁻⁸ | 6.67 × 10⁻⁷ | −4.60 × 10⁻⁸ |
| −623 | 4.18 × 10⁻⁸ | 9.86 × 10⁻⁷ | 1.84 × 10⁻⁸ |
| −573 | 5.02 × 10⁻⁸ | 9.88 × 10⁻⁷ | 1.03 × 10⁻⁷ |
| −523 | 3.90 × 10⁻⁷ | 7.08 × 10⁻⁷ | 3.21 × 10⁻⁷ |
| −423 | 1.13 × 10⁻⁶ | 1.07 × 10⁻⁶ | 1.48 × 10⁻⁶ |
| −323 | 2.86 × 10⁻⁶ | 2.30 × 10⁻⁶ | 4.18 × 10⁻⁶ |
| −223 | 6.34 × 10⁻⁶ | 5.13 × 10⁻⁶ | 1.06 × 10⁻⁵ |
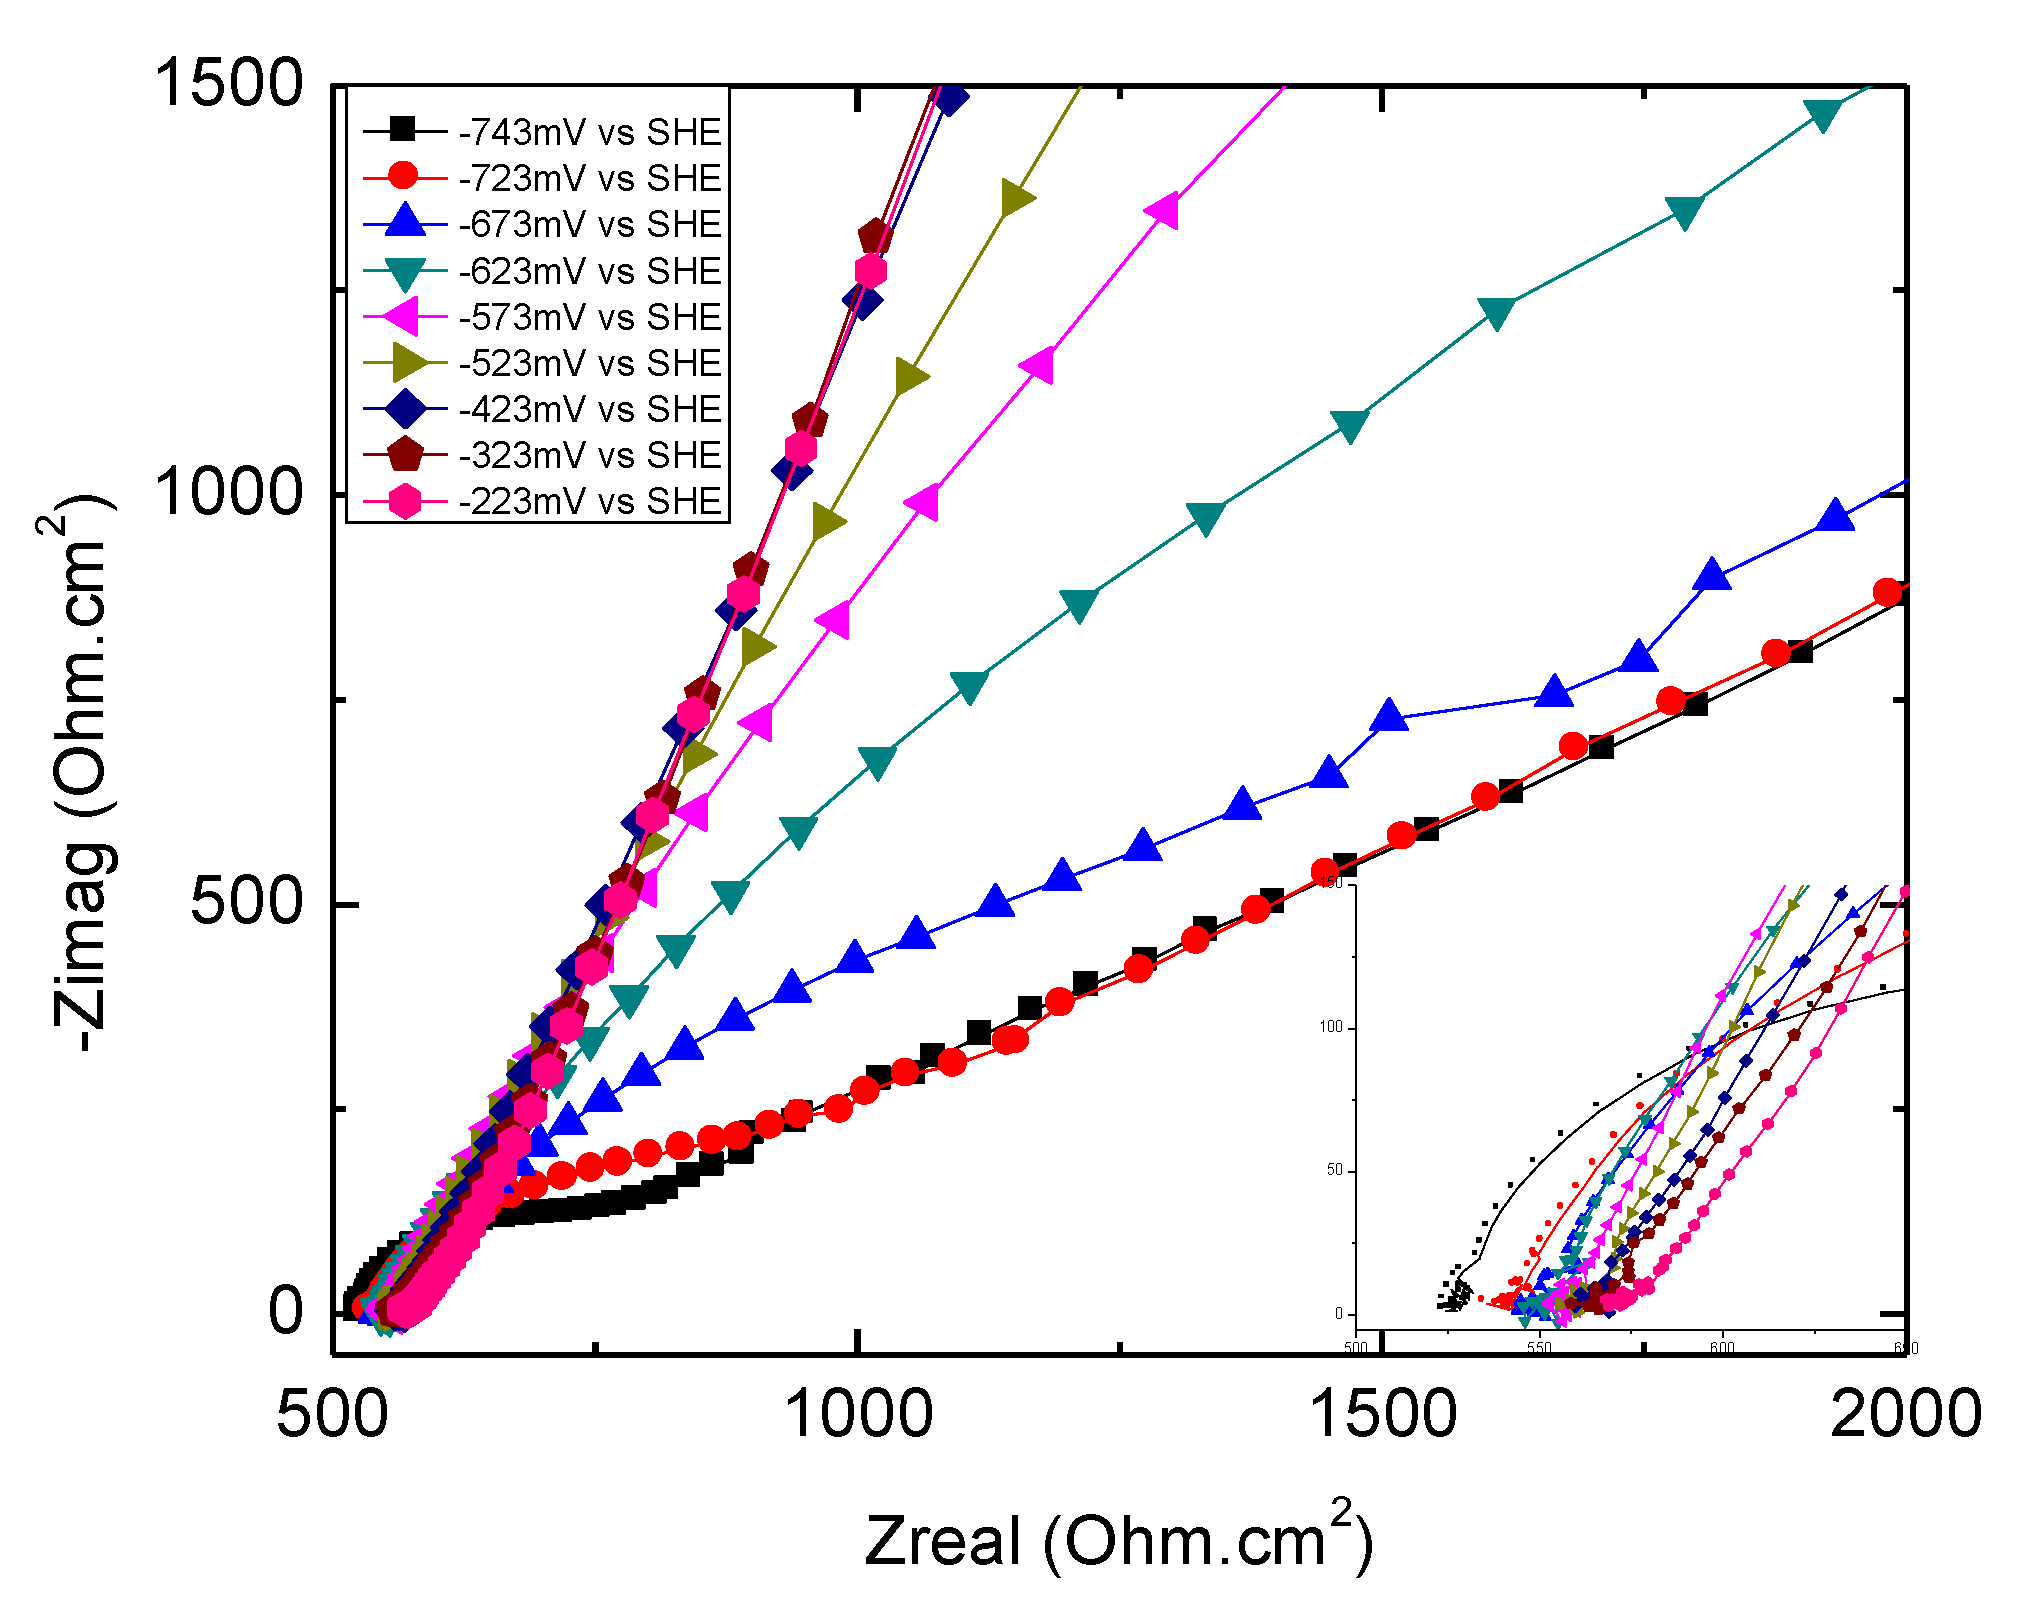
| Spectra with Similarly Shaped Nyquist Plots | Spectra with Similar Values of iDC | Electrochemical Reactions Contributing to EIS |
|---|---|---|
| −743 mV, −723 mV | −743 mV, −723 mV | HRR and Oxidation of Alloy |
| −673 mV, −623 mV, −573 mV, −523 mV | −673 mV, −623 mV, −573 mV, −523 mV | Oxidation Reaction #1 of Alloy |
| −423 mV, −323 mV, −223 mV | −423 mV, −323 mV, −223 mV | Oxidation Reaction #2 of Alloy |
Appendix A.2. Detailed Examination of EIS
Appendix A.2.1. EIS at −743 mV and −723 mV
Appendix A.2.1.1. Overview
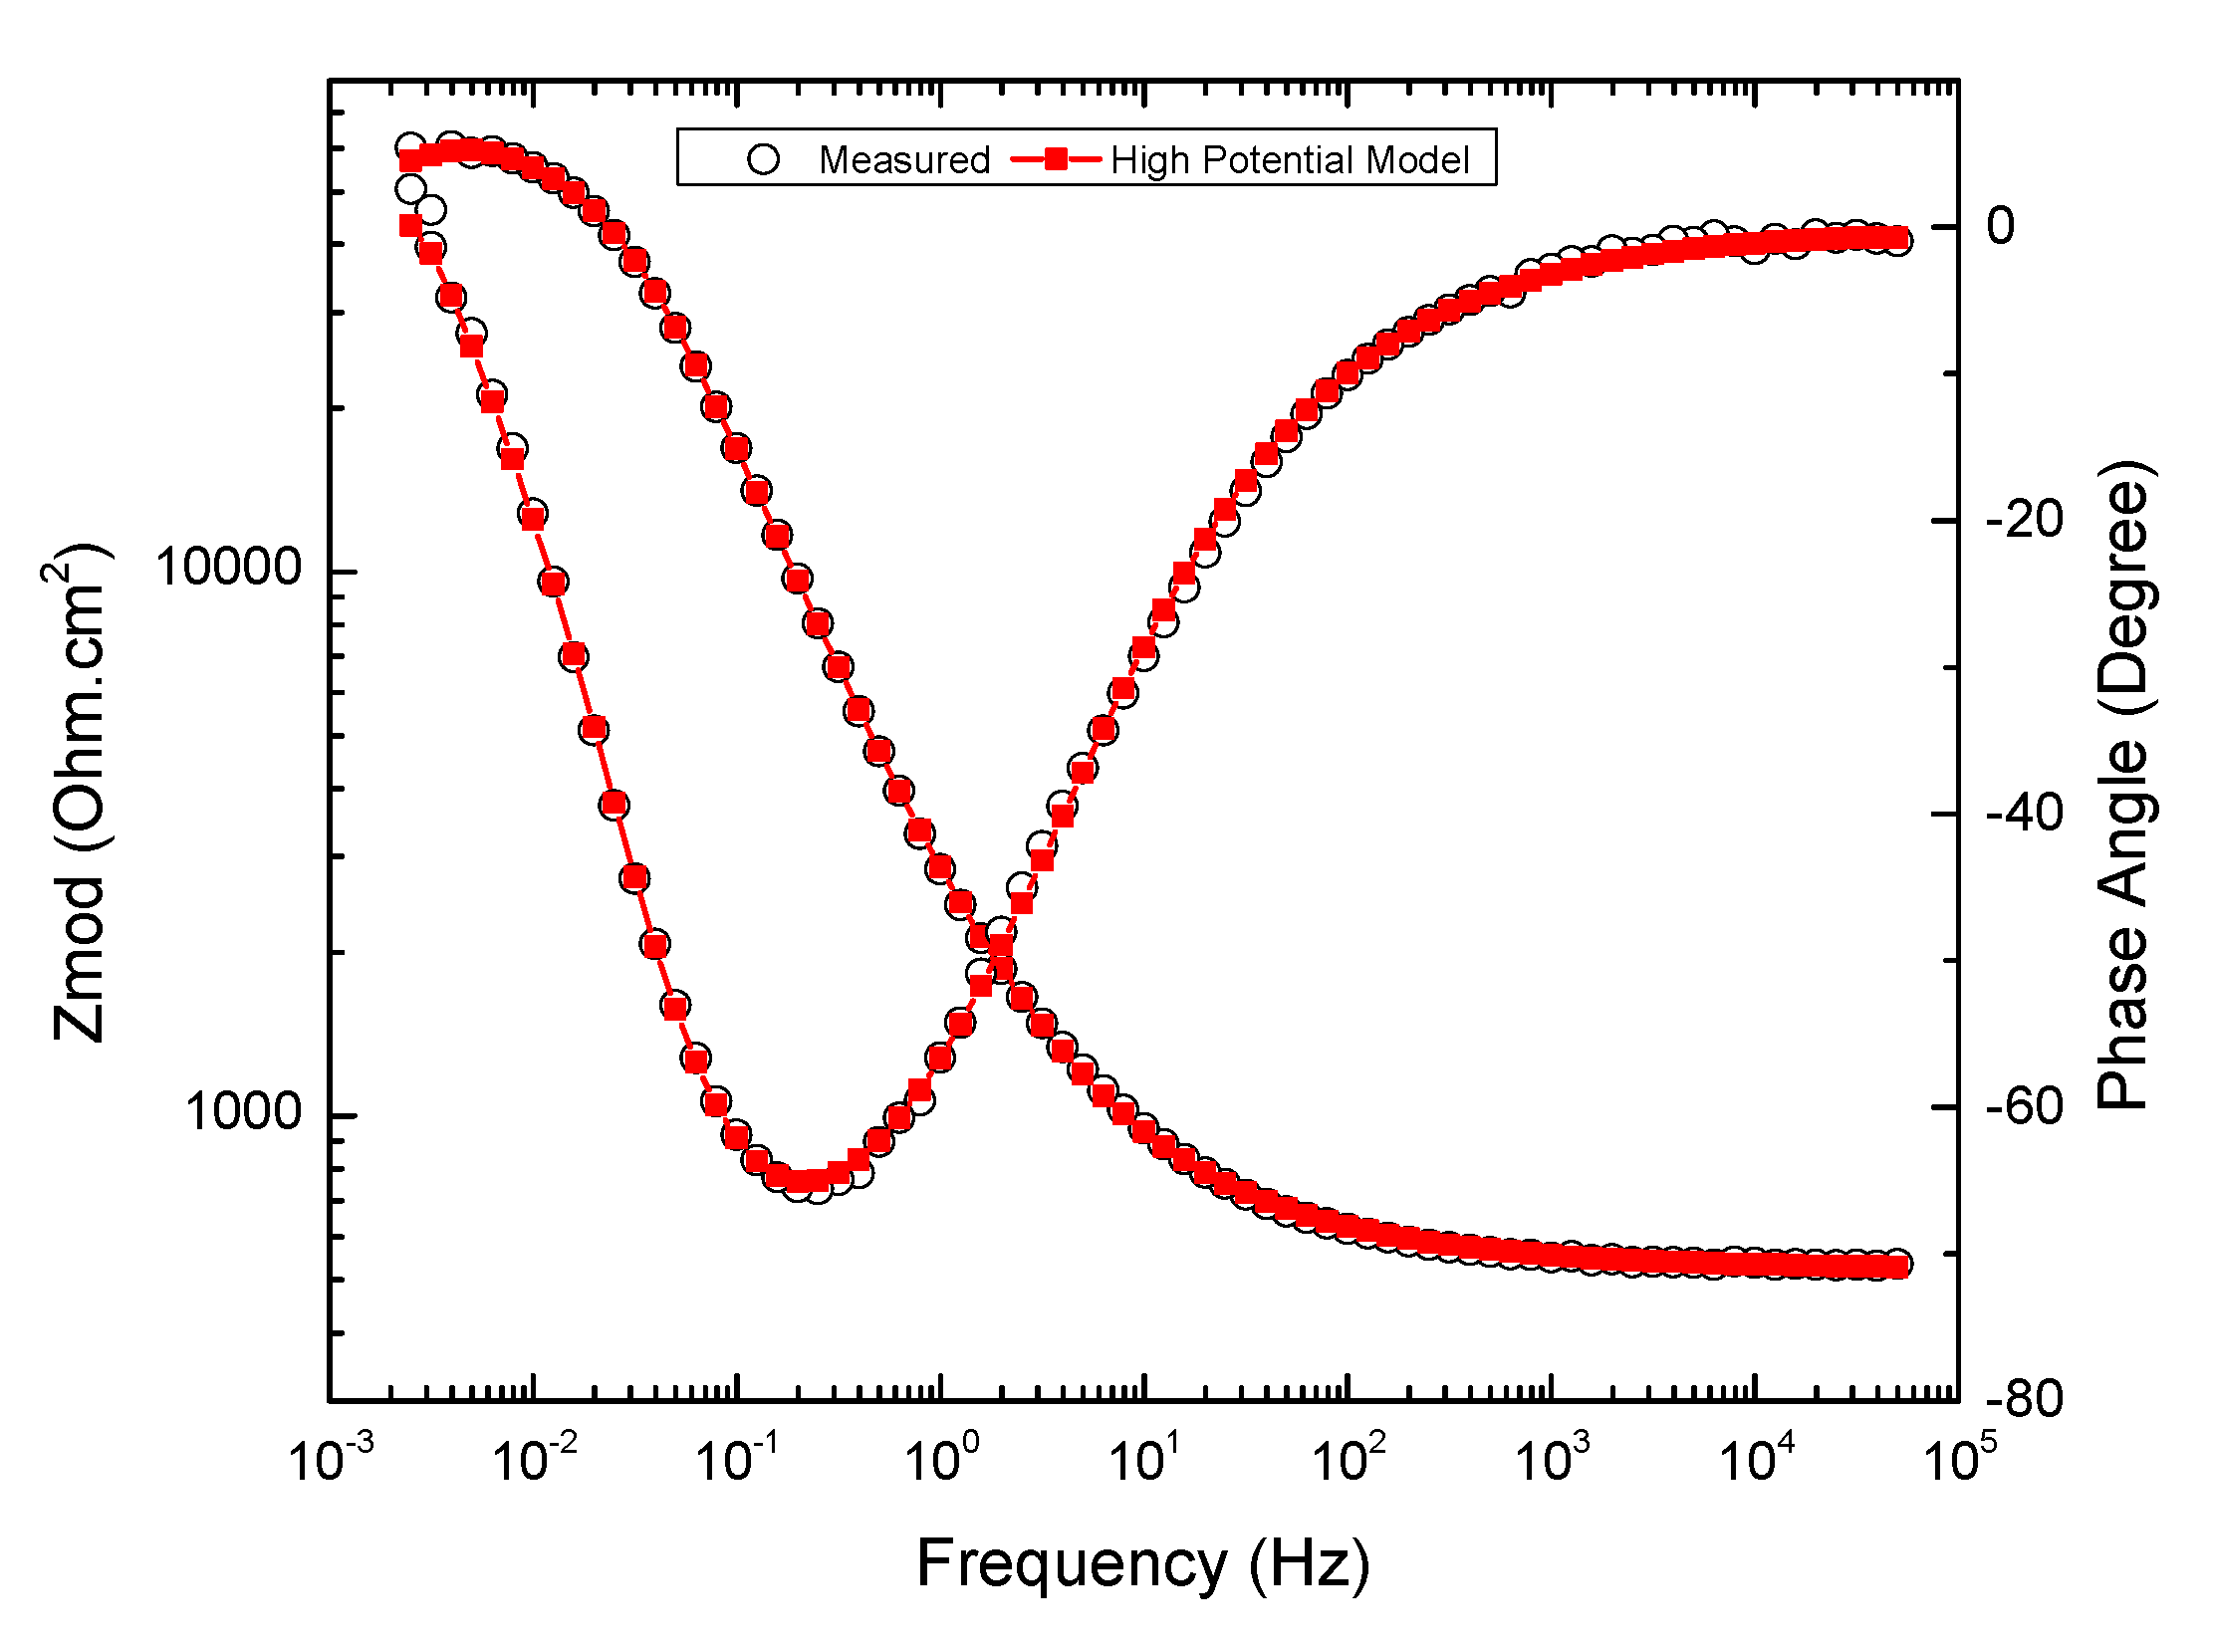
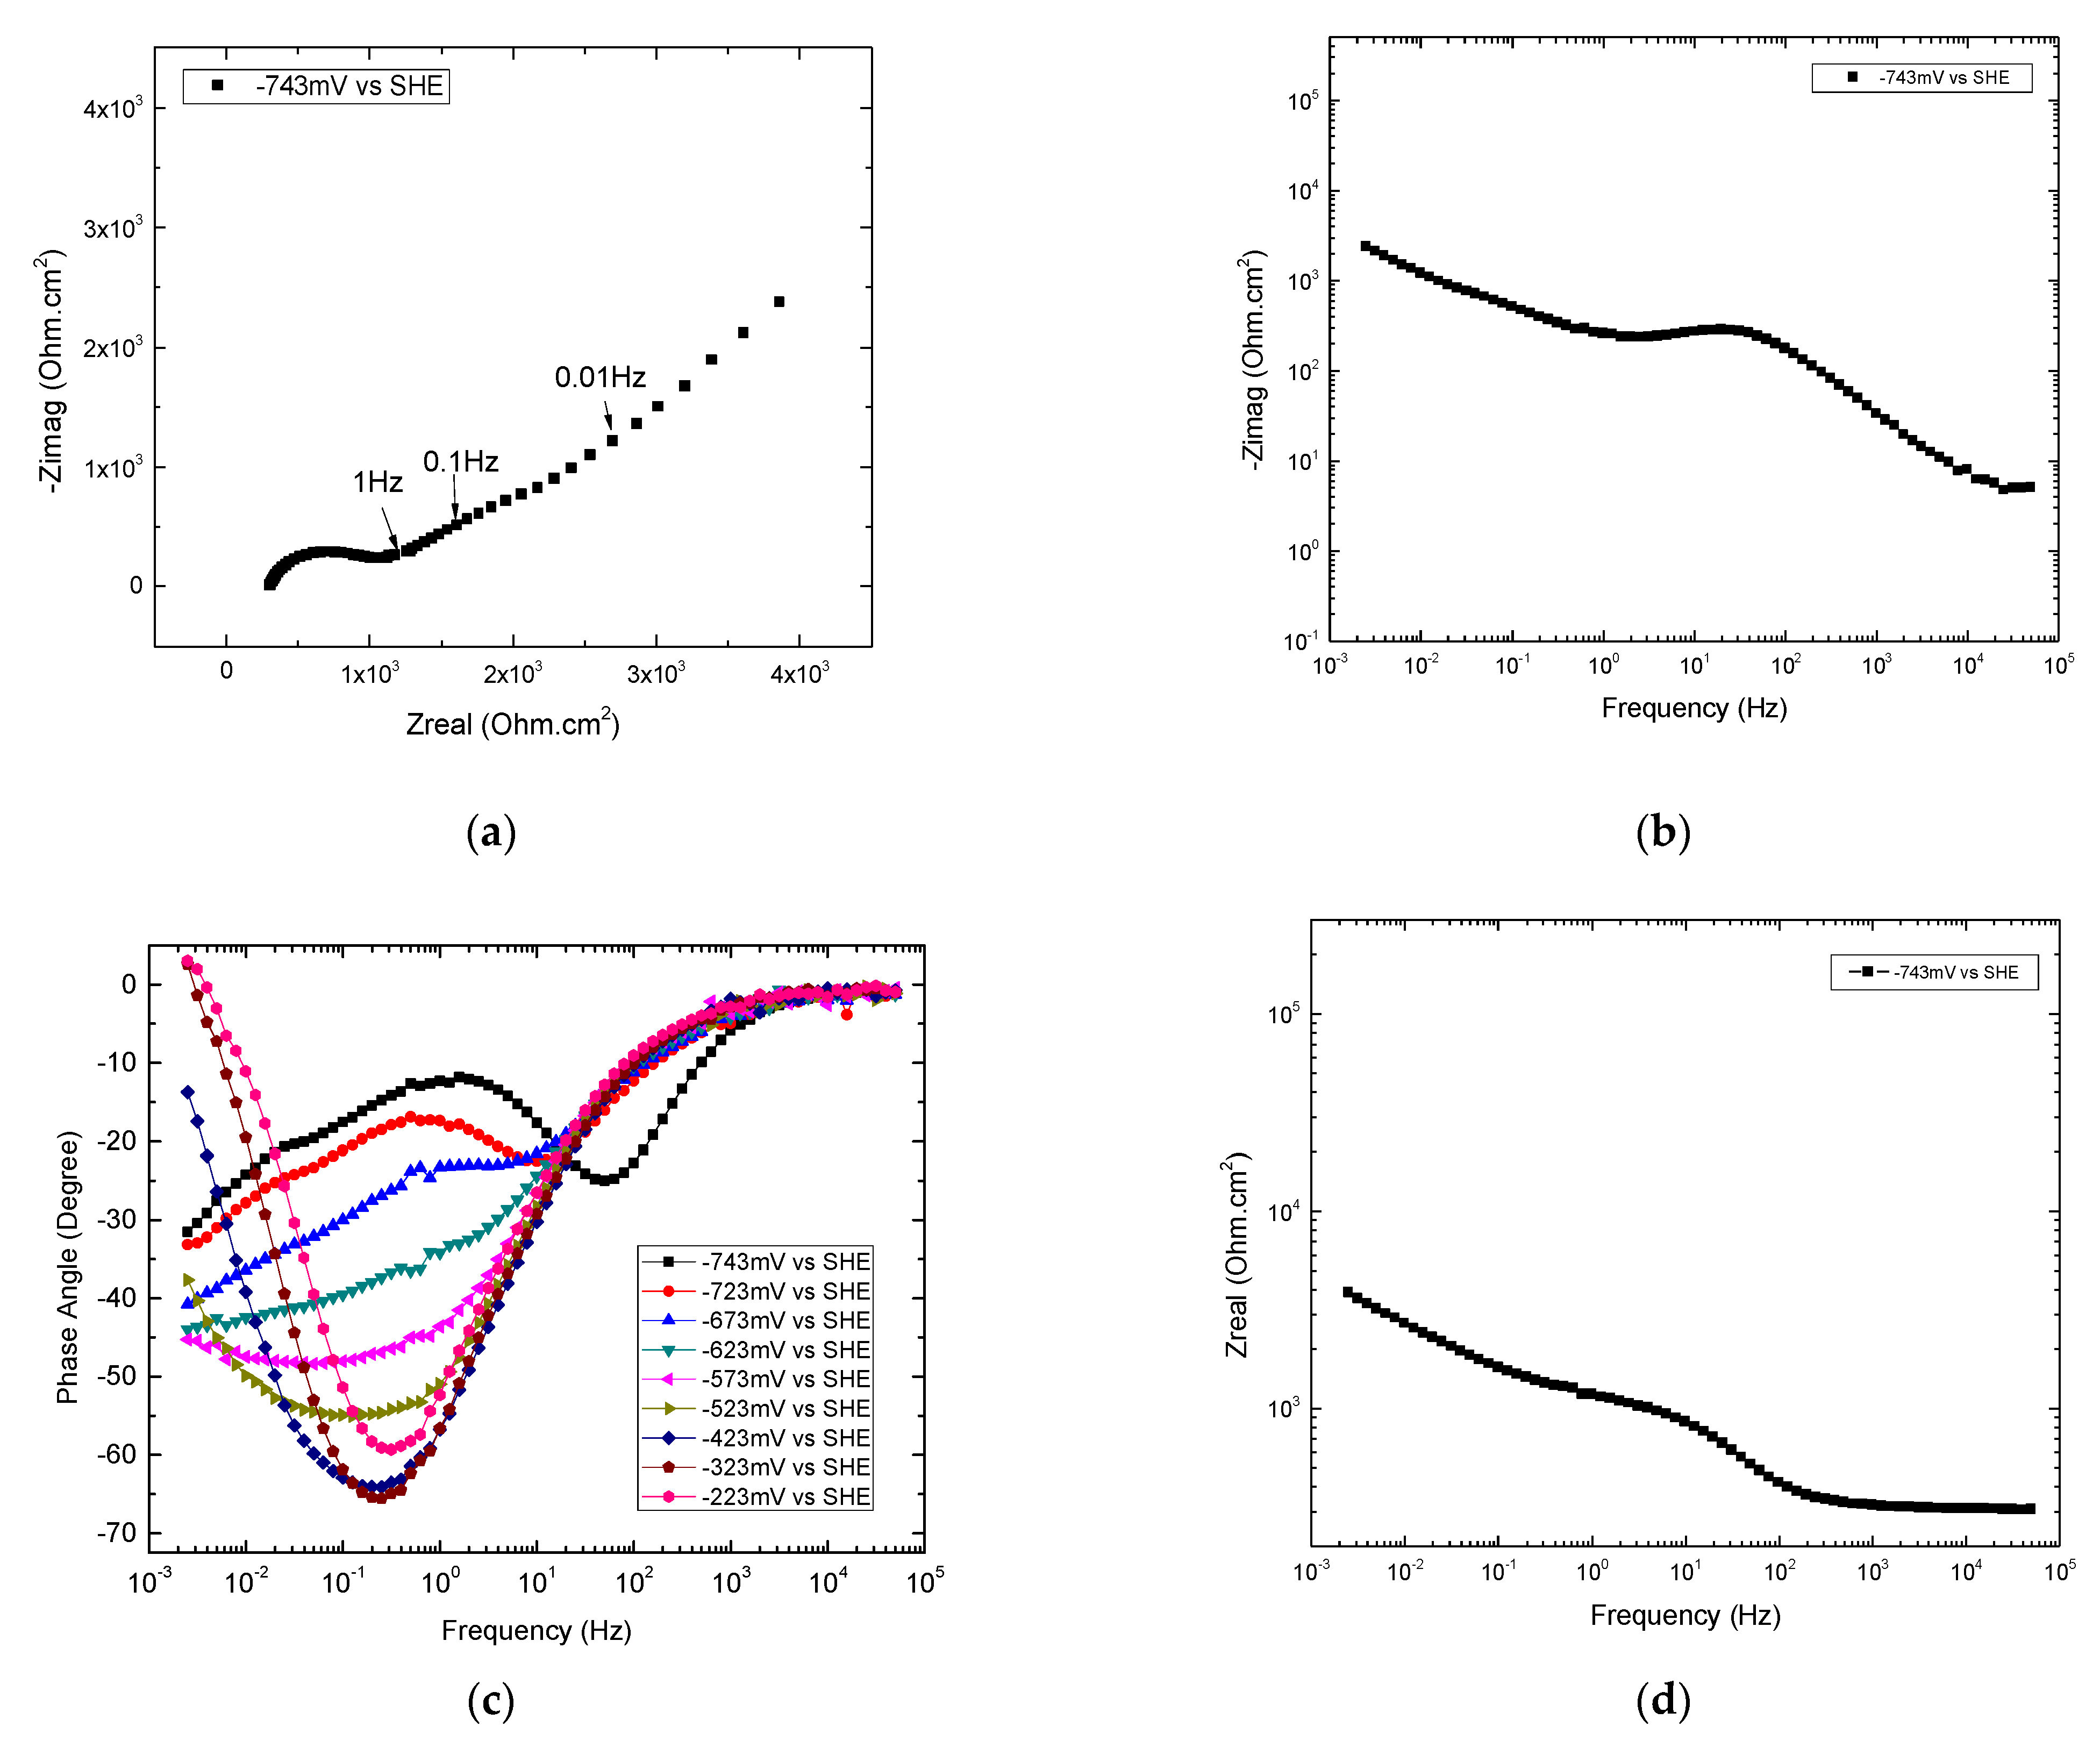
| Freq. Range | Nyquist Plot | Log Im. vs. Log Freq. | Phase Angle vs. Log Freq. | Log Real vs. Log Freq. | Components of EC |
|---|---|---|---|---|---|
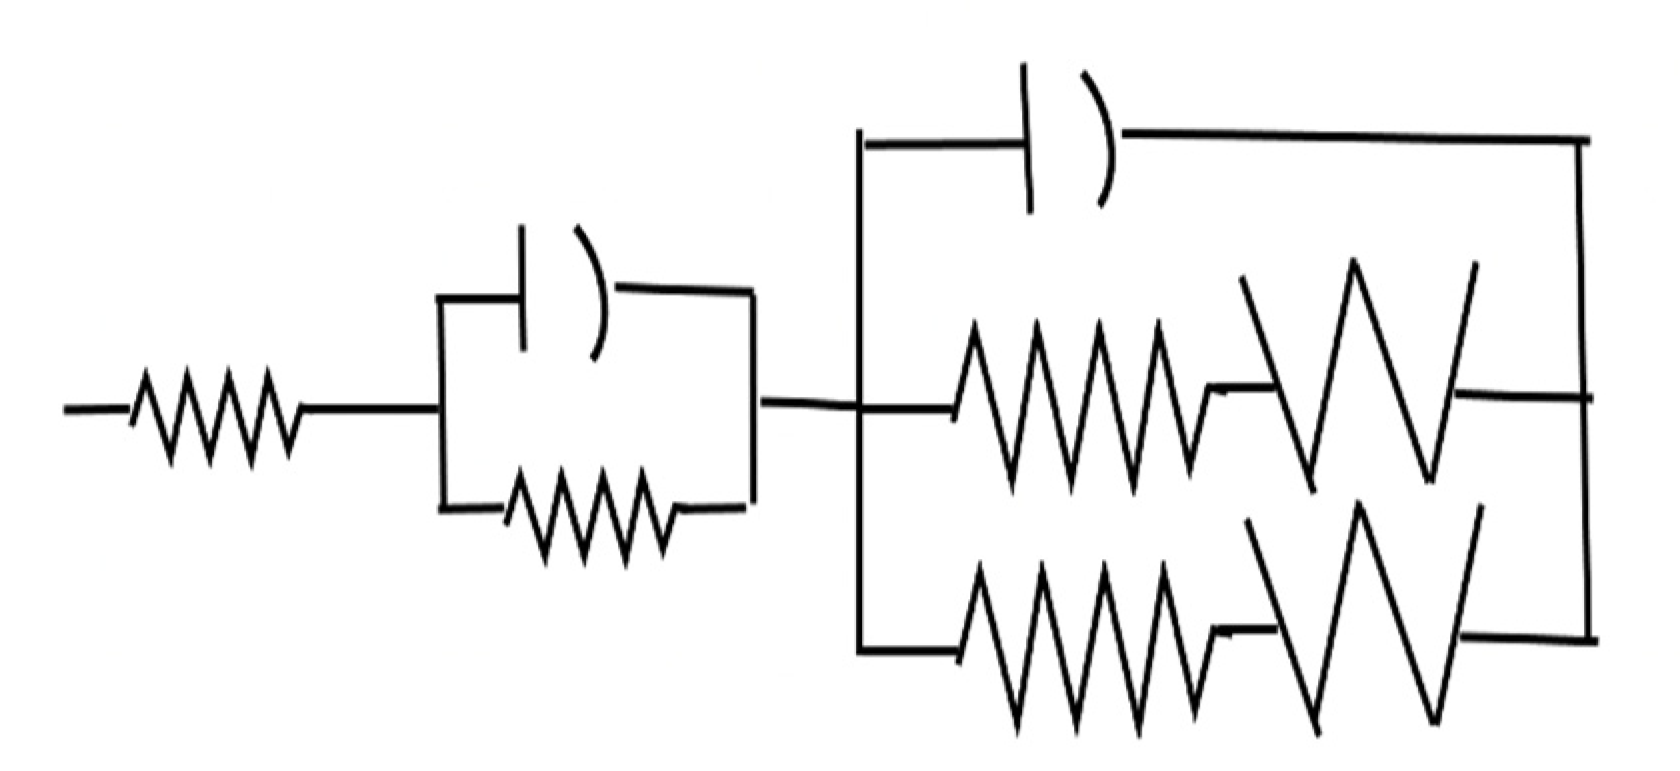
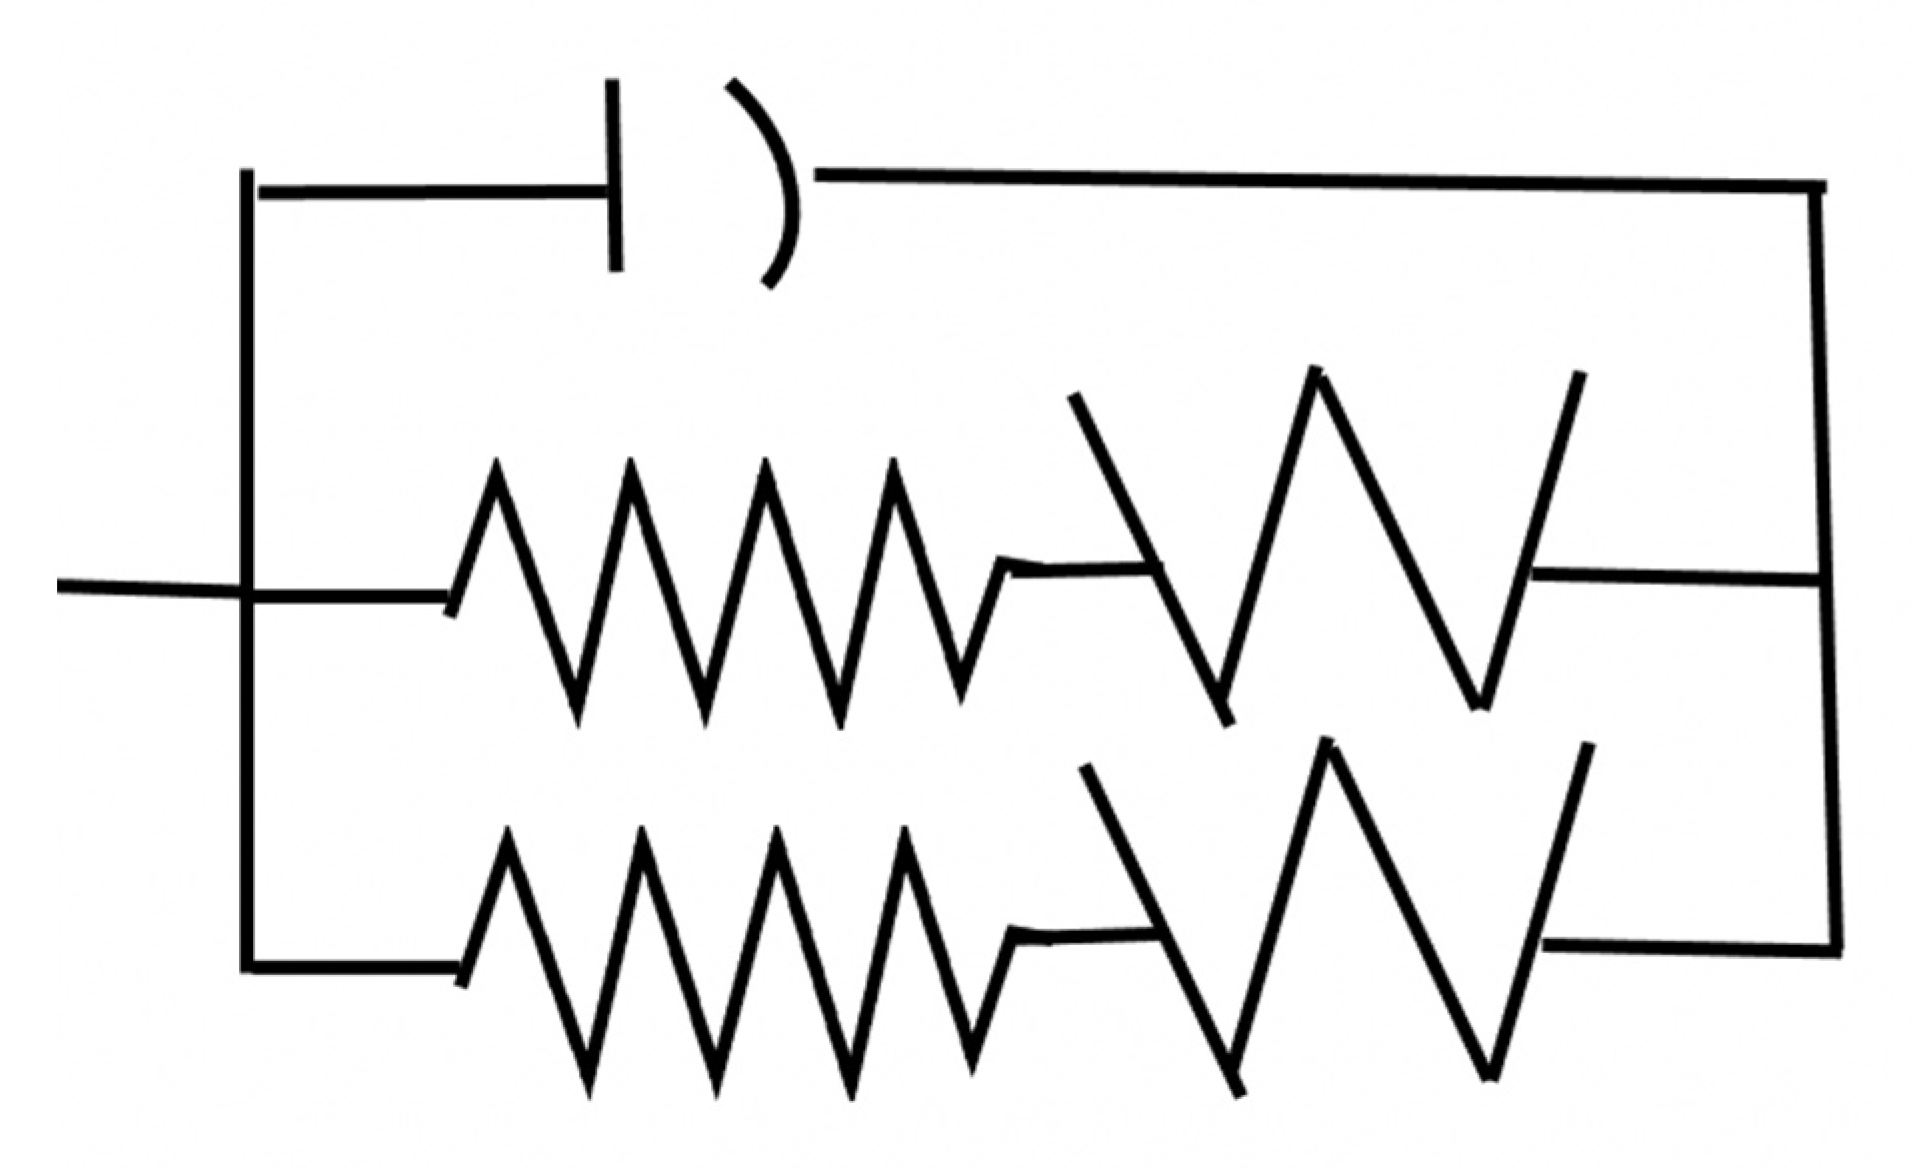
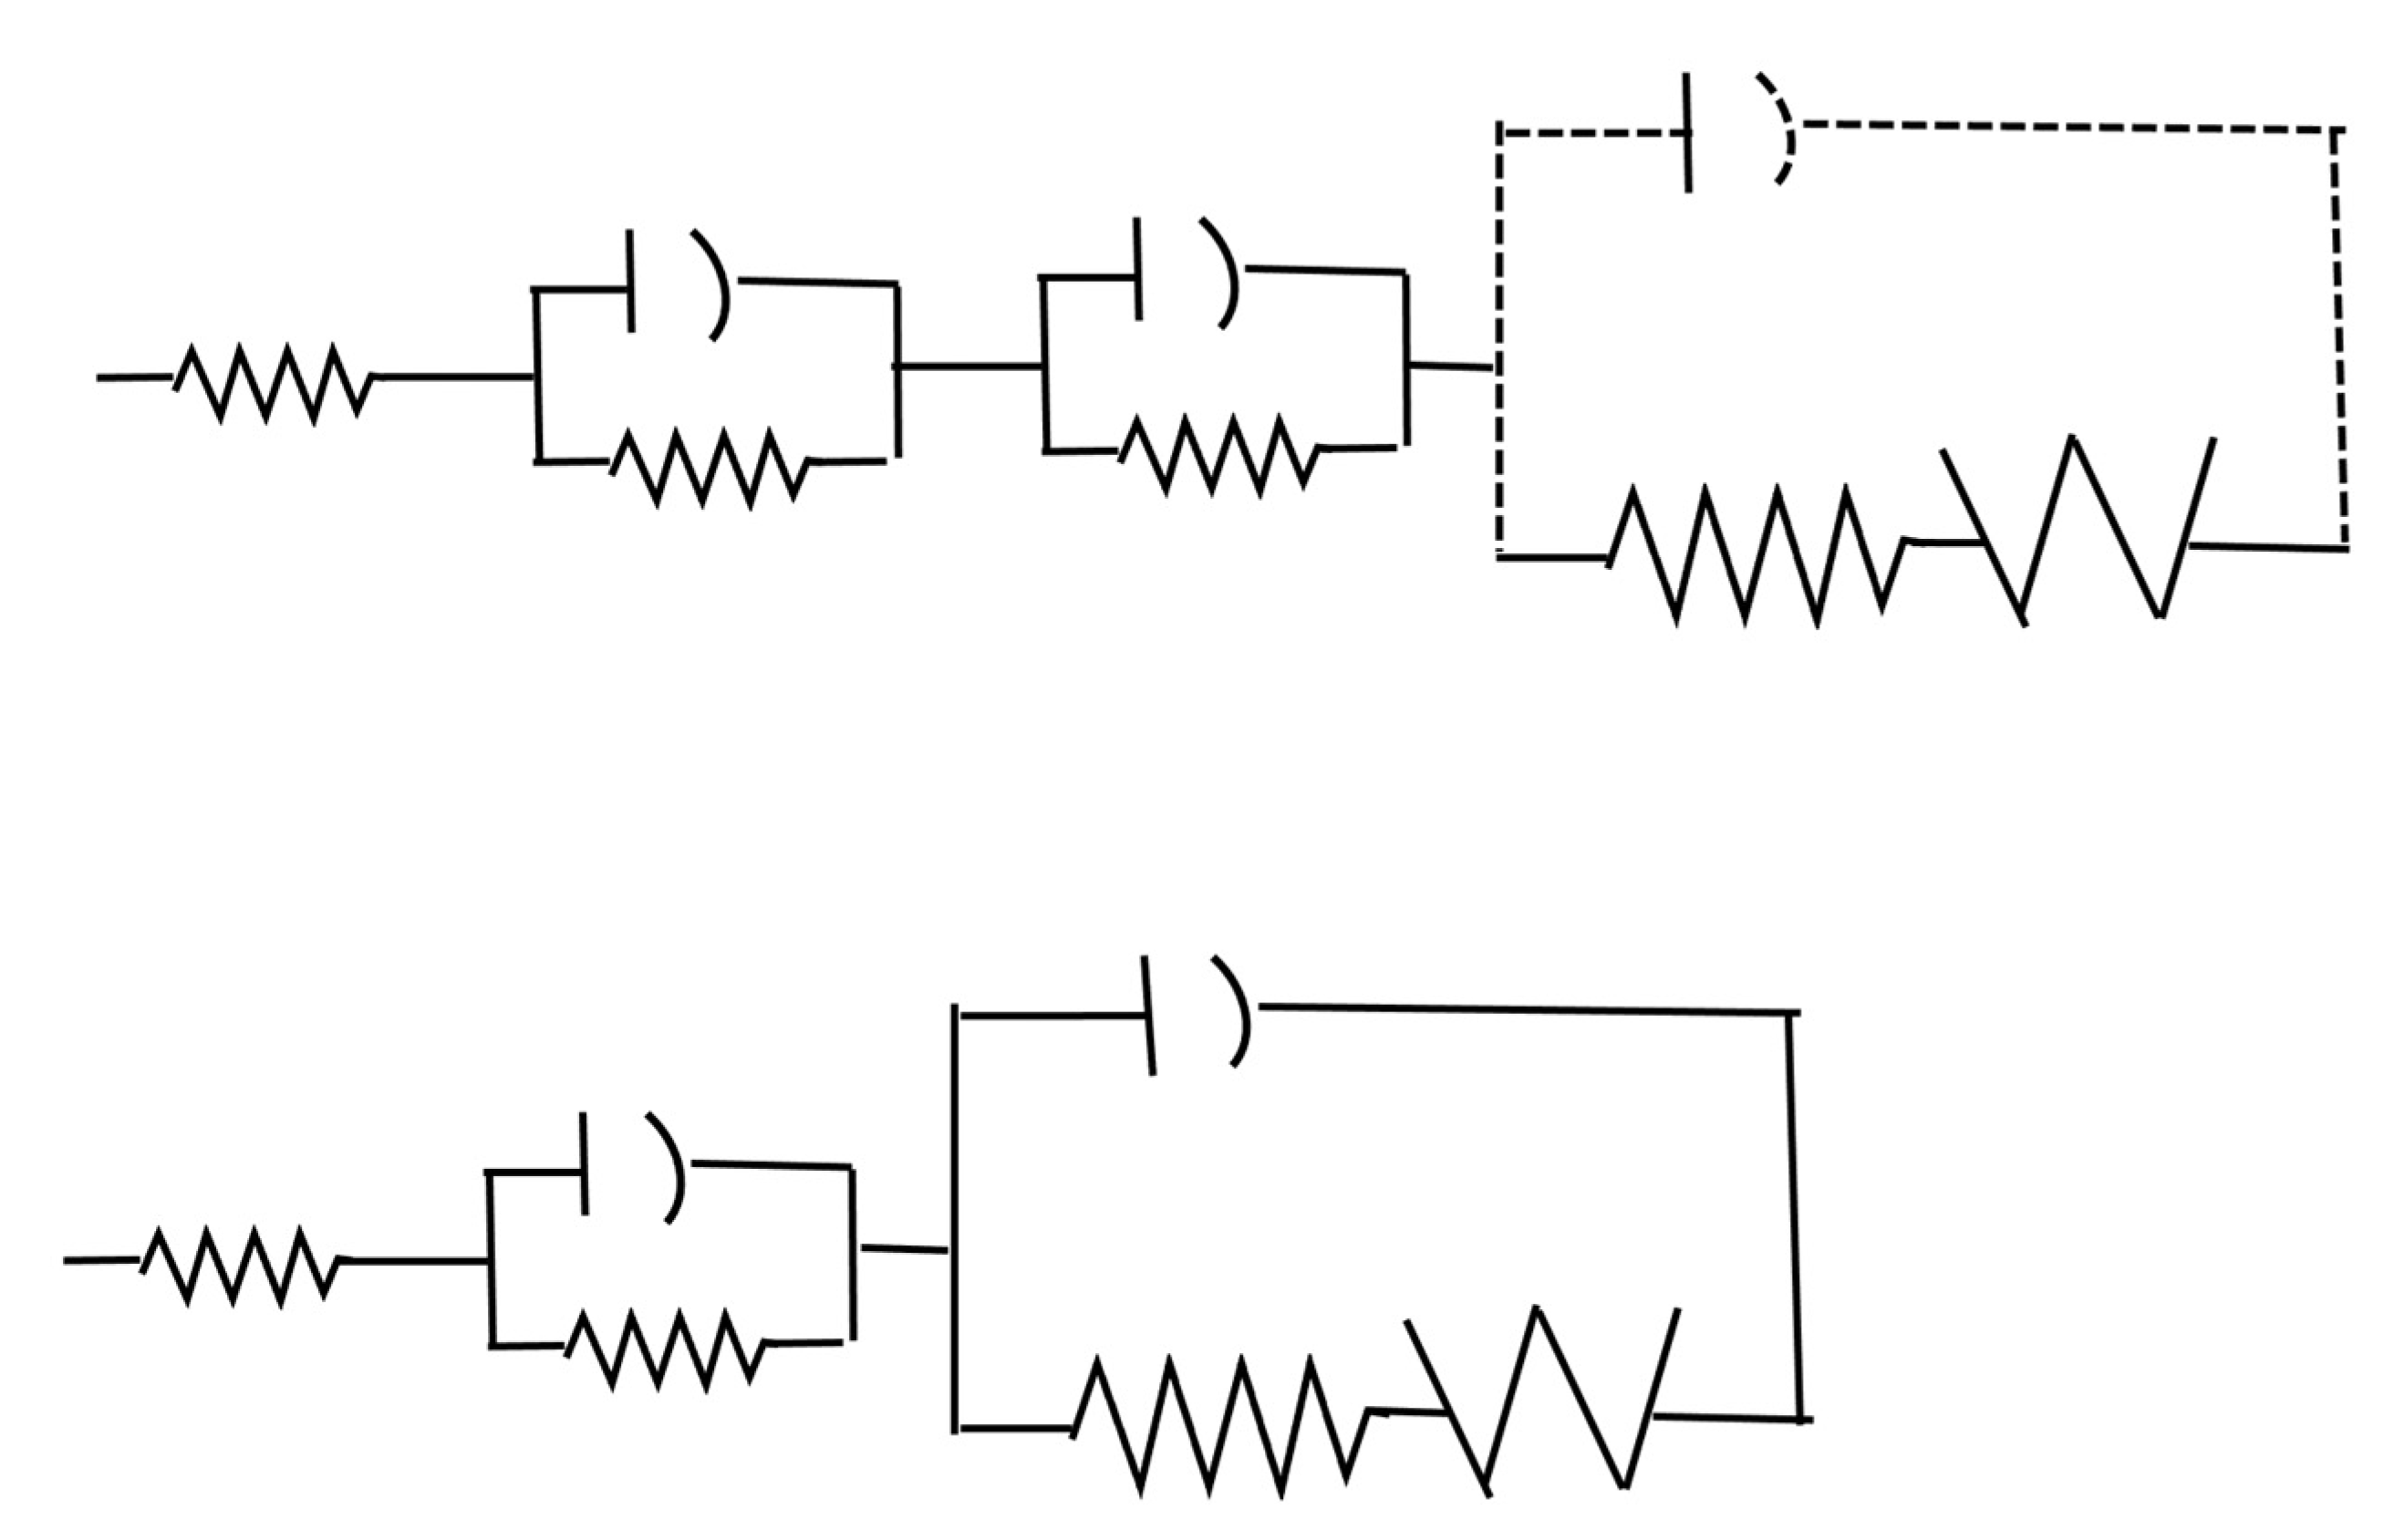
| 0.002 < Freq ≤ 0.01 Hz | Straight line of slope +0.92 | Straight line of slope −0.49 | Monotonically decreasing angle (−22° to −32°) with decreasing freq. | Straight line of slope −0.25 |Im|< |Re| | R + ZW |
| 0.02 Hz < Freq ≤ 0.4 | Portion of a circular arc | Straight line of slope −0.36 | Monotonically decreasing angle (−11° to −20°) with decreasing freq. | Gentle curve with negative slope | Ra||Ca R + ZW |
| 10 Hz < Freq. ≤ 4000 Hz | Only info is Re—Constant and Im--0 | Inverted V-shape with max. at 25 Hz; high-freq. side is str line of slope of −0.74; low-freq. side overlaps with Group II | V-shape with minimum at 40 Hz | Monotonically decreasing from 10 Hz to 500 Hz; constant at freqs. greater than 500 Hz | R||CDL |

Appendix A.2.1.2. 0.002 Hz ≤ Frequencies ≤ 0.01 Hz at −743 mV
Appendix A.2.1.3. 0.02 Hz ≤ Frequencies ≤ 0.4 Hz at −743 mV
Appendix A.2.1.4. 10 Hz ≤ Frequencies ≤ 4000 Hz at −743 mV
Appendix A.2.1.5. Summary of Graphical Analyses of EIS at −743 mV

Appendix A.2.1.6. Fit of the EC based on GA to the measured EIS
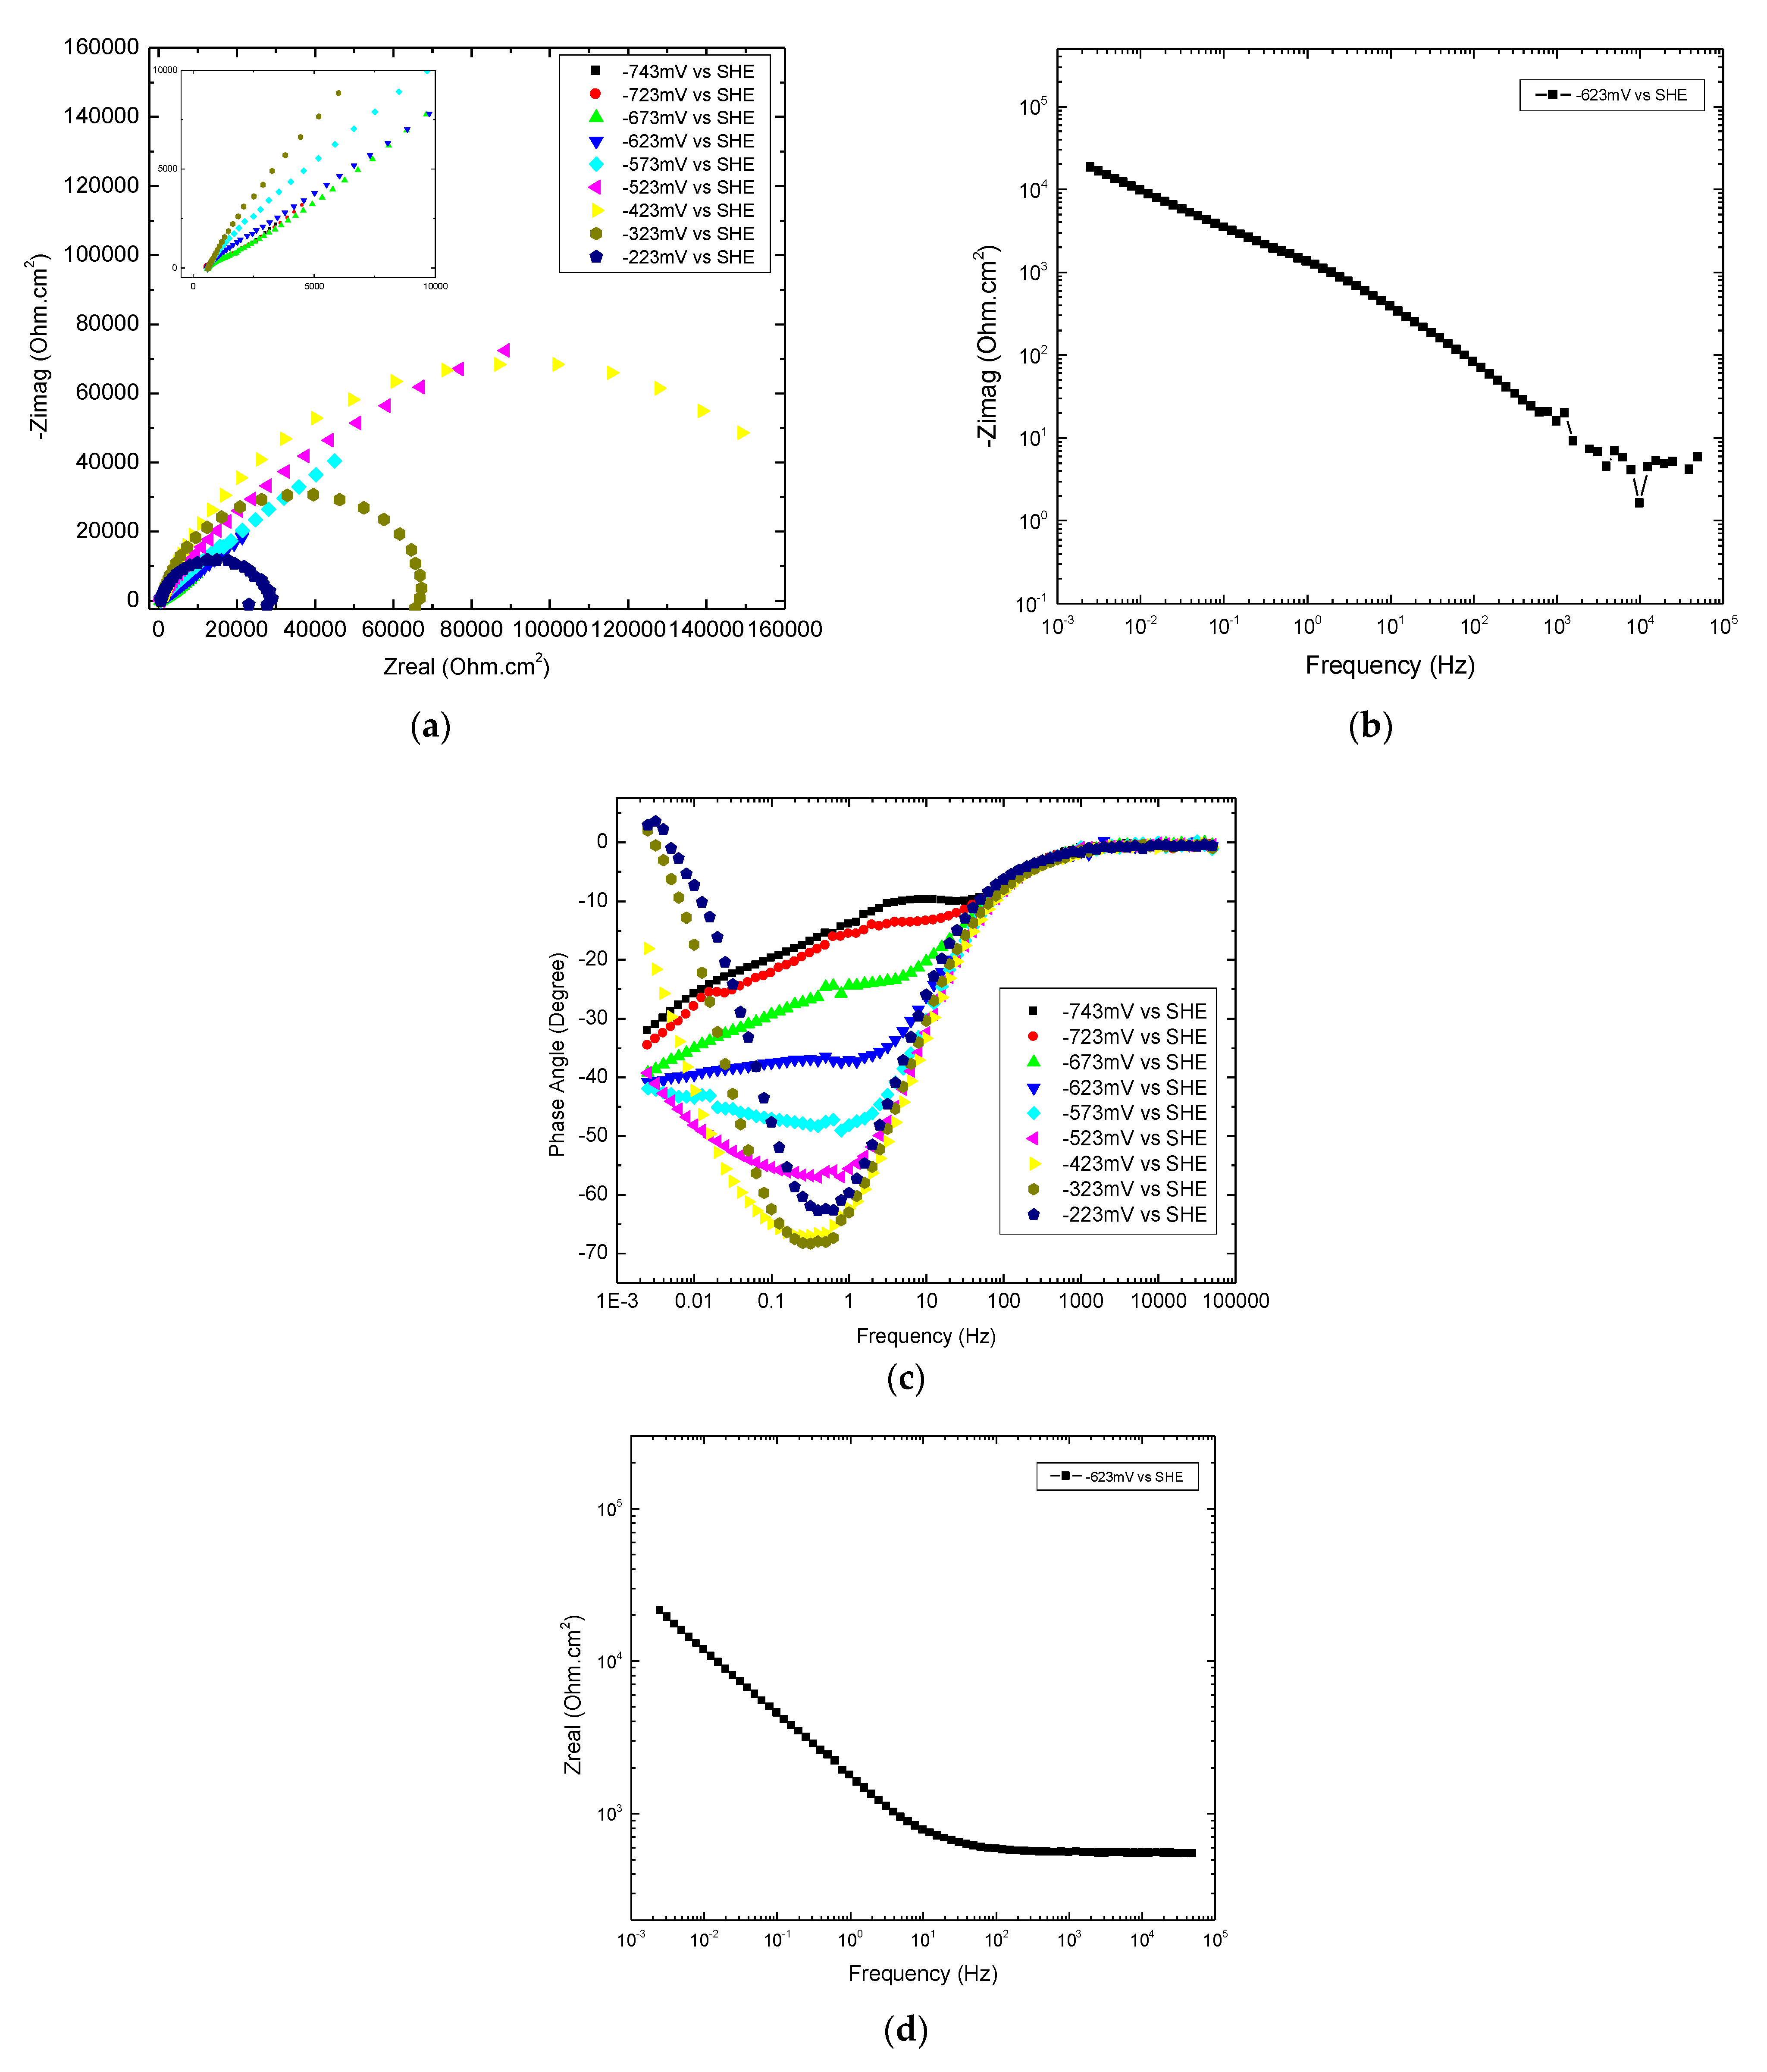
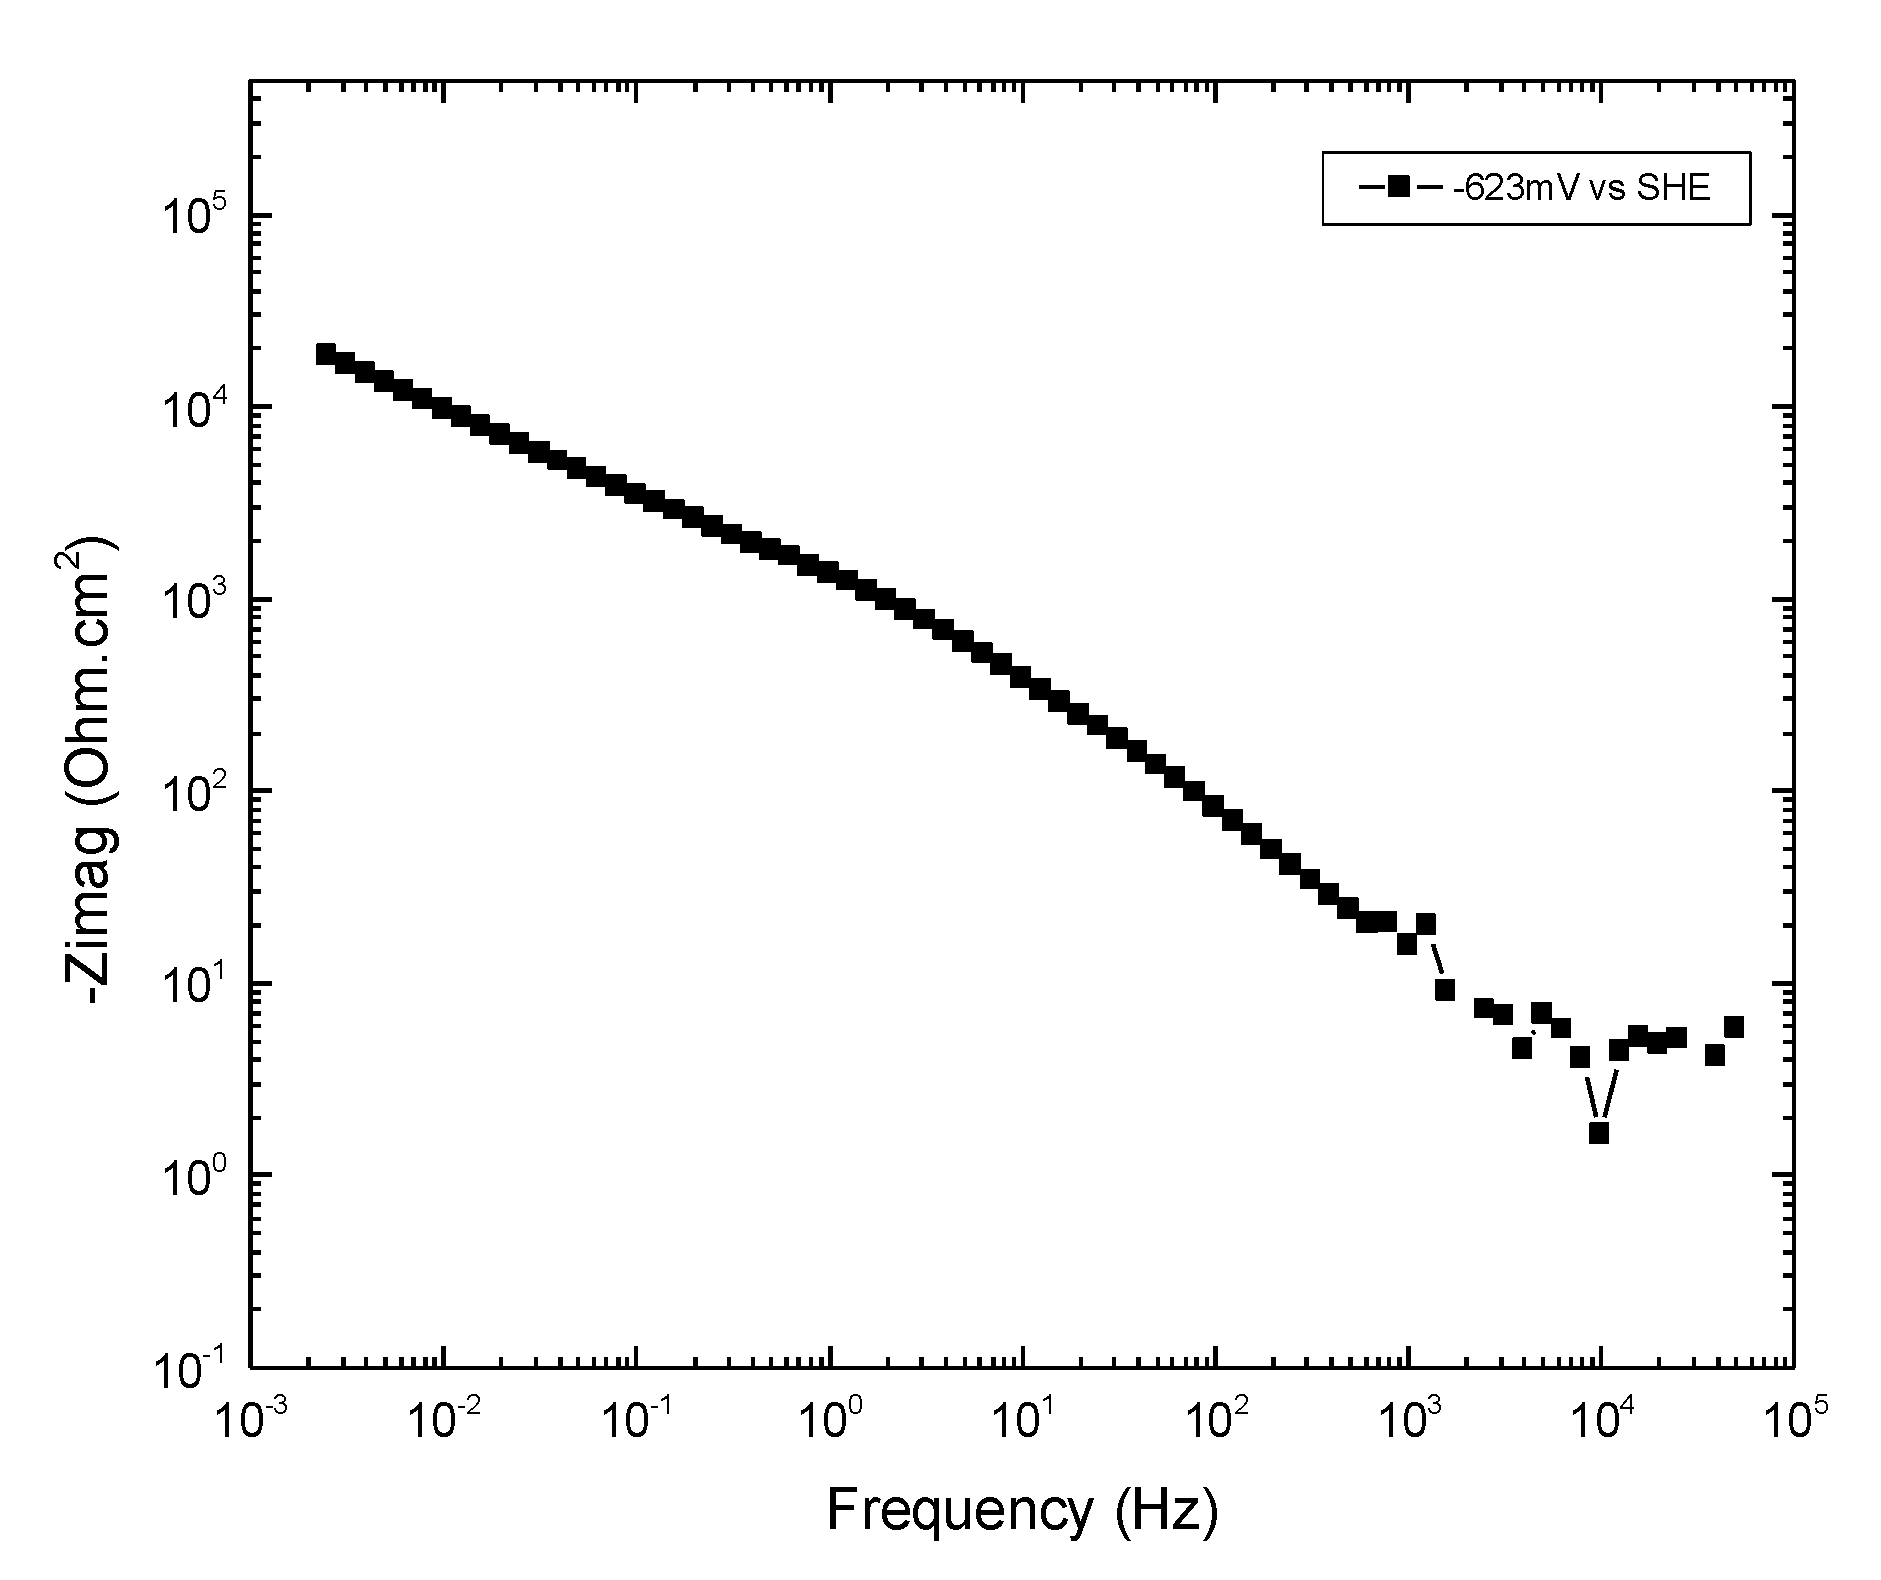
Appendix A.2.2. EIS at −623 mV and −573 mV
Appendix A.2.2.1. Overview
Appendix A.2.2.2. Frequencies ≤ 1.4 Hz at −623 mV
| Nyquist Plot | Log Im. vs. Log Freq. | Phase Angle vs. Log Freq. | Log Re. vs. Log Freq. |
|---|---|---|---|
| 0.002 Hz < Freq. ≤ 0.04 Hz Slope = −0.46 | 0.002 Hz < Freq. < 5 Hz Slope = −0.41 | ||
| 0.02 Hz < Freq. ≤ 0.4 Hz Slope = +0.84 | 0.04 Hz < Freq. ≤ 1.4 Hz Slope = −0.42 | 0.002 Hz < Freq. ≤ 1.0 Hz Phase angle = 39° − 35° | |
| Segment of circular arc starts at 1–2 Hz | 1.4 Hz < Freq. ≤ 40 Hz Gradual, downward bend 40 Hz < Freq. < 2000 Hz Slope = −0.76 1.4 Hz < Freq. ≤ 4000 Hz V-shaped with slope of ±0.76 | 2.4 Hz < Freq. ≤ 1000 Hz Smooth decrease to 0° | |
| 4000 Hz < Freq. Imped. = Resist. of 5 ohm | Phase angle = 0° | 200 Hz < Freq. Re = 550 ohms |

| Frequency | Re | Im | [Re—Im] |
|---|---|---|---|
| 0.0025 Hz | 2.1 × 10⁴ | 2.0 × 10⁴ | 1000 ≈ ROX + RS |
| 0.1 Hz | 4.4 × 10³ | 3.3 × 10³ | 1100 ≈ ROX + RS |
| 1 Hz | 1.8 × 10³ | 1.3 × 10³ | 500 ≈ RS |
| 5 Hz | 970 | 600 | 370 ≈ RS |
Appendix A.2.2.3. 1.4 Hz ≤ Frequencies ≤ 40 Hz at −623 mV


Appendix A.2.2.4. Summary of Graphical Analysis of EIS at −623
Appendix A.3. High-Frequency Response
References
- Westinghouse Nuclear Services/Engineering Services NS-ES-0089, January 2017. Available online: https://www.westinghousenuclear.com/Portals/O/operating%20plant%20services/engineering/nsss%20system%208%20component%20analysis/NS-ES-0089%20Zinc%20Addition%20Flysheet. (accessed on 1 January 2021).
- Pathania, R.; Yagnik, S.; Gold, R.; Dove, M.; Kolstad, E. Evaluation of Zinc Addition to Primary Coolant of Farley-2 Reactor. In Proceedings of the 7th International Symposium on Environmental Degradation of Materials in Nuclaer Power Systems–Water Reactors, Breckenridge, CO, USA, 6–10 August 1995; pp. 163–173. [Google Scholar]
- Pathania, R.; Cheng, B.; Dove, M.; Gold, R.; Bergmann, C. Evaluation of Zinc Addition to Primary Coolant of Farley-2 Reactor. In Proceedings of the 8th International Symposium on Environmental Degradation of Materials in Nuclaer Power Systems–Water Reactors, Amelia Island, FL, USA, 10–14 August 1997; pp. 379–386. [Google Scholar]
- Betova, I.; Bojinov, M.; Kinnunen, P.; Saario, T. Zn Injection in Pressurized Water Reactors–Laboratory Tests, Field Experience and Modeling. In Research Report No. VTT-R-05511-11; Zinc Injection Update; Haas, V.C., Perkins, D., Eds.; Technical Research Center of Finland: Otaniemi, Finland, 2011; pp. 1–5. [Google Scholar]
- Ocken, H.; Fruzzetti, K.; Frattini, P.; Wood, C.J. Recent Developments in PWR Zinc Injection. In Proceedings of the International Conference on Water Chemistry in Nuclear Reactor Systems, Avignon, France, 22–26 April, 2002. [Google Scholar]
- Haas, V.C.; Perkins, D.; Zinc Injection Update. Nuclear Engineering International. Available online: https://www.neimagazine.com/features/featurezinc-injection-update/ (accessed on 1 January 2021).
- Marble, W.J. An Overview of Zinc Addition for BWR Dose Rate Control. In Proceedings of the Third International Workshop on the Implementation of ALARA at Nuclear Power Plants, Long Island, NY, USA, 8–11 May 1994; pp. 67–84. [Google Scholar]
- Kawamura, H.; Hirano, H.; Shirai, S.; Takamatsu, H.; Matsunaga, T.; Yamaoka, K.; Oshinden, K.; Takiguchi, H. Inhibitory Effect of Zinc Addition to High-Temperature Hydrogenated Water on Mill-Annealed and Prefilmed Alloy 600. Corrosion 2000, 56, 623–637. [Google Scholar] [CrossRef]
- Ziemniak, S.E.; Hanson, M. Zinc Treatment Effects on Corrosion Behavior of Alloy 600 in High Temperature, Hydrogenated Water. Corros. Sci. 2006, 48, 3330–3348. [Google Scholar] [CrossRef] [Green Version]
- Alvial, M.G.; Neves, C.F.C.; Schvartzman, M.M.A.M.; Quinan, M.A.D. Electrochemical Evaluation of Zinc Effect on the Corrosion of Nickel Alloy in PWR Solutions with Increasing Temperature. In Proceedings of the 2007 International Nuclear Atlantic Conference–INAC, Santos, Brazil, 30 September–5 October 2007. [Google Scholar]
- Esposito, J.N.; Economy, G.J.; Byers, W.A.; Esposito, J.B.; Peinent, F.W.; Jacko, R.J.; Bergmann, C.A.R. The Addition of Zinc to Primary Reactor Coolant for Enhanced PWSCC Resistance. In Proceedings of the Fifth International Conference on Environmental Degradation of Materials in Nuclear Power Systems–Water Reactors; American Nuclear Society: LaGrange Park, IL, USA, 1991. [Google Scholar]
- Gold, B. Materials Reliability Program: Effect of Zinc Additions on Mitigation of Primary Water Stress Corrosion Cracking of Alloy 600 (MRP-78); EPRI: Palo Alto, CA, USA, 2002; P. 100 3522.
- Kawamura, H.T.; Hirano, H.; Yamaoka, K.; Shirai, S.; Oshindfen, K.; Takamatsu, H.; Matsunaga, T.; Takiguchi, H. The Effect of Zinc Addition to Simulated PWR Primary Water on the PWSCC Resistance, Crack Growth Rate and Surface Oxide Film Characteristics on Prefilmed Alloy 600. Corrosion 1998, 98, 141. [Google Scholar]
- Andresen, P.L.; Hickling, J.; Ahluwalia, K.S.; Wilson, J.A. Effects of PWR Water Chemistry on PWSCC of Ni Alloys. In Proceedings of the 13th International Conference on Environmental Degradation of Materials in Nuclear Power Systems, Whistler, BC, Canada, 19–23 August 2007. [Google Scholar]
- Gordon, B.M.; Garcia, S. Effect of Water Purity on Intergranular Stress Corrosion Cracking of Stainless Steel and Nickel Alloys in BWRs. In Proceedings of the Fontevraud 7 Contributions of Materials Investigations to Improve the Safety and Performance of LWRs, Avignon, France, 26–30 September 2010. [Google Scholar]
- Andresen, P.L.; Angeliu, T.M. Effect of Zinc Additions on the Stress Corrosion Crack Growth Rates of Sensitized Stainless Steel, Alloy 600 and Alloy 182 Weld Metal in 288°C Water. Corrosion 1995, 95, 410. [Google Scholar]
- Angeliu, T.M.; Andresen, P.L. Effect of Zinc Additions on the Oxide Rupture Strain and Repassivation Kinetics of Fe-base Alloys in 288 °C Water. Corrosion 1995, 95, 411. [Google Scholar]
- Bojinov, M.; Galtayries, A.; Kinnuneu, P.; Machet, A.; Marcus, P. Estimation of Parameters of Oxide Film Growth on Ni-Based Alloys in High Temperature Water Electrolytes. Electrochim. Acta 2007, 52, 7475–7483. [Google Scholar] [CrossRef]
- Abraham, G.J.; Kain, V.; Dey, G.K.; Raja, V.S. Stabi;ity of Oxide Film Formed at Different Temperatures on Alloy 600 in Lithiated Environment. J. Nucl. Mater. 2013, 437, 188–195. [Google Scholar] [CrossRef]
- Lai, W.-K.; Szklarska-Smialowska, Z.W. Effect of Heat Treatment on the Behavior of alloy 600 in Lithiated Water Containing Dissolved Hydrogen at 25–350 °C. Corrosion 1991, 47, 40–47. [Google Scholar] [CrossRef]
- Szklarska-Smialowska, Z.; Lai, W.-K.; Xia, Z. oxide Films Formed on Alloy 600 in Lithiated Water at 25° to 350 °C. Corrosion 1990, 46, 853–860. [Google Scholar] [CrossRef]
- Kim, D.-J.; Kwon, H.-C.; Kim, H. Effect of Solution Temperature and the pH on the Electrochemical Properties of the Surface Oxide Film Formed on Alloy 600. Corros. Sci. 2008, 50, 1221–1227. [Google Scholar] [CrossRef]
- Huang, J.; Wu, X.; Han, E.-H. Influence of pH on the Electrochemical Properties of Passive Films Formed on Alloy 690 in High Temperature Aqueous Environments. Corros. Sci. 2009, 51, 2976–2982. [Google Scholar] [CrossRef]
- Huang, F.; Wang, J.; Han, E.-H.; Ke, W. Microstructural Characteristics of the Oxide Films Formed on Alloy 690TT in Pure and Primary Water at 325 °C. Corros. Sci. 2013, 76, 52–59. [Google Scholar] [CrossRef]
- Huang, J.; Liu, X.; Han, E.-H. Influence of Zinc on Oxide Films on Alloy 690 in Borated and Lithiated High Temperature Water. Corros. Sci. 2011, 51, 3254–3261. [Google Scholar] [CrossRef]
- Faichuk, M.G. Characterization of the Corrosion and Oxide Film Properties of alloy 600 and Alloy 800. PhD. Thesis, The University of Western Ontario, Ontario, ON, Canada, 2013. [Google Scholar]
- Terachi, T.; Totsuka, N.; Yamada, T.; Nakagawa, T.; Deguchi, H.; Horiuchi, M.; Oshitani, M. Influence of Dissolved Hydrogen on Structure of Oxide Film on Alloy 600 Formed in Primary Water of PWRs. J. Nucl. Sci. Technol. 2003, 40, 509–516. [Google Scholar] [CrossRef]
- Peng, Q.; Hou, J.; Sakaguchi, K.; Takeda, Y.; Shoji, T. Effect of Dissolved Hydrogen on Corrosion of Inconel Alloy 600 in High Temperature Hydrogenated Water. Electrochim. Acta 2011, 56, 8357–8386. [Google Scholar] [CrossRef]
- Loucif, A.; Petit, J.-P.; Wouters, Y.; Combrade, P. Effect of Dissolved Hydrogn, Surface Conditions and Composition on the Electronic Properties of the Oxide Films formed on Ni-base Alloys in PWR Primary Water. In Proceedings of the 15th International Conference on Environmental Degradation; Busby, J., Ilevbare, G., Andresen, P., Eds.; TMS: Pittsburgh, PA, USA, 2011; pp. 953–963. [Google Scholar]
- Peng, Q.; Shoji, T.; Hou, J.; Sakaguchi, K.; Takeda, Y. Role of Dissolved Hydrogen in Water in Corrosion of Alloy 600 in High Temperature Water. In Proceedings of the 15th International Conference on Environmental Degradation; Busby, J., Ilevbare, G., Andresen, P., Eds.; TMS: Pittsburgh, PA, USA, 2011; pp. 1879–1888. [Google Scholar]
- Zhang, Z.; Wang, J.; Han, E.-H.; Ke, W. Influence of Dissolved Oxygen on Oxide Films of Alloy 690TT with Different Surface Status in Simulated Primary Water. Corros. Sci. 2011, 53, 3623–3635. [Google Scholar] [CrossRef]
- Yang, J.; Li, Y.; Macdonald, D.D. Effects of Temperature and pH on the Electrochemical Behavior of Alloy 600 in Simulated PWR Primary Water. J. Nucl. Mater. 2020, 528, 1–16. [Google Scholar] [CrossRef]
- Machet, A.; Galtayries, A.; Zanna, S.; Klein, L.; Maurice, V.; Jolivet, P.; Foucault, M.; Combrade, P.; Scott, P.; Marcus, P. XPS and STM Study of the Growth and Structure of Passive Films in High Temperature Water on a Ni-base Alloy. Electrochim. Acta 2004, 49, 3957–3964. [Google Scholar] [CrossRef]
- Machet, A.; Galtayries, A.; Marcus, P.; Combrade, P.; Jolivet, P.; Scott, P. XPS Study of Oxides Formed on Ni-base Alloys in High Temperature and High Pressure Water. Surf. Interface Anal. 2002, 34, 197–200. [Google Scholar] [CrossRef]
- Voyshnis, S.; Seyeux, A.; Zanna, S.; Martin-Cabanas, B.B.; Couvant, T.; Marcus, P. Oxide Layer Growth on Nickel-base Alloy Surfaces in High Temperature Water and in O2 Studied by ToF-SIMS with Isotropic Tracers. Corros. Sci. 2018, 145, 212–219. [Google Scholar] [CrossRef]
- Kaufman, L. Pourbaix Diagrams of Ternary Ni-Cr-Fe Alloys in Water at 325 °C with 2 ppm LiOH and 1200 ppm H3BO3; EPRI: Palo Alto, CA, USA, 2008. [Google Scholar]
- Huang, J.; Wu, X.; Han, E.-H. Electrochemical Properties and Growth Mechanisms of Passive Films on Alloy 690 in High Temperature Alkaline Environments. Corros. Sci. 2010, 52, 3444–3452. [Google Scholar] [CrossRef]
- Bojinov, M.; Kinnunen, P.; Sunduolm, G. Electrochemical Behavior of Nickel-Chromium Alloys in a High temperature Aqueous Electrolyte. Corrosion 2003, 59, 91–103. [Google Scholar] [CrossRef]
- Mintz, T.S. An In-Situ Investigation of the Passive Film on Stainless Steel and Inconal 600 in High Temperature, Pressurized, Impurity Containing Water. Ph.D. thesis, University of California, Berkeley, CA, USA, 2003. [Google Scholar]
- Mintz, T.S.; Bhargava, Y.V.; Thorne, S.A.; Chopdekar, R.; Radmilovic, V.; Suzuki, Y.; Devine, T.M. Electrochemical Synthesis of Functionalized Nickel Oxide Nanowires. Electrochem. Solid State Lett. 2005, 8, D26–D30. [Google Scholar] [CrossRef]
- Cliff, G.; Lorimer, G.W. The Quantitative Analysis of Thin Specimens. J. Microsc. 1975, 103, 203–207. [Google Scholar] [CrossRef]
- Wang, F. In-situ Surface Enhanced Raman Spectroscopy Investigation of the Surface Films of Alloy 600 and Alloy 690 in Pressurized Water Reactor–Primary Water. Ph.D. Thesis, Department of Materials Science and Engineering, University of California, Berkeley, CA, USA, 2012. [Google Scholar]
- Wang, F.; Devine, T.M. In-situ Surface Enhanced Raman Spectroscopy Investigation of the Surface Films Formed on Nickel and Chromium in High-temperature and High-pressure Water. At. Energy Sci. Technol. 2013, 47, 7. [Google Scholar]
- Wang, F.; Devine, T.M. Corrosion Behavior of Ni-base Alloys of Nuclear Power Steam Generator Tubes in High-Temperature, High-Pressure Water. Corros. Sci. Prot. Technol. 2015, 27, 19–24. [Google Scholar]
- Wang, F.; Devine, T.M. Oxide Films Film Formed on Nickel-based Alloys in simulated PWR Primary Water. Corros. Sci. Prot. Technol. 2015, 27, 339–344. [Google Scholar] [CrossRef]
- Orzem, M.; Tribollet, B. Electrochemical Impedance Spectroscopy, 2nd ed.; John Wiley & Sons, Inc.: Hoboken, NJ, USA, 2017; pp. 202–205. [Google Scholar]
- Orazem, M.E.; Pébère, N.; Tribollet, B. Enhanced Graphical Representation of Electrochemical Impedance Data. J. Electrochem. Soc. 2006, 153, B129–B136. [Google Scholar] [CrossRef]


| Potential | Oxygen | Chromium | Iron | Nickel |
|---|---|---|---|---|
| −695 mV | 57.0 | 2.2 | 7.6 | 33.3 |
| −565 mV | 59.5 | 2.0 | 3.4 | 35.1 |
| −223 mV | 53.4 | 3.6 | 8.8 | 34.1 |
| Potential | Oxygen | Chromium | Iron | Nickel | Zinc |
|---|---|---|---|---|---|
| −690 mV | 60.7 | 1.1 | 4.3 | 19.0 | 14.9 |
| −570 mV | 73.5 | 0.1 | 4.5 | 15.3 | 6.5 |
| −223 mV | 58.3 | 4.9 | 6.3 | 19.1 | 11.3 |
Disclaimer/Publisher’s Note: The statements, opinions and data contained in all publications are solely those of the individual author(s) and contributor(s) and not of MDPI and/or the editor(s). MDPI and/or the editor(s) disclaim responsibility for any injury to people or property resulting from any ideas, methods, instructions or products referred to in the content. |
© 2023 by the authors. Licensee MDPI, Basel, Switzerland. This article is an open access article distributed under the terms and conditions of the Creative Commons Attribution (CC BY) license (https://creativecommons.org/licenses/by/4.0/).
Share and Cite
Jiang, Y.; Bustillo, K.C.; Devine, T.M. Investigation via Electron Microscopy and Electrochemical Impedance Spectroscopy of the Effect of Aqueous Zinc Ions on Passivity and the Surface Films of Alloy 600 in PWR PW at 320 °C. Corros. Mater. Degrad. 2023, 4, 54-89. https://doi.org/10.3390/cmd4010005
Jiang Y, Bustillo KC, Devine TM. Investigation via Electron Microscopy and Electrochemical Impedance Spectroscopy of the Effect of Aqueous Zinc Ions on Passivity and the Surface Films of Alloy 600 in PWR PW at 320 °C. Corrosion and Materials Degradation. 2023; 4(1):54-89. https://doi.org/10.3390/cmd4010005
Chicago/Turabian StyleJiang, Yifan, Karen C. Bustillo, and Thomas M. Devine. 2023. "Investigation via Electron Microscopy and Electrochemical Impedance Spectroscopy of the Effect of Aqueous Zinc Ions on Passivity and the Surface Films of Alloy 600 in PWR PW at 320 °C" Corrosion and Materials Degradation 4, no. 1: 54-89. https://doi.org/10.3390/cmd4010005