
Development of Photocatalytically Active Anodized Layers by a Modified Phosphoric Acid Anodizing Process for Air Purification


Abstract
:1. Introduction
2. Materials and Methods
2.1. Phosphoric Acid Anodization
2.2. Dip Coating
- 1.
- PC-S7 (10 wt.% TiO, pH 8, particle size (DLS) ∼38 nm)- withdrawal speed: 40 mm/min, 50 mm/min.
- 2.
- W2730X (15 wt.% TiO, pH 7, particle size (DLS) ∼70 nm)- withdrawal speed: 10 mm/min.
2.3. Photocatalytic Activity
2.4. Corrosion Investigations
- Aluminum sheet EN-AW5005 pretreated (degreased, etched and pickled).
- MPAA sample.
- MPAA sample incorporating TiO particles (Tronox PC-S7).
- Oxalic acid anodized sample, sealed (benchmark; c = 57 g/L, V = 46 V, T = 20 °C; d = 40–60 nm, d2 m).
3. Results and Discussion
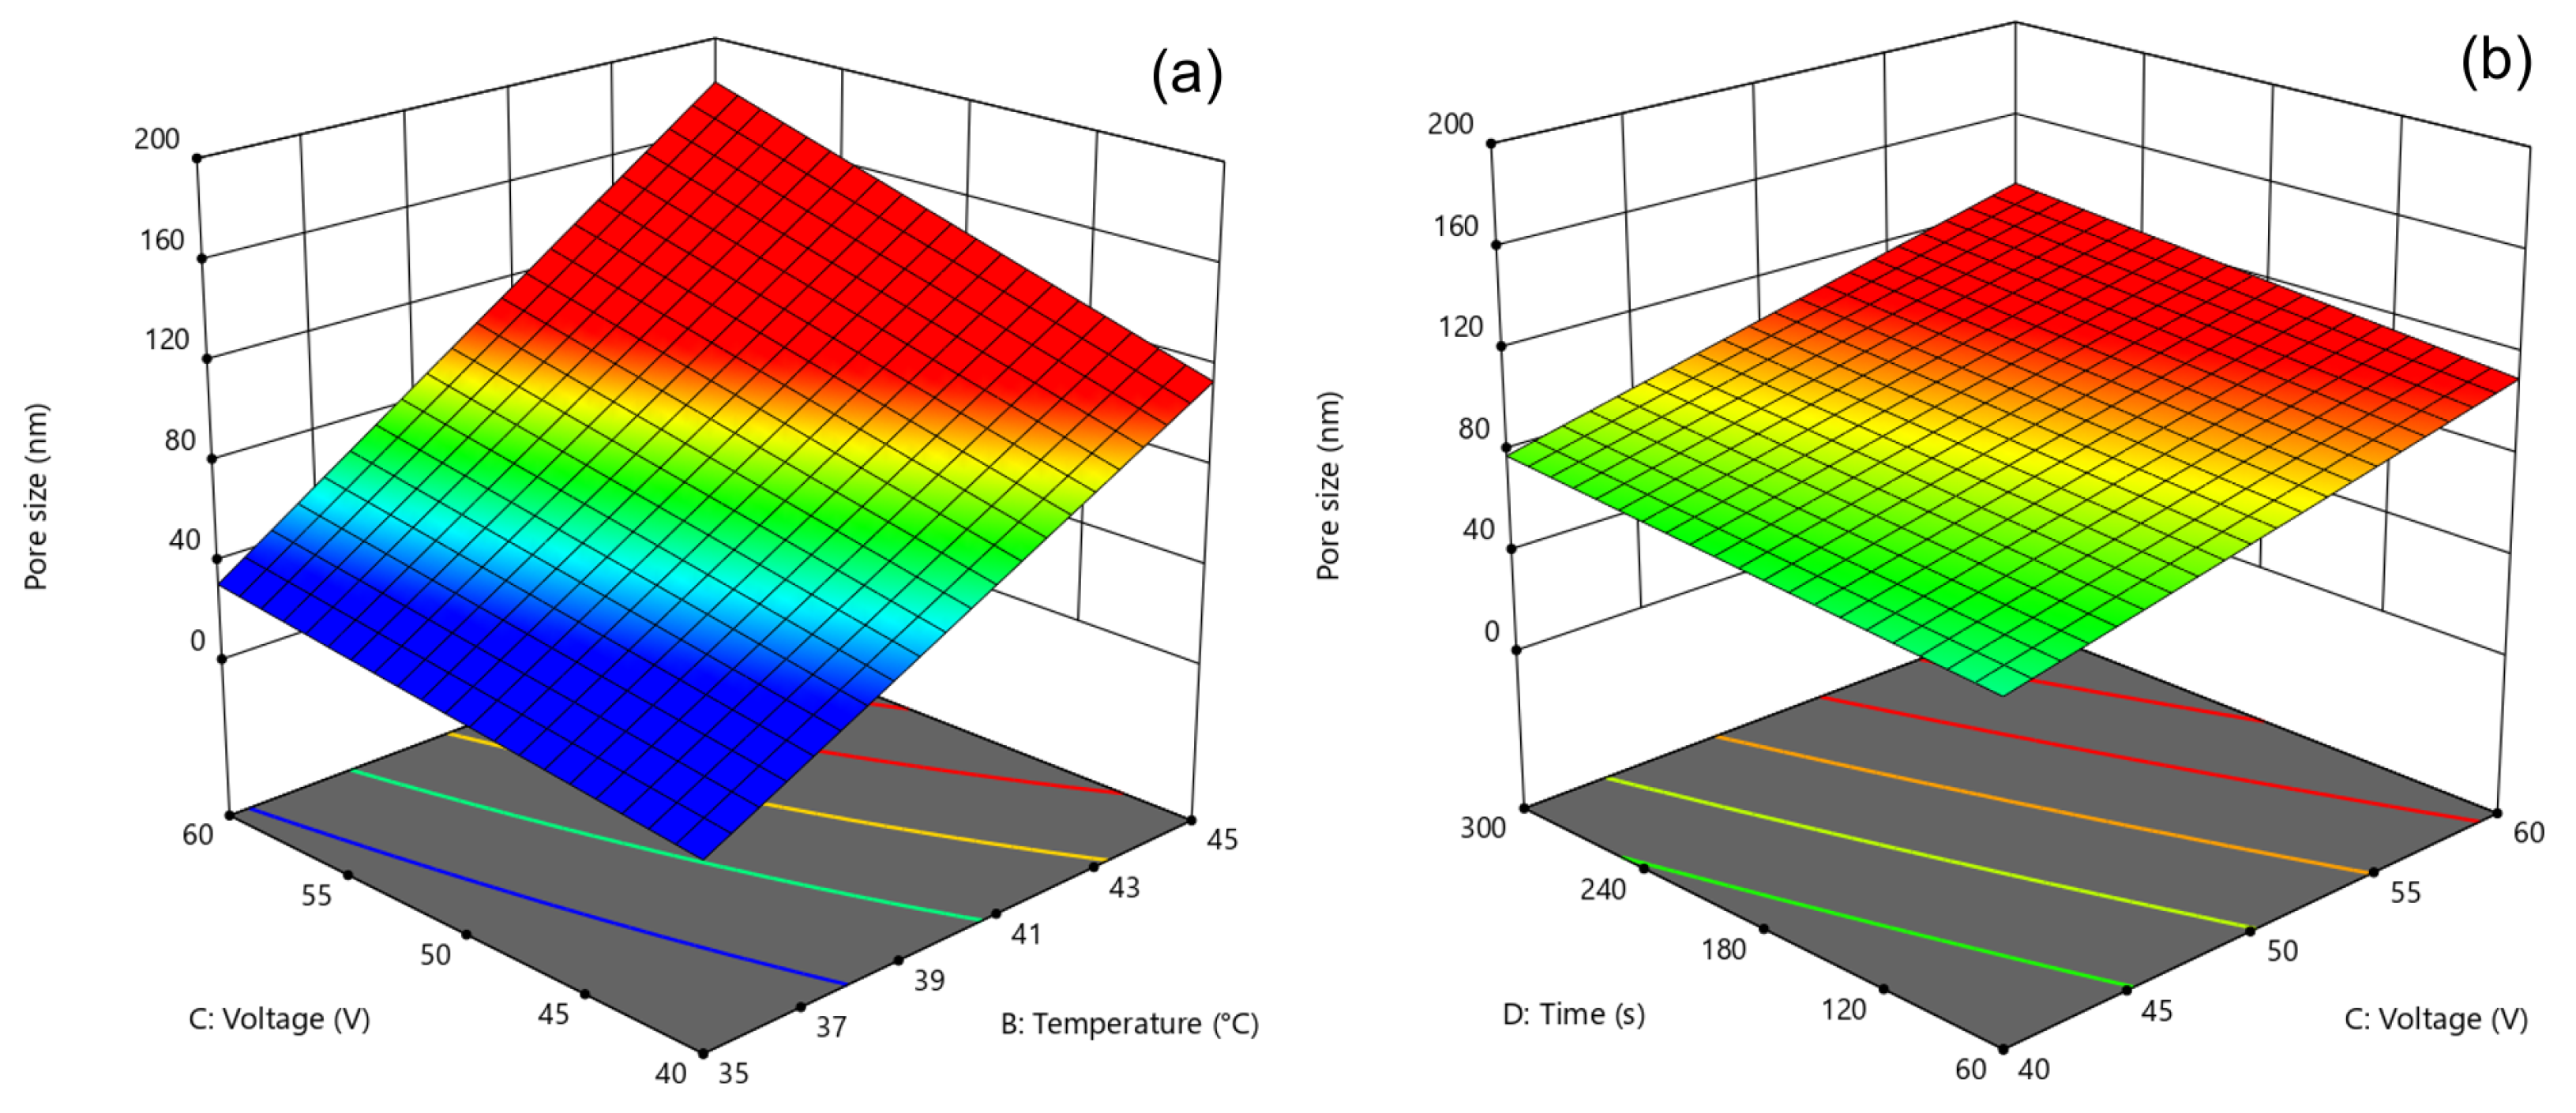
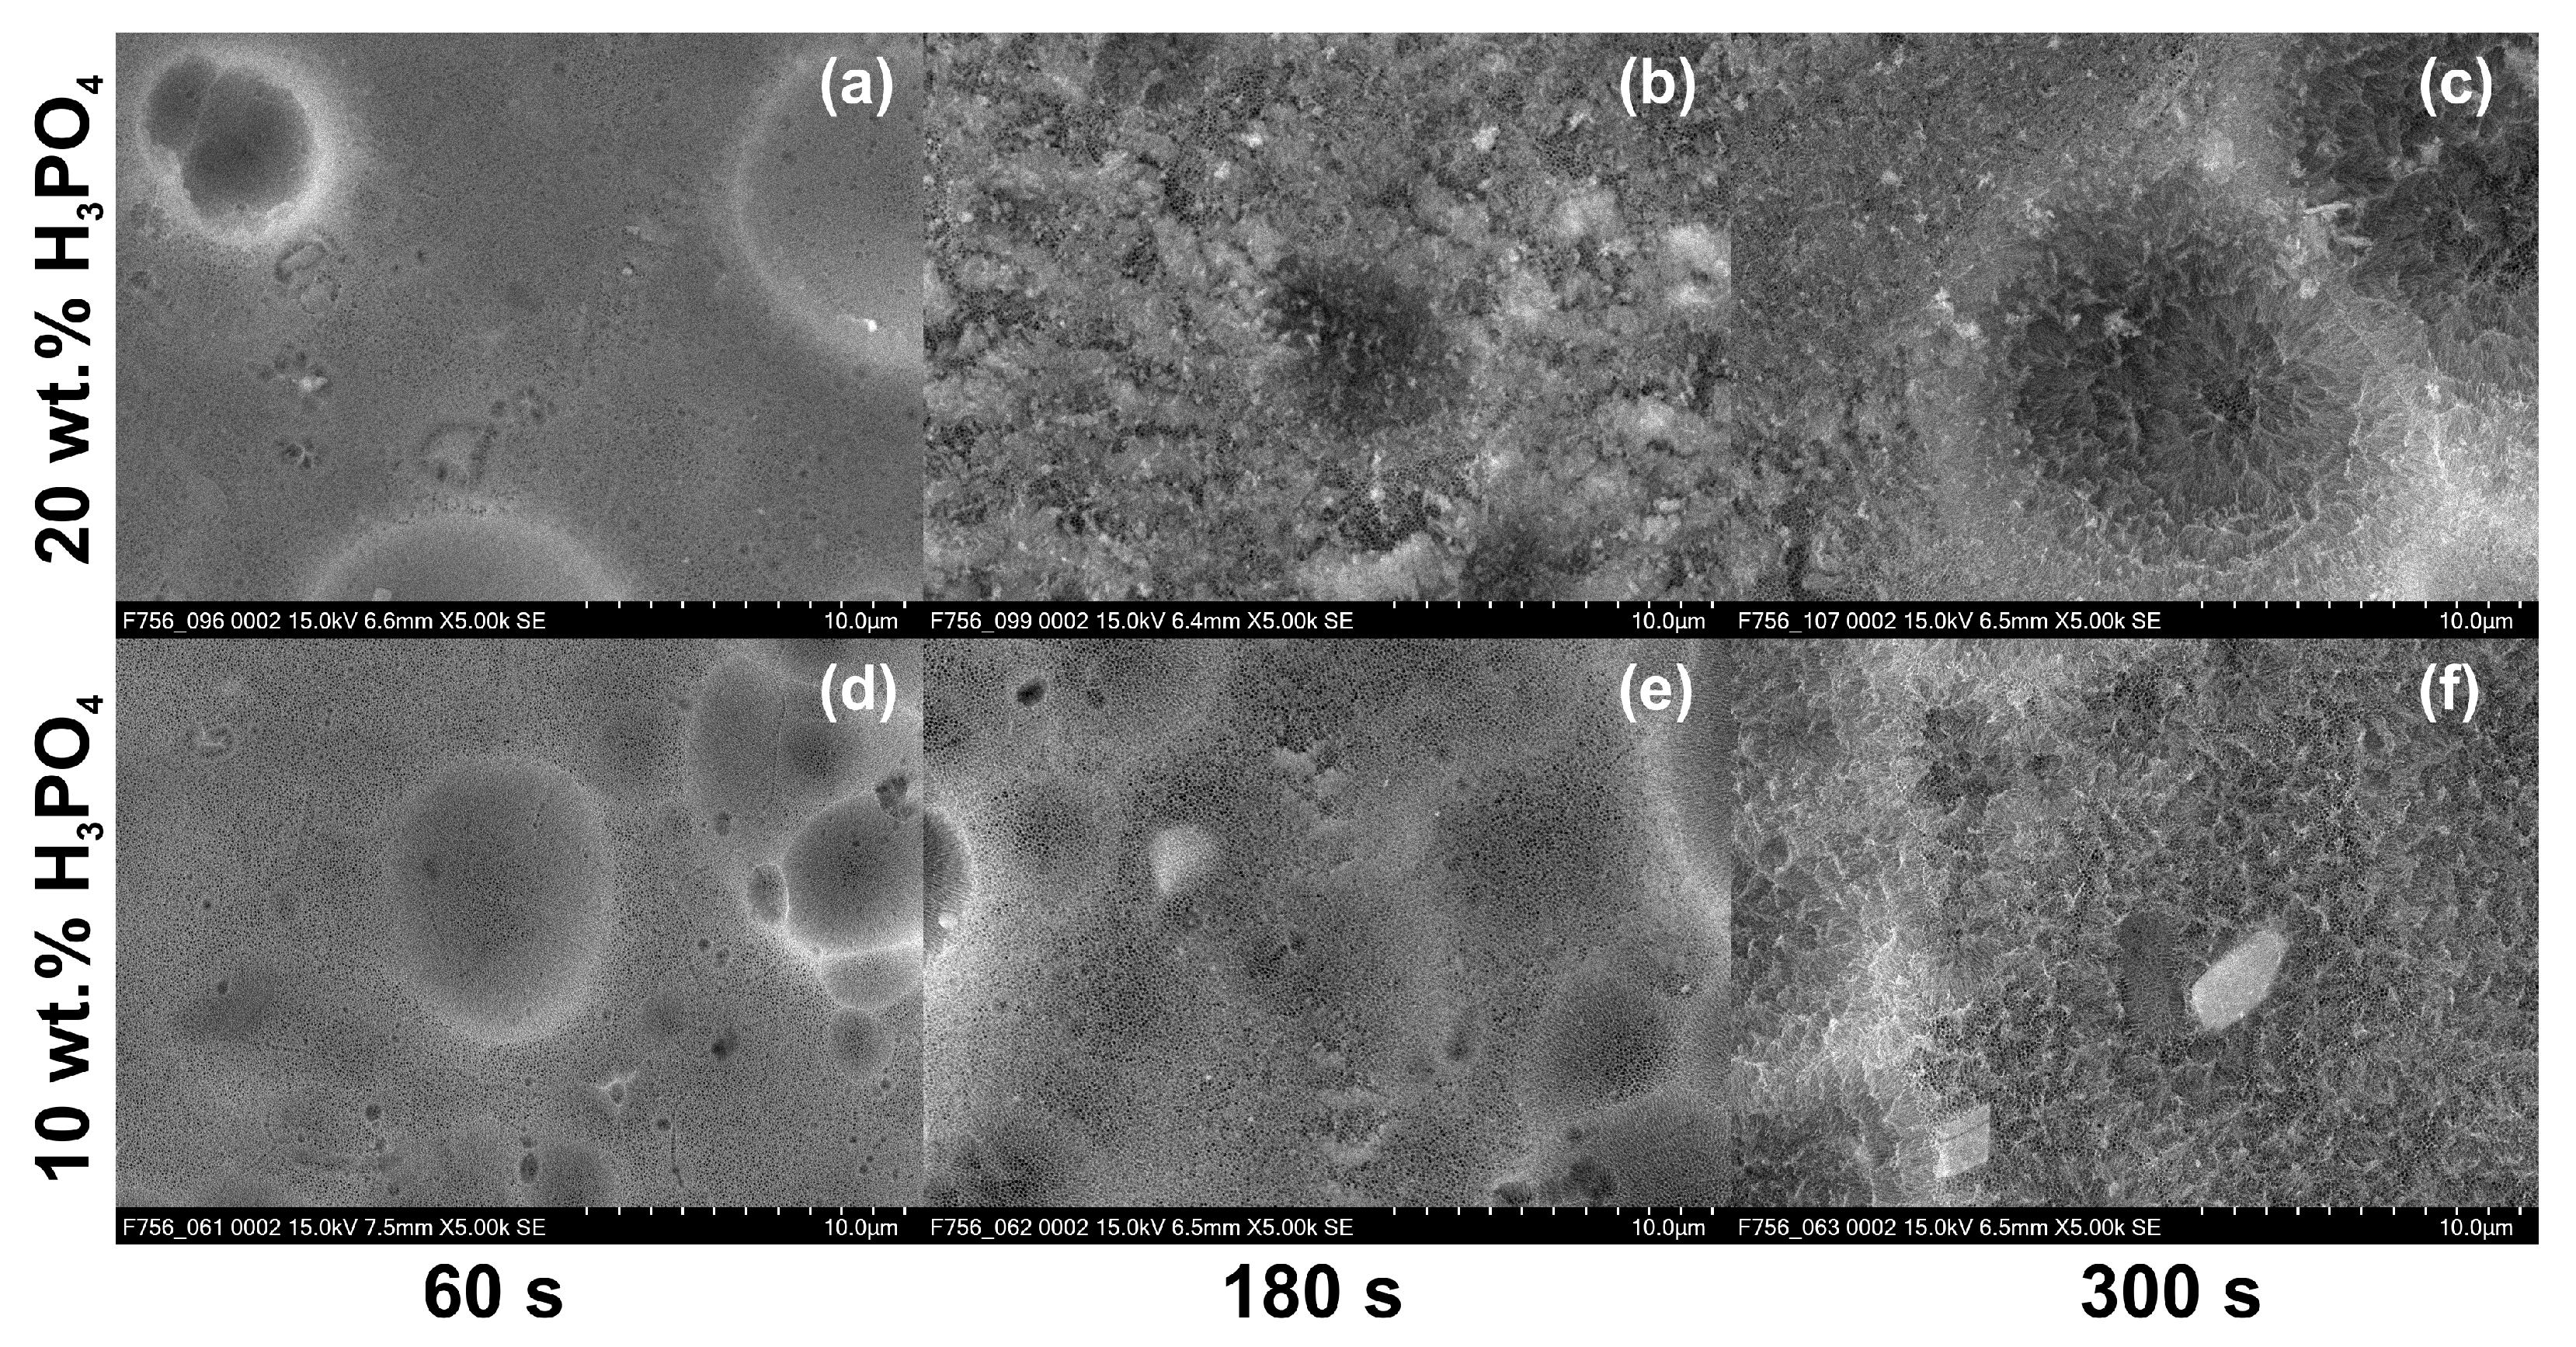
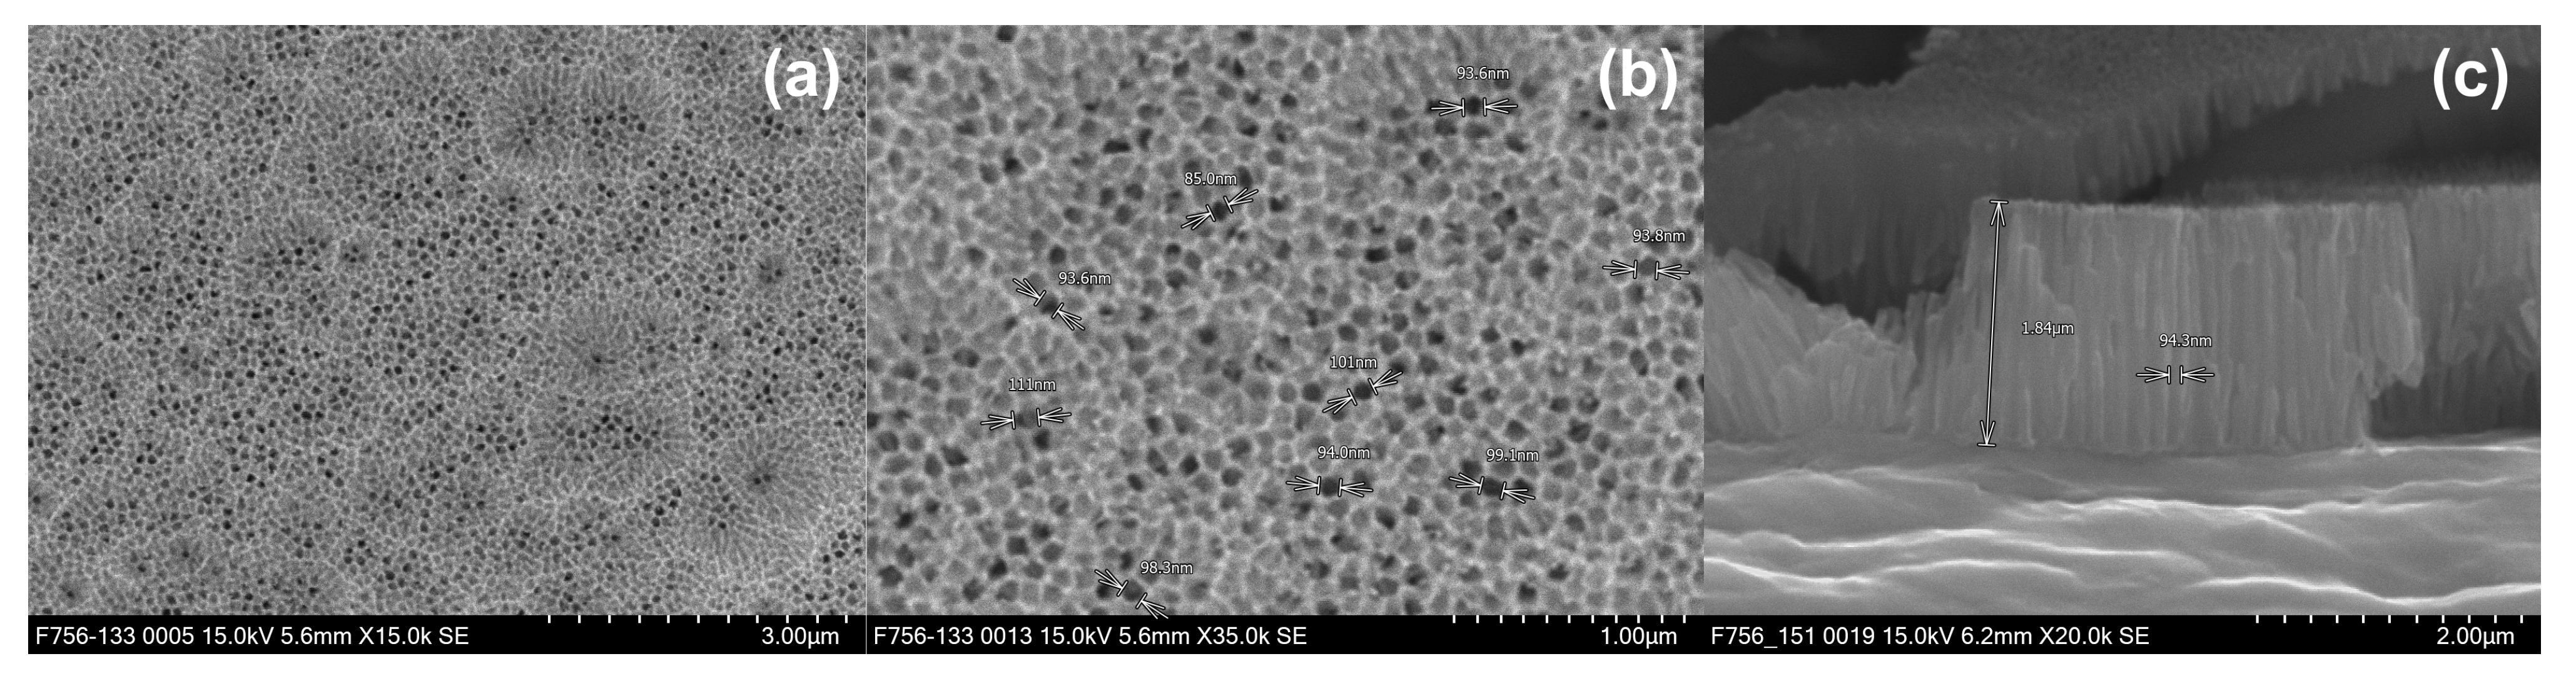
3.1. Phosphoric Acid Anodizing
- Electrolyte: 10 wt.-% phosphoric acid.
- Temperature: 42 °C.
- Voltage: 55 V.
- Anodizing time: 180 s.
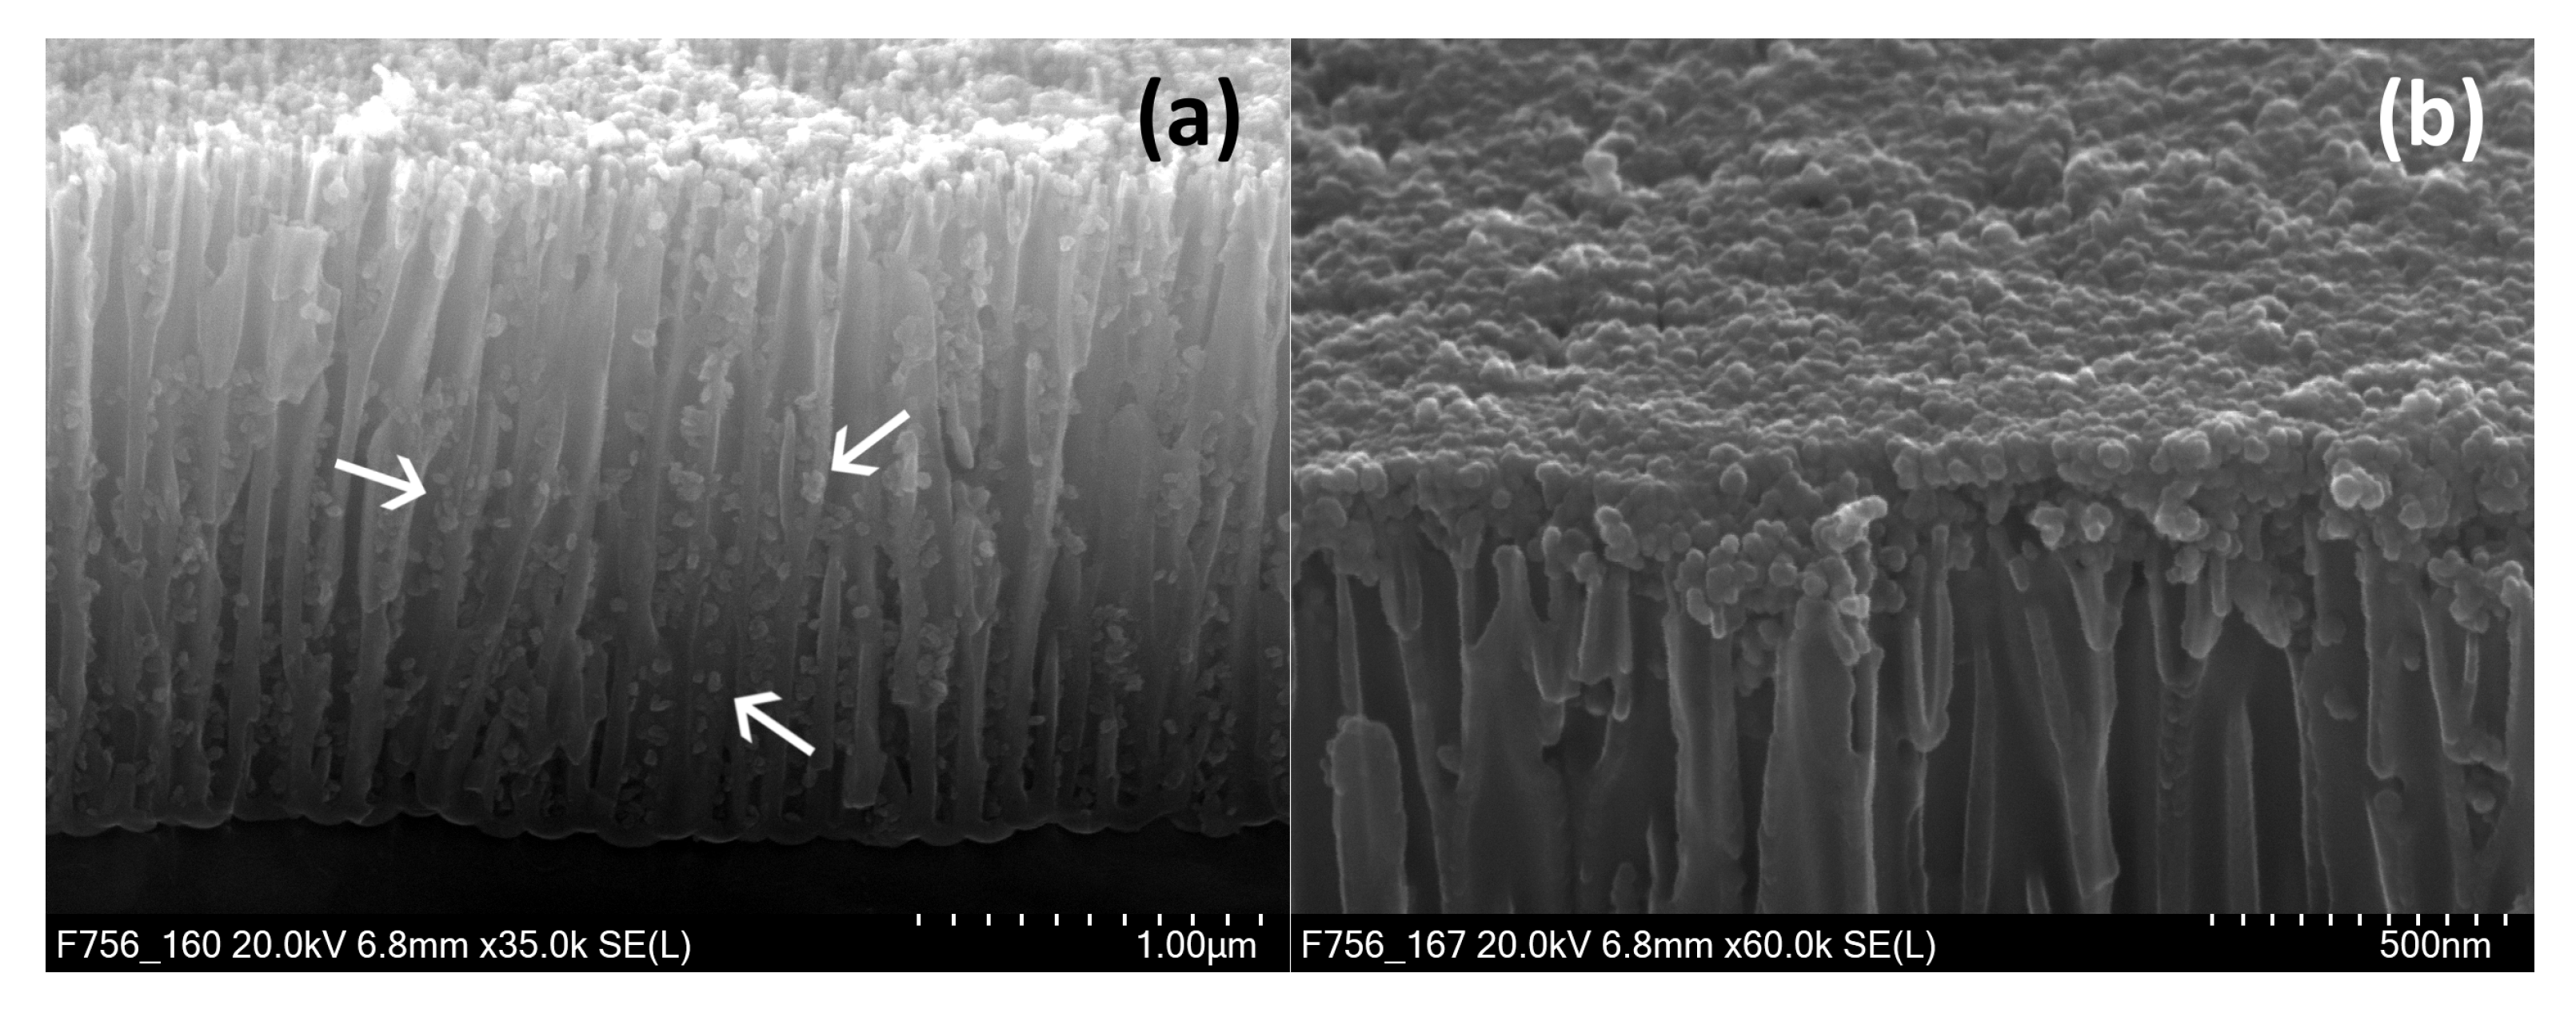
3.2. Dip Coating
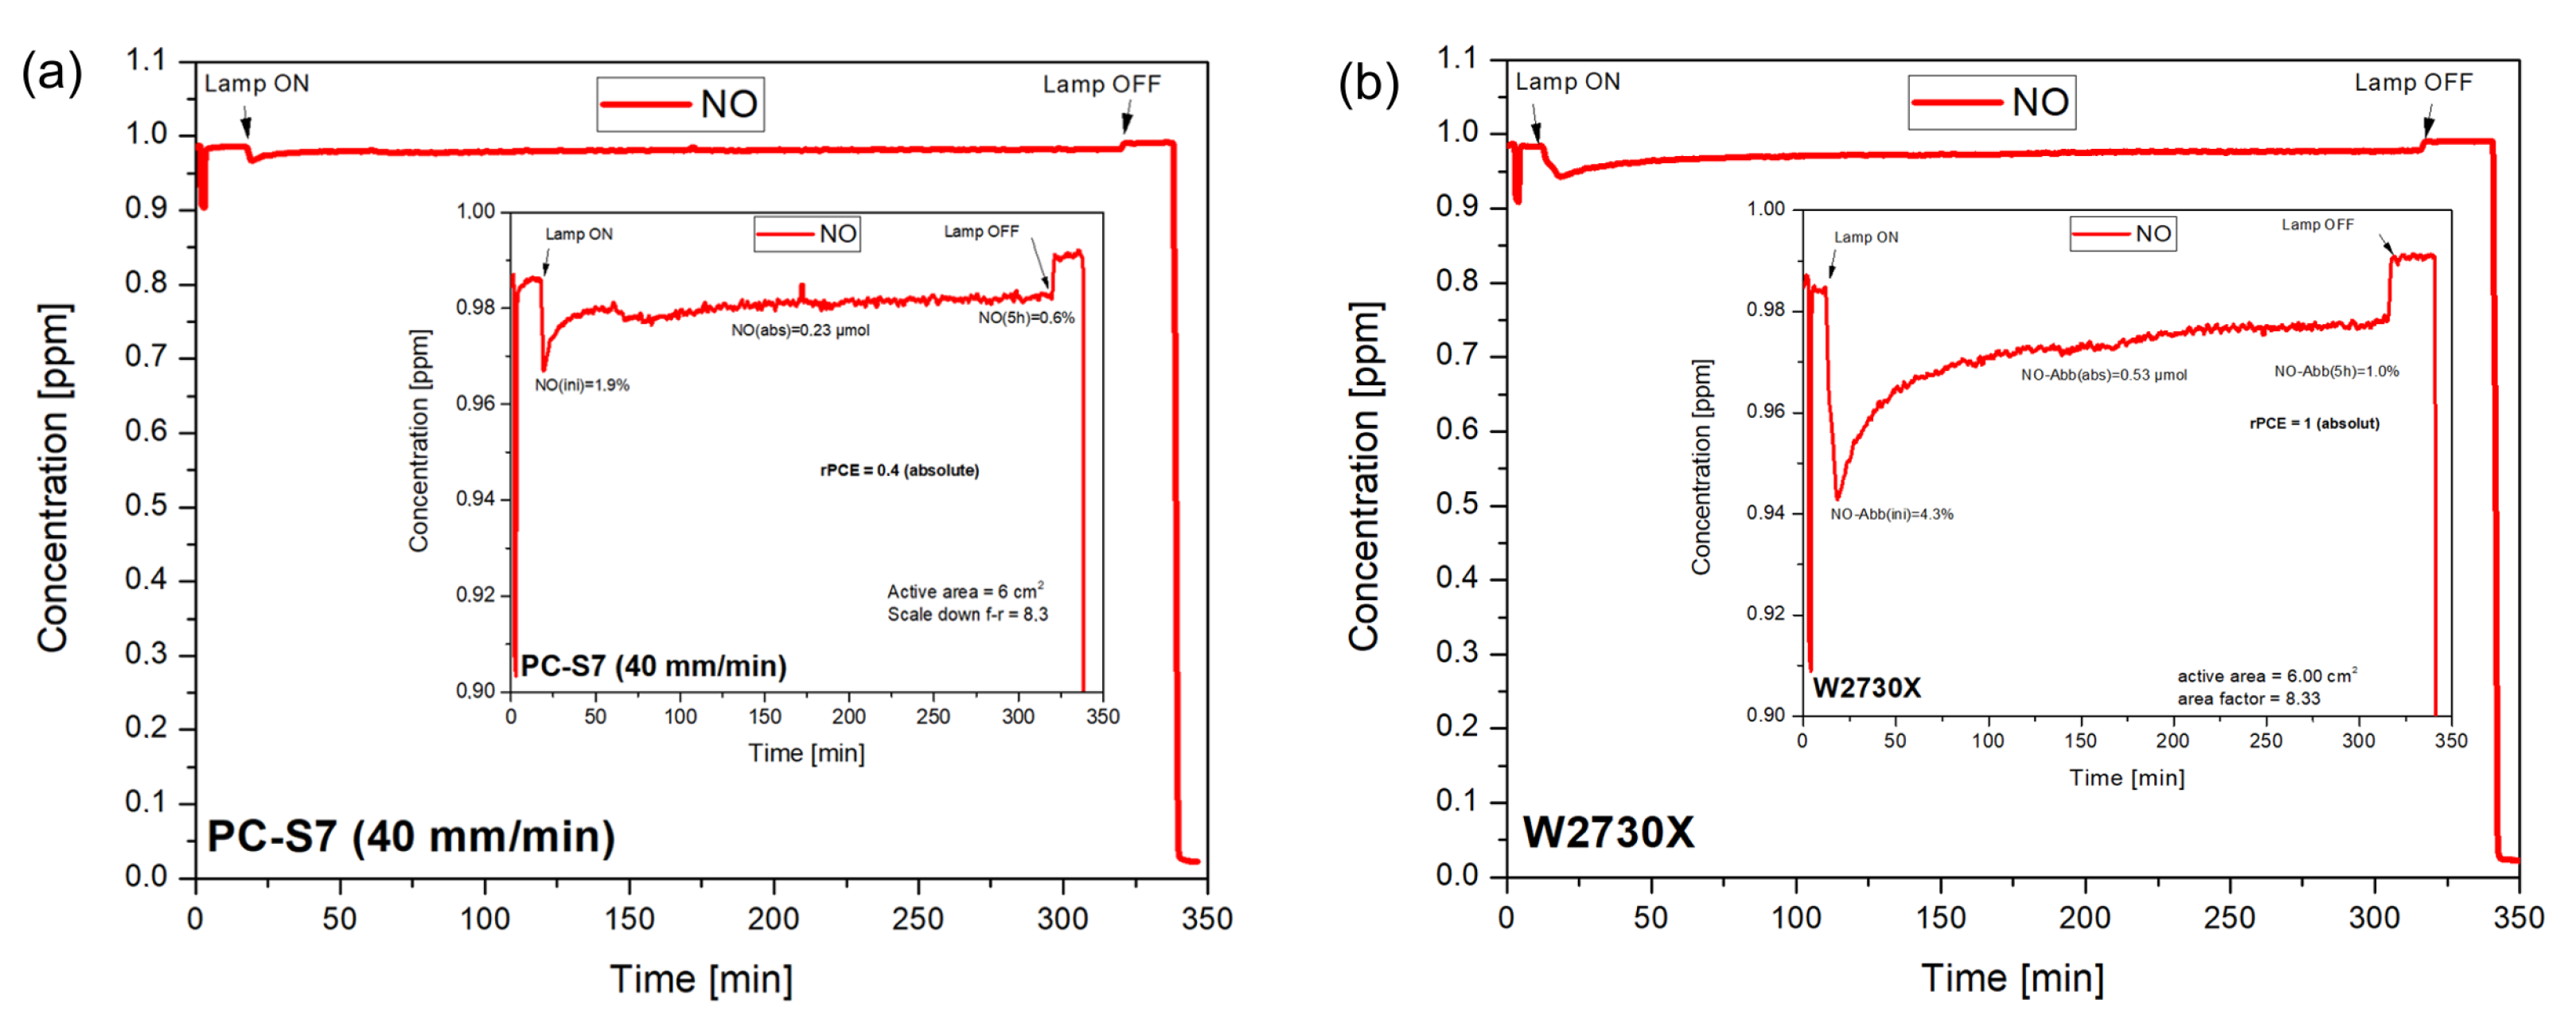
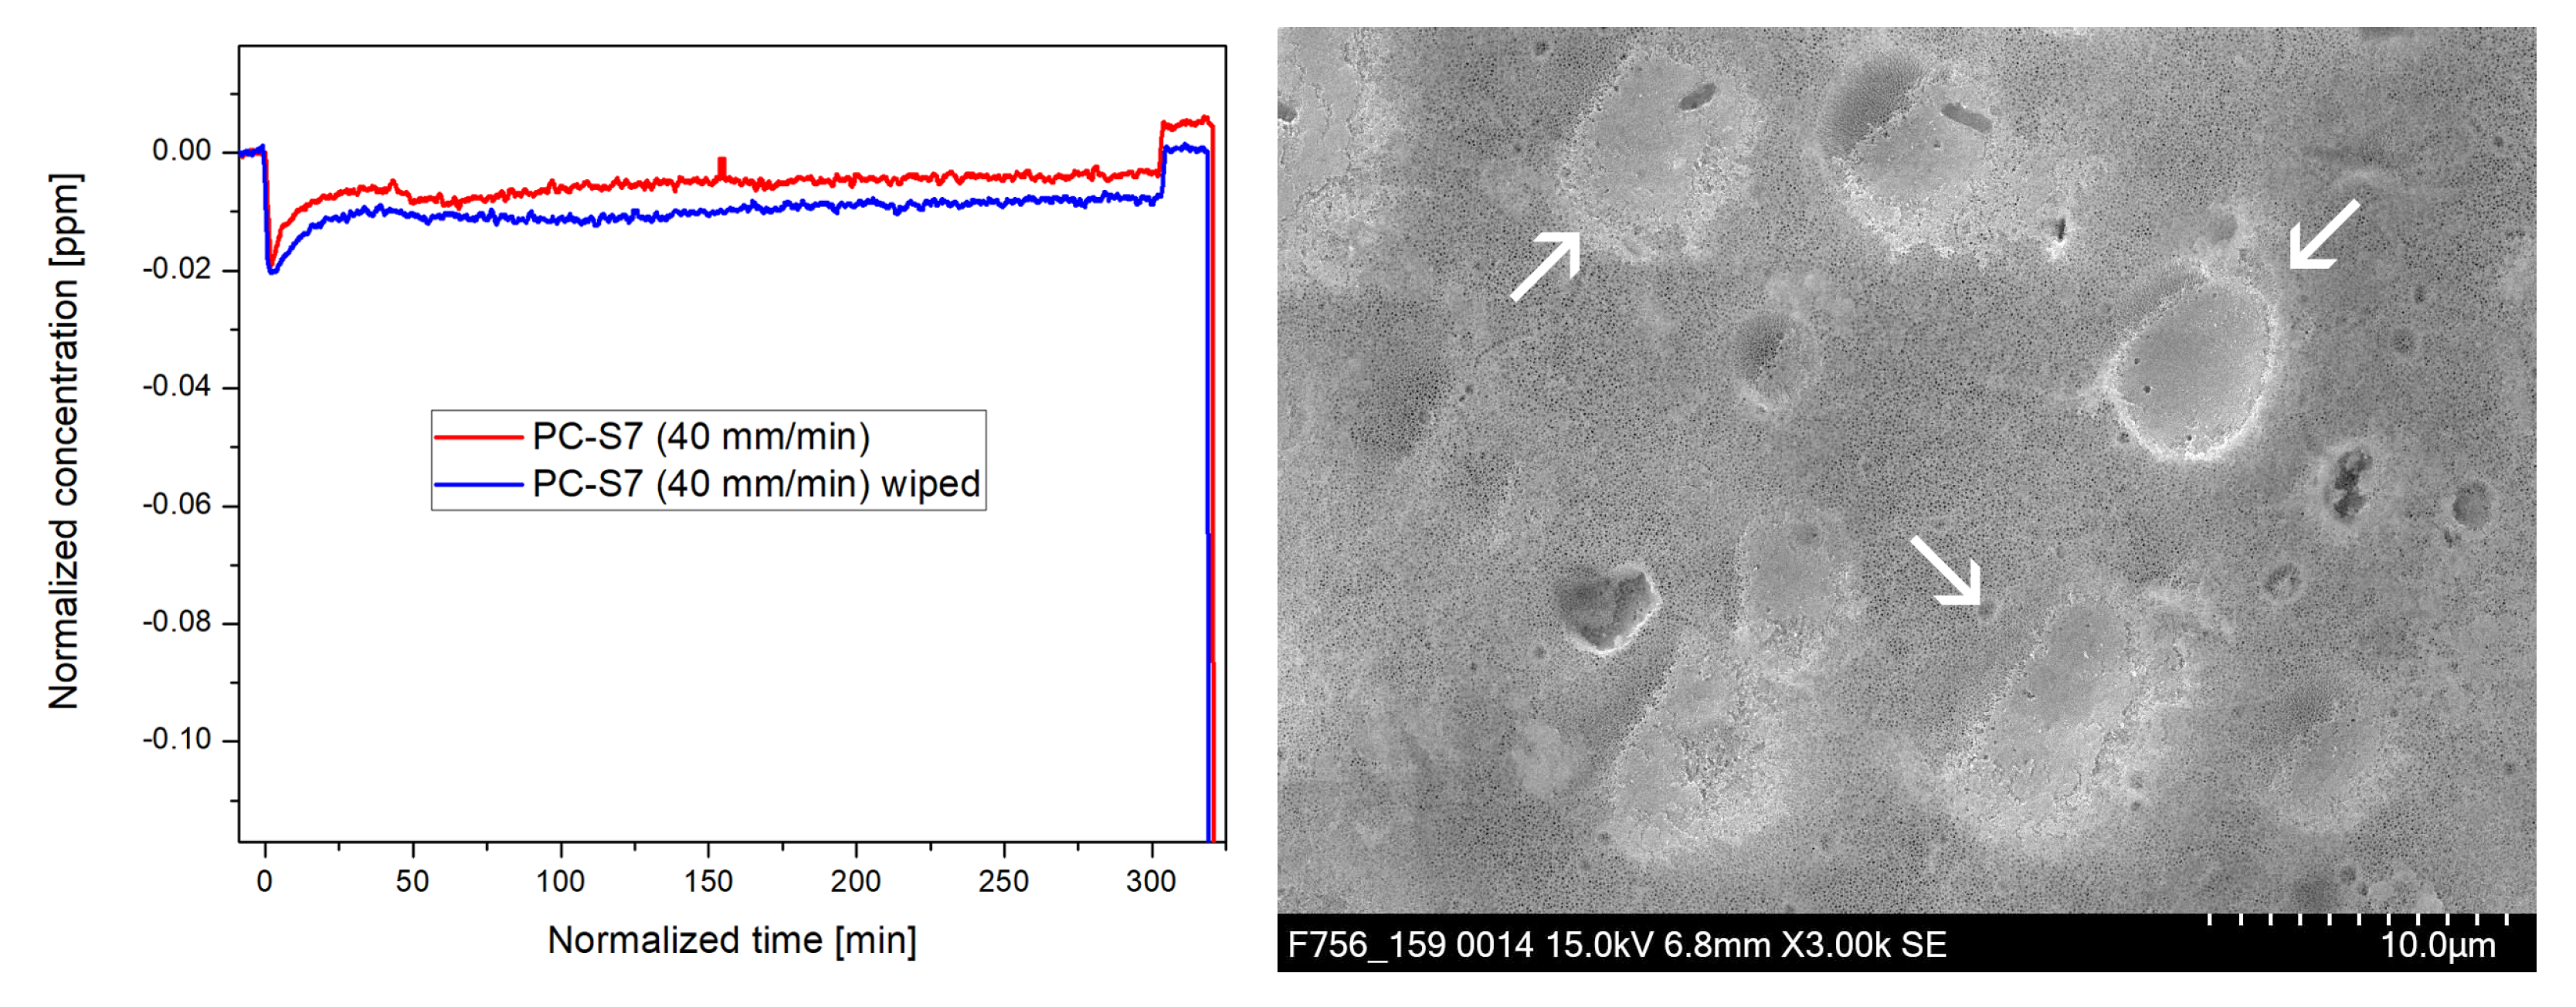
3.3. Photocatalytic Activity
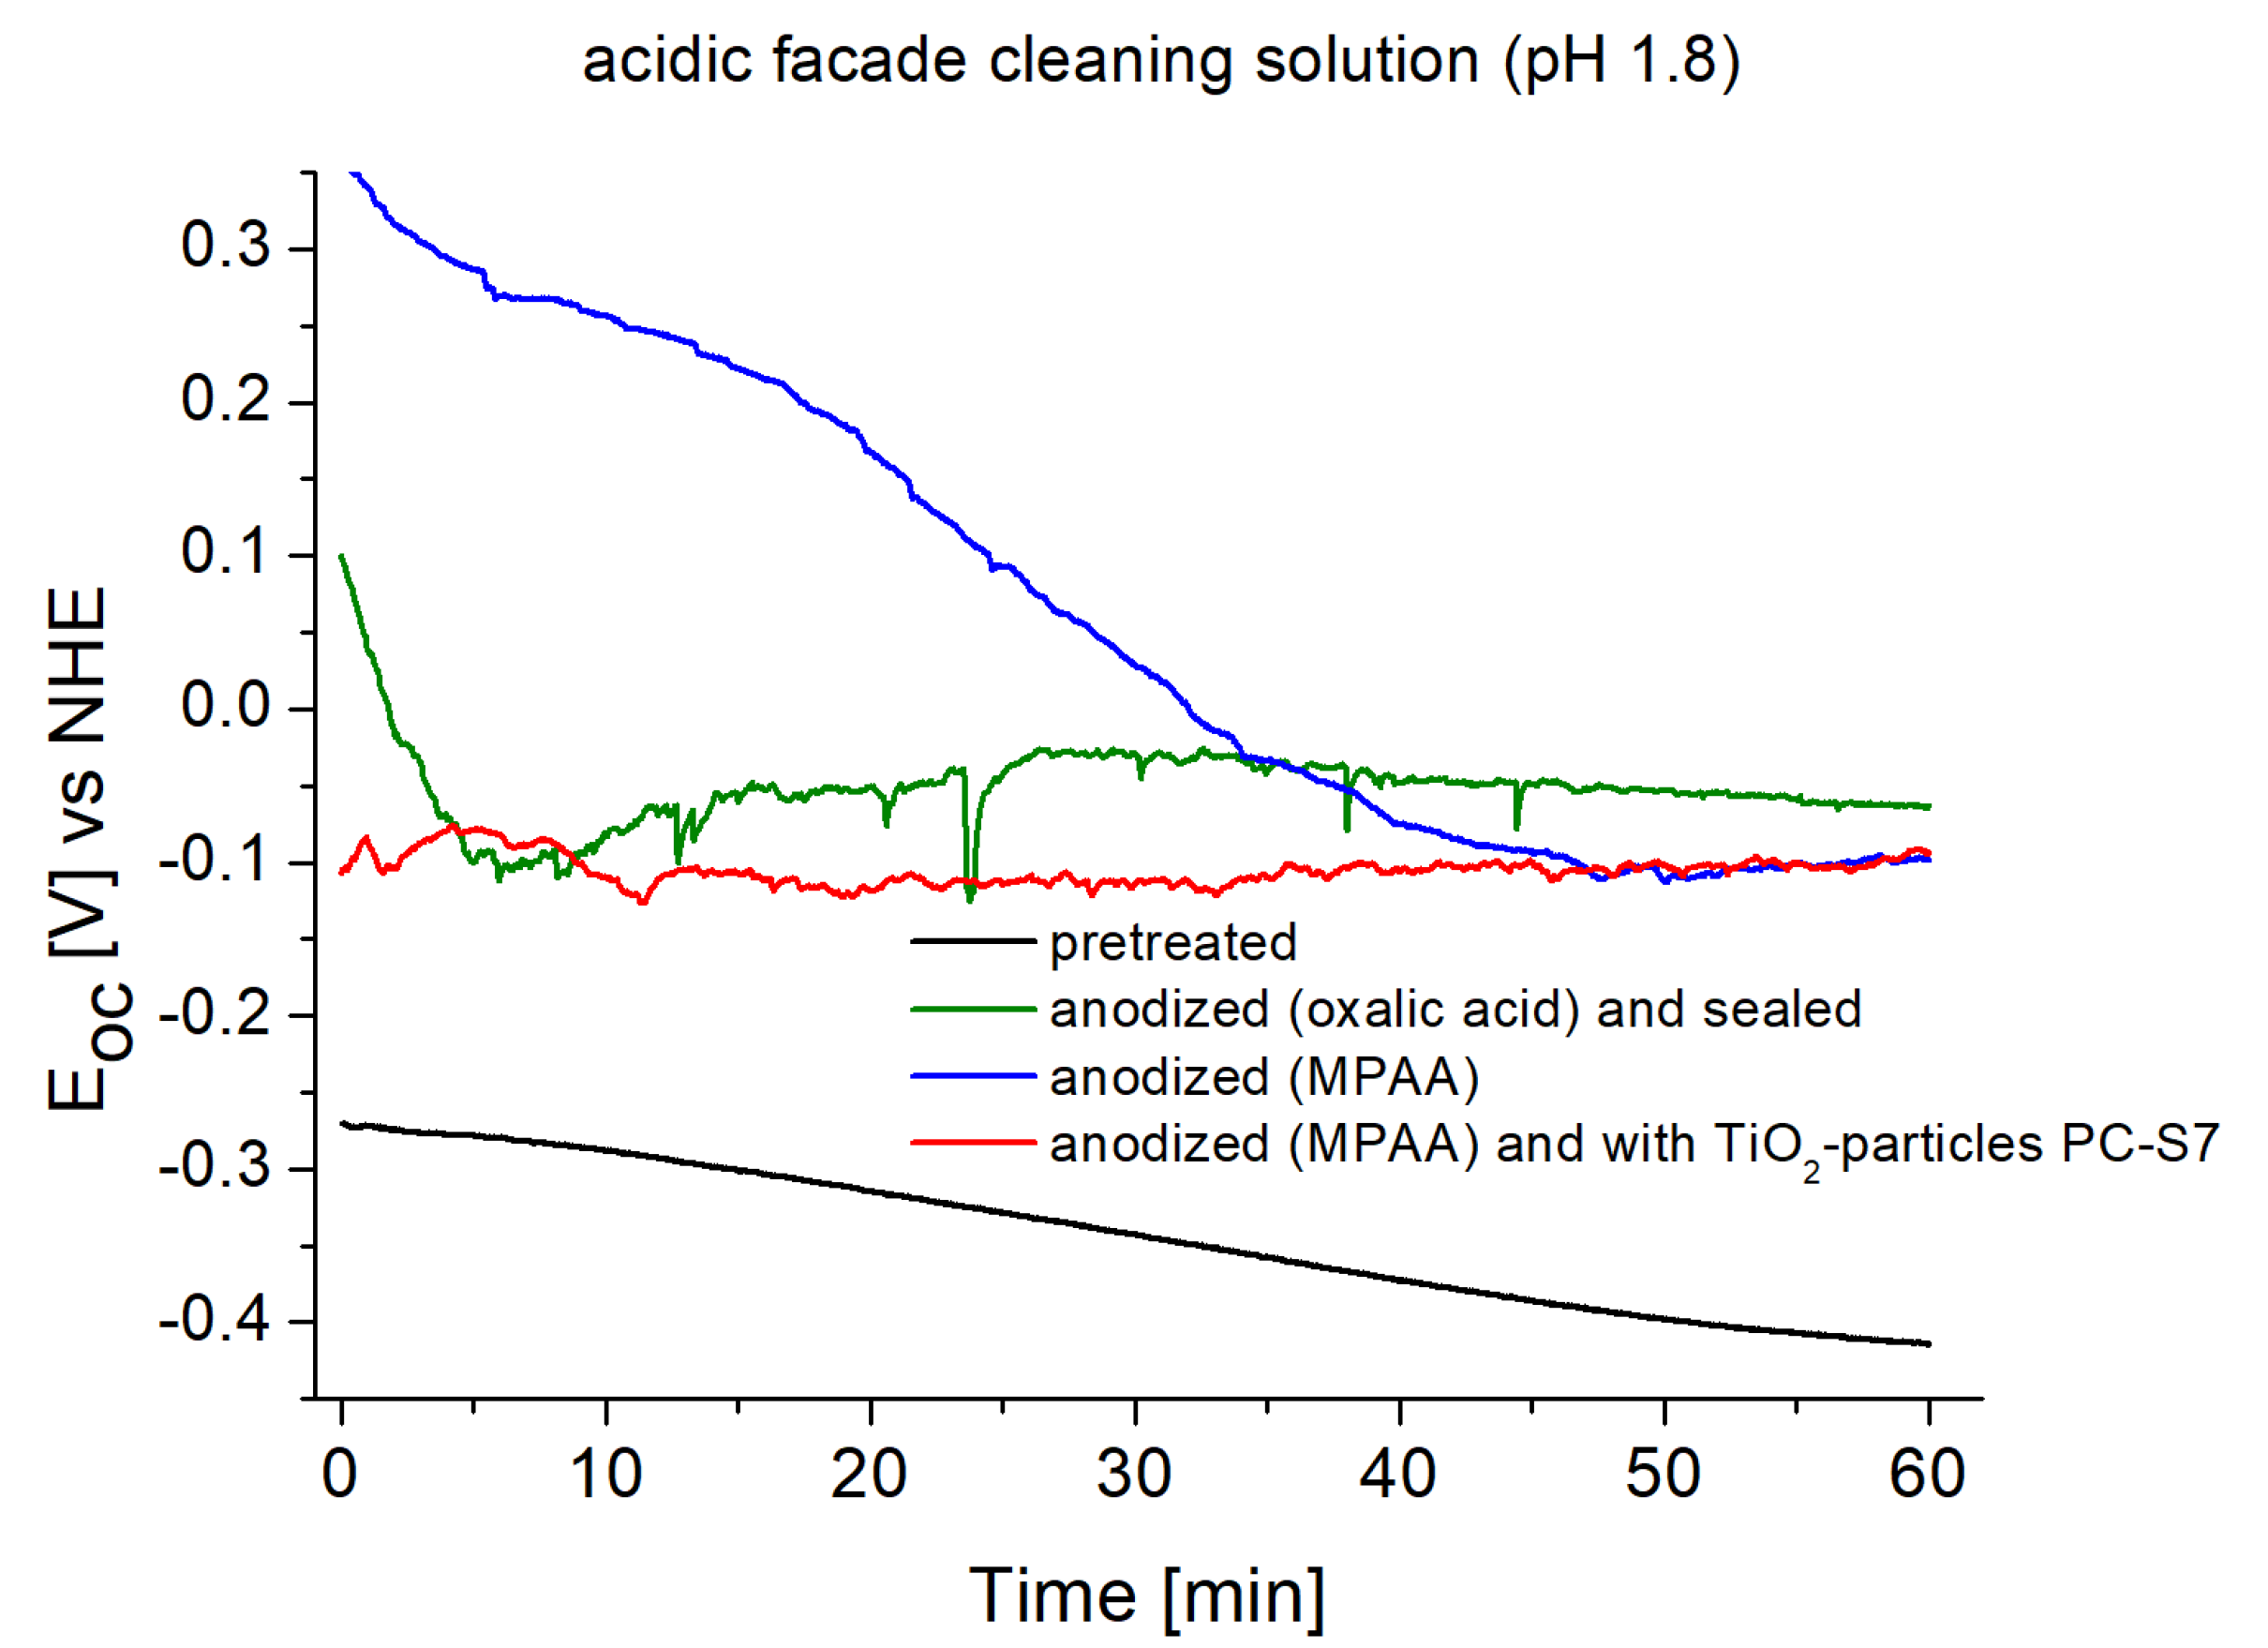
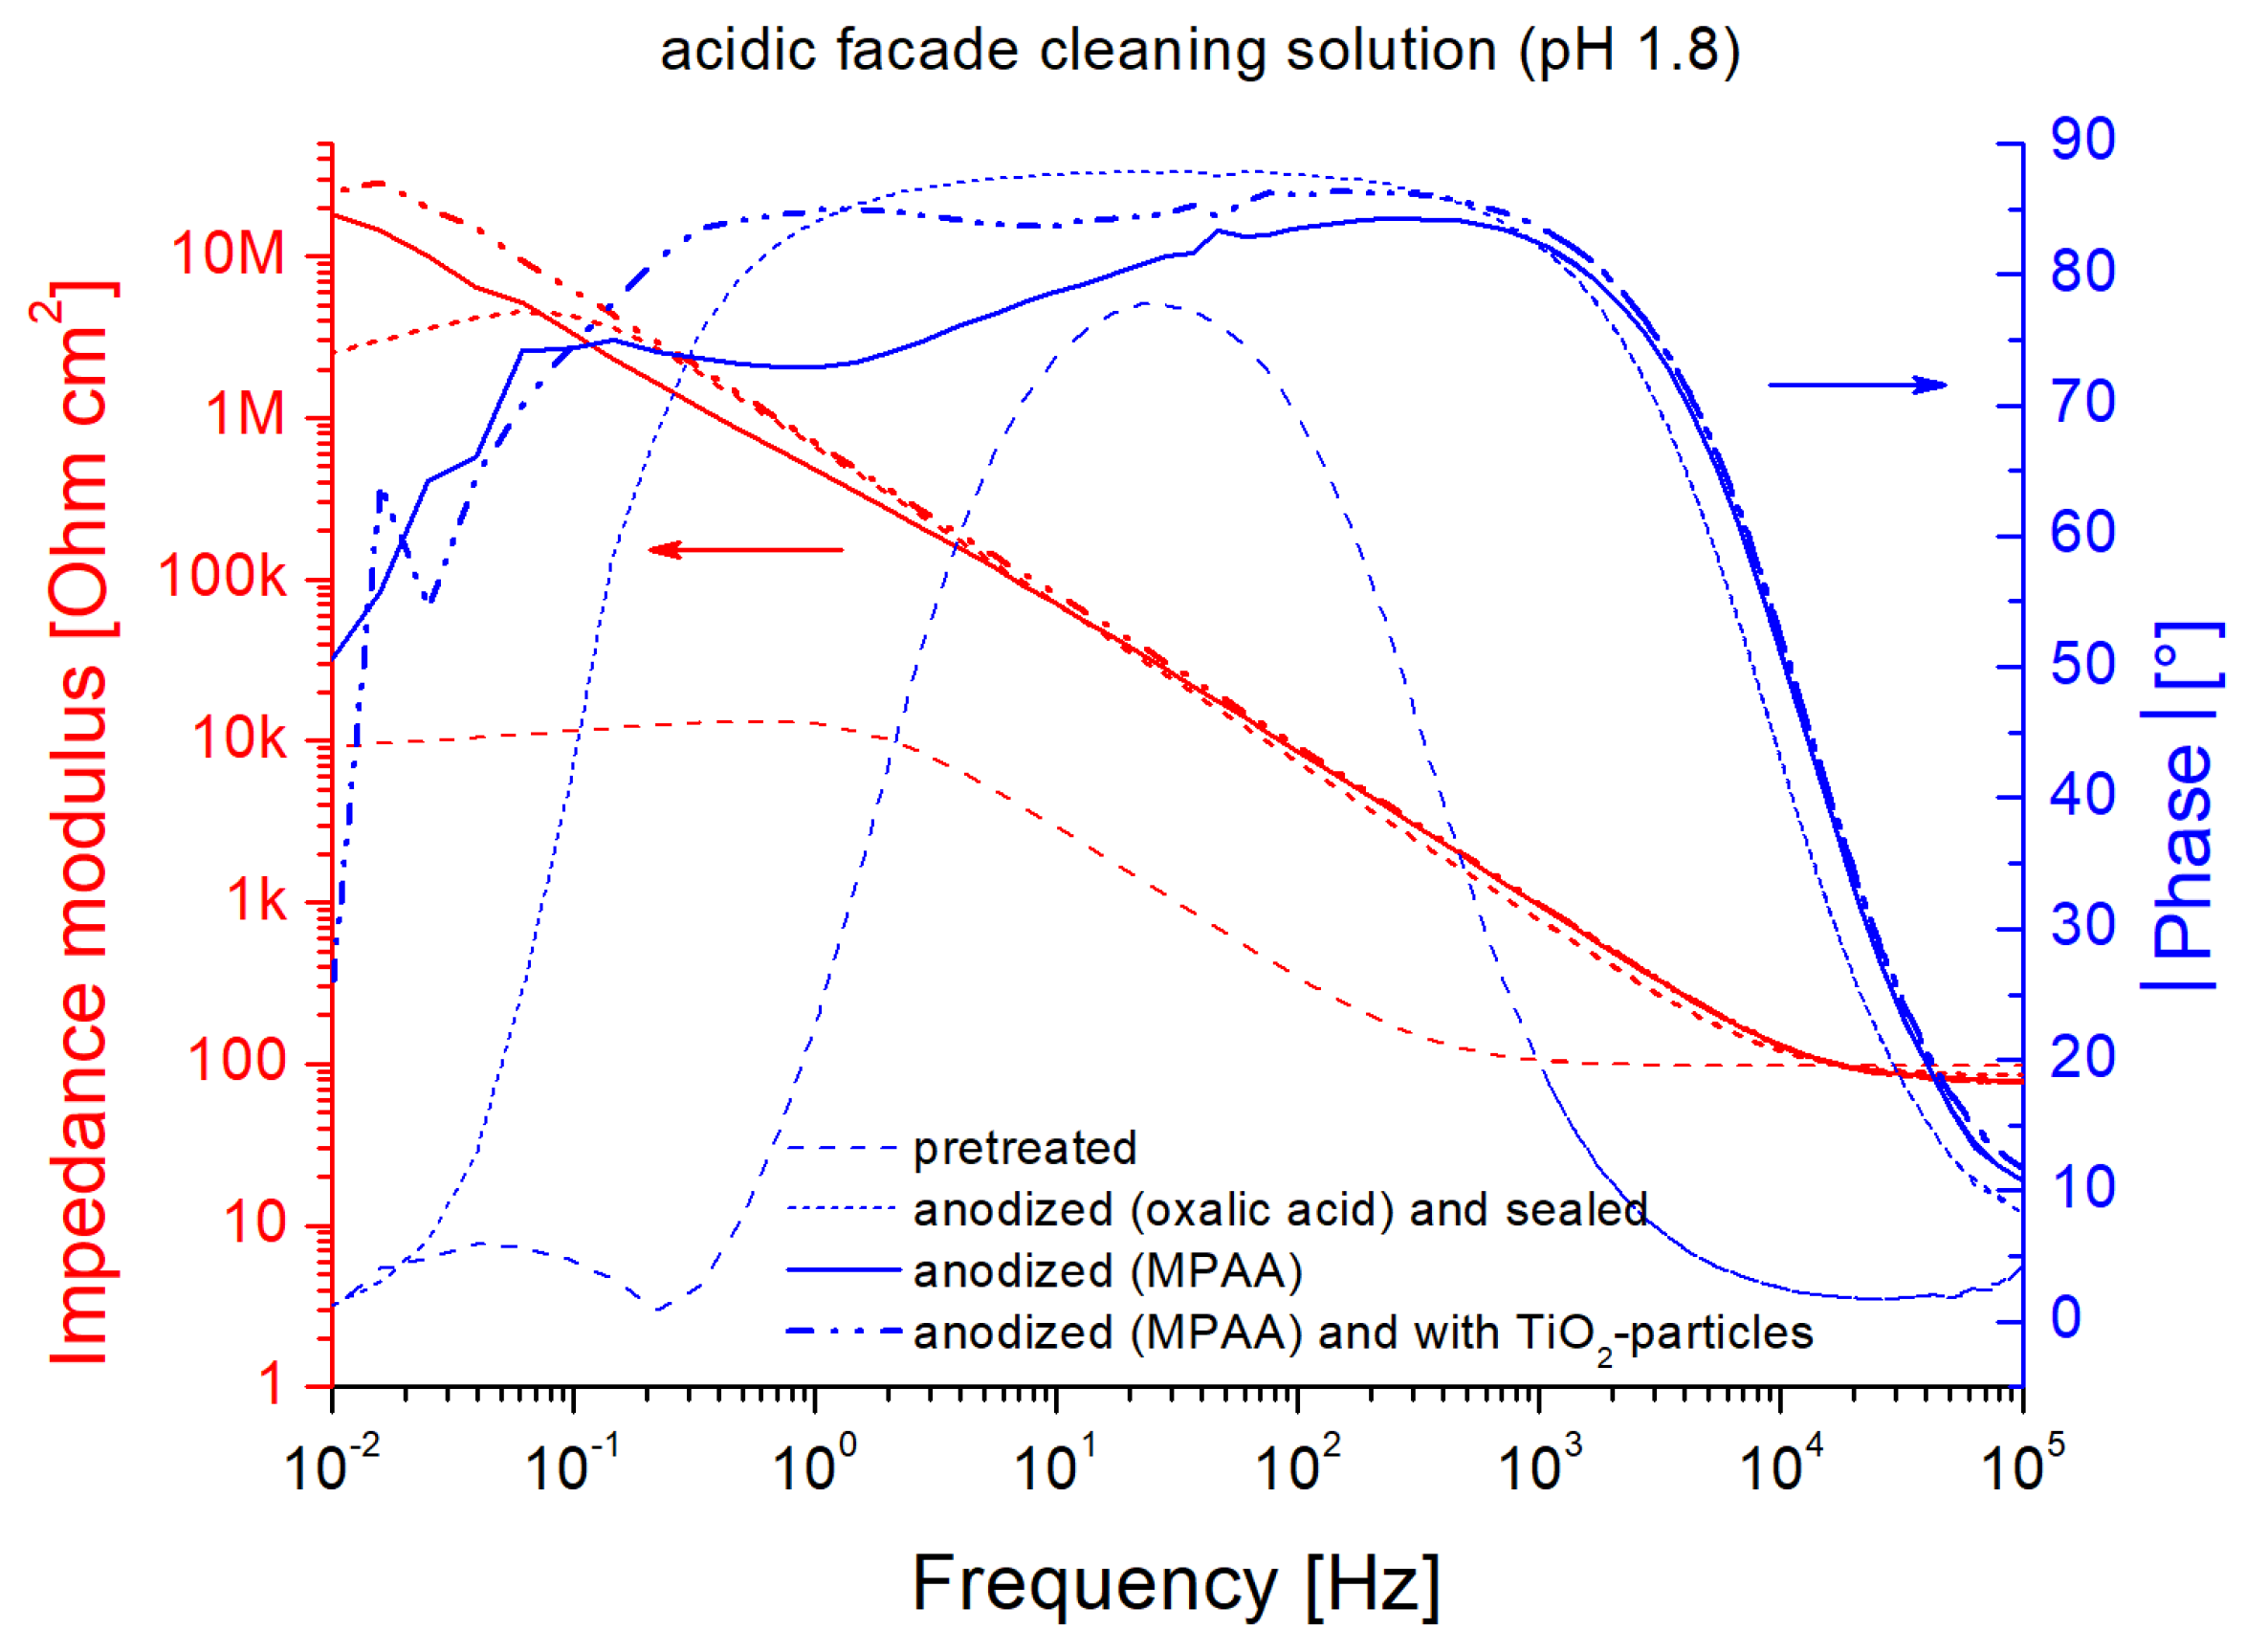
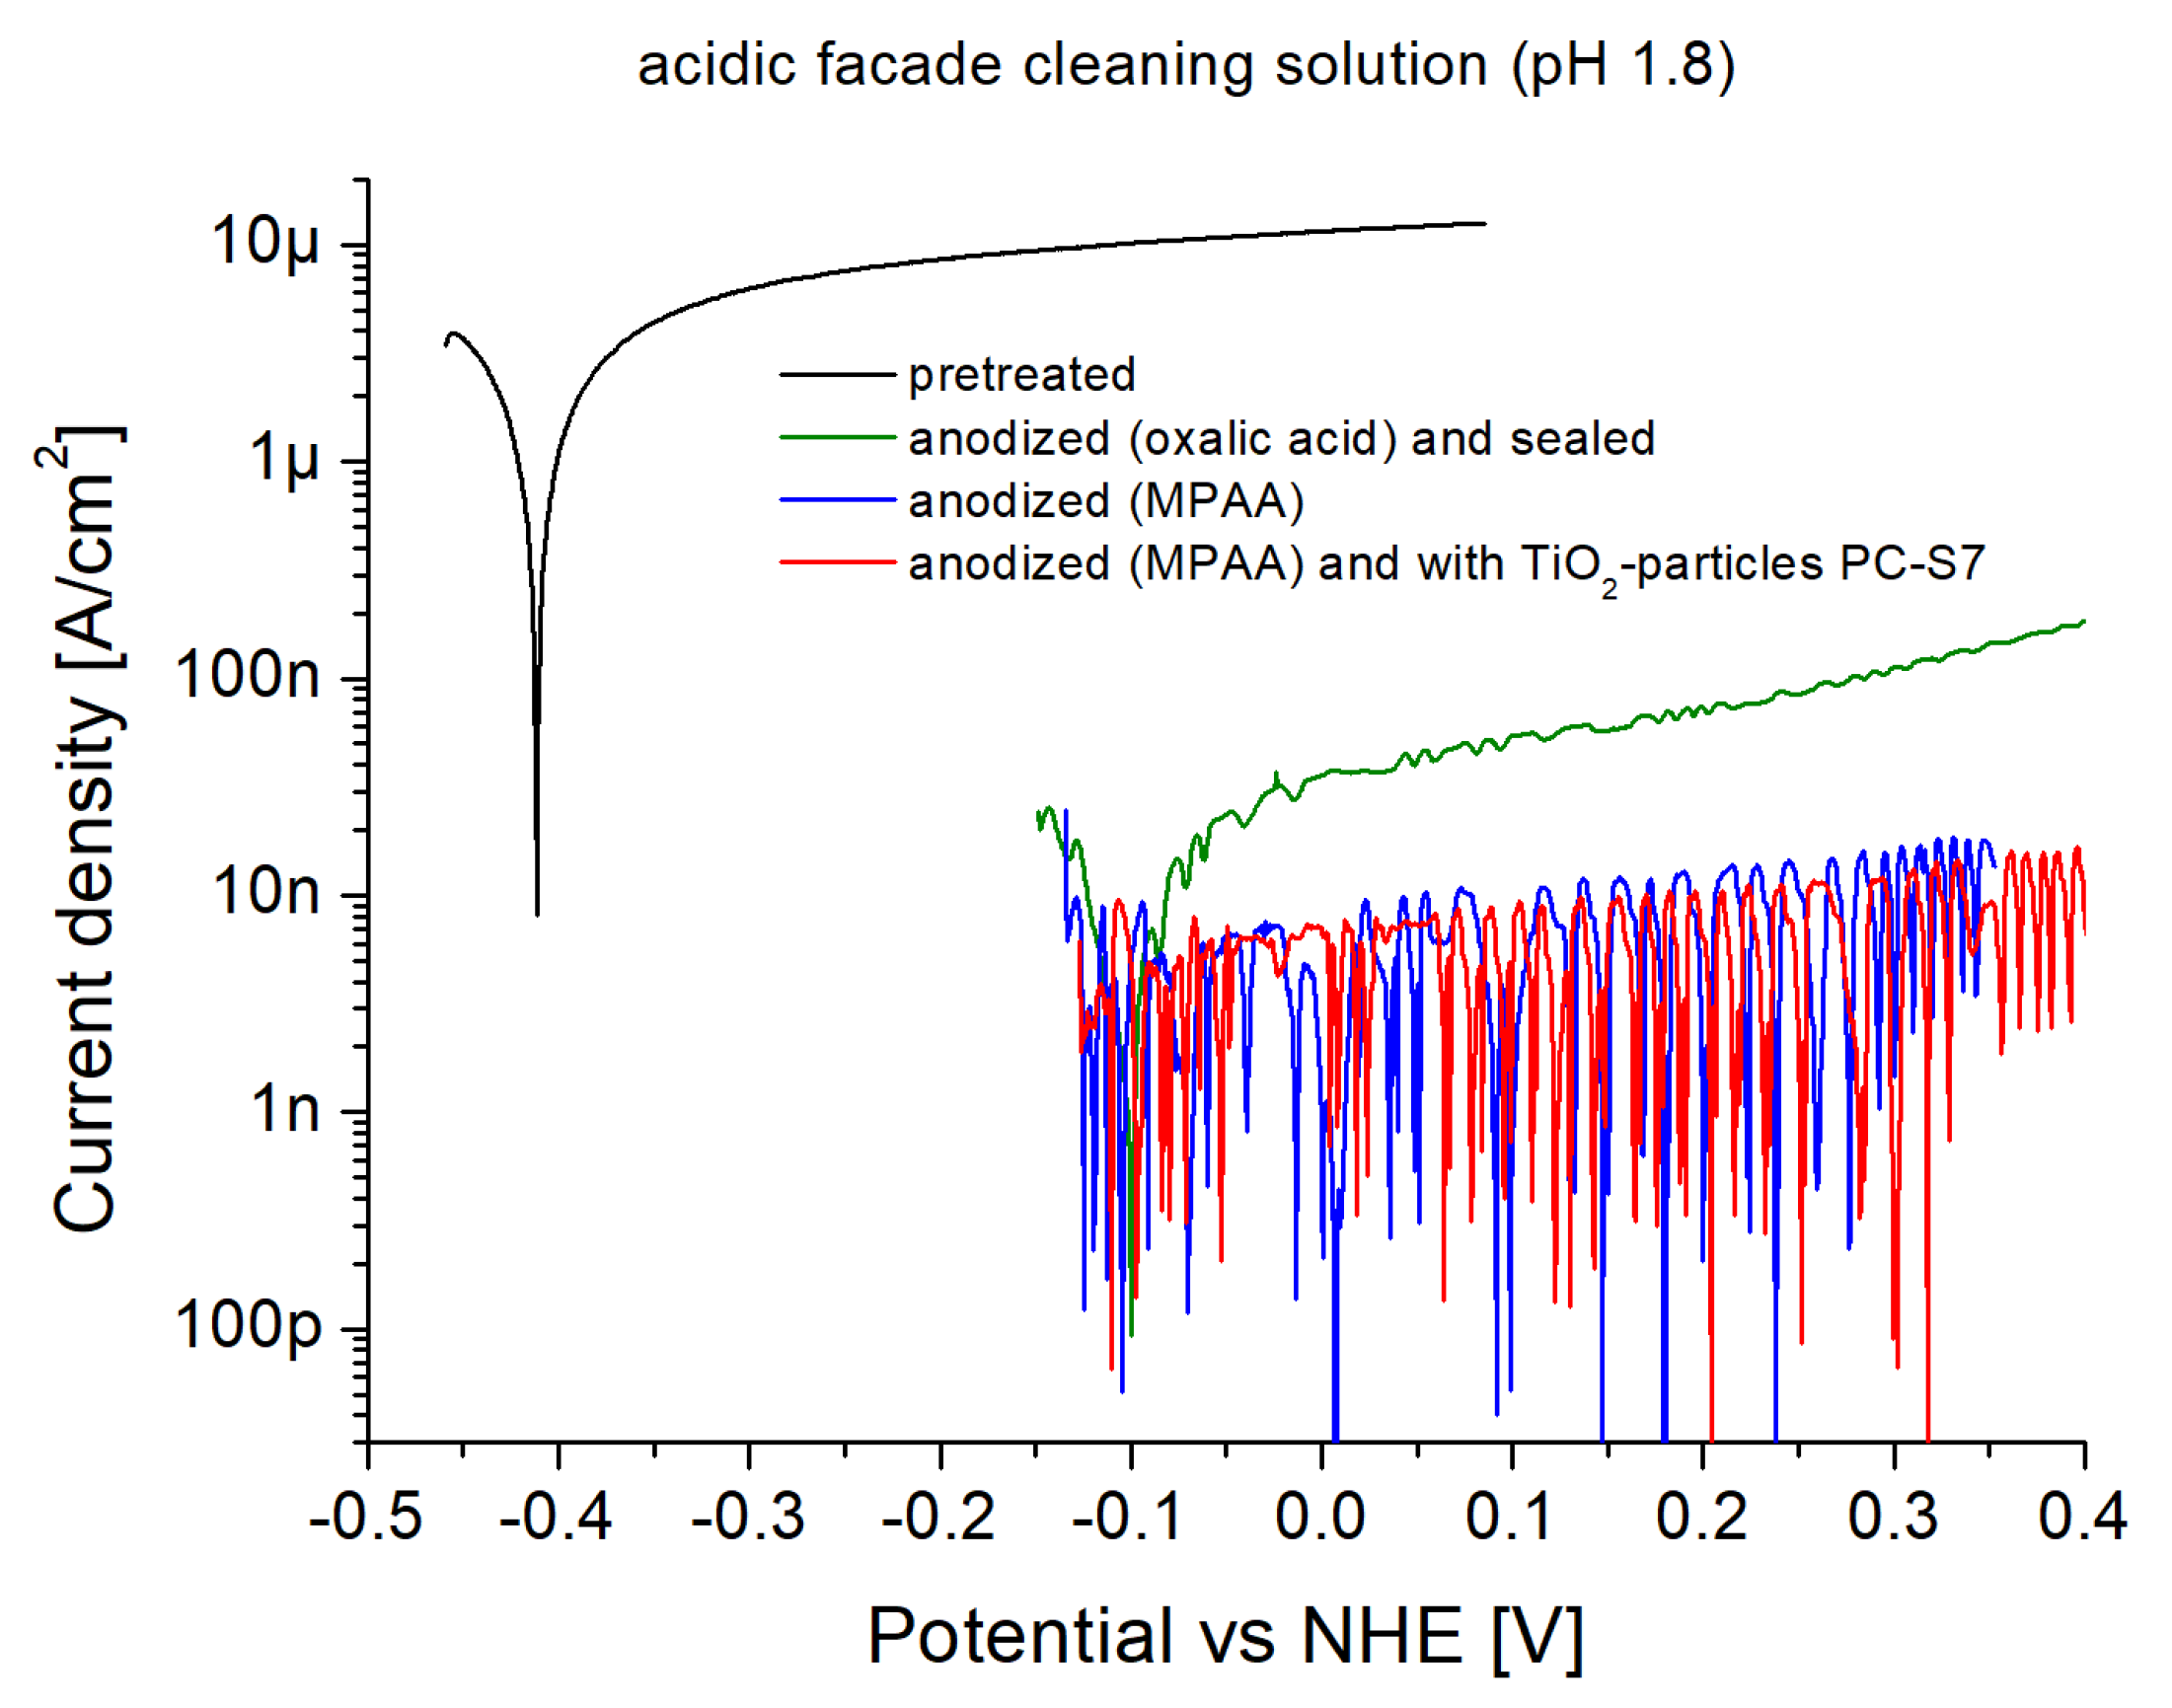
3.4. Corrosion
4. Summary and Conclusions
Author Contributions
Funding
Data Availability Statement
Conflicts of Interest
Abbreviations
| DLS | Dynamic light scattering |
| DoE | Design of experiments |
| MPAA | Modified phosphoric acid anodization |
| rPCE | Relative photocatalytic efficiency |
| UBA | German Federal Environment Agency |
| WHO | World Health Organization |
References
- Umweltbundesamt. Available online: https://www.umweltbundesamt.de/en/topics/air/air-pollutants-at-a-glance/nitrogen-dioxide (accessed on 3 November 2022).
- World Health Oganization. WHO Global Air Quality Guidelines: Particulate Matter (PM2.5 and PM10), Ozone, Nitrogen Dioxide, Sulfur Dioxide and Carbon; WHO: Geneva, Switzerland, 2021. [Google Scholar]
- Verband der Mineralfarbenindustrie e. V. Available online: Https://www.vdmi.de/en/products/applied-photocatalysis/product-range/photoactive-construction-materials/ (accessed on 3 November 2022).
- Chen, J.; Poon, C. Photocatalytic construction and building materials: From fundamentals to applications. Build. Environ. 2009, 44, 1899–1906. [Google Scholar] [CrossRef]
- Zhong, L.; Haghighat, F. Photocatalytic air cleaners and materials technologies—Abilities and limitations. Build. Environ. 2015, 91, 191–203. [Google Scholar] [CrossRef]
- Hamidi, F.; Aslani, F. TiO2-based Photocatalytic Cementitious Composites: Materials, Properties, Influential Parameters, and Assessment Techniques. Nanomaterials 2019, 9, 1444. [Google Scholar] [CrossRef] [Green Version]
- Kammer, C. Aluminium Handbook: Vol. 1: Fundamentals and Materials, 1st ed.; Aluminium-Verlag: Dusseldorf, Germany, 2003. [Google Scholar]
- Spooner, R.C. The Anodic Treatment of Aluminum in Sulfuric Acid Solutions. J. Electrochem. Soc. 1955, 102, 156–162. [Google Scholar] [CrossRef]
- O’Sullivan, J.P.; Wood, G.C. The morphology and mechanism of formation of porous anodic films on aluminium. Roc. R. Soc. Lond. A 1970, 317, 511–543. [Google Scholar] [CrossRef]
- Ono, S.; Saito, M.; Asoh, H.T. Self-ordering of anodic porous alumina formed in organic acid electrolytes. Electrochim. Acta 2005, 51, 827–833. [Google Scholar] [CrossRef]
- Houser, J.E. Modeling the Steady-State Growth of Porous Anodic Alumina. Ph.D. Thesis, Iowa State University, Ames, IN, USA, 2008. [Google Scholar]
- Paz Martínez-Viademonte, M.; Abrahami, S.T.; Hack, T.; Burchardt, M.; Terryn, H. A Review on Anodizing of Aerospace Aluminum Alloys for Corrosion Protection. Coatings 2020, 10, 1106. [Google Scholar] [CrossRef]
- Schneider, M.; Fuerbeth, W. Anodizing—The pore makes the difference. Mater. Corros. 2022, 73, 1752–1765. [Google Scholar] [CrossRef]
- Henley, V.F. Anodic Oxidation of Aluminium and Its Alloys, 1st ed.; Pergamon Press: New York, NY, USA, 1982. [Google Scholar]
- Belwalkar, A.; Grasing, E.; Van Geertruyden, W.; Huang, Z.; Misiolek, W.Z. Effect of processing parameters on pore structure and thickness of anodic aluminum oxide (AAO) tubular membranes. J. Membr. Sci. 2008, 319, 192–198. [Google Scholar] [CrossRef] [Green Version]
- Ono, S.; Masuko, N. Evaluation of pore diameter of anodic porous films formed on aluminum. Surf. Coat. Technol. 2003, 169–170, 139–142. [Google Scholar] [CrossRef]
- Ramirez, O.; Queiroz, F.M.; Tunes, M.; Antunes, R.; Rodrigues, C.; Lanzutti, A.; Pogatscher, S.; Olivier, M.-G.; De Melo, H.G. Tartaric-sulphuric acid anodized clad AA2024-T3 post-treated in Ce-containing solutions at different temperatures: Corrosion behaviour and Ce ions distribution. Appl. Surf. Sci. 2020, 534, 147634. [Google Scholar] [CrossRef]
- Pinner, R.; Sheasby, P.G. The Surface Treatment and Finishing of Aluminium and Its Alloys, 6th ed.; ASM International: Almere, The Netherlands, 2001. [Google Scholar]
- Terada, M.; Queiroz, F.M.; Aguiar, D.B.S.; Ayusso, V.H.; Costenaro, H.; Olivier, M.-G.; De Melo, H.G.; Costa, I. Corrosion resistance of tartaric-sulfuric acid anodized AA2024-T3 sealed with Ce and protected with hybrid sol–gel coating. Surf. Coat. Technol. 2019, 372, 422–426. [Google Scholar] [CrossRef]
- Fedel, M.; Franch, J.; Rossi, S. Effect of thickness and sealing treatments on the corrosion protection properties of anodic oxide coatings on AA5005. Surf. Coat. Technol. 2021, 408, 126761. [Google Scholar] [CrossRef]
- Mann, R.; Hansal, S.; Hansal, W.E.G. Nanoparticle incorporation in plasma-electrolytic oxidation. Int. J. Surf. Eng. Coat. 2016, 94, 131–138. [Google Scholar] [CrossRef]
- Fori, B.; Taberna, P.-L.; Arurault, L.; Bonino, J.P.; Gazeau, C.; Bares, P. Electrophoretic impregnation of porous anodic aluminum oxide film by silica. Colloids Surf. 2012, 415, 187–194. [Google Scholar] [CrossRef] [Green Version]
- Schüth, F.; Sing, K.S.W.; Weitkamp, J. Handbook of Porous Solids, 3rd ed.; Wiley-VCH: Weinheim, Germany, 2002. [Google Scholar]
- US Research Nanomaterials Inc. Available online: https://www.us-nano.com/inc/sdetail/484 (accessed on 3 November 2022).
- Nyacol Nano Technologies Inc. Available online: https://www.nyacol.com/products/titanium-dioxide/ (accessed on 3 November 2022).
- Etacheri, V.; Di Valentin, C.; Schneider, J.; Bahnemann, D.; Pillai, S.C. Visible-light Activation of TiO2 Photocatalysts: Advances in Theory and Experiments. J. Photochem. Photobiol. C 2015, 25, 1–29. [Google Scholar] [CrossRef] [Green Version]
- Schneider, J.; Matsuoka, M.; Takeuchi, M.; Zhang, J.; Horiuchi, Y.; Anpo, M.; Bahnemann, D.W. Understanding TiO2 Photocatalysis: Mechanisms and Materials. Chem. Rev. 2014, 114, 9919–9986. [Google Scholar] [CrossRef]
- Schneider, M.; Kremmer, K.; Weidmann, S.K.; Fuerbeth, W. Interplay between parameter variation and oxide structure of a modified PAA process. Surf. Interface Anal. 2013, 45, 1503–1509. [Google Scholar] [CrossRef]
- Schneider, M.; Kremmer, K.; Weidmann, S.K.; Fuerbeth, W. Particle reinforced open porous anodizing layers on AA5005. Mater. Corr. 2017, 68, 1090–1098. [Google Scholar] [CrossRef]
- Landau, L.D.; Levich, B.G. Dragging of a liquid by a moving plate. Acta Physiochim. U.R.S.S. 1942, 8, 42–54. [Google Scholar]
- German Federation for Applied Photocatalysis. Voluntary Commitment of the Manufacturers of Photocatalytically Active Products to Achieve a Minimum Activity for the NO Degradation on Photocatalytically Active Surfaces. Available online: https://www.vdmi.de/en/products/applied-photocatalysis/voluntary-commitment/voluntary-commitment/?= (accessed on 4 November 2022).
- Masuda, H.; Hasegwa, F.; Ono, S. Self-Ordering of Cell Arrangement of Anodic Porous Alumina Formed in Sulfuric Acid Solution. J. Electrochem. Soc. 1997, 144, 127–130. [Google Scholar] [CrossRef]
- Vorobyova, A.I.; Outkina, E.A. Study of pillar microstructure formation with anodic oxides. Thin Solid Film. 1998, 324, 1–10. [Google Scholar] [CrossRef]
- Ye, J.; Yin, Q.; Zhou, Y. Superhydrophilicity of anodic aluminum oxide films: From “honeycomb” to “bird’s nest”. Thin Solid Film. 2009, 517, 6012–6015. [Google Scholar] [CrossRef]
- Kim, Y.-C.; Quint, B.; Kessler, R.W.; Oelkrug, D. Structural properties of electrochemically designed porous oxide films on AlMg1. J. Electroanal. Chem. 1999, 468, 121–126. [Google Scholar] [CrossRef]
- Xu, Y.-F.; Liu, H.; Li, X.-J.; Kang, W.-M.; Cheng, B.-W.; Li, X.-J. A novel method for fabricating self-ordered porous anodic alumina with wide interpore distance using phosphoric/oxalic acid mixed electrolyte. Mater. Lett. 2015, 151, 79–81. [Google Scholar] [CrossRef]
- Gallus, M.; Ciuraru, R.; Mothes, F.; Akylas, V.; Barmpas, F.; Beeldens, A.; Bernard, F.; Boonen, E.; Boréave, A.; Cazaunau, M.; et al. Photocatalytic abatement results from a model street canyon. Environ. Sci. Pollut. Res. 2015, 22, 18185–18196. [Google Scholar] [CrossRef]
- Morfeld, P.; Groneberg, D.A.; Spallek, M.F. Effectiveness of low emission zones: Large scale analysis of changes in environmental NO2, NO and NOx concentrations in 17 German cities. PLoS ONE 2014, 9, e102999. [Google Scholar] [CrossRef] [PubMed]


| Factor | Range | Response | Target |
|---|---|---|---|
| Bath temperature | 35–45 °C | Pore size | >100 nm |
| Voltage | 40–55 V | Layer thickness | 2–4 m |
| Anodizing time | 60–420 s | Layer quality | Homogeneous, open pores |
| Phosphoric acid concentration | 10–20 wt.% |
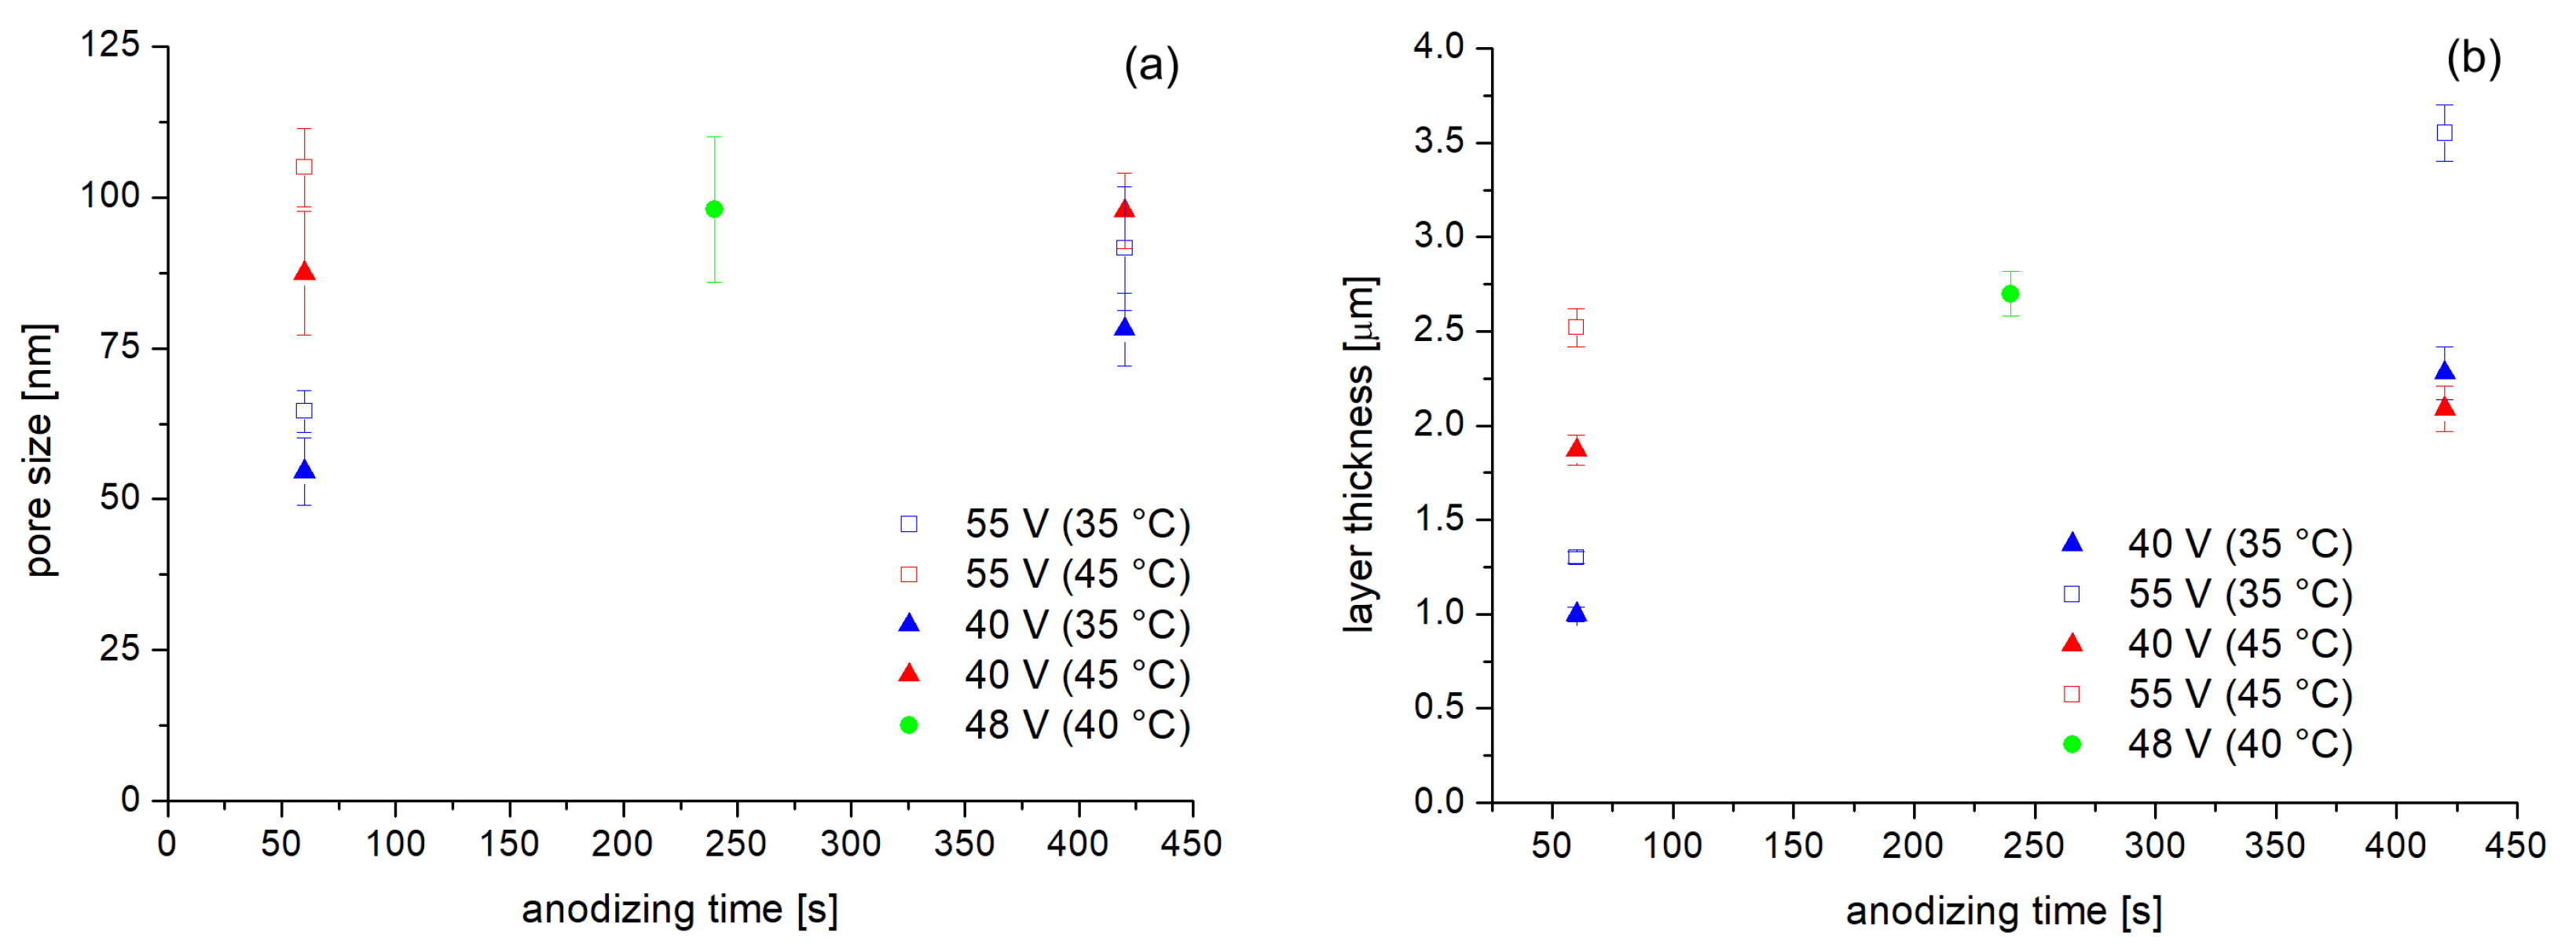
| Temperature | Dwell Time | Charge Accumulated | Coating Thickness |
|---|---|---|---|
| °C | s | cm | m |
| 35 | 60 | 1.79 | 1.0 ± 0.1 |
| 35 | 420 | 5.87 | 2.2 ± 0.2 |
| 45 | 60 | 6.65 | 1.9 ± 0.1 |
| 45 | 420 | 23.21 | 2.1 ± 0.1 |
| Sample Code | NO Degradation Abs. | rPCE |
|---|---|---|
| [mol] | ||
| PC-S7-1 | 1.9 | 3.6 |
| PC-S7-2 | 3.4 | 6.3 |
| PC-S7-3 | 4.4 | 8.4 |
| PC-S7-4 | 2.7 | 5.0 |
| W2730X-1 | 4.4 | 8.4 |
| W2730X-2 | 4.5 | 8.4 |
Disclaimer/Publisher’s Note: The statements, opinions and data contained in all publications are solely those of the individual author(s) and contributor(s) and not of MDPI and/or the editor(s). MDPI and/or the editor(s) disclaim responsibility for any injury to people or property resulting from any ideas, methods, instructions or products referred to in the content. |
© 2022 by the authors. Licensee MDPI, Basel, Switzerland. This article is an open access article distributed under the terms and conditions of the Creative Commons Attribution (CC BY) license (https://creativecommons.org/licenses/by/4.0/).
Share and Cite
Lederer, S.; Benfer, S.; Bloh, J.; Javed, R.; Pashkova, A.; Fuerbeth, W. Development of Photocatalytically Active Anodized Layers by a Modified Phosphoric Acid Anodizing Process for Air Purification. Corros. Mater. Degrad. 2023, 4, 18-30. https://doi.org/10.3390/cmd4010002
Lederer S, Benfer S, Bloh J, Javed R, Pashkova A, Fuerbeth W. Development of Photocatalytically Active Anodized Layers by a Modified Phosphoric Acid Anodizing Process for Air Purification. Corrosion and Materials Degradation. 2023; 4(1):18-30. https://doi.org/10.3390/cmd4010002
Chicago/Turabian StyleLederer, Stephan, Sigrid Benfer, Jonathan Bloh, Rezan Javed, Aneta Pashkova, and Wolfram Fuerbeth. 2023. "Development of Photocatalytically Active Anodized Layers by a Modified Phosphoric Acid Anodizing Process for Air Purification" Corrosion and Materials Degradation 4, no. 1: 18-30. https://doi.org/10.3390/cmd4010002