
Pulsed Current Effect on the Hard Anodizing of an AlSi10Mg Aluminum Alloy Obtained via Additive Manufacturing

 , , ,
, , ,
Abstract
:1. Introduction
2. Materials and Methods
2.1. Hard Anodizing Treatments
2.1.1. Direct Current (DC) Procedures
2.1.2. Pulsed Direct Current (PDC) Procedures
2.2. Characterization Techniques
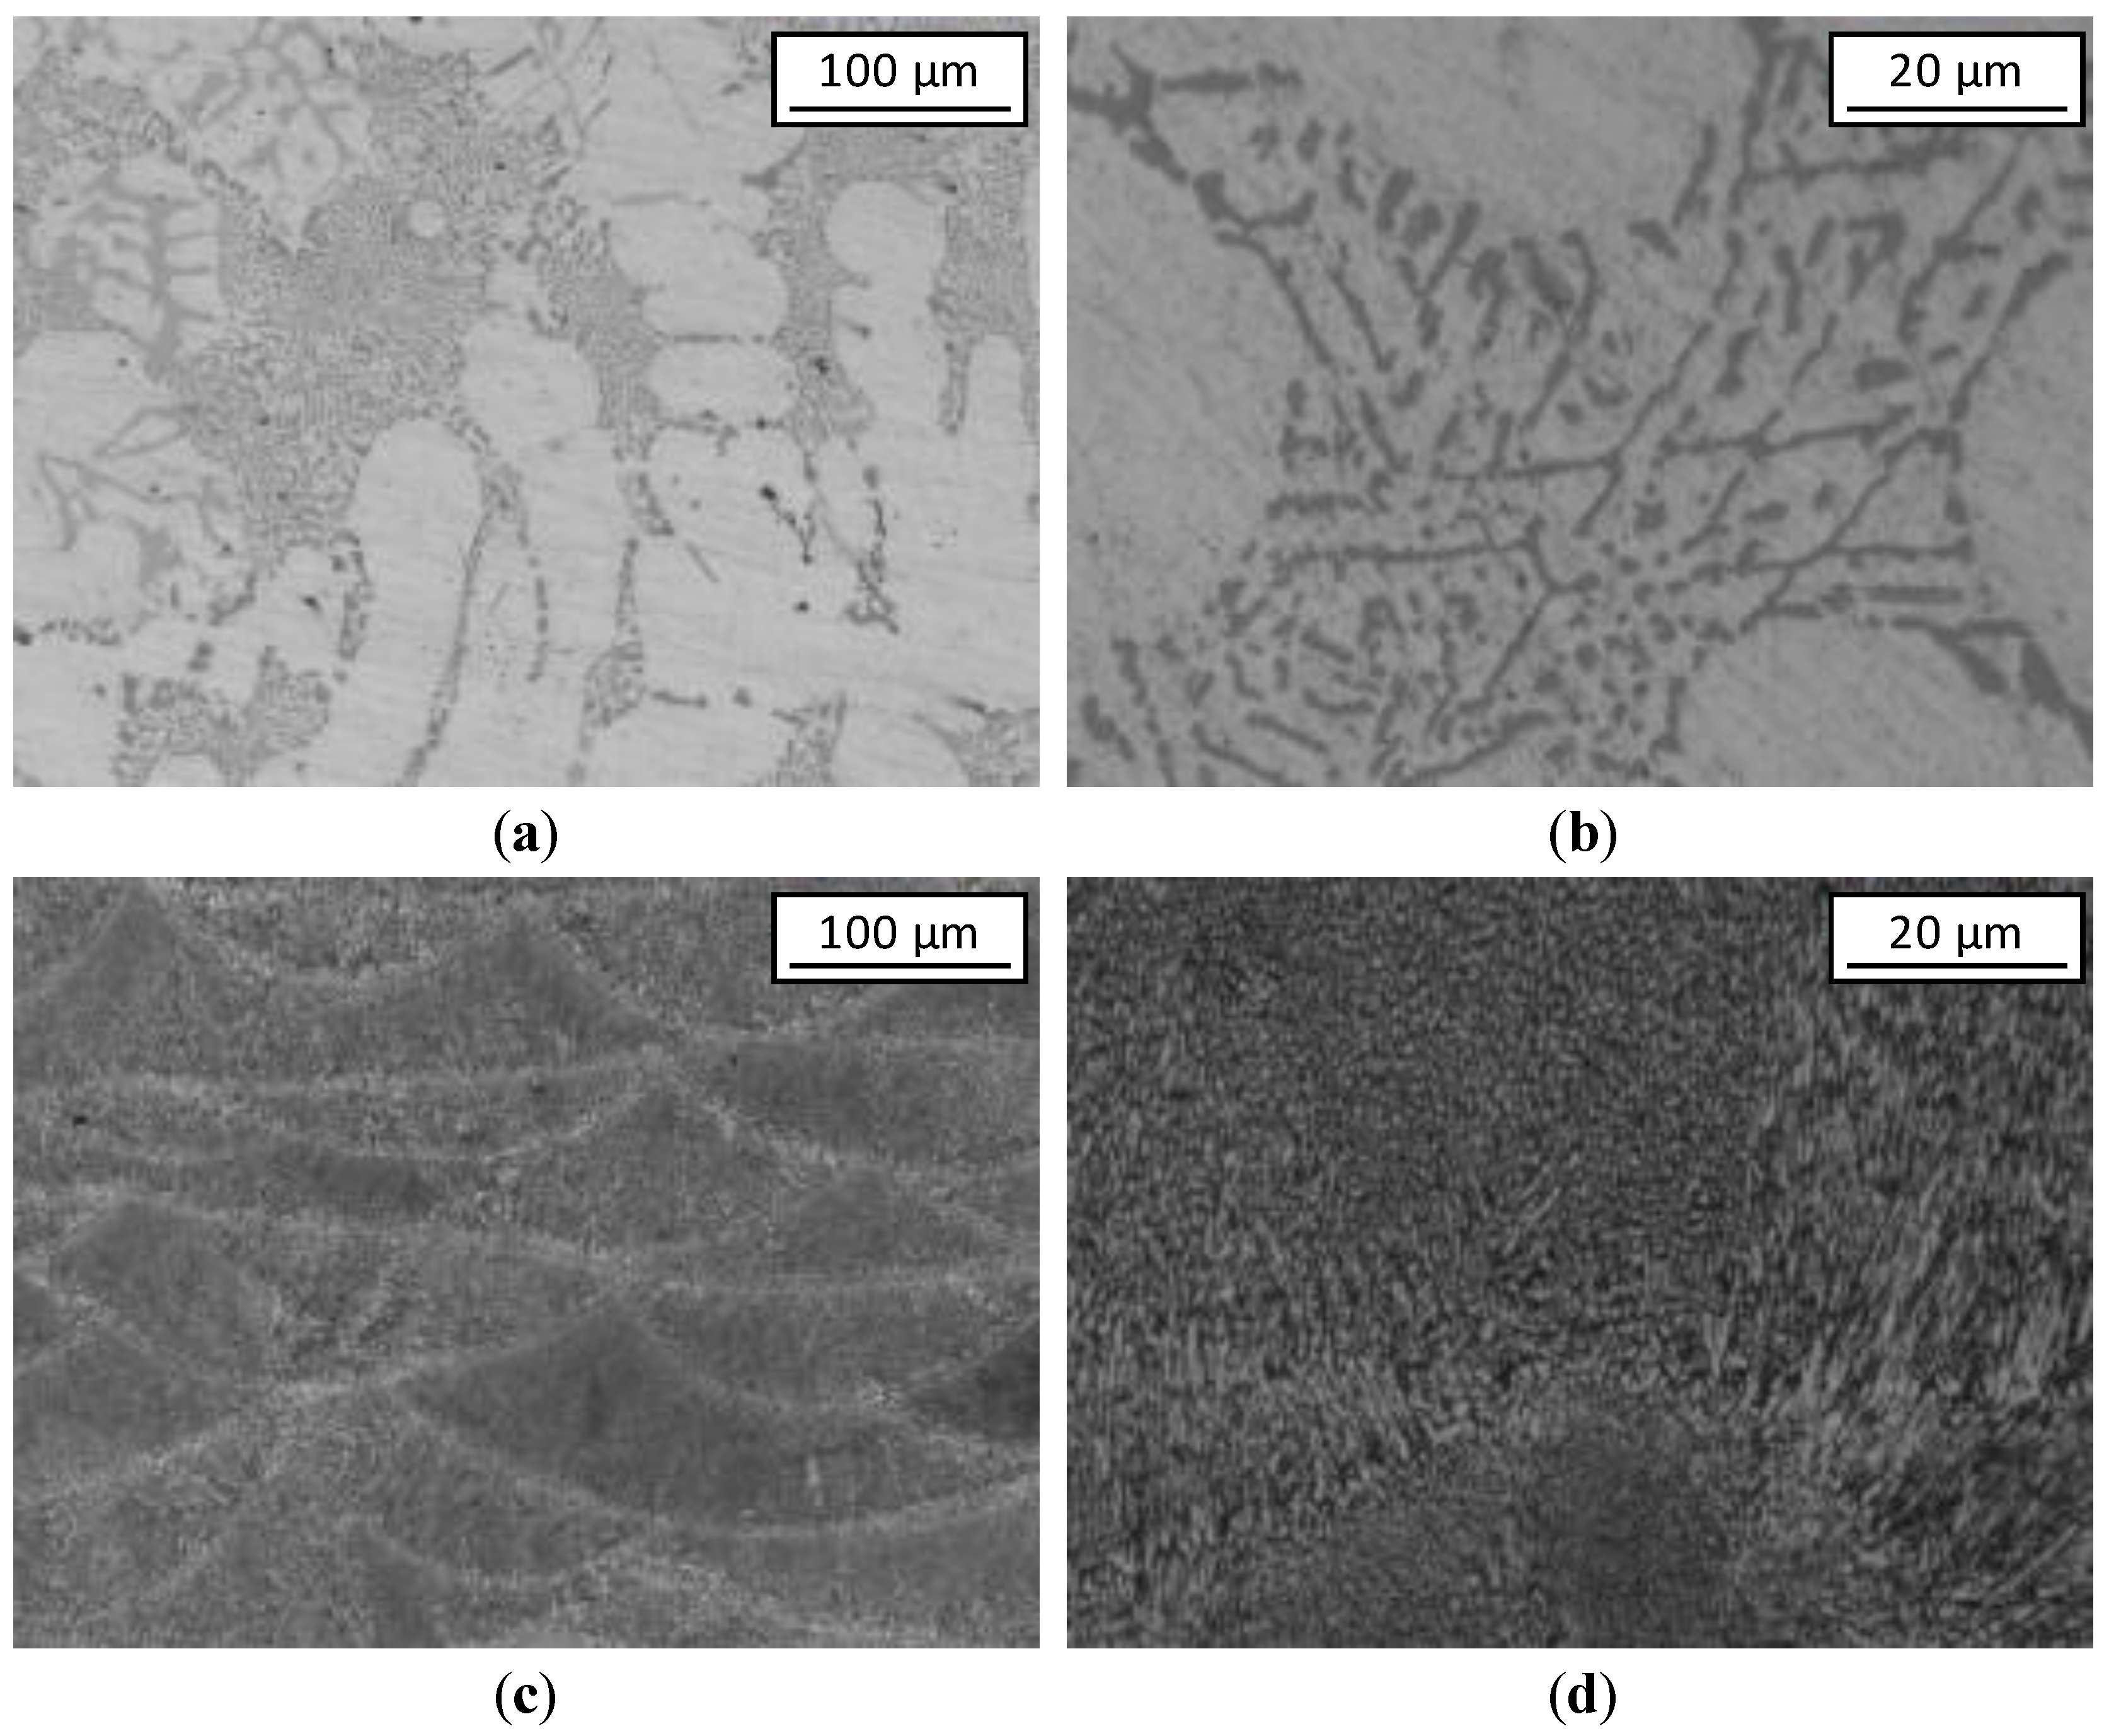
- Microstructure of both GC and L-PBF bare samples. AM samples were observed after Keller etching (1% HF, 1.5% HCl, 2.5% HNO3 and 95% H2O) for 30 s according to ASTM E407 standard.
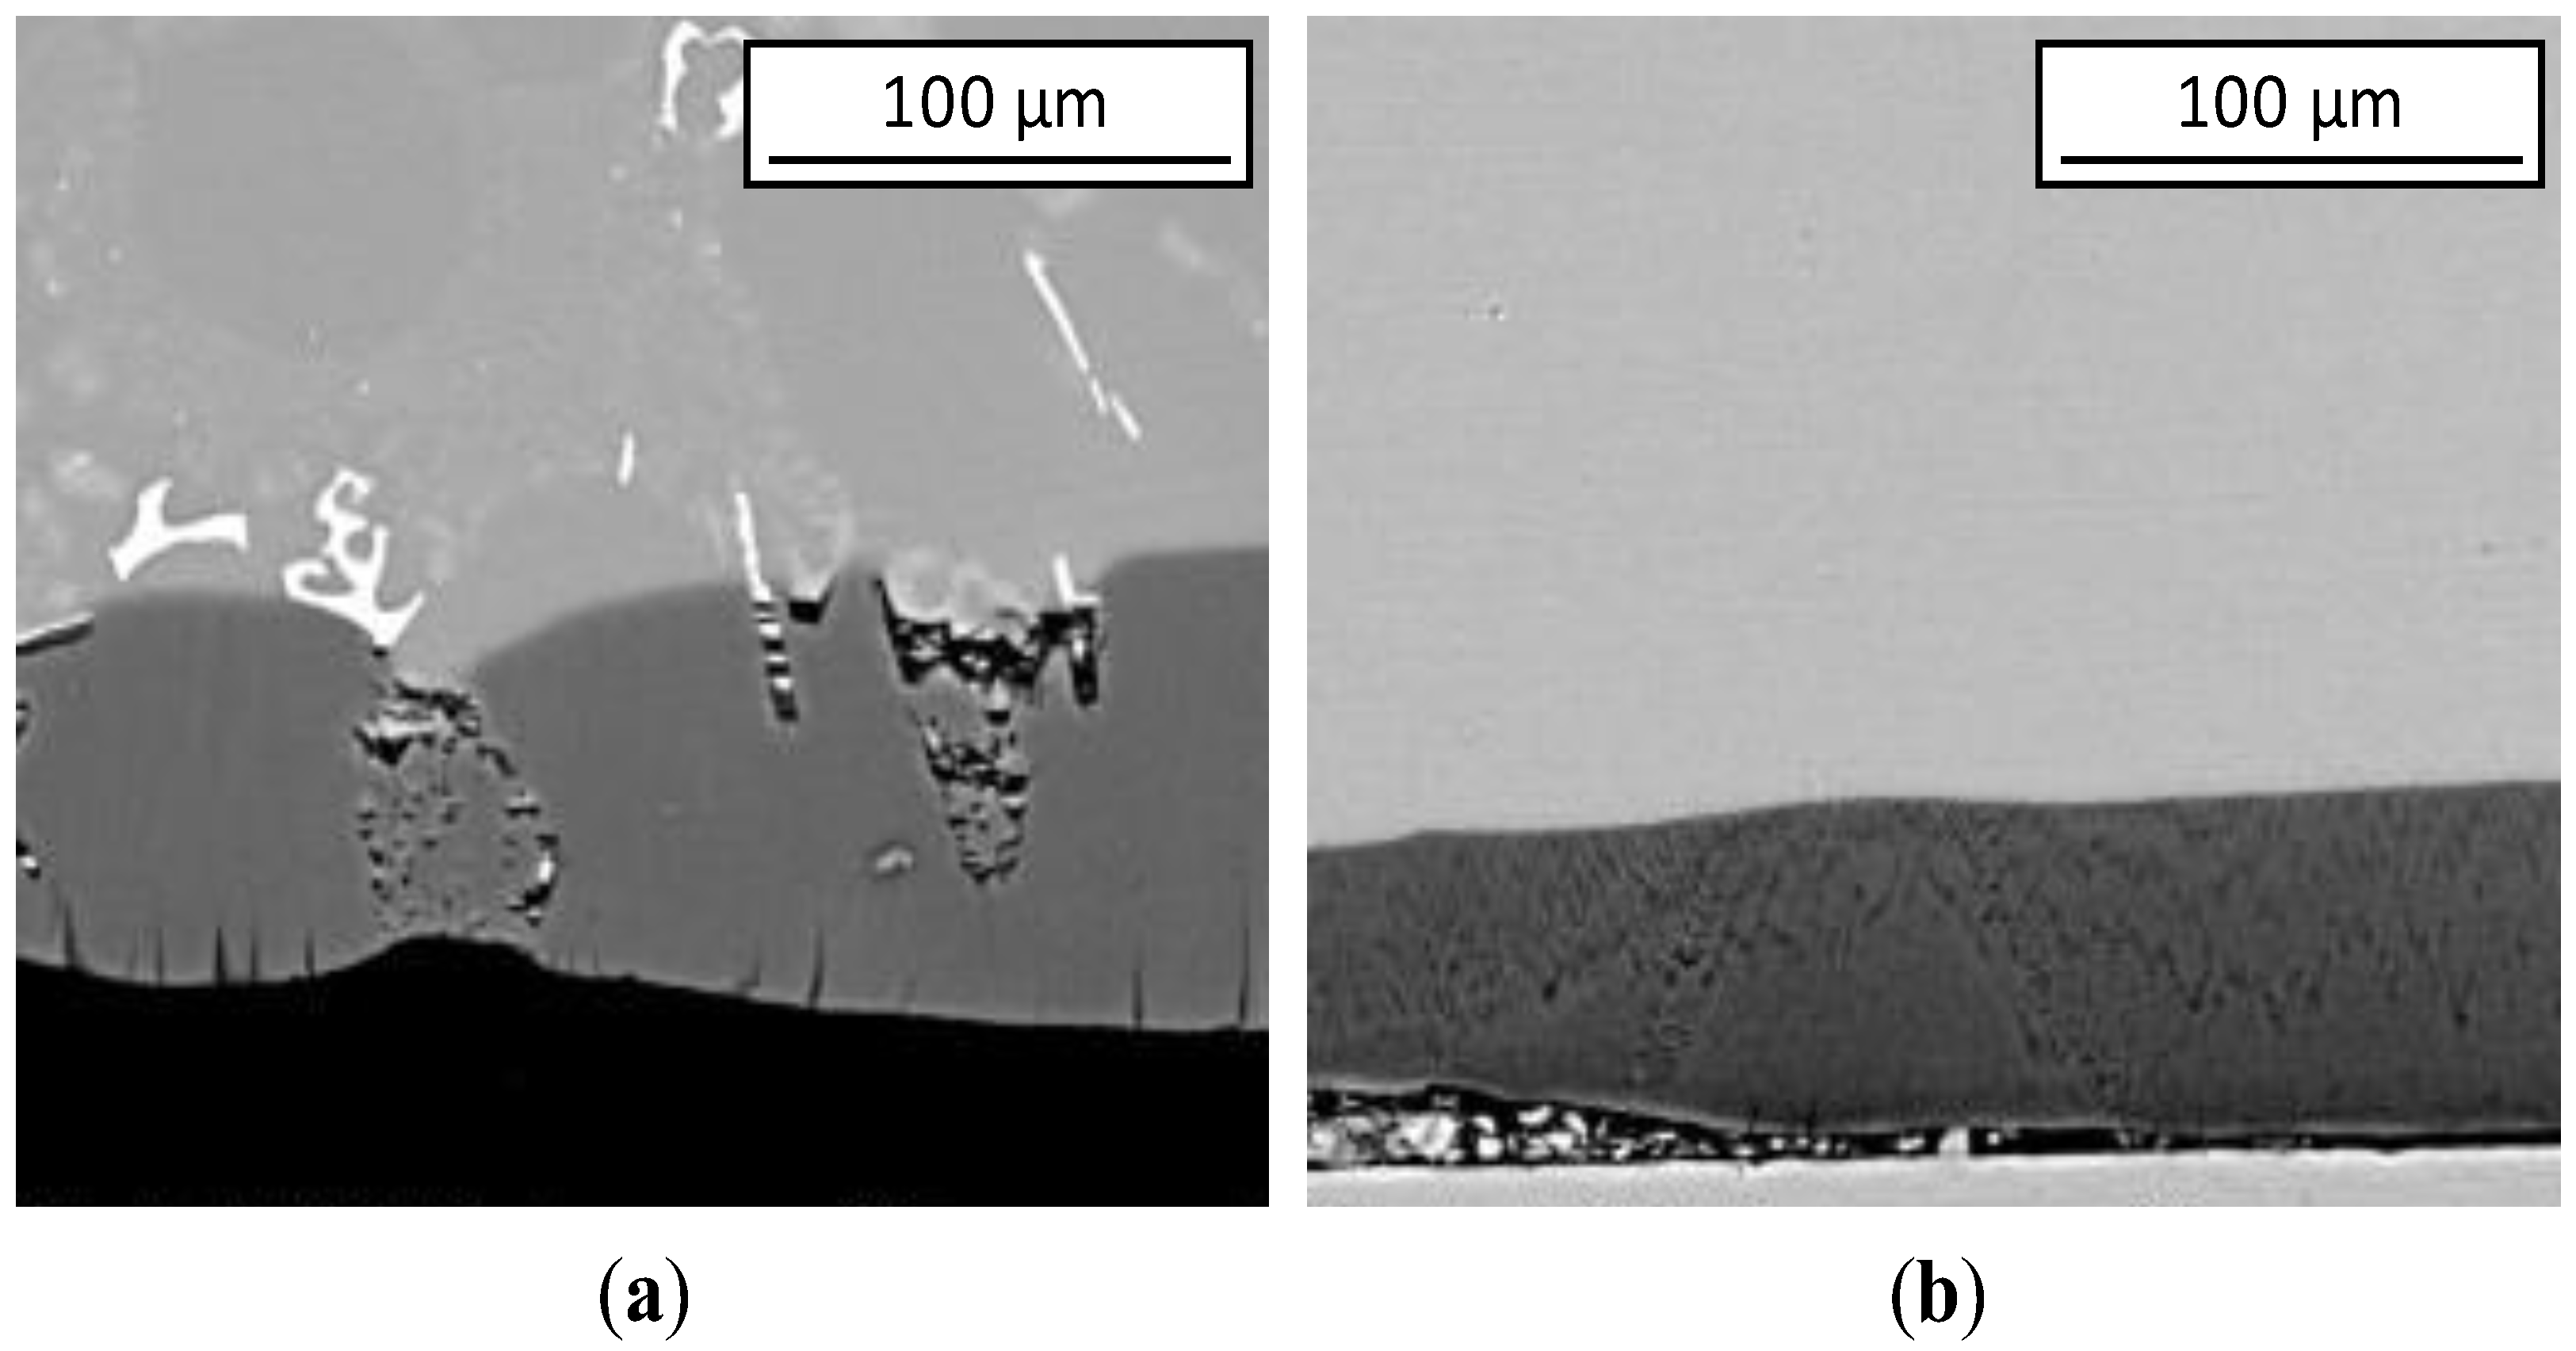
- Anodic oxide thickness. For each sample, the anodic oxide thickness value was calculated as an average of ten measurements acquired in five different cross-section micrographs at 100× magnification.
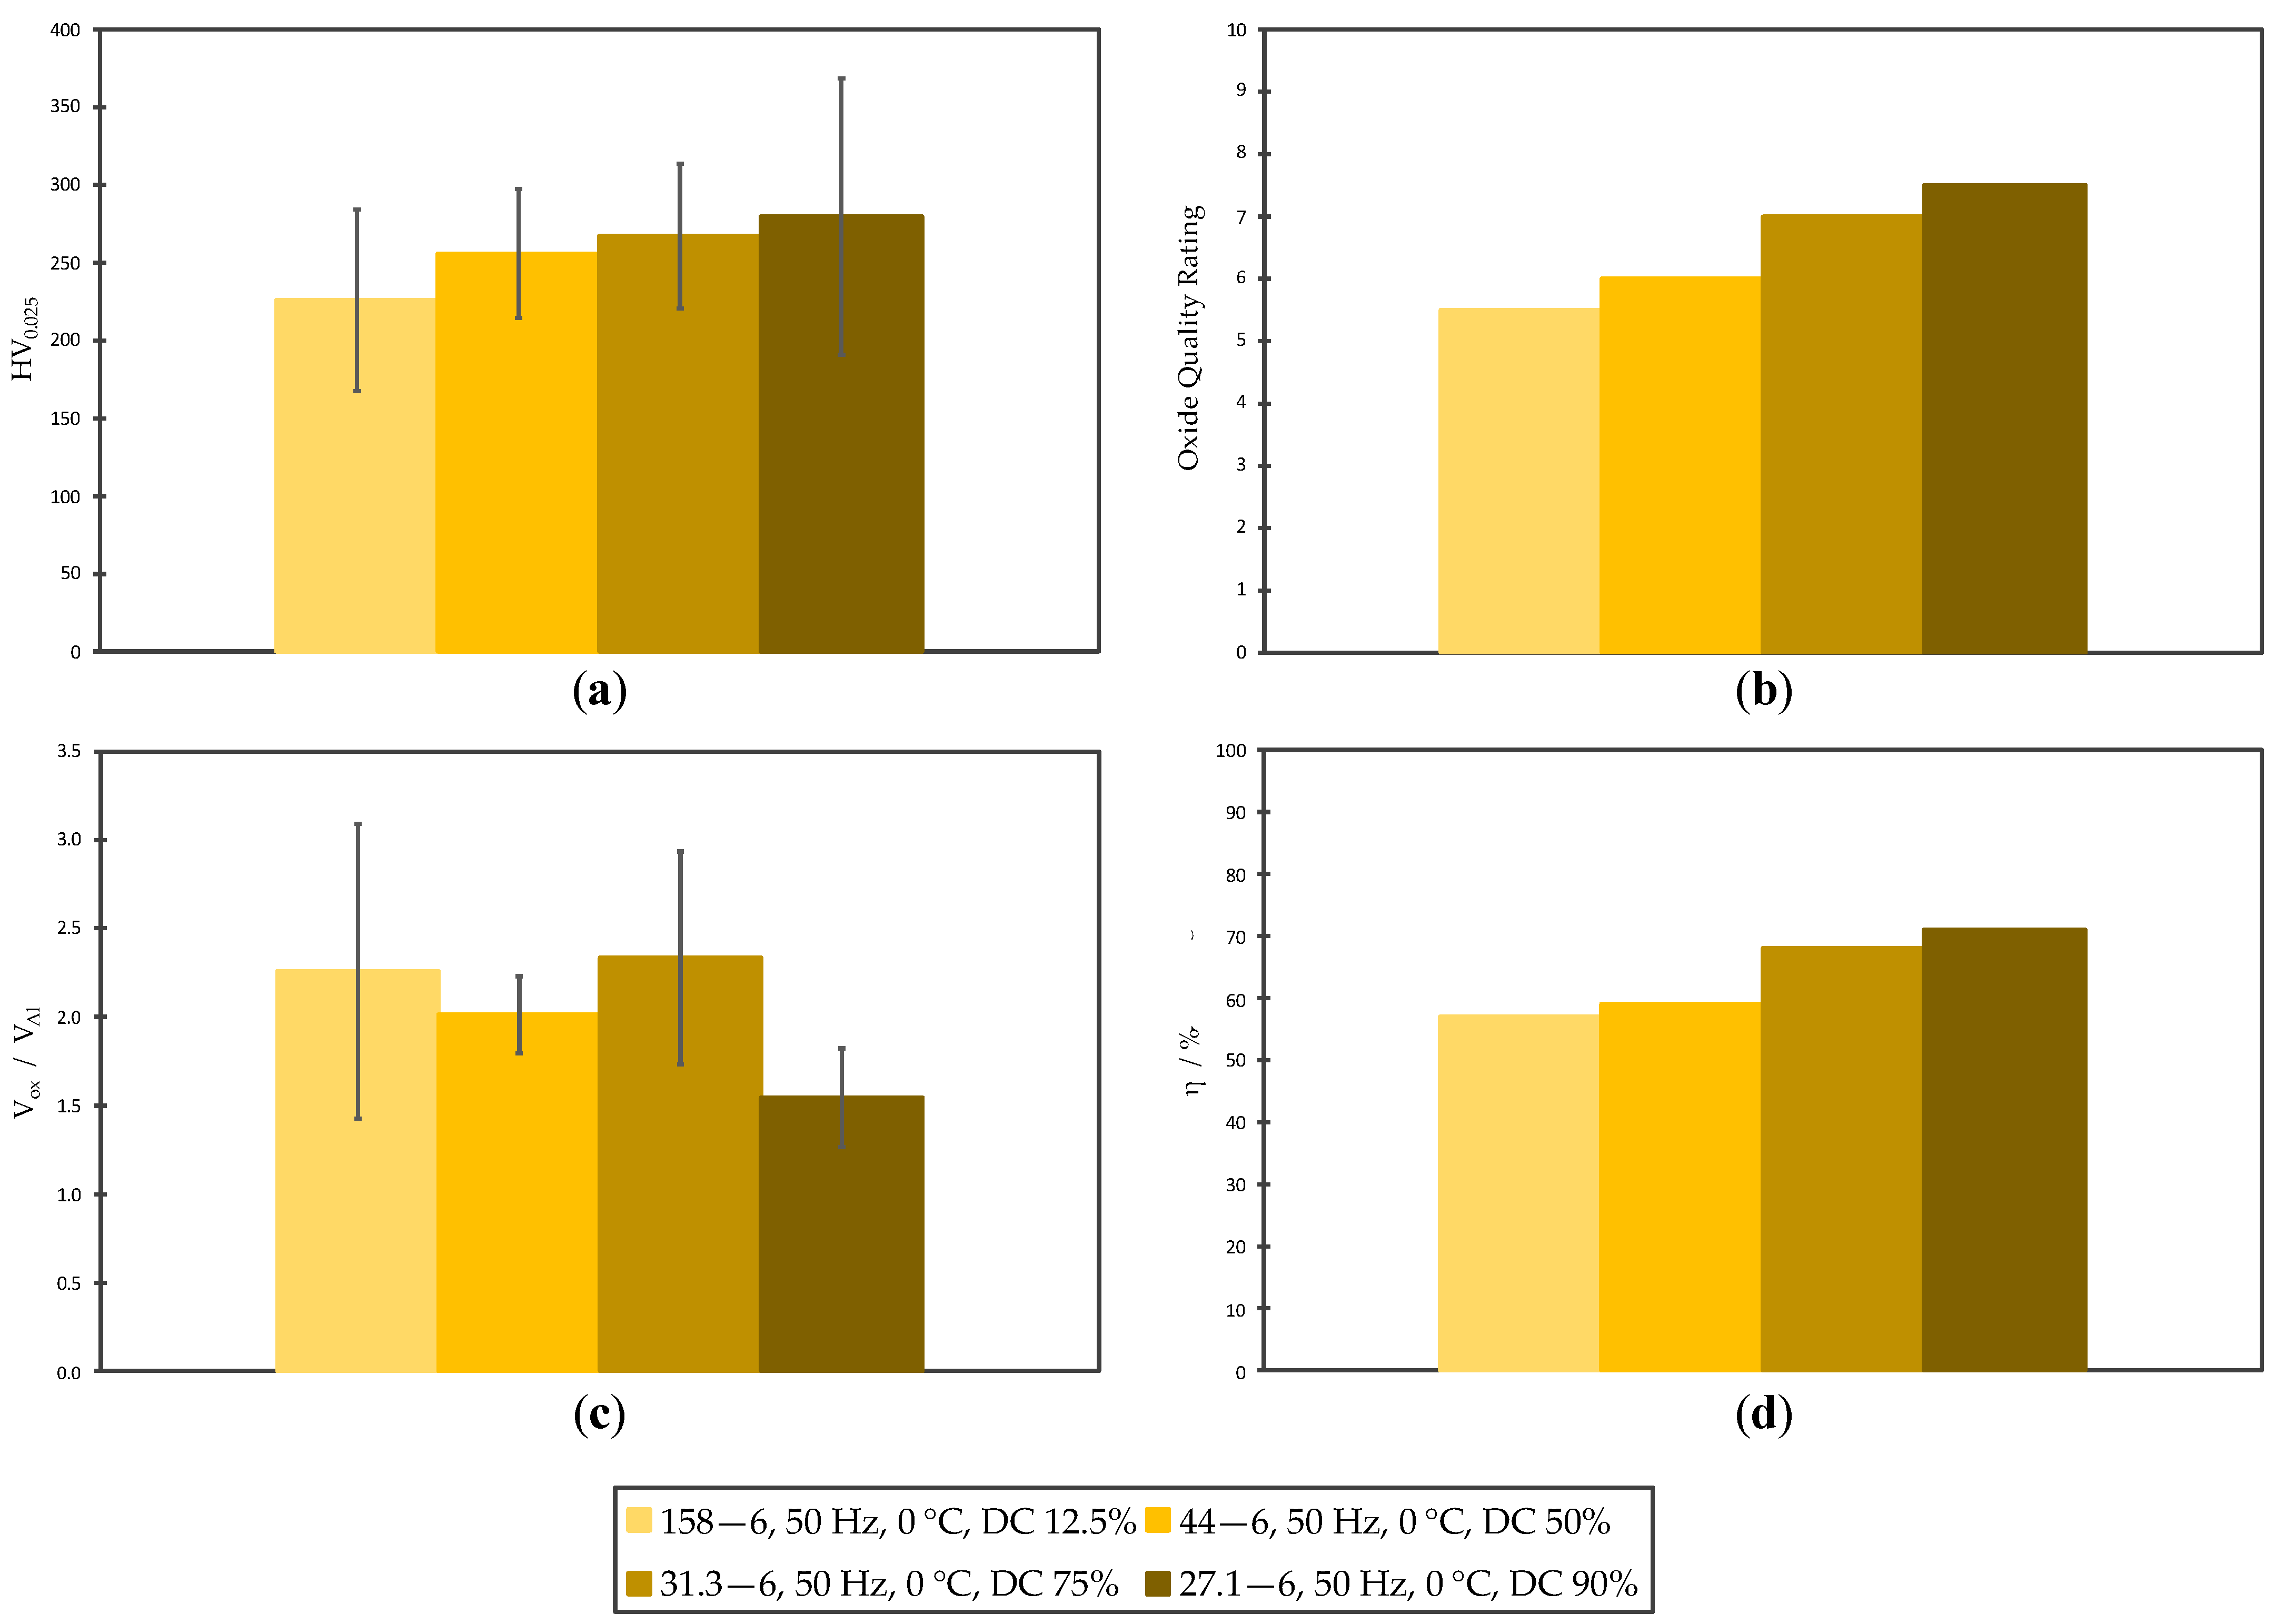
- Volumetric expansion ratio, Vox/VAl. The Vox/VAl values were calculated according to previous works [26,32,33] based on measuring the aluminum converted thicknesses and the anodic oxide thicknesses. In order to do this, in each sample two different cross-section micrographs at 100× magnification were acquired; a high value of the volumetric expansion ratio suggests a poor anodic oxide density due to a large distribution of defects and porosity.
- Faradaic efficiency, η. The η values, defined as a ratio between the effective converted mass (meff.) and the theoretical converted mass (mtheor), were calculated as in previous work [26]. The meff. values were determined by setting 1.0 cm2 as the exposed area and 2.67 or 2.68 g/cm3 as the density for GC and L-PBF samples, respectively [25]. The mtheor value was determined using Faraday’s law [34] by setting 27.1652 g/mol as the molar mass, 100 C as the total charge transferred, 2.7031 as the number of electrons exchanged, and 96,485 C/mol as the Faraday constant.
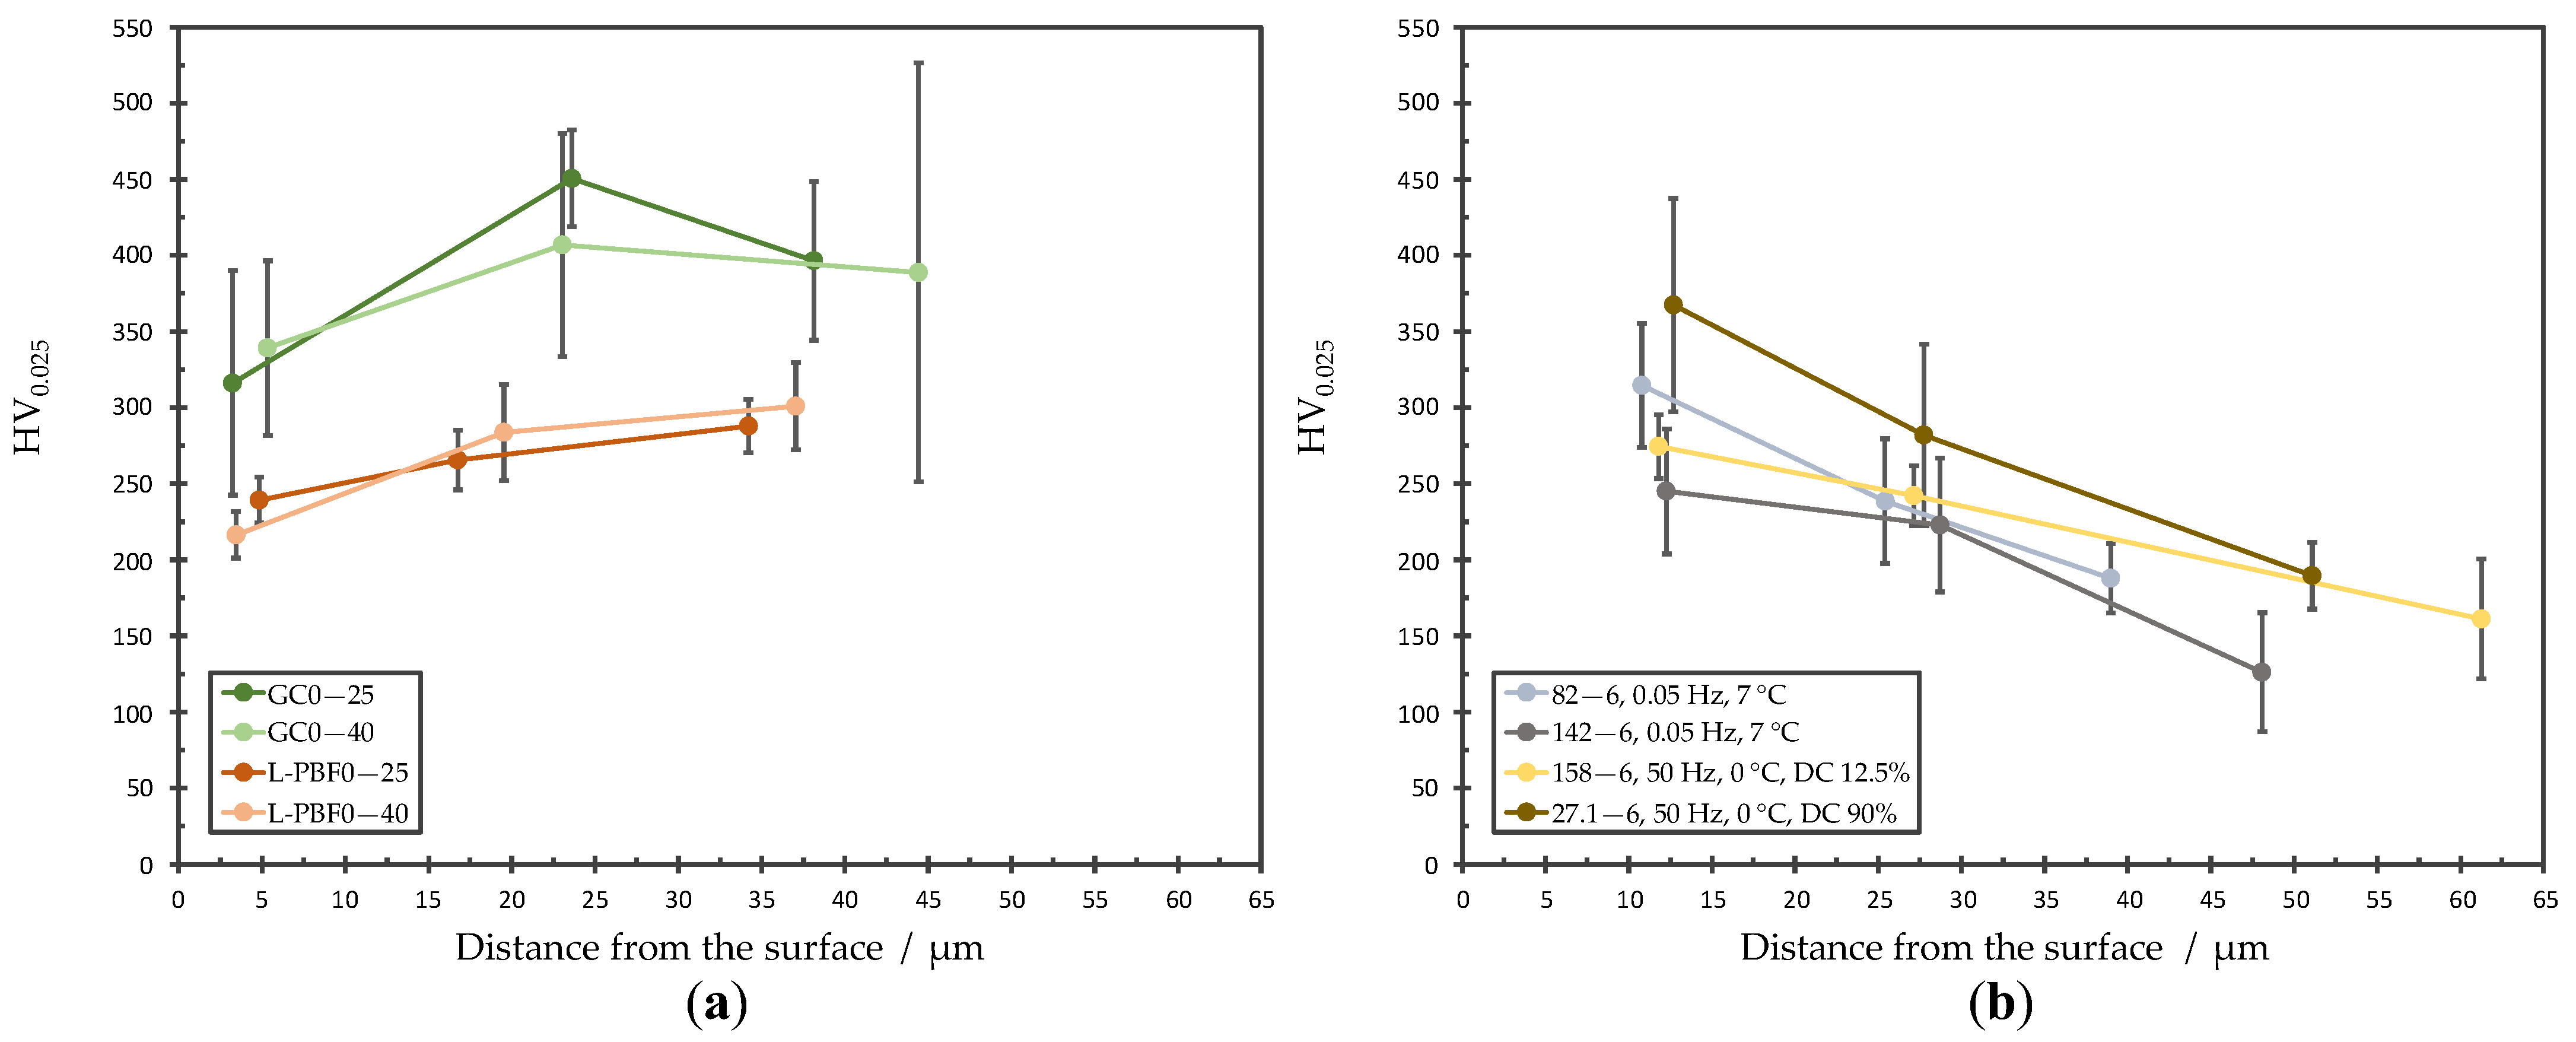
- Vickers hardness, HV0.025. For each sample, the HV0.025 value was calculated as an average of fifteen measurements carried out with a Wolpert Wilson® Instruments 402 MVD Microhardness Tester using 25 gf as test load and 10 s as dwell time. To this end, in each sample five different cross-section micrographs at 200× magnification were acquired.
3. Results and Discussion
4. Conclusions
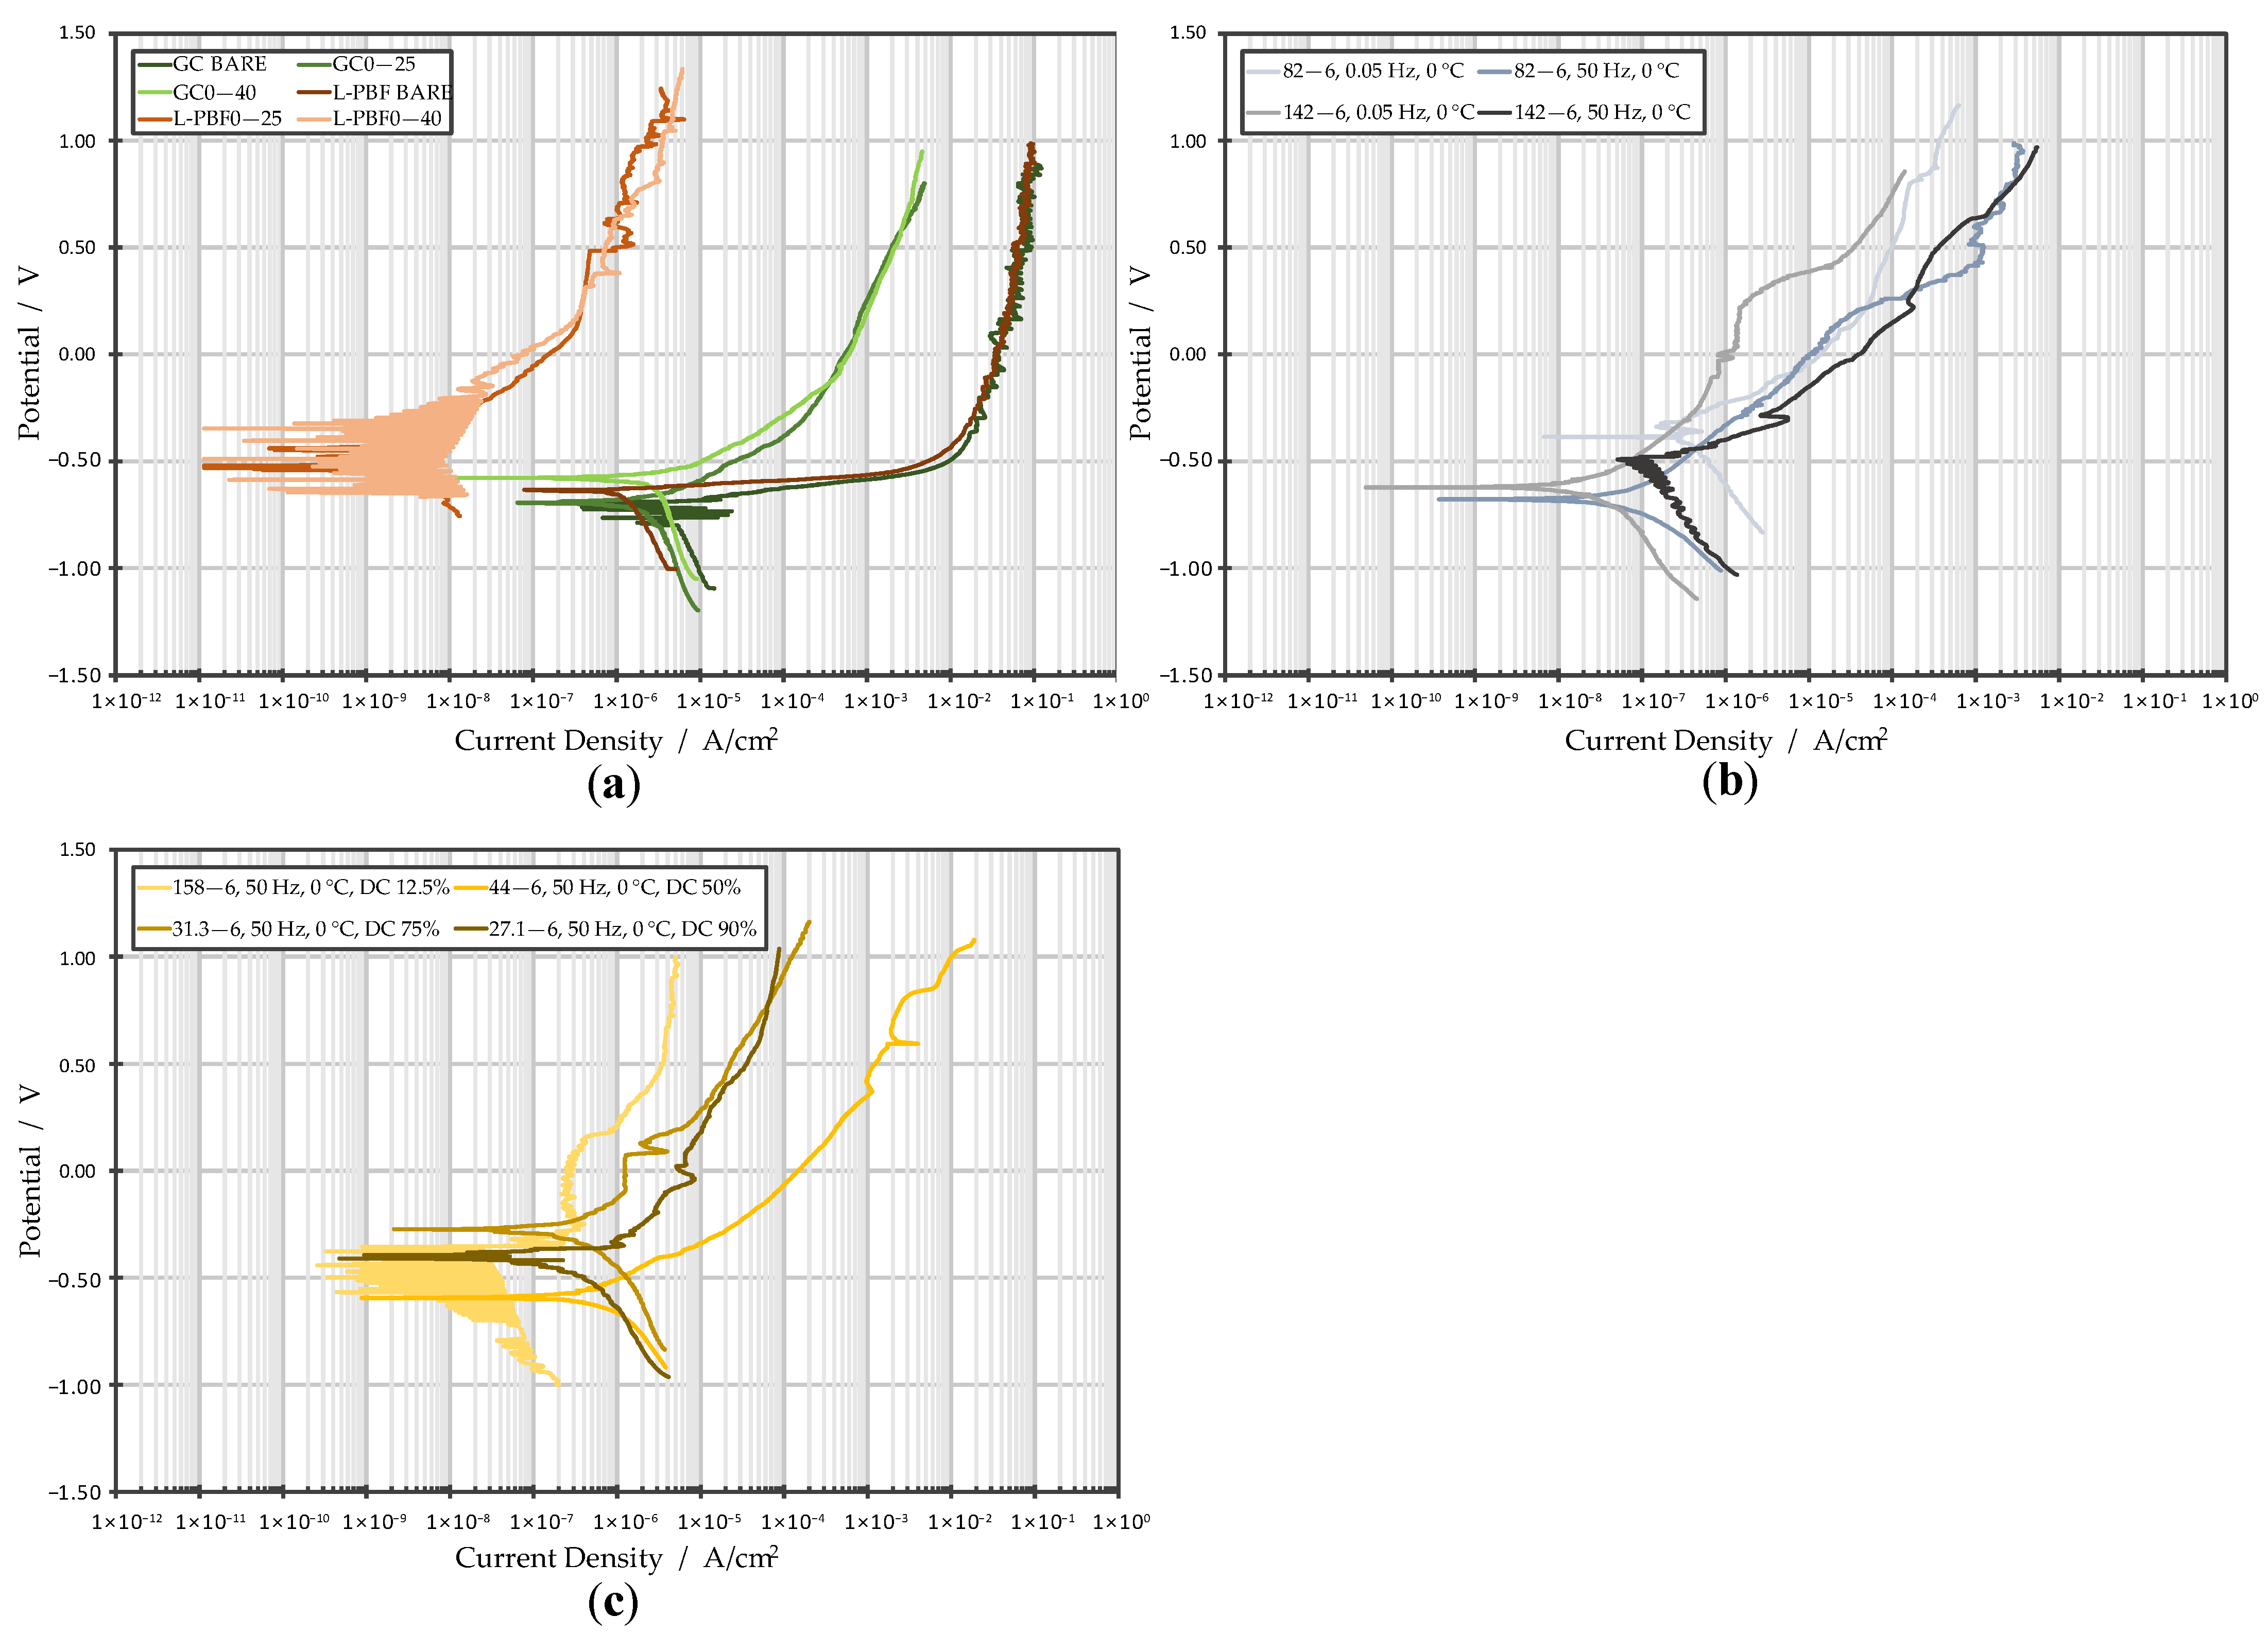
- Compared to the as-produced GC sample, the as-produced L-PBF sample presented a better corrosion resistance behavior related to the superfine network of Si particles distributed in its anodic oxide layer.
- Unlike the anodized GC samples, the anodized L-PBF samples are marked by homogeneous anodic oxide layers. The uniform distribution of very fine Si particles in the L-PBF samples avoids the formation of punctual defects, e.g., conical asperities, which are responsible for the inhomogeneous anodic oxide growth.
- Neither the DC procedures nor the PDC procedures completely resolved the critical feature of the anodized L-PBF samples, i.e., the low hardness of the oxide. Operating in DC with a high current level allows the hardness of the oxide to increase due to silicon oxidation, but it compromises the quality of the oxide in terms of defects and volumetric expansion ratio (not allowing to reach very high hardness values). On the other hand, operating in PDC, in particular, by increasing the DC% and decreasing the Ion value, the microstructural quality of the oxide increases (limited porosity, no defects) but the amount of oxidized silicon decreases. Unfortunately, none of the electrical parameter combinations applied allowed the two effects that lead to an increase in hardness to be simultaneously obtain.
- The higher corrosion resistance was obtained using the DC procedures on L-PBF samples. The PDC procedures leads in general to a slightly lower corrosion resistance, ascribed to an imperfect growth of the barrier layer; the DC% strongly affect this phenomenon, so lower DC% (which correspond to higher current values during the time-on in our procedures) allows the best results in terms of corrosion resistance to be obtained.
- Considering microstructure, hardness, and corrosion resistance, the best compromise obtained among the investigated DC and PDC procedures is represented by the “27.1—6, 50 Hz, 0 °C, DC 90%” cycle. Using this PDC procedure, it was possible to obtain an anodic oxide with the highest HV0.025 and the lowest Vox/VAl values without compromising the oxide quality and the corrosion resistance behavior.
Author Contributions
Funding
Institutional Review Board Statement
Informed Consent Statement
Data Availability Statement
Conflicts of Interest
References
- Stevenson, M.F., Jr. Anodizing. In Surface Engineering; Cotell, C.M., Sprague, J.A., Smidt, F.A., Jr., Eds.; ASM International: Novelty, OH, USA, 1994; Volume 5, ISBN 978-1-62708-170-2. [Google Scholar]
- Zhu, B.; Fedel, M.; Andersson, N.-E.; Leisner, P.; Deflorian, F.; Zanella, C. Effect of Si Content and Morphology on Corrosion Resistance of Anodized Cast Al-Si Alloys. J. Electrochem. Soc. 2017, 164, C435–C441. [Google Scholar] [CrossRef]
- Zhu, B.; Seifeddine, S.; Persson, P.O.Å.; Jarfors, A.E.W.; Leisner, P.; Zanella, C. A Study of Formation and Growth of the Anodised Surface Layer on Cast Al-Si Alloys Based on Different Analytical Techniques. Mater. Des. 2016, 101, 254–262. [Google Scholar] [CrossRef]
- Fratila-Apachitei, L.E.; Terryn, H.; Skeldon, P.; Thompson, G.E.; Duszczyk, J.; Katgerman, L. Influence of Substrate Microstructure on the Growth of Anodic Oxide Layers. Electrochim. Acta 2004, 49, 1127–1140. [Google Scholar] [CrossRef]
- Fratila-Apachitei, L.E.; Tichelaar, F.D.; Thompson, G.E.; Terryn, H.; Skeldon, P.; Duszczyk, J.; Katgerman, L. A Transmission Electron Microscopy Study of Hard Anodic Oxide Layers on AlSi(Cu) Alloys. Electrochim. Acta 2004, 49, 3169–3177. [Google Scholar] [CrossRef]
- Scampone, G.; Timelli, G. Anodizing Al–Si Foundry Alloys: A Critical Review. Adv. Eng. Mater. 2022, 24, 2101480. [Google Scholar] [CrossRef]
- Zhu, B.; Zanella, C. Hardness and Corrosion Behaviour of Anodised Al-Si Produced by Rheocasting. Mater. Des. 2019, 173, 107764. [Google Scholar] [CrossRef]
- Riddar, F.; Hogmark, S.; Rudolphi, Å.K. Comparison of Anodised Aluminium Surfaces from Four Fabrication Methods. J. Mater. Process. Technol. 2012, 212, 2272–2281. [Google Scholar] [CrossRef]
- Wu, J.; Wang, X.Q.; Wang, W.; Attallah, M.M.; Loretto, M.H. Microstructure and Strength of Selectively Laser Melted AlSi10Mg. Acta Mater. 2016, 117, 311–320. [Google Scholar] [CrossRef] [Green Version]
- Lam, L.P.; Zhang, D.Q.; Liu, Z.H.; Chua, C.K. Phase Analysis and Microstructure Characterisation of AlSi10Mg Parts Produced by Selective Laser Melting. Virtual Phys. Prototyp. 2015, 10, 207–215. [Google Scholar] [CrossRef]
- Aboulkhair, N.T.; Simonelli, M.; Parry, L.; Ashcroft, I.; Tuck, C.; Hague, R. 3D Printing of Aluminium Alloys: Additive Manufacturing of Aluminium Alloys Using Selective Laser Melting. Prog. Mater. Sci. 2019, 106, 100578. [Google Scholar] [CrossRef]
- Rubben, T.; Revilla, R.I.; De Graeve, I. Effect of Heat Treatments on the Anodizing Behavior of Additive Manufactured AlSi10Mg. J. Electrochem. Soc. 2019, 166, C42–C48. [Google Scholar] [CrossRef]
- Revilla, R.I.; Rojas, Y.; De Graeve, I. On the Impact of Si Content and Porosity Artifacts on the Anodizing Behavior of Additive Manufactured Al-Si Alloys. J. Electrochem. Soc. 2019, 166, C530–C537. [Google Scholar] [CrossRef]
- Revilla, R.I.; Terryn, H.; De Graeve, I. Role of Si in the Anodizing Behavior of Al-Si Alloys: Additive Manufactured and Cast Al-Si10-Mg. J. Electrochem. Soc. 2018, 165, C532–C541. [Google Scholar] [CrossRef]
- Revilla, R.I.; Verkens, D.; Couturiaux, G.; Malet, L.; Thijs, L.; Godet, S.; De Graeve, I. Galvanostatic Anodizing of Additive Manufactured Al-Si10-Mg Alloy. J. Electrochem. Soc. 2017, 164, C1027–C1034. [Google Scholar] [CrossRef]
- Mohitfar, S.H.; Mahdavi, S.; Etminanfar, M.; Khalil-Allafi, J. Characteristics and Tribological Behavior of the Hard Anodized 6061-T6 Al Alloy. J. Alloys Compd. 2020, 842, 155988. [Google Scholar] [CrossRef]
- Bononi, M.; Giovanardi, R. Hard Anodizing of AA2011-T3 Al-Cu-Pb-Bi Free-Cutting Alloy: Improvement of the Process Parameters. Corros. Sci. 2018, 141, 63–71. [Google Scholar] [CrossRef]
- Mukhopadhyay, A.K.; Sharma, A.K. Influence of Fe-Bearing Particles and Nature of Electrolyte on the Hard Anodizing Behaviour of AA 7075 Extrusion Products. Surf. Coat. Technol. 1997, 92, 212–220. [Google Scholar] [CrossRef]
- Caliari, D.; Timelli, G.; Salata, T.; Cavagnini, G.; Maestri, S.; Manfredini, A. Influence of Microstructure and Surface Finishing on the Hard Anodizing of Diecast Al-Si-Cu Alloys. Metall. Ital. 2019, 111, 23–31. [Google Scholar]
- Konieczny, J.; Labisz, K.; Polok-Rubiniec, M.; Włodarczyk-Fligier, A. Influence of Aluminium Alloy Anodizing and Casting Methods on Structure and Functional Properties. Arch. Metall. Mater. 2016, 61, 1337–1342. [Google Scholar] [CrossRef] [Green Version]
- Bononi, M.; Conte, M.; Giovanardi, R.; Bozza, A. Hard Anodizing of AA2099-T8 Aluminum-lithium-copper Alloy: Influence of Electric Cycle, Electrolytic Bath Composition and Temperature. Surf. Coat. Technol. 2017, 325, 627–635. [Google Scholar] [CrossRef]
- Bononi, M.; Giovanardi, R.; Bozza, A. Pulsed Current Hard Anodizing of Heat Treated Aluminum Alloys: Frequency and Current Amplitude Influence. Surf. Coat. Technol. 2016, 307, 861–870. [Google Scholar] [CrossRef]
- Bononi, M.; Giovanardi, R.; Bozza, A.; Mattioli, P. Pulsed Current Effect on Hard Anodizing Process of 2024-T3 Aluminium Alloy. Surf. Coat. Technol. 2016, 289, 110–117. [Google Scholar] [CrossRef]
- Chiang, M.-H.; Yeh, C.-C.; Lee, C.-L. Improvement in the Abrasive Wear Resistance of an Aluminum Alloy Casting for a Continuously-Variable Transmission Using Heat Treatment and Pulsed Anodizing. Wear 2020, 442–443, 203137. [Google Scholar] [CrossRef]
- Girelli, L.; Tocci, M.; Conte, M.; Giovanardi, R.; Veronesi, P.; Gelfi, M.; Pola, A. Effect of the T6 Heat Treatment on Corrosion Behavior of Additive Manufactured and Gravity Cast AlSi10Mg Alloy. Mater. Corros. 2019, 70, 1808–1816. [Google Scholar] [CrossRef]
- Bozza, A.; Giovanardi, R.; Manfredini, T.; Mattioli, P. Pulsed Current Effect on Hard Anodizing Process of 7075-T6 Aluminium Alloy. Surf. Coat. Technol. 2015, 270, 139–144. [Google Scholar] [CrossRef]
- Aperador, W.; Delgado, A.; Bautista, J. Improved Corrosion Protection Properties in Anodic Films Type Porous on 2024 T3 Aluminium Alloys Obtained by Pulse Reverse Plating. Int. J. Electrochem. Sci. 2013, 8, 9607–9617. [Google Scholar]
- Juhl, A.D. Why It Makes Sense to Upgrade to Pulse Anodizing. Met. Finish. 2009, 107, 24–27. [Google Scholar] [CrossRef]
- Qian, J.; Wang, C.; Li, D.; Guo, B.; Song, G. Formation Mechanism of Pulse Current Anodized Film on AZ91D Mg Alloy. Trans. Nonferrous Met. Soc. China 2008, 18, 19–23. [Google Scholar] [CrossRef]
- Kanagaraj, D.; Raj, V.; Vincent, S.; Iyer, S.V. Effect of Pulse Frequency on Pulse Anodising of AA 1100 Aluminium Alloy in Sulphamic Acid. Bull. Electrochem. 2001, 17, 523–526. [Google Scholar]
- Kanagaraj, D.; Raj, V.; Vincent, S.; Kumar, B.P.; Kumar, A.S.; Iyer, S.V.K. Pulse Anodizing of AA1100 Aluminium Alloy in Oxalic Acid Electrolyte. Bull. Electrochem. 2001, 17, 285–288. [Google Scholar]
- Poinern, G.E.J.; Ali, N.; Fawcett, D. Progress in Nano-Engineered Anodic Aluminum Oxide Membrane Development. Materials 2011, 4, 487–526. [Google Scholar] [CrossRef] [Green Version]
- Arurault, L. Pilling–Bedworth Ratio of Thick Anodic Aluminium Porous Films Prepared at High Voltages in H2 SO4 Based Electrolyte. Trans. IMF 2008, 86, 51–54. [Google Scholar] [CrossRef] [Green Version]
- Hamann, C.H.; Hamnett, A.; Vielstich, W. Electrochemistry; Wiley: New York, NY, USA, 2007; ISBN 978-3-527-31069-2. [Google Scholar]
- ASTM International. ASTM G3—Standard Practice for Conventions Applicable to Electrochemical Measurements in Corrosion Testing; ASTM International: West Conshohocken, PA, USA, 2014. [Google Scholar]
- ASTM International. ASTM G5—Standard Reference Test Method for Making Potentiodynamic Anodic Polarization Measurements; ASTM International: West Conshohocken, PA, USA, 2014. [Google Scholar]
- Runge, J.M. The Metallurgy of Anodizing Aluminum; Springer International Publishing: Cham, Switzerland, 2018; ISBN 978-3-319-72175-0. [Google Scholar]
- Yang, Y.; Chen, Y.; Zhang, J.; Gu, X.; Qin, P.; Dai, N.; Li, X.; Kruth, J.-P.; Zhang, L.-C. Improved Corrosion Behavior of Ultrafine-Grained Eutectic Al-12Si Alloy Produced by Selective Laser Melting. Mater. Des. 2018, 146, 239–248. [Google Scholar] [CrossRef]
- Leon, A.; Shirizly, A.; Aghion, E. Corrosion Behavior of AlSi10Mg Alloy Produced by Additive Manufacturing (AM) vs. Its Counterpart Gravity Cast Alloy. Metals 2016, 6, 148. [Google Scholar] [CrossRef] [Green Version]
- Wang, X.; Nie, M.; Wang, C.T.; Wang, S.C.; Gao, N. Microhardness and Corrosion Properties of Hypoeutectic Al–7Si Alloy Processed by High-Pressure Torsion. Mater. Des. 2015, 83, 193–202. [Google Scholar] [CrossRef]
- Li, J.; Wei, H.; Zhao, K.; Wang, M.; Chen, D.; Chen, M. Effect of Anodizing Temperature and Organic Acid Addition on the Structure and Corrosion Resistance of Anodic Aluminum Oxide Films. Thin Solid Film. 2020, 713, 138359. [Google Scholar] [CrossRef]
- He, C.; Lou, D.; Wang, J.; Cai, Q. Corrosion Protection and Formation Mechanism of Anodic Coating on SiCp/Al Metal Matrix Composite. Thin Solid Film. 2011, 519, 4759–4764. [Google Scholar] [CrossRef]
- Zhang, Y.; Shen, X. Facile Fabrication of Robust Superhydrophobic Coating for Enhanced Corrosion Protection on AZ91 Magnesium Alloy by Electroless Ni-B/GO Plating. Surf. Coat. Technol. 2023, 455, 129213. [Google Scholar] [CrossRef]
- Qin, J.; Shi, X.; Li, H.; Zhao, R.; Li, G.; Zhang, S.; Ding, L.; Cui, X.; Zhao, Y.; Zhang, R. Performance and Failure Process of Green Recycling Solutions for Preparing High Degradation Resistance Coating on Biomedical Magnesium Alloys. Green Chem. 2022, 24, 8113–8130. [Google Scholar] [CrossRef]
- Hakimizad, A.; Raeissi, K.; Ashrafizadeh, F. A Comparative Study of Corrosion Performance of Sealed Anodized Layers of Conventionally Colored and Interference-Colored Aluminium. Surf. Coat. Technol. 2012, 206, 4628–4633. [Google Scholar] [CrossRef]
- Brevnov, D.A.; Rama Rao, G.V.; López, G.P.; Atanassov, P.B. Dynamics and Temperature Dependence of Etching Processes of Porous and Barrier Aluminum Oxide Layers. Electrochim. Acta 2004, 49, 2487–2494. [Google Scholar] [CrossRef]


| Sample | Solution Conditions | Electrical Parameters | |||||||
|---|---|---|---|---|---|---|---|---|---|
| H2SO4 | Al3+ | T | Charge | Constant Current Density | Initial Ramp Inclination | Initial Ramp Duration | Constant Value Duration | Total Duration | |
| (g/L) | (g/L) | (°C) | (C) | (mA/cm2) | (mA/cm2s) | (s) | (s) | (s) | |
| GC0—25 | 190 | 8 | 0 | 100 | 25 | 0.1 | 250 | 3875 | 4125 |
| GC0—40 | 190 | 8 | 0 | 100 | 40 | 0.1 | 400 | 2300 | 2700 |
| L-PBF0—25 | 190 | 8 | 0 | 100 | 25 | 0.1 | 250 | 3875 | 4125 |
| L-PBF0—40 | 190 | 8 | 0 | 100 | 40 | 0.1 | 400 | 2300 | 2700 |
| Sample | Solution Conditions | Electrical Parameters | ||||||||||
|---|---|---|---|---|---|---|---|---|---|---|---|---|
| H2SO4 | Al3+ | T | Charge | Average Current Density | Frequency | DC% | Ion | ton | Ioff | toff | Total Duration | |
| (g/L) | (g/L) | (°C) | (C) | (mA/cm2) | (Hz) | (%) | (mA/cm2) | (s) | (mA/cm2) | (s) | (s) | |
| 82—6, 0.05 Hz, 0 °C | 190 | 8 | 0 | 100 | 25 | 0.05 | 25 | 82 | 5 | 6 | 15 | 4000 |
| 82—6, 0.05 Hz, 7 °C | 190 | 8 | 7 | 100 | 25 | 0.05 | 25 | 82 | 5 | 6 | 15 | 4000 |
| 82—6, 50 Hz, 0 °C | 190 | 8 | 0 | 100 | 25 | 50 | 25 | 82 | 0.005 | 6 | 0.015 | 4000 |
| 82—6, 50 Hz, 7 °C | 190 | 8 | 7 | 100 | 25 | 50 | 25 | 82 | 0.005 | 6 | 0.015 | 4000 |
| 142—6, 0.05 Hz, 0 °C | 190 | 8 | 0 | 100 | 40 | 0.05 | 25 | 142 | 5 | 6 | 15 | 2500 |
| 142—6, 0.05 Hz, 7 °C | 190 | 8 | 7 | 100 | 40 | 0.05 | 25 | 142 | 5 | 6 | 15 | 2500 |
| 142—6, 50 Hz, 0 °C | 190 | 8 | 0 | 100 | 40 | 50 | 25 | 142 | 0.005 | 6 | 0.015 | 2500 |
| 142—6, 50 Hz, 7 °C | 190 | 8 | 7 | 100 | 40 | 50 | 25 | 142 | 0.005 | 6 | 0.015 | 2500 |
| 158—6, 50 Hz, 0 °C, DC 12.5% | 190 | 8 | 0 | 100 | 25 | 50 | 12.5 | 158 | 0.0025 | 6 | 0.0175 | 4000 |
| 44—6, 50 Hz, 0 °C, DC 50% | 190 | 8 | 0 | 100 | 25 | 50 | 50 | 44 | 0.01 | 6 | 0.01 | 4000 |
| 31.3—6, 50 Hz, 0 °C, DC 75% | 190 | 8 | 0 | 100 | 25 | 50 | 75 | 31.3 | 0.015 | 6 | 0.005 | 4000 |
| 27.1—6, 50 Hz, 0 °C, DC 90% | 190 | 8 | 0 | 100 | 25 | 50 | 90 | 27.1 | 0.018 | 6 | 0.002 | 4000 |
| Sample | HV0.025 | Oxide Quality Rating | L* | Oxide Thickness | Vox/VAl | η |
|---|---|---|---|---|---|---|
| (—) | (—) | (—) | (µm) | (—) | (%) | |
| GC0—25 | 387.68 ± 67.62 | 3.5 | 39.71 ± 0.15 | 58.04 ± 30.74 | 1.87 ± 0.05 | 100 |
| GC0—40 | 378.26 ± 35.08 | 4.0 | 39.52 ± 0.09 | 64.67 ± 21.52 | 2.22 ± 0.50 | 100 |
| L-PBF0—25 | 264.20 ± 24.29 | 8.0 | 39.49 ± 0.15 | 54.43 ± 13.55 | 2.19 ± 0.17 | 83 |
| L-PBF0—40 | 267.00 ± 44.69 | 7.5 | 40.48 ± 0.06 | 56.04 ± 7.51 | 2.12 ± 0.17 | 81 |
| 82—6, 0.05 Hz, 0 °C | 230.31 ± 24.46 | 7.0 | 47.52 ± 0.09 | 61.67 ± 16.03 | 2.13 ± 0.44 | 79 |
| 82—6, 0.05 Hz, 7 °C | 246.95 ± 63.79 | 7.5 | 44.27 ± 0.16 | 52.27 ± 13.06 | 1.63 ± 0.33 | 85 |
| 82—6, 50 Hz, 0 °C | 261.01 ± 50.18 | 5.0 | 37.01 ± 0.19 | 45.75 ± 13.63 | 2.24 ± 0.75 | 50 |
| 82—6, 50 Hz, 7 °C | 238.45 ± 67.25 | 5.5 | 35.68 ± 0.45 | 51.58 ± 16.48 | 1.96 ± 0.49 | 73 |
| 142—6, 0.05 Hz, 0 °C | 191.72 ± 64.96 | 6.5 | 47.13 ± 0.11 | 62.48 ± 11.51 | 2.14 ± 0.03 | 71 |
| 142—6, 0.05 Hz, 7 °C | 198.00 ± 63.16 | 7.0 | 44.65 ± 0.09 | 55.14 ± 15.27 | 1.85 ± 0.10 | 83 |
| 142—6, 50 Hz, 0 °C | 238.93 ± 68.58 | 6.0 | 37.80 ± 0.01 | 56.77 ± 18.92 | 2.24 ± 0.34 | 51 |
| 142—6, 50 Hz, 7 °C | 207.40 ± 66.45 | 6.0 | 36.83 ± 0.27 | 51.25 ± 17.68 | 2.05 ± 0.09 | 68 |
| 158—6, 50 Hz, 0 °C, DC 12.5% | 225.91 ± 58.32 | 5.5 | 35.41 ± 0.26 | 54.95 ± 24.92 | 2.26 ± 0.83 | 57 |
| 44—6, 50 Hz, 0 °C, DC 50% | 255.99 ± 41.55 | 6.0 | 37.65 ± 0.26 | 49.95 ± 14.97 | 2.01 ± 0.22 | 59 |
| 31.3—6, 50 Hz, 0 °C, DC 75% | 267.20 ± 46.59 | 7.0 | 36.42 ± 0.28 | 55.15 ± 12.15 | 2.33 ± 0.60 | 68 |
| 27.1—6, 50 Hz, 0 °C, DC 90% | 279.70 ± 88.86 | 7.5 | 35.72 ± 0.22 | 49.39 ± 14.49 | 1.55 ± 0.28 | 71 |
| Sample | Ecorr | icorr |
|---|---|---|
| (V) vs. SSCE | (A/cm2) | |
| GC BARE | −0.691 | 1.08 × 10⁻⁵ |
| GC0—25 | −0.693 | 8.41 × 10⁻⁷ |
| GC0—40 | −0.581 | 1.20 × 10⁻⁶ |
| L-PBF BARE | −0.633 | 2.76 × 10⁻⁶ |
| L-PBF0—25 | −0.535 | 1.02 × 10⁻⁹ |
| L-PBF0—40 | −0.492 | 8.01 × 10⁻⁹ |
| 82—6, 0.05 Hz, 0 °C | −0.336 | 2.00 × 10⁻⁷ |
| 82—6, 50 Hz, 0 °C | −0.686 | 3.08 × 10⁻⁸ |
| 142—6, 0.05 Hz, 0 °C | −0.619 | 9.45 × 10⁻⁹ |
| 142—6, 50 Hz, 0 °C | −0.497 | 1.29 × 10⁻⁷ |
| 158—6, 50 Hz, 0 °C, DC 12.5% | −0.365 | 2.49 × 10⁻⁸ |
| 44—6, 50 Hz, 0 °C, DC 50% | −0.591 | 2.64 × 10⁻⁷ |
| 31.3—6, 50 Hz, 0 °C, DC 75% | −0.283 | 8.94 × 10⁻⁸ |
| 27.1—6, 50 Hz, 0 °C, DC 90% | −0.388 | 9.59 × 10⁻⁸ |
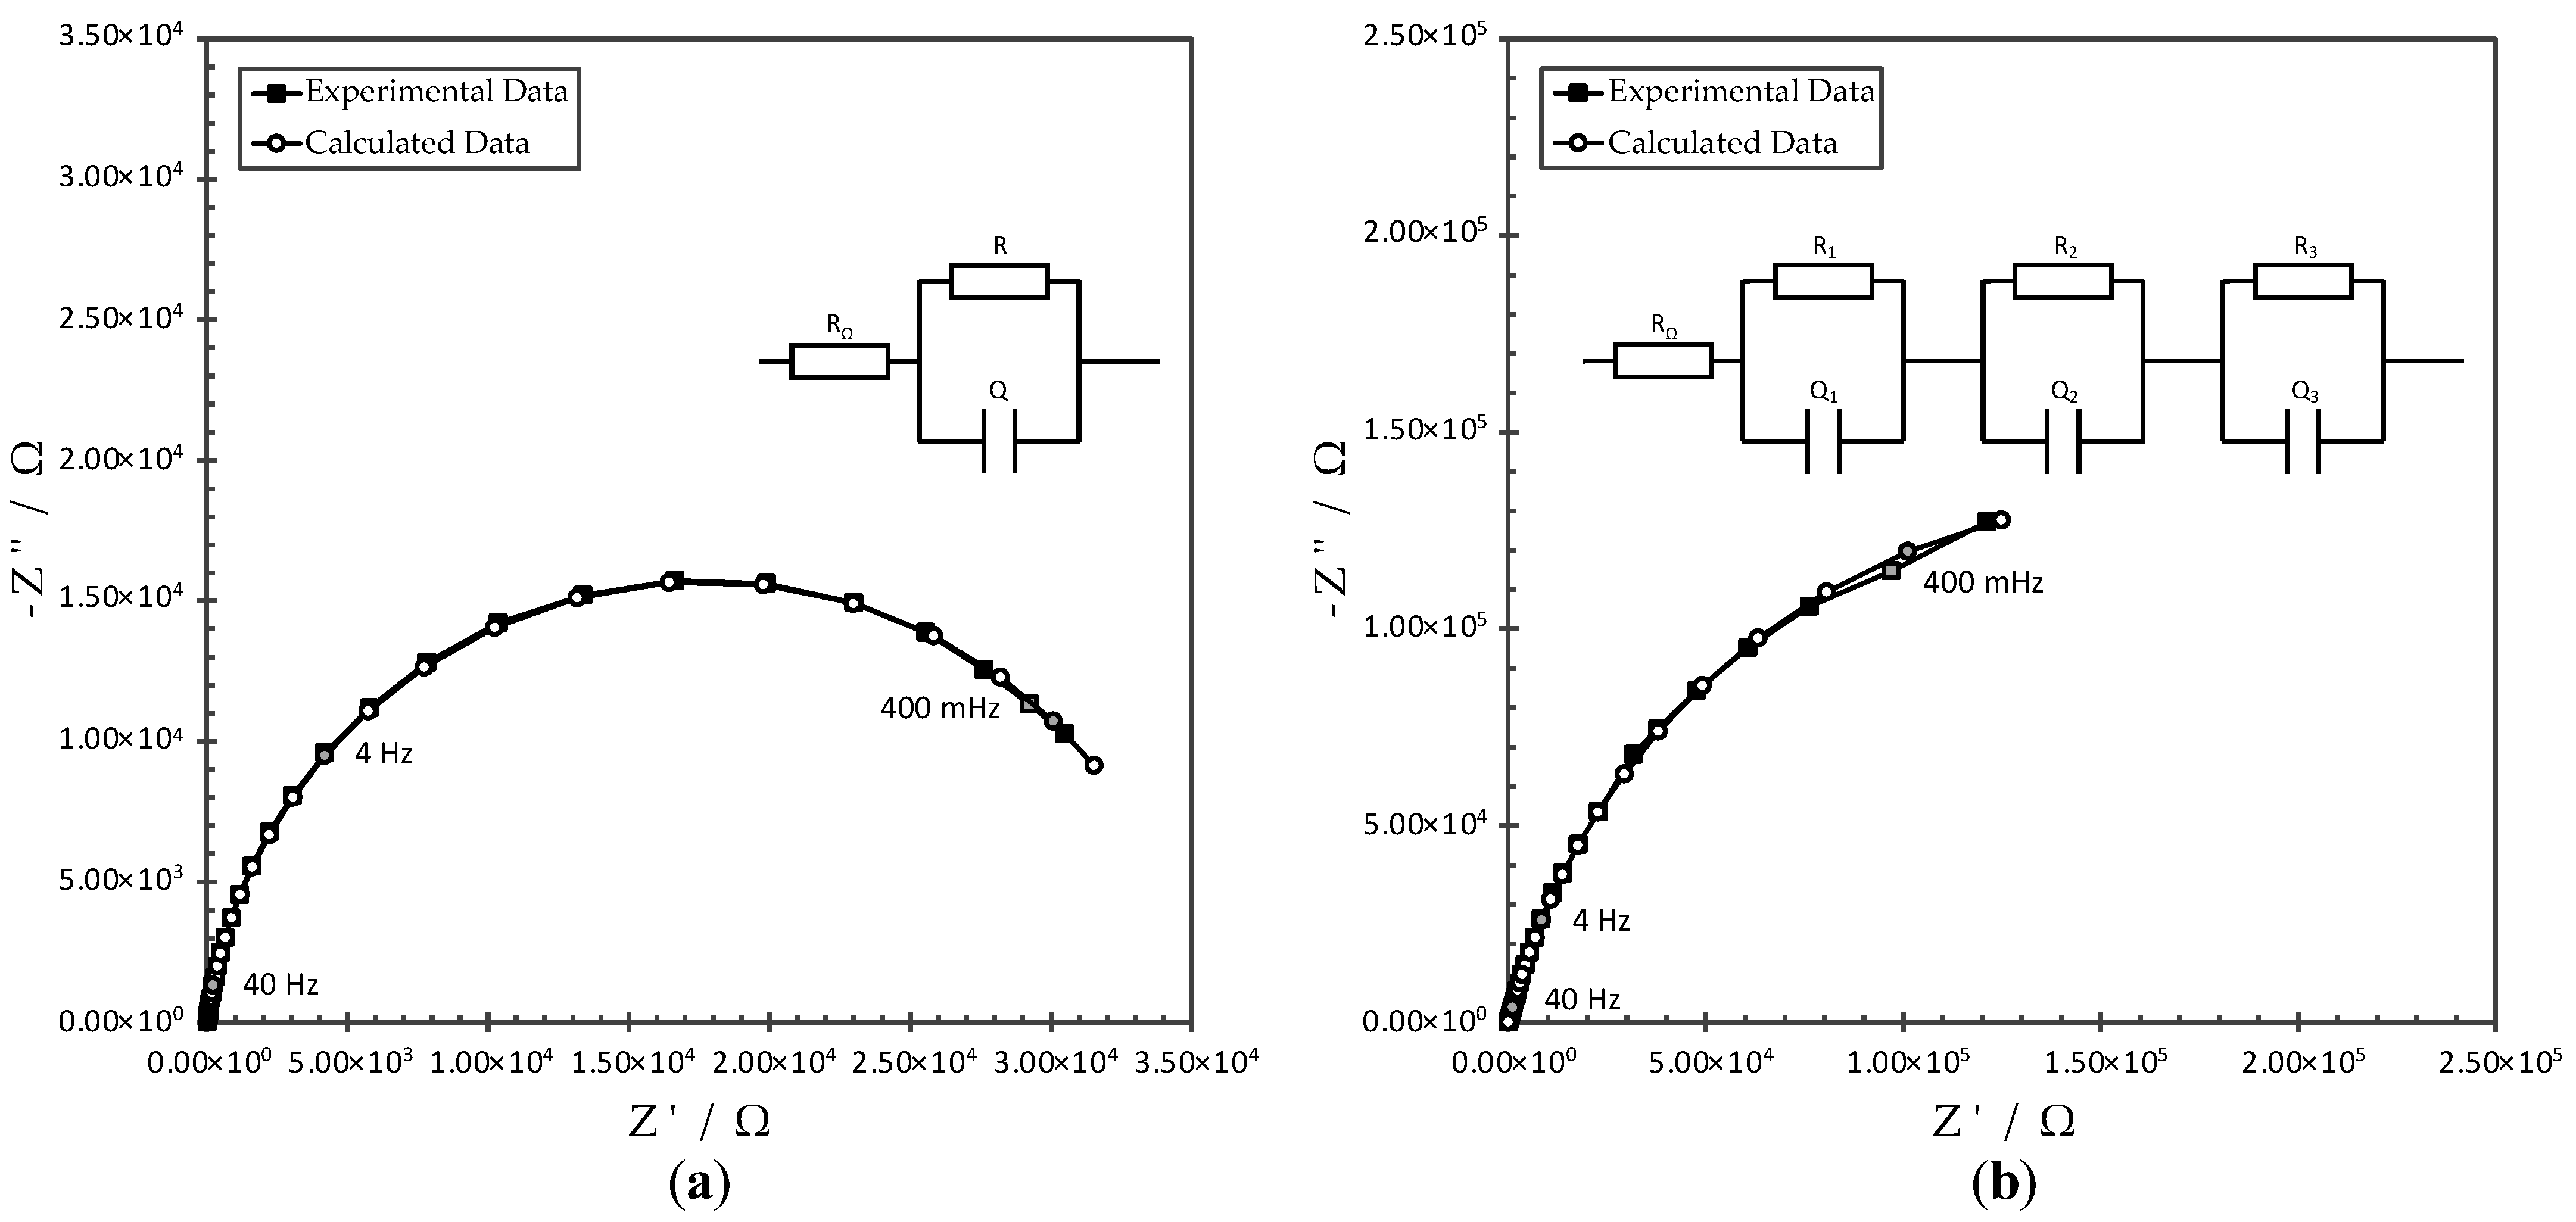
| Sample | RΩ | Q—Y0 | Q—n | R |
|---|---|---|---|---|
| (ohm) | (S · sec n) | (—) | (ohm) | |
| L-PBF BARE | 2.59 × 101 | 4.54 × 10⁻⁶ | 9.24 × 10⁻¹ | 3.54 × 10⁴ |
| Sample | RΩ | Q1—Y0 | Q1—n | R1 | Q2—Y0 | Q2—n | R2 | Q3—Y0 | Q3—n | R3 |
|---|---|---|---|---|---|---|---|---|---|---|
| (ohm) | (S · sec n) | (—) | (ohm) | (S · sec n) | (—) | (ohm) | (S · sec n) | (—) | (ohm) | |
| L-PBF0—25 | 5.01 × 10⁻² | 5.37 × 10⁻⁷ | 8.25 × 10⁻¹ | 2.74 × 10³ | 6.79 × 10⁻⁹ | 1.00 × 100 | 5.44 × 101 | 1.28 × 10⁻⁶ | 7.49 × 10⁻¹ | 7.06 × 10⁵ |
| L-PBF0—40 | 2.40 × 10⁻² | 5.53 × 10⁻⁹ | 1.00 × 100 | 4.70 × 101 | 9.02 × 10⁻⁷ | 8.32 × 10⁻¹ | 1.24 × 10³ | 1.60 × 10⁻⁶ | 7.62 × 10⁻¹ | 1.65 × 10⁷ |
| 82—6, 0.05 Hz, 0 °C | 2.75 × 101 | 3.05 × 10⁻⁵ | 6.42 × 10⁻¹ | 9.30 × 10² | 4.68 × 10⁻⁵ | 5.45 × 10⁻¹ | 1.32 × 10² | 3.15 × 10⁻⁶ | 9.18 × 10⁻¹ | 2.65 × 10⁵ |
| 82—6, 50 Hz, 0 °C | 2.81 × 101 | 2.07 × 10⁻⁶ | 8.28 × 10⁻¹ | 2.63 × 10⁴ | 8.39 × 10⁻⁷ | 8.79 × 10⁻¹ | 3.21 × 10³ | 2.90 × 10⁻⁶ | 7.80 × 10⁻¹ | 9.92 × 10⁶ |
| 142—6, 0.05 Hz, 0 °C | 2.47 × 101 | 3.28 × 10⁻⁷ | 1.00 × 100 | 1.86 × 10² | 1.92 × 10⁻⁶ | 8.09 × 10⁻¹ | 1.78 × 10³ | 1.77 × 10⁻⁶ | 7.42 × 10⁻¹ | 4.33 × 10⁷ |
| 142—6, 50 Hz, 0 °C | 3.19 × 101 | 1.87 × 10⁻⁵ | 6.89 × 10⁻¹ | 1.82 × 10³ | 2.28 × 10⁻⁶ | 8.17 × 10⁻¹ | 4.49 × 10² | 3.29 × 10⁻⁶ | 9.06 × 10⁻¹ | 8.47 × 10⁵ |
| 158—6, 50 Hz, 0 °C, DC 12.5% | 2.89 × 101 | 3.07 × 10⁻⁶ | 7.34 × 10⁻¹ | 3.32 × 10³ | 2.39 × 10⁻¹⁵ | 4.04 × 10⁻¹ | 8.58 × 10⁻¹ | 3.61 × 10⁻⁶ | 8.96 × 10⁻¹ | 3.27 × 10⁷ |
| 44—6, 50 Hz, 0 °C, DC 50% | 2.17 × 100 | 1.63 × 10⁻⁸ | 9.30 × 10⁻¹ | 3.61 × 101 | 8.16 × 10⁻⁶ | 7.27 × 10⁻¹ | 4.95 × 10⁴ | 2.48 × 10⁻⁶ | 1.00 × 100 | 1.42 × 10⁵ |
| 31.3—6, 50 Hz, 0 °C, DC 75% | 1.46 × 10⁻² | 3.06 × 10⁻⁵ | 7.36 × 10⁻¹ | 2.43 × 10² | 2.42 × 10⁻⁸ | 9.20 × 10⁻¹ | 4.36 × 101 | 2.29 × 10⁻⁶ | 8.55 × 10⁻¹ | 3.36 × 10⁵ |
| 27.1—6, 50 Hz, 0 °C, DC 90% | 9.90 × 10⁻¹ | 9.50 × 10⁻²⁰ | 6.12 × 10⁻¹ | 3.78 × 101 | 2.30 × 10⁻⁵ | 6.42 × 10⁻¹ | 1.15 × 10³ | 1.75 × 10⁻⁶ | 9.07 × 10⁻¹ | 3.35 × 10⁵ |
Disclaimer/Publisher’s Note: The statements, opinions and data contained in all publications are solely those of the individual author(s) and contributor(s) and not of MDPI and/or the editor(s). MDPI and/or the editor(s) disclaim responsibility for any injury to people or property resulting from any ideas, methods, instructions or products referred to in the content. |
© 2023 by the authors. Licensee MDPI, Basel, Switzerland. This article is an open access article distributed under the terms and conditions of the Creative Commons Attribution (CC BY) license (https://creativecommons.org/licenses/by/4.0/).
Share and Cite
Dallari, E.; Bononi, M.; Pola, A.; Tocci, M.; Veronesi, P.; Giovanardi, R. Pulsed Current Effect on the Hard Anodizing of an AlSi10Mg Aluminum Alloy Obtained via Additive Manufacturing. Surfaces 2023, 6, 97-113. https://doi.org/10.3390/surfaces6010008
Dallari E, Bononi M, Pola A, Tocci M, Veronesi P, Giovanardi R. Pulsed Current Effect on the Hard Anodizing of an AlSi10Mg Aluminum Alloy Obtained via Additive Manufacturing. Surfaces. 2023; 6(1):97-113. https://doi.org/10.3390/surfaces6010008
Chicago/Turabian StyleDallari, Elisa, Massimiliano Bononi, Annalisa Pola, Marialaura Tocci, Paolo Veronesi, and Roberto Giovanardi. 2023. "Pulsed Current Effect on the Hard Anodizing of an AlSi10Mg Aluminum Alloy Obtained via Additive Manufacturing" Surfaces 6, no. 1: 97-113. https://doi.org/10.3390/surfaces6010008