1. Introduction
The impact of crimes committed against cultural property has been captured in the 1954 Hague Convention for the Protection of Cultural Property in the Event of Armed Conflict [
1]. Since then, several legislative mechanisms have been introduced, such as the UNESCO Convention on the Means of Prohibiting and Preventing the Illicit Import, Export and Transfer of Ownership of Cultural Property (1970) [
2]; the UN Convention against Transnational Organised Crime (2000) [
3]; the UNESCO Convention on the Protection of the Underwater Cultural Heritage (2001) [
4]; and the Council of Europe Convention on Offences relating to Cultural Property (2017) [
5].
However, regardless of this solid international framework, cultural-property crimes continue to harm cultural heritage on a global scale, and support organized crime groups through their unlawful revenues [
6,
7,
8]. Political and security failures in countries rich in archaeological and heritage sites offer perfect conditions for these illicit actions. Additionally, the remote locations, and modern communication technologies further facilitate the illegal business, making it practically borderless [
9]. In addition, the COVID-19 pandemic contributed to exacerbate the already fragile situation.
The Eastern Mediterranean and Middle East (EMME) region is extremely rich in archaeological heritage. Cyprus specifically is home to over 12,000 years of human history, and artefacts from all the ancient civilisations of the region can be found on the island. Yet it is also particularly affected by transnational crimes associated with this, such as the trafficking of cultural goods.
Cyprus has experienced extensive archaeological looting, both in the area where the Republic of Cyprus applies its authority and in the occupied area which has been under Turkish occupation since 1974. Despite the efforts of local authorities and the growing interest in protecting cultural heritage from plunder, the international community is struggling to find effective measures to prevent this type of crime. In Cyprus, local authorities have limited access to new tools, regardless of the extraordinary high-tech transformation happening in many sectors of the society, in terms of new equipment, algorithms and expertise.
Unmanned aerial systems (UAS) represent reliable means of allowing archaeologists to perform fast and large-scale data collection for monitoring purposes. These systems are nowadays largely used in archaeological-site reconnaissance, including looting scenarios [
10,
11], coupled with photogrammetric reconstruction and change detection. The latter has been successfully applied in many domains, including (but not limited to), civil engineering [
12], remote sensing [
13], video surveillance [
14], autonomous driving systems [
15], medical applications [
16], cultural heritage [
17] and risk-and-disaster management [
18].
This paper focuses on the application of change detection algorithms using high-resolution imagery produced through photogrammetric techniques for the multitemporal monitoring of looted archaeological sites.
Research benefited from the the collaboration between the Cyprus Institute, the Department of Antiquities of Cyprus, and the Cyprus Police, which was formalized through a Memorandum of Understanding that is presently in effect. The primary objective of this partnership concerns the use and application of digital technologies (both aerial and terrestrial) for safeguarding archaeological sites and monuments that have been impacted by looting activities.
The paper’s case study concerns an undisclosed site that has suffered from looting attempts. Due to the sensitivity of the topic, its location and name are omitted in this paper’s discussion. Hereinafter, the authors will refer to it as: Arch_site_01.
2. State of the Art
Illegal archaeological excavations mainly affect sites that are (i) difficult to patrol due to geographical remoteness, (ii) that have been deemed unsafe, due to political instability in the country where are they located, or (iii) are simply too large for surveillance, given available resources.
Space-born sensors are frequently used to systematically document illegal archaeological excavations, thanks to their large footprint, relatively fast revisiting time, and resolution.
Satellite imagery, and especially very-high-resolution (VHR) datasets, represent an effective tool for assessing the magnitude of damage, and can be used to validate against ground-based walk-over surveys, and reveal destructive excavations, earthmoving, and construction [
19]. This particularly applies in locations outside of cities and in remote sites where an efficient patrol is usually difficult or where archaeological areas are not fenced off and protected.
Contreras analyzed the looted sites in Peru’s Viru’ Valley using the open-source software Google Earth. Although named as a powerful tool, problems related to coverage, suitable ground resolution and surface visibility, were observed [
20].
Having been granted access to a large archive of satellite imagery, Casana [
21] analyzed and assessed the conservation conditions of archaeological sites in Syria. This study highlighted the immense capabilities of identifying illegal archaeological excavations and destruction. The damage was studied in near real-time for many sites spread throughout the region.
The studies described by Tapete et al. [
22,
23] focus on the analysis and monitoring of cultural landscapes, using COSMO-SkyMed data. The COnstellation of small Satellites for Mediterranean basin Observation (COSMO-SkyMed) offers very high ground resolution, and an average revisit time per site area of one day, making it extremely useful for archaeological-site monitoring.
Tapete and Cigna [
24] assessed the potential of the synthetic-aperture-radar (SAR) sensor to monitor looted sites, mainly because of the spatial resolution of SAR images. The authors primarily used the new TerraSAR-X beam mode, Staring Spotlight (ST) radar-backscattering-change detection.
These studies show how satellite imagery can pinpoint looting activities and help in linking the ongoing looting to broader matters, such as social, environmental, economic, or political changes [
25].
Agapiou [
26] investigated the potentials of open-access satellite images for detecting large-scale looted areas over the archaeological site of Apamea in Syria, during the period January 2011 to April 2012. A multi-temporal analysis of multispectral Landsat 7 ETM+ images was performed, analyzing pseudo-color temporal composites, multi-temporal spectral profiles, correlation between the spectral bands, and the application of principal component analysis (PCA).
The increasing accessibility to VHR images from optical satellites has also boosted the scientific community’s interest in exploring new image-processing methods for the identification and assessment of ground anomalies related to archaeological looting. Researchers active in the remote-sensing domain are therefore developing new automated procedures to quantify looting. In this context, remote sensing has been used to answer several questions regarding (i) the identification of illegal archaeological excavations and their location; (ii) the evidence concerning looting incidents; and especially (iii) the monitoring and assessing of the extension of the damage and its frequency.
The current extraordinary availability of remote-sensing data poses, however, severe limitations in terms of processing and interpretation capabilities, due to the large volume and continuous expansion.
Lauricella et al. [
27] present a semi-automatic detection method for reliable and accurate multitemporal site monitoring. The authors propose a process customized to deal with site monitoring which is largely dependent upon lengthy and error-prone manual evaluations of satellite images.
Bowen [
28] used change-detection algorithms (changes in a region of interest occurring over time) to identify illegal looting pits. The main aim of the study was to detect new illegal excavations and not previous ones, or new typologies of other classes of ground anomalies. The authors proposed a novel categorization scheme, which was tested on a large satellite image of the pyramid area in Egypt, where looting of tombs was ongoing.
Lasaponara and Masini [
29] propose an automated methodology they refer to as a methodology for Archaeological Looting Feature Extraction Approach (ALFEA). The ALFEA workflow is structured in three stages: image improvement using spatial autocorrelation, unsupervised classification, and segmentation. Case studies were located in Syria and in Peru, using a set of Google Earth images.
Danese et al. [
30] investigated the use of LiDAR data to characterize the looting phenomenon in archaeology, exploiting a multi-scalar approach based on the geomorphon model [
31]. The latter is commonly used in geomorphological research for the automatic classification of land features.
While the multidisciplinary research community composed of surveyors, archaeologists and remote-sensing experts acknowledged the benefits of the identification of illegal archaeological excavations through satellite imagery, the high cost of high-resolution data, usually acquired through commercial sensors, essentially prevents their extensive use by the research community.
Equally, unmanned aerial systems (UASs) and image-based modelling techniques nowadays represent viable and reliable tools for producing high-resolution aerial imagery (digital elevation models and orthophotos) with resolution in millimeters, allowing the identification of small features such as pits and holes caused by illegal excavations. Although not comparable with the extension of satellite-image footprints, today digital photogrammetry is considered a feasible and flexible solution for archaeological surveys, and can deliver range-based comparable data when specific parameters are met [
32].
3. Material and Methods
The area where Arch_site_01 is located shows a long history of occupation. It features numerous burial sites, which have preserved a rich diversity of archaeological material spanning the Late Bronze Age through to the early Christian periods.
The richness of its archaeological remains, the remote location of the site, and the difficulties in patrolling the area on a regular basis contributed to the spread of illegal archaeological excavations and destruction.
During the COVID-19 pandemic, the site integrity was increasingly compromised, due to the reduction of regular surveillance and the reallocation of law enforcement agencies’ human resources. Today, the site is not fenced off, and it is used for agricultural purposes, hence being ploughed regularly.
Three aerial-survey campaigns were realized on January 2020, May 2020, and October 2022, to monitor the progression of the illegal archaeological excavations.
The digital methodology proposed in this study consists of four steps: (i) an aerial photogrammetric survey, (ii) orthophoto and digital-elevation-model production, (iii) unsupervised, multitemporal change detection, (iv) relief visualization (RV), (v) geographic-information-system (GIS) mapping, and (vi) data interpretation (
Figure 1,
Table 1).
Recently excavated pits are clearly visible, due to the RGB color variations between the surface and the recently excavated soil.
3.1. Image-Based-Modelling Data Collection and Data Production
In order to create high-resolution orthoimages and digital-elevation models (DEMs) of the area of interest, an aerial image-based survey was performed, using a custom-made UAV platform equipped with a state-of-the art RGB sensor. The surveyed plot has an extension of 36.400 m2, and its terrain is flat.
The UAV flight was designed in order to reach a forward- and lateral-image overlap of ~80%, and an average ground sample distance (GSD) of ~1.5 cm.
The aerial survey was coupled with a topographic network exploiting a Differential Global Positioning System (DGPS). All the generated models were referenced in the Cyprus Geodetic Reference System 93 (CGRS93).
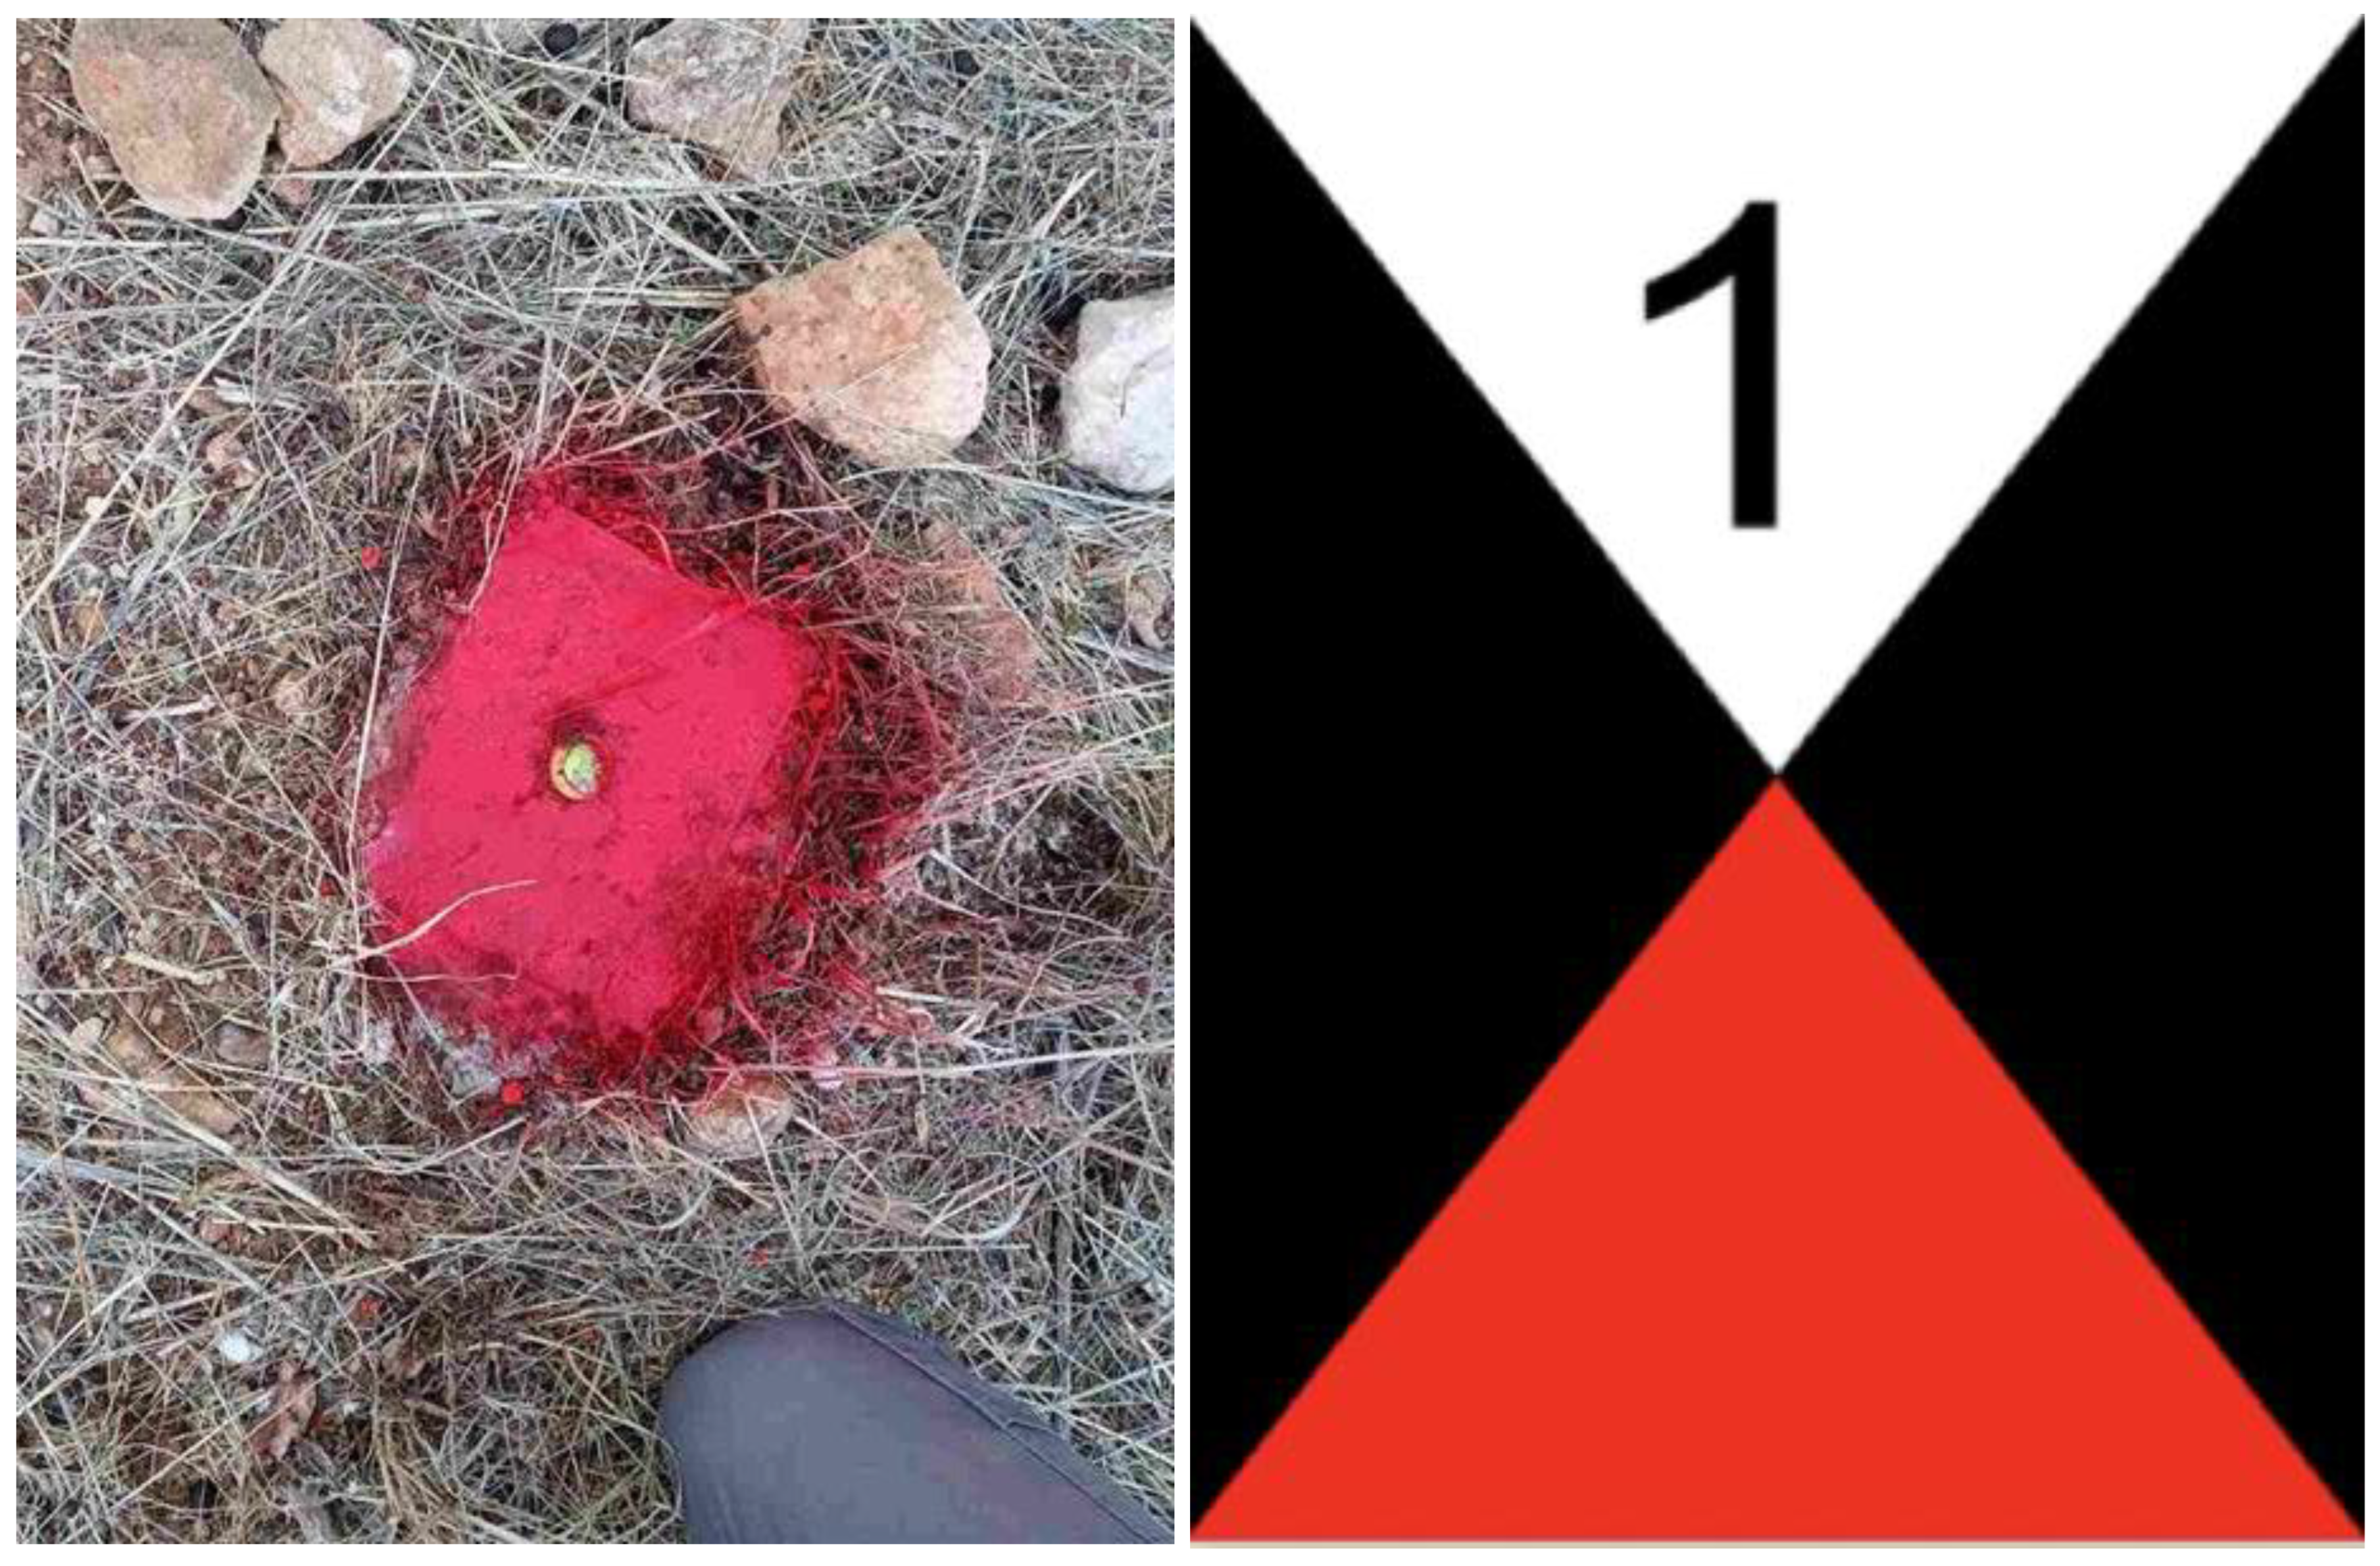
For this purpose, two different types of ground control points (GCPs), fixed and temporary, were made on the ground:
- -
Four concrete blocks featuring a painted metal plate installed before the first data-collection campaign, in January 2020 (
Figure 2, left);
- -
Several A3 laminated targets, surveyed during each of the three seasons to avoid any geometric deformation which might occur during the photogrammetric process (
Figure 2, right).
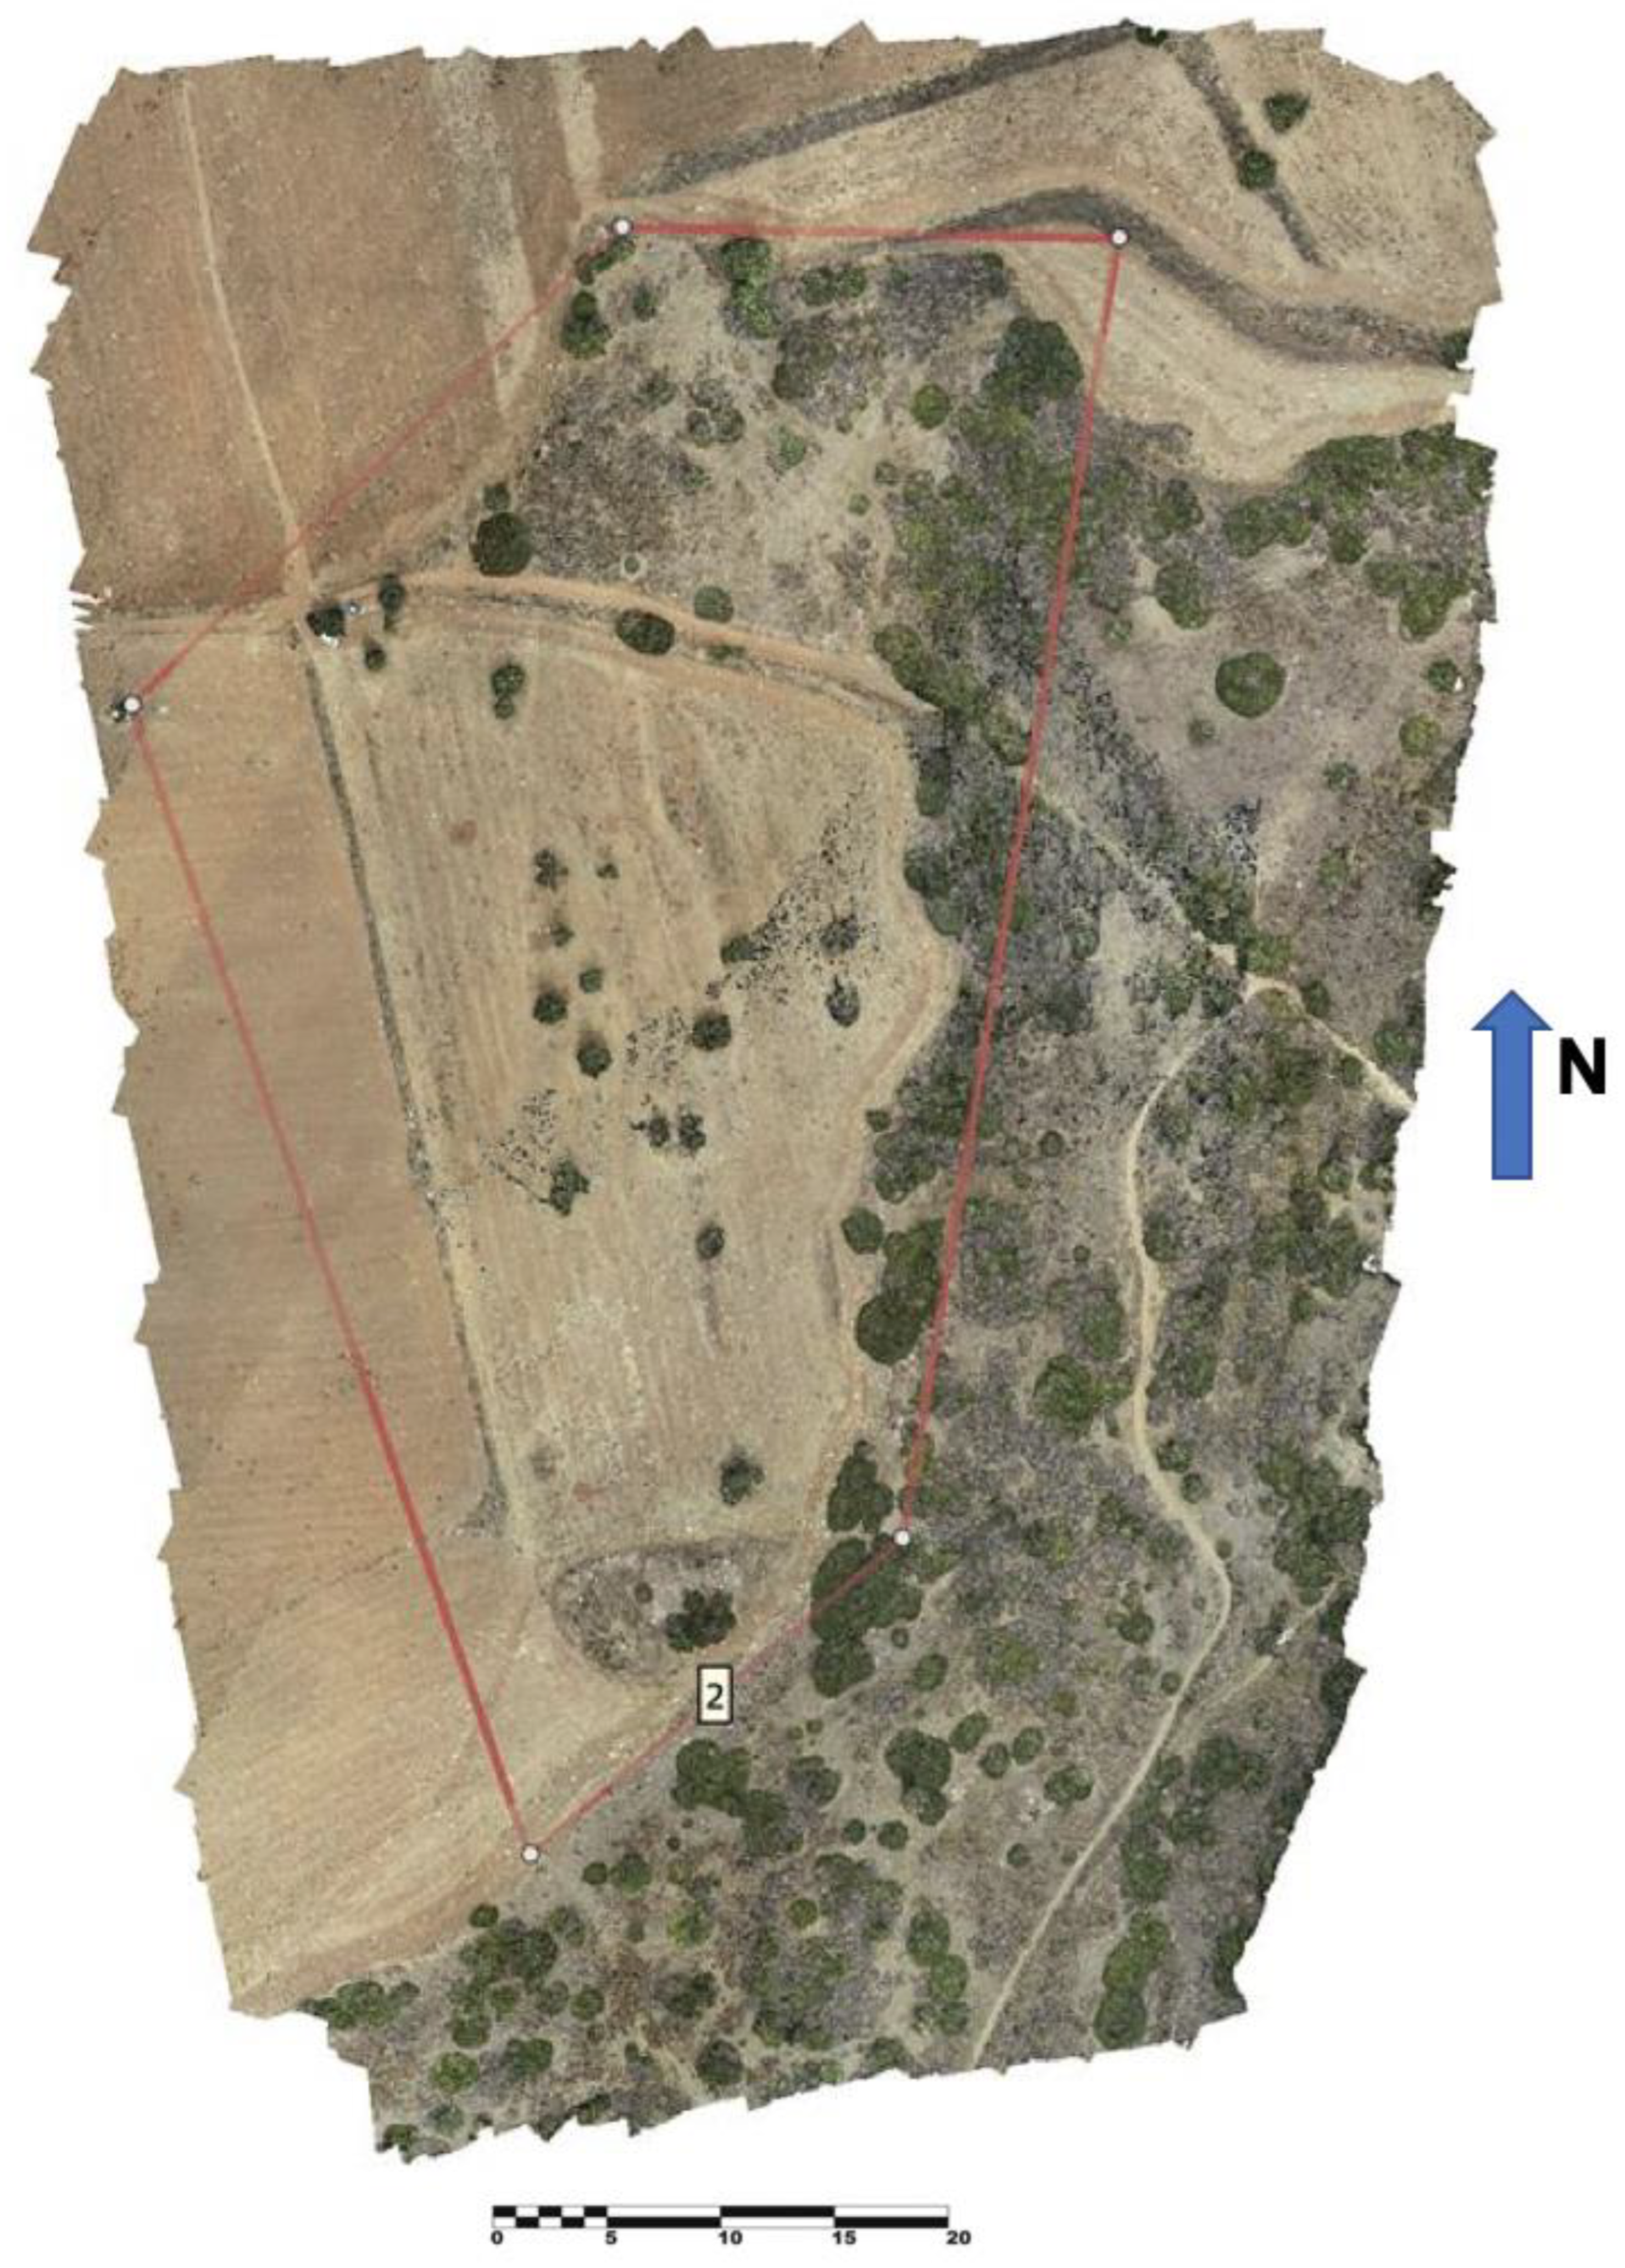
The use of the four fixed concrete blocks buried in the ground was for two reasons: they served as permanent topographical points for future data acquisition, and they were used as cornerstones to place the three orthophotos in the same physical space during the change-detection analysis.
Accordingly, to crop the orthophotos and the digital-elevation model to the same extent, a shape file was created, using the fixed points (
Figure 3).
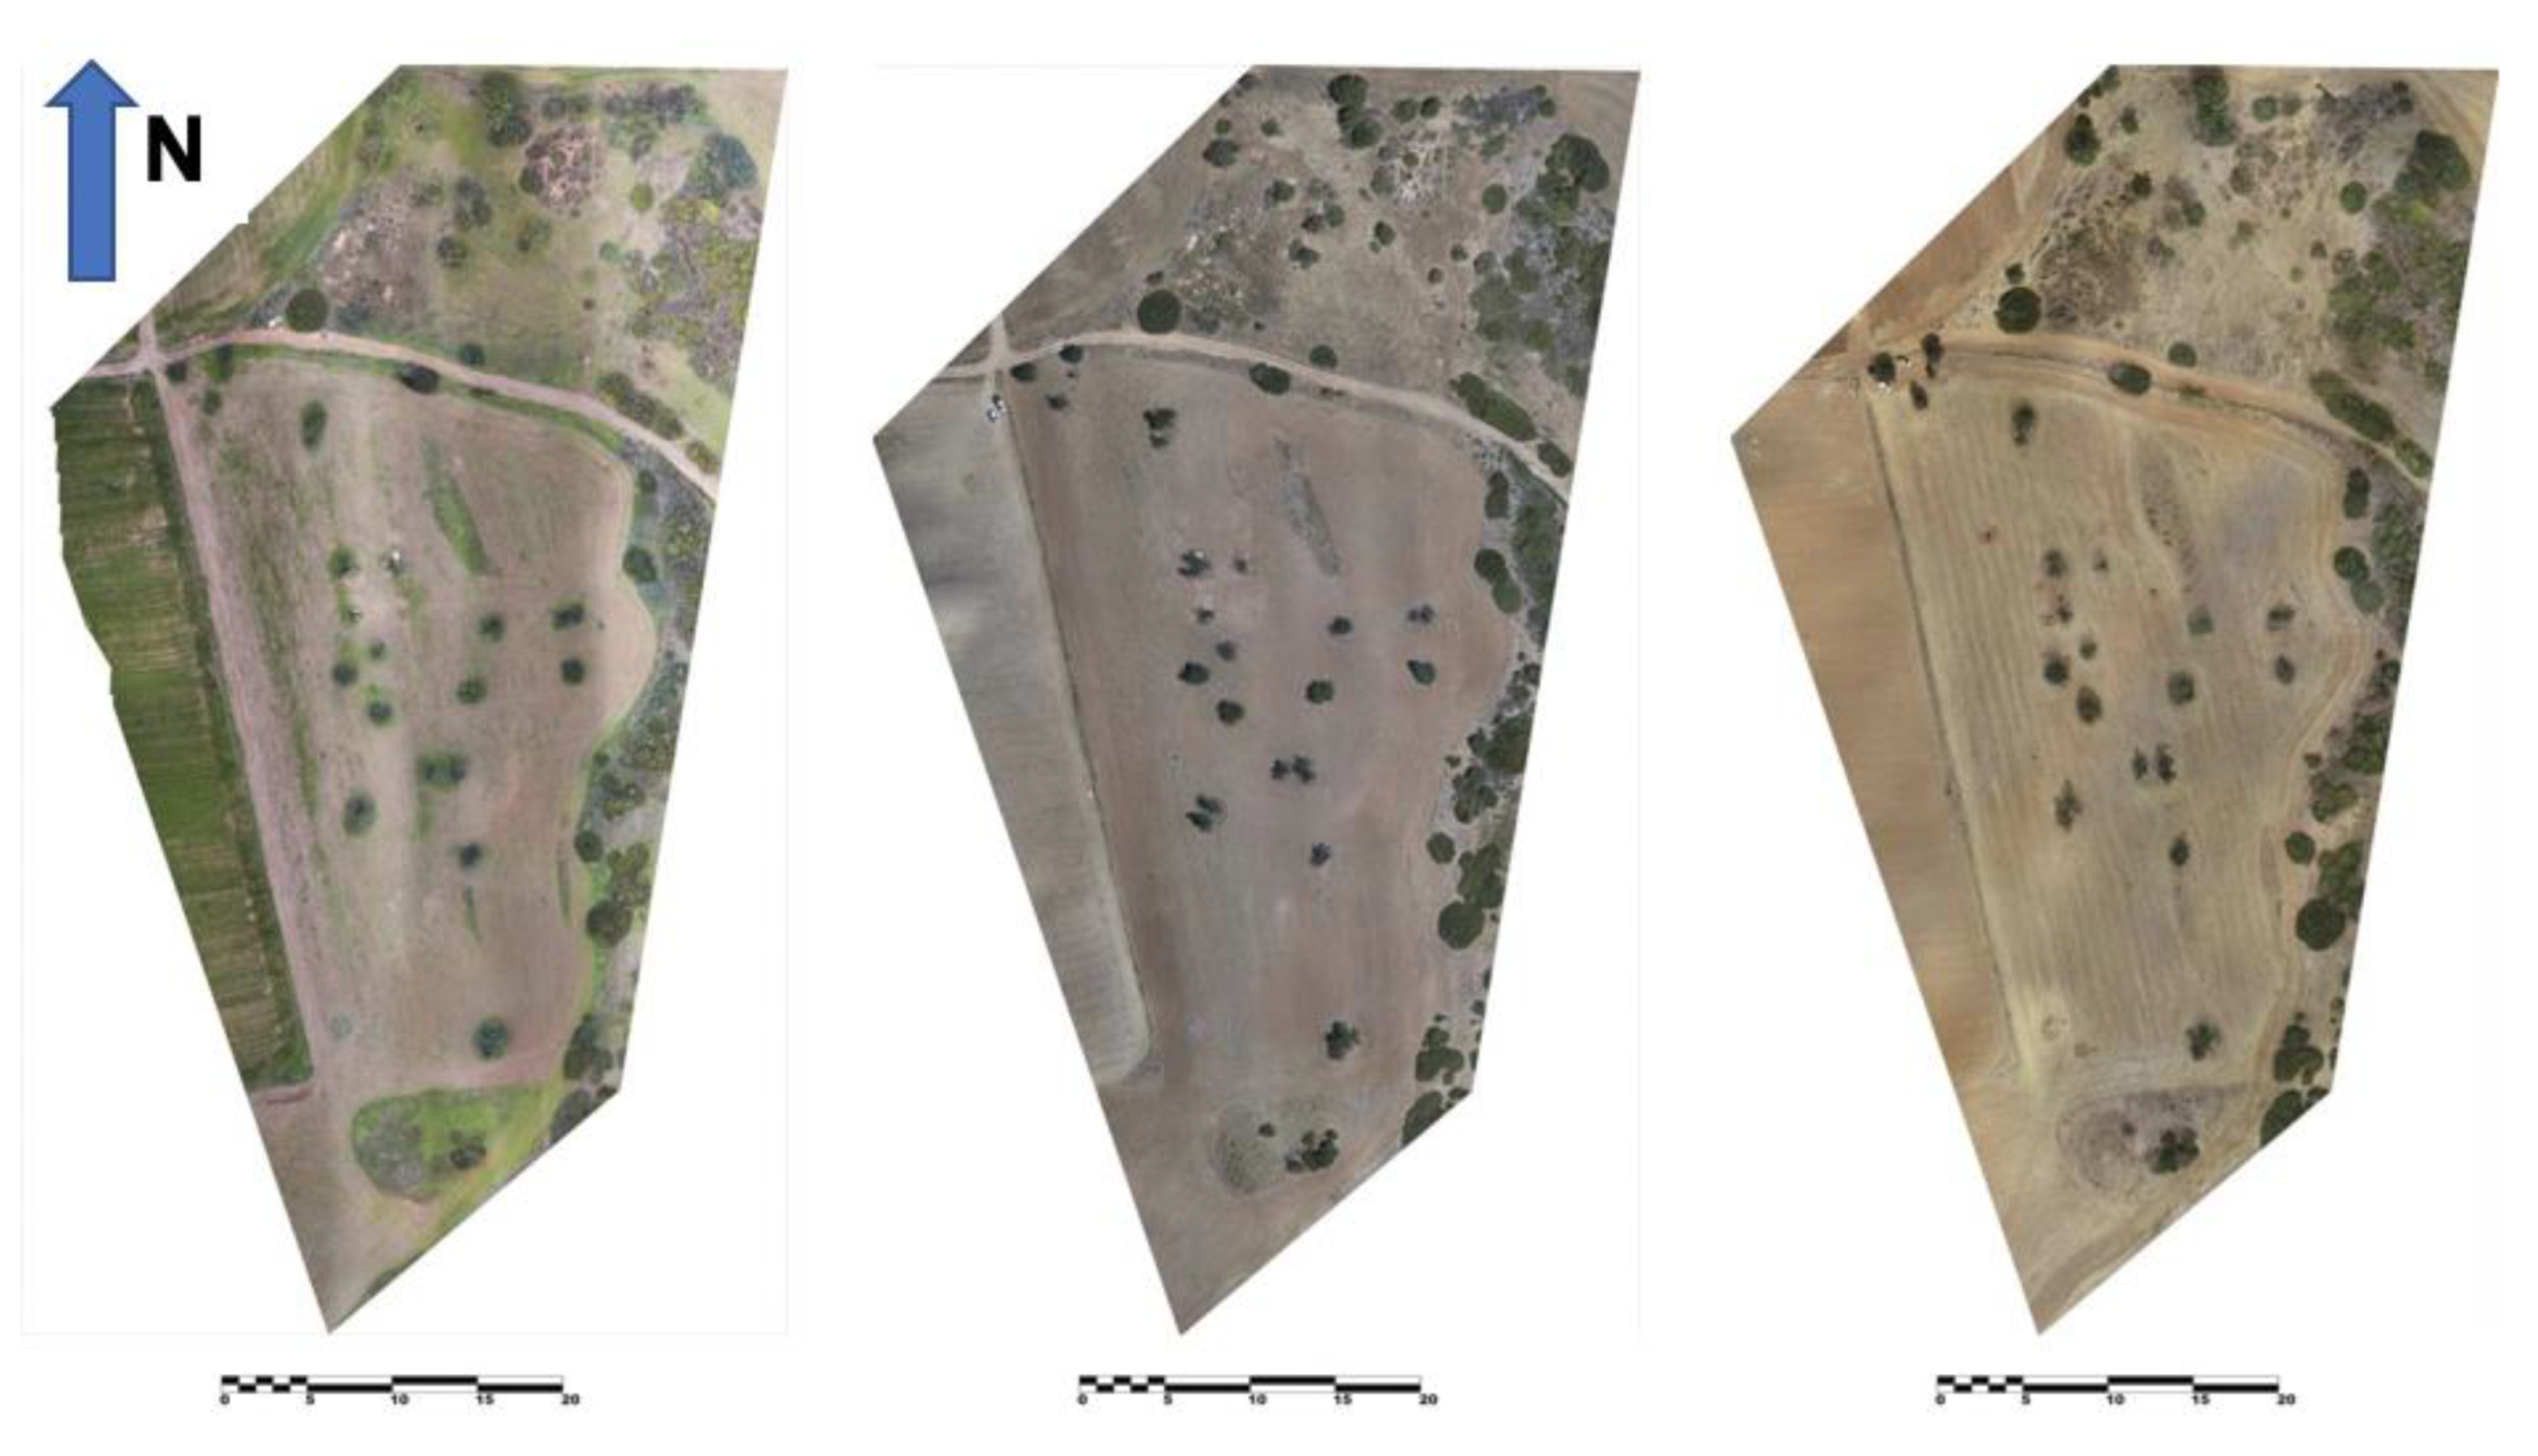
Each dataset was composed of an average of 900 RAW images.
The data were firstly pre-processed to improve the radiometric values (white balance, histogram stretching, etc.). Afterwards, the standard photogrammetric process, consisting of image-correspondence detection, bundle adjustment and dense image matching using the first-level image pyramid, was performed.
Three orthophotos and three DEMs digitally blended to avoid the visibility of seam lines between images were created and used for further analysis (
Figure 4).
3.2. Unsupervised Change Detection
Various procedures have been developed in remote sensing, with the final goal of detecting differences appearing on the Earth surface over time. One of those techniques is known as change detection. It can be tackled in a supervised or unsupervised way.
Unsupervised change detection is usually selected when there is no availability of training samples or a limited knowledge of the ground features.
In this study, the multivariate-alteration-detection (MAD) algorithm available in the Orfeo Tool Box was selected. It was initially compared with principal component analysis (PCA), which has shown its robustness in remote sensing, [
33]. PCA is a statistical procedure developed to transform a set of correlated variables into a new set of uncorrelated variables. The principal direction of the data in the space is considered the weighting factor. Whereas PCA allows one to reduce the size and redundancy of the original data, the multivariate alteration detection uses the maximum autocorrelation to eliminate factors associated with the possibility that a dominating element in the image affects the PCA components. Additionally, MAD is invariant for linear transformations of the data, making it unaffected by its application to raw digital numbers (DNs) or transformed images [
34].
Multivariate alteration detection, developed by Nielsen et al. [
35], is a mathematical analysis technique, largely used in image linear transformation. It aims to improve the simple image-differentiating procedures which are possible using canonical-correlation analysis (CCA). The main principle is to achieve a high degree of similarity (i.e., correlation) between images, before their difference is computed. The latter is performed by using CCA to find two sets of linear combinations of the original variables, where the first two linear combinations (called canonical variates) are the ones presenting the weightiest correlation (called first canonical correlation).
Several iterations are then computed to achieve the higher-order canonical correlations/variates, under the condition that they are orthogonal (i.e., uncorrelated) to the previous ones. If N is the maximum number of bands in first- and second-input images, the differences between the corresponding pairs of variates (called MAD variates or components), constitute N change maps, which are usually combined in a single multi-band image.
Since MAD analysis lacks semantic interpretation, the adoption of a two-step procedure is preferred to support the understanding of changes highlighted by MAD. Accordingly, the maximum-autocorrelation-factor (MAF) transformation to the MAD components can be applied [
36]. MAF transforming aims to separate the noise component of the data by computing a new set of variates from the original ones. Low-order components represent maximal spatial autocorrelation (signal). The highest-order variates correspond to minimal spatial autocorrelation (noise). Therefore, the first MAF-MAD component will identify areas with maximum changes, while the noise is expected to be isolated in the lower order MAF-MAD components. The use of the MAD technique, and its combination with MAF, is popular in the remote-sensing domain [
37,
38].
Arch_Site_01 Change Detection
The Orfeo ToolBox (OTB) remote-sensing image-processing library [
39] was used to process the generated orthophotos. A standard procedure for the comparison of multitemporal images of the same area includes a preliminary image co-registration refinement. This task computes a 2D disparity map between two images corresponding to the same scene. It is mainly used when small mis-registration between images has to be computed and corrected. Although the orthophotos were cropped evenly, using the process described above, through fixed GCPs, the decision to perform this additional step was due to the small ground movements which might have occurred over the three years. It should be reiterated that besides being a site of archaeological interest, it is today used for cultivation, and plowing occurs at regular intervals. The co-registration algorithm performs an iterative computation to reduce discrepancies between images until a best match between local patches is obtained. The final output image contains X and Y offsets, as well as sub-pixel-accuracy metric value.
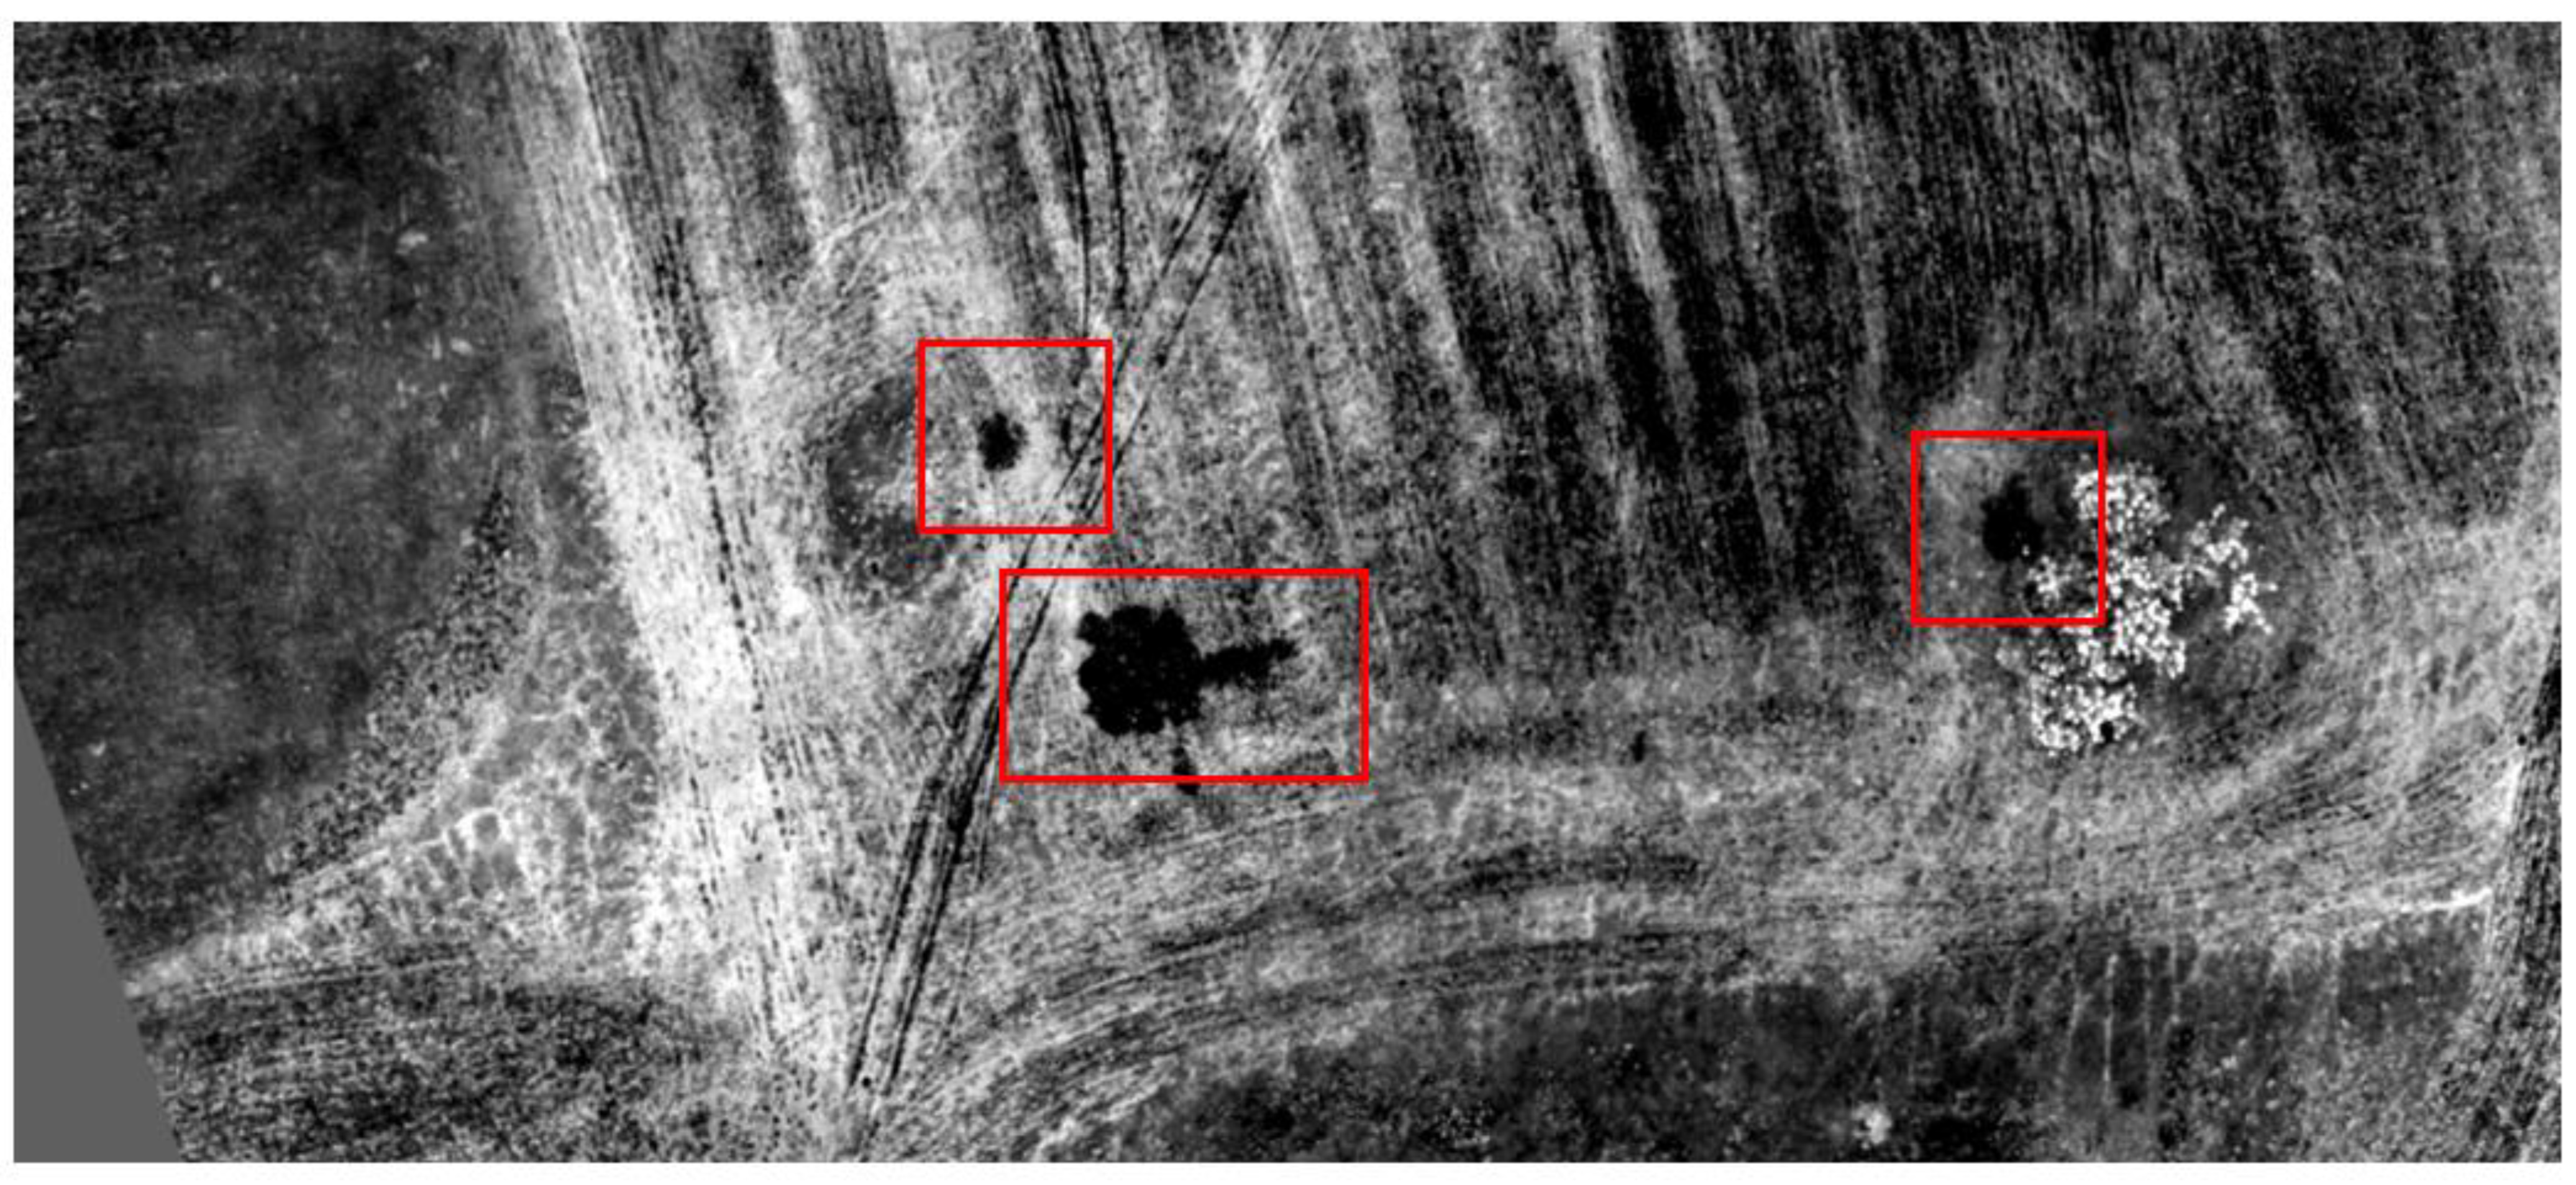
The multitemporal change detection is then performed by using the MAD algorithm. A MAD map is then produced, comprising three bands that represent the variates (change maps) organized by increasing correlation.
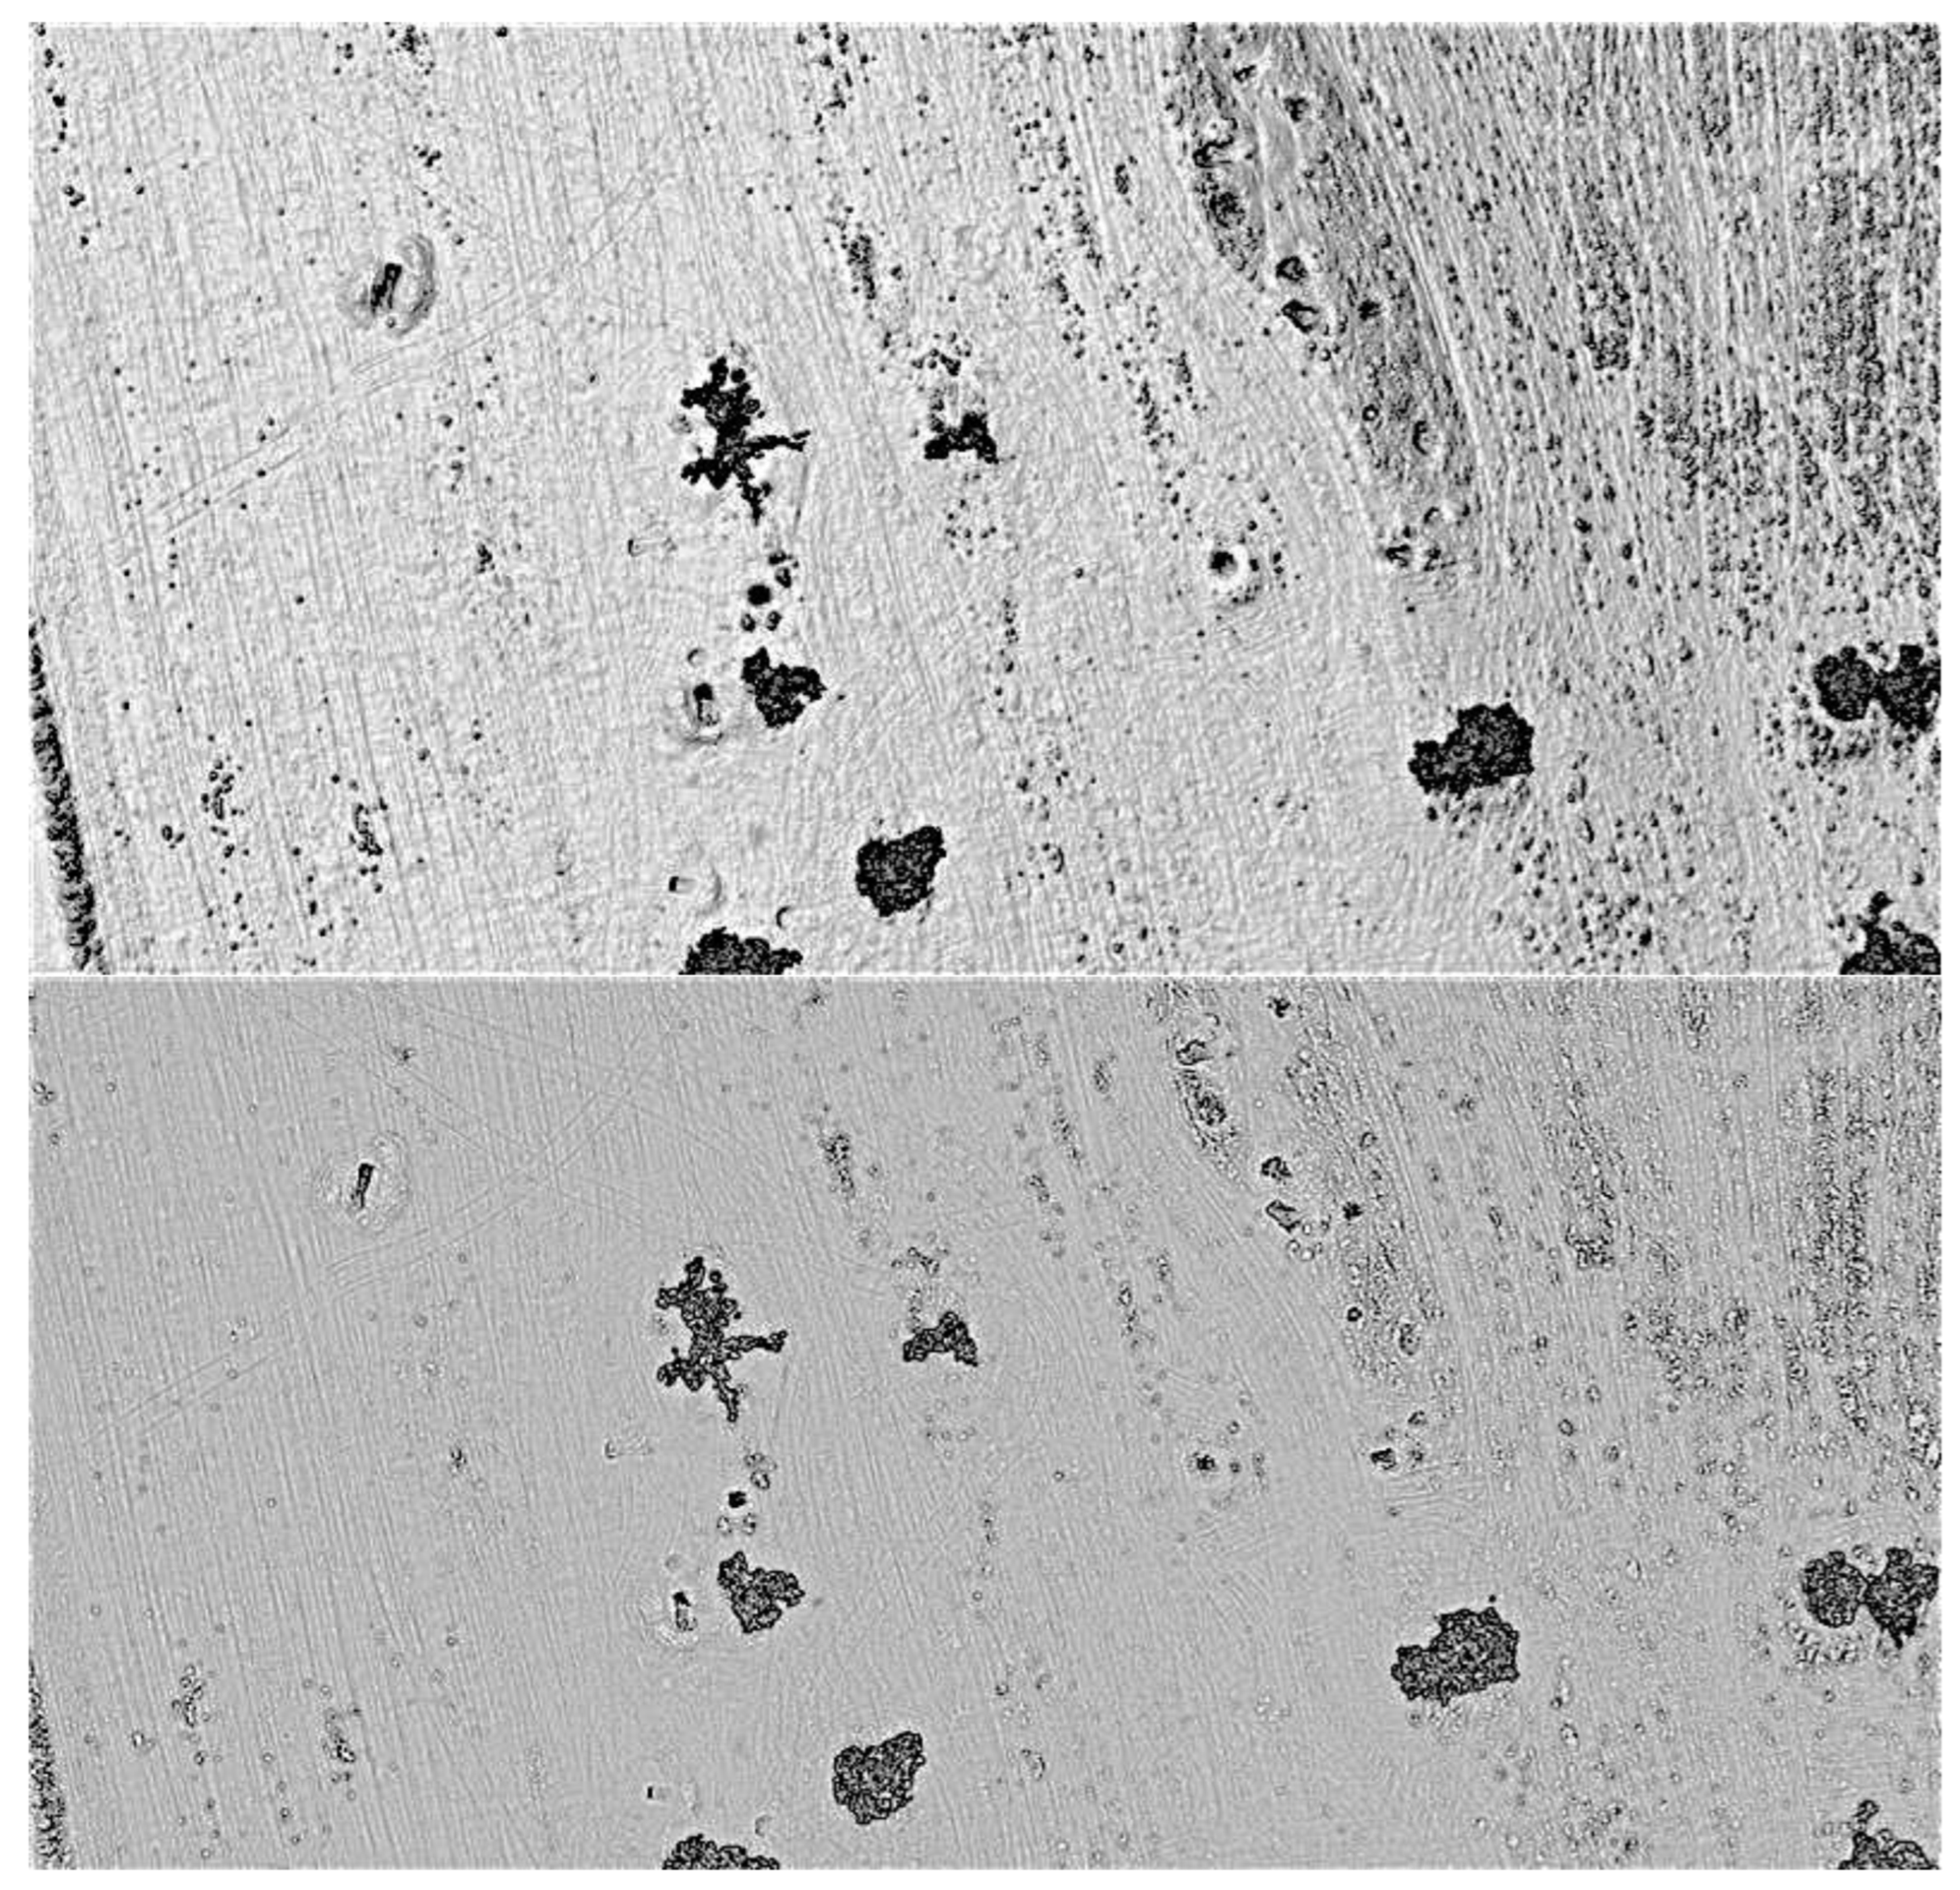
Finally, the MAF transform is applied to the MAD variates. The first MAF-MAD component (i.e., lowest order) is primarily analyzed to identify the changes which have occurred (
Figure 5).
The following change-detection analyses were performed, comparing different periods of observation (
Table 2):
The applied procedure highlighted several macroscopic and microscopic ground anomalies scattered over the field. All the features were then confirmed through walk-over surveys, leading to positive (looting) and negative (plant removal/growth; earth-moving) results.
In spite of MAD/MAF providing a high degree of details, their interpretation requires being carefully validated. A comparison with RGB orthophotos was hence conducted for initial validation.
The temporal progression of the illegal excavations was then mapped in a GIS environment (
Section 3.4) for a spatio-temporal assessment.
3.3. Digital-Elevation-Models Analysis
For a precise analysis and interpretation of the
Arch_site_01 terrain’s features, and to possibly identify anomalies which were not classified during the change-detection analysis, a method using the Relief Visualization Toolbox (RVT) was followed [
40].
The Relief Visualization Toolbox (RVT) allows users to perform a set of operations which were successfully used for archaeological-feature identifications: (i) Hill-Shading [
41], (ii) Local Relief Model [
42], (iii) Positive and Negative Openness [
43], (iv) Local Dominance [
44], and Sky View Factor [
45].
The digital-elevation models (DEMs) of the three seasons were processed to assess the performance of the several visualization algorithms.
As described in [
30], in the case of
Arch_site_01, the most successful tool for highlighting looting pits was the Sky View Factor, with Positive Openness, providing similar results (
Figure 6).
3.4. GIS Analysis
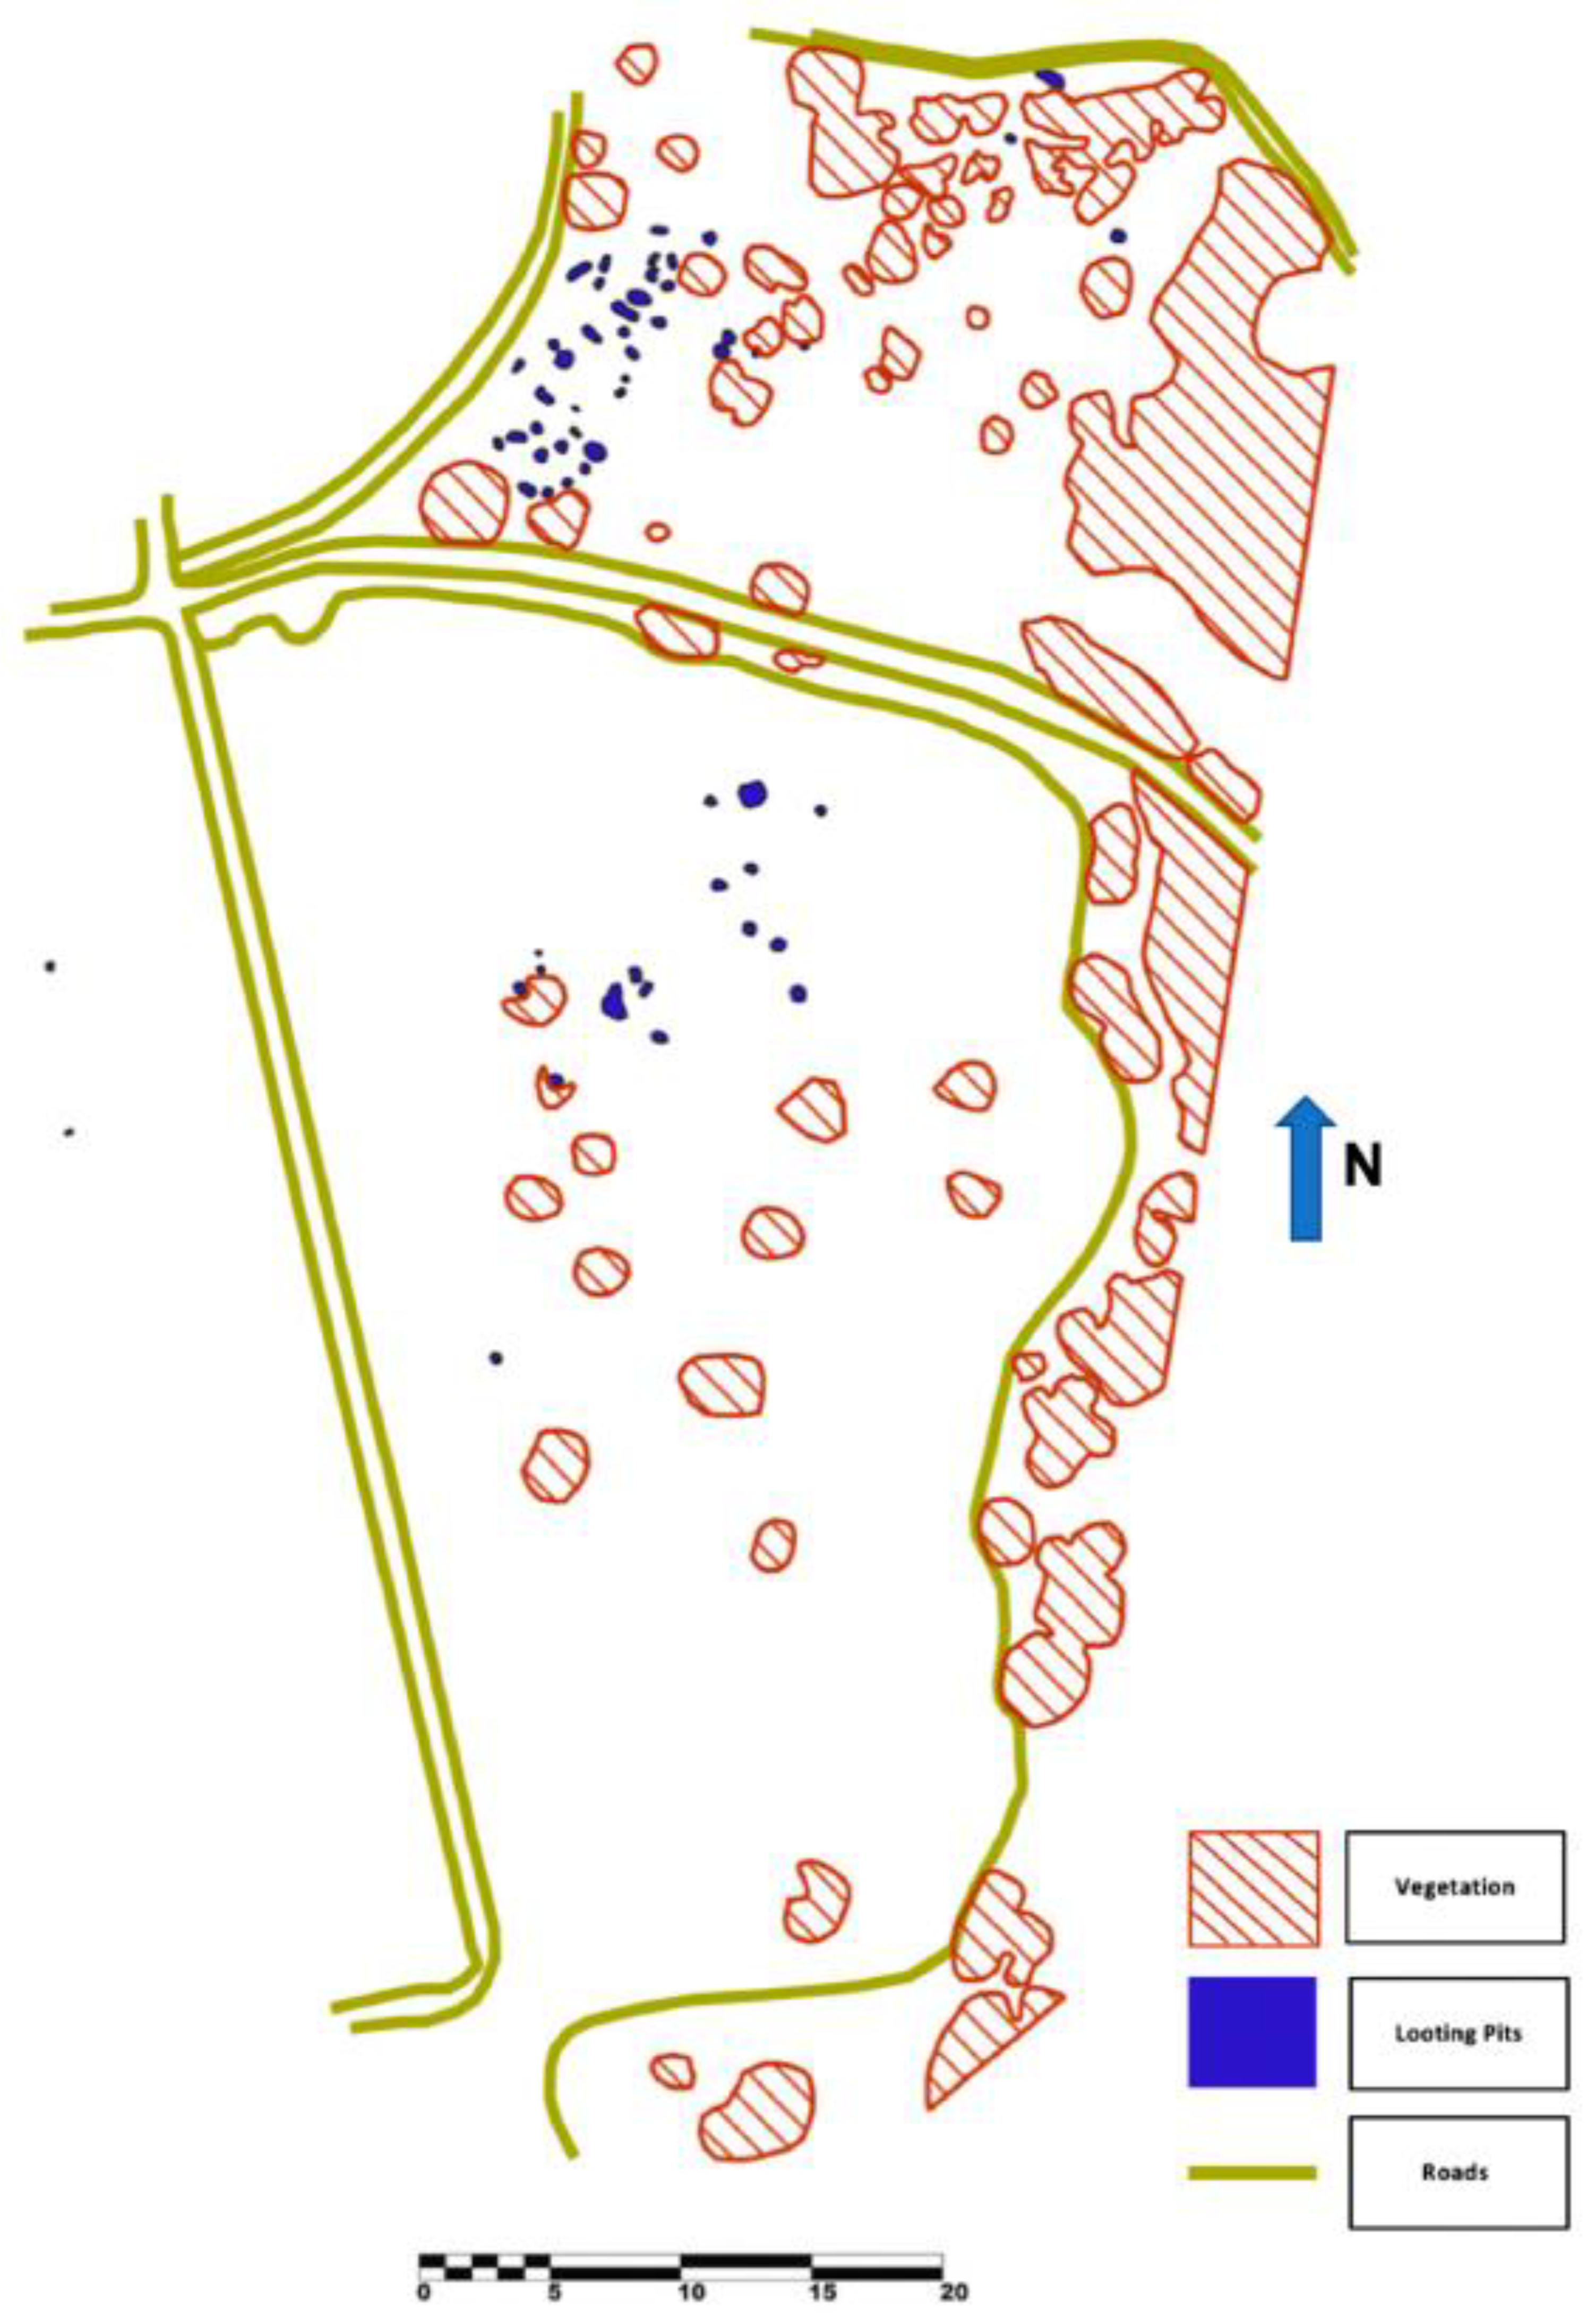
After the identification of ground anomalies which were possibly related to looting and illegal archaeological excavations, each feature was mapped using geographic information system (GIS) with the final goal of assessing the spatial location and temporal sequence of the recorded incidents (
Figure 7).
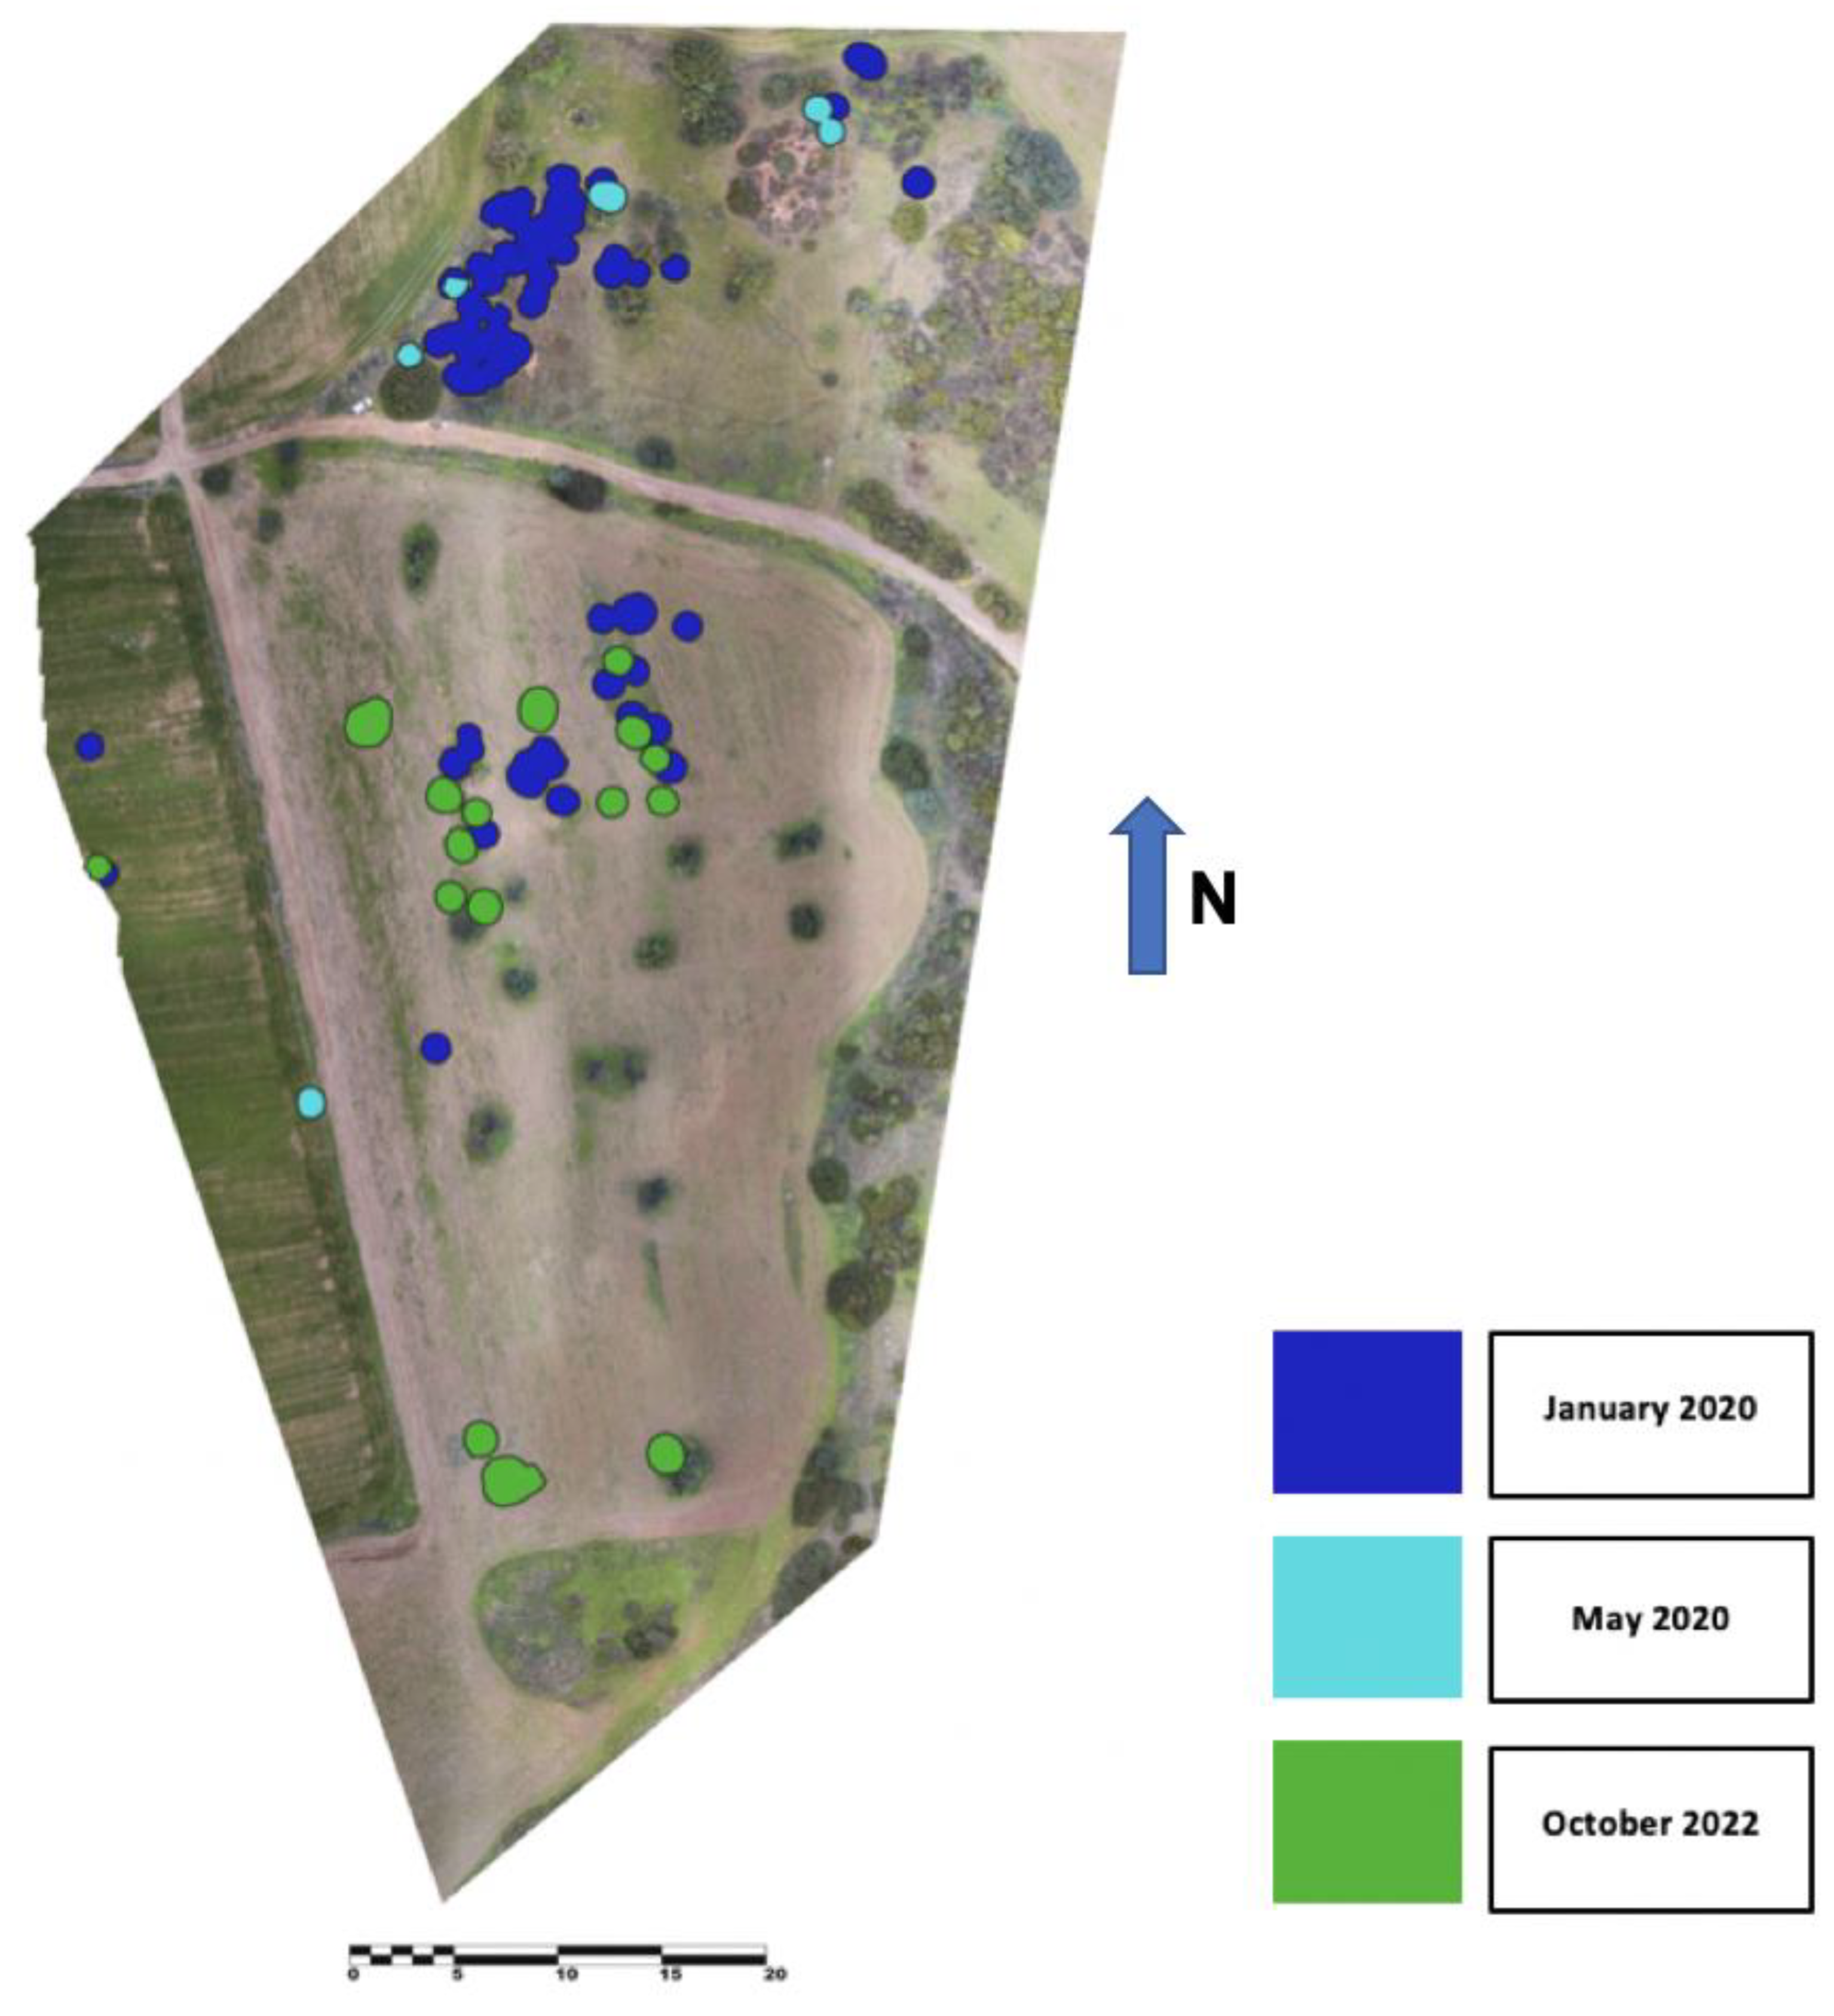
At the beginning of the monitoring period (January 2020), around 60 ground anomalies (looting pits) were recorded in the area. Forty-one pits were located in the western side and appeared not to have been excavated recently. Nineteen features instead were located in the area of the plateau, possibly indicating more recent events. Although is not possible to assess without any reasonable doubt the temporal sequence of the illegal excavations, the ground anomalies seem to suggest a movement from west to east (
Figure 8).
The second aerial-survey campaign was completed after five months (May 2020), with the final goal of assessing conditions on the ground in the short term. The change-detection and visualization analysis highlighted six tentative features which were then investigated on the ground. Out of six, one anomaly was connected to looting activities. It was located in the field adjacent to the main plateau, an area where pillage was identified during the previous campaign (
Figure 9).
The third survey campaign was performed in October 2022, featuring a twenty-nine-month pit area from the previous one. After the application of the described methodology, sixteen new features mapped, all of them related to illegal excavations. The majority of the pits are located in the center of the field (thirteen), although it is possible to observe that the terrain has been moved in the eastern part where a significant deep hole is visible (
Figure 10).
Figure 11 shows a buffer analysis for the purposed visualization. A buffer area was computed for all the features included in each specific season layer, using a fixed distance.
4. Results and Discussion
This paper presented a multimodal data-collection and data-processing approach, developed for the identification of illegal archaeological excavations and the assessment of the spatio-temporal dynamics of the crime of looting.
The implemented workflow allows users to visualize different categories of data, allowing one to uncover patterns, understand trends, monitor changes, and eventually counter events, to facilitate a more efficient decision-making process (e.g., the location of camera traps in a location where new incidents may occur, according to the documented scenario).
Aerial images and digital-elevation models were analyzed using a manual and semiautomatic approach, with the ultimate goal being to identify ground anomalies, potentially related to illegal archaeological excavations. Several features were recognized and classified as looting incidents over the three monitoring seasons.
For each season, an initial assessment was performed by visually analyzing RGB orthophotos. Thanks to the high-resolution data, small features (i.e., tools which were used to possibly perform the illegal excavations, and panels used to cover the pits) were clearly recognizable, and subsequently mapped.
The applied multitemporal-change-detection approach was realized by mutually comparing the RGB orthophotos with the MAD/MAF output, to study the looting activities in time and space and possibly identify any possible path.
Besides pinpointing new illegal excavations, the change-detection analysis highlighted the erasing effect of plowing activities on the evidence of past-looting activity. Shallow pits and small ground anomalies, connected most probably to shoveling and not performed with excavators, and which were clearly visible in specific seasons, were indeed obliterated, due to the effect of soil handling linked to agriculture practices.
With the ultimate goal of confirming and possibly identifying ground anomalies not recorded before, several visualization algorithms were applied to the digital-elevation models generated using the Relief Visualization Toolbox (RVT).
According to the shape of the pits (not large, and morphologically consistent), the most promising algorithm among those applied for looting identification, were those behind the Sky View Factor and, to some extent, the Positive Openness programs.
The relief-visualization study was confirmed by aerial-imagery analysis and a walkover survey. Besides confirming the results, it was also possible to pinpoint additional features.
In order to gather all the information collected in a single database, and to be able to classify, visualize, and examine different layers of data by creating maps, all the ground anomalies recorded were input into a GIS system. The possibility of enabling and disabling layers allowed the initial assessment of the amount of destruction, the path followed by looters and the temporal sequence over three seasons (two years).
5. Conclusions
Despite the fact that satellite observations or low-altitude aerial imagery does not represent a preventive measure to tackle illegal archaeological excavations, the identification of new looted areas, probably unknown to local stakeholders, or the documentation of their progress over time is considered a critical step towards the increase in awareness of potential illegal trafficking and tentative surveillance measures.
The increasing availability of open and freely available high-resolution sensors (space or airborne) is allowing the scientific community and the authorities to assess the problem more efficiently.
However, although the growing availability of semi-automatic and automatic-features-extraction algorithms, the archaeological-protection domain needs further tools to stop these illegal activities before any sort of destruction occurs.

 ,
, 


