
On Devotional Artworks: A Non-Invasive Characterization of Pigments of the Madonna della Croce Wall Painting in Triggiano (Bari, Southern Italy)
 , ,
, ,
Abstract
:1. Introduction
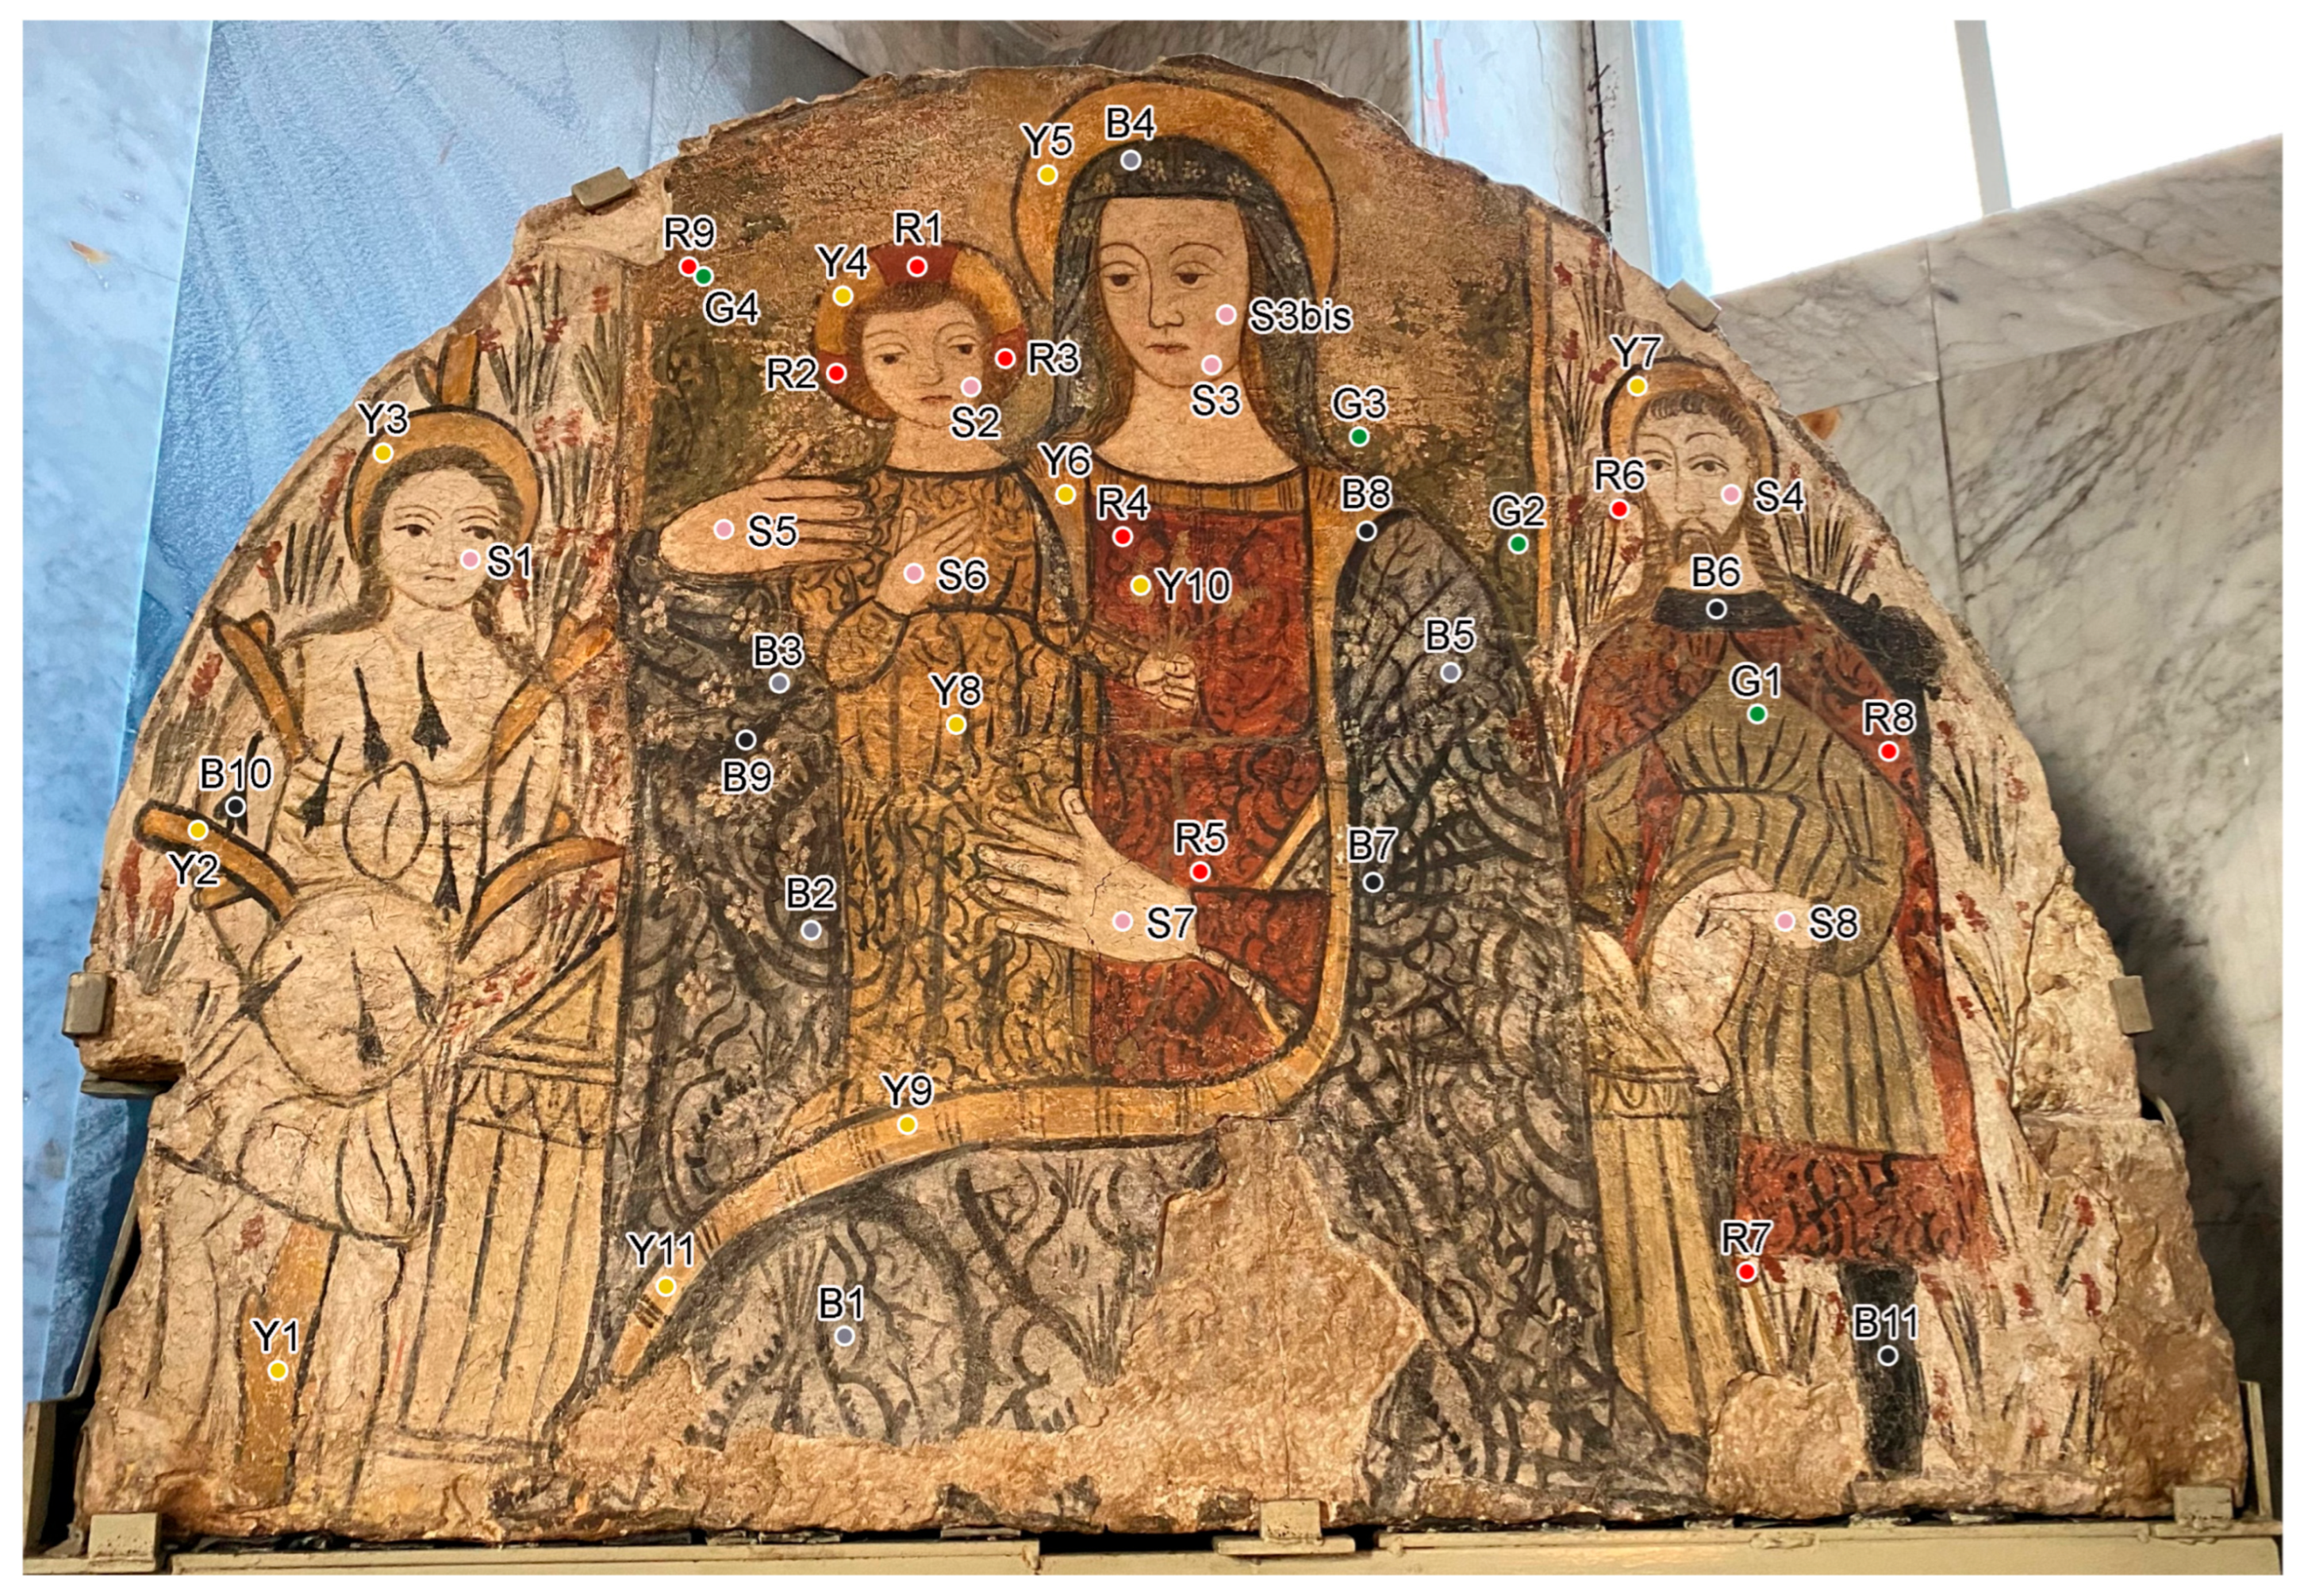
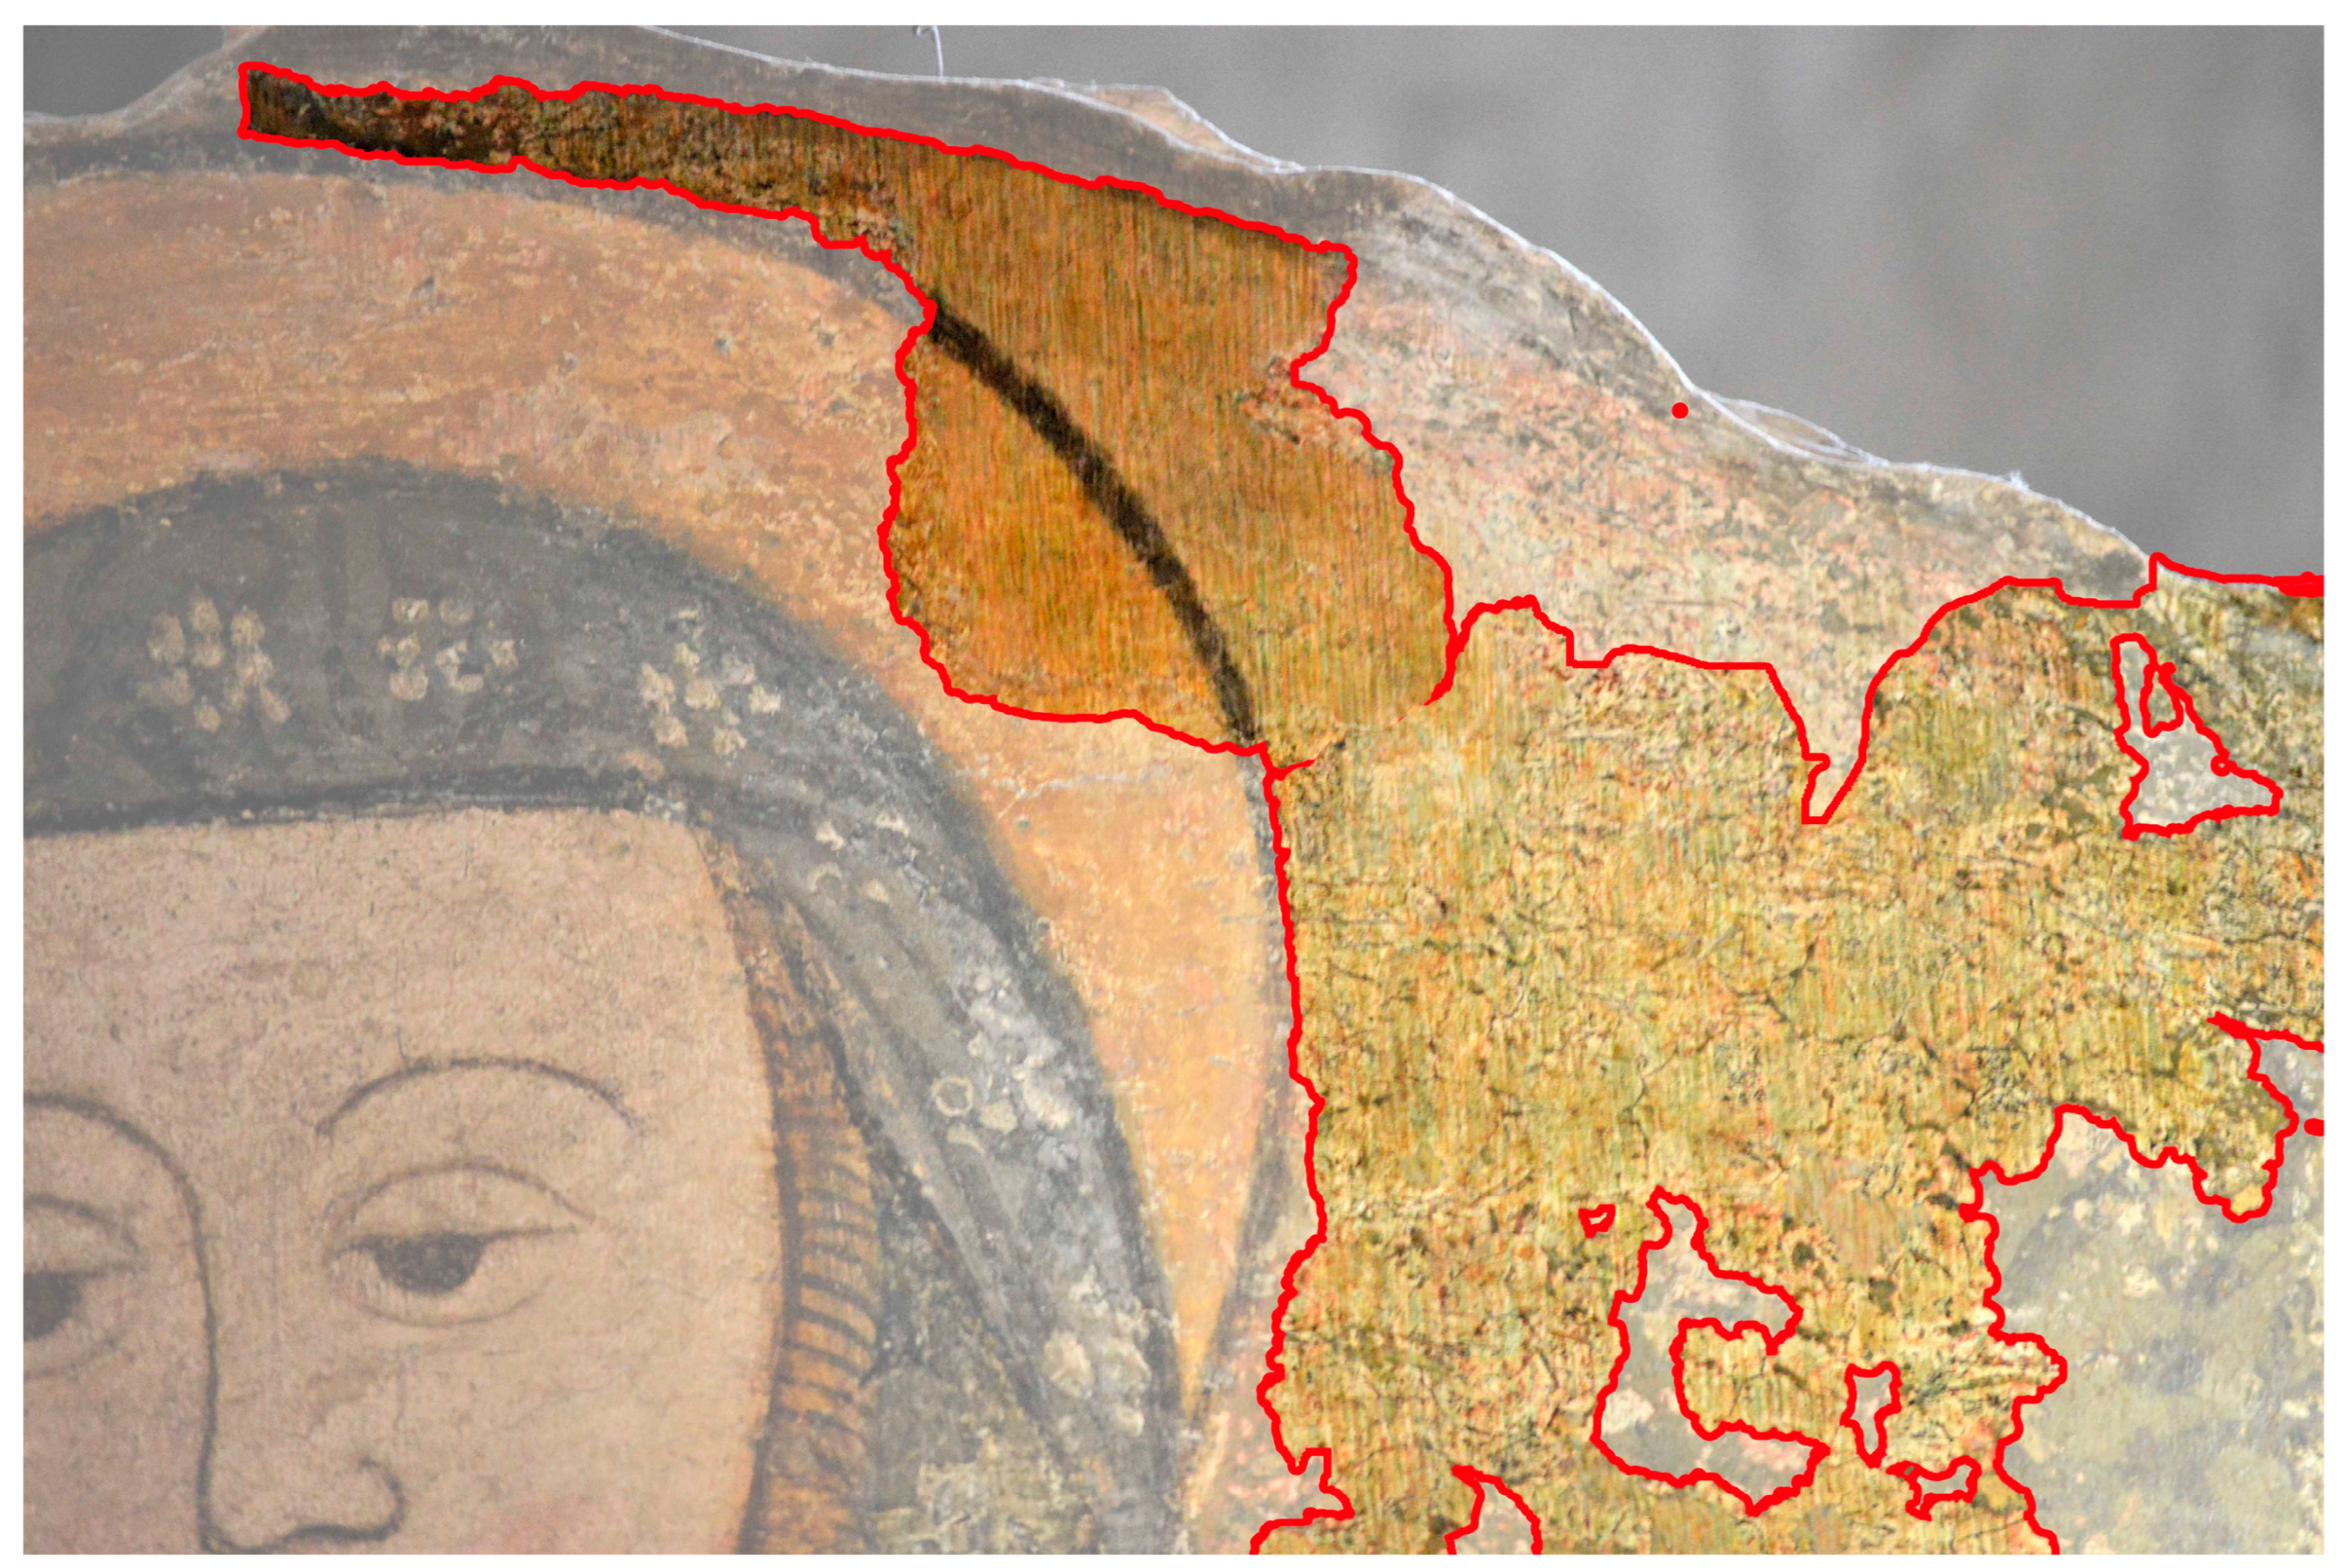
The Painting
2. Analysis Points
3. Methods
3.1. Optical Microscopy
3.2. Colorimetry
3.3. Fiber Optic Reflectance Spectroscopy
3.4. XRF
4. Results
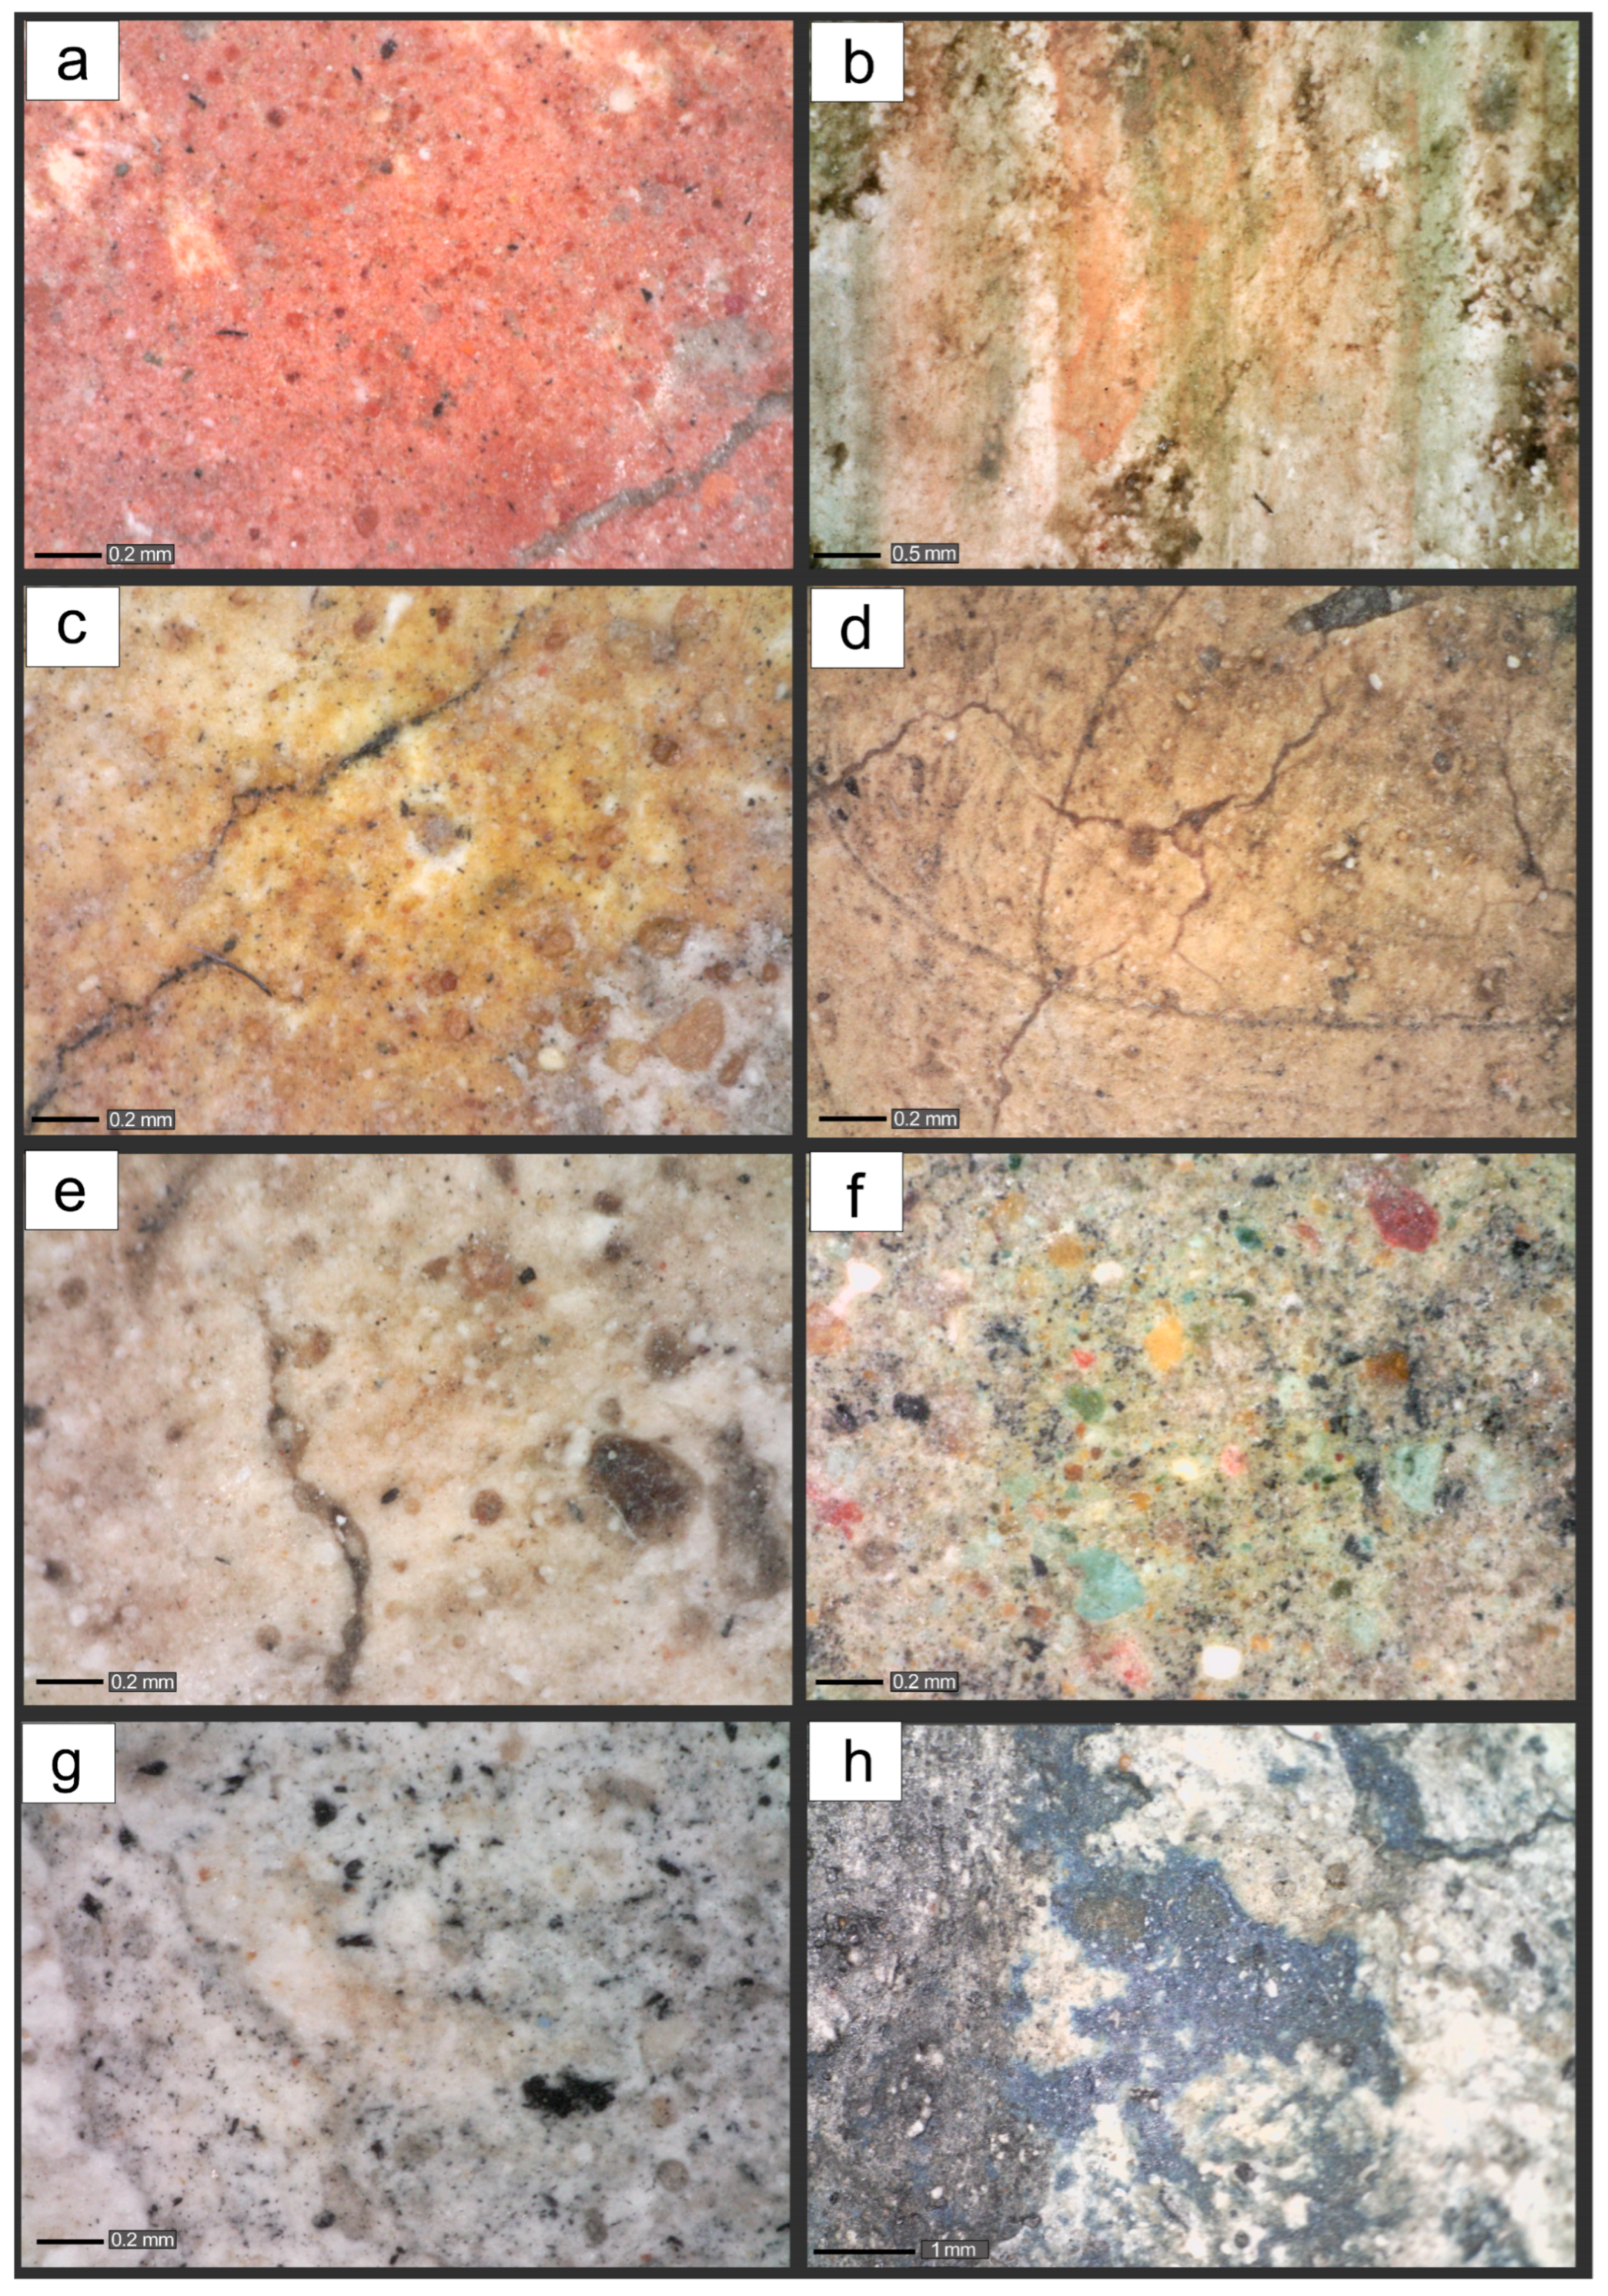
4.1. Microscopic Characterisation
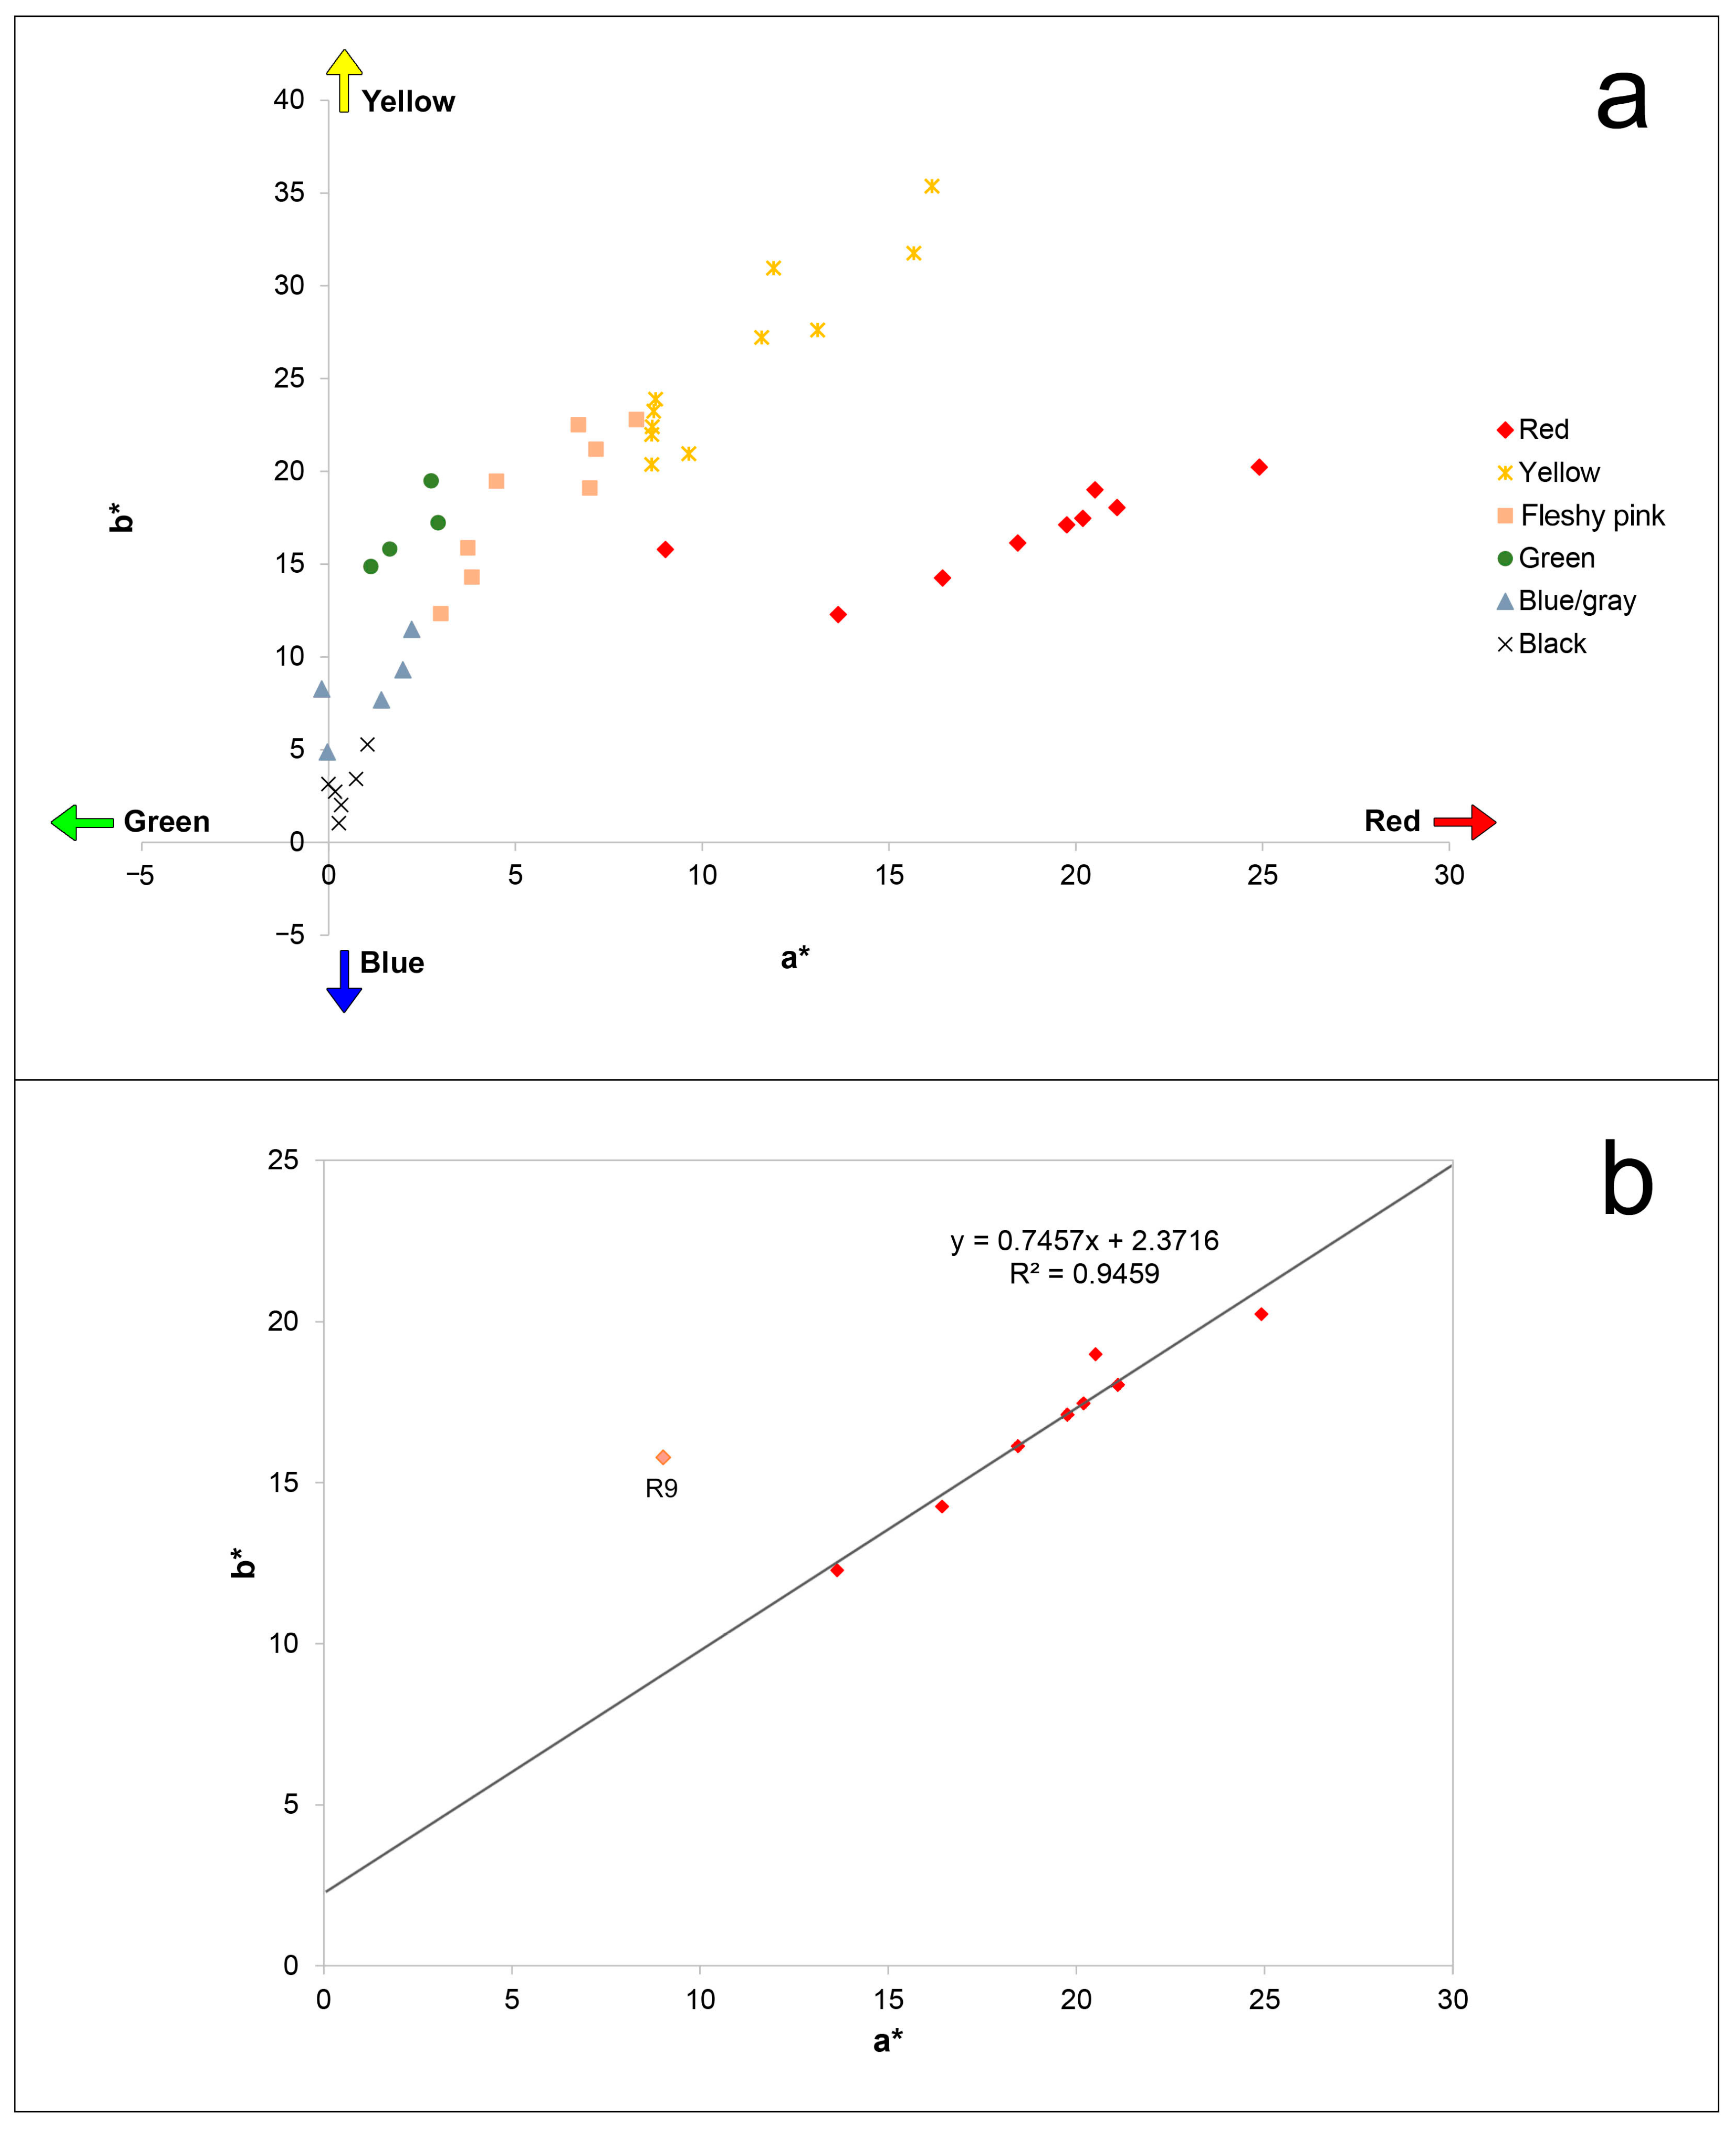
4.2. Colorimetry
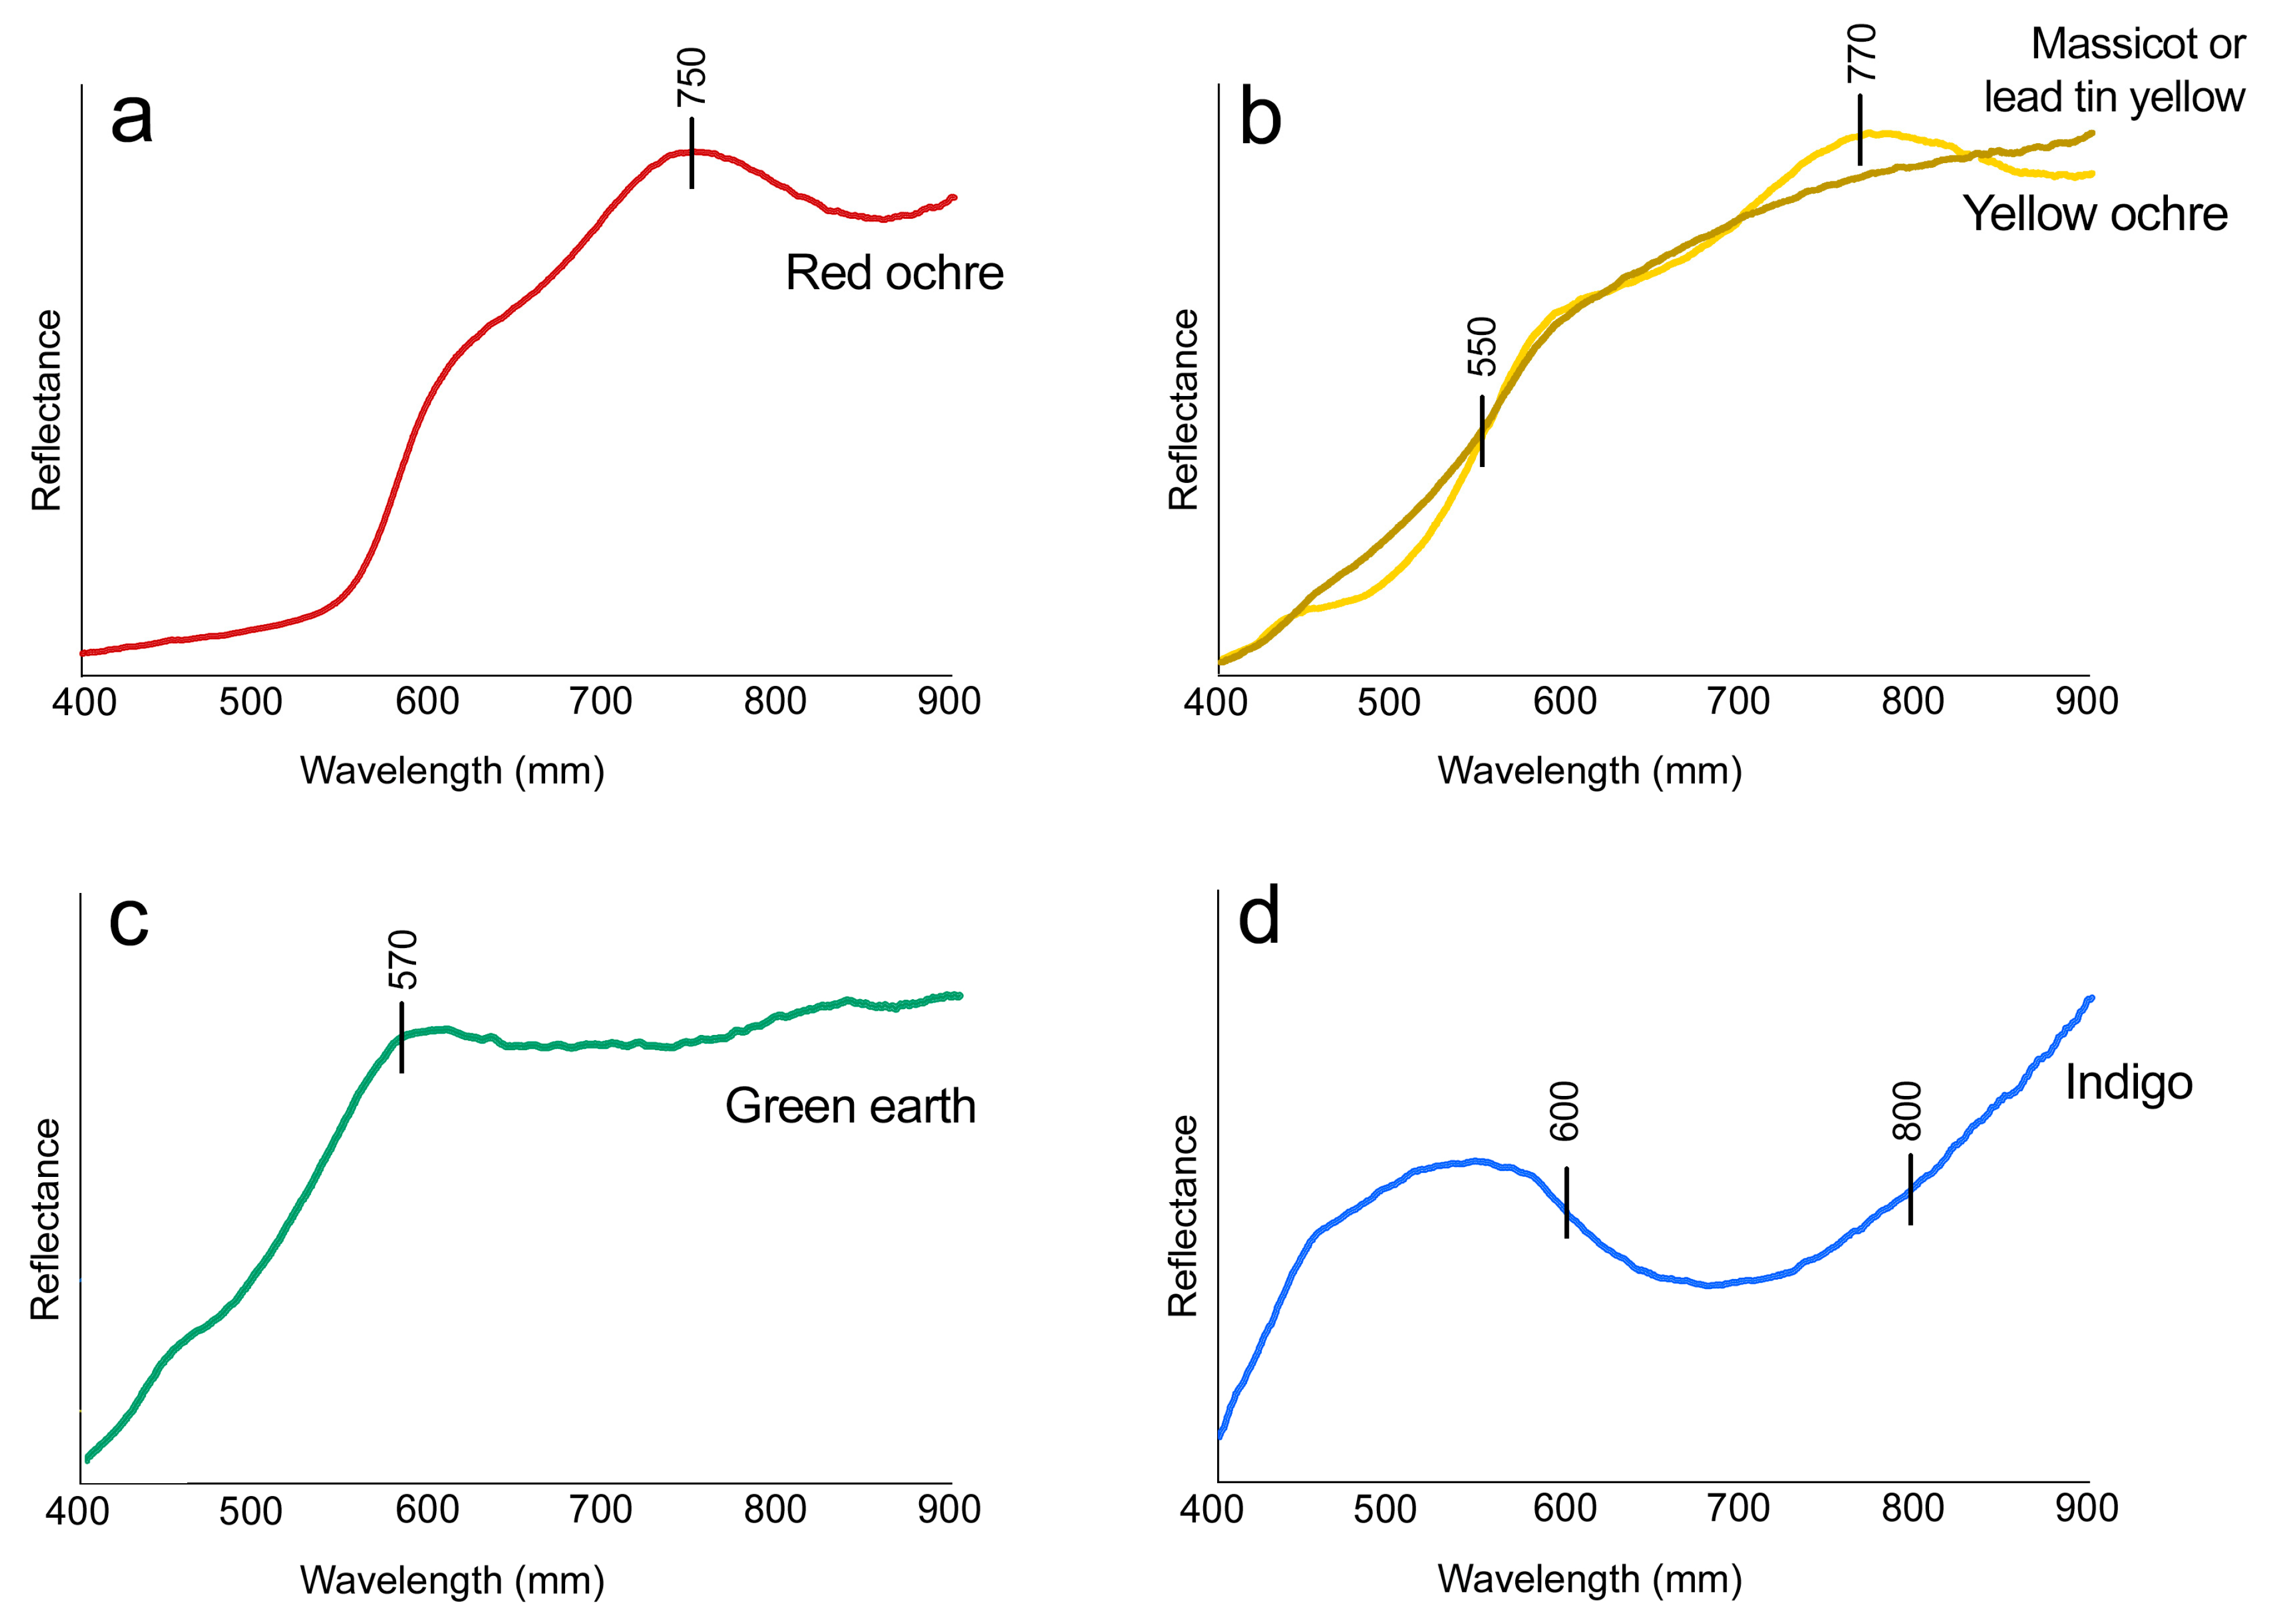
4.3. FORS
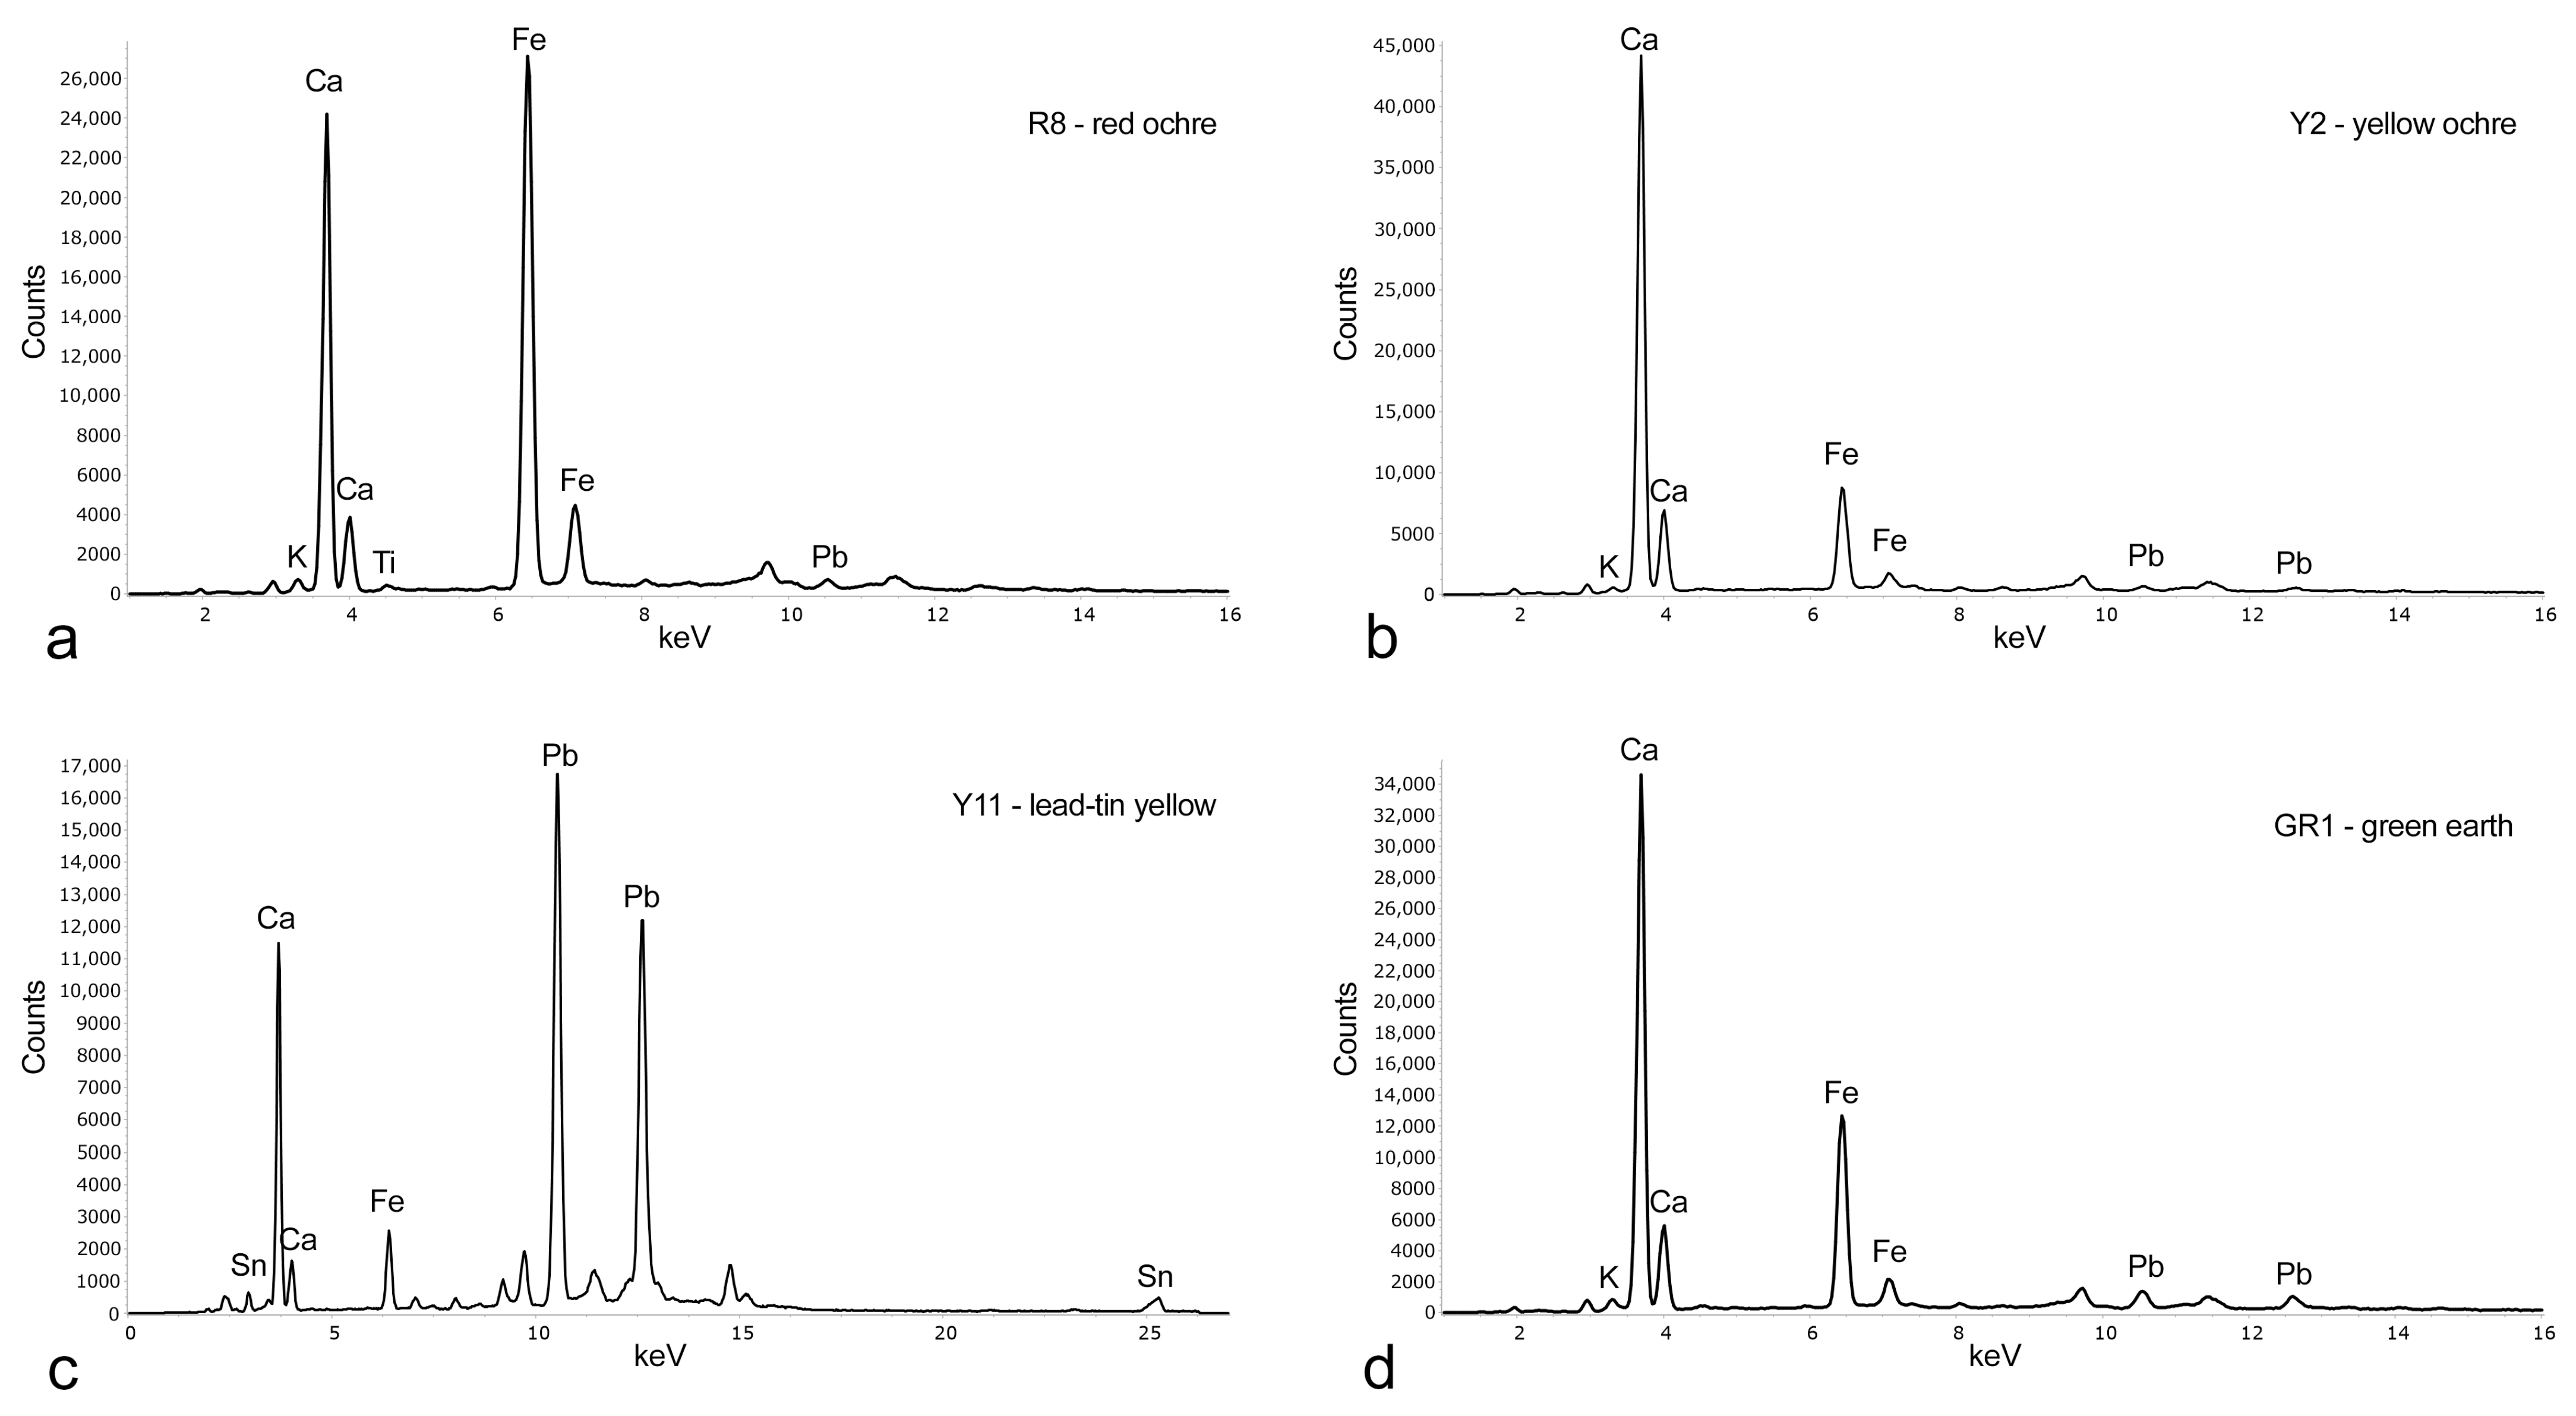
4.4. XRF
5. Discussion
6. Conclusions
Author Contributions
Funding
Data Availability Statement
Acknowledgments
Conflicts of Interest
References
- Battista, P. La Madonna Della Croce in Una “Memoria” Del 1737; Levante Editori: Bari, Italy, 1984. [Google Scholar]
- Campobasso, C.; Di Fronzo, D. Viaggio Alla Scoperta Del Culto Della Madonna Del Pozzo, Storie, Aneddoti e Fotografie Della Protettrice Della Comunità Dei Pugliesi Nel Mondo; Edizione Fondazione Pasquale Battista: Bari, Italy, 2021. [Google Scholar]
- Caprara, R.; Dell’Aquila, C. Il Villaggio Rupestre Della Gravina “Madonna Della Scala” a Massafra (Taranto); Dellisanti Ed.: Massafra, Italy, 2007. [Google Scholar]
- Cirillo, M.T.; Pastore, M. I Santuari. Guida Agli Itinerari Religiosi Tra Puglia e Basilicata; Di Marsico Libri: Bari, Italy, 2010. [Google Scholar]
- Fioretti, G.; Raneri, S.; Pinto, D.; Mignozzi, M.; Mauro, D. The Archaeological Site of St. Maria Veterana (Triggiano, Southern Italy): Archaeometric Study of the Wall Paintings for the Historical Reconstruction. J. Archaeol. Sci. Rep. 2020, 29, 102080. [Google Scholar] [CrossRef]
- Fioretti, G.; Campobasso, C.; Capotorto, S. Digital Photogrammetry as Tool for Mensiochronological Analysis: The Case of St. Maria Veterana Archaeological Site (Triggiano, Italy). Digit. Appl. Archaeol. Cult. Herit. 2020, 19, e00158. [Google Scholar] [CrossRef]
- Fioretti, G.; Campobasso, C. (Eds.) TRIVIANUM Ricerca, Tutela e Valorizzazione Del Patrimonio Culturale Di Triggiano; Edizione Fondazione Pasquale BAttista: Bari, Italy, 2021. [Google Scholar]
- Fioretti, G.; Acquafredda, P.; Calò, S.; Cinelli, M.; Germanò, G.; Laera, A.; Moccia, A. Study and Conservation of the St. Nicola’s Basilica Mosaics (Bari, Italy) by Photogrammetric Survey: Mapping of Polychrome Marbles, Decorative Patterns and Past Restorations. Stud. Conserv. 2020, 65, 160–171. [Google Scholar] [CrossRef]
- Fioretti, G.; Acciani, A.; Buongiorno, R.; Catella, M.A.; Acquafredda, P. Photogrammetric Survey and 3D Model as Experimental Tool for Mapping of Polychrome Marbles in Artworks: The Case of Two Baroque Altars in Bari (Italy). J. Archit. Conserv. 2019, 25, 90–103. [Google Scholar] [CrossRef]
- Capitanio, D.; Laviano, R.; Menga, A.; Meo-Evoli, N.; Vona, F.; Vurro, F. Intonaci e Pitture Murali dell’ipogeo di san Matteo All’arena, Monopoli (Bari). In Sulle Pitture Murali; Arcadia Ricerche: Marghera-Venezia, Italy, 2005; pp. 1137–1146. [Google Scholar]
- Pinto, D.; Laviano, R.; Bianchi, V. Archaeometric Investigations on Wall Paintings from the Hypogeum of S. Marco (Fasano—Brindisi, Southern Italy). Plinius 2008, 34, 348. [Google Scholar]
- Calia, A.; Giorgi, M.; Quarta, G.; Masieri, M. Le Pitture Della Cripta Del Gonfalone a Tricase (Lecce): Problematiche Stori-Co-Artistiche e Contributo Alla Identificazione Dei Pigmenti Attraverso FRX Portatile. In Proceedings of the BENI CULTURALI IN PUGLIA Dialoghi Multidisciplinari per la Ricerca, la Tutela e la Valorizzazione, Bari, Italy, 16–17 September 2020; pp. 125–132. [Google Scholar]
- Fioretti, G.; Garavelli, A.; Germinario, G.; Pinto, D. Archaeometric Study of Wall Rock Paintings from the Sant’Angelo in Criptis Cave, Santeramo in Colle, Bari: Insights on the Rupestrian Decorative Art in Apulia (Southern Italy). Archaeol. Anthropol. Sci. 2021, 13, 168. [Google Scholar] [CrossRef]
- Calia, A.; Giannotta, M.T. La Tomba Dei Festoni Di Via Crispi A Taranto: Individuazione E Riconoscimento Dei Pigmenti Utilizzati Nelle Pitture; D’Amico, C., Ed.; Pàtron Editore: Bologna, Italy, 2005; pp. 271–278. [Google Scholar]
- Calia, A.; Melica, D.; Quarta, G. I Dipinti Murali Del Tempietto: Materiali Costituenti e Tecniche Esecutive. In Masseria Seppannibale Grande in agro di Fasano (BR); Bertelli, G., Lepore, G., Eds.; Adda Editore: Bari, Italy, 2011; pp. 195–206. [Google Scholar]
- Pinto, D. Analisi di alcuni campioni di intonaco dipinto della cupola orientale. In Masseria Seppannibale Grande in agro di Fasano (BR); Bertelli, G., Lepore, G., Eds.; Adda Editore: Bari, Italy, 2011; pp. 207–209. [Google Scholar]
- De Benedetto, G.E.; Fico, D.; Margapoti, E.; Pennetta, A.; Cassiano, A.; Minerva, B. The Study of the Mural Painting in the 12th Century Monastery of Santa Maria Delle Cerrate (Puglia-Italy): Characterization of Materials and Techniques Used: Study of Painting at the Santa Maria Delle Cerrate Church. J. Raman Spectrosc. 2013, 44, 899–904. [Google Scholar] [CrossRef]
- Fico, D.; Pennetta, A.; Rella, G.; Savino, A.; Terlizzi, V.; De Benedetto, G.E. A Combined Analytical Approach Applied to Medieval Wall Paintings from Puglia (Italy): The Study of Painting Techniques and Its Conservation State: Study of Painting Techniques and Its Conservation State. J. Raman Spectrosc. 2016, 47, 321–328. [Google Scholar] [CrossRef]
- Cheilakou, E.; Troullinos, M.; Koui, M. Identification of Pigments on Byzantine Wall Paintings from Crete (14th Century AD) Using Non-Invasive Fiber Optics Diffuse Reflectance Spectroscopy (FORS). J. Archaeol. Sci. 2014, 41, 541–555. [Google Scholar] [CrossRef]
- Cosentino, A. FORS Spectral Database of Historical Pigments in Different Binders. E-Conser. J. 2014, 2, 54–65. [Google Scholar] [CrossRef]
- Corradini, M.; de Ferri, L.; Pojana, G. Fiber Optic Reflection Spectroscopy–Near-Infrared Characterization Study of Dry Pigments for Pictorial Retouching. Appl. Spectrosc. 2021, 75, 445–461. [Google Scholar] [CrossRef] [PubMed]
- Piccolo, A.; Bonato, E.; Falchi, L.; Lucero-Gómez, P.; Barisoni, E.; Piccolo, M.; Balliana, E.; Cimino, D.; Izzo, F.C. A Comprehensive and Systematic Diagnostic Campaign for a New Acquisition of Contemporary Art—The Case of Natura Morta by Andreina Rosa (1924–2019) at the International Gallery of Modern Art Ca’ Pesaro, Venice. Heritage 2021, 4, 4372–4398. [Google Scholar] [CrossRef]
- Raicu, T.; Zollo, F.; Falchi, L.; Barisoni, E.; Piccolo, M.; Izzo, F.C. Preliminary Identification of Mixtures of Pigments Using the PaletteR Package in R—The Case of Six Paintings by Andreina Rosa (1924–2019) from the International Gallery of Modern Art Ca’ Pesaro, Venice. Heritage 2023, 6, 524–547. [Google Scholar] [CrossRef]
- Elias, M.; Chartier, C.; Prévot, G.; Garay, H.; Vignaud, C. The Colour of Ochres Explained by Their Composition. Mater. Sci. Eng. B 2006, 127, 70–80. [Google Scholar] [CrossRef]
- Lorusso, S.; Natali, A.; Matteucci, C. Colorimetry Applied to the Field of Cultural Heritage: Examples of Study Cases. Conserv. Sci. Cult. Herit. 2007, 7, 187–220. [Google Scholar] [CrossRef]
- Cavaleri, T.; Giovagnoli, A.; Nervo, M. Pigments and Mixtures Identification by Visible Reflectance Spectroscopy. Procedia Chem. 2013, 8, 45–54. [Google Scholar] [CrossRef]
- Galli, A.; Caccia, M.; Bonizzoni, L.; Gargano, M.; Ludwig, N.; Poldi, G.; Martini, M. Deep inside the Color: How Optical Microscopy Contributes to the Elemental Characterization of a Painting. Microchem. J. 2020, 155, 104730. [Google Scholar] [CrossRef]
- Lee, N.R.; Kim, S.J.; Moon, D.H. Non-Invasive Mineral Analysis of Pigments of Wall Paintings in the Sungseonjeon Hall. Geosci. J. 2022, 27, 161–176. [Google Scholar] [CrossRef]
- Fioretti, G.; Clausi, M.; Eramo, G.; Longo, E.; Monno, A.; Pinto, D.; Tempesta, G. A Non-Invasive and Sustainable Characterization of Pigments in Wall Paintings: A Library of Apulian Colors. Heritage 2023, 6, 1567–1593. [Google Scholar] [CrossRef]
- Folk, R.L. Bimodal supermature sandstones. Product of the desert floor. XXIII Internat. Geol. Cong. Proc. 1968, 8, 9–32. [Google Scholar]
- McLAREN, K. XIII—The Development of the CIE 1976 (L* A* B*) Uniform Colour Space and Colour-difference Formula. J. Soc. Dye. Colour. 1976, 92, 338–341. [Google Scholar] [CrossRef]
- Menges, F. Spectragryph—Optical Spectroscopy Software. 2022. Available online: http://www.effemm2.de/spectragryph/ (accessed on 10 February 2023).
- Hradil, D.; Grygar, T.; Hradilová, J.; Bezdička, P. Clay and Iron Oxide Pigments in the History of Painting. Appl. Clay Sci. 2003, 22, 223–236. [Google Scholar] [CrossRef]
- Mastrotheodoros, G.P.; Beltsios, K.G. Pigments—Iron-Based Red, Yellow, and Brown Ochres. Archaeol. Anthropol. Sci. 2022, 14, 35. [Google Scholar] [CrossRef]
- Tomasini, E.; Siracusano, G.; Maier, M.S. Spectroscopic, Morphological and Chemical Characterization of Historic Pigments Based on Carbon. Paths for the Identification of an Artistic Pigment. Microchem. J. 2012, 102, 28–37. [Google Scholar] [CrossRef]
- Kotulanová, E.; Bezdička, P.; Hradil, D.; Hradilová, J.; Švarcová, S.; Grygar, T. Degradation of Lead-Based Pigments by Salt Solutions. J. Cult. Herit. 2009, 10, 367–378. [Google Scholar] [CrossRef]
- Švarcová, S.; Hradil, D.; Hradilová, J.; Čermáková, Z. Pigments—Copper-Based Greens and Blues. Archaeol. Anthropol. Sci. 2021, 13, 190. [Google Scholar] [CrossRef]
- Konta, J. Clay and Man: Clay Raw Materials in the Service of Man. Appl. Clay Sci. 1995, 10, 275–335. [Google Scholar] [CrossRef]
- Hofmann, C.; Rabitsch, S.; Malissa, A.; Aceto, M.; Uhlir, K.; Griesser, M.; Calà, E.; Agostino, A.; Fenoglio, G. The Miniatures of the Vienna Genesis: Colour Identification and Painters’ Palettes. In The Vienna Genesis; Hofmann, C., Ed.; Böhlau Verlag: Wien, Austria, 2020; pp. 201–246. [Google Scholar] [CrossRef]
- Villafana, T.; Edwards, G. Creation and Reference Characterization of Edo Period Japanese Woodblock Printing Ink Colorant Samples Using Multimodal Imaging and Reflectance Spectroscopy. Herit. Sci. 2019, 7, 94. [Google Scholar] [CrossRef]
- Grazia, C.; Buti, D.; Amat, A.; Rosi, F.; Romani, A.; Domenici, D.; Sgamellotti, A.; Miliani, C. Shades of Blue: Non-Invasive Spectroscopic Investigations of Maya Blue Pigments. From Laboratory Mock-Ups to Mesoamerican Codices. Herit. Sci. 2020, 8, 1. [Google Scholar] [CrossRef]
- Aceto, M. Pigments—The Palette of Organic Colourants in Wall Paintings. Archaeol. Anthropol. Sci. 2021, 13, 159. [Google Scholar] [CrossRef]
- Brandi, C. Teoria del Restauro, Rist; Piccola Biblioteca Einaudi Arte, Teatro, Cinema, Musica; Giulio Einaudi: Torino, Italy, 2000. [Google Scholar]


| Colour | Sample | Area | Analysis Methods |
|---|---|---|---|
| Red | R1 | Child’s halo | DM, SPC, FORS |
| R2 | Child’s halo | DM, SPC, FORS, XRF | |
| R3 | Child’s halo | DM, SPC, FORS, XRF | |
| R4 | Virgin’s tunic | DM, SPC, FORS, XRF | |
| R5 | Virgin’s tunic | DM, SPC, FORS | |
| R6 | Flower | DM, SPC, FORS | |
| R7 | Flower | DM, SPC, FORS | |
| R8 | St. Vito’s mantle | DM, SPC, FORS, XRF | |
| R9 | Background | DM, SPC, FORS, XRF | |
| Yellow | Y1 | Tree trunk (St. Sebastiano) | DM, SPC, FORS |
| Y2 | Tree branch (St. Sebastiano) | DM, SPC, FORS, XRF | |
| Y3 | St. Sebastiano’s halo | DM, SPC, FORS | |
| Y4 | Child’s halo | DM, SPC, FORS | |
| Y5 | Virgin’s halo | DM, SPC, FORS | |
| Y6 | Rim of Virgin’s mantle | DM, SPC, FORS, XRF | |
| Y7 | St.Vito’s halo | DM, SPC, FORS | |
| Y8 | Child’s tunic | DM, SPC, FORS | |
| Y9 | Rim of Virgin’s mantle | DM, SPC, FORS | |
| Y10 | Flower | DM, SPC, FORS, XRF | |
| Y11 | Rim of Virgin’s mantle | DM, SPC, FORS, XRF | |
| Fleshy Pink | S1 | St. Sebastiano’s face | DM, SPC, FORS, XRF |
| S2 | Child’s face | DM, SPC, FORS, XRF | |
| S3 | Virgin’s face | DM, SPC, FORS, XRF | |
| S4 | St. Vito’s face | DM, SPC, FORS | |
| S5 | Virgin’s hand | DM, SPC, FORS, XRF | |
| S6 | Child’s hand | DM, SPC, FORS, XRF | |
| S7 | Virgin’s hand | DM, SPC, FORS | |
| S8 | St. Vito’s hand | DM, SPC, FORS | |
| Green | G1 | St. Vito’s tunic | DM, SPC, FORS, XRF |
| G2 | Background | DM, SPC, FORS, XRF | |
| G3 | Background | DM, SPC, FORS | |
| G4 | Background | DM, SPC, FORS | |
| Grey/blue | B1 | Virgin’s mantle | DM, SPC, FORS |
| B2 | Virgin’s mantle | DM, SPC, FORS | |
| B3 | Virgin’s mantle | DM, SPC, FORS, XRF | |
| B4 | Virgin’s veil | DM, SPC, FORS | |
| B5 | Virgin’s mantle | DM, SPC, FORS, XRF | |
| Black | B6 | Neck of St. Vito’s mantle | DM, SPC, FORS, XRF |
| B7 | Decoration of Virgin’s mantle | DM, SPC, FORS | |
| B8 | Rim of Virgin’s mantle | DM, SPC, FORS | |
| B9 | Decoration of Virgin’s mantle | DM, SPC, FORS, XRF | |
| B10 | Arrow (St. Sebastiano) | DM, SPC, FORS | |
| B11 | St. Vito’s boot | DM, SPC, FORS, XRF |
| Colour | Sample | Attribution | Texture | D Moda | Colour | Morphology | |||||||||||
|---|---|---|---|---|---|---|---|---|---|---|---|---|---|---|---|---|---|
| Unpolarised Light | Polarised Light | ||||||||||||||||
| Hue | Saturation | Brightness | Gloss | Hue | Saturation | Brightness | Gloss | Shape | Rounding | Edge | Appearance | ||||||
| Dark red | R1, R2, R3, R4, R5, R6, R7, R8 | Red ochre | bimodal | 25 µm | red | medium-low | low | low | red | medium-low | low | low | massive | rounded | sharp | intact | |
| n.v. | red | medium-low | low | n.v. | red | medium-low | low | n.v. | n.v. | n.v. | n.v. | n.v. | |||||
| Vine black | unimodal | 25 µm | black | medium | medium-high | high | black | low | low | low | tabular | angular | soft | intact | |||
| Pale red | R9 | n.i. | unimodal | n.v. | orange | low | low | n.v. | orange | low | low | n.v. | n.v. | n.v. | n.v. | n.v. | |
| Gold yellow | Y1, Y2, Y3, Y4, Y5, Y6, Y7, Y8, | Yellow ochre | bimodal | n.v. | yellow | low | low | n.v. | yellow | low | low | n.v. | n.v. | n.v. | n.v. | n.v. | |
| 30 µm | yellow | low | low | low | yellow | low | low | low | massive | rounded | sharp | intact | |||||
| Vine black | unimodal | 20 µm | black | medium | medium-high | high | black | low | low | low | tabular | angular | soft | intact | |||
| Dark Yellow | Y9, Y10, Y11 | Massicot | unimodal | <10 µm | yellow | high | high | medium | yellow | high | high | medium | massive | mixed | soft | intact | |
| Yellow | S2, S3, S5, S6, S7 | n.i. | unimodal | 70 µm | brown | medium | low | low | brown | medium | low | low | n.v. | n.v. | n.v. | n.v. | |
| n.i. | unimodal | n.v. | pink | low | low | n.v. | pink | low | low | n.v. | n.v. | n.v. | n.v. | n.v. | |||
| Vine black | unimodal | 20 µm | black | medium | medium-high | high | black | low | low | low | tabular | angular | soft | intact | |||
| Pale yellow | S1, S4, S8 | Vine black | unimodal | 15 µm | black | medium | medium-high | high | black | low | low | low | tabular | angular | soft | intact | |
| Green | G1, G2, G | Green earth | bimodal | n.v. | green | low | medium | n.v. | green | low | low | n.v. | n.v. | n.v. | n.v. | n.v. | |
| 40 µm | green | low | low | low | green | medium | medium | medium | massive | rounded | sharp | intact | |||||
| Yellow ochre | unimodal | 30 µm | yellow | low | low | low | yellow | medium | medium | low | massive | rounded | sharp | intact | |||
| Hematite | unimodal | 100 µm | red | high | high | high | high | high | high | high | massive | rounded | sharp | intact | |||
| Vine black | unimodal | 40 µm | black | medium | medium-high | high | black | low | low | low | tabular | angular | soft | intact | |||
| Pale green | G4 | n.i. | unimodal | n.v. | green | low | low | n.v. | green | low | low | n.v. | n.v. | n.v. | n.v. | n.v. | |
| Grey | B1, B2, B3 | Vine black | unimodal | 15 µm | black | medium | medium-high | high | black | low | low | low | tabular | angular | soft | intact | |
| Yellow ochre | unimodal | 30 µm | yellow | low | low | low | yellow | low | low | low | massive | rounded | sharp | intact | |||
| Grey-blue | B4, B5 | Vine black | unimodal | 25 µm | black | medium | medium-high | high | black | low | low | low | tabular | angular | soft | intact | |
| n.i. | unimodal | n.v. | blue | medium | low | low | blue | medium | low | medium | n.v. | n.v. | n.v. | n.v. | |||
| Black | B6, B7, B8, B9, B10, B11 | Vine black | unimodal | 30 µm | black | medium | medium-high | high | black | low | low | low | tabular | angular | soft | intact | |
| Colour | Sample | L* | L* st. Dev. | a* | a* st. Dev. | b* | b* st. Dev. |
|---|---|---|---|---|---|---|---|
| Red | R1 | 41.111 | 0.317 | 20.185 | 0.316 | 17.467 | 0.245 |
| R2 | 43.300 | 0.174 | 20.510 | 0.067 | 18.996 | 0.084 | |
| R3 | 39.455 | 0.341 | 19.757 | 0.167 | 17.119 | 0.230 | |
| R4 | 40.224 | 0.271 | 24.914 | 0.162 | 20.233 | 0.217 | |
| R5 | 43.237 | 0.301 | 21.100 | 0.149 | 18.041 | 0.206 | |
| R6 | 40.938 | 0.208 | 18.445 | 0.184 | 16.138 | 0.127 | |
| R7 | 38.921 | 0.179 | 13.640 | 0.154 | 12.286 | 0.081 | |
| R8 | 46.902 | 0.253 | 16.431 | 0.147 | 14.261 | 0.119 | |
| R9 | 55.585 | 0.107 | 9.016 | 0.037 | 15.787 | 0.010 | |
| Yellow | Y1 | 55.472 | 0.190 | 8.652 | 0.153 | 20.371 | 0.134 |
| Y2 | 51.056 | 0.100 | 13.086 | 0.063 | 27.622 | 0.025 | |
| Y3 | 58.849 | 0.217 | 8.666 | 0.175 | 22.412 | 0.018 | |
| Y4 | 54.662 | 0.231 | 11.587 | 0.151 | 27.215 | 0.148 | |
| Y5 | 59.172 | 0.147 | 16.153 | 0.051 | 35.371 | 0.143 | |
| Y6 | 51.434 | 0.227 | 15.663 | 0.073 | 31.756 | 0.274 | |
| Y7 | 58.589 | 0.239 | 9.646 | 0.185 | 20.954 | 0.064 | |
| Y8 | 58.240 | 0.189 | 11.909 | 0.052 | 30.956 | 0.139 | |
| Y9 | 62.909 | 0.277 | 8.700 | 0.201 | 23.240 | 0.132 | |
| Y10 | 51.473 | 0.117 | 8.647 | 0.025 | 21.981 | 0.012 | |
| Y11 | 62.487 | 0.127 | 8.754 | 0.024 | 23.890 | 0.285 | |
| Fleshy pink | S1 | 77.013 | 0.196 | 3.725 | 0.050 | 15.876 | 0.020 |
| S2 | 61.776 | 0.194 | 6.991 | 0.056 | 19.109 | 0.061 | |
| S3 | 62.322 | 0.143 | 6.681 | 0.017 | 22.512 | 0.032 | |
| S4 | 74.226 | 0.134 | 3.835 | 0.088 | 14.306 | 0.011 | |
| S5 | 65.641 | 0.330 | 8.237 | 0.303 | 22.791 | 0.098 | |
| S6 | 62.013 | 0.191 | 7.158 | 0.026 | 21.194 | 0.103 | |
| S7 | 70.405 | 0.263 | 4.496 | 0.169 | 19.479 | 0.077 | |
| S8 | 80.846 | 0.114 | 2.998 | 0.030 | 12.332 | 0.004 | |
| Green | G1 | 54.743 | 0.170 | 2.929 | 0.075 | 17.233 | 0.054 |
| G2 | 44.432 | 0.272 | 1.639 | 0.078 | 15.822 | 0.156 | |
| G3 | 47.157 | 0.330 | 1.128 | 0.058 | 14.872 | 0.179 | |
| G4 | 63.925 | 0.222 | 2.744 | 0.136 | 19.487 | 0.118 | |
| Blue-grey | B1 | 62.030 | 0.247 | 1.413 | 0.171 | 7.675 | 0.036 |
| B2 | 55.858 | 0.329 | 1.989 | 0.242 | 9.303 | 0.105 | |
| B3 | 52.117 | 0.368 | 2.226 | 0.209 | 11.481 | 0.145 | |
| B4 | 42.595 | 0.158 | −0.185 | 0.093 | 8.270 | 0.055 | |
| B5 | 40.857 | 0.237 | −0.035 | 0.007 | 4.880 | 0.065 | |
| Black | B6 | 44.190 | 0.117 | 0.736 | 0.016 | 3.420 | 0.018 |
| B7 | 33.855 | 0.084 | −0.002 | 0.004 | 3.156 | 0.035 | |
| B8 | 30.658 | 0.454 | 0.176 | 0.082 | 2.733 | 0.053 | |
| B9 | 34.367 | 0.854 | 1.042 | 0.151 | 5.281 | 0.299 | |
| B10 | 33.825 | 0.181 | 0.333 | 0.123 | 2.017 | 0.038 | |
| B11 | 33.661 | 0.179 | 0.269 | 0.073 | 1.042 | 0.035 |
| Color | Sample | FORS Spectral Features | Attribution | References |
|---|---|---|---|---|
| Red1 | R1, R2, R3, R4, R5, R6, R7, R8, R9 | ~750 nm (max); absorption after ~800 nm | Red ochre | [20,29] |
| Yellow 1 | Y1, Y2, Y3, Y4, Y5, Y6, Y7, Y8, | ~770 nm (max) | Yellow ochre | [20,29] |
| Yellow 2 | Y9, Y10, Y11 | ~525 nm (i.p.) | Yellow ochre + massicot or lead-tin yellow | [20,29] |
| Fleshy pink 1 | S2, S3, S5, S6, S7 | ~770 nm (max) | Yellow ochre | [20,29] |
| Fleshy pink 2 | S1, S4, S8 | flat spectrum | - | - |
| Green | G1, G2, G3 | ~570 nm (max); ~750 nm (max) | Green earth + yellow ochre | [20,29,39] |
| Grey 1 | B1, B2, B3 | flat spectrum | - | - |
| Grey 2 | B4, B5 | 600–800 nm (absorption band) | Indigo dye | [40,41] |
| Black | B6, B7, B8, B9, B10, B11 | flat spectrum | - | - |
| Colour | Sample | XRF | Attribution |
|---|---|---|---|
| Red | R2, R3, R4, R8, R9 | Ca (+), Fe (+), K (tr), Ti (tr), Pb (tr) | Red ochre |
| Yellow 1 | Y2, Y6, Y10 | Ca (+), Fe (−), K (tr), Ti (tr), Pb (tr) | Yellow ochre |
| Yellow 2 | Y11 | Pb (+), Ca (+), Sn (−), Fe (−), K (tr), Ti (tr) | Massicot + yellow ochre + lead tin yellow |
| Fleshy pink 1 | S2, S3, S5, S6 | Ca (+), Fe (−), K (tr), Pb (tr) | Yellow ochre |
| Fleshy pink 2 | S1 | Ca (+), Fe (tr), K (tr), Pb (tr) | no mineral pigment identified |
| Green | G1, G2 | Ca (+), Fe (−), K (tr), Ti (tr), Pb (tr) | Green earth |
| Grey 1 | B3 | Ca (+), Fe (tr), K (tr), Pb (tr) | no mineral pigment identified |
| Grey 2 | B5 | Ca (+), Fe (tr), K (tr), Pb (tr) | no mineral pigment identified |
| Black | B6, B9, B11 | Ca (+), Fe (tr), K (tr) | no mineral pigment identified |
Disclaimer/Publisher’s Note: The statements, opinions and data contained in all publications are solely those of the individual author(s) and contributor(s) and not of MDPI and/or the editor(s). MDPI and/or the editor(s) disclaim responsibility for any injury to people or property resulting from any ideas, methods, instructions or products referred to in the content. |
© 2023 by the authors. Licensee MDPI, Basel, Switzerland. This article is an open access article distributed under the terms and conditions of the Creative Commons Attribution (CC BY) license (https://creativecommons.org/licenses/by/4.0/).
Share and Cite
Fioretti, G.; Campobasso, C.; Eramo, G.; Monno, A.; Tempesta, G. On Devotional Artworks: A Non-Invasive Characterization of Pigments of the Madonna della Croce Wall Painting in Triggiano (Bari, Southern Italy). Heritage 2023, 6, 4263-4281. https://doi.org/10.3390/heritage6050225
Fioretti G, Campobasso C, Eramo G, Monno A, Tempesta G. On Devotional Artworks: A Non-Invasive Characterization of Pigments of the Madonna della Croce Wall Painting in Triggiano (Bari, Southern Italy). Heritage. 2023; 6(5):4263-4281. https://doi.org/10.3390/heritage6050225
Chicago/Turabian StyleFioretti, Giovanna, Cinzia Campobasso, Giacomo Eramo, Alessandro Monno, and Gioacchino Tempesta. 2023. "On Devotional Artworks: A Non-Invasive Characterization of Pigments of the Madonna della Croce Wall Painting in Triggiano (Bari, Southern Italy)" Heritage 6, no. 5: 4263-4281. https://doi.org/10.3390/heritage6050225