

Usability Evaluation with Eye Tracking: The Case of a Mobile Augmented Reality Application with Historical Images for Urban Cultural Heritage

Abstract
:1. Introduction
2. Theoretical Background
2.1. Usability Testing
2.2. Eye Tracking
2.3. Augmented Reality
2.4. Usability Testing with Eye Tracking for Augmented Reality
3. Materials
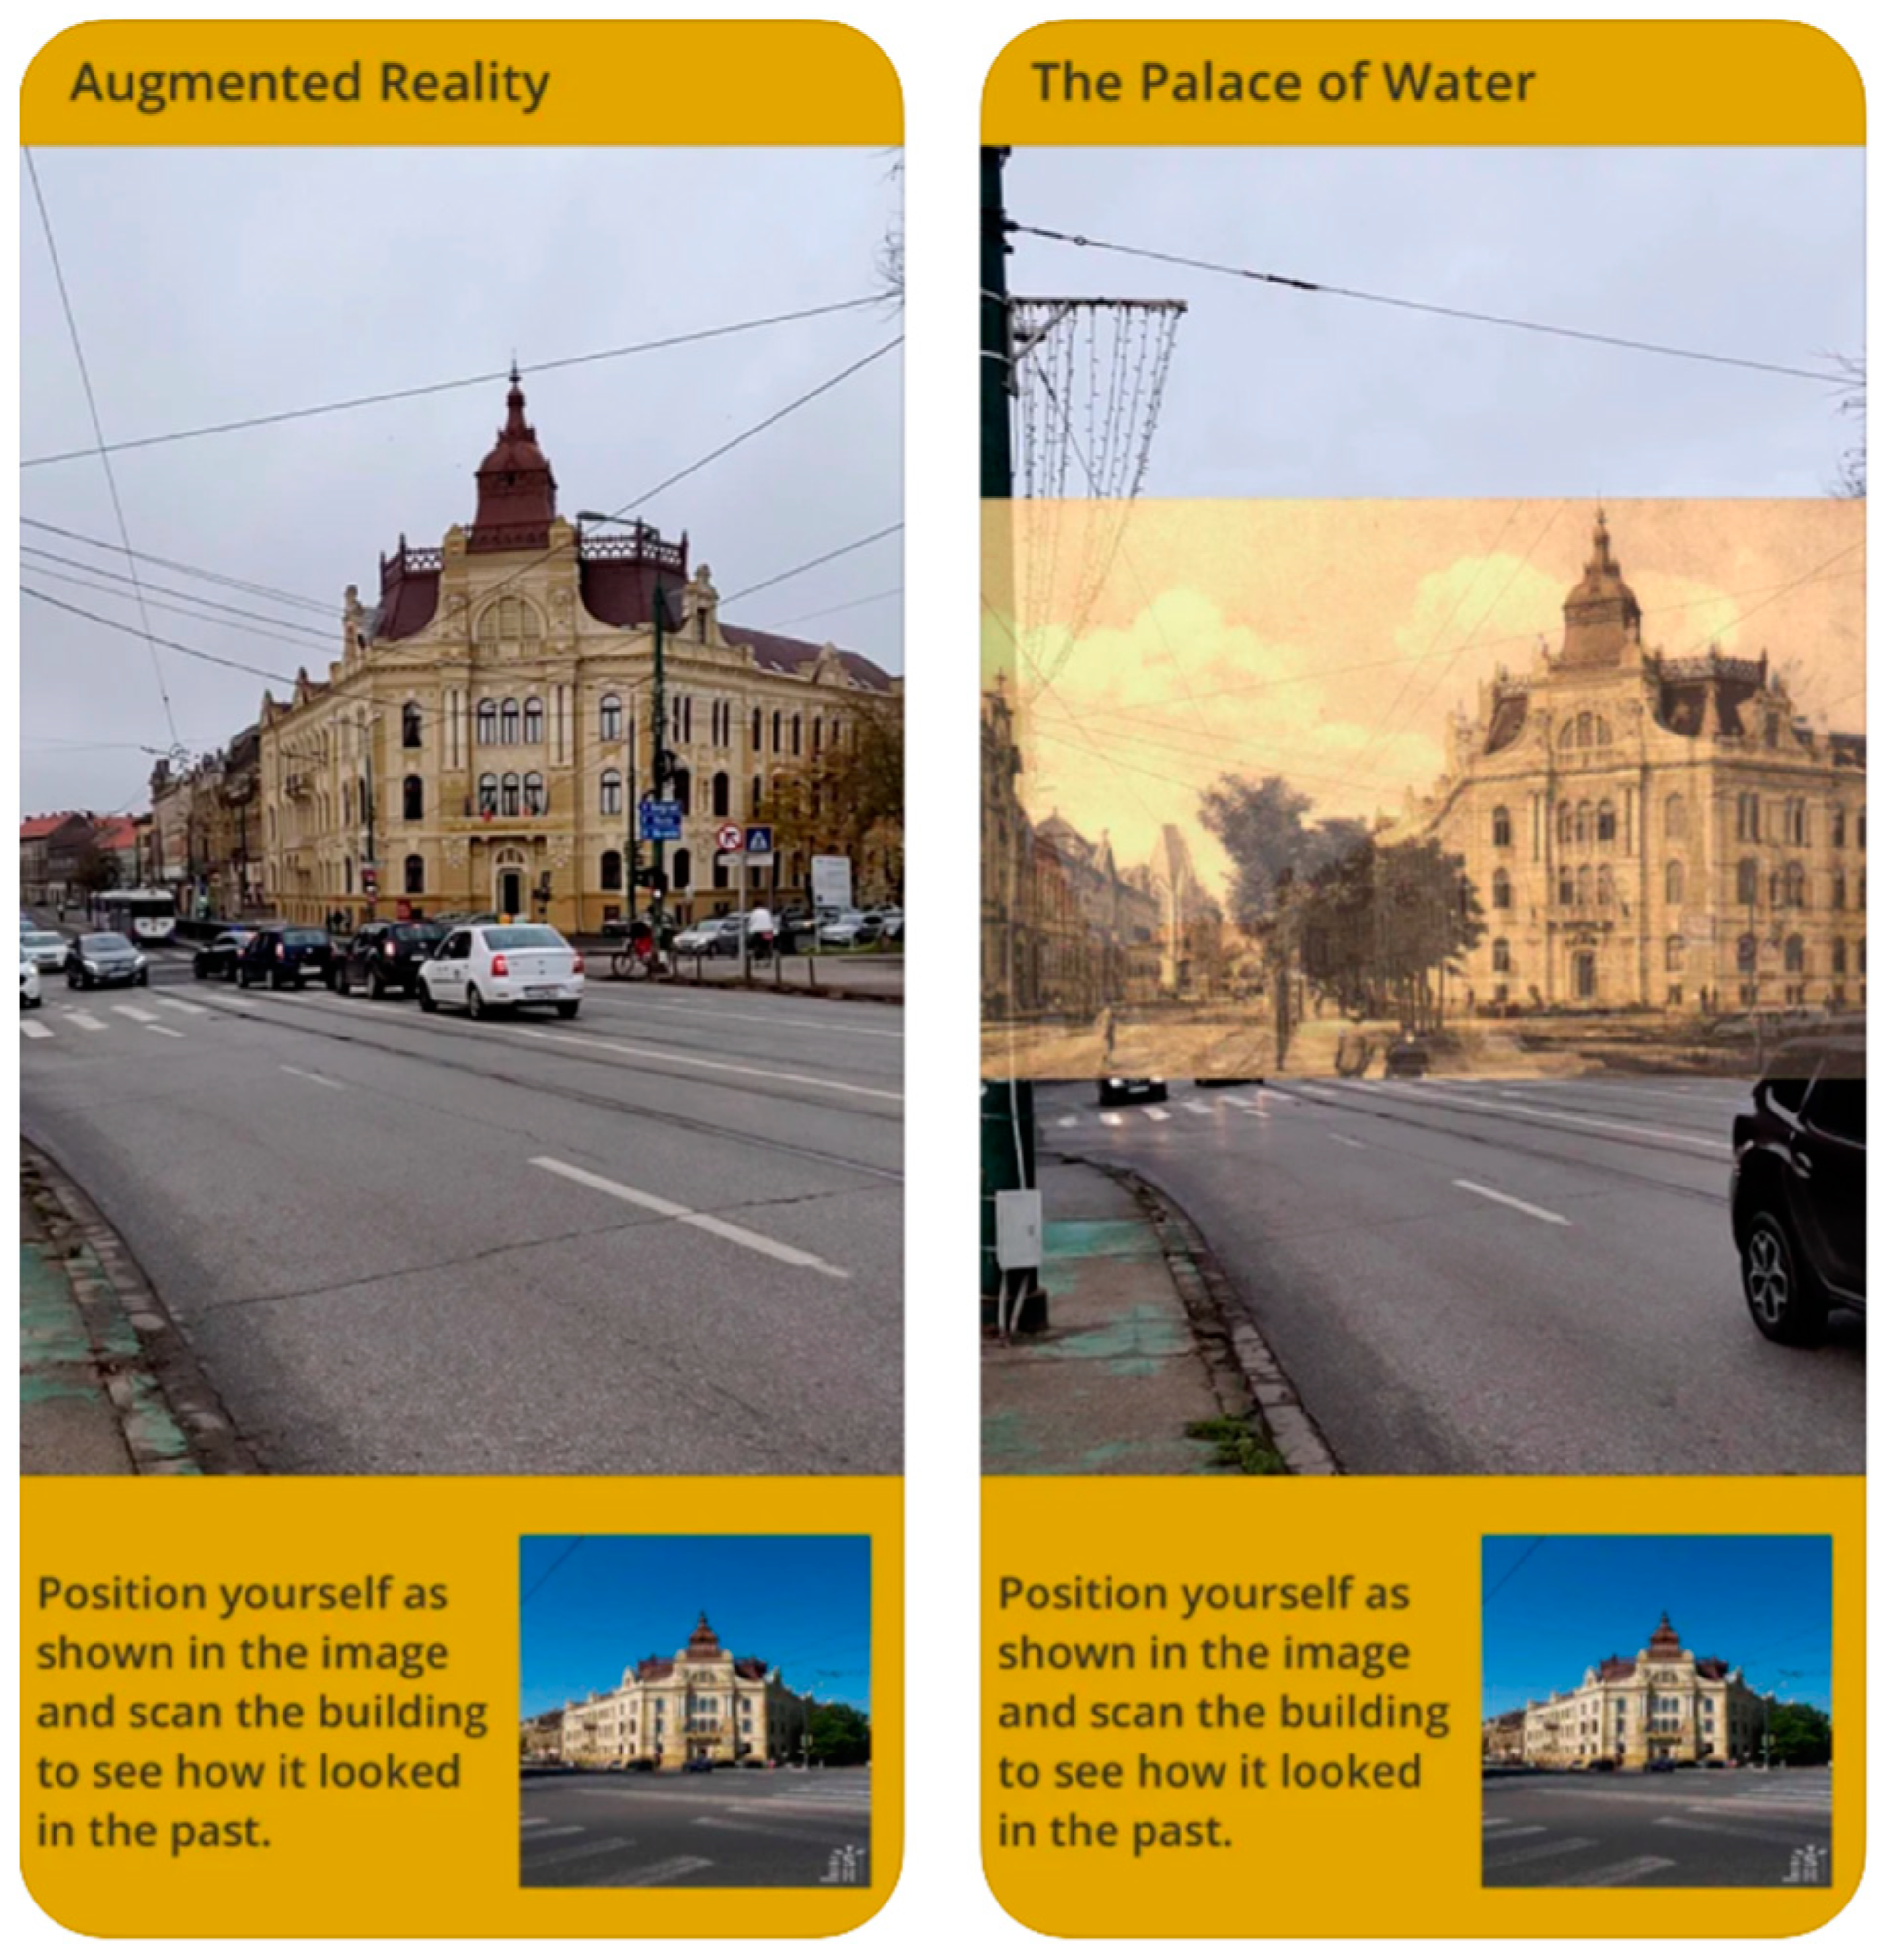
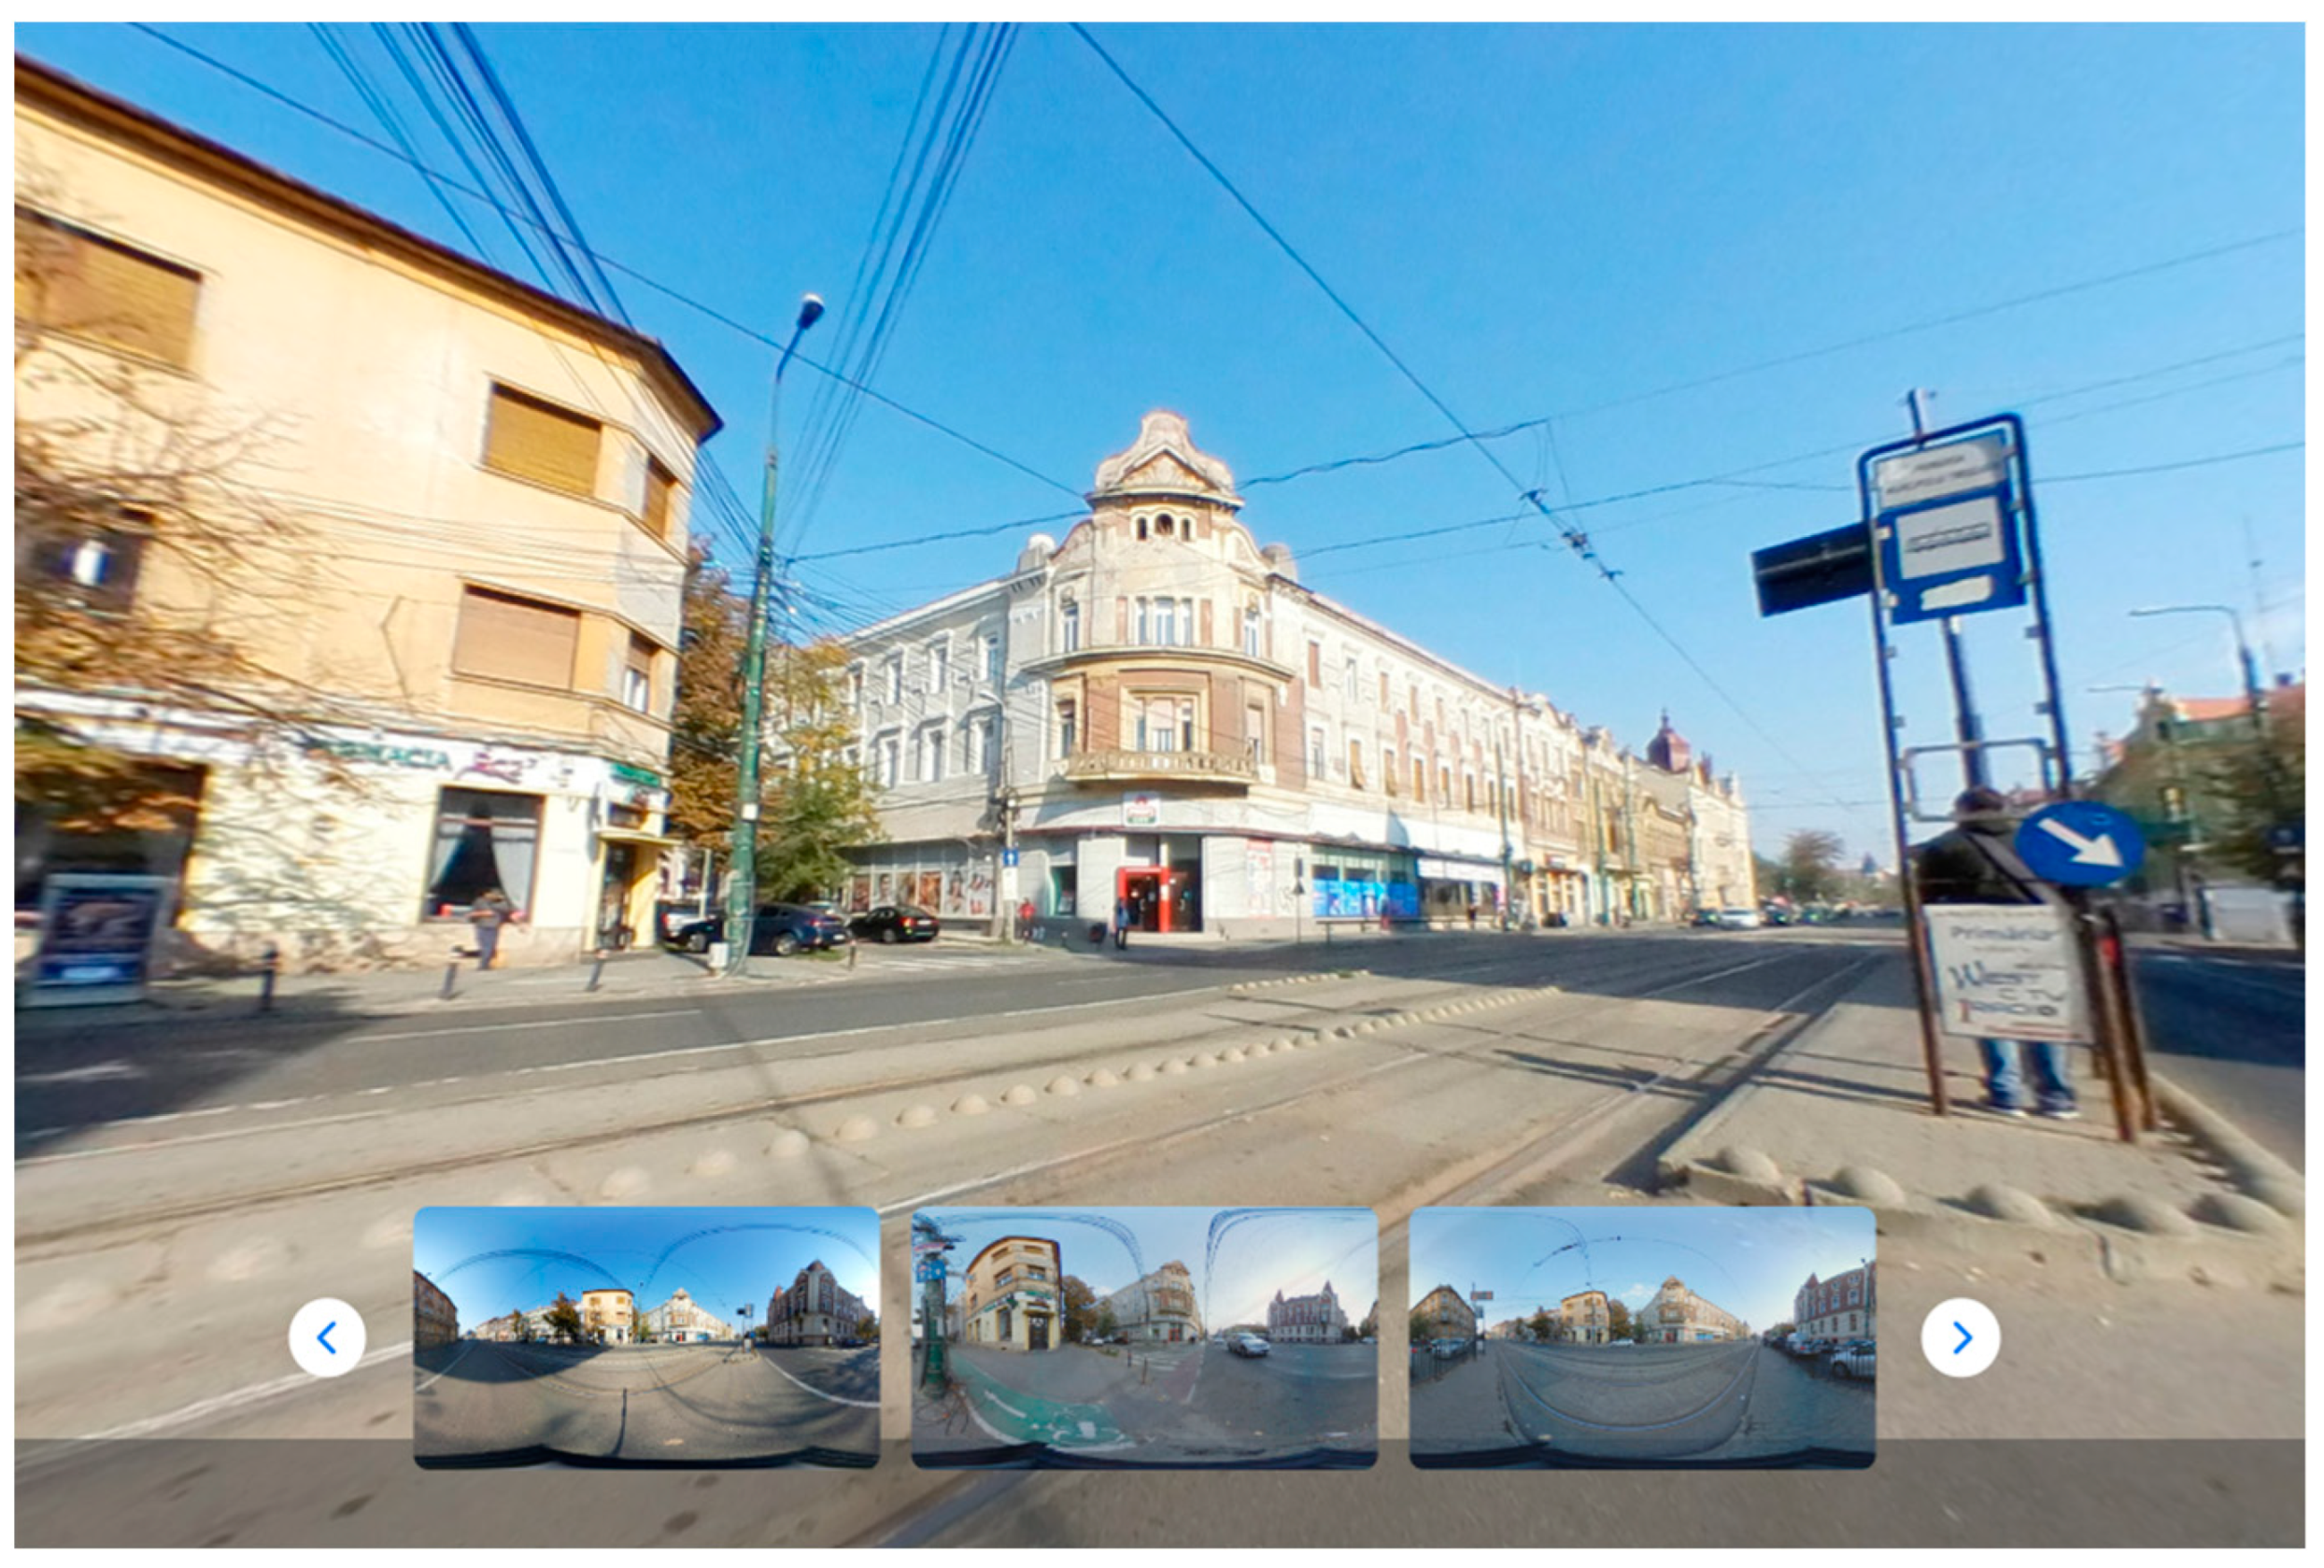
3.1. The Spotlight Timisoara AR App
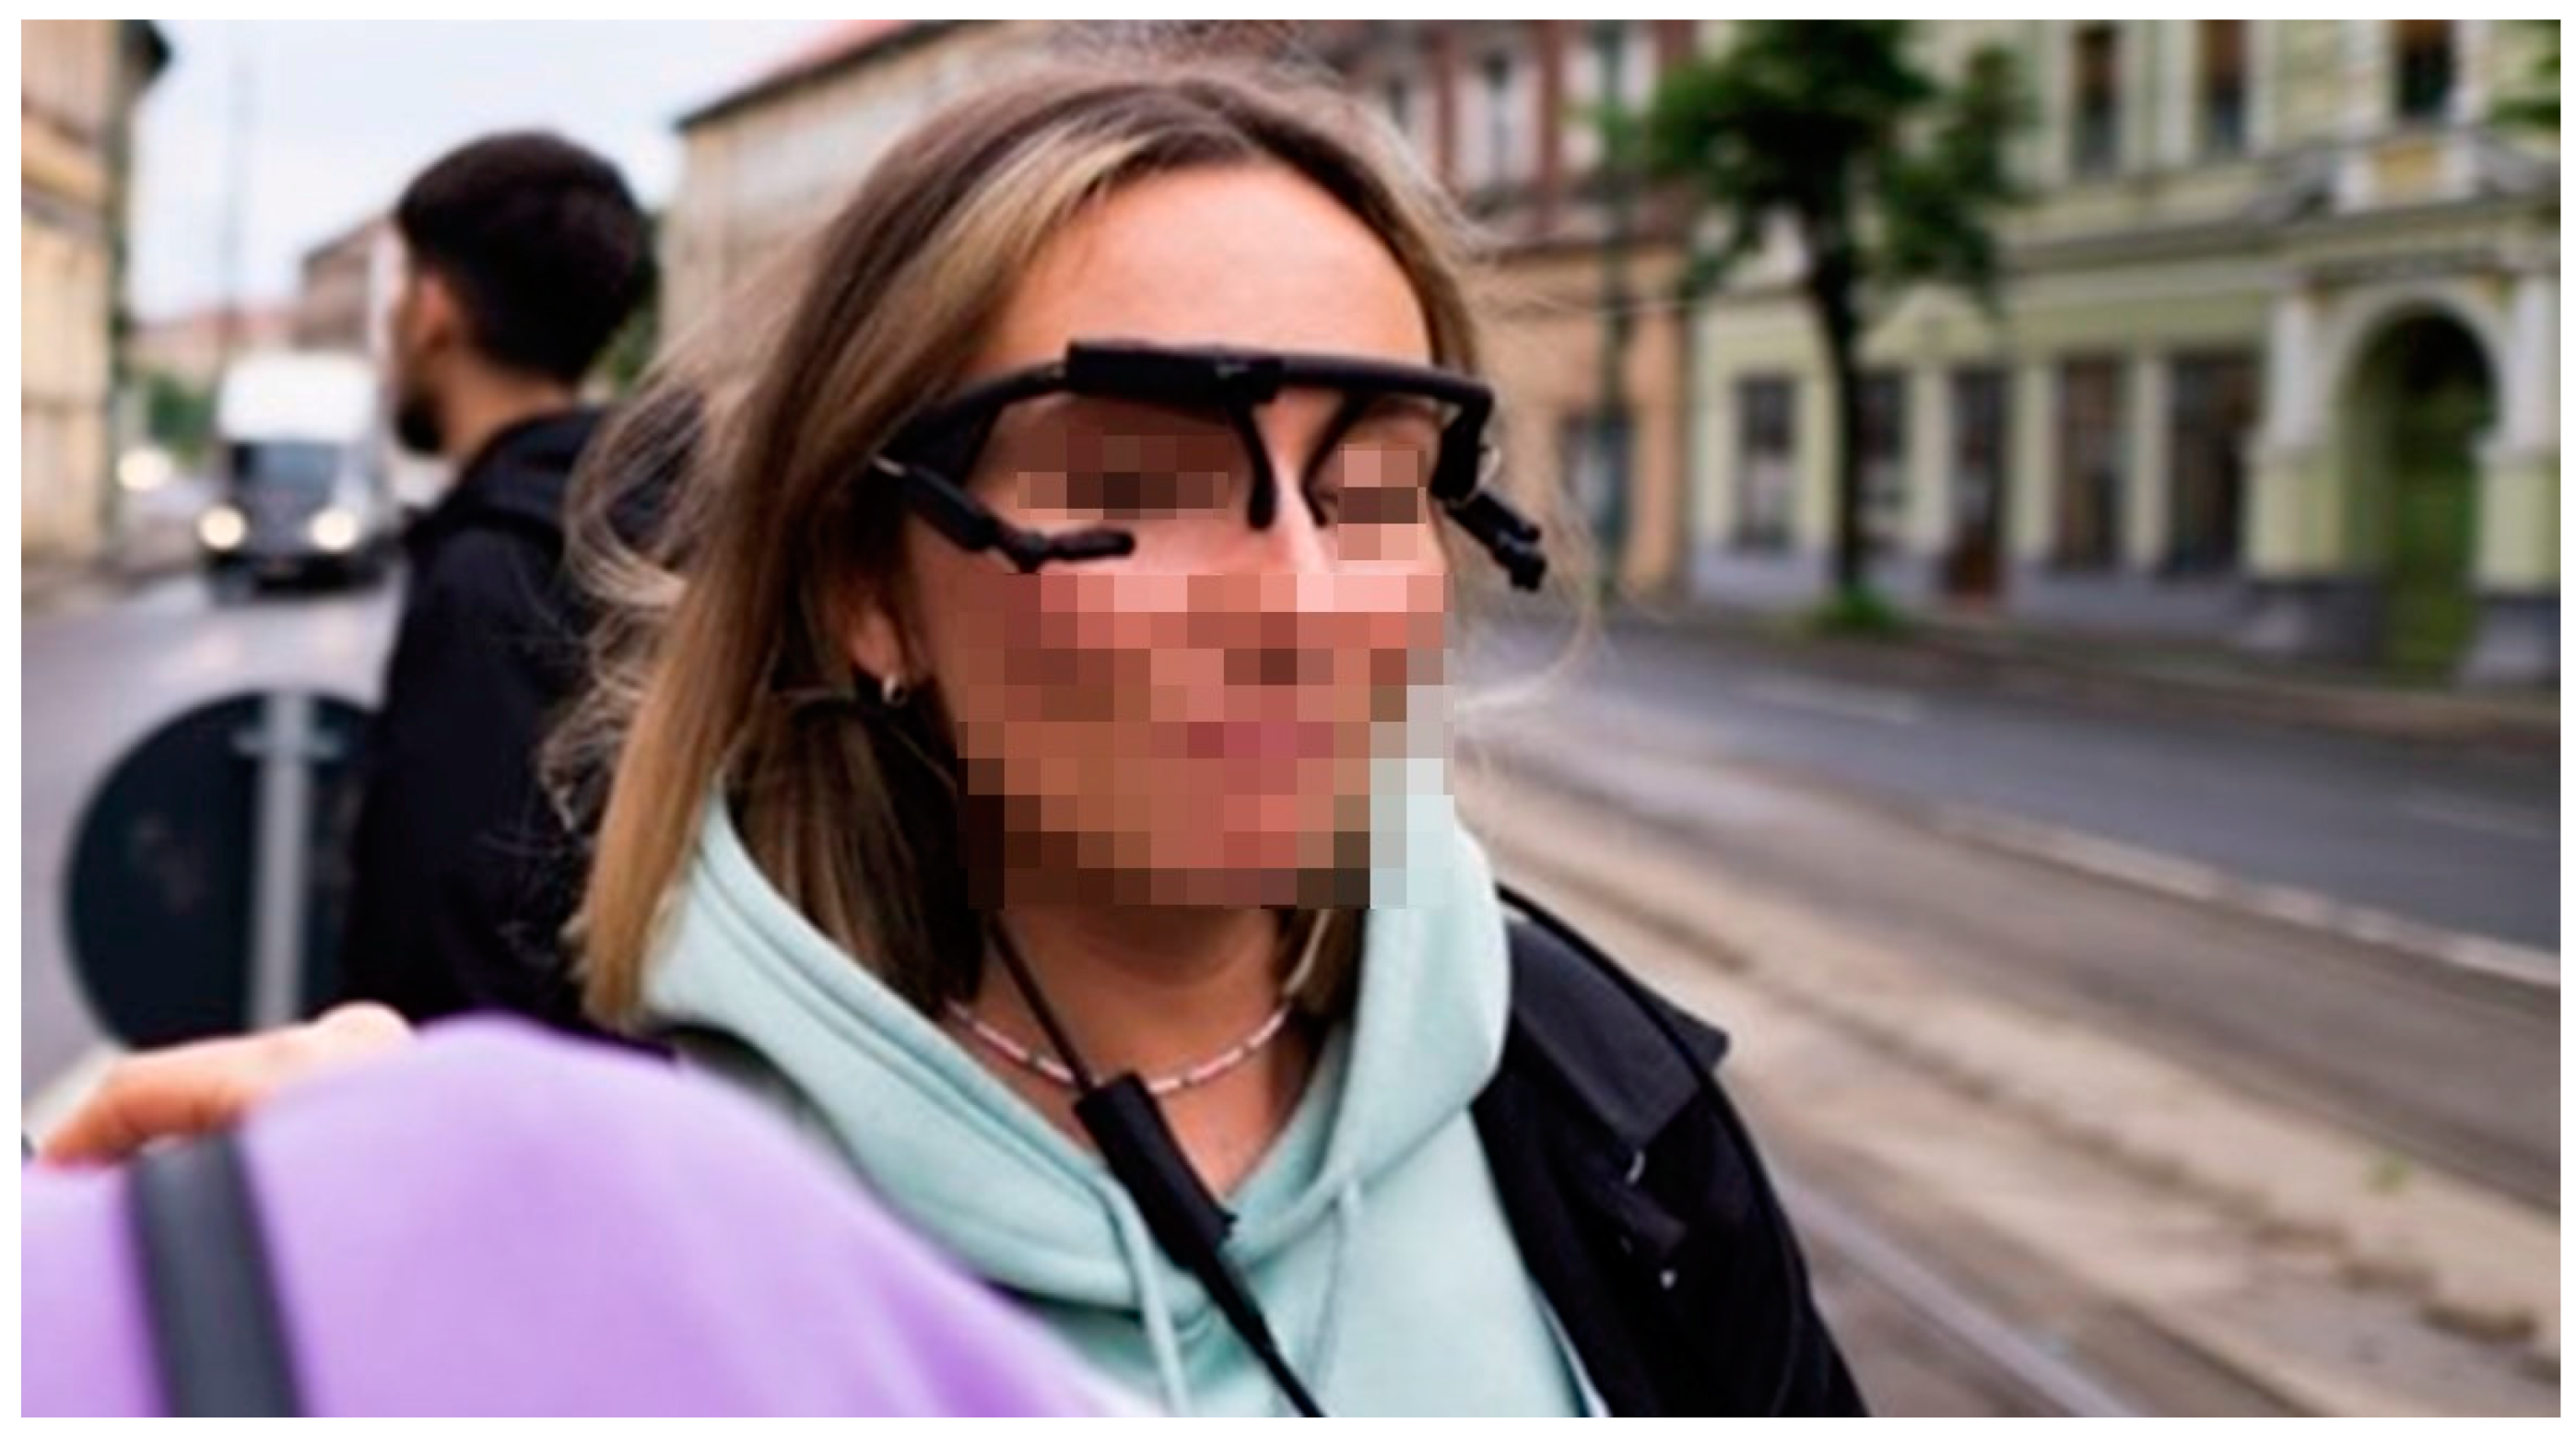
3.2. Pupil Core Eye Tracker
4. Methodology
4.1. Participants
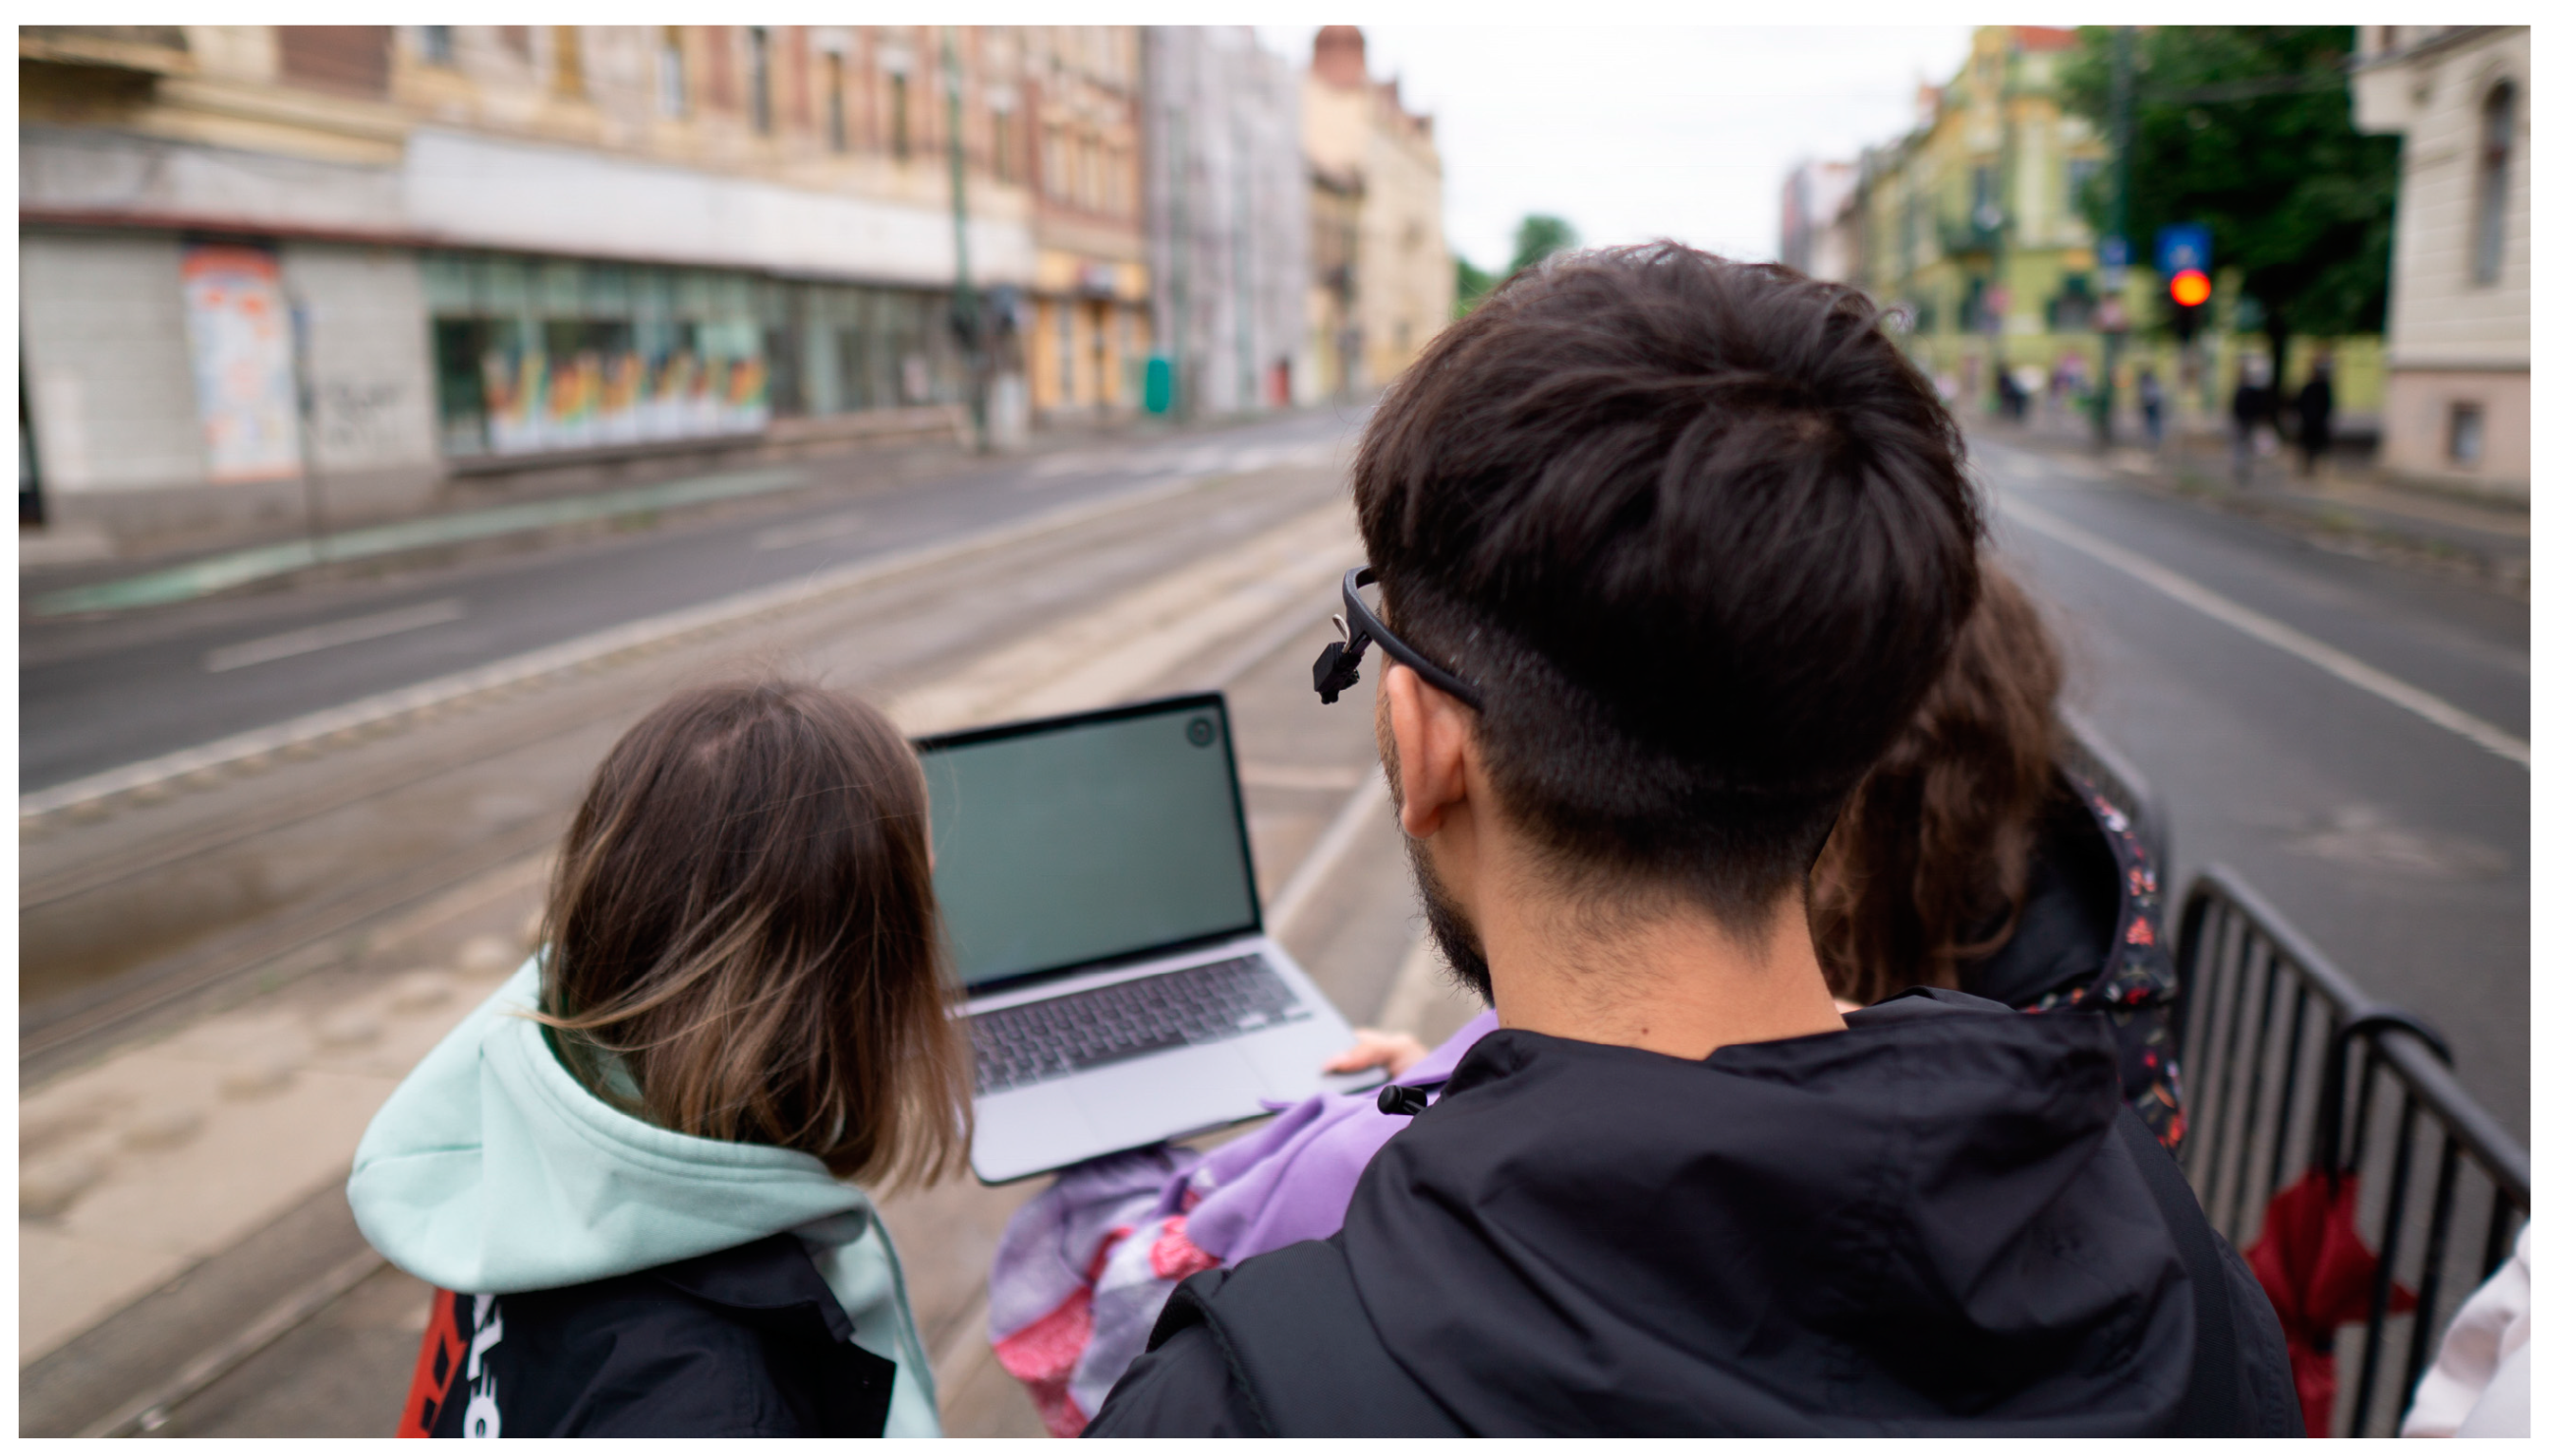
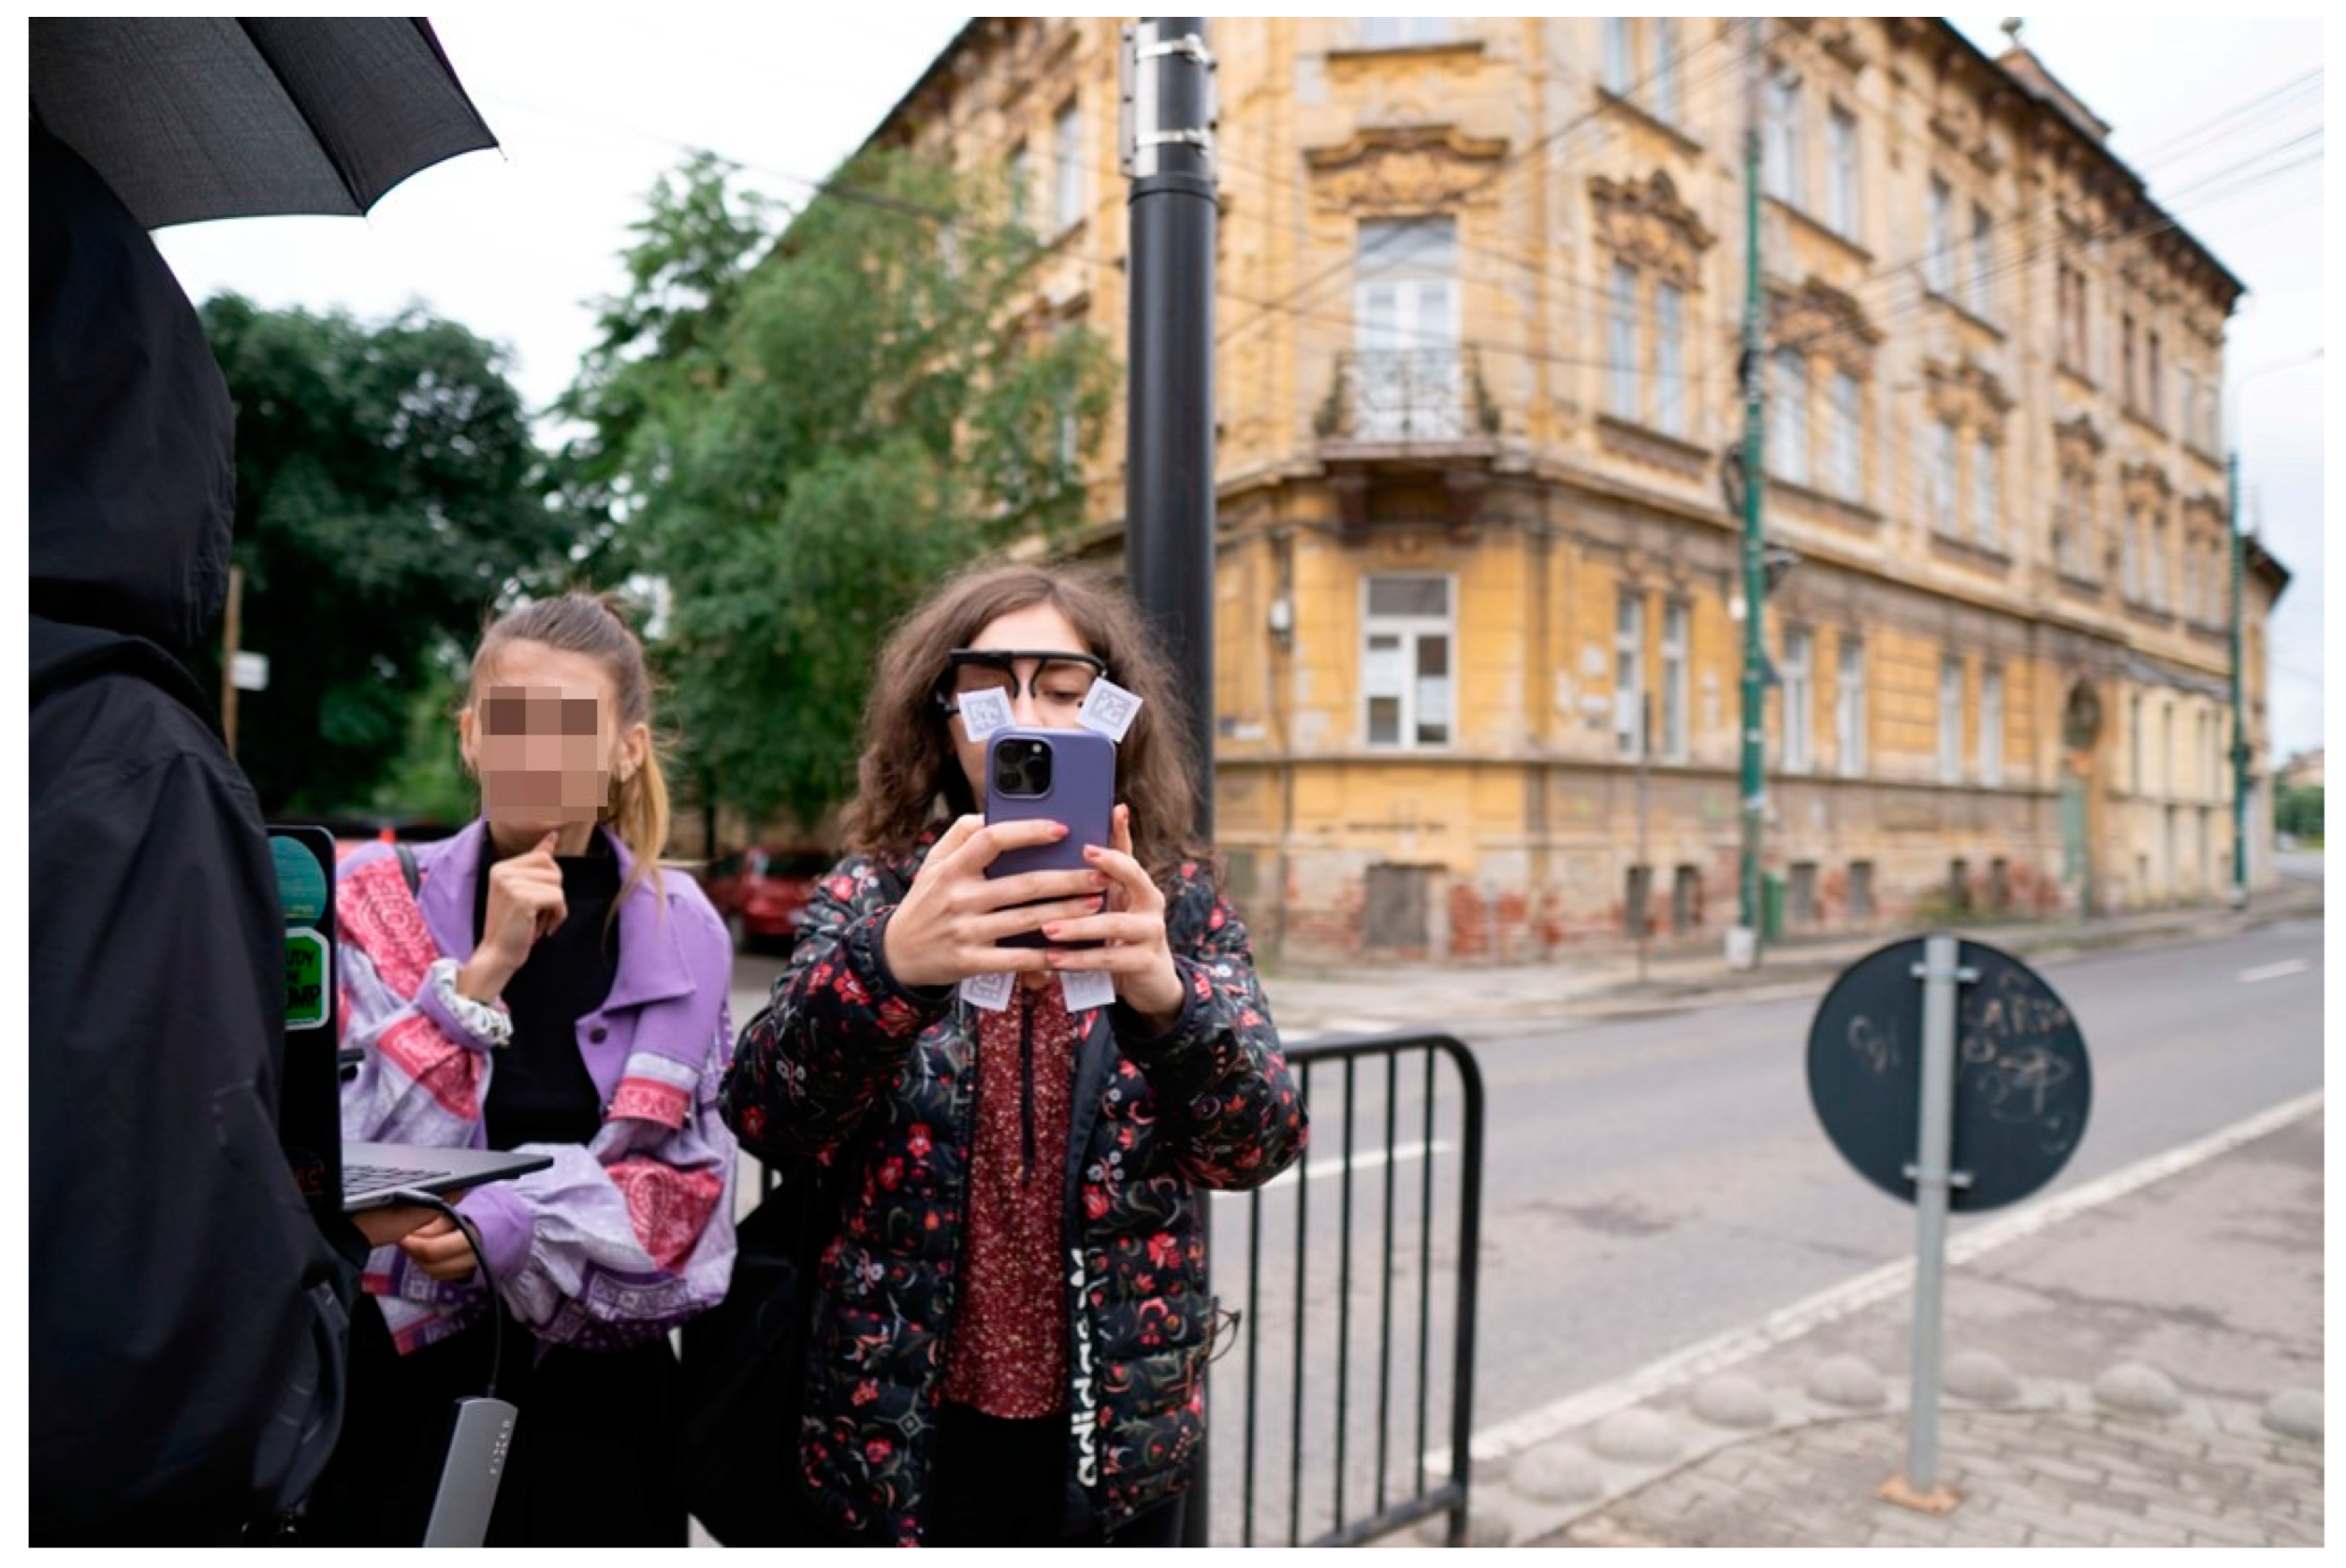
4.2. Procedure
5. Results
5.1. User Testing Results
5.2. SUS Questionnaire Results
5.3. Product Reaction Cards Method Results
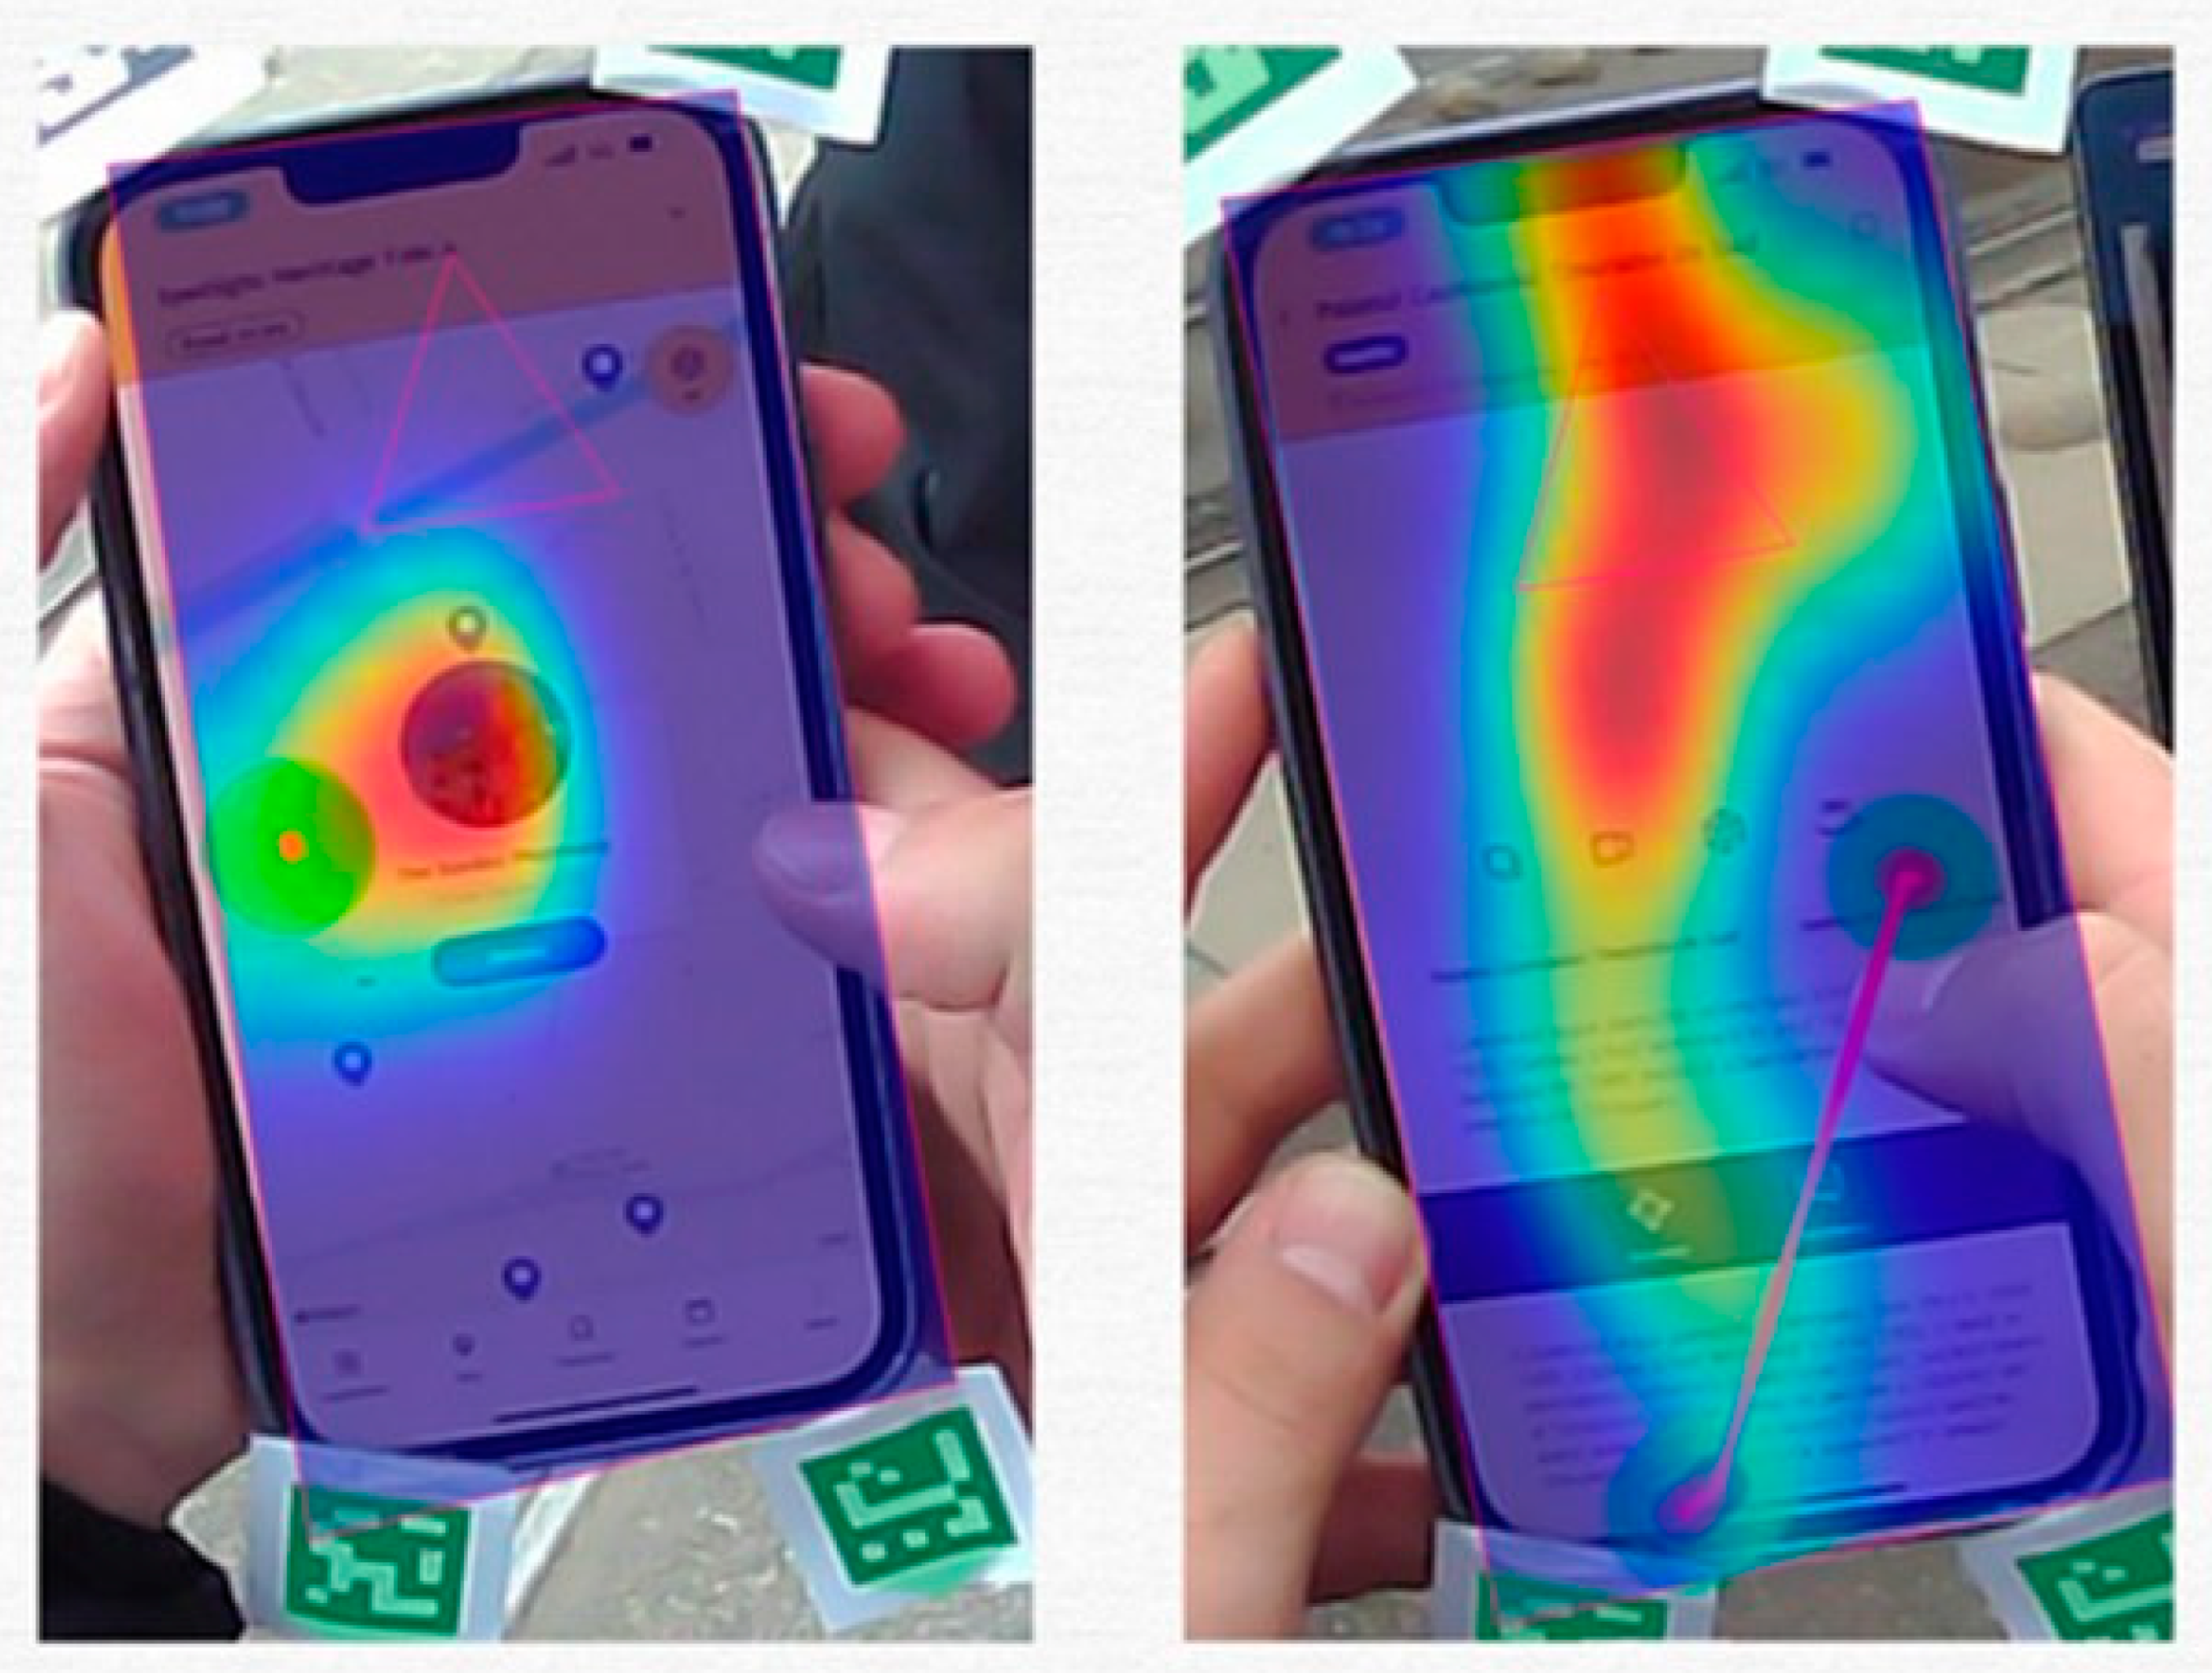
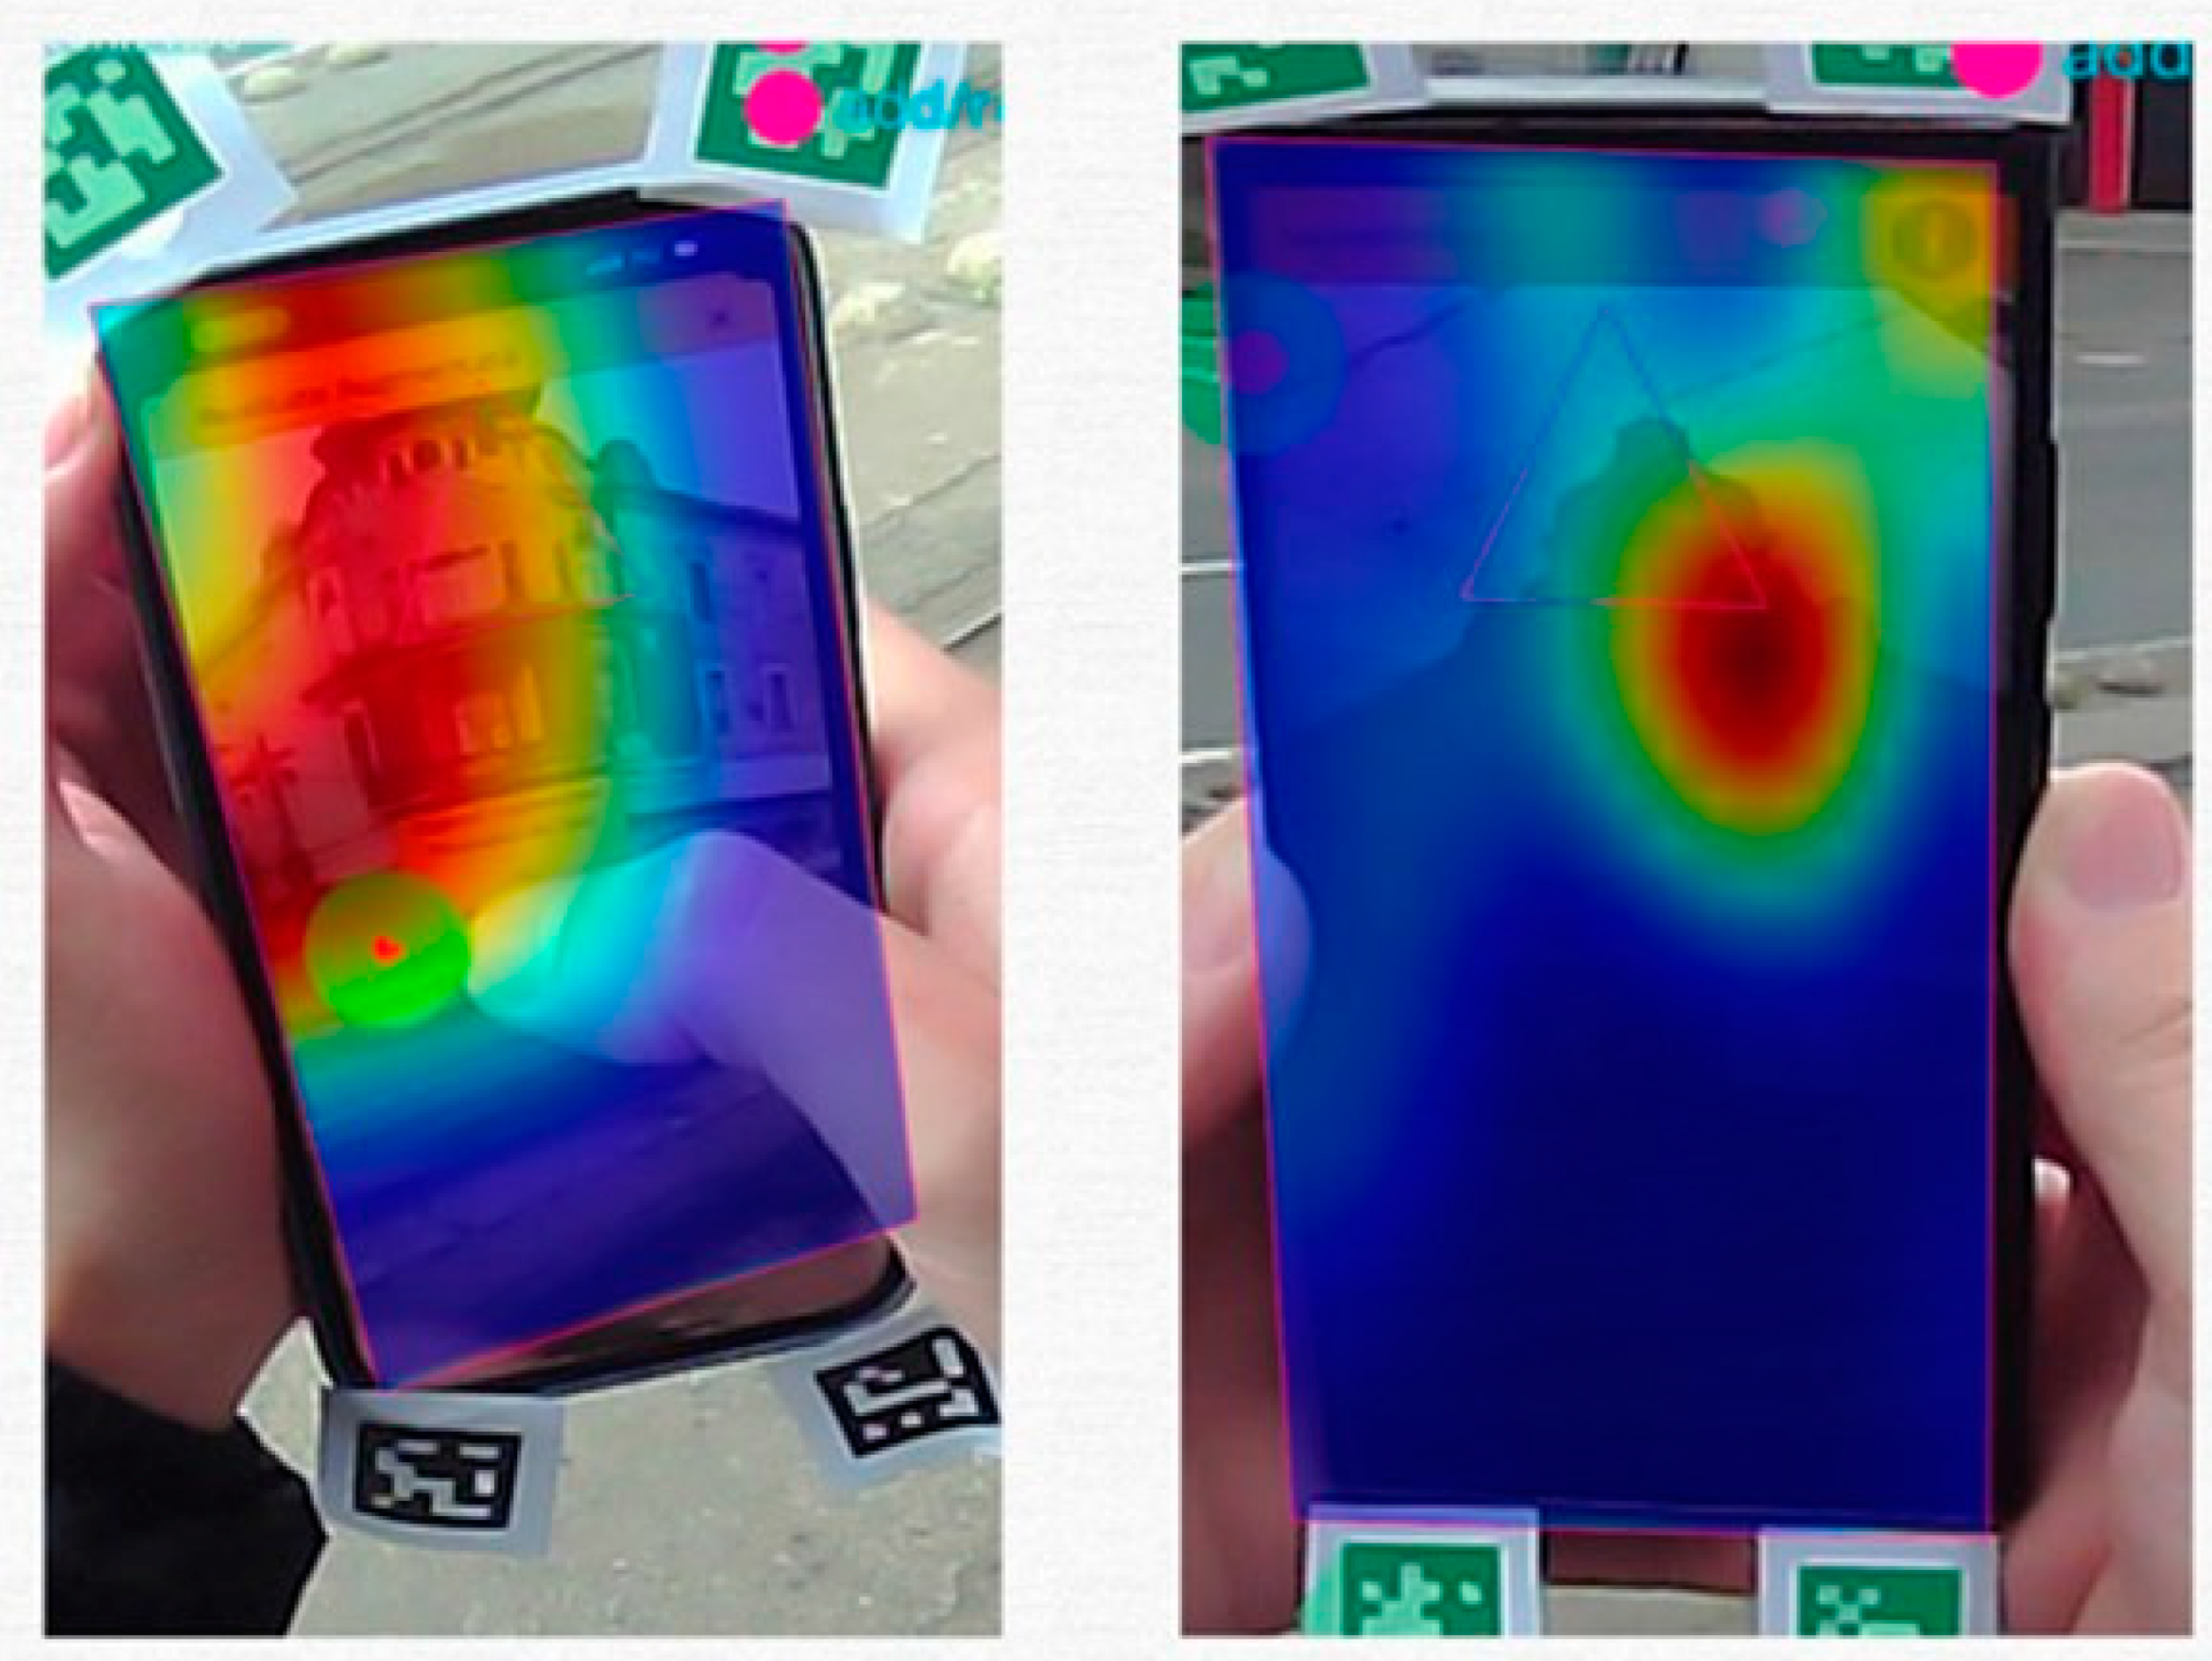
5.4. Eye-Tracking Results
6. Discussions
6.1. Interpretation of the Results
6.2. Threats to the Validity of the Study
7. Conclusions
Author Contributions
Funding
Institutional Review Board Statement
Informed Consent Statement
Data Availability Statement
Acknowledgments
Conflicts of Interest
References
- Boboc, R.G.; Băutu, E.; Gîrbacia, F.; Popovici, N.; Popovici, D.-M. Augmented Reality in Cultural Heritage: An Overview of the Last Decade of Applications. Appl. Sci. 2022, 12, 9859. [Google Scholar] [CrossRef]
- Tiriteu, D.; Vert, S. Usability Testing of Mobile Augmented Applications for Cultural Heritage—A Systematic Literature Review. In Proceedings of the Rochi-International Conference on Human-Computer Interaction, Online, 22–23 October 2020; pp. 137–144. [Google Scholar] [CrossRef]
- Vert, S.; Andone, D.; Ternauciuc, A.; Mihaescu, V.; Rotaru, O.; Mocofan, M.; Orhei, C.; Vasiu, R. User Evaluation of a Multi-Platform Digital Storytelling Concept for Cultural Heritage. Mathematics 2021, 9, 2678. [Google Scholar] [CrossRef]
- Goldberg, J.H.; Wichansky, A.M. Eye tracking in usability evaluation: A practitioner’s guide. In The Mind’s Eye; Elsevier: Amsterdam, The Netherlands, 2003; pp. 493–516. [Google Scholar]
- Naspetti, S.; Pierdicca, R.; Mandolesi, S.; Paolanti, M.; Frontoni, E.; Zanoli, R. Automatic Analysis of Eye-Tracking Data for Augmented Reality Applications: A Prospective Outlook. In Augmented Reality, Virtual Reality, and Computer Graphics; Springer: Cham, Switzerland, 2016; pp. 217–230. [Google Scholar] [CrossRef]
- Josephson, S.; Myers, M. Augmented Reality Through the Lens of Eye Tracking. Vis. Commun. Q. 2019, 26, 208–222. [Google Scholar] [CrossRef]
- Hussain, A.; Mkpojiogu, E.; Musa, J.; Mortada, S. A User Experience Evaluation of Amazon Kindle Mobile Application. AIP Conf. Proc. 1891, 2017, 020060. [Google Scholar] [CrossRef] [Green Version]
- Eccles, D.; Arsal, G. The think aloud method: What is it and how do I use it? Qual. Res. Sport Exerc. Health 2017, 9, 514–531. [Google Scholar] [CrossRef]
- Bangor, A.; Kortum, P.; Miller, J. Determining what individual SUS scores mean: Adding an adjective rating scale. J. Usability Stud. 2009, 4, 114–123. [Google Scholar]
- Product Reaction Card—An Overview | ScienceDirect Topics. Available online: https://www.sciencedirect.com/topics/computer-science/product-reaction-card (accessed on 22 November 2022).
- Hutton, S. Eye Tracking Terminology—Eye Movements. SR Research Website. 2 July 2020. Available online: https://www.sr-research.com/eye-tracking-blog/background/eye-tracking-terminology-eye-movements/ (accessed on 10 August 2022).
- Burr, D.C.; Morrone, M.C.; Ross, J. Selective suppression of the magnocellular visual pathway during saccadic eye movements. Nature 1994, 371, 511–513. [Google Scholar] [CrossRef] [PubMed]
- Learn about the Different Types of Eye Movement—Tobii Pro. 6 August 2015. Available online: https://www.tobiipro.com/learn-and-support/learn/eye-tracking-essentials/types-of-eye-movements/ (accessed on 10 August 2022).
- Wang, J.; Antonenko, P.; Celepkolu, M.; Jimenez, Y.; Fieldman, E.; Fieldman, A. Exploring Relationships Between Eye Tracking and Traditional Usability Testing Data. Int. J. Hum.-Comput. Interact. 2019, 35, 483–494. [Google Scholar] [CrossRef]
- Ho, H.-F. The effects of controlling visual attention to handbags for women in online shops: Evidence from eye movements. Comput. Hum. Behav. 2014, 30, 146–152. [Google Scholar] [CrossRef]
- Ho, C.-H.; Lu, Y.-N. Can pupil size be measured to assess design products? Int. J. Ind. Ergon. 2014, 44, 436–441. [Google Scholar] [CrossRef]
- Han, D.-I.; Jung, T.; Gibson, A. Dublin AR: Implementing Augmented Reality (AR) in Tourism. In Information and Communication Technologies in Tourism 2014; Springer: Cham, Switzerland, 2014; pp. 511–523. [Google Scholar] [CrossRef]
- Safitri, R.; Yusra, D.; Hermawan, D.; Ripmiatin, E.; Pradani, W. Mobile Tourism Application Using Augmented Reality; IEEE: Denpasar, Indonesia, 2017; p. 6. [Google Scholar] [CrossRef]
- Tobii. What Is Eye Tracking? How Do Eye Trackers Work?—Tobii Pro. 17 January 2018. Available online: https://www.tobii.com/learn-and-support/get-started/what-is-eye-tracking (accessed on 10 August 2022).
- Orhei, C.; Vert, S.; Mocofan, M.; Vasiu, R. TMBuD: A Dataset for Urban Scene Building Detection. In Information and Software Technologies; Springer: Cham, Switzerland, 2021; pp. 251–262. [Google Scholar] [CrossRef]
- Vert, S. Spotlight Timisoara AR—Mobile Augmented Reality with Historical Images for Cultural Heritage. In Digital Culture in Education, Science and Technology; IAFeS Publications: Vienna, Austria, 2021; p. 186. [Google Scholar]
- Pupil Labs. Core—Getting Started. Available online: https://docs.pupil-labs.com/core/ (accessed on 11 August 2022).
- Pupil Core—Eye Tracking Platform Technical Specifications—Pupil Labs. Available online: https://pupil-labs.com/products/core/tech-specs/ (accessed on 11 August 2022).
- Pupil Labs. Core—Pupil Capture. Available online: https://docs.pupil-labs.com/core/software/pupil-capture/ (accessed on 11 August 2022).
- Pupil Labs. Core—pye3d Pupil Detection. Available online: https://docs.pupil-labs.com/developer/core/pye3d/ (accessed on 11 August 2022).
- Kassner, M.; Patera, W.; Bulling, A. Pupil: An Open Source Platform for Pervasive Eye Tracking and Mobile Gaze-based Interaction. In Proceedings of the UbiComp 2014—2014 ACM International Joint Conference on Pervasive and Ubiquitous Computing, Seattle, WA, USA, 13–17 September 2014. [Google Scholar] [CrossRef]
- Lewis, J.R. The System Usability Scale: Past, Present, and Future. Int. J. Hum.-Comput. Interact. 2018, 34, 577–590. [Google Scholar] [CrossRef]
- Nielsen, J.; Nielsen Norman Group. 10 Usability Heuristics for User Interface Design. Available online: https://www.nngroup.com/articles/ten-usability-heuristics/ (accessed on 4 September 2022).
- Azuma, R.T. A survey of augmented reality. Presence 1997, 6, 355–385. [Google Scholar] [CrossRef]
- Nielsen Norman Group. World Leaders in Research-Based User Experience. How Many Test Users in a Usability Study? Available online: https://www.nngroup.com/articles/how-many-test-users/ (accessed on 6 June 2022).
- Faulkner, L. Beyond the five-user assumption: Benefits of increased sample sizes in usability testing. Behav. Res. Methods Instrum. Comput. 2003, 35, 379–383. [Google Scholar] [CrossRef] [PubMed] [Green Version]


| Participant | Age Group | Gender | Occupation | Domain | Smartphone Proficiency |
|---|---|---|---|---|---|
| P1 | 19–25 | F | Student | Psychology | Advanced |
| P2 | 19–25 | F | Student | Psychology | Advanced |
| P3 | 26–35 | M | Employed | Sales | Advanced |
| P4 | 26–35 | F | Freelancer | Advertising | Advanced |
| P5 | 26–35 | M | Student | IT | Intermediate |
| P6 | 19–25 | M | Employed | IT | Advanced |
| Participants | Task 1 | Task 2 | Task 3 | Task 4 | Task 5 | Total Time |
|---|---|---|---|---|---|---|
| P1 | 56 | 14 | 67 | 30 | 63 | 230 |
| P2 | 72 | 16 | 75 | 62 | 58 | 283 |
| P3 | 67 | 14 | 79 | 39 | 47 | 246 |
| P4 | 84 | 15 | 24 | 33 | 57 | 213 |
| P5 | 58 | 17 | 38 | 66 | n/a | 179 |
| P6 | 49 | 14 | 51 | 39 | n/a | 153 |
| AVG | 64.33 | 15 | 55.66 | 44.83 | 56.25 | - |
| STDEV | 12.62 | 1.26 | 21.83 | 15.30 | 6.70 | - |
| p | Q1 | Q2 | Q3 | Q4 | Q5 | Q6 | Q7 | Q8 | Q9 | Q10 | Score |
|---|---|---|---|---|---|---|---|---|---|---|---|
| P1 | 2 | 2 | 5 | 1 | 3 | 2 | 5 | 1 | 4 | 2 | 77.5 |
| P2 | 4 | 1 | 4 | 1 | 4 | 2 | 4 | 2 | 3 | 4 | 72.5 |
| P3 | 2 | 1 | 4 | 1 | 4 | 3 | 5 | 2 | 3 | 2 | 72.5 |
| P4 | 4 | 1 | 4 | 1 | 5 | 2 | 5 | 1 | 4 | 2 | 87.5 |
| P5 | 4 | 4 | 5 | 2 | 4 | 4 | 5 | 2 | 4 | 2 | 70 |
| P6 | 2 | 1 | 4 | 2 | 4 | 2 | 4 | 2 | 2 | 2 | 67.5 |
| Participants | 1st Card | 2nd Card | 3rd Card | 4th Card | 5th Card |
|---|---|---|---|---|---|
| P1 | Creative | Understandable | Annoying | Interesting | Uncontrollable |
| P2 | Accessible | Creative | Frustrating | Interesting | Useful |
| P3 | Clear | Creative | Inconsistent | - | - |
| P4 | Attractive | Good quality | Exciting | Complex | Flexible |
| P5 | Creative | Effective | Effortless | Interesting | Friendly |
| P6 | Direct | Fragile | Optimistic | - | - |
Disclaimer/Publisher’s Note: The statements, opinions and data contained in all publications are solely those of the individual author(s) and contributor(s) and not of MDPI and/or the editor(s). MDPI and/or the editor(s) disclaim responsibility for any injury to people or property resulting from any ideas, methods, instructions or products referred to in the content. |
© 2023 by the authors. Licensee MDPI, Basel, Switzerland. This article is an open access article distributed under the terms and conditions of the Creative Commons Attribution (CC BY) license (https://creativecommons.org/licenses/by/4.0/).
Share and Cite
Szekely, D.; Vert, S.; Rotaru, O.; Andone, D. Usability Evaluation with Eye Tracking: The Case of a Mobile Augmented Reality Application with Historical Images for Urban Cultural Heritage. Heritage 2023, 6, 3256-3270. https://doi.org/10.3390/heritage6030172
Szekely D, Vert S, Rotaru O, Andone D. Usability Evaluation with Eye Tracking: The Case of a Mobile Augmented Reality Application with Historical Images for Urban Cultural Heritage. Heritage. 2023; 6(3):3256-3270. https://doi.org/10.3390/heritage6030172
Chicago/Turabian StyleSzekely, Diana, Silviu Vert, Oana Rotaru, and Diana Andone. 2023. "Usability Evaluation with Eye Tracking: The Case of a Mobile Augmented Reality Application with Historical Images for Urban Cultural Heritage" Heritage 6, no. 3: 3256-3270. https://doi.org/10.3390/heritage6030172