Article

Modelling the Alteration of Medieval Stained Glass as a Function of Climate and Pollution: Comparison between Different Methodologies

by
Aurélie Verney-Carron
1,*,
Loryelle Sessegolo
1,
Roger-Alexandre Lefèvre
1 and
Peter Brimblecombe
2
1
Univ Paris Est Créteil and Université Paris Cité, CNRS, LISA, F-94010 Créteil, France
2
Department of Marine Environment and Engineering, National Sun Yat-sen University, Kaohsiung 80424, Taiwan
*
Author to whom correspondence should be addressed.
Heritage 2023, 6(3), 3074-3088; https://doi.org/10.3390/heritage6030164
Submission received: 22 January 2023 / Revised: 6 February 2023 / Accepted: 10 February 2023 / Published: 15 March 2023
(This article belongs to the Special Issue Effective Models in Heritage Science)

Abstract

:
Most stained-glass windows installed during the Middle Ages have deteriorated over time due to climate and pollution. To reconstruct their alteration history over the centuries, evaluate the current environmental risk, and predict their alteration in the future, two modelling methodologies have been used. First, based on the short-term exposure of medieval-type glass in different sites, dose–response functions (DRFs) were established. These DRFs correlate relevant environmental factors (temperature, rain quantity, rain pH, relative humidity, and SO2 concentration) with the response of the material in terms of alteration layer thickness. The second methodology consists of laboratory experiments that aim at parametrising kinetic laws as a function of specific parameters (temperature, rain pH, and relative humidity). These kinetic laws can be extrapolated over long periods, contrary to DRFs. In this study, we compared both methodologies to simulate the alteration of a model stained glass at different European sites or over different time periods. The results highlighted that the kinetic laws were able to closely represent the data, except for the polluted sites where the alteration was underestimated. This indicated that the dependence of the alteration rate on the pollutant concentrations should be included to improve the model.

1. Introduction

Medieval stained glass deteriorates through environmental exposure. The most ancient stained-glass windows still in place date from the 12th century (e.g., Augsburg Cathedral), and a large number were then installed through to the 13th and 14th centuries in different countries in Europe, mainly in France, Germany, and England [1]. During the Middle Ages, in this geographical zone, glass was produced with siliceous sand and ashes of trees and terrestrial plants (ferns). Thus, most glass pieces have a Si-K-Ca composition with a relatively low SiO2 content (~50 ± 5 wt.%) but high contents of K2O (~18 ± 5 wt.%) and CaO (~18 ± 4 wt.%) (see [2] for a review). This type of glass also contains Al2O3, Na2O, MgO, Fe2O3/FeO, TiO2, P2O5, and certain metals for coloration. The relatively high variability of the composition of Si-K-Ca glass can be explained by the glassmaking technology and by the local raw materials. In particular, the ash composition depends on the plant species, the part of the tree, the substratum, the harvest period, etc. [1]. By analysing a large set of data, Adlington et al. [1] were able to distinguish different regions of glass production. Due to this variable composition, the glass has poor durability, contrary to Si-Na-Ca glass produced with natron or coastal plants [3].
After installation, stained glass is exposed to the atmosphere and affected by both climatic (rain, temperature, relative humidity) and environmental (e.g., pollution) variation. This exposure leads to the degradation of the glass, limiting the passage of light and the legibility of artistic expression. These alterations are manifested in the form of discontinuous (pits, craters) or continuous alteration layers and deposits of secondary phases (sulphates such as gypsum or syngenite) and carbonates or oxalates [3,4,5,6,7,8,9,10,11,12,13,14,15,16,17]. The alteration layer is generally depleted in alkalis and alkaline earth elements, but rich in Si, Al, and Fe. Its thickness varies up to 300 µm after six or seven centuries of alteration in most cases. Characterisation studies and laboratory experiments highlight that the alteration layer is formed by interdiffusion or ion exchange between modifier ions of the glass (K+) and hydrogenated species (H+) in water. This leads to a hydrated and dealkalinised layer, where local hydrolysis and condensation reactions can contribute to the reorganisation of the layer such that it appears laminated [16,18,19]. A loss of materials caused by dissolution can sometimes be observed [9].
In order to reconstruct the alteration history and predict the degradation of stained-glass windows in the future (in the context of pollution and climate change), it is necessary to understand the alteration mechanisms and to determine the associated kinetics as a function of the climatic and environmental parameters. Several methodologies can be used to achieve this, such as dose–response functions (DRFs) or models based on kinetic laws (KLs), which are detailed below.
First, short-term exposure or laboratory experiments on pristine glass can assess the initial stages of alteration and short-term kinetics in response to selected parameters. Short-term exposure in real atmospheres (in positions sheltered or unsheltered from rain) was applied [20,21,22,23,24,25,26,27] in the context of national European projects (e.g., Multi-Assess, Vidrio) or international programs such as ICP-Materials [28]. The objective of these projects was to compare the alteration of medieval-type glass in different environments (rural, urban, and industrial). Parameters such as temperature; relative humidity; rain quantity and pH; and pollutant (SO2, NO2, PM10, etc.) concentrations were monitored. After exposure, the apparent glass alteration rates, corresponding to the K-depleted thickness divided by the exposure time, were calculated. In sheltered positions, the alteration rates of the different model glasses (SC and CLI, reproducing stained-glass windows from Sainte-Chapelle in Paris and Cologne Cathedral for [22]; and M1 for [24]) ranged between 0.5 and 2.2 µm·a−1 according to the nine different sites. This suggested that the chemical alteration of the glass was significant even without the direct impact of rain, and that the differences between the sites could induce a four-fold variation in the alteration rate. The temporal evolution also showed that over a year, the rate was not constant or tended to slow down slightly. In unsheltered positions, the alteration thickness can also be measured, but the external surface can be partly dissolved or lost by scaling [29]. The alteration rates of different model glasses (SC, TR, and CLI, reproducing stained-glass windows from Sainte-Chapelle, Troyes, and Cologne for [22]; M3 for [23,30]; Si-K-Ca for [21,29]; and Ca-K for [27]) after 1 year were between 0.4 and 5.4 µm·a−1 depending on the composition of the glass and the place of exposure (~25 sites, mainly in Europe). In particular, at the 20 ICP-Materials (International Co-operative Programme on Effects on Materials including Historic and Cultural Monuments) sites, the alteration thickness of a model glass (M3, composition shown in Table 1) varied between 0.8 and 1.9 µm, with an average value of 1.2 µm after three years [23]. The average temperatures at these sites ranged from −0.8 to 24.2 °C, the average RH between 57.5 and 84.3%, the cumulative precipitation over three years from 618 to 5032 mm, the average SO2 concentration between 0.2 and 35.2 µg·m−3, and the average NO2 concentration between 1.4 and 79.1 µg·m−3. Thus, climate and pollution induced a two- to three-fold variation in the alteration thickness, which was relatively limited. However, this simplified model glass used at the ICP sites was more durable than medieval stained glass. The alterations also slowed down over the six years of exposure [26]. Another glass, M1 (composition shown in Table 1), which was more representative of medieval stained glass, was studied in the ICP-Materials program [31] and the Multi-Assess project [25]. For the 23 ICP-Materials sites [31], the alteration thickness varied from 1.4 to 17.1 µm after six months of exposure and from 1.6 to 22.1 µm after a year of exposure (Table 2). The effect of climate and pollution was thus more pronounced for this glass.
From these data, dose–response functions (DRFs) have been determined. These DRFs correlate relevant environmental factors with the responses of the materials in terms of alterations (e.g., the alteration layer thickness or the percentage of the surface covered by salts for model stained-glass windows) [25,31].
The second methodology consists in laboratory experiments that aim at parametrising kinetic laws and determining the effect of a specific parameter, such as the temperature and pH of a solution to simulate rain [19,32], or the ambient temperature, relative humidity (RH), and SO2 concentration to simulate atmosphere [33,34,35]. These kinetic laws can represent inputs for geochemical models. Calculations based on these kinetic laws were undertaken by Verney-Carron et al. [2] to reconstruct the alteration history of medieval stained glass from installation until today. The results were consistent with observations of ancient samples.
The object of this paper was to compare the two methodologies for representing measured data and to simulate theoretical case studies: (i) dose–response functions based on multiple parameters and (ii) kinetic laws based on first-order parameters. To this end, data from the ICP-Materials program ([31], Table 2) as well as a previous case study [36] were used to examine and discuss the advantages and drawbacks of the different models. This comparison provides directions for future research.

2. Materials and Methods

2.1. Data

The ICP-Materials programme (International Co-operative Programme on Effects on Materials including Historic and Cultural Monuments) of the Economic Commission for Europe within the United Nations (UNECE ICP-Materials) is a collaborative project that aims to investigate the effects of air pollution on the degradation of materials and cultural heritage [28]. It has a large network of tests sites and performs regular exposure campaigns involving different materials. The corrosion or soiling rates are evaluated after exposure using parallel meteorological and environmental data. For this, temperature and relative humidity data from local or national meteorological stations are gathered for each site. Rainfall collection is carried out using closed-bucket samplers to measure the pH and the composition. Gaseous pollutants and particulate matter concentrations come either from nearby EMEP net sites (European Monitoring and Evaluation Programme), national or local air quality stations, or passives samplers on site. The results highlighted the evolution of pollution and material responses [37] and allowed the establishment of dose–response functions that relate climate or pollution parameters to the alteration of materials (for example, limestone erosion; the erosion of zinc, aluminium, copper, and various steels; and glass soiling) [38]. The sensitivity of stained-glass windows to the atmosphere led the Institute of Sciences and Technologies in Art of the Academy of Fine Arts (Vienna) to expose two model stained glasses (M1 and M3, Table 1) in sheltered and unsheltered conditions as part of this programme. The first campaign was started between October 1993 and September 1995 and continued until October 1997 and September 2001 to obtain six years of alterations. After exposure, the authors determined the thickness of the altered layer (depleted in K). The evaluation of its thickness after 6 and 12 months of alteration was carried out using nuclear reaction analysis (NRA). Melcher and Schreiner [24] estimated that the uncertainty associated with the procedure of leached depth determination was less than 10%. Several reports (available at https://www.ri.se/en/icp-materials/documents/icp-materials-reports, accessed on 9 February 2023) have gathered the results: Report 27 [31] for two-year exposure in sheltered and unsheltered conditions and dose–response functions, and Reports 48 [39] and 49 [26] characterising glass after three to six years of alteration in sheltered and unsheltered conditions. Woisetschläger and Schreiner [31] characterised the facies of alteration using SEM (scanning electron microscopy). In unsheltered conditions, few crystals were present on the glass surface, as they were regularly rinsed off by the rain. The leached layer appeared to be cracked and flaked off. The authors also developed a dose–response function [31]. For this, they used a statistical evaluation method based on Pearson correlations.
In this paper, we used the set of data concerning the M1 glass [31]. This glass had a high presence of network modifiers (K, Na, Ca, and Mg) and a low amount of network formers (Si, Al, and P), so its composition was relatively close to that of medieval stained glass (Table 1). The model glass was exposed for 6 and 12 months (Table 2) at 23 sites in Europe and North America. Moreover, for this glass, dose–response functions were established: two in unsheltered conditions for 6 and 12 months and one in sheltered conditions for 12 months (see Equations (1)–(3)).

2.2. Dose–Response Functions

Dose–response functions were established by Woisetschläger and Schreiner [31] for the leached layer thickness (LDR in µm) of the M1 glass after six months in unsheltered conditions (U):
L D R 6 U = e x p 0.13717 + 0.56722   l n S O 2 + 10.2395   r   p H
where [SO2] is the concentration of SO2 (in µg·m−3), r is the rain quantity (in mm), and pH is the pH of the rain.
The DRF after 12 months was as follows:
L D R 12 U = e x p 2.75562 + 0.436   l n S O 2 + 0.04634   R H + 0.001585   r   p H
where RH is the relative humidity. This new parameter was statistically significant in this case.
Melcher and Schreiner [25] also established a dose–response function in sheltered conditions (S) from M1 exposure data in 6 different sites during the Multi-Assess project, which was adapted by Brimblecombe and Lefèvre [36]. After 12 months, the leached layer thickness was expected to be:
L D R 12 S = 0.64 + 0.03   R H + 0.04   S O 2 0.05   T
where T is the temperature.

2.3. Kinetic Laws

Glass can be altered by two main processes: (1) interdiffusion or ion exchange [40], which leads to the formation of a hydrated and dealkalinised or leached layer that can be reorganised by local hydrolysis and condensation reactions [19]; (2) the dissolution of the glass network, which leads to a loss of material.
Different kinetic laws are associated with both mechanisms. The evolution of the leached layer thickness formed by interdiffusion L generally follows Fick’s second law (e.g., [41]):
L = 2 D   t π
where D (m2·s−1) is the diffusion coefficient of the glass modifier elements within the leached layer, and t (s) is the duration of alteration. Therefore, D can be determined under different alteration conditions (T, rain pH, RH) by measuring the leached layer thickness (using SEM or SIMS (secondary ion mass spectrometry) techniques, for example) and knowing the duration of alteration.
The dissolution rate is generally formalised by a first-order law [32,42] that depends on the pH, temperature, and a chemical affinity term based on a silica phase. However, the loss of glass by means other than craters or the scaling of the altered layer was shown to be limited on ancient stained-glass windows (e.g., [9]). Therefore, the alteration rate in the atmosphere is predominantly controlled by diffusion, and dissolution can be neglected.
In ambient conditions, rainfall events alternate with drier periods, where the RH varies. A parametrised geochemical model based on alteration kinetics as a function of climate and pollution must thus consider different water conditions [32,35]. Verney-Carron et al. [2] accounted for three hygric phases: (i) rainfall events; (ii) residual or pore water in the alteration layer when the RH is high; and (iii) water present as vapour. It was also assumed that the alteration layer prevents the direct contact of rain with the pristine glass and limits its dissolution and the loss of materials. Therefore, Equation (5) with suitable parameters is used to determine the simulated alteration thickness using kinetic laws in unsheltered conditions LKL-U:
L K L U = 2 D r · x r · t π + 2 D w · x w · t π + 2 D v · x v · t π
where Dr is the diffusion coefficient of the glass modifier elements during rainfall events, which depends on pH and T (see Equation (6)); xr is the proportion of rainfall time; Dw is the diffusion coefficient of the glass modifier elements when water fills a significant part of the pore network of the altered layer, which also depends on pH and T (Equation (6)); xw is the fraction of time for which altered layer imbibition takes place; Dv is the diffusion coefficient of the glass modifier elements when the water is in vapour form; and xv is the fraction of time for which the water is in vapour form.
The parameters Dr and Dw were evaluated by a laboratory study performed at different pH and temperature values on the model stained glass SG3 (composition in Table 1):
D = D 0 × 10 p H n × e x p E a R T
where D0 is an initial constant (D0 = 2.4 ± 0.3 × 10⁻¹⁰ m2·s−1); n is an empirical pH-dependent coefficient (n = 0.25 ± 0.02); and Ea is the activation energy (Ea = 34.5 ± 0.3 kJ·mol−1) [32]. The parameter Dr is calculated using the pH and T values from Table 2 for each site, and Dw is assessed by considering a pH of 8 in the altered layer resulting from interdiffusion and the T value for each site. For Dv, general kinetic laws have yet to be established. Sessegolo et al. [35] have performed some alteration experiments on SG3 glass as a function of T and RH, but complementary data are necessary. However, the authors measured a value of 1 × 10⁻²⁰ m²·s−1 for the SG3 model glass exposed at 20 °C for nine months. Furthermore, thanks to H isotope tracing on ancient stained-glass windows, Sessegolo et al. [16] measured diffusion coefficients of 3.6 × 10⁻²⁰ m2·s−1 at 20 °C and 70% RH and 4.9 × 10⁻²⁰ m2·s−1 at 90% RH. Therefore, in the absence of a complete kinetic law for Dv as a function of T and RH, a unique value of 3.6 × 10⁻²⁰ m2·s−1 was considered in the calculations.
There is no clear correlation between rainfall (mm) and rain duration as it depends on the intensity of rain. However, based on meteorological data in Paris (617 mm·a−1 of rain between 1881 and 2000, corresponding to 548 h·a−1 of rain (over 8766 h in total) between 1961 and 1990; Météo-France data), xr was determined as:
x r = 548 / 8766 617 r 1 y
where r1y is the annual rainfall in mm (calculated from the cumulated rainfall over the considered period r in mm).
The duration for which the altered layer is considered wet or soaked by water is dependent on the RH and the pore size in the altered layer (Kelvin’s equation). At 12 °C, the pore radius at which water condenses and fills the pore (Kelvin’s radius) is 2 nm for 57% RH, 3 nm for 69% RH, 5 nm for 80% RH, 10 nm for 89% RH, and 20 nm for 95% RH. Sessegolo et al. [16] showed that the average pore size of ancient stained-glass windows is around 2 nm. It is difficult to accurately estimate the time required for the altered layer to be sufficiently soaked by water for alteration to occur, but we assumed that xw is equal to 15% if RH < 70%, 25% if 70 < RH < 80%, and 35% if RH > 80%.
By deduction, the fraction of time for which the glass is exposed to the vapour phase (xv) is:
x v = 1 x w x r
For sheltered conditions, we could consider that the water is in vapour form 100% of the time, but this would not take into account the imbibition of the alteration layer. In unsheltered conditions, xw was assumed to vary between 15 and 35% (25% in Paris), but without rain, this percentage could be lower, as the layer is never completely soaked. These two extreme cases were simulated as follows:
L K L S = 2 D v · x v · t π
where xv = 1; and
L K L S = 2 D w · x w · t π + 2 D v · x v · t π
where xv = 1 − xw.

3. Results and Discussion

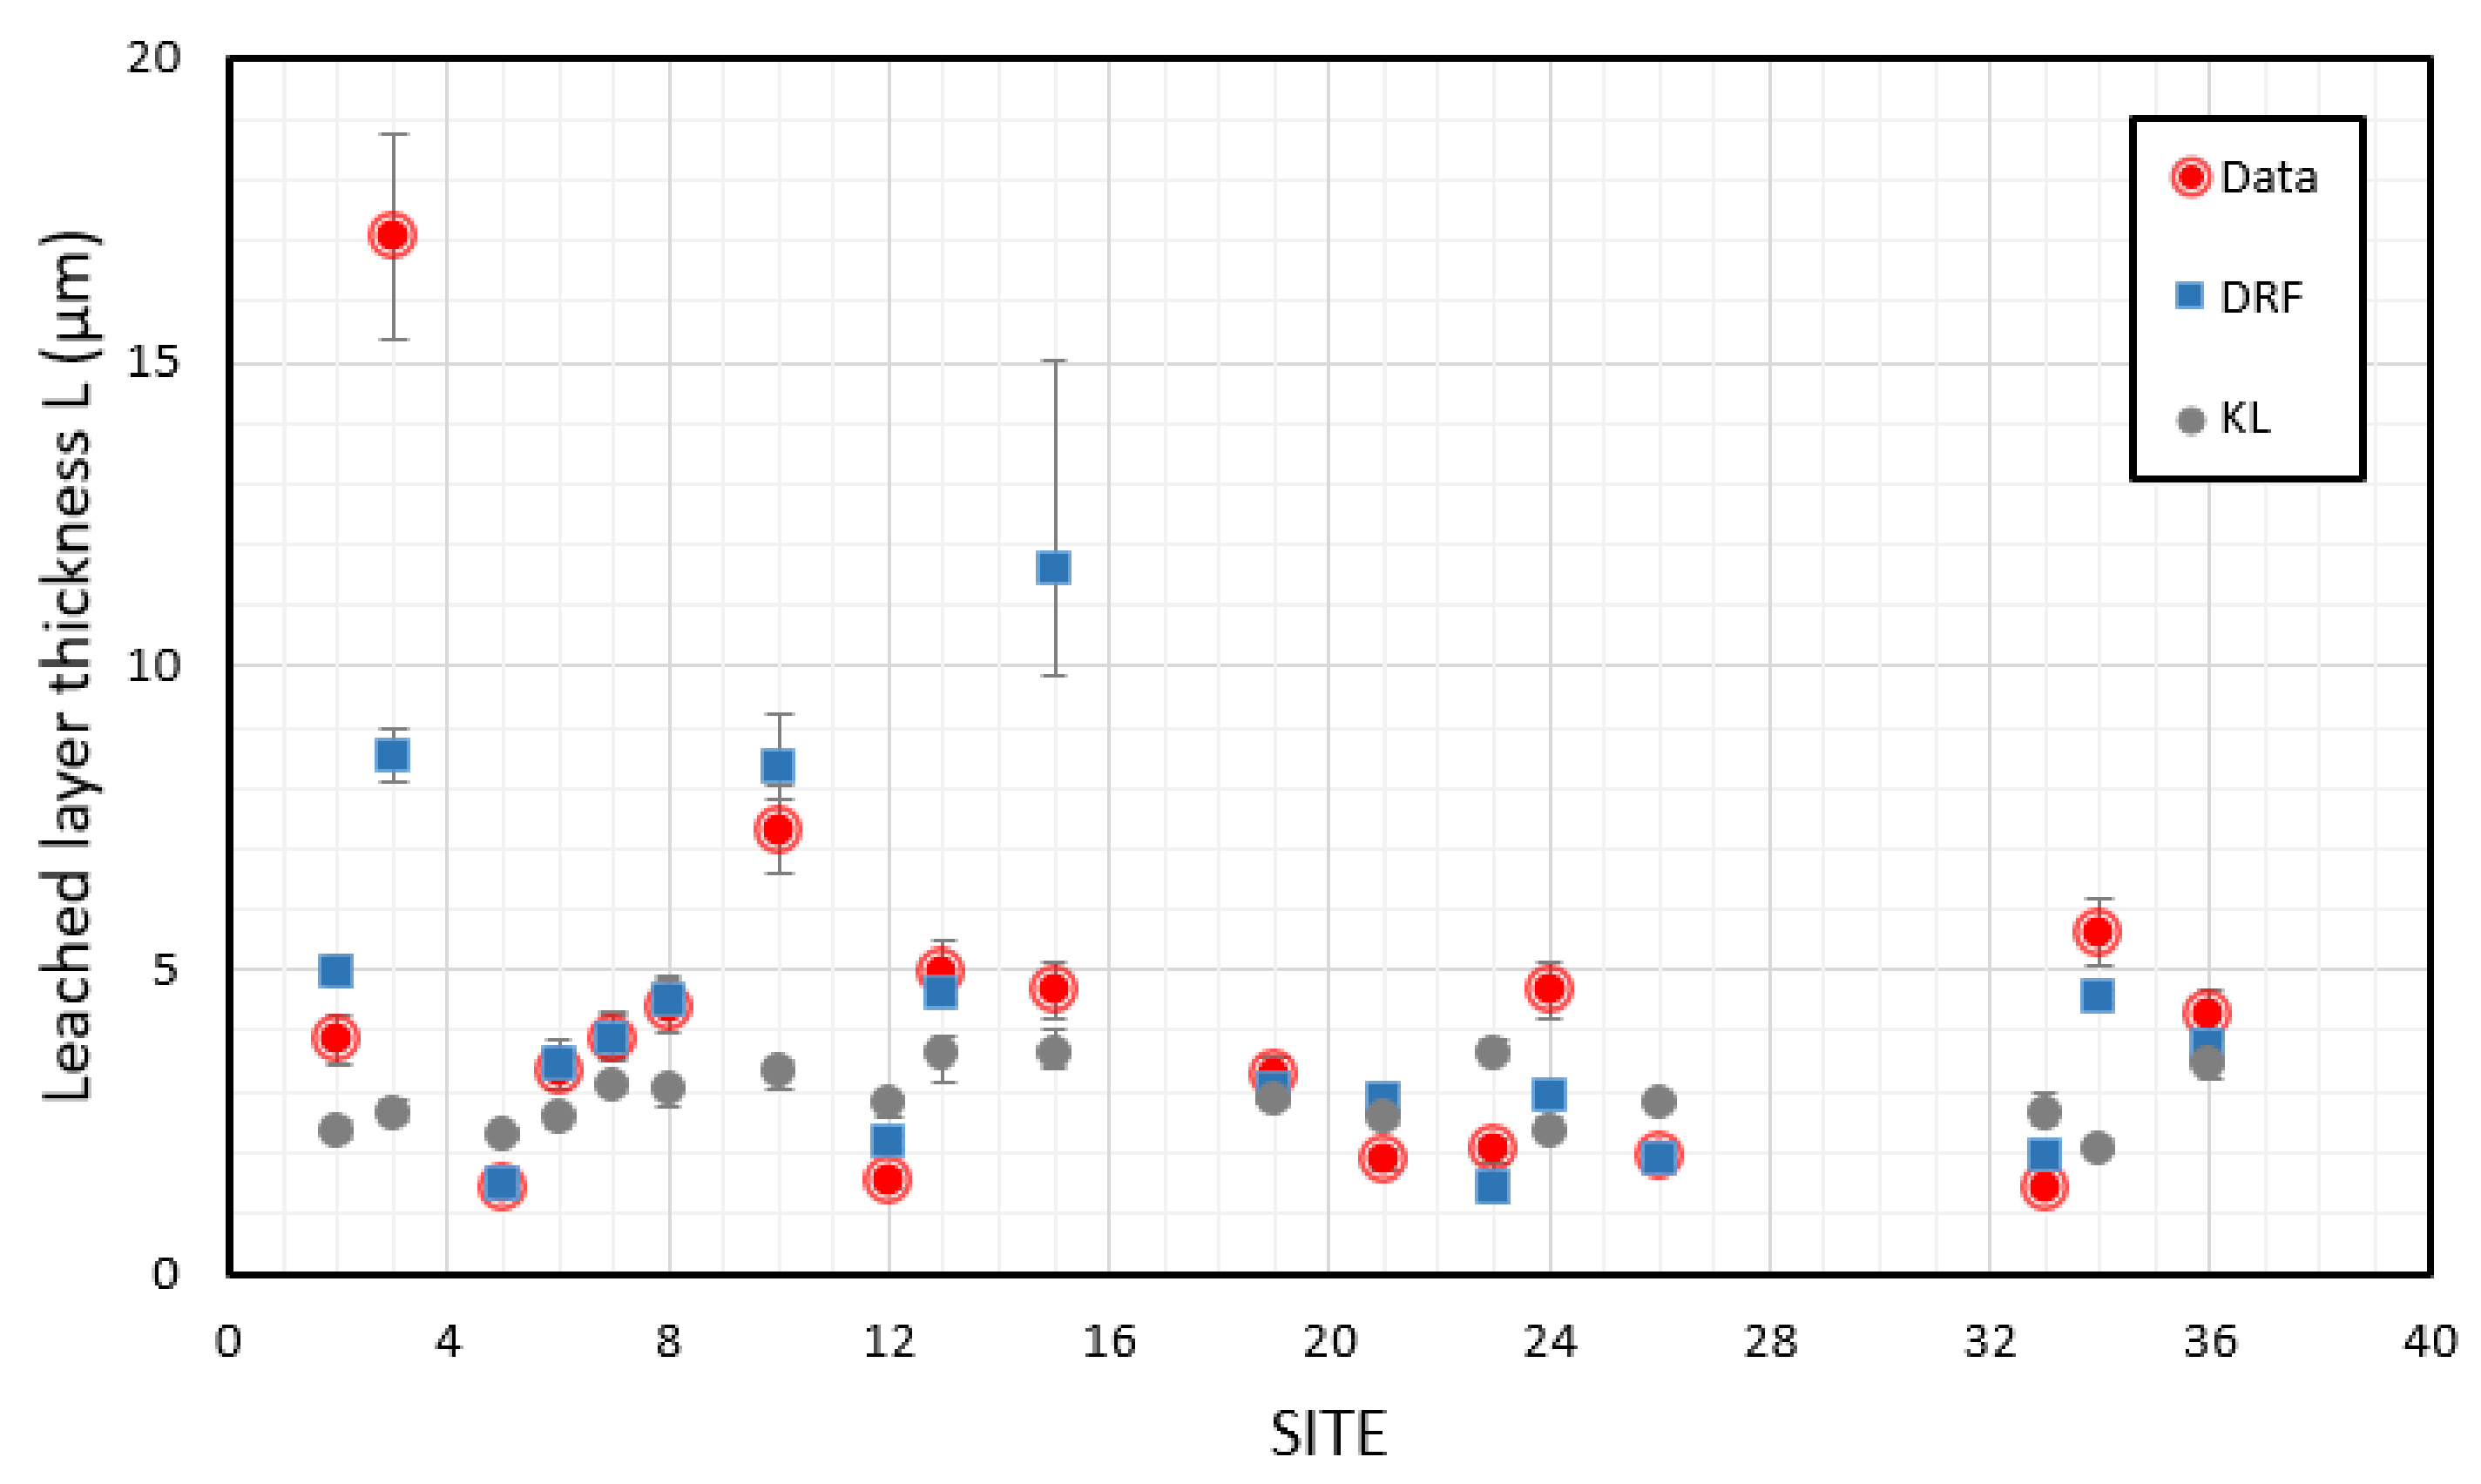
3.1. Leached Layer Thickness in Model Glass

Using environmental data (Table 2), the thickness of the leached layer (L) was calculated based on dose–response functions (LDR-6U and LDR-12U) and kinetic laws (LKL-U) (Table 2, Figure 1 and Figure 2). The uncertainties in the models (error bars in Figure 1 and Figure 2) were determined by considering an uncertainty for each environmental parameter of ±5%. The minimum and maximum values were obtained, considering that an increase in T, RH, SO2, and r and a decrease in pH caused an increase in L, and vice versa. For the kinetic laws, the uncertainties for the different assumptions concerning the respective time fractions and the parameterisation of the diffusion laws were difficult to assess and so were not considered here.
As expected, the values provided by the DRFs at six months (Figure 1) and 12 months (Figure 2) were close to the actual data, as they were established using this set of data. Furthermore, the values provided by the kinetic laws, which were parameterised in a completely independent way, were also in good agreement. This indicated that despite differences in composition (Table 1), the M1 and SG3 glasses were altered at a similar rate. It also suggested that the kinetic laws determined in the laboratory were able to account for short-term alterations in real conditions and consider the relevant mechanisms. Verney-Carron et al. [2] also showed that the predictions for alterations over the centuries were consistent with observations from ancient stained-glass windows.
The correlation between the data and models was evaluated using Rstudio and calculating Kendall’s tau coefficient, because the sample size was small and the variables did not follow a normal distribution. The tau coefficient for the data and the DRFs was 0.68 (with a p-value of 0.0001) for the 6-month series and 0.62 (with a p-value of 0.0004) for the 12-month series. This positive correlation and the low p-values (<0.05) confirmed the ability of the DRFs to fit the data. However, the tau coefficient for the data and the kinetic laws was 0.17 (with a p-value of 0.3370) for the 6-month series and 0.18 (with a p-value of 0.3035) for the 12-month series. In this case, the high p-values highlighted that the kinetic laws produced results of the same order of magnitude as the data but failed to account for the variations in the leached layer thickness as a function of the site. The kinetic laws also underestimated the alteration for highly polluted sites.
The main difference between the models was that the DRFs considered the SO2 concentration, whereas the KLs only took into account the influence of air pollution via the pH of the rain. However, for polluted sites with high SO2 concentrations (e.g., sites 3, 10, and 15), the pH was not significantly lower than at the other sites, except for site 3 in the 12-month data (Table 2). Therefore, the pH of the rain did not accurately represent the pollution level of the sites. The SO2 concentrations in the DRFs allowed us to fit the high L values for sites 3 (partly or totally) and 10 (totally or even more), but produced strange values of L for site 15 (Milan) (Figure 1 and Figure 2).
Unsurprisingly, the DRFs fit the measured data well. For the KLs, the results were close to the data when the L values were relatively low (between 1 and 6 µm); this was encouraging, as they were parameterised on a specific glass altered in laboratory conditions. However, they did not account for the variation as a function of the site or for the high L values, as they did not consider gaseous pollutants other than through their weak and indirect effect on the pH of the rain.

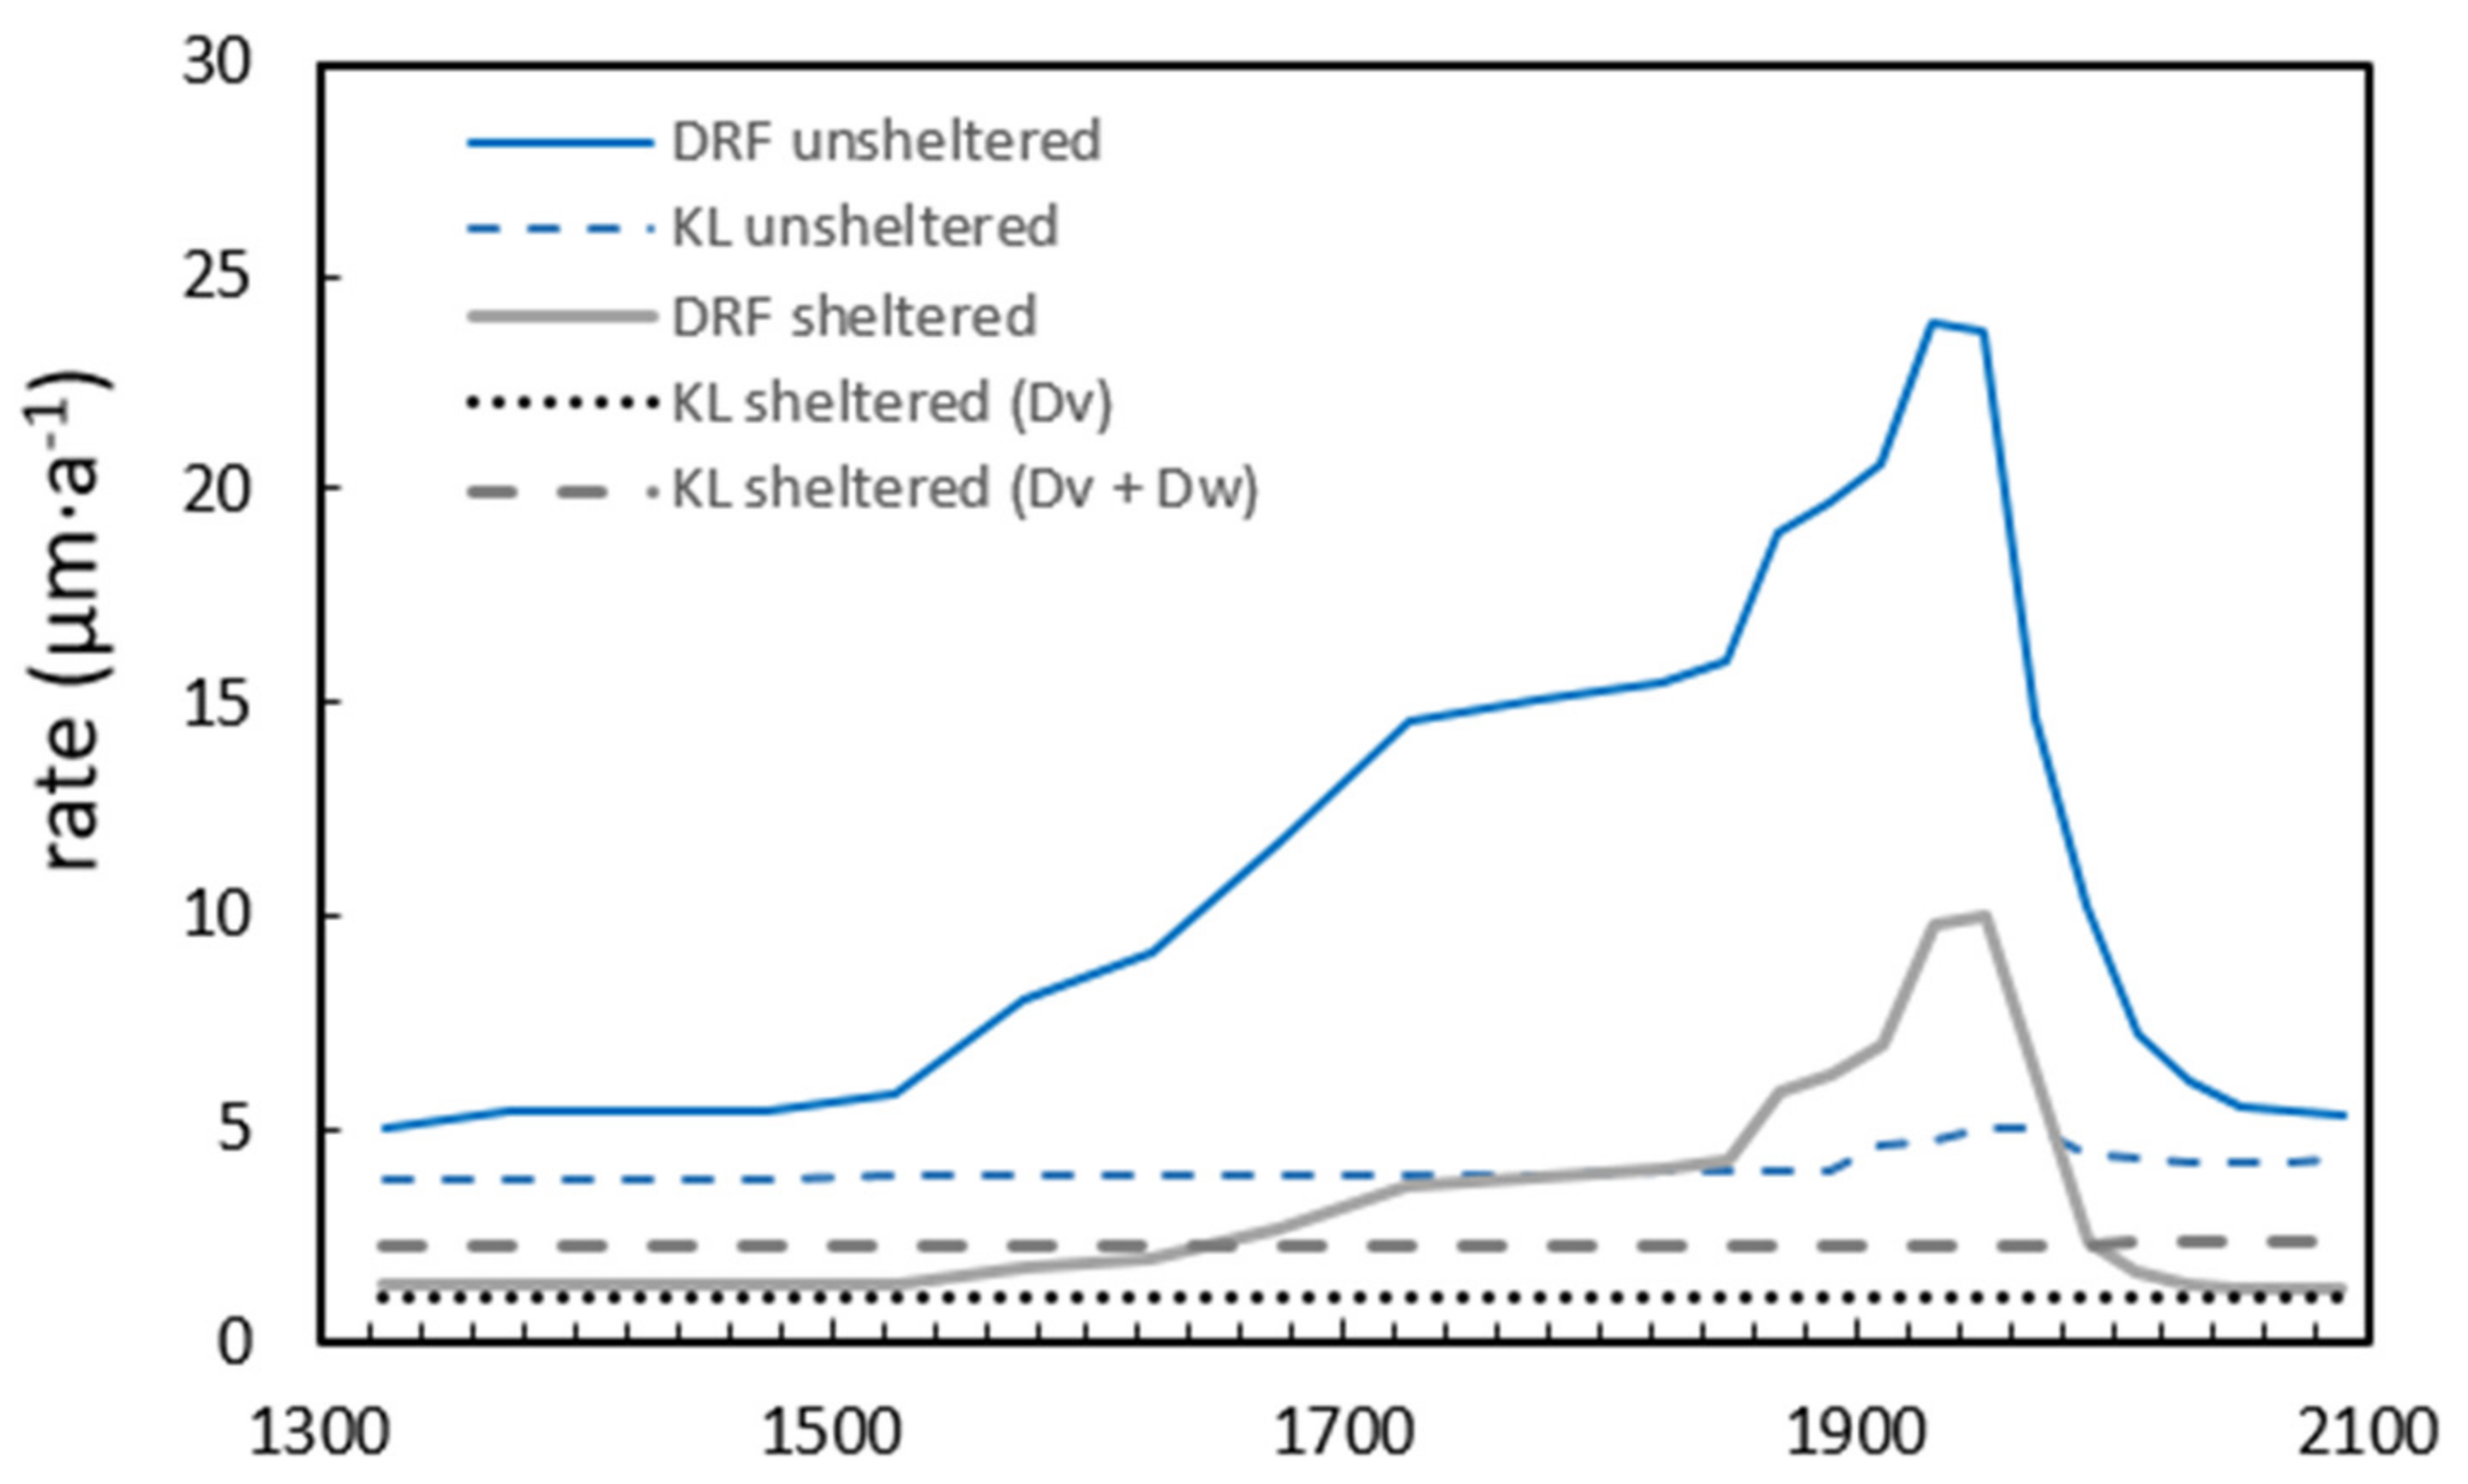
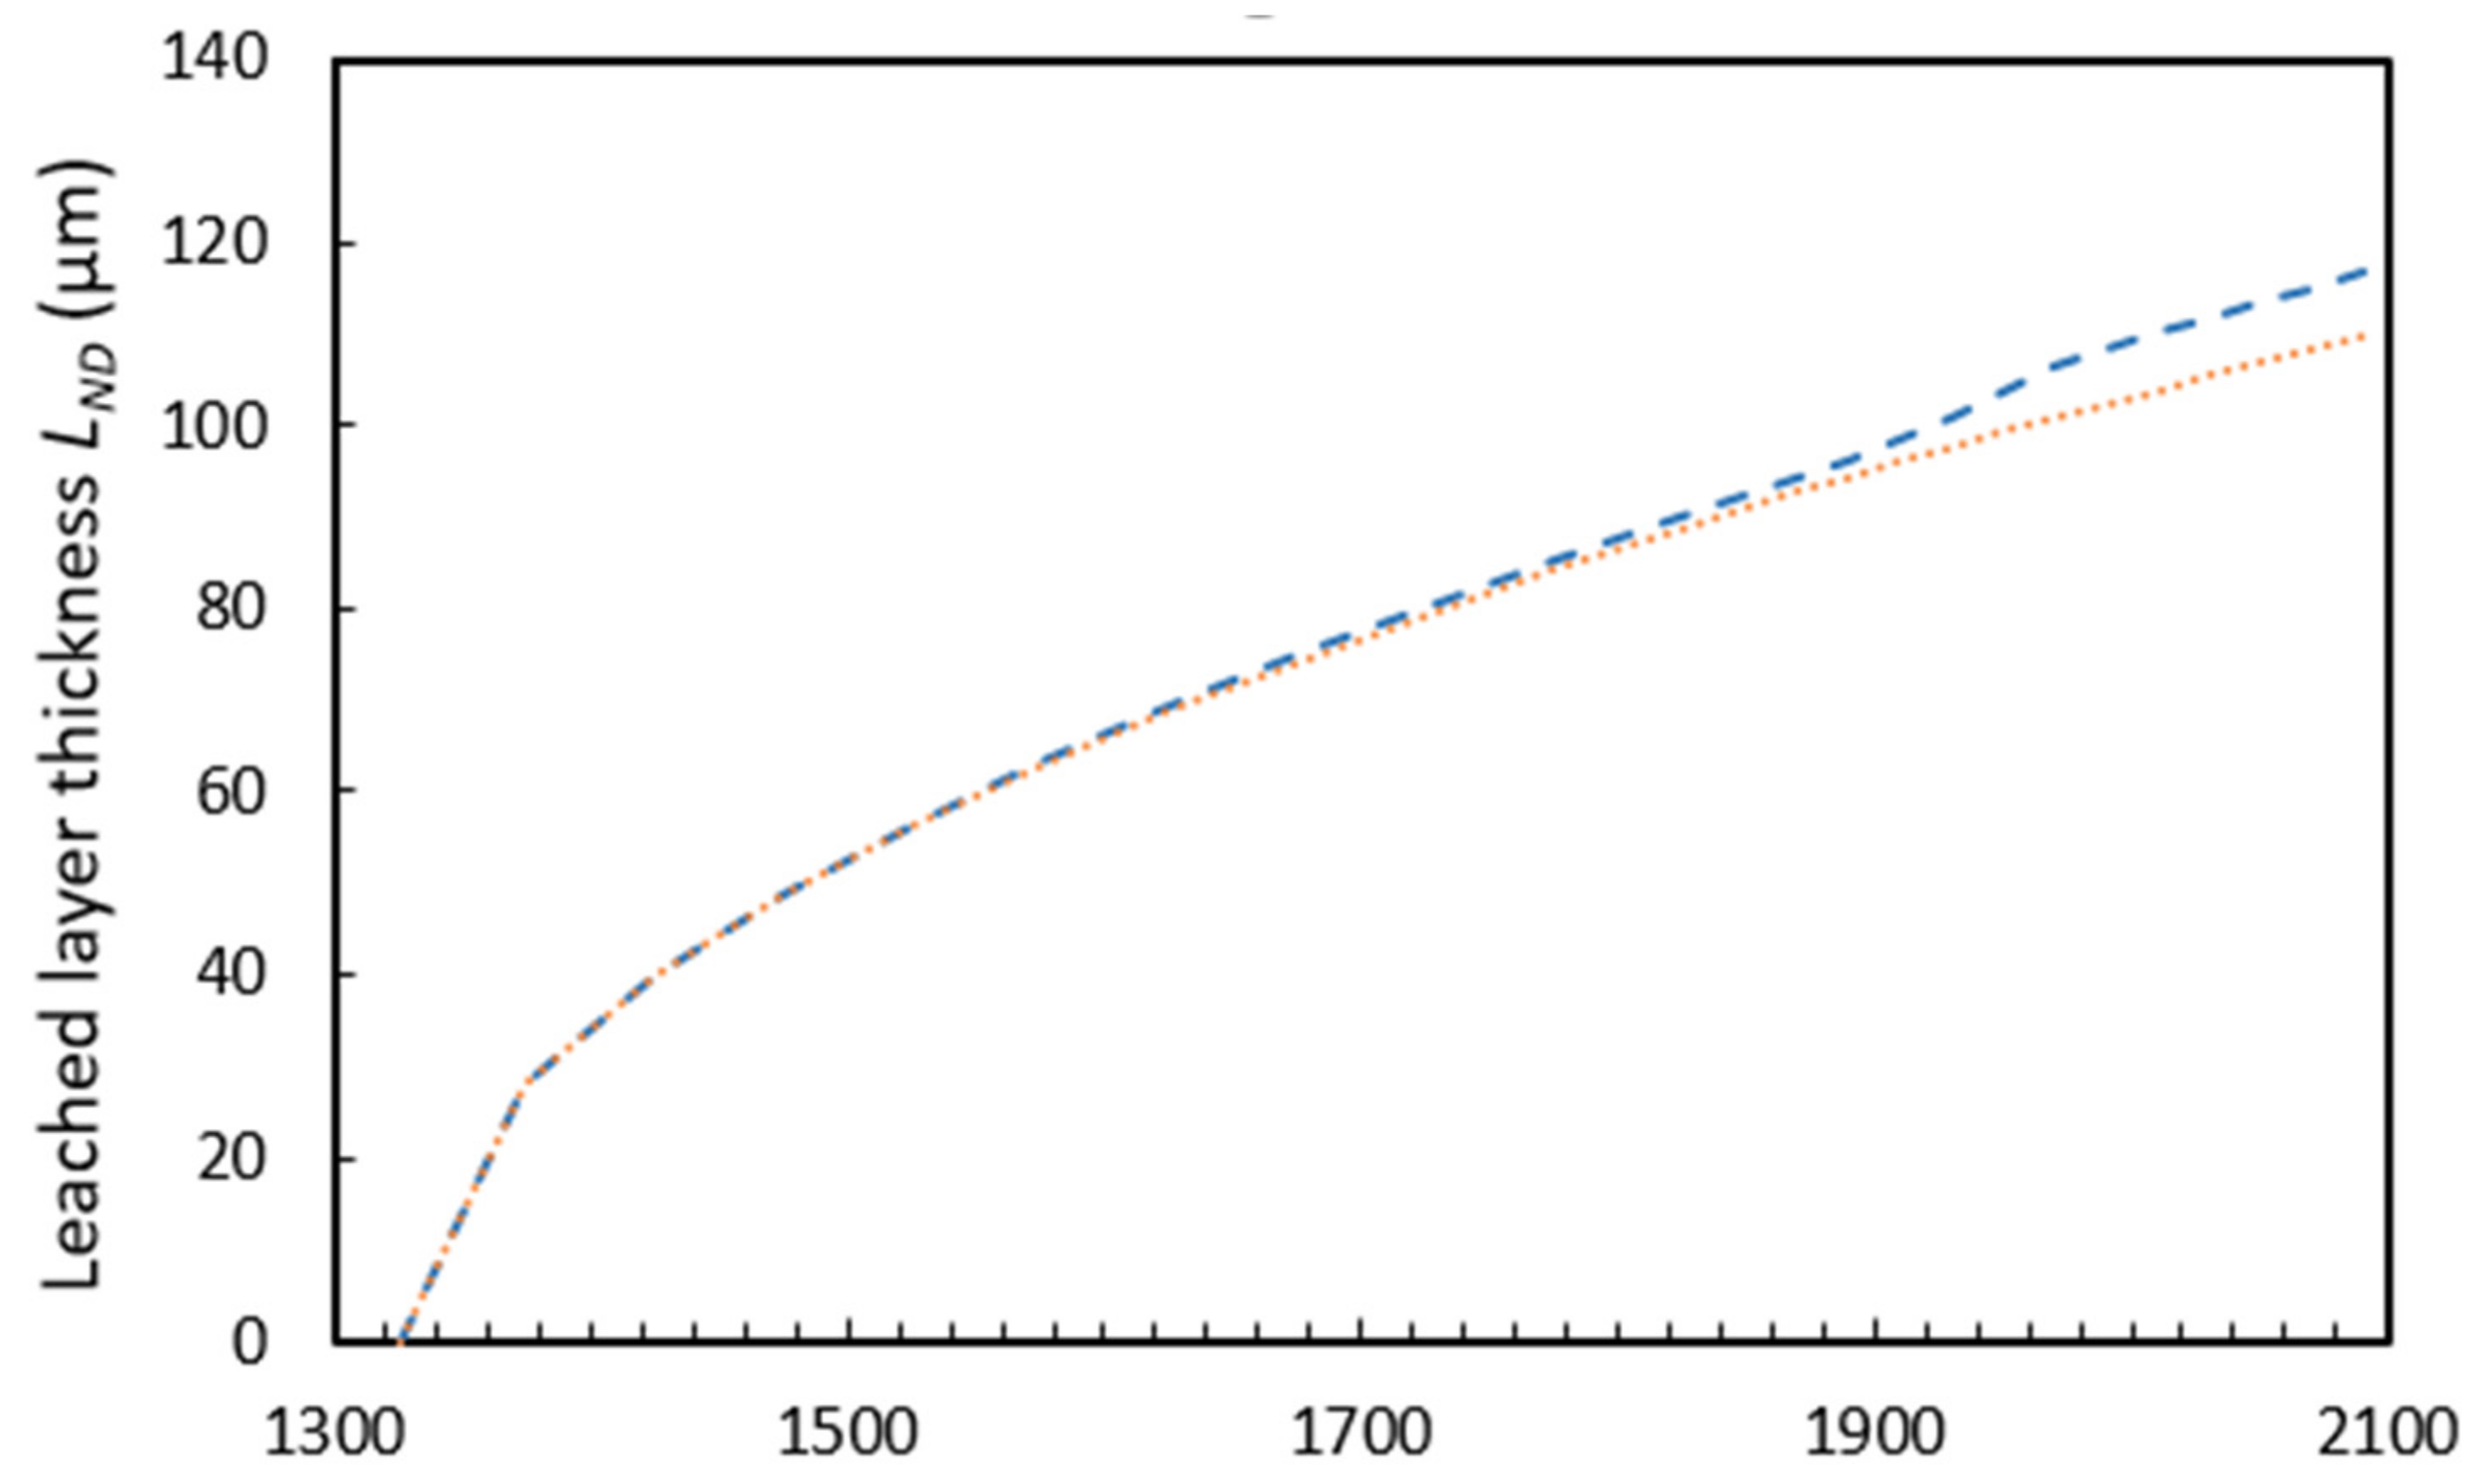
3.2. Long-Term Alteration Rate of Historic Glass in Paris

Ionescu et al. [43] simulated the alteration rate of stone, modern glass, and stained glass in the centre of Paris from 1500 to 2090 using DRFs and climate models. Brimblecombe and Lefèvre [36] extended the study to the different materials (stone, metals, and stained glass) found in Notre-Dame Cathedral between 1325 and 2090. For the past and current periods, they collected historical data (based on proxies or assumptions) and contemporary data (measurements). In particular, they used dendrochronology for temperature and different climate assumptions for precipitation and relative humidity. By using different pollution scenarios, e.g., based on fuel use [44,45]), the authors were able to estimate the concentrations of SO2, NO2, O3, and PM10. For future projections, the authors used outputs of the RCP2.6 and 8.5 scenarios of climate evolution designed by the IPCC (Intergovernmental Panel on Climate Change) AR5 and outputs of the GAINS model for the emission of pollutants. Data concerning temperature, relative humidity, precipitation amount and pH, and SO2 concentration are presented in the Supplementary Materials (Table S1). This earlier study considered only the alteration of stained-glass windows in sheltered positions, so we proposed here to calculate the evolution of the alteration rate of these ancient stained-glass windows in unsheltered positions using DRFs (Equation (2)) and similar environmental data ([36], Table S1) (Figure 3, solid blue line). For comparison, the alteration rate in sheltered conditions calculated from Equation (3) is also presented (Figure 3, solid grey line).
It should be noted that the alteration rate obtained from the DRFs corresponded to the initial alteration over the first year. As these DRFs did not include a time parameter, and the alteration rate was not constant [16,20,23,35], the DRFs could not be used to simulate the alteration over longer time periods. Therefore, the curves could not be read as a cumulative process, as this would lead to very high and overestimated alteration thickness values over the centuries. Rather, the results correspond to an estimation of the environmental risk for stained-glass window alteration as a function of time.
For comparison, it was also possible to estimate this alteration rate for one year using kinetic laws in unsheltered conditions (Equations (5)–(8), Table S1, Figure 3, dashed blue line) and in sheltered conditions (Equations (9) and (10), Table S1, Figure 3, dashed grey lines).
Figure 3 (blue curves) shows that for low levels of pollution, before the increasing use of coal and the Industrial Age, as well as for the 21st century, the alteration rates predicted by the DRFs and KLs in unsheltered conditions were very close. In contrast, during the 20th century, the increase in the alteration rate caused by the pollution was very low for the KLs compared to the DRFs, as only the lower rain pH was considered among the pollution parameters. The large increase in SO2 resulted in an increase in the alteration rate provided by the DRFs. The sharp drop in the alteration rate starting from the 1950s was then caused by the strong decrease in SO2 in the atmosphere. For the KLs, a slight effect of the temperature increase was visible during the 21st century. Figure 3 (grey curves) also shows that for sheltered conditions, the results provided by the DRFs and KLs were similar for low-pollution conditions but very different for highly polluted periods.
As the DRFs were parameterised for 6 or 12 months, they could not be extrapolated over the long term, whereas this was feasible with the KLs. Figure 4 shows the evolution of the leached layer thickness of the stained glass windows of Notre-Dame Cathedral (LND) over the centuries (from 1325 to 2090) calculated from the kinetic laws and using the same climate and pollution data as in Brimblecombe and Lefèvre [36] (blue dashed line); only the situation of 1325 (orange dashed line) is considered for comparison. Equation (5) was adapted to consider the different values of the diffusion coefficient and the time fraction as a function of the environmental data corresponding to the time period:
L N D = 2 i = 1 n D r i · x r i · t i π + 2 i = 1 n D w i · x w i · t i π + 2 i = 1 n D v · x v · t i π
where ti is the time between each time interval i; and Dri, Dwi, xri, xwi, and xvi are the corresponding values calculated from the environmental data for the given time period. Data and calculations are presented in the Supplementary Materials (Table S1).
The comparison between the curves showed that the increase in pollution induced a small acceleration in the alteration rate during the 20th century due to the decrease in pH (4.5 between 1910 and 1950 and 4 between 1950 and 1990) and during the 21st century due to the increase in temperature. The results showed that the effect of the temperature predominated over the slight decrease due to the RH and precipitation, but the effect of the RH should be considered more finely in the model, which would require complementary experiments.

3.3. Advantages and Drawbacks of the Models

The DRFs were established from data collected on various sites pertaining to the climate and pollution. They correlated different environmentally relevant parameters that were statistically selected, but also incorporated knowledge of the alteration processes. However, they were based on short-term measurements (6 and 12 months), and the alteration rate is not constant and tends to decrease over time [2,16,20,23,35]. For the simulations at Notre-Dame (Figure 3), this alteration rate thus corresponded to the evaluation of a potential threat for stained glass over centuries or decades, and not to a cumulative process, as the alteration thickness does not evolve linearly. Nevertheless, this represents how stained-glass windows have been altered by the environment over time.
A model based on kinetic laws parametrised in the laboratory as a function of specific parameters (T, pH, RH) provides an opportunity to extrapolate results over longer periods. For short-term data, kinetic laws provide good results when pollution is low, but they cannot account for changes at highly polluted sites. It is therefore necessary to improve these kinetic approaches to consider the effect of pollution. The comparison between sheltered and unsheltered conditions indicated that the effect of pollution is significant when the water is in the form of rain, but also when it is in the vapour form (unsheltered and sheltered conditions). In particular, based on laboratory experiments, Boehm [33] highlighted that the SO2 concentration increases these alterations. The author explained this phenomenon by the higher dissolution of SO2 in the absorbed water layer, which decreases the pH and increases interdiffusion and crust (gypsum or syngenite) formation. This hypothesis should be confirmed by additional experiments to quantify this effect and to implement it in kinetic laws, e.g., through the pH in the alteration layer for the wet situation in Equation (5).
To be useful, models must be based on physico-chemical principles so that they can help elucidate processes, work at suitable temporal and spatial scales, and have practical applications [46]. Here, the objectives of the stained-glass alteration models were multiple. They were used to reconstruct the alteration history of medieval stained-glass windows. The modelling of long-term alteration requires the understanding of alteration processes and the determination of the associated kinetics. In this sense, the comparison of both kinds of models is fruitful. Because DRFs are statistical models, they cannot be extrapolated over long periods (typically decades or centuries), as the alteration is not constant. However, their comparison to kinetic laws highlighted the key role of pollutants such as SO2. Geochemical models are based on a more accurate description of the mechanisms and kinetics, but they should include the effects of air pollutants to be more realistic and to account for the variations between sites or environments. Thus, they could anticipate the future degradation of stained-glass windows in the context of climate change and pollution change. The case of Notre-Dame highlighted that an increase in temperature could accelerate the degradation of stained-glass windows. This impact needs to be confirmed by considering more finely the effect of a reduction in RH and precipitation that could counterbalance this increase. However, improved geochemical models could help decision making for the preservation of stained-glass windows. For example, climate data could be evaluated to consider solutions such as protective glazing. Then, the models could have a political application. DRFs have been used in the field of heritage to assess the economic and societal impacts of policies to reduce greenhouse gases and air pollutant emissions [47,48,49,50,51]. In stained-glass window conservation, geochemical models could also have value in simulating the actual process of their alteration as a function of relevant environmental parameters, and they could be appropriate for similar evaluations of climate and pollution scenarios.

4. Conclusions

Two kinds of model can be used to assess the alteration of medieval stained-glass windows. Each has advantages and drawbacks. Dose–response functions based on statistical evaluation can include a large set of climate or pollution parameters to assess the short-term alteration and estimate the risk for medieval stained-glass windows over different time periods. Kinetic laws based on the experimental determination of the alteration rate as a function of specific parameters can be extrapolated over longer time periods but are more limited in the number of environmental parameters they incorporate. The comparison of these models was valuable, as it validated the capacity of kinetic laws to predict alterations in low-pollution situations, but it also underlined the lack of underlying theory. This comparison emphasised the need for future research in the laboratory. Indeed, it would be particularly interesting to conduct experiments to better constrain the effect of SO2, in order to determine the associated kinetics and build a geochemical model that is able to account for its effect. The objective would be to quantify the effect of SO2 on the alteration rate under different conditions (concentration, temperature, and RH), and to determine how to implement this effect in a geochemical model. This would require us to understand, for example, if SO2 has an impact on the pH within the alteration layer or if it favours secondary phase formation, which retroacts on the alteration rate. The model must also better consider the influence of relative humidity.

Supplementary Materials

The following supporting information can be downloaded at: https://www.mdpi.com/article/10.3390/heritage6030164/s1, Table S1: Environmental parameters from 1325 to 2090 in Paris and thickness of the leached layer for medieval stained glass windows (LND in µm).

Author Contributions

Conceptualisation, A.V.-C.; investigation, A.V.-C., L.S. and P.B.; methodology, A.V.-C., L.S., R.-A.L. and P.B.; writing—original draft preparation, A.V.-C.; writing—review and editing, A.V.-C., L.S., R.-A.L. and P.B.; funding acquisition, A.V.-C. All authors have read and agreed to the published version of the manuscript.

Funding

This research was funded by Agence Nationale de la Recherche, GLAM project (ANR-14-CE22-0007).

Data Availability Statement

All the data presented in this study are given in the article and in the Supplementary Material.

Acknowledgments

Some of the data were collected by members of the Task Force and organisations including supporting organisations of the official UNECE ICP Materials network. These organisations are presented under the ‘Acknowledgements’ heading on the ICP Materials web page.

Conflicts of Interest

The authors declare no conflict of interest. The funders had no role in the design of the study; in the collection, analyses, or interpretation of data; in the writing of the manuscript; or in the decision to publish the results.

References

  1. Adlington, L.W.; Freestone, I.C.; Kunicki-Goldfinger, J.J.; Ayers, T.; Gilderdale Scott, H.; Eavis, A. Regional Patterns in Medieval European Glass Composition as a Provenancing Tool. J. Archaeol. Sci. 2019, 110, 104991. [Google Scholar] [CrossRef]
  2. Verney-Carron, A.; Sessegolo, L.; Chabas, A.; Lombardo, T.; Rossano, S.; Perez, A.; Valbi, V.; Boutillez, C.; Muller, C.; Vaulot, C.; et al. Alteration of Medieval Stained Glass Windows in Atmospheric Medium: Review and Simplified Alteration Model. NPJ Mater. Degrad. 2023. under review. [Google Scholar]
  3. Sterpenich, J.; Libourel, G. Using Stained Glass Windows to Understand the Durability of Toxic Waste Matrices. Chem. Geol. 2001, 174, 181–193. [Google Scholar] [CrossRef]
  4. Bräutigam, U.; Bürger, H.; Völksch, G. Investigations into Structure and Composition of Gel Layers on Medieval Window Glasses of the Katharinenkirche, Oppenheim (Germany), and the Cathedral St. Gatien, Tours (France). Glastech. Ber. Glass Sci. Technol. 1995, 68, 29–33. [Google Scholar]
  5. Carmona, N.; García-Heras, M.; Gil, C.; Villegas, M.A. Vidrios y Grisallas Del s. XV de La Cartuja de Miraflores (Burgos): Caracterización y Estado de Conservación. Bol. Soc. Esp. Ceram. Vidr. 2005, 44, 251–258. [Google Scholar] [CrossRef]
  6. Carmona, N.; Laiz, L.; Gonzalez, J.M.; Garcia-Heras, M.; Villegas, M.A.; Saiz-Jimenez, C. Biodeterioration of Historic Stained Glasses from the Cartuja de Miraflores (Spain). Int. Biodeterior. Biodegrad. 2006, 58, 155–161. [Google Scholar] [CrossRef]
  7. Garcia-Vallès, M.; Vendrell-Saz, M. The Glasses of the Transept’s Rosette of the Cathedral of Tarragona: Characterization, Classification and Decay. Bol. Soc. Esp. Ceram. Vidr. 2002, 41, 217–224. [Google Scholar]
  8. Gillies, K.J.S.; Cox, A. Decay of Medieval Stained Glass at York, Canterbury and Carlisle. I: Composition of the Glass and Its Weathering Products. Glastech. Ber. 1988, 61, 75–84. [Google Scholar]
  9. Lombardo, T.; Loisel, C.; Gentaz, L.; Chabas, A.; Verita, M.; Pallot-Frossard, I. Long Term Assessment of Atmospheric Decay of Stained Glass Windows. Corros. Eng. Sci. Technol. 2010, 45, 420–424. [Google Scholar] [CrossRef]
  10. Marchesi, V.; Messiga, B.; Riccardi, M.P. Window Panes of the Certosa Di Pavia: Chemical Composition, Microstructure and Alteration. Surf. Eng. 2005, 21, 397–401. [Google Scholar] [CrossRef]
  11. Messiga, B.; Riccardi, M.P. Alteration Behaviour of Glass Panes from the Medieval Pavia Charterhouse (Italy). J. Cult. Herit. 2006, 7, 334–338. [Google Scholar] [CrossRef]
  12. Perez y Jorba, M.; Dallas, J.P.; Bauer, C.; Bahezre, C.; Martin, J.C. Deterioration of Stained Glass by Atmospheric Corrosion and Micro-Organisms. J. Mater. Sci. 1980, 15, 1640–1647. [Google Scholar] [CrossRef]
  13. Piñar, G.; Garcia-Valles, M.; Gimeno-Torrente, D.; Fernandez-Turiel, J.L.; Ettenauer, J.; Sterflinger, K. Microscopic, Chemical, and Molecular-Biological Investigation of the Decayed Medieval Stained Window Glasses of Two Catalonian Churches. Int. Biodeterior. Biodegrad. 2013, 84, 388–400. [Google Scholar] [CrossRef]
  14. Schreiner, M. Deterioration of Stained Medieval Glass by Atmospheric Attack. Part 1. Scanning Electron Microscopic Investigations of the Weathering Phenomena. Glastech. Ber. 1988, 61, 197–204. [Google Scholar]
  15. Schreiner, M. Deterioration of Stained Medieval Glass by Atmospheric Attack. Part 2. Secondary Ion Mass Spectrometry Analysis of the Naturally Weathered Glass Surfaces. Glastech. Ber. 1988, 61, 223–229. [Google Scholar]
  16. Sessegolo, L.; Verney-Carron, A.; Saheb, M.; Remusat, L.; Gonzalez-Cano, A.; Nuns, N.; Mertz, J.-D.; Loisel, C.; Chabas, A. Long-Term Weathering Rate of Stained-Glass Windows Using H and O Isotopes. NPJ Mater. Degrad. 2018, 2, 17. [Google Scholar] [CrossRef] [Green Version]
  17. Lefèvre, R.-A.; Grégoire, M.; Derbez, M.; Ausset, P. Origin Of Sulphated Grey Crusts On Glass In Polluted Urban Atmosphere: Stained Glass Windows Of Tours Cathedral (France). Glastech. Ber. Glass Sci. Technol. 1998, 71, 75–80. [Google Scholar]
  18. Lombardo, T.; Gentaz, L.; Verney-Carron, A.; Chabas, A.; Loisel, C.; Neff, D.; Leroy, E. Characterisation of Complex Alteration Layers in Medieval Glasses. Corros. Sci. 2013, 72, 10–19. [Google Scholar] [CrossRef]
  19. Verney-Carron, A.; Sessegolo, L.; Saheb, M.; Valle, N.; Ausset, P.; Losno, R.; Mangin, D.; Lombardo, T.; Chabas, A.; Loisel, C. Understanding the Mechanisms of Si–K–Ca Glass Alteration Using Silicon Isotopes. Geochim. Cosmochim. Acta 2017, 203, 404–421. [Google Scholar] [CrossRef]
  20. Gentaz, L. Simulation et Modélisation de l’altération Des Verres de Composition Médiévale Dans L’atmosphère Urbaine. Ph.D. Thesis, Université Paris-Est, Marne-la-Vallée, France, 2011. [Google Scholar]
  21. Gentaz, L.; Lombardo, T.; Loisel, C.; Chabas, A.; Vallotto, M. Early Stage of Weathering of Medieval-like Potash-Lime Model Glass: Evaluation of Key Factors. Environ. Sci. Pollut. Res. Int. 2011, 18, 291–300. [Google Scholar] [CrossRef]
  22. Geotti-Bianchini, F.; Nicola, C.; Preo, M.; Vallotto, M.; Verita, M. MicroIRRS and EPMA Study of the Weathering of Potash-Lime-Silicate Glasses. Riv. Stn. Sper. Vetro 2005, 35, 49–61. [Google Scholar]
  23. Melcher, M.; Schreiner, M. Evaluation Procedure for Leaching Studies on Naturally Weathered Potash-Lime-Silica Glasses with Medieval Composition by Scanning Electron Microscopy. J. Non-Cryst. Solids 2005, 351, 1210–1225. [Google Scholar] [CrossRef]
  24. Melcher, M.; Schreiner, M. Leaching Studies on Naturally Weathered Potash-Lime–Silica Glasses. J. Non-Cryst. Solids 2006, 352, 368–379. [Google Scholar] [CrossRef]
  25. Melcher, M.; Schreiner, M. Quantification of the Influence of Atmospheric Pollution on the Weathering of Low-Durability Potash-Lime-Silica Glasses. Pollut. Atmos. 2007, 49, 13–22. [Google Scholar]
  26. Melcher, M.; Schreiner, M. Results from the Multipollutant Programme: Evaluation of the Decay to Glass Samples of Medieval Composition after 3, 4, 5 and 6 Years of Exposure. Part B: Results of the Unsheltered Exposure; UNECE International Co-Operative Programme on Effects on Materials, Including Historic and Cultural Monuments; Institute of Sciences and Technologies in Art, Academy of Fine Arts: Vienna, Austria, 2004; p. 136. [Google Scholar]
  27. Munier, I.; Lefèvre, R.; Geotti-Bianchini, F.; Verità, M. Influence of Polluted Urban Atmosphere on the Weathering of Low Durability Glasses. Glass Technol. 2002, 43, 225–237. [Google Scholar]
  28. Tidblad, J.; Kucera, V.; Ferm, M.; Kreislova, K.; Brüggerhoff, S.; Doytchinov, S.; Screpanti, A.; Grøntoft, T.; Yates, T.; de la Fuente, D.; et al. Effects of Air Pollution on Materials and Cultural Heritage: ICP Materials Celebrates 25 Years of Research. Int. J. Corros. 2012, 2012, e496321. [Google Scholar] [CrossRef]
  29. Gentaz, L.; Lombardo, T.; Chabas, A.; Loisel, C.; Neff, D.; Verney-Carron, A. Role of Secondary Phases in the Scaling of Stained Glass Windows Exposed to Rain. Corros. Sci. 2016, 109, 206–216. [Google Scholar] [CrossRef]
  30. Melcher, M.; Schreiner, M. Statistical Evaluation of Potash-Lime-Silica Glass Weathering. Anal. Bioanal. Chem. 2004, 379, 628–639. [Google Scholar] [CrossRef]
  31. Woisetschläger, G.; Schreiner, M. Evaluation of Decay to Glass Samples after 1 and 2 Years of Exposure; UNECE International Co-Operative Programme on Effects on Materials, Including Historic and Cultural Monumentsicp Materials; Institute of Chemistry, Academy of Fine Arts: Vienna, Austria, 1998; p. 68. [Google Scholar]
  32. Sessegolo, L.; Verney-Carron, A.; Ausset, P.; Nowak, S.; Triquet, S.; Saheb, M.; Chabas, A. Alteration Rate of Medieval Potash-Lime Silicate Glass as a Function of PH and Temperature: A Low PH-Dependent Dissolution. Chem. Geol. 2020, 550, 119704. [Google Scholar] [CrossRef]
  33. Boehm, T. The Influence of Temperature, Relative Humidity and SO2 Concentration on Weathering of Glass. In Proceedings of the 5th ESG Conference, Prague, Czech Republic, 21–24 June 1999; pp. 49–55. [Google Scholar]
  34. Carmona, N.; Villegas, M.A.; Fernández Navarro, J.M. Corrosion Behaviour of R2O–CaO–SiO2 Glasses Submitted to Accelerated Weathering. J. Am. Ceram. Soc. 2005, 25, 903–910. [Google Scholar] [CrossRef]
  35. Sessegolo, L.; Verney-Carron, A.; Valle, N.; Ausset, P.; Narayanasamy, S.; Nowak, S.; Fourdrin, C.; Saheb, M.; Chabas, A. Alteration of Potash-Lime Silicate Glass in Atmospheric Medium: Study of Mechanisms and Kinetics Using 18O and D Isotopes. J. Non-Cryst. Solids 2021, 570, 121020. [Google Scholar] [CrossRef]
  36. Brimblecombe, P.; Lefèvre, R.-A. Weathering of Materials at Notre-Dame from Changes in Air Pollution and Climate in Paris, 1325–2090. J. Cult. Herit. 2021, 50, 88–94. [Google Scholar] [CrossRef]
  37. Tidblad, J.; Kreislová, K.; Faller, M.; de la Fuente, D.; Yates, T.; Verney-Carron, A.; Grøntoft, T.; Gordon, A.; Hans, U. ICP Materials Trends in Corrosion, Soiling and Air Pollution (1987–2014). Materials 2017, 10, 969. [Google Scholar] [CrossRef] [Green Version]
  38. Tidblad, J.; Kucera, V.; Mikhailov, A.A.; Henriksen, J.; Kreislova, K.; Yates, T.; Stöckle, B.; Schreiner, M. UN ECE ICP Materials: Dose-Response Functions on Dry and Wet Acid Deposition Effects After 8 Years of Exposure. Water Air Soil Pollut. 2001, 130, 1457–1462. [Google Scholar] [CrossRef]
  39. Melcher, M.; Schreiner, M. Results from the Multipollutant Programme: Evaluation of the Decay to Glass Samples of Medieval Composition after 3, 4, 5 and 6 Years of Exposure. Part A: Results of the Sheltered Exposure; UNECE International Co-Operative Programme on Effects on Materials, Including Historic and Cultural Monuments; Institute of Sciences and Technologies in Art, Academy of Fine Arts: Vienna, Austria, 2003; p. 167. [Google Scholar]
  40. Doremus, R. Interdiffusion of Hydrogen and Alkali Ions in a Glass Surface. J. Non-Cryst. Solids 1975, 19, 137–144. [Google Scholar] [CrossRef]
  41. Chave, T.; Frugier, P.; Ayral, A.; Gin, S. Solid State Diffusion during Nuclear Glass Residual Alteration in Solution. J. Nucl. Mater. 2007, 362, 466–473. [Google Scholar] [CrossRef]
  42. Grambow, B. A General Rate Equation for Nuclear Waste Glass Corrosion. MRS Online Proc. Libr. Arch. 1984, 44, 15–27. [Google Scholar] [CrossRef]
  43. Ionescu, A.; Lefèvre, R.-A.; Brimblecombe, P.; Grossi, C.M. Long-Term Damage to Glass in Paris in a Changing Environment. Sci. Total Environ. 2012, 431, 151–156. [Google Scholar] [CrossRef]
  44. Brimblecombe, P. London Air Pollution, 1500–1900. Atmos. Environ. 1977, 11, 1157–1162. [Google Scholar] [CrossRef]
  45. Brimblecombe, P.; Grossi, C.M. Millennium-Long Recession of Limestone Facades in London. Environ. Geol. 2008, 56, 463–471. [Google Scholar] [CrossRef]
  46. Richards, J.; Brimblecombe, P. The Transfer of Heritage Modelling from Research to Practice. Herit. Sci. 2022, 10, 17. [Google Scholar] [CrossRef]
  47. Di Turo, F.; Proietti, C.; Screpanti, A.; Fornasier, M.F.; Cionni, I.; Favero, G.; De Marco, A. Impacts of Air Pollution on Cultural Heritage Corrosion at European Level: What Has Been Achieved and What Are the Future Scenarios. Environ. Pollut. 2016, 218, 586–594. [Google Scholar] [CrossRef]
  48. Grøntoft, T. Maintenance Costs for European Zinc and Portland Limestone Surfaces Due to Air Pollution since the 1980s. Sustain. Cities Soc. 2018, 39, 1–15. [Google Scholar] [CrossRef]
  49. Grøntoft, T. Conservation-Restoration Costs for Limestone Façades Due to Air Pollution in Krakow, Poland, Meeting European Target Values and Expected Climate Change. Sustain. Cities Soc. 2017, 29, 169–177. [Google Scholar] [CrossRef]
  50. Grøntoft, T.; Verney-Carron, A.; Tidblad, J. Cleaning Costs for European Sheltered White Painted Steel and Modern Glass Surfaces Due to Air Pollution Since the Year 2000. Atmosphere 2019, 10, 167. [Google Scholar] [CrossRef] [Green Version]
  51. Spezzano, P. Mapping the Susceptibility of UNESCO World Cultural Heritage Sites in Europe to Ambient (Outdoor) Air Pollution. Sci. Total Environ. 2021, 754, 142345. [Google Scholar] [CrossRef]
Figure 1. Leached layer thickness (L in µm) after six months of unsheltered exposure in different sites estimated from measurements on model glass (data), based on dose–response functions (DRF) and from kinetic laws (KL).
Heritage 06 00164 g001
Figure 2. Leached layer thickness (L in µm) after 12 months of unsheltered exposure in different sites estimated from measurements on model glass (data), based on dose–response functions (DRF) and from kinetic laws (KL).
Heritage 06 00164 g002
Figure 3. Alteration rate (for the 1st year, in µm·a−1) of medieval stained-glass windows in Notre-Dame from 1325 to 2090 based on DRFs and KLs. Climate and pollution data used as input are presented in Brimblecombe and Lefèvre [36] and Table S1.
Heritage 06 00164 g003
Figure 4. Evolution of the leached layer thickness (in µm) of medieval stained-glass windows in Notre-Dame from 1325 to 2090 predicted by KLs. The blue curve represents the climate and pollution data provided in Brimblecombe and Lefèvre [36] and Table S1. The orange curve represents only the situation of 1325, without changes.
Heritage 06 00164 g004
Table 1. Chemical composition (in wt.%) of the model glass samples.
GlassSiO2K2OCaOP2O5Na2OMgOAl2O3MnOFe2O3
M148.025.515.04.03.03.01.5
M360.015.025.0
SG351.319.216.83.81.14.01.81.01.2
Table 2. Environmental parameters (average temperature T in °C, average relative humidity RH in %, average SO2 and NO2 concentrations expressed in µg·m−3, cumulated rainfall amount r in mm, average pH of rain) for 6 and 12 months of exposure (between October 1993 and April or October 1994) [31] and thickness of the leached layer (L6U or L12U in µm) for each site in unsheltered position. The leached layer thickness values are from the ICP-Materials program (data) [31] with an associated uncertainty of 10% [24]. They were also calculated using the dose–response function (DRF, Equations (1) and (2)) and the kinetic laws (KL, Equations (5)–(8)). ‘n.a.’ means not available.
6-Month Exposure (October 1993–April 1994)12-Month Exposure (October 1993–October 1994)
Environmental DataL6UEnvironmental DataL12U
SiteTRHSO2NO2rpHDataDRFKLTRHSO2NO2rpHDataDRFKL
°C%µg·m−3mm µmµmµm°C%µg·m−3mm µmµmµm
Kaperske Hory (Czech Rep.) 1.57720.28.5124.74.63.95.02.37.37316.77.11006.75.17.36.44.5
Kopisty (Czech Rep.)3.48052.232.9252.44.917.18.52.69.87451.128.51343.50.522.121.412.6
Ähtari (Finland)−6.2872.25.4230.54.51.41.52.32.0801.34529.14.64.02.93.8
Helsinki (Finland)−2.4849.537.8253.74.43.43.52.65.0766.836.3621.54.43.55.04.3
Waldhof-Langenbrügge (Germany)2.99011.513.3392.64.63.93.93.18.9827.39.5723.34.53.86.85.0
Aschaffenburg (Germany)5.47016.241.84034.84.44.53.111.46411.740.27494.83.33.64.5
Bottrop (Germany)5.88345.840.7439.54.77.38.33.311.17935.837.9764.64.87.011.84.8
Garmisch-Partenkirchen (Germany)2.2834.717.3391.15.21.52.22.89.8802.110.71195.15.23.63.64.9
Rome (Italy)15.37218.526.86625.95.04.63.619.56713.929.1875.85.12.34.55.3
Casaccia (Italy)10.8804.712n.a.4.91.4n.a.n.a.15.3744.811.3n.a.4.9n.a.3.9n.a.
Milan (Italy)96854.294.1504.24.24.711.63.615.06831.785.91202.84.315.36.76.0
Vredepeel (Netherlands)5888.830.5451.15.83.23.02.910.0836.727.8875.25.110.06.84.9
Oslo (Norway)−1.4767.259.2333.64.71.92.92.66.8715.154.9789.44.82.93.54.4
Birkenes (Norway)−1.4851.13.11046.64.42.01.43.64.9790.92.31646.94.41.62.45.4
Stockholm (Sweden)0.3787.426.8138.74.34.72.92.46.9705.224.8513.44.63.23.34.2
Aspvreten (Sweden)−0.1882.84.5270.14.21.91.92.85.9831.83.7585.34.46.93.84.5
London (UK)n.a.n.a.n.a.n.a.n.a.n.a.5.8n.a.n.a.n.a.n.a.n.a.n.a.n.a.n.a.14.1n.a.n.a.
Wells (UK)n.a.n.a.n.a.n.a.n.a.n.a.3.5n.a.n.a.n.a.n.a.n.a.n.a.n.a.n.a.4.3n.a.n.a.
Toledo (Spain)8.3693.920.8362.65.81.41.92.613.9582.519.1487.35.91.61.43.8
Moscow (Russia)−3.98018.326.9324.16.25.64.52.14.47417.631.3717.2610.06.83.6
Lisbon (Portugal)15.46812.537561.55.54.33.73.418.26412.537808.25.66.93.74.7
Dorset (Canada)−6.18117.8n.a.n.a.n.a.2.0n.a.n.a.3.48113.8n.a.n.a.n.a.1.7n.a.n.a.
Steubenville (USA)2.86251.544.3468.5n.a.2.9n.a.n.a.10.66843.840.61072.4n.a.2.6n.a.n.a.
Disclaimer/Publisher’s Note: The statements, opinions and data contained in all publications are solely those of the individual author(s) and contributor(s) and not of MDPI and/or the editor(s). MDPI and/or the editor(s) disclaim responsibility for any injury to people or property resulting from any ideas, methods, instructions or products referred to in the content.

