Article

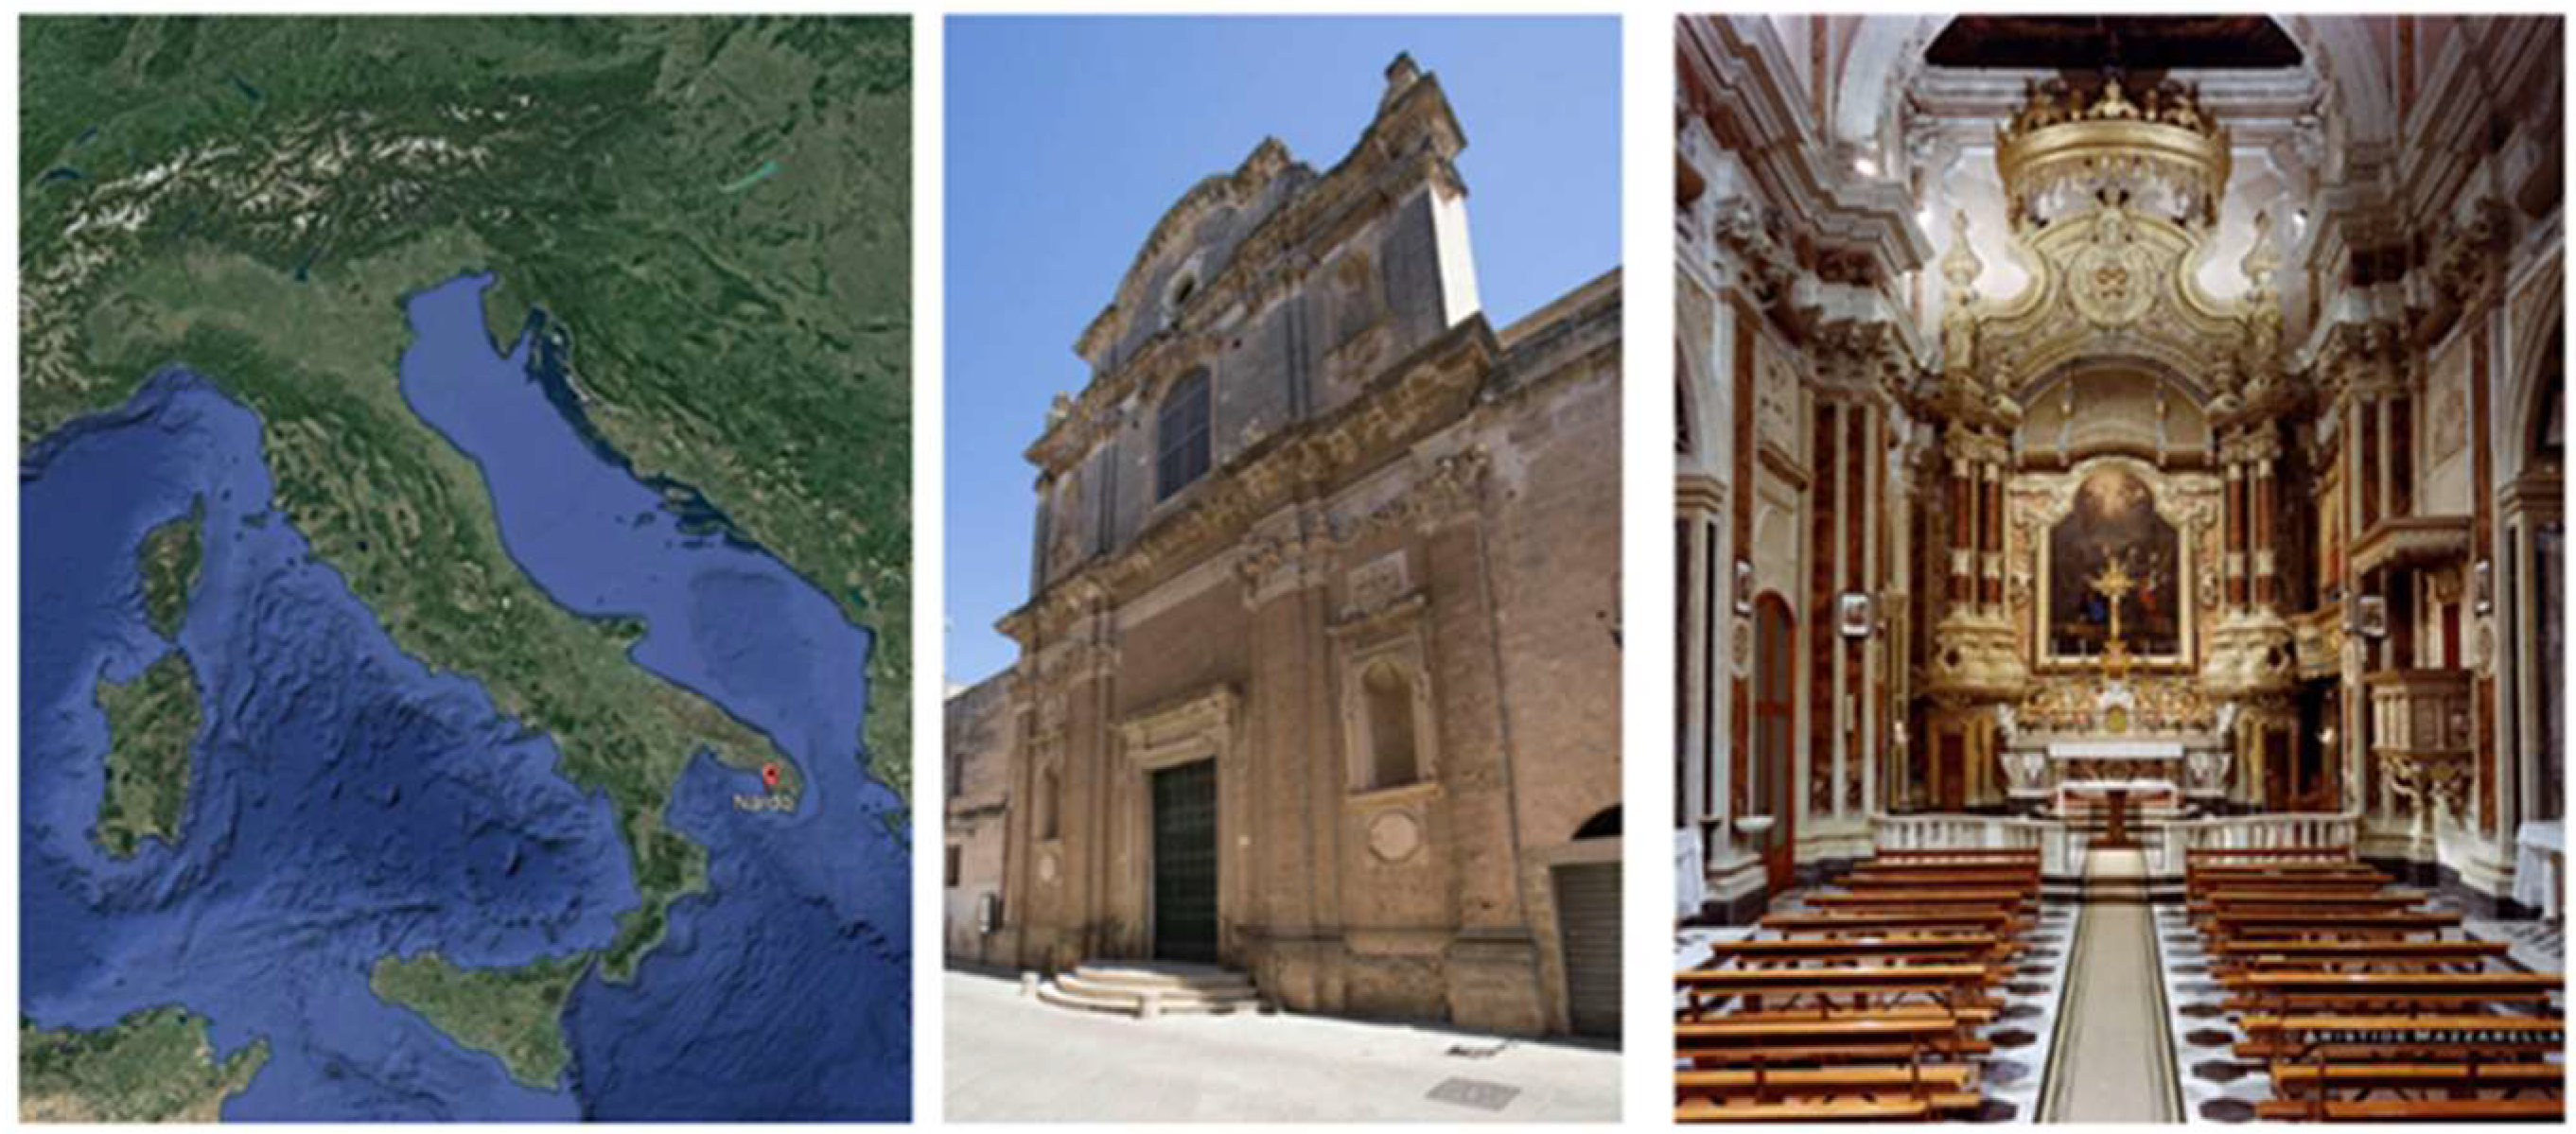
Geophysical Investigation at the Santa Chiara Church in Nardò (Southern Italy)

1
Institute of Heritage Science, National Research Council, 73100 Lecce, Italy
2
Dipartimento di Scienze Umanistiche, University of Catania, 95131 Catania, Italy
*
Author to whom correspondence should be addressed.
Heritage 2023, 6(3), 2978-2989; https://doi.org/10.3390/heritage6030158
Submission received: 21 December 2022 / Revised: 8 February 2023 / Accepted: 21 February 2023 / Published: 12 March 2023
(This article belongs to the Special Issue Geophysical Surveys for Heritage and Archaeology)

Abstract

:
The church of Santa Chiara with its adjacent convent, whose foundations date back to the 13th century, is a monastic complex in the city of Nardò in the province of Lecce. The current church was built ex novo between the 17th and 18th centuries under the direction of Bishop Orazio Fortunato. Currently, there is no information about the presence of crypts or burials in the church and in the adjacent area. For this reason, a campaign of geophysical investigations was undertaken using electromagnetic, electrical resistivity and ground-penetrating radar methods. Geophysical investigations were carried out both inside and in the courtyard of the church. The results showed the presence of a series of anomalies, whose interpretation suggests important structures of probable archaeological interest.

1. Introduction

The monastery of Santa Chiara, among the oldest in Southern Italy, is traced back by a few to the 16th century; more probably, it should be placed in the following century, according to the documentation present in the archive of the monastery. Inside the monastery, there was a small rectangular church with barrel vaults supported by pointed arches. The church had only one altar and was entirely frescoed. In 1693, the bishop Orazio Fortunato ordered the construction of a new church, the current church of Santa Chiara, which was inaugurated on 31 May 1698 [1].
The church consists of a single nave. On each side of the nave, there are three chapels distinguished by pilasters with capitals decorated in marble. In the 19th century, there was restoration work on the altars of the six chapels [1,2]. The church is located in Nardò, a city about 25 km south of Lecce (Figure 1).
Geophysical surveys have assumed an important role in the monitoring of historical monuments and generally of built cultural heritage [3,4,5,6,7,8,9,10,11,12,13,14,15].
This type of investigation allows for the highlighting of the degree of fracturing, the presence of voids, the volumetric water content and other useful information in the preliminary phase of a restoration. Another type of information extrapolated from geophysical surveys is linked to the possibility of understanding the probable changes that the structure in question may have had over the centuries [3,4,5,6,7,8,9,10,11,12,13,14,15].
Several geophysical methods can be used in archaeological investigations, including churches. Ground-penetrating radar (GPR) has been applied for 25 years in archaeological prospections to map shallow subsurface targets [8]. It suffers from changes in variations to three physical parameters (relative dielectric constant, electrical conductivity and magnetic permeability) of the subsoil [8]. It can be used to detect buried materials that present a contrast of the above physical parameters. It has a higher resolution than other geophysical techniques for the localization of buried structures into the shallow subsurface.
Electrical resistivity tomography (ERT) has been widely used in archaeology [16]. ERT yields more information than conventional resistivity mapping or imaging about depth, true resistivity and the extent of buried archaeological structures. The ERT technique is an alternative to GPR in urban archaeology, but they can be used together to resolve uncertainties related to the two methods [16].
The electromagnetic method generates a primary electromagnetic field and induces, within the range of this field, secondary electric currents in metal objects. In this way, a secondary electromagnetic field is created and this field is measured at multiple time intervals. The rate of decay of this secondary field is proportionate to the size and depth of the object. This technique can be used both on land and under water. An important advantage of this technique is that not only can objects containing iron be detected, but also cast iron and other alloys [8].
Furthermore, the non-invasiveness of geophysical methodologies makes them even more interesting if applied to historical monuments where non-invasiveness is a must. In the Salento peninsula, the area where the city of Nardò is located, there are innumerable historical monuments (with a large number of churches) that date back to periods ranging from the 11th to the 18th century. These monuments have very important architectural structures. Churches in particular were, in many cases, used as burial places for important people. The various restoration works carried out over the centuries, in a few cases, have erased their traces. In these cases, geophysical investigations become important and help to provide information on what the subsoil of the churches hides [11,12,13,14,15,16]. In the international literature, there are numerous examples of the application of geophysics in churches. In this case, special targets are crypts and tombs [17,18,19,20]. Another important target is linked to the fact that a particular building may have had important changes over the centuries. In many cases, it is not possible to find the documentation relating to the changes made or the documentation has been lost. In these cases, geophysics can be of help in reconstructing the structural changes undergone by the historical monument. Currently, there is no information about the presence of crypts or burials in the church and in the adjacent area.
For this reason, a campaign of geophysical investigations using electromagnetic (EM), electrical resistivity tomography (ERT) and ground-penetrating radar (GPR) methods was undertaken.

2. Materials and Methods

GPR measurements were performed in areas A, B, C and D (Figure 2). An IDS RIS Hi-Mod GeoRadar equipped with a dual-band antenna with central frequencies of 200–600 MHz was used. GPR data were acquired in a grid with parallel profiles spaced at 0.2 m. In total, 140 GPR profiles were acquired.
The two-way time window was 80 ns (nanoseconds) for the 600 MHz antenna and 160 ns for 200 MHz antenna. The sample interval and the trace interval were, respectively, 512 samples per scan and 0.02 m. GPR data were processed using GPR-Slice Software (GPR-SLICE Software (gpr-survey.com) accessed on 10 December 2019). The 2D data were processed in order to eliminate a small noise component present in the data. For this reason, the following processing steps were applied: (i) data editing, which allowed for the insertion of geometric information (position of the profile within the grid) in order to then be able to create the 3D representation of the results; (ii) band pass filter, to eliminate both low and high-frequency noise components; (iii) manual adjustment of the gain, to try to improve the vision of the deepest anomalies; (iv) removal of the average trace (background removal filter), to eliminate the horizontal components of the signal present on the radar sections and due to ringing; (v) Kirchhoff migration, using an average velocity value of the electromagnetic wave equal to 0.075 m/ns. Migration allows hyperbolic-shaped reflected events to be given their real size by collapsing the hyperbolas into their apex. The electromagnetic wave velocity was estimated using the diffraction hyperbola method [21,22,23,24].
The data thus processed were subsequently used for the construction of the 3D volumes. This allowed us to view the same data in various ways and subsequently simplify their interpretation. As the data acquired with the 200 MHz antenna did not provide more information than those acquired with the 600 MHz one, only the results relating to the data acquired with the 600 MHz antenna are presented in this work.
ERT data were acquired using a Syscal Kid georesistivimeter with 24 active channels. Areas A and B were investigated. The dipole–dipole array was taken into consideration, which is the most used for archaeology applications as it allows the vertical variations in resistivity linked to the presence of tombs, crypts, walls, etc., to be better highlighted. The distance between the electrodes was chosen to be equal to 0.25 m and, having only 24 electrodes available, the roll along was used to allow a snake-type acquisition [22]. The distance between the profiles was 0.25 m.
Electrocardiogram electrodes were used to avoid piercing the floor (Figure 3). Here, the contact resistance was low (about 3000–3500 ohm m). This was probably due to the high humidity inside the church. ERTLab 2.0 software (http://www.geostudiastier.it/home_en.asp?sezione=2 accessed on 10 December 2019) was used to process the data in a 3D mode. This software uses the tetrahedral finite element iterative method (data variance iterative reweighting).
EM measurements were performed in areas C and D where ERT measurements were not possible due to the high contact resistance (concrete floor). CMD explorer multi-depth electromagnetic conductivity meters by GF instruments were used. Here, 46 parallel profiles spaced at 0.2 m were acquired. The sampling rate was 10 Hz. A probe with three receivers was used. This allowed us to investigate the shallow subsoil (about 2.5 m in depth). EM data were processed using Res3Dinv software [20].

3. Results

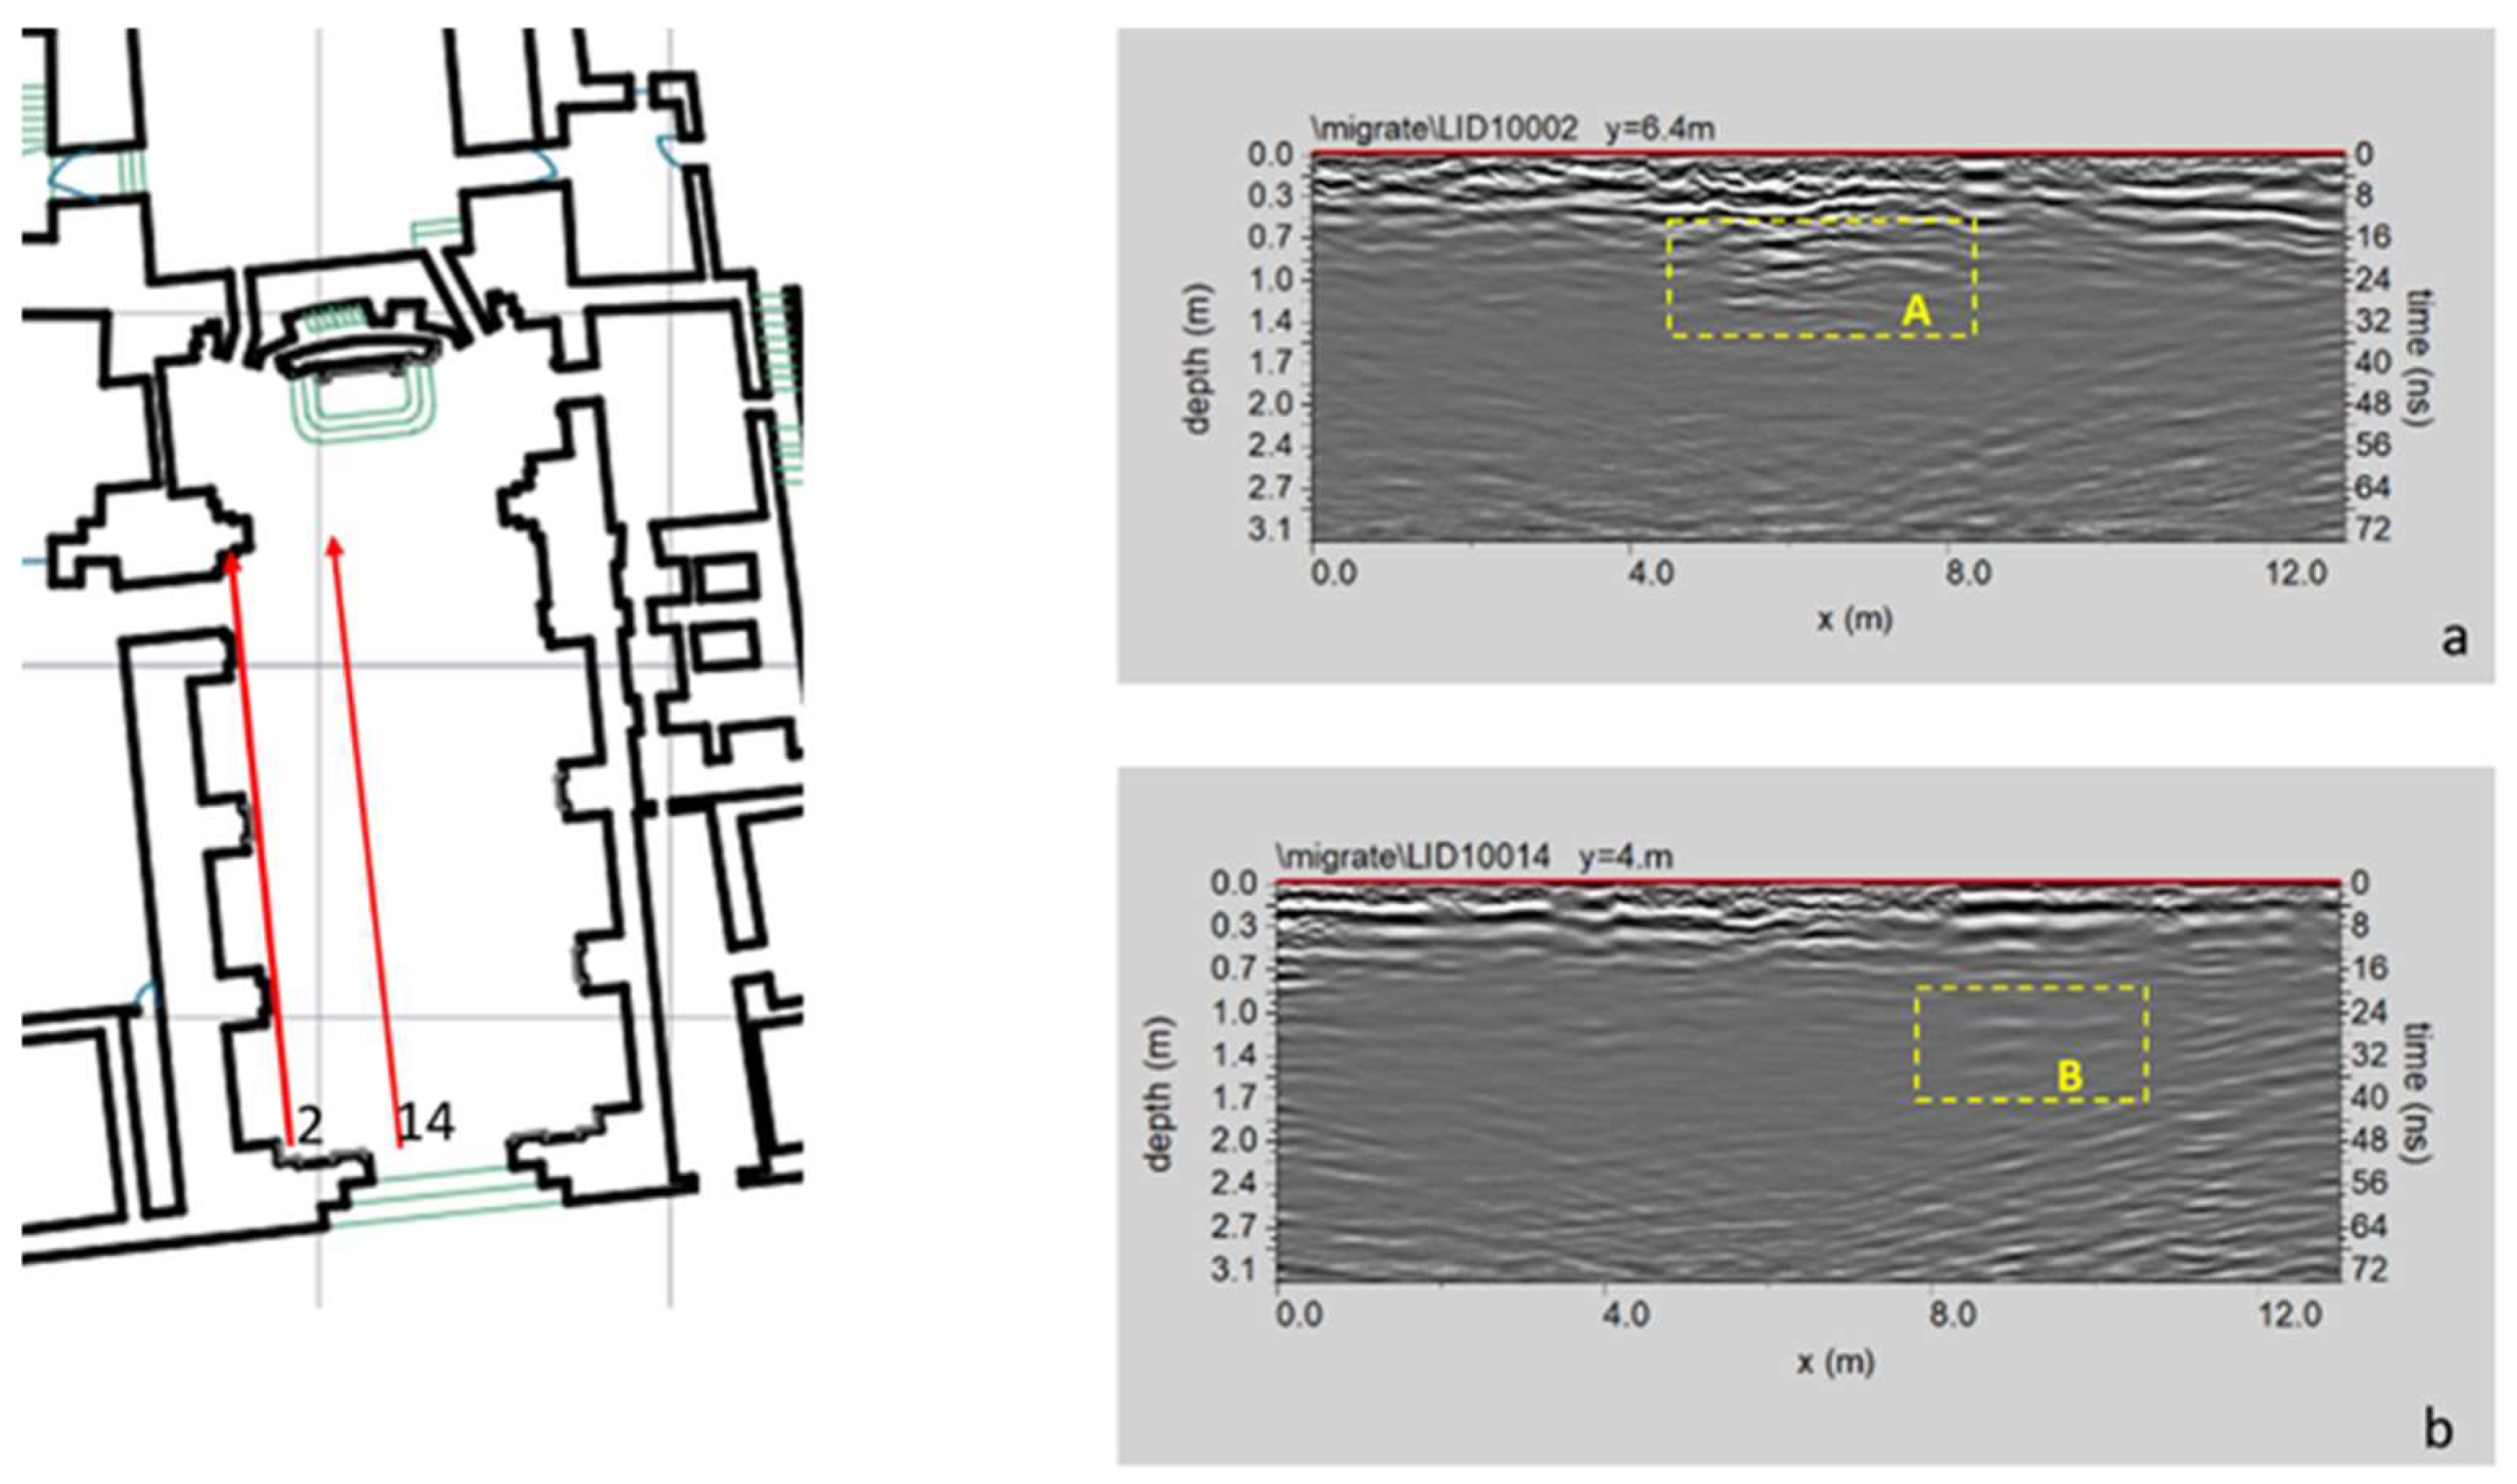
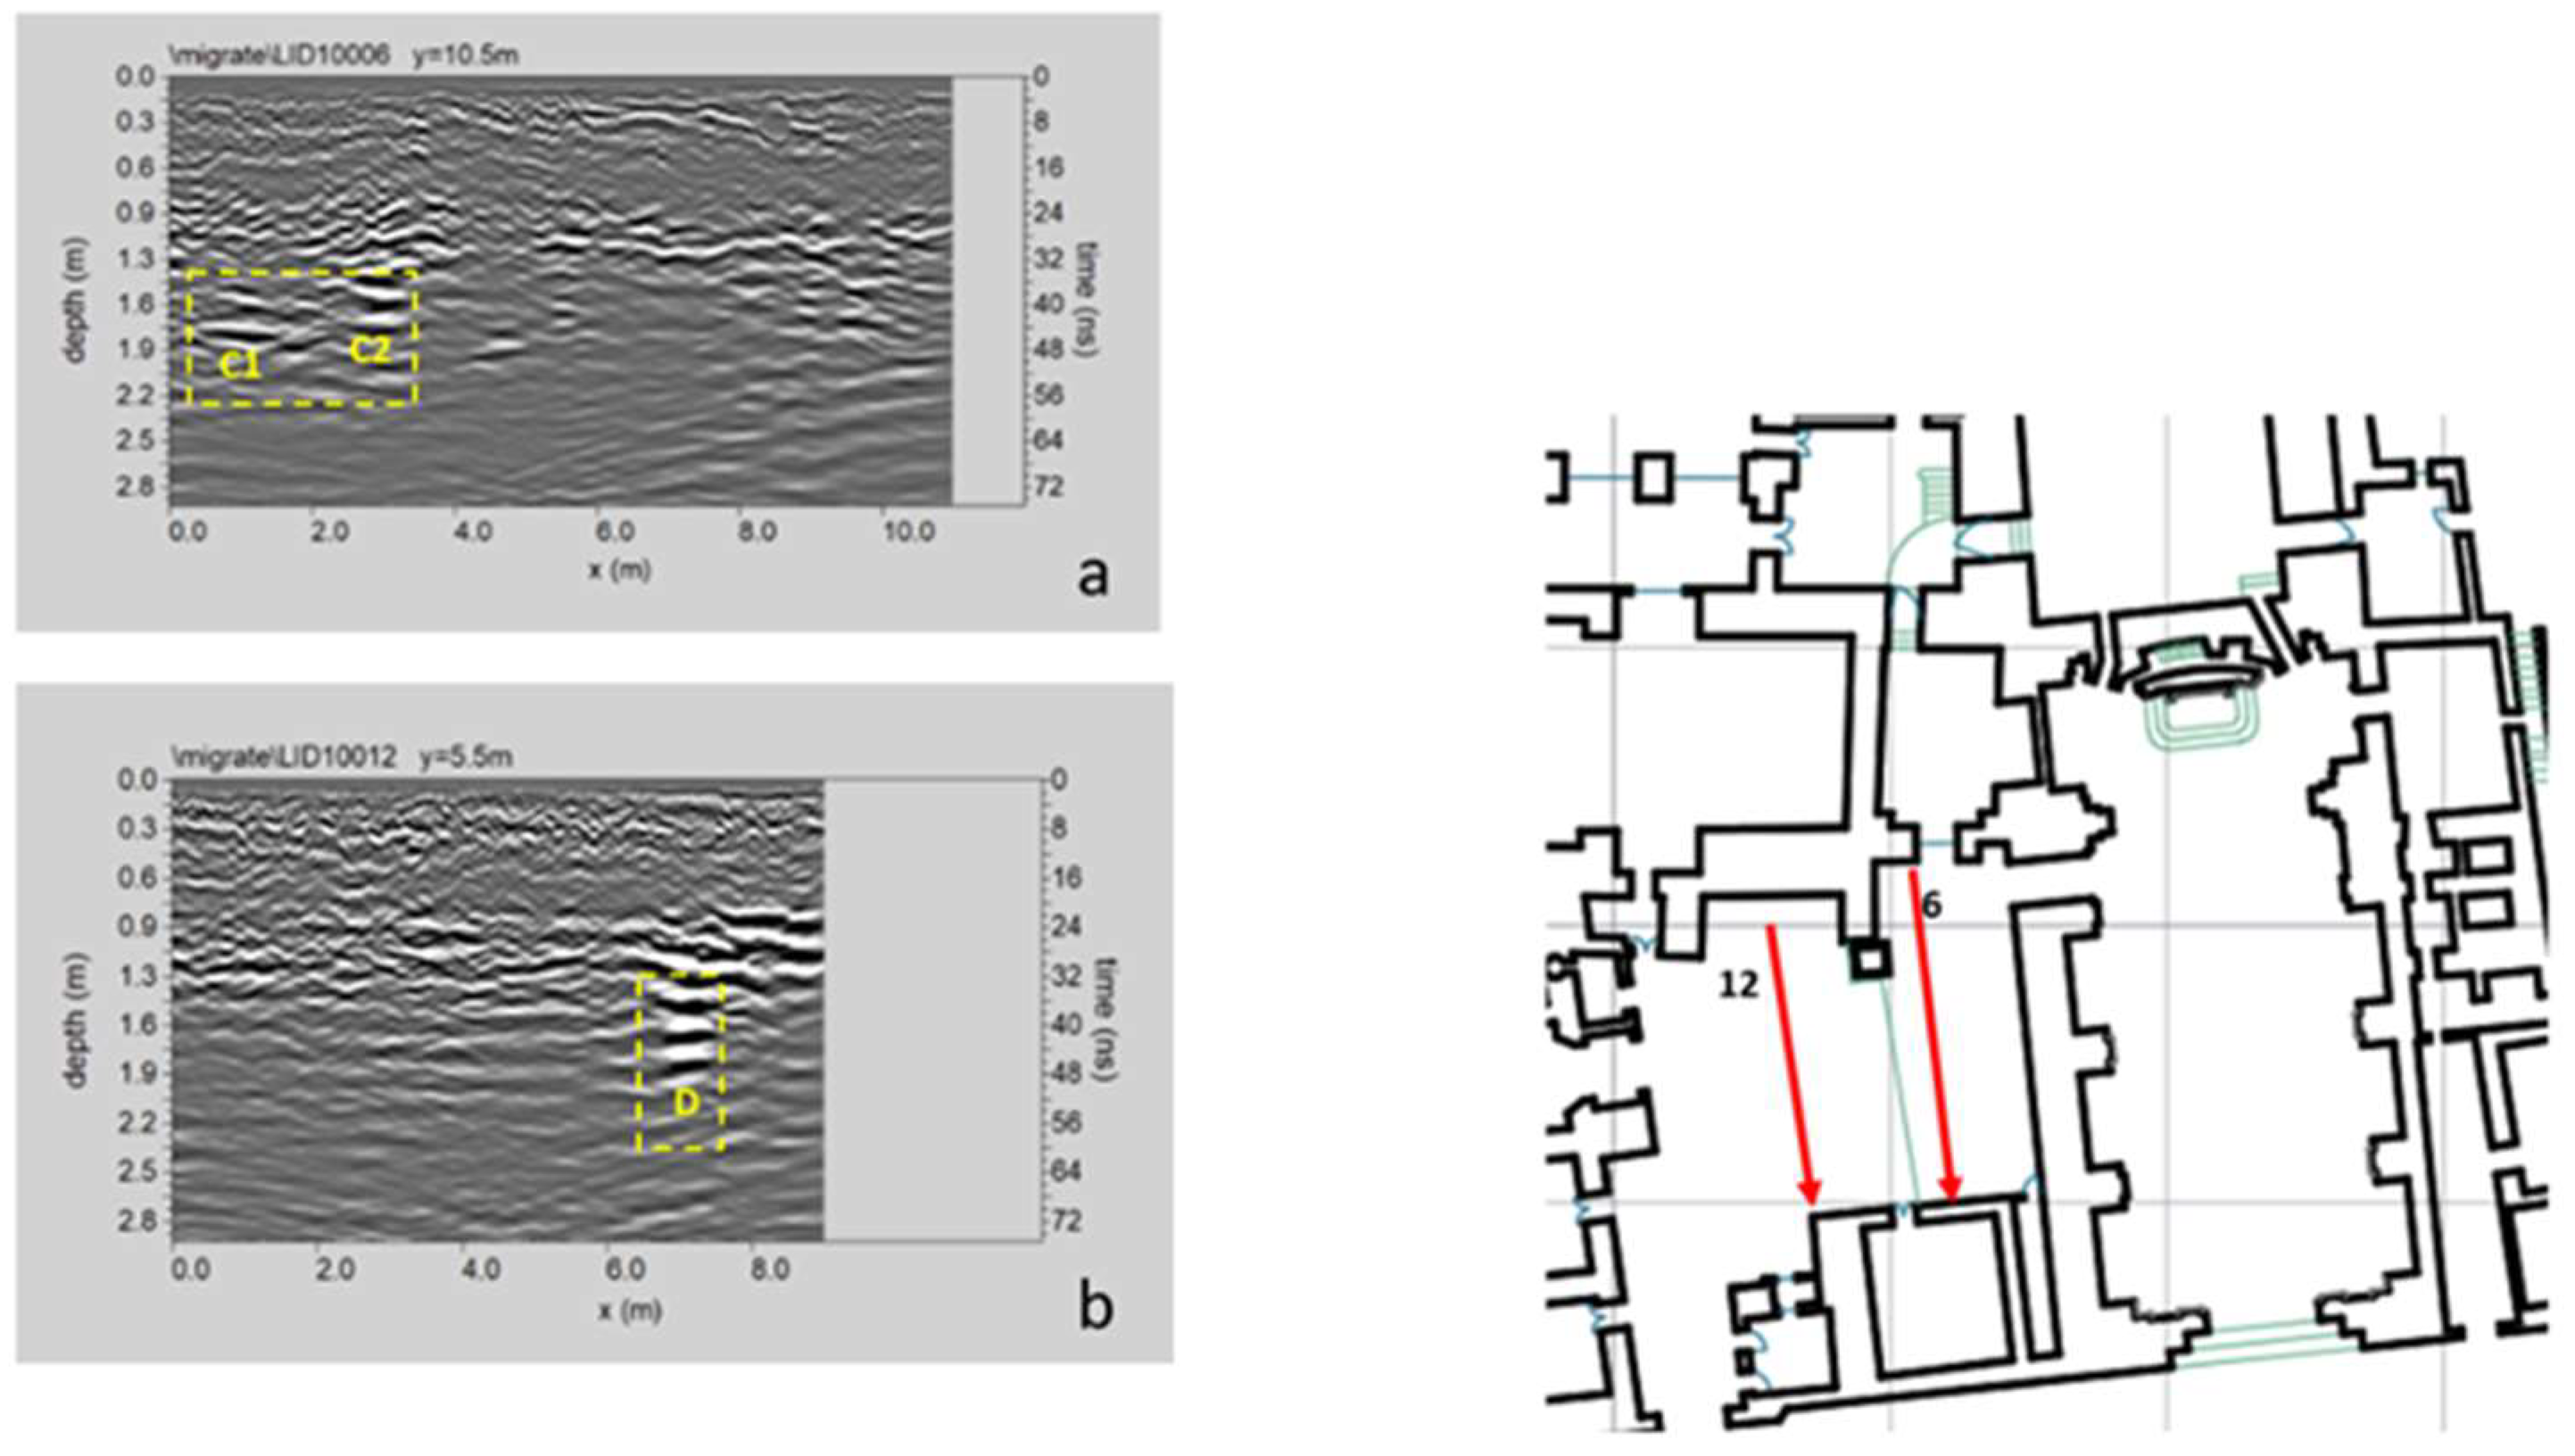
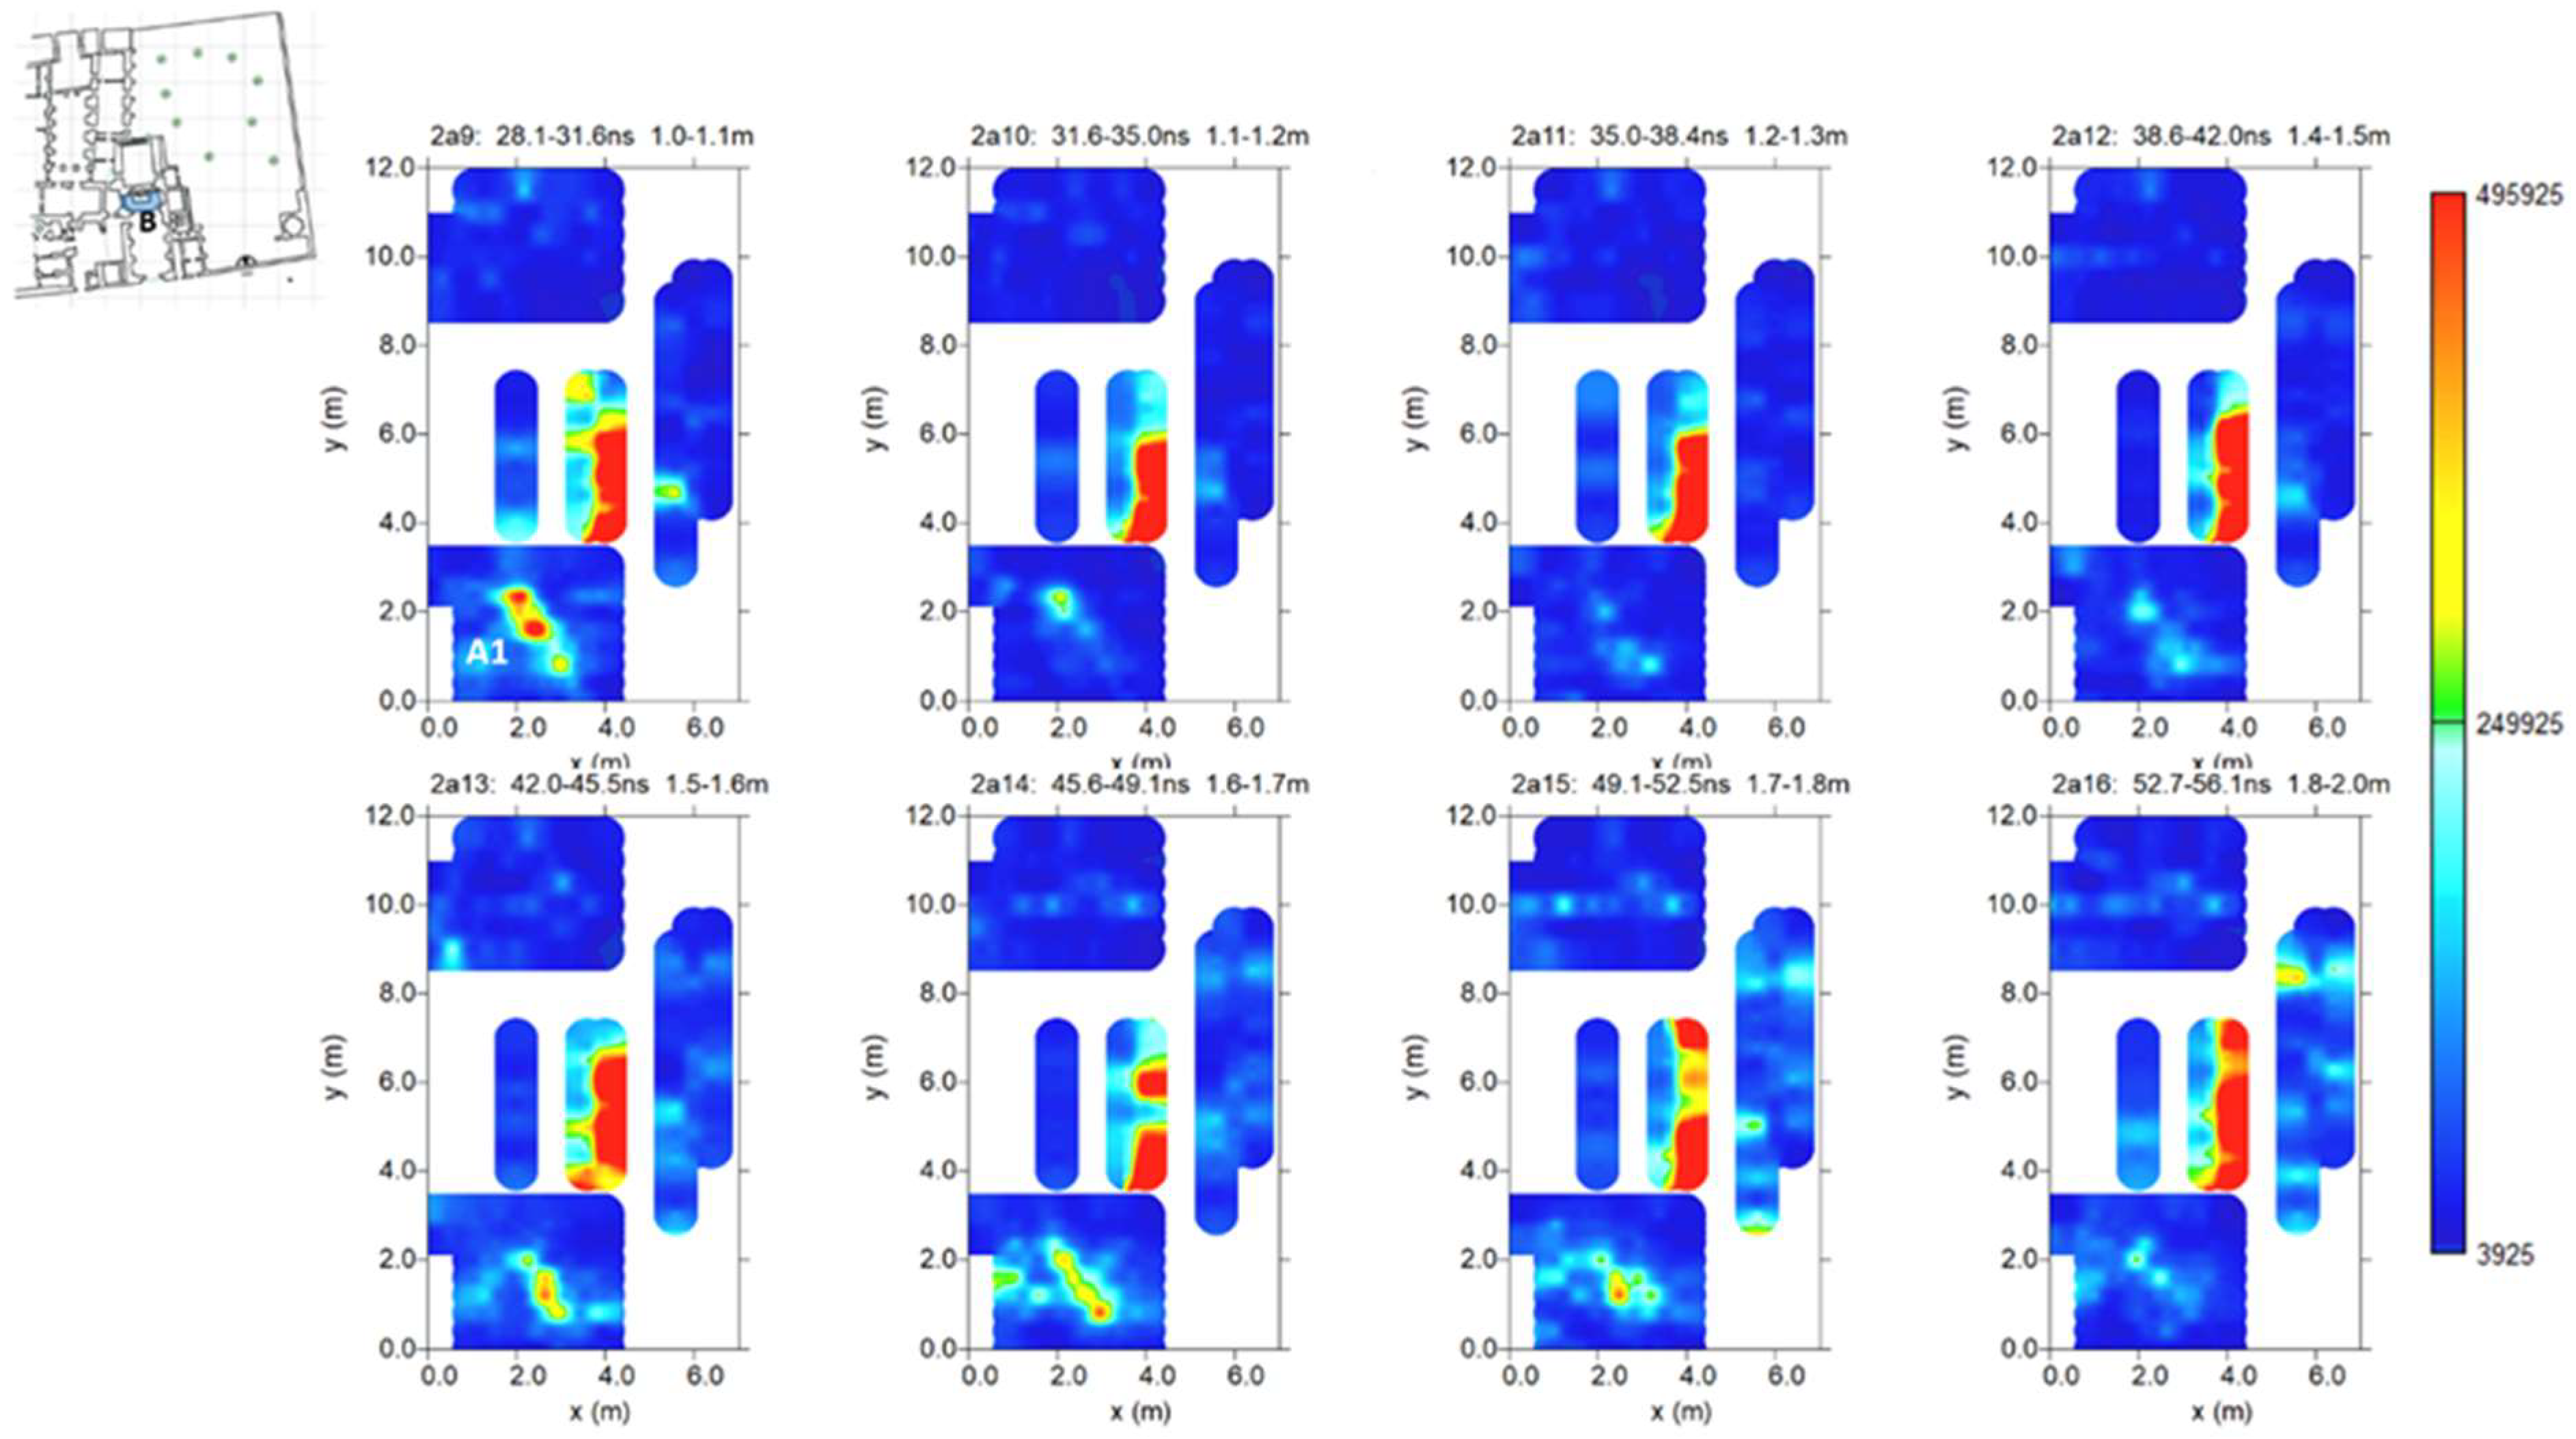
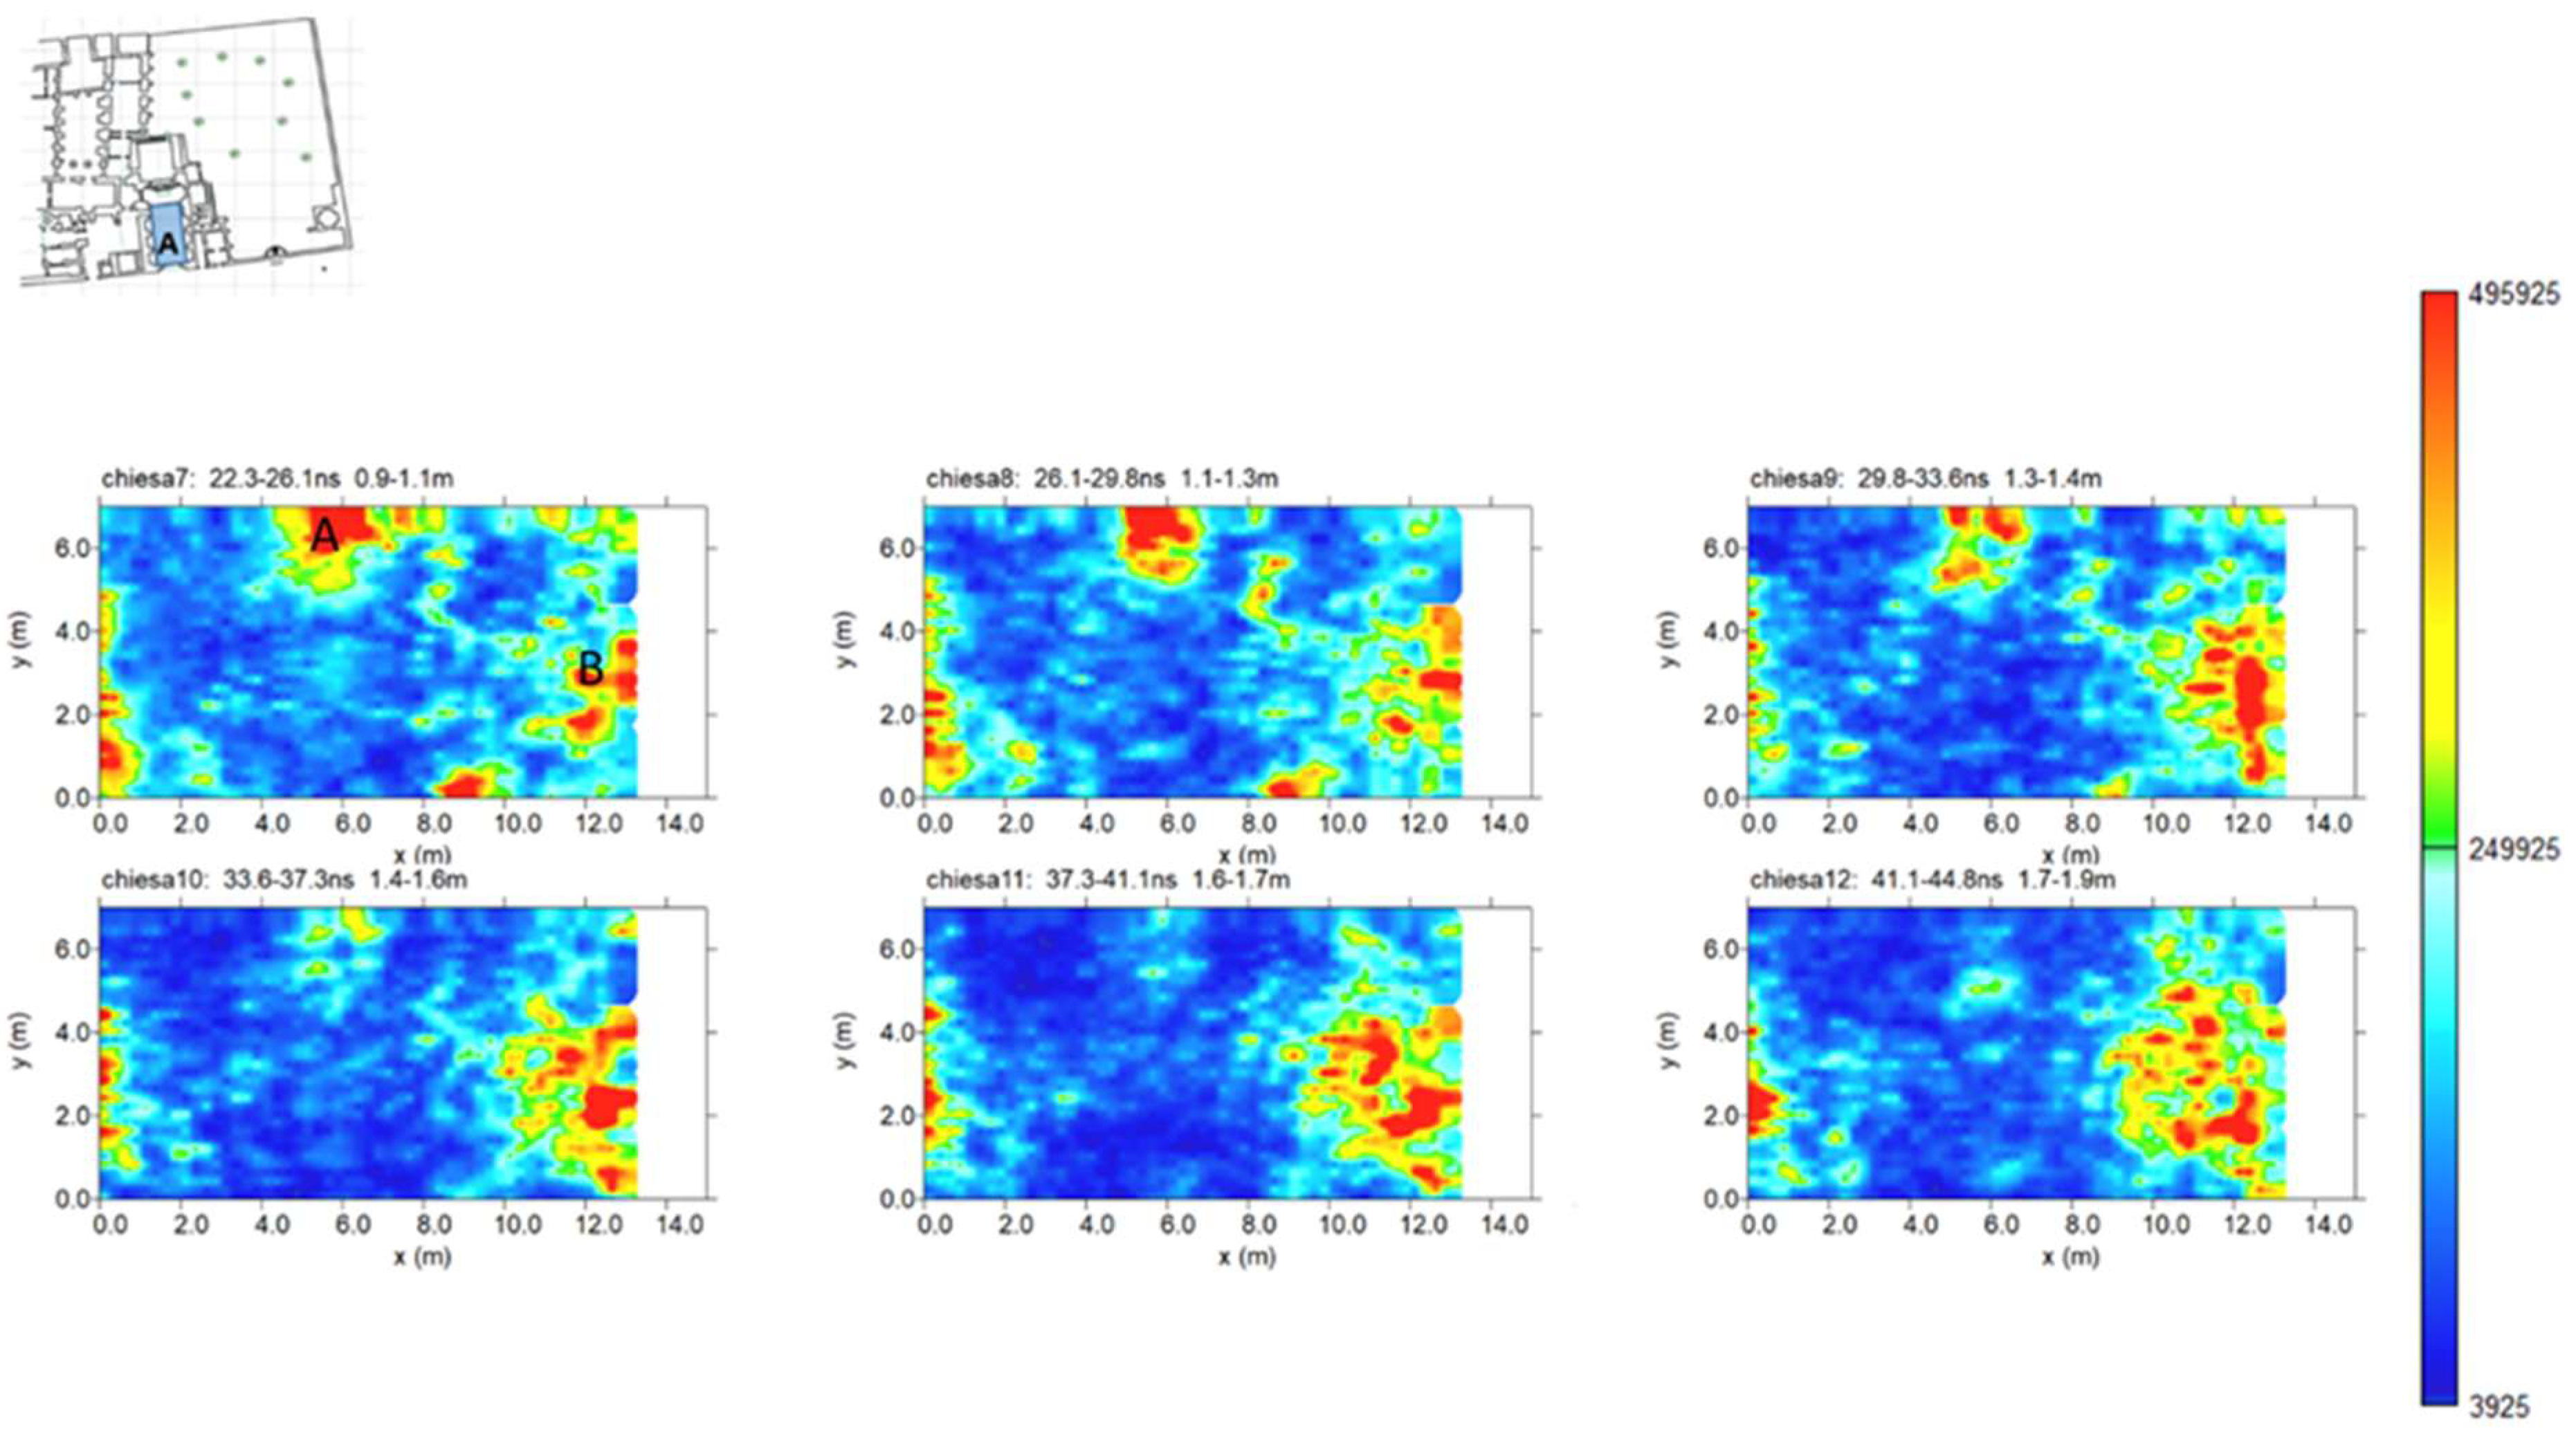
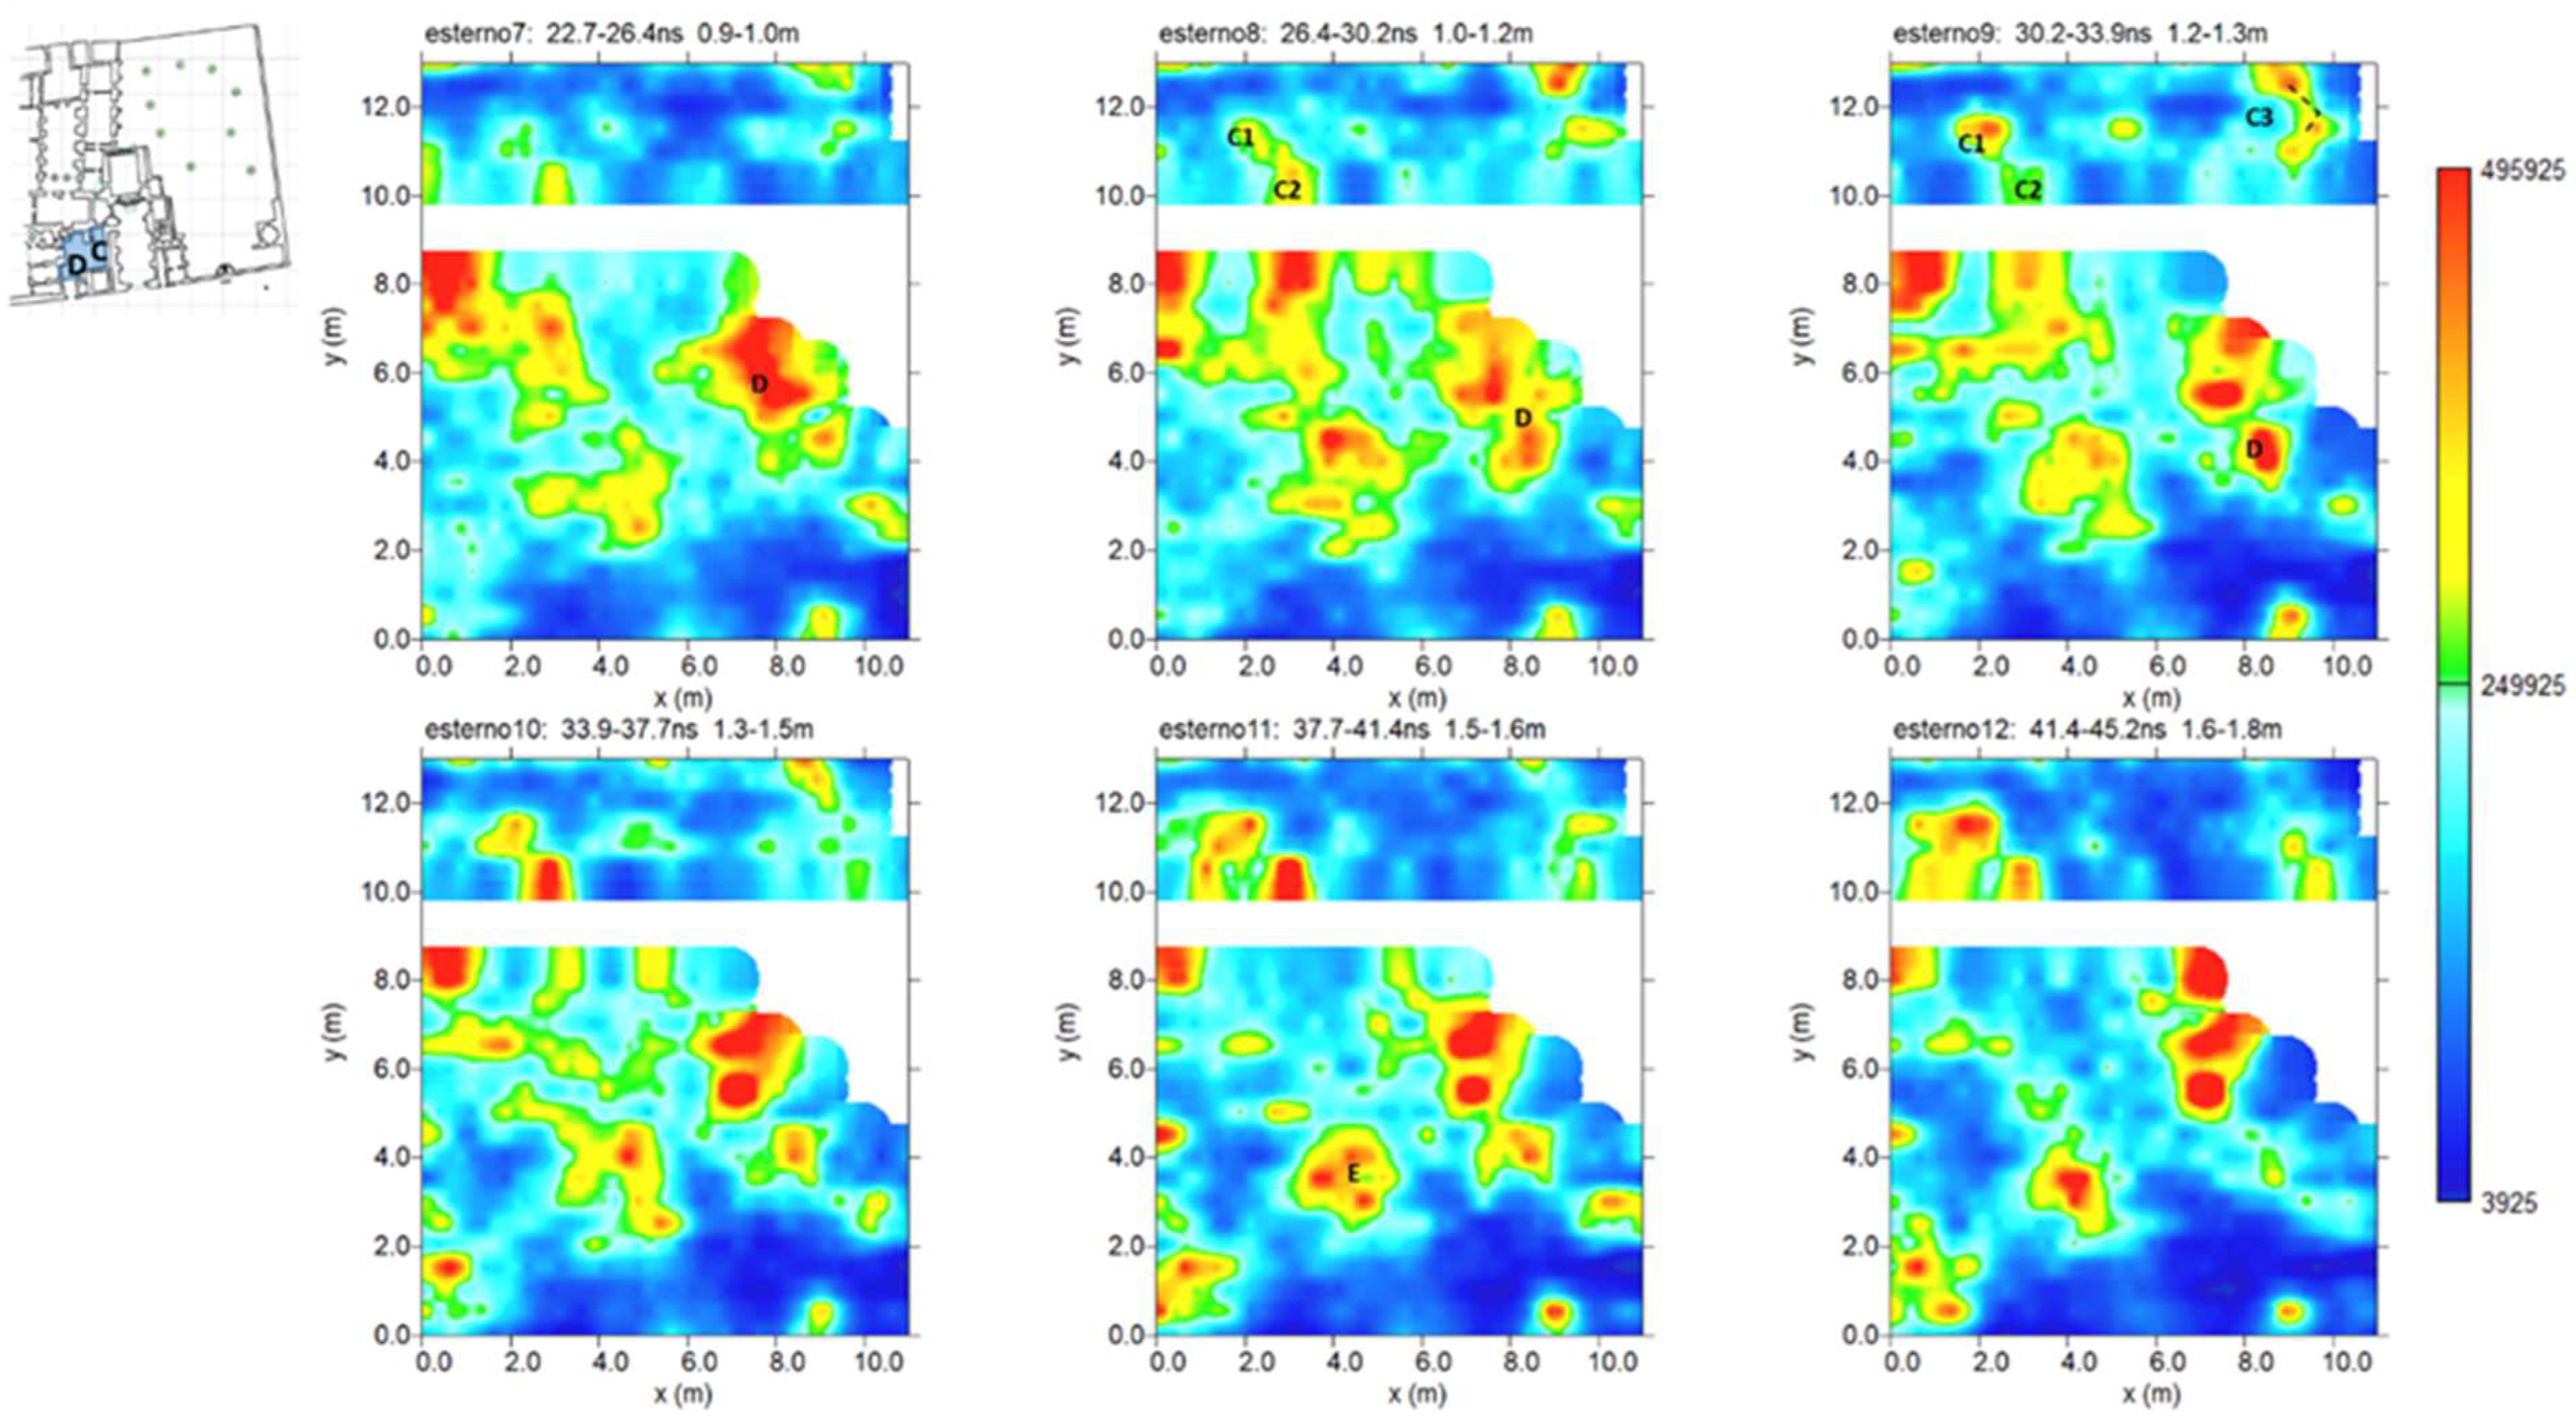
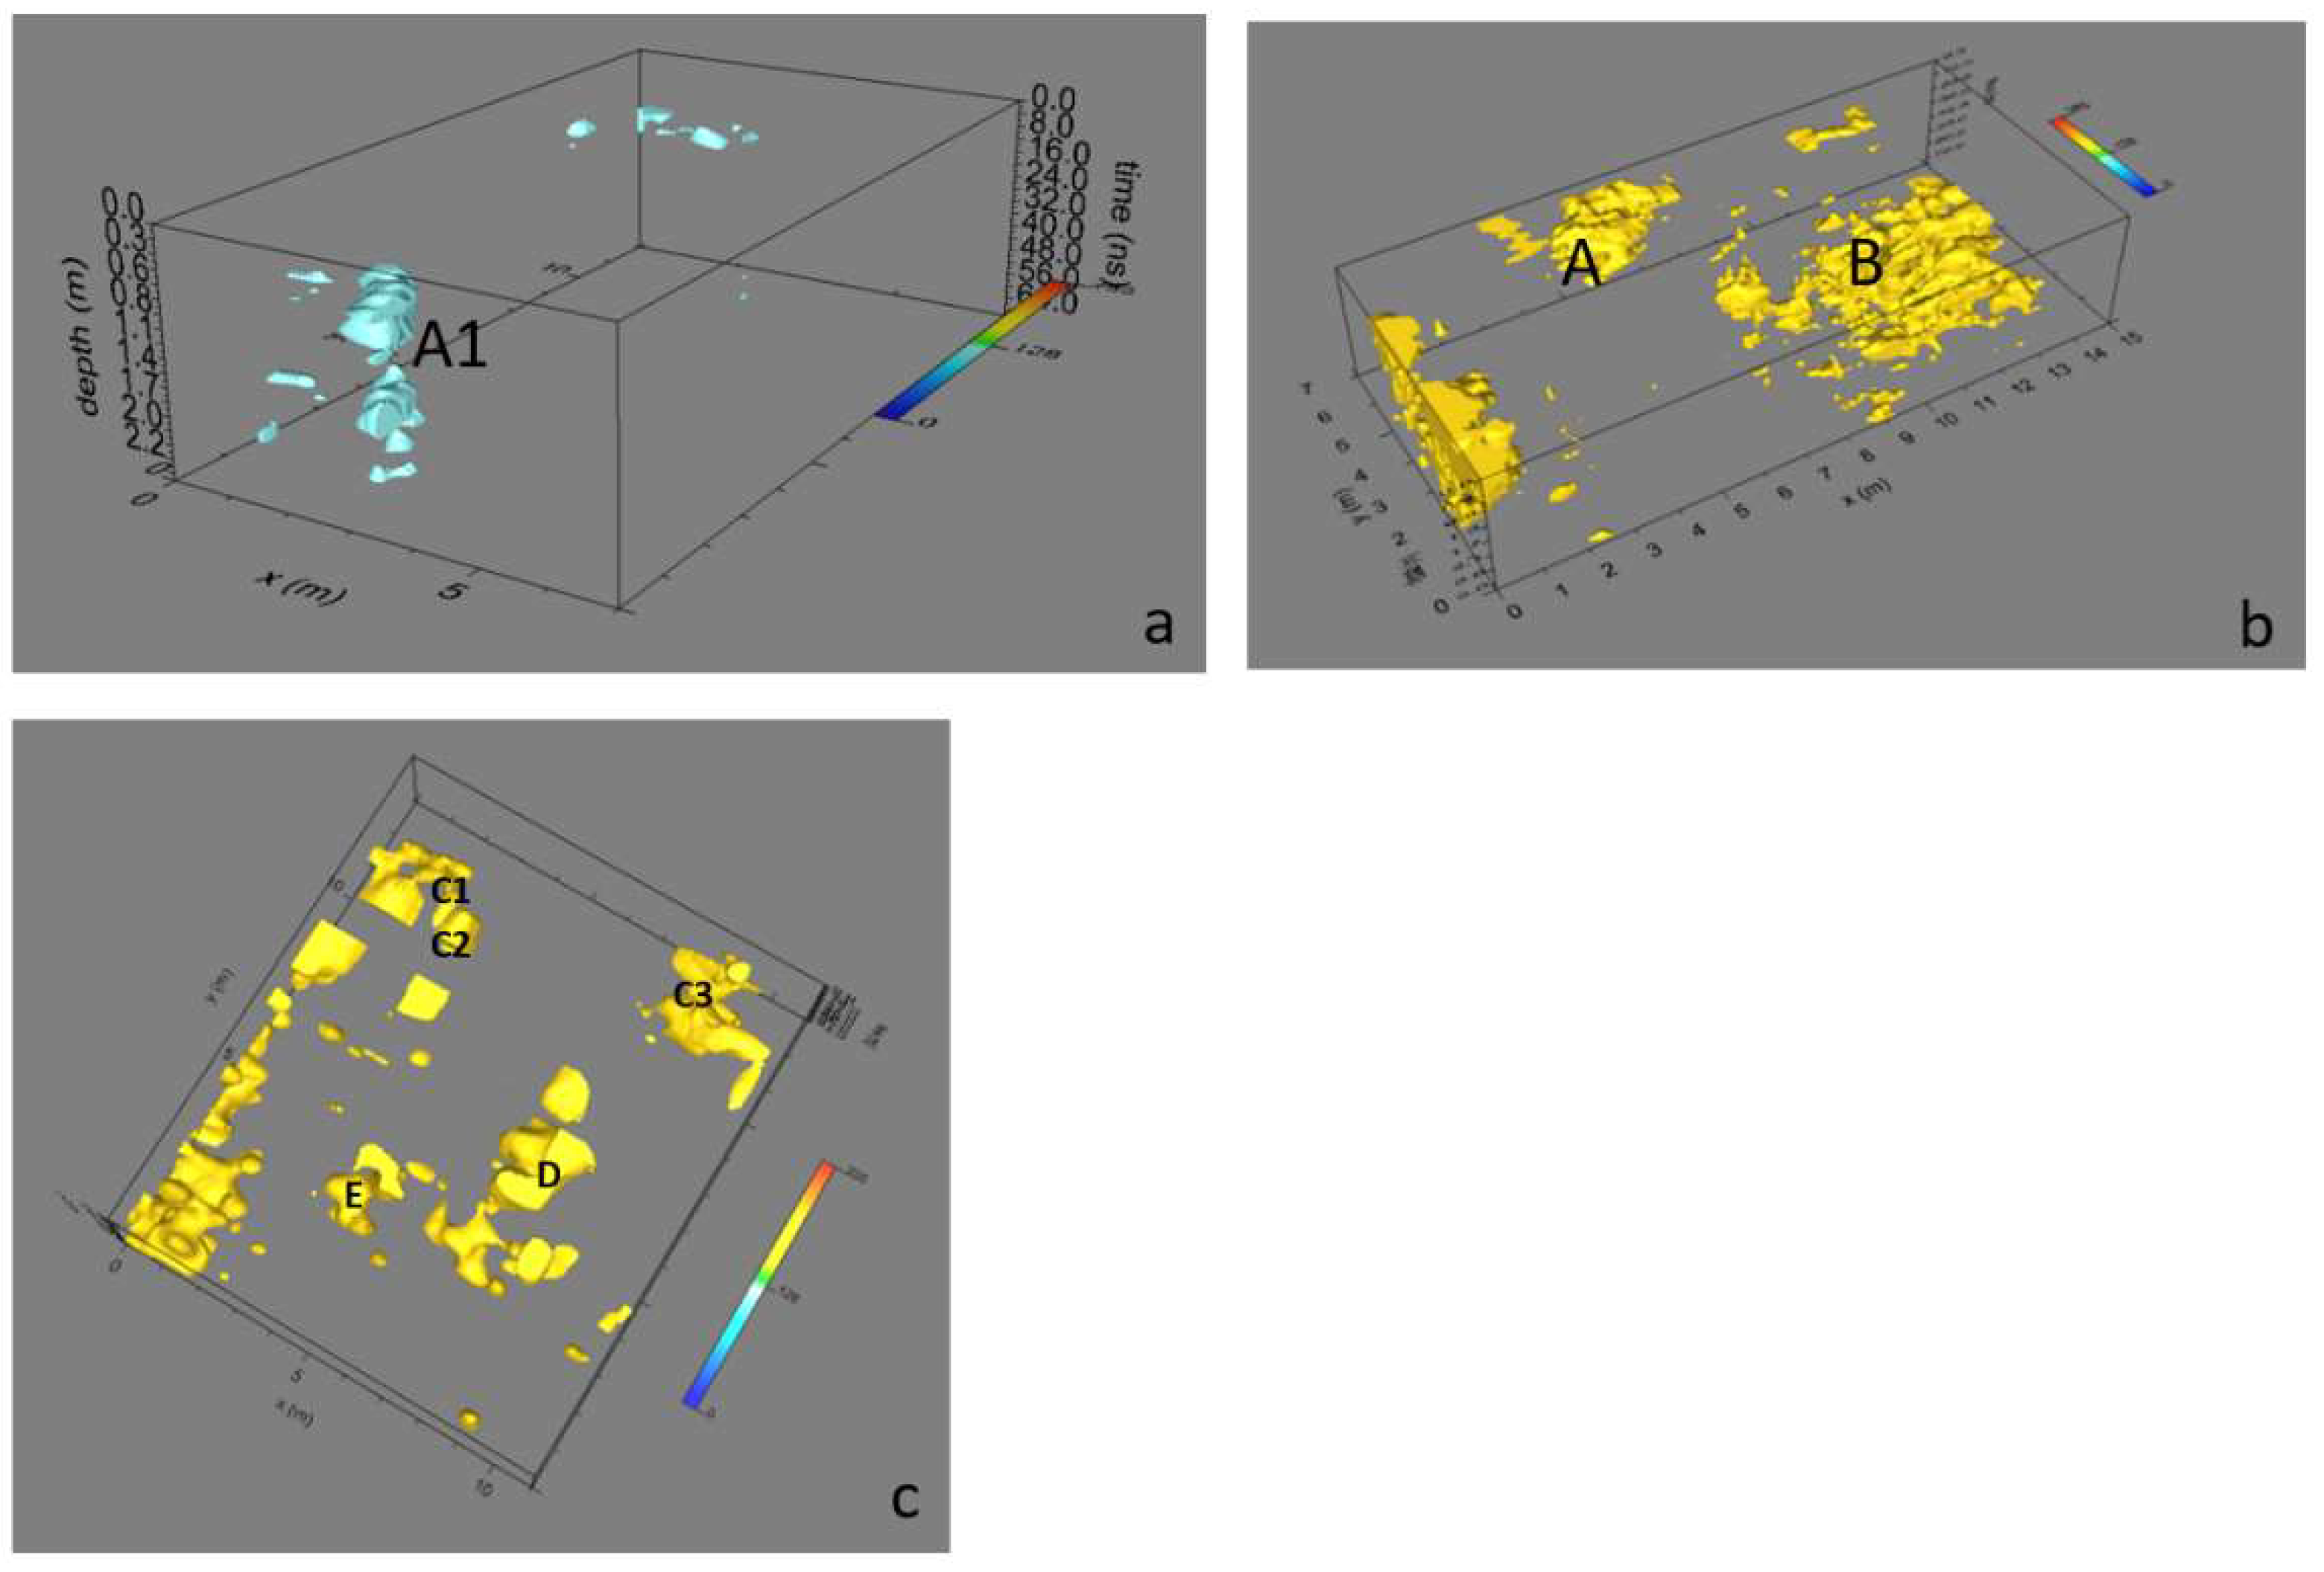
3.1. GPR Data Analysis

In area B, the GPR processed profile presented several reflection events. The reflection event denoted A1 in Figure 4 was of particular interest. It was evident in the profiles acquired on the left side of the altar. The size was about 1 m in width and the depth of the top was between 1.35 and 1.40 m (with an average electromagnetic wave velocity of 0.075 m/ns). It had a length of about 1.8–2.0 m. Above the reflection event A1 there was a series of reflection events (R) that could have been related to a probable filling (as if there had been an excavation and a subsequent filling). A few considerations were made to try to understand what anomaly A1 may have been due to. The first thing to underline is that the church is built on a 2 m raised floor with respect to the normal walking surface. There is, therefore, a filling of compacted debris. Observing the anomaly A1 on the radar section, a change in the polarity of the electromagnetic wave (EM) was noted. An inversion of polarity is produced when the reflection coefficient is negative. Thus, for materials where the wave velocity depends only on the dielectric constant, radar waves are reflected in a material with a higher dielectric constant. A typical case is reflections from air to any other material [21,23,24]. All these considerations led to us interpreting this anomaly as being due to a tomb.
Looking carefully at the results of the GPR survey inside the church (Figure 5), it was possible to notice the presence of two reflected events denoted, respectively, as A and B. In this case, a change in the polarity of the reflected EM wave was also denoted. These events had a length of about 3 m (event A) and 5 m (event B). This was because these anomalies were visible in other profiles adjacent to the profiles shown in Figure 6. Their widths were about 4 m and at a depth between 0.7 m and 0.8 m. With the same gain, the amplitude value of the reflected event linked to anomaly B was lower than the amplitude value of the reflected event linked to anomaly A. This could be due to a change in the humidity value attributable to the investigated subsoil matrix.
In areas C and D, the results (Figure 6) included a few reflection events labelled C1, C2 and D. The reflected events relating to anomalies C1 and C2 were located at a depth of about 1.3–1.6 m and had a size of 1.5 m if we considered an average velocity of propagation of the EM wave equal to 0.075 m/ns. The reflected event linked to anomaly D had a depth of about 1.3–1.5 m and dimensions of about 1 m. In the latter, a change in the polarity of the reflected EM wave was noted.
The planimetry of the profiles acquired within a grid with a 0.2 m pitch allowed us to build 3D maps of the distribution of the anomalies identified within the 2D radar sections. One type of visualization is related to the construction of time slices within specific time intervals. The time slices can be defined as maps within which the amplitudes of reflected events related to high-amplitude anomalies identified in 2D radar sections are projected at a given time interval [23]. It is important to underline that, thanks to a graphical method called “overlay analysis” developed by [21,23,24,25] and implemented within GPR-slice software, it is possible to highlight, through the time slices, the events reflected with the amplitude of a lower EM wave associated with deeper anomalies that may be indistinguishable in 2D radar sections. In this work, time slices were built to visualize the amplitude variations within time intervals of Δt equal to 3.5 ns. Another way of presenting the volume of 3D data is the amplitude isosurfaces of the EM wave [23]. Here, it is possible to isolate the amplitude values, establishing a minimum threshold value in order to make uniquely visible the 3D structure of the anomalies identified in the 2D radar sections. In this case, the impression of real structures of probable archaeological interest is given. Clearly, the calibration of the threshold is a very delicate step and depends on the experience of the interpreter to obtain useful results [23]. Figure 7 shows the most significant time slices relating to the GPR data acquired from the altar (area B). Here, slices at depths of 1.0–1.8 m were considered. At these depths, it was possible to highlight the reflected event linked to the A1 anomaly, which corresponded with the one indicated as A1 in the 2D radar section of Figure 4.
The same could be said for the GPR data acquired inside the church in area A. The most significant time slices (0.9–1.9 m depth) are shown in Figure 8. In this case, anomalies A and B, which corresponded with the anomalies marked as A and B in the radar sections of Figure 5, were clear visible in their shape and dimensions.
The most significant time slices relating to the GPR profiles acquired outside the church (areas C and D) are shown in Figure 9. They ranged from 0.9 m to 1.8 m in depth. Here, it was possible to find the anomalies C1, C2 and D already highlighted in the radar sections of Figure 6. A strong amplitude anomaly of the EM wave, called C3, was visible at a depth between 1.2 m and 1.3 m. At a depth of 1.5–1.8 m, the anomaly (called E) was visible.
Another way to represent the entire volume of GPR data in 3D is the one that takes into consideration the isosurfaces of the electromagnetic wave amplitude. Figure 10 shows the isosurfaces of amplitude with a threshold value equal to 70% of the total amplitude. Anomalies A1 (Figure 10a), A and B (Figure 10b), C1, C2, C3, D and E (Figure 10c) could best be visualized in their 3D development.

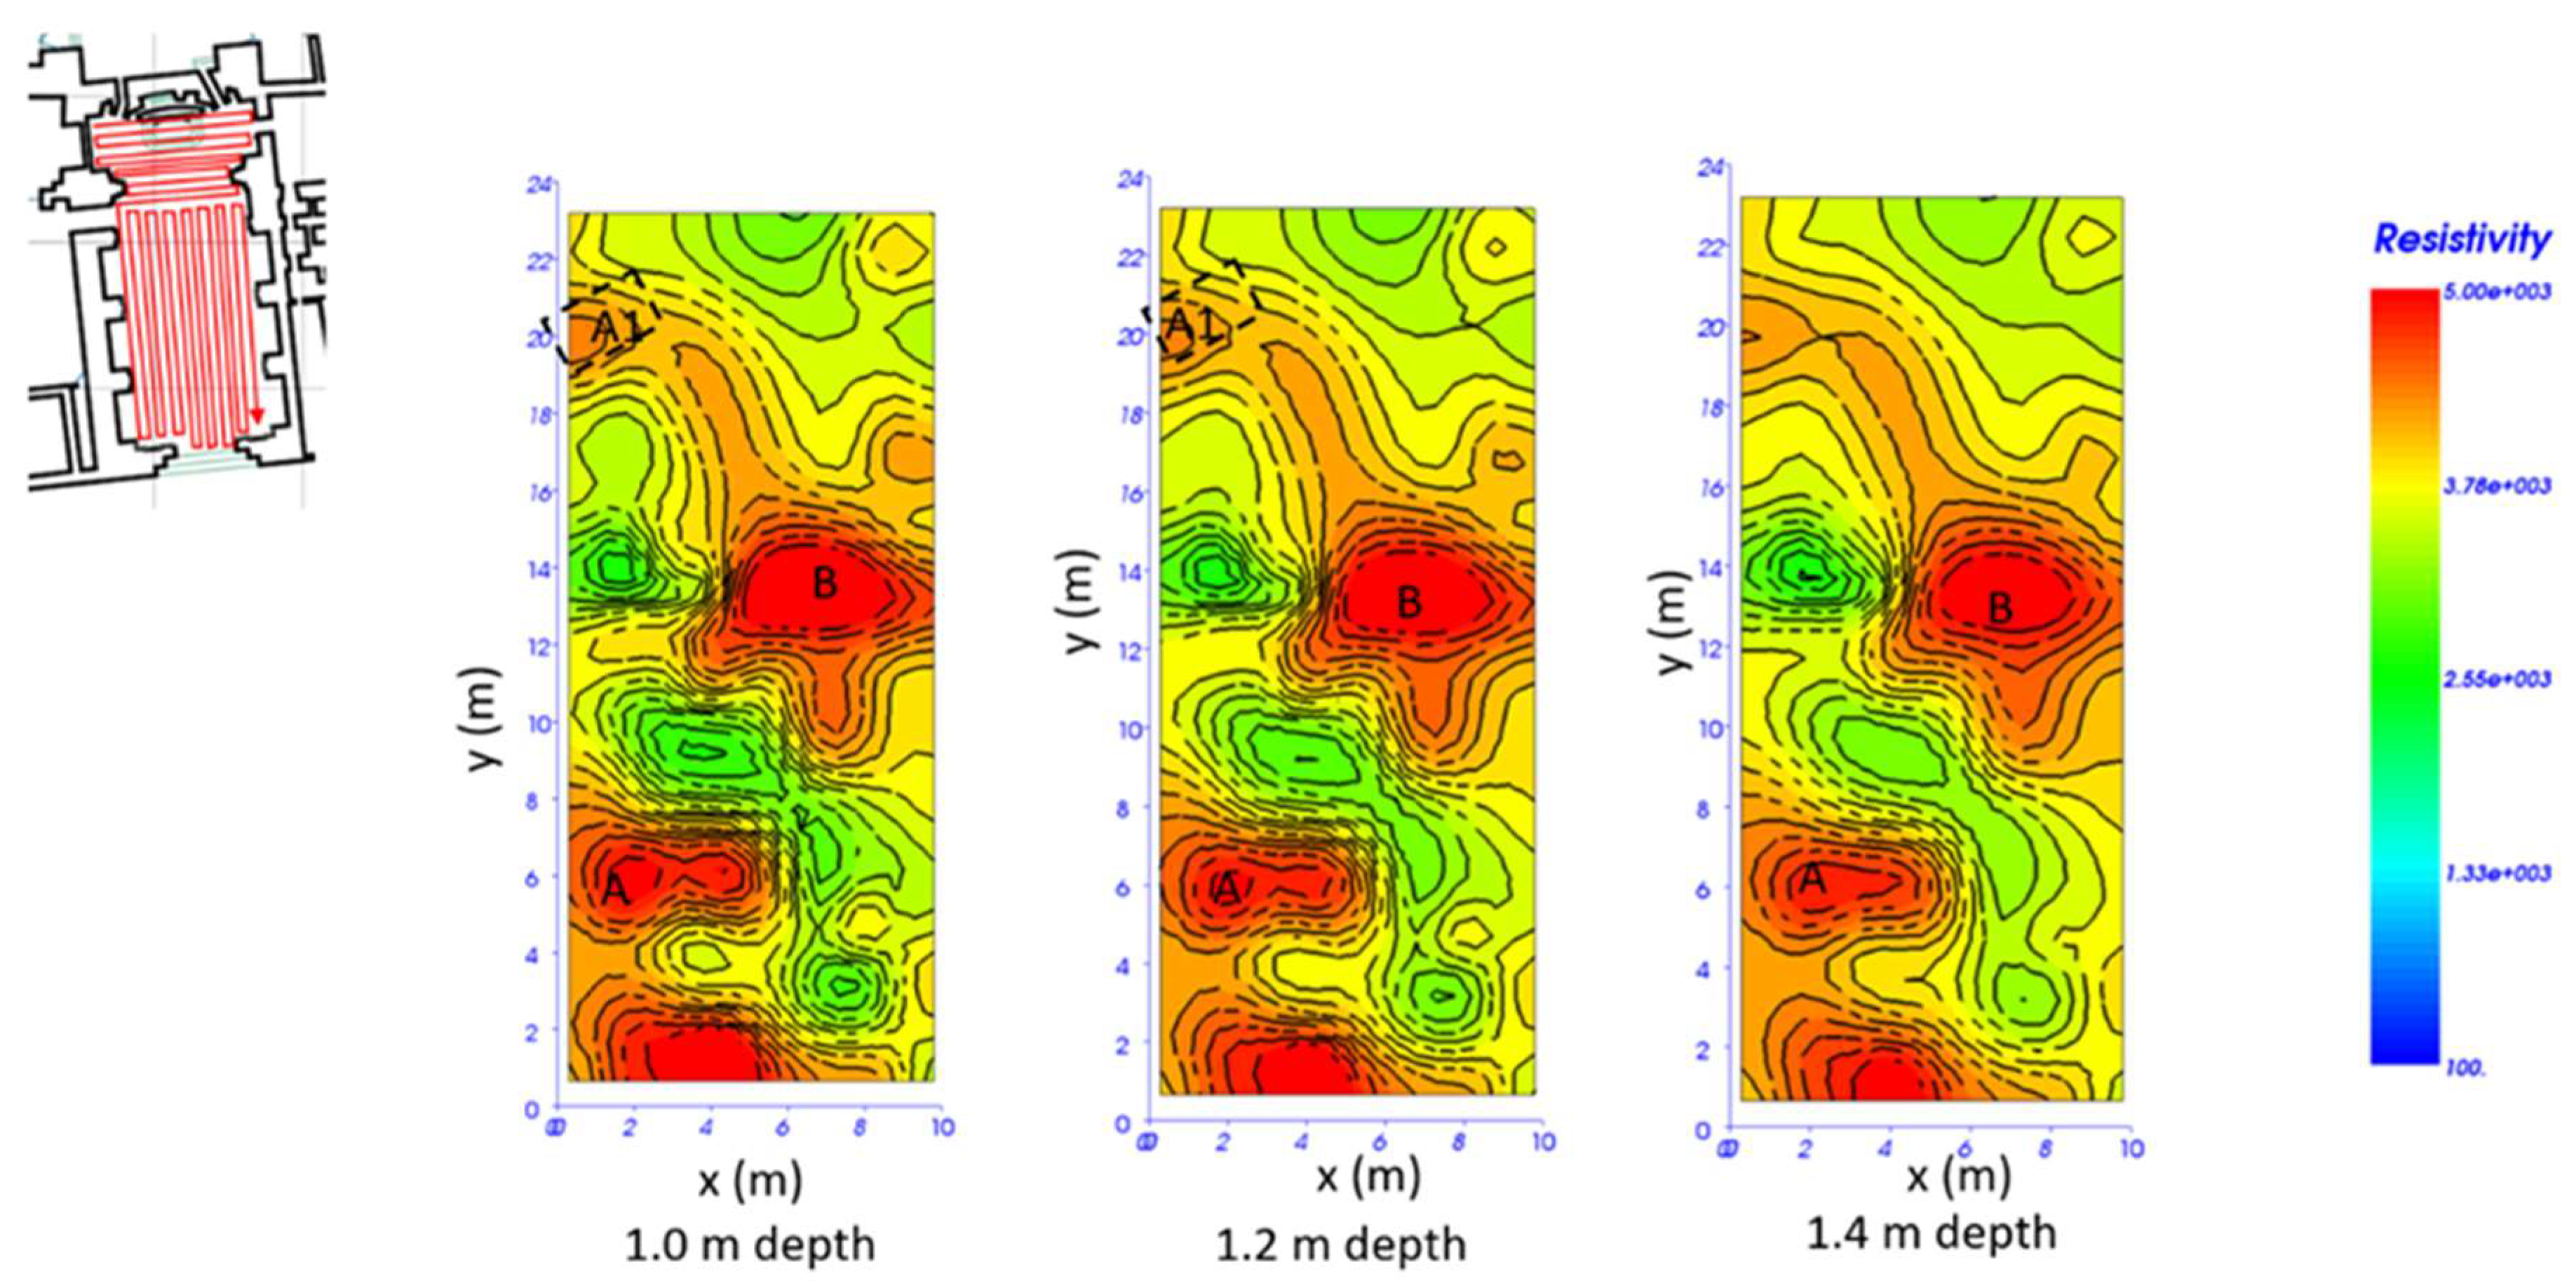
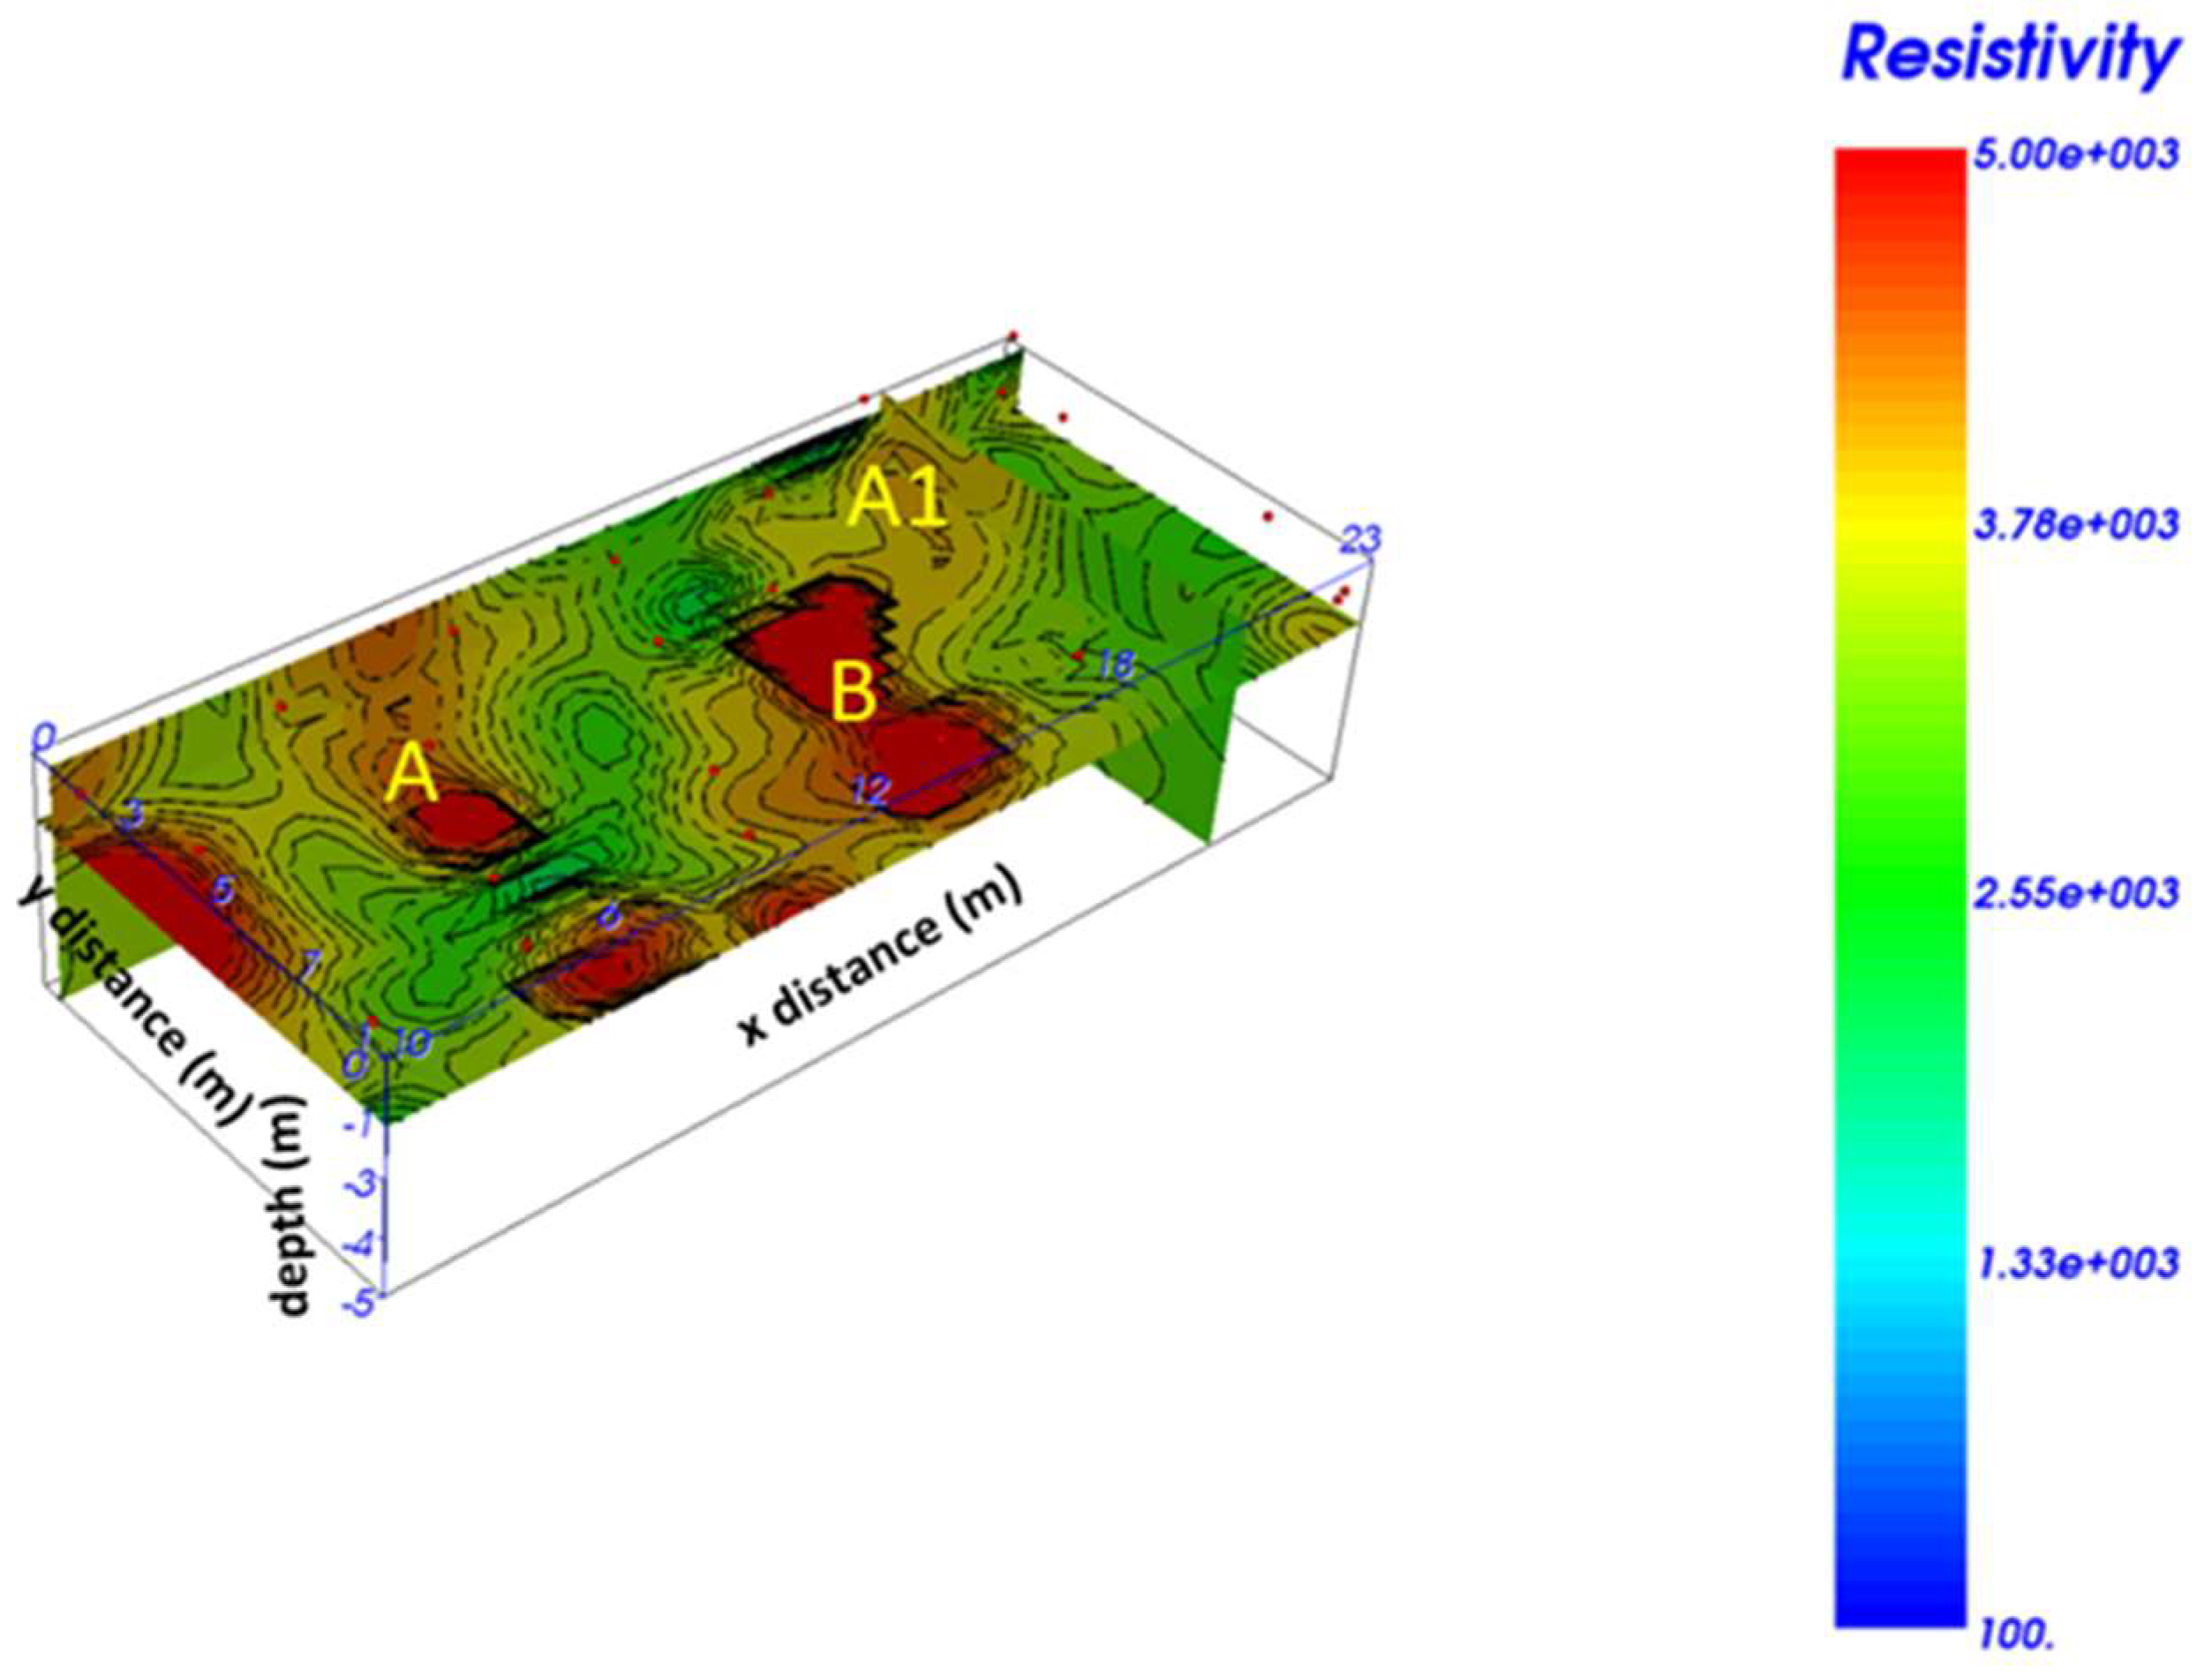
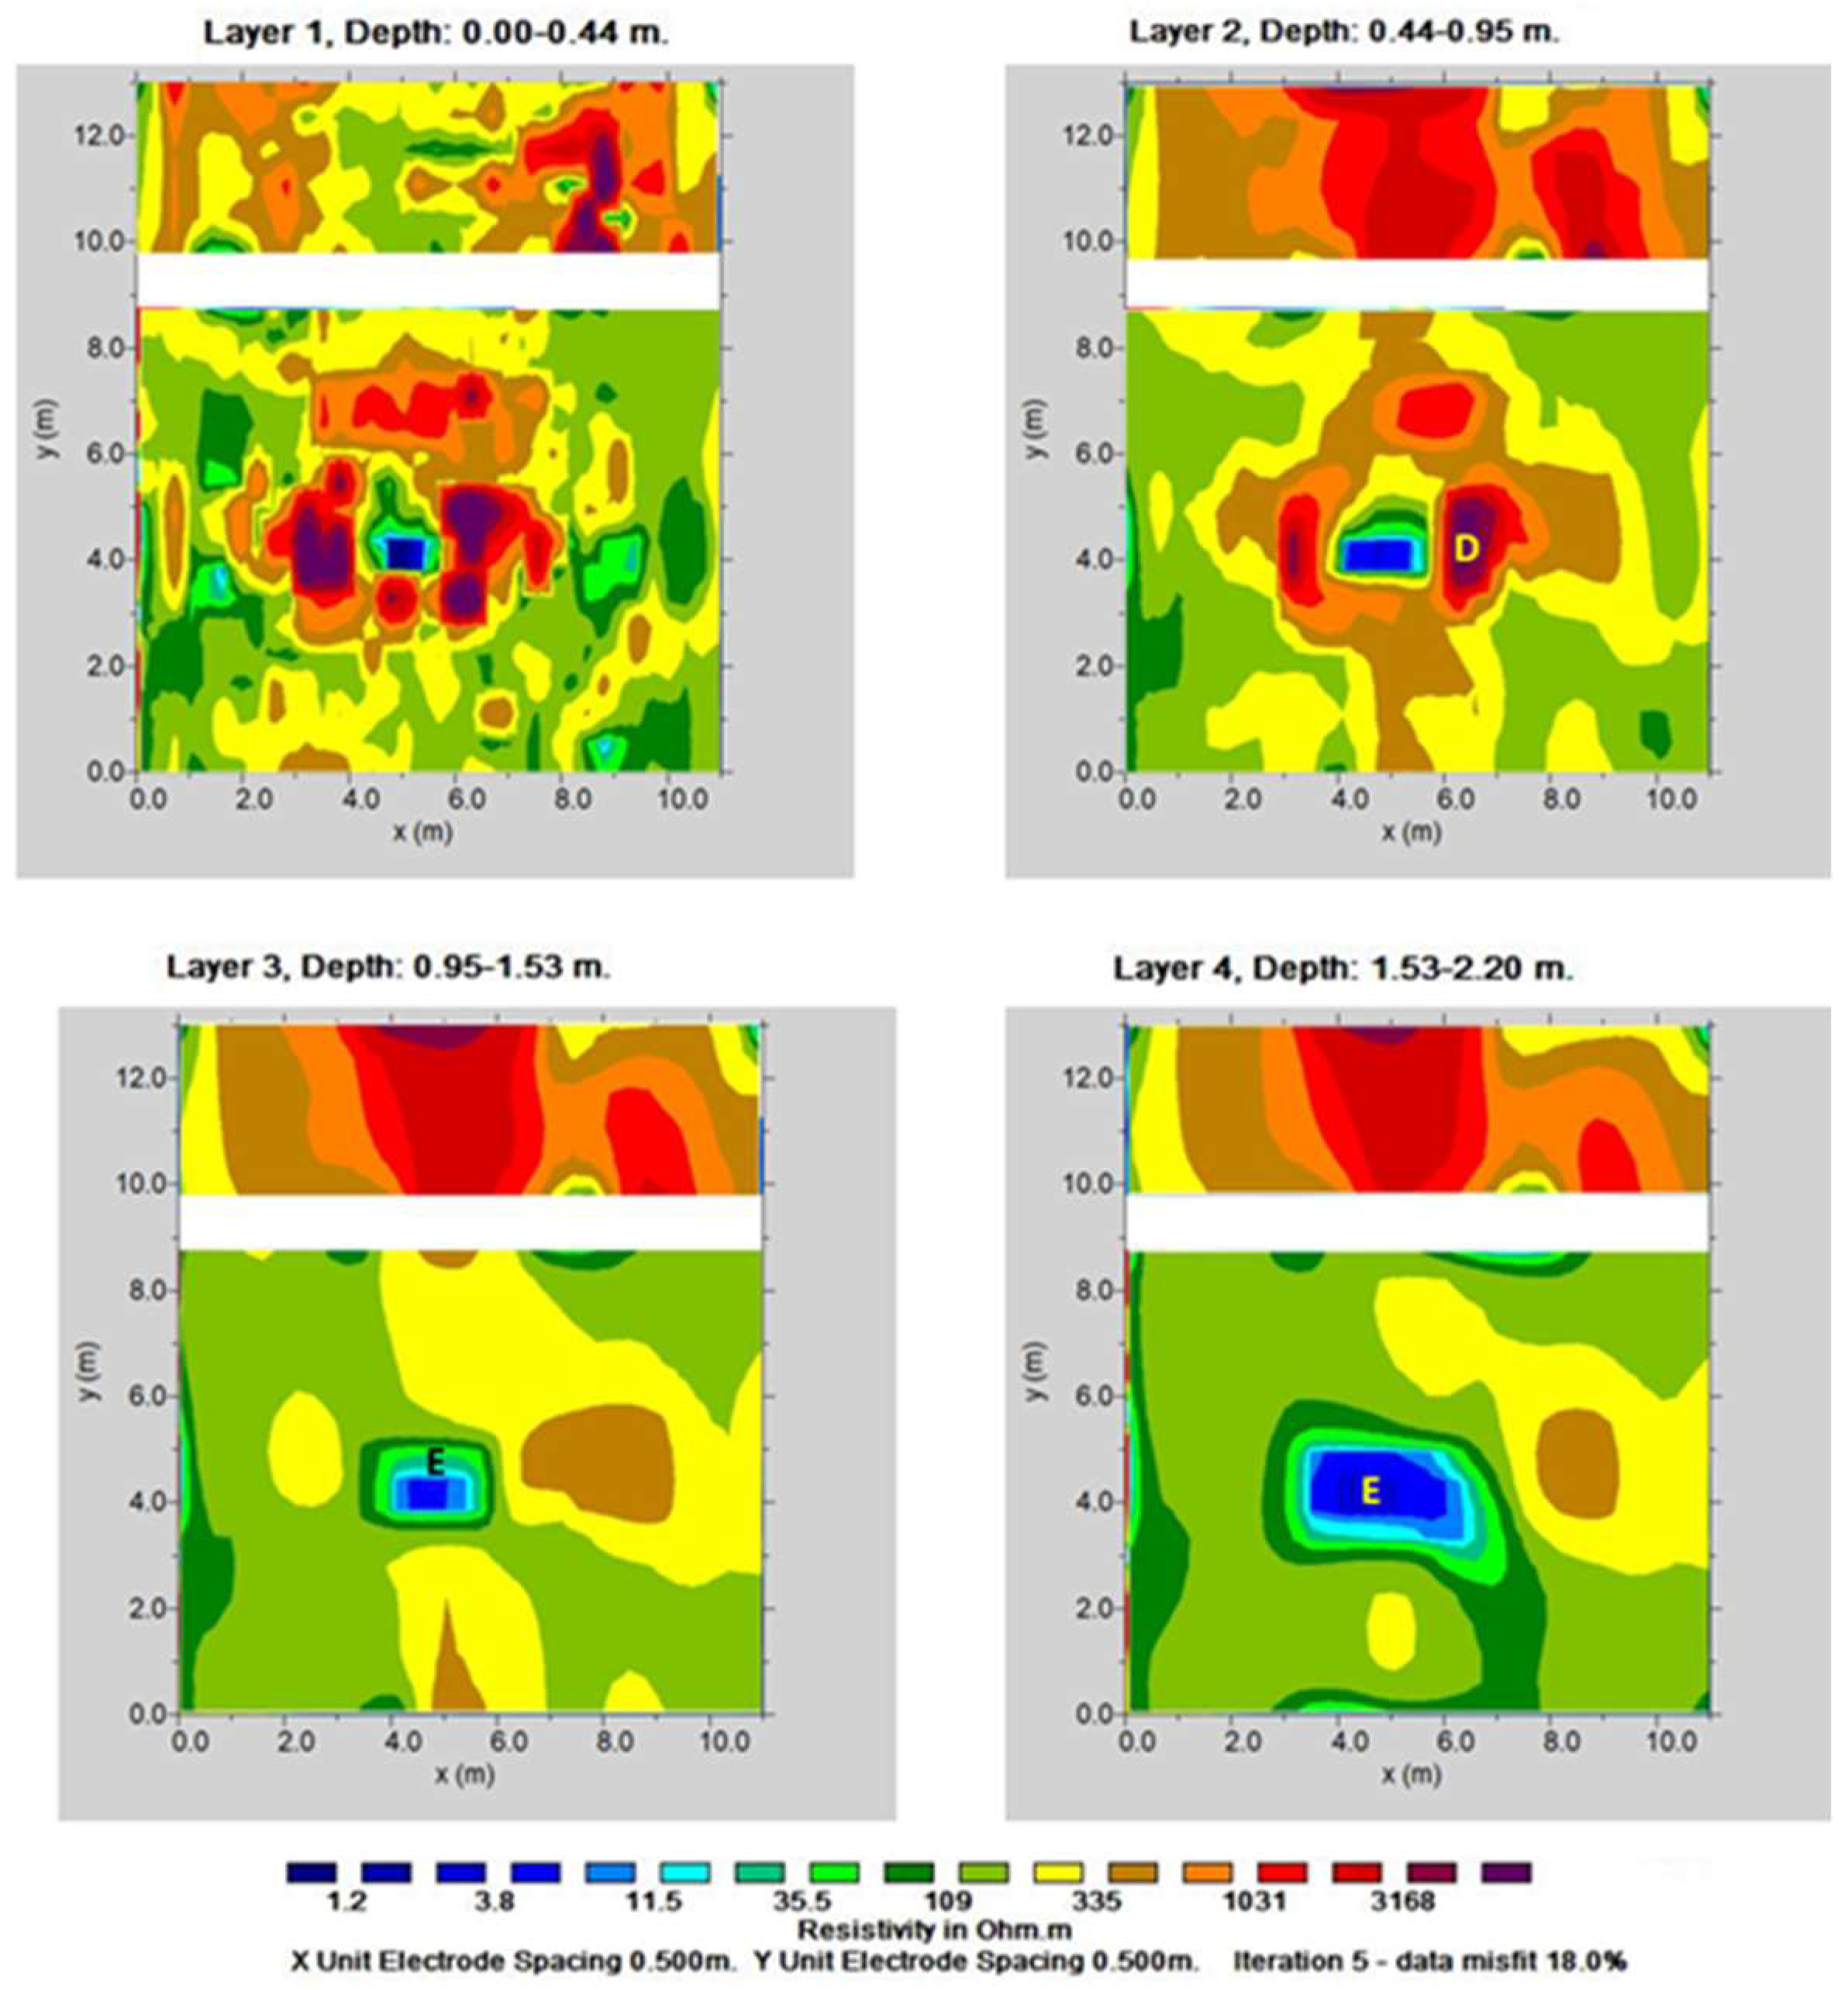
3.2. ERT Data Analysis

The ERT data showed an investigation depth of about 5 m. The subsoil was clearly heterogeneous, with resistivity values between 1100 ohm m and 5000 ohm m (Figure 11). Figure 11 shows the most significant resistivity slices covering a depth ranging from 1.0 m to 1.4 m. Here, it was possible to note the anomalies A1, A and B, with resistivity values between 3800 ohm m and 5000 ohm m. These anomalies corresponded with the same anomalies highlighted in the GPR time slices (Figure 7 and Figure 8). In Figure 12, a pseudo-3D representation of the ERT data is shown. In this representation, three slices were merged into one volume. In this way, it was possible to see the extent of the resistivity anomalies.

3.3. EM Data Analysis

The EM data are shown in Figure 13 as resistivity depth slices. Here, a probable correspondence with the anomaly labelled D in the GPR time slices was possibly evidenced. A correspondence with the GPR data (anomalies C1, C2 and C3) was not seen. This was probably due to the low resolution of the EM method. Furthermore, in the central part of the depth slices, it was possible to see a low resistivity anomaly, which was labelled E.

4. Discussion

Integrated data acquisition helped us to understand the structures of the shallow subsurface of the investigated areas. For the area B, the GPR (Figure 8) and ERT (Figure 12) data were congruent. The high-amplitude anomaly A1 in the GPR data corresponded with the high-resistivity anomaly A1 in the ERT data. Considering the above, it was possible to attempt an interpretation of the results. First, the change in polarity of the reflected EM wave suggested the presence of a strong contrast of dielectric properties such as those produced by the presence of an empty space [20]. Furthermore, the reflected event linked to anomaly A1 had a flat shape; above this reflected event, there was a series of reflected events, indicated as R, which suggested a probable excavation with a subsequent filling [20]. The presence of the empty space, again for anomaly A1, was confirmed by the high resistivity values (about 4000 ohm m). At this point, the anomaly called A1 could be interpreted as being due to the presence of a probable burial. To understand the accuracy of this interpretation, a videoendoscopic investigation was carried out. A hole with a diameter of 2 cm was drilled to a depth of 1.2 m. The hole was then cleaned using a vacuum cleaner and a video probe was introduced. Observing Figure 14, one actually noticed the presence of an empty space, which confirmed what was stated previously for anomaly A1.
For area A, a correspondence between the GPR (Figure 8) and ERT (Figure 11) results was evident. It was possible to see the correspondence between the high-amplitude anomalies A and B and the high-resistivity (about 5000 ohm m) anomalies A and B. This could lead to the interpretation of these anomalies as empty spaces.
In areas C and D, the comparison between the GPR data (Figure 9) and EM data (Figure 13) did not provide optimal results. The C1, C2 and C3 anomalies identified with ground-penetrating radar were not highlighted in the EM data. This could have been due to a lower vertical resolution of the EM methodology. The acquired EM data referred to a subsoil volume below the midpoint between the transmitting coil and the receiving coil and, for this reason, the vertical resolution was limited by this distance. As can be seen from Figure 13, the soil thicknesses investigated increased with the depth. Furthermore, when the ground had very low conductivity values, the phenomenon of electromagnetic induction tended to diminish. Instead, the probable high-amplitude anomaly D on the GPR slices (Figure 9) corresponded with a high resistivity (3500 ohm m) of anomaly D (Figure 13). The relatively high-amplitude anomaly E on the GPR slices (Figure 9) corresponded with a low resistivity value of anomaly E (10 ohm m) in the EM data (Figure 13). In this case, anomaly E could be interpreted as a probable cistern with retaining walls (anomaly D).

5. Conclusions

In this work, the results of geophysical surveys carried out inside and outside the church of Santa Chiara in Nardò (Apulia Region, Southern Italy) were presented. These surveys once again confirmed the effectiveness linked to the use of multiple integrated methodologies. Having a comparison between the various geophysical parameters (electrical resistivity and amplitude of EM wave reflections) was fundamental to guide the interpretation of the data. The polarity-reversal high-amplitude GPR anomalies and the corresponding ERT high-resistivity anomalies were interpreted as being due to empty space. The results, therefore, allowed important indications on the presence of structures such as burials, crypts and cisterns in the subsoil of the church. No masonry structures were identified that could lead to an old layout of the church itself. It should be noted that the various 3D visualization tools also contributed to a better understanding of the extent of the anomalies and facilitated with their interpretation. We now await a further validation of the results, which could occur through archaeological excavations.

Author Contributions

Conceptualization, G.L.; methodology, L.D.G., D.F.B. and L.D.G.; software, L.D.G. and L.D.G.; formal analysis, L.D.G. and G.L.; investigation, L.D.G., D.F.B., I.F., F.G., C.T. and G.L.; data curation, G.L.; writing—original draft preparation, G.L.; writing—review and editing, L.D.G., D.F.B., I.F., F.G., C.T. and G.L.; supervision, G.L. All authors have read and agreed to the published version of the manuscript.

Funding

This research received no external funding.

Data Availability Statement

Not applicable.

Conflicts of Interest

The authors declare no conflict of interest.

References

  1. De Angelis, C.S. Serva di Dio. Suor Chiara di Gesù Clarissa. Isabella D’Amato dei Duchi di Seclì, 1st ed.; Editrice Velar: Gorle, Italy, 2016. [Google Scholar]
  2. Mazzarella, E. Nardò Sacra, 1st ed.; Gaballo: Galatina, Italy, 1999; pp. 110–128. [Google Scholar]
  3. Leucci, G.; Persico, R.; Soldovieri, F. Detection of Fracture from GPR Data: The Case History of the Cathedral of Otranto. J. Geophys. Eng. 2007, 4, 452–461. [Google Scholar] [CrossRef]
  4. Cosentino, P.L.; Capizzi, P.; Martorana, R.; Messina, P.; Schiavone, S. From Geophysics to Microgeophysics for Engineering and Cultural Heritage. Int. J. Geophys. 2011, 428412. [Google Scholar] [CrossRef] [Green Version]
  5. Masini, N.; Persico, R.; Rizzo, E.; Calia, A.; Giannotta, M.T.; Quarta, G.; Pagliuca, A. Integrated Techniques for Analysis and Monitoring of Historical Monuments: The case of S.Giovanni al Sepolcro in Brindisi (Southern Italy). Near Surf. Geophys. 2010, 8, 423–432. [Google Scholar] [CrossRef] [Green Version]
  6. D’Amico, S.; Colica, E.; Persico, R.; Betti, M.; Foti, S.; Paterniti Barbino, M.; Galone, L. Geophysical Investigations, Digital Reconstruction and Numerical Modeling at the Batia Church in Tortorici (Messina, Sicily): Preliminary Results. In Proceedings of the IMEKO TC-4 International Conference on Metrology for Archaeology and Cultural Heritage, Trento, Italy, 22–24 October 2020. [Google Scholar]
  7. Milo, P.; Vagner, M.; Tencer, T.; Murin, I. Application of Geophysical Methods in Archaeological Survey of Early Medieval Fortifications. Remote Sens. 2022, 14, 2471. [Google Scholar] [CrossRef]
  8. Giannino, F.; Leucci, G. Electromagnetic Methods in Geophysics: Applications in GeoRadar, FDEM, TDEM, and AEM; Wiley: Hoboken, NJ, USA, 2021; p. 352. ISBN 978-1-119-77098-5. [Google Scholar]
  9. Obłuski, A.; Herbich, T.; Ryndziewicz, R. Shedding Light on the Sudanese Dark Ages: Geophysical Research at Old Dongola, a City-State of the Funj Period (16th–19th Centuries). Archaeol. Prospect. 2022, 29, 259–273. [Google Scholar] [CrossRef]
  10. Coolen, J.; Wallner, M.; Trausmuth, T.; König, A. New Insights into a Romanesque Basilica Church in the Deserted Town of Corvey, Germany, Based on a High-Resolution GPR Survey. ArcheoSciences 2021, 45, 35–38. [Google Scholar] [CrossRef]
  11. Sayed Hemeda, S.; Pitilakis, K. Geophysical Investigations at Cairo’s Oldest, the Church of Abu Serga (St. Sergius), Cairo, Egypt. Res. Nondestruct. Eval. 2017, 28, 123–149. [Google Scholar] [CrossRef]
  12. Angheluta, L.M.; Ene, D.V. An Interdisciplinary Field Campaign for Modern Investigation and Monitoring in Preservation and Restoration. Int. J. Conserv. Sci. 2015, 6, 455–464. [Google Scholar]
  13. Binda, L.; Saisia, A.; Tiraboschi, C.; Valle, S.; Colla, C.; Forde, M. Application of sonic and radar tests on the piers and walls of the Cathedral of Noto. Constr. Build. Mater. 2003, 17, 613–627. [Google Scholar] [CrossRef]
  14. Ranalli, D.; Scozzafava, M.; Tallini, M. Ground Penetrating Radar Investigations for Restoration of Historical Building: The Case Study of Collemaggio Basilicata (L’Aquila, Italy). J. Cult. Herit. 2004, 5, 91–99. [Google Scholar] [CrossRef]
  15. Pieraccini, M.; Luzi, G.; Noferini, L.; Mecatti, D.; Atzeni, C. Joint Time Frequency Analysis of Layered Masonry Structures Using Ground penetrating radar. IEEE Trans. Geosci. Remote Sens. 2004, 42, 309–317. [Google Scholar] [CrossRef]
  16. Reynolds, J.M. An Introduction to Applied and Environmental Geophysics, 2nd ed.; Wiley: Hoboken, NJ, USA, 2011; p. 710. [Google Scholar]
  17. Leucci, G.; Parise, M.; Sammarco, M.; Scardozzi, G. The Use of Geophysical Prospections to Map Ancient Hydraulic Works: The Triglio Underground Aqueduct (Apulia, Southern Italy). Archaeol. Prospect. 2016, 23, 195–211. [Google Scholar] [CrossRef]
  18. Grasso, F.; Leucci, G.; Masini, N.; Persico, R. GPR Prospecting in Renaissance and Baroque Monuments in Lecce (Southern Italy). In Proceedings of the 6th International Workshop on Advanced Ground Penetrating Radar IWAGPR, Aachen, Germany, 22–24 June 2011; pp. 22–24. [Google Scholar]
  19. Pieraccini, M.; Noferini, L.; Mecatti, D.; Atzeni, C.; Persico, R.; Soldovieri, F. Advanced Processing Techniques for Step-Frequency Continuous-Wave Penetrating Radar: The Case Study of ‘Palazzo Vecchio’ Walls (Firenze, Italy). Res. Nondestruct. Eval. 2006, 17, 71–83. [Google Scholar] [CrossRef]
  20. De Giorgi, L.; Ferrari, I.; Giuri, F.; Leucci, G.; Scardozzi, G. Integrated Geoscientific Surveys at the Church of Santa Maria della Lizza (Alezio-Italy). Sensors 2021, 21, 2205. [Google Scholar] [CrossRef] [PubMed]
  21. Leucci, G. Advances in Geophysical Methods Applied to Forensic Investigations: New Developments in Acquisition and Data Analysis Methodologies; Springer Editore: Berlin/Heidelberg, Germany, 2020; p. 200. ISBN 978-3-030-46241-3. [Google Scholar]
  22. Loke, M.H. Tutorial: 2-D and 3-D Electrical Imaging Surveys. Copyright (1996–2001). Lecture Notes. Available online: http://www.geoelectrical.com/downloads.php (accessed on 18 November 2020).
  23. Conyers, L.B. Innovative Ground-Penetrating Radar Methods for Archaeological Mapping. Archaeol. Prospect. 2006, 13, 139–141. [Google Scholar] [CrossRef]
  24. Goodman, D.; Steinberg, J.; Damiata, B.; Nishimure, Y.; Schneider, K.; Hiromichi, H.; Hisashi, N. GPR Overlay Analysis for Archaeological Prospection. In Proceedings of the 11th International Conference on Ground Penetrating Radar, Columbus, OH, USA, 27–30 June 2006. [Google Scholar]
  25. Conyers, L.B. Ground-Penetrating Radar for Archaeology, 3rd ed.; Alta Mira Press: Lanham, MD, USA, 2013; 258p. [Google Scholar]
Figure 1. The Church of Santa Chiara.
Heritage 06 00158 g001
Figure 2. Areas investigated by geophysical measurements: A, B, C and D are the surveyed areas.
Heritage 06 00158 g002
Figure 3. Phases of ERT measurements with the electrocardiogram electrodes (photo by Leucci).
Heritage 06 00158 g003
Figure 4. Processed radar section acquired on the altar.
Heritage 06 00158 g004
Figure 5. Processed radar sections acquired inside the church: (a) profile n. 2; (b) profile n. 14.
Heritage 06 00158 g005
Figure 6. Processed radar sections acquired outside the church: (a) profile n. 6; (b) profile n. 12.
Heritage 06 00158 g006
Figure 7. GPR time slices related to the altar (area B).
Heritage 06 00158 g007
Figure 8. GPR time slices related to the church (area A).
Heritage 06 00158 g008
Figure 9. GPR time slices related to areas C and D.
Heritage 06 00158 g009
Figure 10. GPR isosurfaces: (a) the altar (area B); (b) the church (area A); (c) outside the church (areas C and D).
Heritage 06 00158 g010
Figure 11. ERT depth slices.
Heritage 06 00158 g011
Figure 12. ERT pseudo-3D visualization.
Heritage 06 00158 g012
Figure 13. EM resistivity depth slices.
Heritage 06 00158 g013
Figure 14. The videoendoscopic results.
Heritage 06 00158 g014
Disclaimer/Publisher’s Note: The statements, opinions and data contained in all publications are solely those of the individual author(s) and contributor(s) and not of MDPI and/or the editor(s). MDPI and/or the editor(s) disclaim responsibility for any injury to people or property resulting from any ideas, methods, instructions or products referred to in the content.

