
Comparison of ARIMA, SutteARIMA, and Holt-Winters, and NNAR Models to Predict Food Grain in India
by
 , , and
Ansari Saleh Ahmar
1,* ,
,
Pawan Kumar Singh
2,3 ,
,
R. Ruliana
1, 
Alok Kumar Pandey
4 and
Stuti Gupta
5 1
Department of Statistics, Universitas Negeri Makassar, Makassar 90223, Indonesia
2
School of Humanities and Social Sciences, Thapar Institute of Engineering and Technology, Patiala 147004, India
3
Department of Economics, Lakshmibai College, University of Delhi, Delhi 110052, India
4
Centre for the Integrated and Rural Development, Banaras Hindu University, Varanasi 221005, India
5
RamManohar Lohia University, Faizabad 224001, India
*
Author to whom correspondence should be addressed.
Forecasting 2023, 5(1), 138-152; https://doi.org/10.3390/forecast5010006
Submission received: 2 December 2022
/
Revised: 26 December 2022
/
Accepted: 7 January 2023
/
Published: 10 January 2023
(This article belongs to the Special Issue Feature Papers of Forecasting 2022)
Abstract
:The agriculture sector plays an essential function within the Indian economic system. Foodgrains provide almost all the calories and proteins. This paper aims to compare ARIMA, SutteARIMA, Holt-Winters, and NNAR models to recommend an effective model to predict foodgrains production in India. The execution of the SutteARIMA predictive model used in this analysis was compared with the established ARIMA, Neural Network Auto-Regressive (NNAR), and Holt-Winters models, which have been widely applied for time series prediction. The findings of this study reveal that both the SutteARIMA model and the Holt-Winters model performed well with real-life problems and can effectively and profitably be engaged for food grain forecasting in India. The food grain forecasting approach with the SutteARIMA model indicated superior performance over the ARIMA, Holt-Winters, and NNAR models. Indeed, the actual and predicted values of the SutteARIMA and Holt-Winters forecasting models are quite close to predicting foodgrains production in India. This has been verified by MAPE and MSE values that are relatively low with the SutteARIMA model. Therefore, India’s SutteARIMA model was used to predict foodgrains production from 2021 to 2025. The forecasted amount of respective crops are as follows (in lakh tonnes) 1140.14 (wheat), 1232.27 (rice), 466.46 (coarse), 259.95 (pulses), and a total 3069.80 (foodgrains) by 2025.
1. Overview of the Study
India’s agriculture has the potential to increase productivity and overall production [1,2]. The present global governance architecture for nutrition, food, and agriculture is incapable of appropriately addressing the difficulties of ensuring progress toward food security [3]; with disproportionately concentrated malnutrition among poor children in India [4]. India’s population is expected to reach 1.7 billion by 2050, roughly equaling China and the United States combined. Can India adequately feed its 1.7 billion people? If food is scarce now [5], what will the circumstances be like in 2050, when India will have an additional 430 million people to feed? [6,7,8].
Food grain prediction is a significant activity for global decision-making in the agriculture sector. An accurate foodgrains prediction approach will help farmers decide when and how much to cultivate [9]. In this situation, it is even more essential to forecast the quantity of crops produced across India effectively. To accomplish this, multiple forecasting models were used to choose the most appropriate model and anticipate future crop output values. An accurate crop production estimate serves as the cornerstone for its agricultural commodities marketing policy decisions. Crop yield forecasting is essential in farm planning and management, domestic food production, international food trade, habitat preservation, and other fields [10]. As a result, the primary goal of this work is to provide an adequate model for forecasting food grain production in India. Several models were used for crop yield forecasting: machine learning algorithms and modeling techniques are often undervalued in defining agricultural produce. A land of a growing population undoubtedly requires optimized output from agriculture. Incorporating the latest comprehensive technology in agriculture is the only way to survive. Liakos et al. [11] demonstrated how agri-technology domain and machine learning programs benefit farmers’ decisions regarding crop, livestock, water, and soil management. Veenadhari et al. [12] have attempted to develop a crop advisor to consider the effect of the most influential climate change parameters on crop yields in Madhya Pradesh. Paul and Sinha [13] forecasted wheat yield concerning weather variables in the Kanpur district of Uttar Pradesh using parametric and non-parametric tests. Turmeric yield was similarly forecasted on climate parameters using a data set for 20 years [14]. In another study performed by Kandiannan et al. [14], turmeric yield was predicted using a multiple regression model where a significant correlation was found between yield and rainfall, evaporation wind speed, minimum temperature, and humidity. Gandhi and Armstrong [15] in their study examined the correlation between climate factors and rice crop yields for the Kharif season in India using a historical data set of agriculture. Likewise, Woodhouse [16] also found technological options for the productivity revolution in Africa. With technology, environmental impact is also an important dimension to consider. The research study by Chlingaryan et al. [17] talks about precision agriculture and improvement in yield production with proper nitrogen management. The future demands sustainable and optimized crop management while minimizing environmental harm. Machine learning algorithms and remote sensing technologies are of great use in this estimation. According to [18], machine learning is a reliable technology for analyzing crop price prediction considering annual rainfall, WPI to produce a logical conclusion. Random Forest Ensembled (RFE) learning and decision tree regressor were compared, and RFE was found to have a higher accuracy. Data mining techniques helped improve crop yield prediction as reflected by studies conducted by Gandhi and Armstrong [15] and Sujatha and Isakki [19].
The developing model that accurately forecasts growth and output can support policy makers by improving control for accurate production, equating market supply and demand with lower cost. According to Alhnaity et al. [20], development in machine learning, in particular, deep learning, can provide new analytical tools.
India has the most significant number of hungry people in the world, as the research work by Banik [21] demonstrates; it reviews India’s success in preventing famine and compares it to the country’s inability to provide food security to hundreds of millions of its citizens. A study conducted by Sherman [22] explores how the methods to get the country to “grow more food” as part of the drive towards nationwide self-sufficiency were marked by conflict between the dream of supplying the benefits of development to all Indians and the reality that the resources in independent India were minimal. Hazra and Bohra [23] suggested meeting growing food demand by ensuring sustainable intensification of crops, achieving high yield per unit production, and bringing more cropland area under cultivation. Thus, achieving food security with constrained resources is required. Agricultural policy makers in most countries rely on prediction models to influence food security policies.
The paper by Mittal et al. [24] stresses using modeling results to coordinate environmental and renewable energy source policies to reach the GHG emission lowering target efficiently and cost-effectively. The mitigation price in terms of economic development and social welfare loss can be reduced by improving the penetration of renewable energy. Farmer’s income is also considered an essential factor in determining agricultural yield. Farmers who lack access to resources, capital, and information lag in optimizing their produce. So, Birthal et al. [25] suggested diversification by small farmers towards high-value crops such as fruits and vegetables that significantly raise farm income. Choosing and producing a crop is a tedious task as various factors affect agriculture such as soil, temperature, humidity, and rainfall, and these differ across regions. According to Thomas [26], it would be of incredible help to agricultural farmers to determine on the storage and business side if it was possible to find the best crop before sowing it. Recommending appropriate crops to farmers can significantly increase productivity and reduce loss. Sujatha and Isakki [19] also demonstrate the crop yield estimation by selecting the most excellent crop, thereby improving the value and gain of the farming area using data mining.
Kang et al. [27] present an estimation of maize yield forecast in the U.S. using different machine learning algorithms [random forest, XGBoost, support vector regressor, Lasso, LSTM, and CNN]. Furthermore, the study found that the yield prediction method helps from the advanced algorithm and large composite of details. The XGBoost outperforms other algorithms both in exactness and strength. It also showed that incorporating the best algorithm and inputs enhances the prediction exactness by 5% compared to the baseline model (Lasso). Zheng et al. [28] added that crewless-aerial-vehicle (UAV)-based remote sensing (RS) possesses the significant advantage of collecting images for precision agricultural applications. Data visualization is vital for understanding the general trends of various factors influencing crop yield. The study by Gandhi and Armstrong [15] examined data visualization approaches to find a correlation between rice crop yield and climatic factors. In agriculture, crop yield production is becoming a significantly challenging task. Earlier, yield prediction was performed by considering farmers’ experience in particular. However, this demands accuracy and farmers’ involvement which is not always feasible. So competitive analysis was performed by Sivanandhini et al. [29] of the crop yield protection model for a district in Tamil Nadu. Then, empirical investigation suggested that SVM (support vector regression) implementation is better than KNN (k-nearest neighbor) decision tree models. The SVM model with two other enhanced variants, F-SVM (fuzzy-support vector regression) and BS-SVR (boosted-support vector regression), was used by Fung et al. [30] to predict the standardized precipitation and transpiration indices and minimize potential drought impact in oil palm plantations at the Langat river basin. F-SVR was found to be best with improved accuracy.
Research Gap
Studies have explained multiple views on the comparative performance of forecasting models. Hence, further investigation is required to help unify a coherent picture of an advanced methodology. This paper, therefore, seeks to compare and clarify different contradictory opinions reported in the literature on the superiority of ARIMA, SutteARIMA, Holt-Winters (H-W), and Neural Network Auto-Regressive (NNAR) models. Moreover, the study has compared ARIMA, SutteARIMA, H-W, and NNAR with their MAPE and MSE values to suggest an appropriate prediction model. The ARIMA method was chosen because it is used in agriculture crop research and foodgrains predictions; for example, ARIMA was used to forecast food crop price [31] and Chinese food grain price [32]; ARIMA along with LSTM-NN models was used to forecast rice cultivation in India [33]. Studies have also predicted the amount of monsoon rainfall in Andhra Pradesh, India by using MANNs (Modular Artificial Neural Network). Subsequently, the crop yield is predicted with rainfall data and the area allotted to that gave crop output by support vector regression. ANN and multiple linear regression were also used by Maya Gopal and Bhargavi [34]. A hybrid relationship of the Multiple Linear Regression-Artificial Neural Network (MLR-ANN) model has been proposed in research work for crop yield forecasts. This hybrid model was compared with Artificial Neural Network (ANN), Multiple Linear Regression (MLR), Support Vector Regression (SVR), k-Nearest Neighbor (KNN), and Random Forest models, and its accuracy outperforms all the other conventional models.
The SutteARIMA model also performed well in several other areas, including COVID-19 and stock prices in Spain [35], to predict COVID-19 in the U.S. [36], and to predict COVID-19 in the World [37]. Moreover, the Holt-Winters method is one of the most widely used predicting algorithms [38]. The method estimated the trend in overall emissions of organic water contaminants in Poland and Romania [39]. In one study, Kahforoushan et al. [40] applied ANN and H-W methods to predict the added value of agriculture subsections. In addition, Michel and Makowski [41] have compared different forecasting models, including Holt-Winters, to predict wheat yield in France.
2. Model
2.1. ARIMA
The Yt process is an ARIMA(p,q) or autoregressive-moving average model if it fulfilled as:
with ϕp(B) is AR(p) and θq(B) is MA(q).
The ARIMA model becomes:
If there is a difference with ϕp(B) is AR(p), (1 − B)d is differencing non-seasonal, and θq(B) is MA(q).
2.2. α-Sutte Indicator
This model (α-Sutte indicator) are developed on the technique of forecasting on the previous values of the indicator set [42]. The ideal applies the adapted version of the moving average method of forecasting. α-Sutte indicator is essentially used to identify and forecast trends and fluctuations in a time-series database. It is based on four data sets of the previous period, that is, Yt−1, Yt−2, Yt−3, and Yt−4 [42]. The equations of the α-Sutte indicator method are [42]:
where:
= data at t time, = data at (t − k) time
2.3. SutteARIMA
SutteARIMA is a method of forecasting that incorporates ARIMA with the method of α-Sutte Indicator [42]. SutteARIMA using the average of results from ARIMA and α-Sutte indicator.
The ARIMA in Equation (1) can be described as:
While Equation (3) can be reduced by using the backward shift operator (BpZt = Zt−p):
If we define:
Equation (4):
Furthermore, Equation (2) can be simplified as:
When Equation (4) is added to Equation (5), we find:
Therefore, Equation (6) is the formula of SutteARIMA.
2.4. Holt-Winters
Holt-Winters approach was divided into two categories: Additive Holt-Winters (AH-W) and Multiplicative Holt-Winters (MH-W). Theseparts are explained in following equations:
The component form for the multiplicative method is:
The component form for the additive method is:
where: yt = data on t time, s = the seasonal length in a certain time, and m = the amount of data to be predicated.
2.5. Neural Network Auto-Regressive (NNAR)
The NNAR is the widely used model for time series modeling and forecasting [43]. This model is a three-layer feedforward neural network involving linear combination and activation functions. The relationship between the model output (yt) and the inputs (at−1; …; yt−p) has the following mathematical representation:
where, wi,j (i = 0, 1, 2, …, n, j = 1, 2, …, h) and wj (j = 0, 1, 2, …, h) are techniques parameters or association weights; n is number of input nodes; and h is number of hidden nodes. A sigmoid function used as the hidden layer transfer function shown in Equation (16). A linear function is the output layer’s most widely used activation function.
3. Methodology
Agriculture food grain production data from 1950–1951 to 2019–2020 was collected from the open data source of Reserver Bank of India (RBI) in India [44]. Reserve Bank of India collects agriculture food grain data from the Ministry of Agriculture & Farmers Welfare, Government of India. Data for 2019–2020 is based on fourth advance estimates. This data was fragmented into five parts: wheat, rice, coarse, pulses, and total crops. Total crops are the sum of all four crops (wheat, rice, coarse, and pulses). The data was split into two categories: training data and test data. Data from 1951 to 2013 was considered for training on that basis test conducted from 2014 to 2020. Based on the fitted data, this study conducted short-term forecasts for the next five years (2021–2025). Ahmar [45] designed the SutteForecast R package in R software which compares the forecasting outcomes of other forecasting approaches. In diagnosing the predictions, we used the forecasting accuracy estimation MAPE (Mean Absolute Percentage Error) [46].
The mean square error is
where, At = actual values at data time t, and =forecast value at data time t.
4. Experimental Results and Discussion
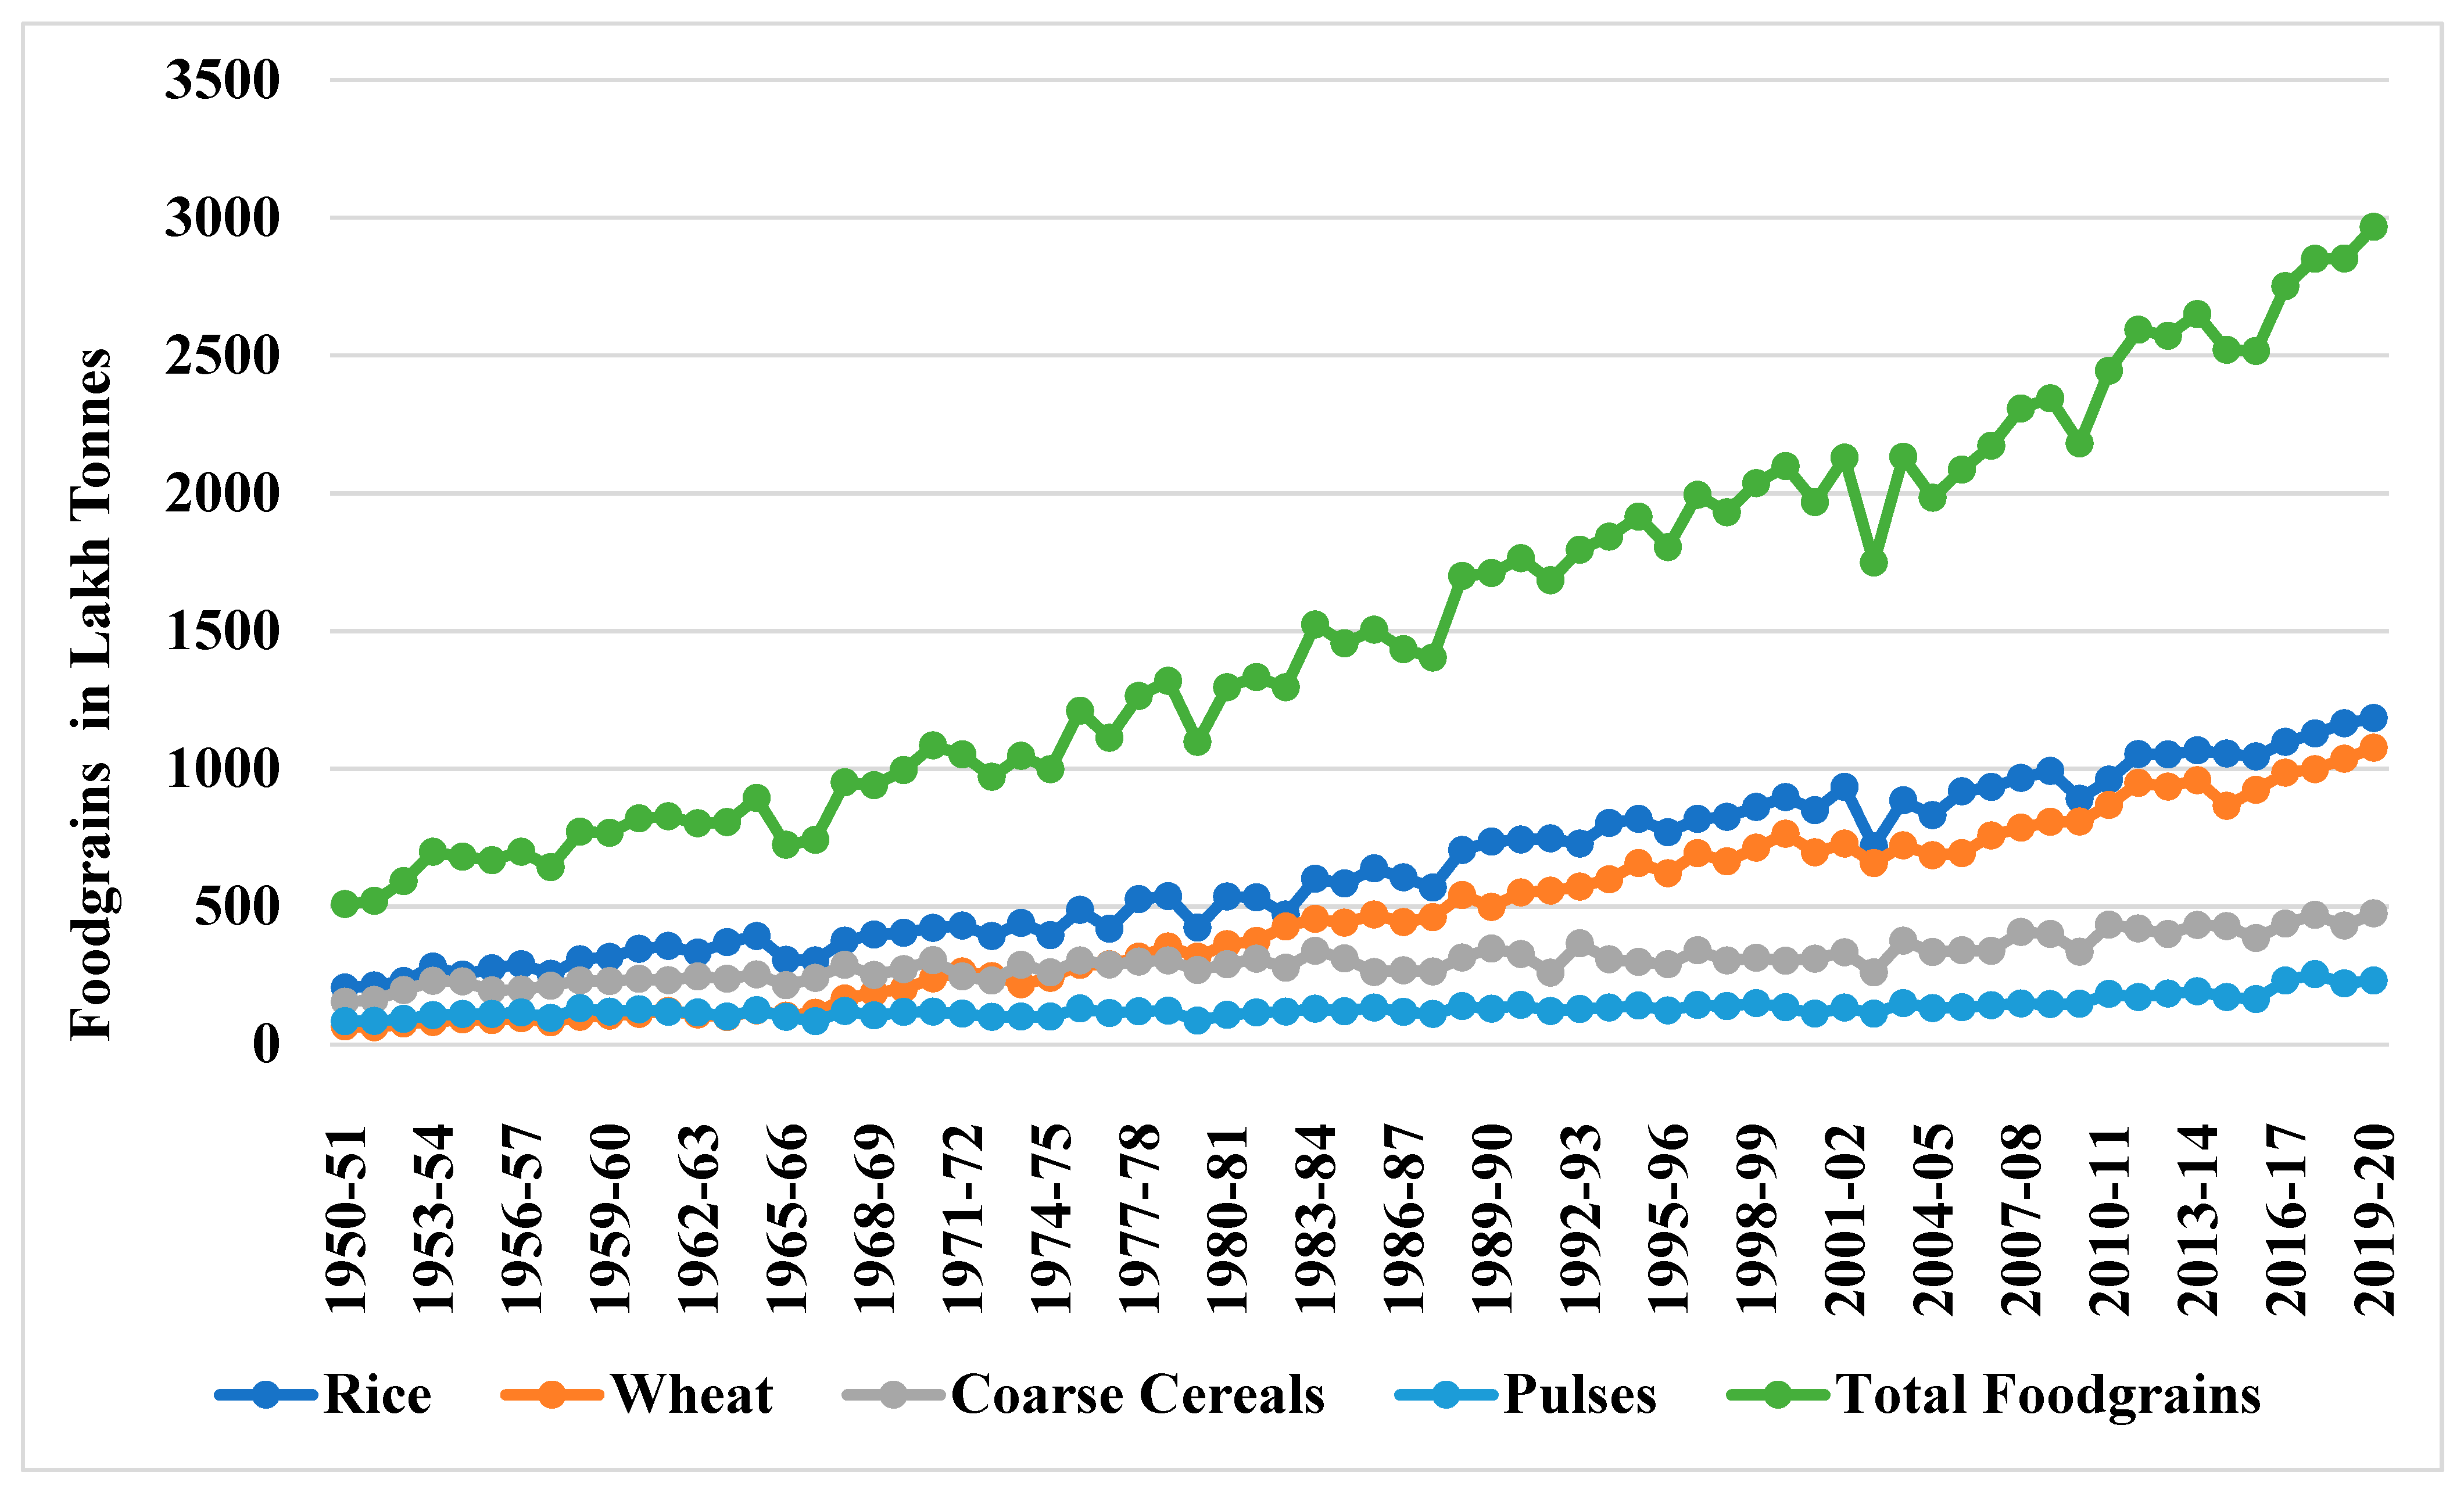
Due to extensive growth of the population, there is a need to make predictions on foodgrains. Past studies, which have made predictions on various aspects, employed limited approach/models. The present research study employs SutteForecast R-studio package to analyze models for ARIMA, SutteARIMA, H-W, and NNAR models, which would be quite helpful in making relatively accurate predictions. Hence, the usage of extensive models makes this study unique and valuable. The acquired findings are provided in the sections below. The first step for analysis is plot data. The plot of data can see in Figure 1.
From Figure 1, we can see that the data has increased from year to year in both data rice, wheat, coarse cereals, pulses, and total foodgrains.
4.1. Result of ARIMA Model
Although ARIMA has been working as a good model for forecasting [47], the current experiment with the ARIMA model gave relatively poor forecast results, as indicated in Table 1, Table 2, Table 3, Table 4 and Table 5. Therefore, ARIMA has not been considered the best model based on the criteria of MAPE and MSE. As shown in Table 6 the mean absolute percentage error (MAPE) and the mean square error (MSE) values for wheat (MAPE:3.71 and MSE:339.78), rice (MAPE:3.23 and MSE:260.77), coarse (MAPE:7.68 and MSE:201.08), pulses (MAPE:16.06 and MSE:272.83), and total (MAPE:2.83 and MSE:3082.6) with ARIMA is relatively higher as compared to some of the other models.
4.2. Result of SutteARIMA Model
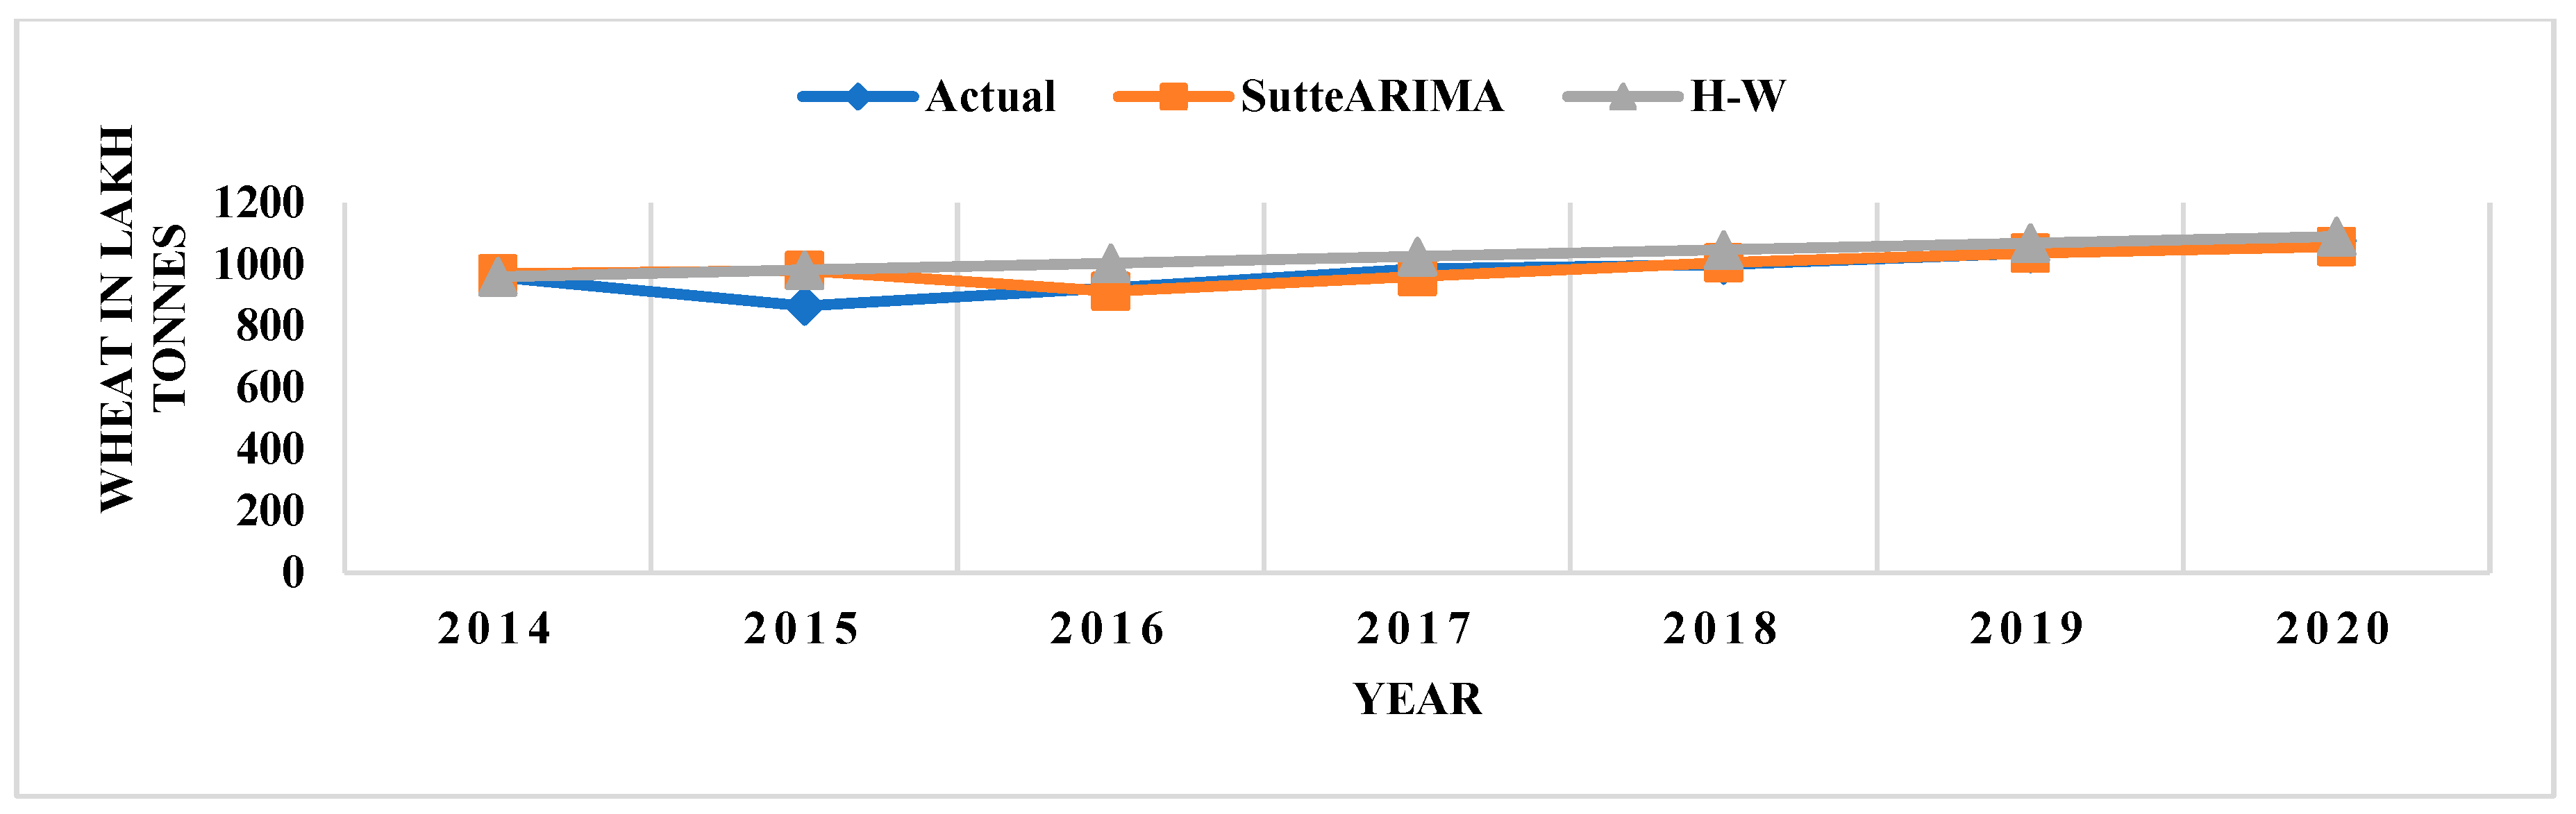
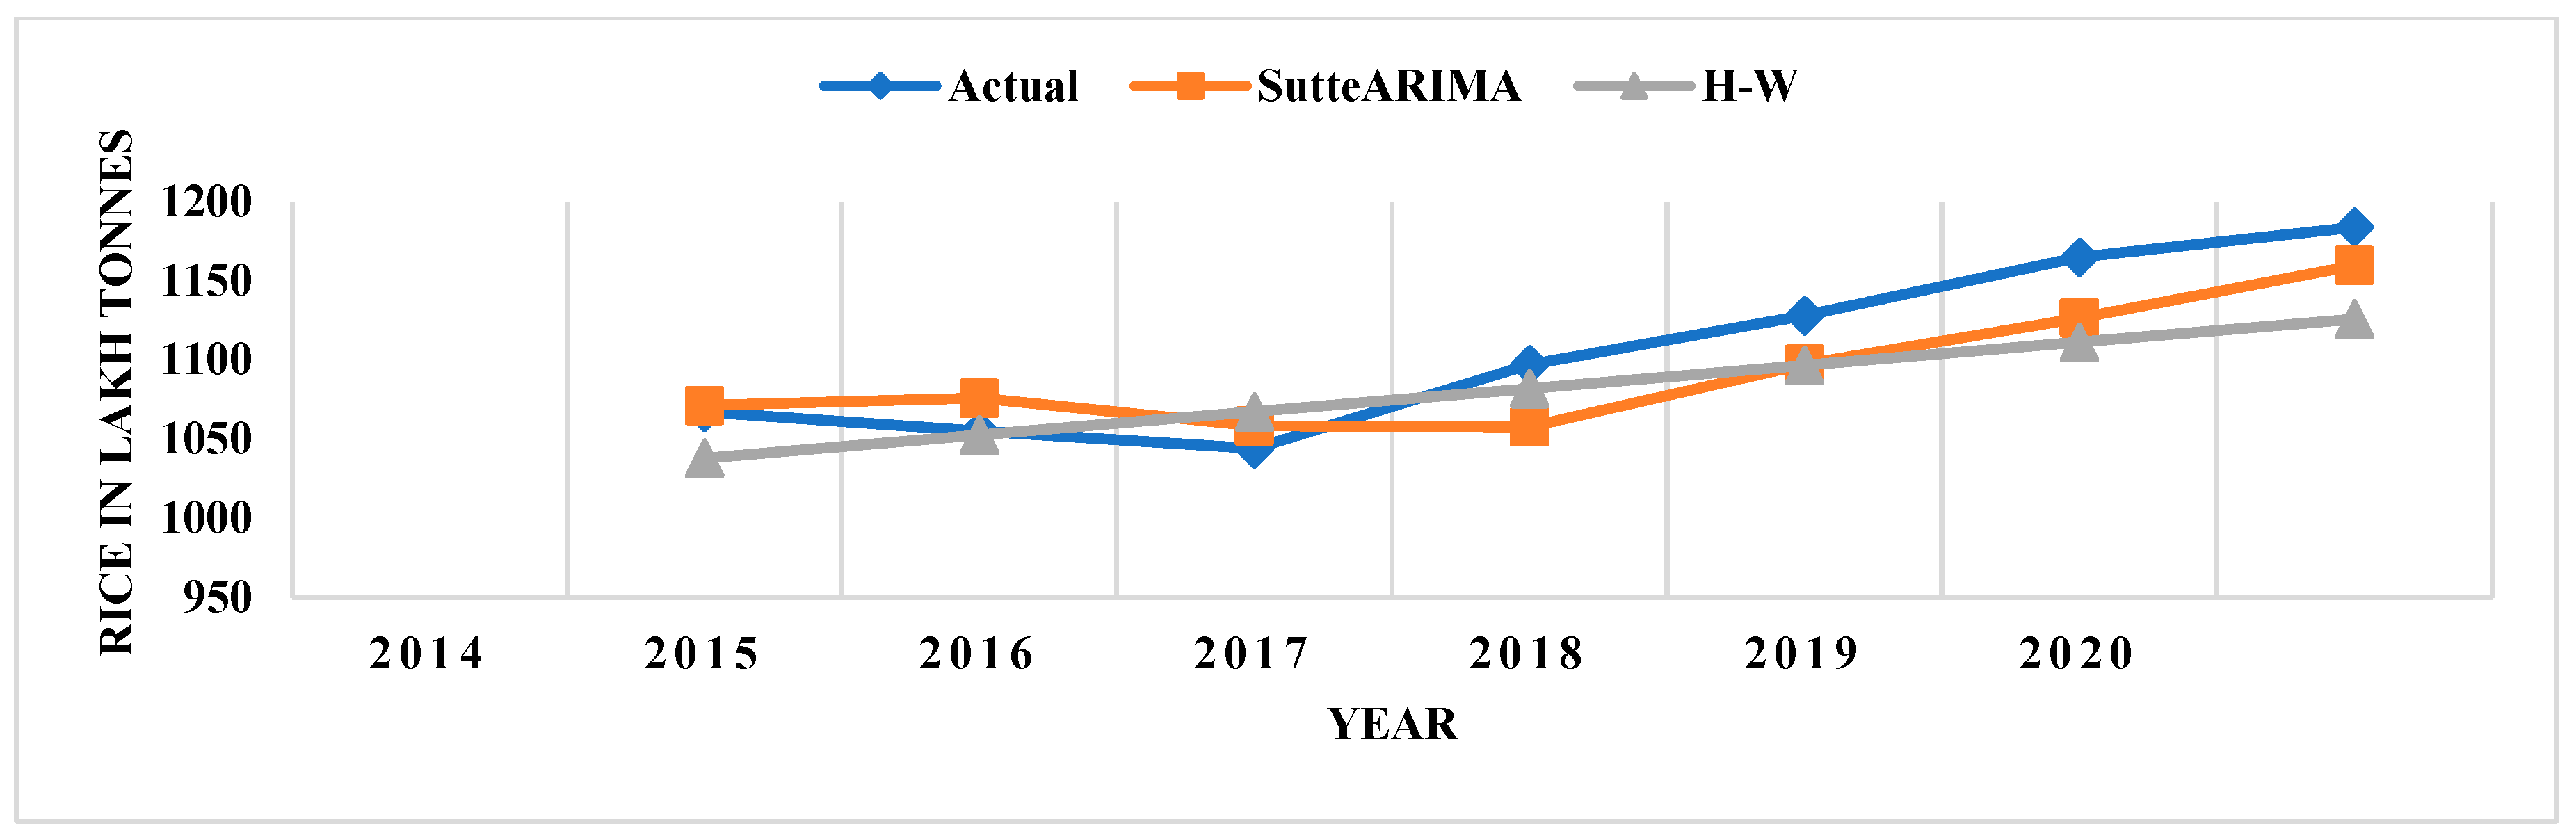
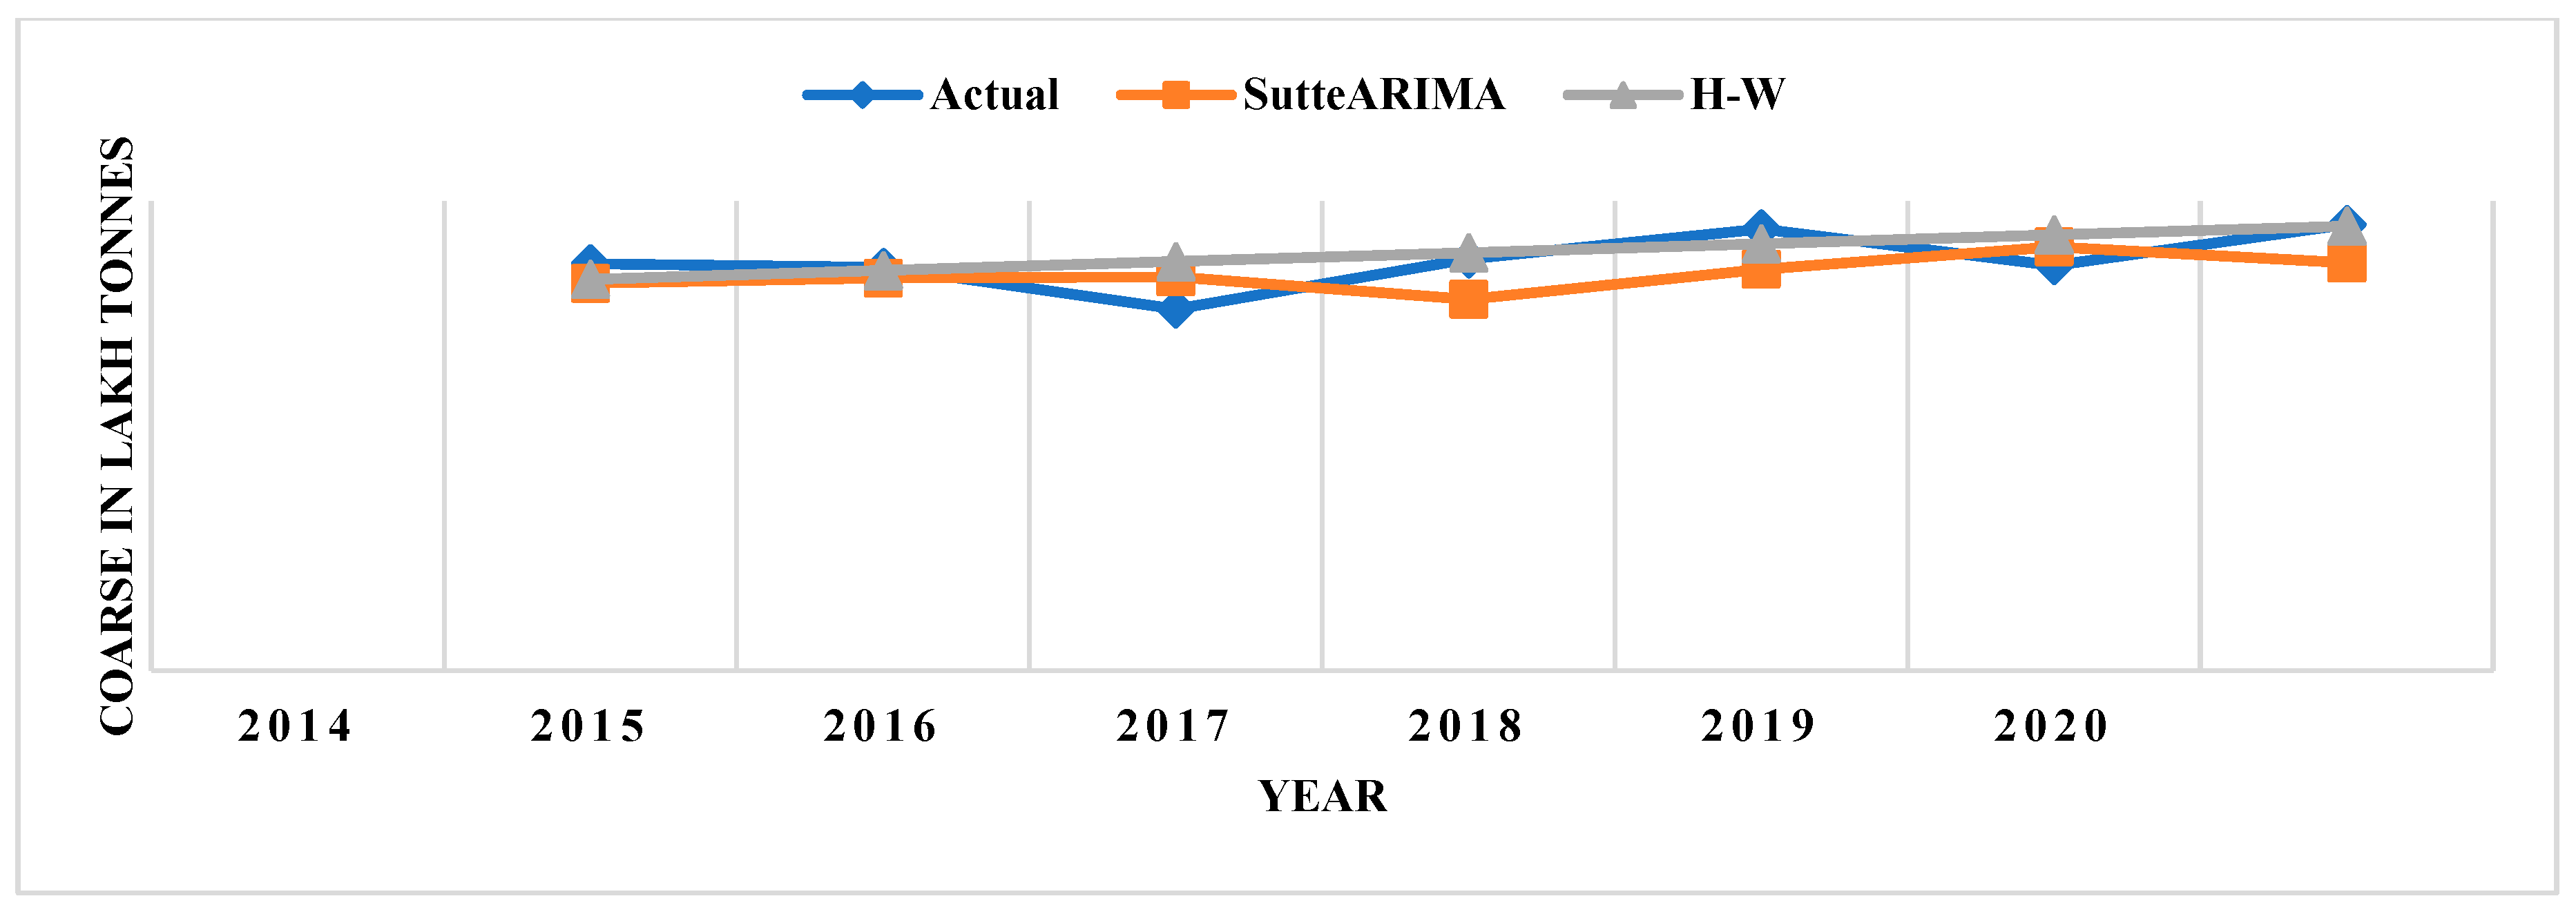
In this study, the SutteARIMA model has performed as the best forecast model in predicting wheat, rice, coarse, pulses, and total crops, as indicated in Table 1, Table 2, Table 3, Table 4 and Table 5. On the other hand, the forecast error is relatively low and outstanding since the projected values are near to the actual values and move in the direction of the forecasted values in many instances, as demonstrated in Table 1, Table 2, Table 3, Table 4 and Table 5. In addition, MAPE and MSE values with the SutteARIMA model were recorded relatively lower compared to ARIMA, Holt-Winter (except coarse), and NNAR, as given in Table 6. The actual and predicted values are presented in Table 1, Table 2, Table 3, Table 4 and Table 5, comparing all the models mentioned in the study. Hence, this model has been selected as the best model to predict crop production for the next five years (2021–2025). Figure 2, Figure 3, Figure 4, Figure 5 and Figure 6 provide the graph for the predicted values of crops.
4.3. Comparison of SutteARIMA and Holt-Winters (H-W)
From the observed outcomes presented in Table 1, Table 2, Table 3, Table 4 and Table 5 and Figure 2, Figure 3, Figure 4 and Figure 5, it is observed that the forecasting exactness level of the SutteARIMA model compared with that of the Holt-Winters (H-W) model is not quite significantly different from each other. It can be argued that both models achieved good forecast performance. They were judged on the prediction error (MAPE and MSE) for both models (SutteARIMA and Holt-Winters), which came out pretty low as compared to ARIMA and NNAR models. The SutteARIMA model was also found as the best method in several studies to forecast COVID-19 and the stock price in Spain [35], to predict COVID-19 in the U.S. [36], and to predict COVID-19 in world [37]. The Holt-Winters approach is one of the widely used forecasting techniques [38]. It was used to evaluate the movement in overall emissions of organic water contaminants as well as the exposure of the textile industry to pollution in Eastern Europe [39]. It has ensured the best predicting values for long-term and short-term thermal load forecasting [48]. However, the execution of the SutteARIMA model is better than the Holt-Winter model in terms of forecasting accuracy in test data in the current study. Table 6 shows that the SutteARIMA model is better than the Holt-Winters model for wheat, rice, pulses, and total food grain production, whereas Holt-Winters performed well to predict coarse production with lower MAPE (4.36) and MSE (85.20) values. Statistical tests were carried out, showing no significant difference between the actual and predicted values of the SutteARIMA and Holt-Winters models, as shown in Table 1, Table 2, Table 3, Table 4 and Table 5. Notwithstanding, SutteARIMA is still better. Hence, this study further clarifies the contrary opinions reported in the literature about the superiority of the SutteARIMA model over ARIMA, Holt-Winters, and NNAR models in time series prediction.
4.4. Result of NNAR Model
MAPE and MSE values with the NNAR model were significantly higher compared to ARIMA, SutteARIMA, and H-W. This finding agrees with some research studies; ARIMA was found more accurate in forecasting the horizon-daily values of CO2 than NNAR [49], in admission the NNAR model is considered inferior to H-W and ARIMA to predict tourist arrival data [50]. However, in several studies, it performed quite well, including unemployment rate prediction in Romania [51] and dengue epidemics [52].
Based on forecasting results, this study concludes that the SutteARIMA model is the most suitable forecasting method to predict foodgrains production in India. The value of MAPE, the least that of MSE value were verified. India’s SutteARIMA model was used to predict foodgrains production from 2021–2025. The result of the forecast of SutteARIMA is shown in Table 7. In addition, Table 7, presents the lower and upper value (99%) of forecasting.
5. Conclusions
The observed results combined with published food grain data on the performance of different prediction models SutteARIMA, ARIMA, Holt-Winters, and NNAR models were used in this study. The performance of the SutteARIMA predictive model applied in this study was compared with the conventional ARIMA, Holt-Winters, and NNAR models, which were widely used for time series forecasting. Our findings reveal that both the SutteARIMA model and the Holt-Winters model could achieve reliable forecasts when applied to real-life problems. This helps further to effectively and profitably engage food grain forecasting in India. The food grain prediction with the SutteARIMA approach revealed superior performance over ARIMA, Holt-Winters, and NNAR models. Indeed, the actual and predicted values of the SutteARIMA and Holt-Winters predictive model are quite close in predicting food grain production in India. This has been verified by MAPE and MSE values that are relatively low for the SutteARIMA model. India’s SutteARIMA model has been used to predict food grain production from 2021 to 2025. The forecasted amount of respective crops in lakh tonnes was predicted to be 1140.14 (wheat), 1232.27 (rice), 466.46 (coarse), 259.95 (pulses), and a total of 3069.80 (foodgrains) by 2025.
6. Policy Implication and Further Suggestion for Research
India enjoys the dubious distinction of being ranked the second most populated country on the planet. Speculations are made that in the near future, India can supposedly overtake China in the number of inhabitants. This presents a precarious condition as the rising population will eventually place demand on foodgrains for human survival, and it would necessarily be the responsibility of the State to provide the same. Hence, to feed the huge population, there has to be a realistic attempt to understand what would be the possible demand placed by the population. Predictions about foodgrains can assist in understanding whether the current rate at which foodgrains are produced would be adequate to meet the increasing demands. Accurate predictions of foodgrains is a herculean task in the Indian context considering the volatile environment and extremely diverse soil quality. The issues of predictions of foodgrains will be resolved if the appropriate method is used. The SutteARIMA model was found to be a suitable method for predictions of foodgrains in India. Moreover, it will assist in providing a baseline from which various policymakers can seek to resolve future predictions of foodgrains while designing the strategy. It is estimated that the world population will grow to 9 billion by the year 2050.
Consequently, there will be enormous challenges at the global level to produce a significant amount of food as compared to the present scenario. In the given scenario, the study would ideally help in accurately anticipating food grain production. This study would essentially assist the policy makers/decision makers in designing special policies in case of a serious mismatch between the demand placed for foodgrains by the ever-increasing population and the predictions about the production of foodgrains. By and large, these policy interventions would yield benefits for future studies and also for the larger society. In the future, research combining this model with other methods, such as the LSTM, RNN, decision tree, and reinforcement learning methods, can lead to better forecasting accuracy. This research work has been conducted for academic and research only, and the predictions for the future are based on the premise that the existing restrictive circumstances will remain.
Author Contributions
A.S.A.: conceptualization, methodology, software data curation, visualization, writing—original draft preparation, writing—reviewing and editing. P.K.S.: conceptualization, methodology, software data curation, visualization, writing—original draft preparation, writing—reviewing and editing. R.R.: software data curation, visualization, writing—reviewing. A.K.P.: investigation, supervision, validation, writing—reviewing and editing. S.G.: software data curation, visualization. All authors have read and agreed to the published version of the manuscript.
Funding
This research received no external funding.
Data Availability Statement
Not applicable.
Conflicts of Interest
The authors declare no conflict of interest.
References
- Huang, J.; Pray, C.; Rozelle, S. Enhancing the Crops to Feed the Poor. Nature 2002, 418, 678–684. [Google Scholar] [CrossRef] [PubMed]
- Ray, D.K.; Ramankutty, N.; Mueller, N.D.; West, P.C.; Foley, J.A. Recent Patterns of Crop Yield Growth and Stagnation. Nat. Commun. 2012, 3, 1293. [Google Scholar] [CrossRef] [Green Version]
- von Braun, J. Food Insecurity, Hunger and Malnutrition: Necessary Policy and Technology Changes. New Biotechnol. 2010, 27, 449–452. [Google Scholar] [CrossRef] [PubMed]
- Pathak, P.K.; Singh, A. Trends in Malnutrition among Children in India: Growing Inequalities across Different Economic Groups. Soc. Sci. Med. 2011, 73, 576–585. [Google Scholar] [CrossRef]
- Chatterjee, N.; Fernandes, G.; Hernandez, M. Food Insecurity in Urban Poor Households in Mumbai, India. Food Secur. 2012, 4, 619–632. [Google Scholar] [CrossRef]
- FAO. Food and Agriculture Organization of the United Nations. Available online: http://www.fao.org/home/en/ (accessed on 31 May 2021).
- Le Mouël, C.; Forslund, A. How Can We Feed the World in 2050? A Review of the Responses from Global Scenario Studies. Eur. Rev. Agric. Econ. 2017, 44, 541–591. [Google Scholar] [CrossRef]
- Pingali, P.; Aiyar, A.; Abraham, M.; Rahman, A. Indian Food Systems towards 2050: Challenges and Opportunities. In Transforming Food Systems for a Rising India; Palgrave Studies in Agricultural Economics and Food Policy; Pingali, P., Aiyar, A., Abraham, M., Rahman, A., Eds.; Springer International Publishing: Cham, Switzerland, 2019; pp. 1–14. ISBN 978-3-030-14409-8. [Google Scholar]
- van Klompenburg, T.; Kassahun, A.; Catal, C. Crop Yield Prediction Using Machine Learning: A Systematic Literature Review. Comput. Electron. Agric. 2020, 177, 105709. [Google Scholar] [CrossRef]
- Guo, W.W.; Xue, H. Crop Yield Forecasting Using Artificial Neural Networks: A Comparison between Spatial and Temporal Models. Math. Probl. Eng. 2014, 2014, 857865. [Google Scholar] [CrossRef]
- Liakos, K.G.; Busato, P.; Moshou, D.; Pearson, S.; Bochtis, D. Machine Learning in Agriculture: A Review. Sensors 2018, 18, 2674. [Google Scholar] [CrossRef] [Green Version]
- Veenadhari, S.; Misra, B.; Singh, C. Machine Learning Approach for Forecasting Crop Yield Based on Climatic Parameters. In Proceedings of the 2014 International Conference on Computer Communication and Informatics, Coimbatore, India, 3–5 January 2014; IEEE: Piscataway, NJ, USA, 2014; pp. 1–5. [Google Scholar]
- Paul, R.K.; Sinha, K. Forecasting Crop Yield: A Comparitve Assessment of Arimax and Narx Model. RASHI J. Soc. Appl. Stat. Agric. Allied Sci. 2016, 1, 77–85. [Google Scholar]
- Kandiannan, K.; Chandaragiri, K.K.; Sankaran, N.; Balasubramanian, T.N.; Kailasam, C. Crop-Weather Model for Turmeric Yield Forecasting for Coimbatore District, Tamil Nadu, India. Agric. For. Meteorol. 2002, 112, 133–137. [Google Scholar] [CrossRef]
- Gandhi, N.; Armstrong, L.J. Rice Crop Yield Forecasting of Tropical Wet and Dry Climatic Zone of India Using Data Mining Techniques. In Proceedings of the 2016 IEEE International Conference on Advances in Computer Applications (ICACA), Coimbatore, India, 24 October 2016; IEEE: Piscataway, NJ, USA, 2016; pp. 357–363. [Google Scholar]
- Woodhouse, P. Technology, Environment and the Productivity Problem in African Agriculture: Comment on the World Development Report 2008. J. Agrar. Chang. 2009, 9, 263–276. [Google Scholar] [CrossRef]
- Chlingaryan, A.; Sukkarieh, S.; Whelan, B. Machine Learning Approaches for Crop Yield Prediction and Nitrogen Status Estimation in Precision Agriculture: A Review. Comput. Electron. Agric. 2018, 151, 61–69. [Google Scholar] [CrossRef]
- Prassanna, A.S.; Harshanand, B.A.; Srishti, B.; Chaitanya, R.; Soundari, K.N.; Sriram, S.; Kumar, V.M.; Chennamsetti, V.; Venkateshwaran, G.; Maurya, P.K. Crop Value Forecasting Using Decision Tree Regressor and Models. Eur. J. Mol. Clin. Med. 2020, 7, 3702–32722. [Google Scholar]
- Sujatha, R.; Isakki, P. A Study on Crop Yield Forecasting Using Classification Techniques. In Proceedings of the 2016 International Conference on Computing Technologies and Intelligent Data Engineering (ICCTIDE’16), Kovilpatti, India, 7–9 January 2016; IEEE: Piscataway, NJ, USA, 2016; pp. 1–4. [Google Scholar]
- Alhnaity, B.; Pearson, S.; Leontidis, G.; Kollias, S. Using Deep Learning to Predict Plant Growth and Yield in Greenhouse Environments. Acta Hortic. 2020, 1296, 425–432. [Google Scholar] [CrossRef]
- Banik, D. The Hungry Nation: Food Policy and Food Politics in India. Food Ethics 2016, 1, 29–45. [Google Scholar] [CrossRef] [Green Version]
- Sherman, T.C. From ‘Grow More Food’ to ‘Miss a Meal’: Hunger, Development and the Limits of Post-Colonial Nationalism in India, 1947–1957. South Asia J. South Asian Stud. 2013, 36, 571–588. [Google Scholar] [CrossRef] [Green Version]
- Hazra, K.K.; Bohra, A. Increasing Relevance of Pulse Crops to Sustainable Intensification of Indian Agriculture. Natl. Acad. Sci. Lett. 2021, 44, 1–3. [Google Scholar] [CrossRef]
- Mittal, S.; Dai, H.; Fujimori, S.; Masui, T. Bridging Greenhouse Gas Emissions and Renewable Energy Deployment Target: Comparative Assessment of China and India. Appl. Energy 2016, 166, 301–313. [Google Scholar] [CrossRef]
- Birthal, P.S.; Joshi, P.K.; Roy, D.; Thorat, A. Diversification in Indian Agriculture toward High-Value Crops: The Role of Small Farmers. Can. J. Agric. Econ. Can. Agroecon. 2013, 61, 61–91. [Google Scholar] [CrossRef]
- Thomas, K.T. Crop Prediction Using Machine Learning. Int. J. Future Gener. Commun. Netw. 2020, 13, 6. [Google Scholar]
- Kang, Y.; Ozdogan, M.; Zhu, X.; Ye, Z.; Hain, C.; Anderson, M. Comparative Assessment of Environmental Variables and Machine Learning Algorithms for Maize Yield Prediction in the US Midwest. Environ. Res. Lett. 2020, 15, 064005. [Google Scholar] [CrossRef]
- Zheng, H.; Li, W.; Jiang, J.; Liu, Y.; Cheng, T.; Tian, Y.; Zhu, Y.; Cao, W.; Zhang, Y.; Yao, X. A Comparative Assessment of Different Modeling Algorithms for Estimating Leaf Nitrogen Content in Winter Wheat Using Multispectral Images from an Unmanned Aerial Vehicle. Remote Sens. 2018, 10, 2026. [Google Scholar] [CrossRef]
- Sivanandhini, P.; Prakash, J. Crop Yield Prediction Analysis Using Feed Forward and Recurrent Neural Network. Int. J. Innov. Sci. Res. Technol. 2020, 5, 1092–1096. [Google Scholar]
- Fung, K.F.; Huang, Y.F.; Koo, C.H.; Mirzaei, M. Improved SVR Machine Learning Models for Agricultural Drought Prediction at Downstream of Langat River Basin, Malaysia. J. Water Clim. Chang. 2020, 11, 1383–1398. [Google Scholar] [CrossRef]
- Shao, Y.E.; Dai, J.-T. Integrated Feature Selection of ARIMA with Computational Intelligence Approaches for Food Crop Price Prediction. Complexity 2018, 2018, e1910520. [Google Scholar] [CrossRef]
- Zou, H.F.; Xia, G.P.; Yang, F.T.; Wang, H.Y. An Investigation and Comparison of Artificial Neural Network and Time Series Models for Chinese Food Grain Price Forecasting. Neurocomputing 2007, 70, 2913–2923. [Google Scholar] [CrossRef]
- Paidipati, K.; Banik, A. Forecasting of Rice Cultivation in India-A Comparative Analysis with ARIMA and LSTM-NN Models. ICST Trans. Scalable Inf. Syst. 2018, 7, 161409. [Google Scholar] [CrossRef]
- Maya Gopal, P.S.; Bhargavi, R. A Novel Approach for Efficient Crop Yield Prediction. Comput. Electron. Agric. 2019, 165, 104968. [Google Scholar] [CrossRef]
- Ahmar, A.S.; Boj, E. SutteARIMA: Short-Term Forecasting Method, a Case: Covid-19 and Stock Market in Spain. Sci. Total Environ. 2020, 729, 138883. [Google Scholar] [CrossRef]
- Ahmar, A.; Boj, E. Current Research in Behavioral Sciences Will COVID-19 Confirmed Cases in the USA Reach 3 Million? A Forecasting Approach by Using SutteARIMA Method. Curr. Res. Behav. Sci. 2020, 1, 100002. [Google Scholar] [CrossRef]
- Ahmar, A.S.; Rusli, R. Will Covid-19 Cases in the World Reach 4 Million? A Forecasting Approach Using SutteARIMA. JOIV Int. J. Inform. Vis. 2020, 4, 159–161. [Google Scholar] [CrossRef]
- Trull, O.; García-Díaz, J.C.; Troncoso, A. Initialization Methods for Multiple Seasonal Holt-Winters Forecasting Models. Mathematics 2020, 8, 268. [Google Scholar] [CrossRef] [Green Version]
- Paraschiv, D.; Tudor, C.; Petrariu, R. The Textile Industry and Sustainable Development: A Holt-Winters Forecasting Investigation for the Eastern European Area. Sustainability 2015, 7, 1280–1291. [Google Scholar] [CrossRef]
- Kahforoushan, E.; Zarif, M.; Mashahir, E.B. Prediction of Added Value of Agricultural Subsections Using Artificial Neural Networks: Box-Jenkins and Holt-Winters Methods. J. Dev. Agric. Econ. 2010, 2, 115–121. [Google Scholar] [CrossRef]
- Michel, L.; Makowski, D. Comparison of Statistical Models for Analyzing Wheat Yield Time Series. PLoS ONE 2013, 8, e78615. [Google Scholar] [CrossRef] [Green Version]
- Ahmar, A.S.; Rahman, A.; Mulbar, U. α-Sutte Indicator: A New Method for Time Series Forecasting. J. Phys. Conf. Ser. 2018, 1040, 012018. [Google Scholar] [CrossRef] [Green Version]
- Zhang, G.; Eddy Patuwo, B.; Hu, M.Y. Forecasting with Artificial Neural Networks: The State of the Art. Int. J. Forecast. 1998, 14, 35–62. [Google Scholar] [CrossRef]
- Reserver Bank of India. Dbie-Rbi: Database of Indian Economy. Available online: https://dbie.rbi.org.in/DBIE/dbie.rbi?site=statistics (accessed on 20 May 2021).
- Ahmar, A.S. RcmdrPlugin. SutteForecastR: An RcmdrPlugin for Forecasting Data. J. Phys. Conf. Ser. 2018, 1028, 012224. [Google Scholar] [CrossRef] [Green Version]
- Kim, S.; Kim, H. A New Metric of Absolute Percentage Error for Intermittent Demand Forecasts. Int. J. Forecast. 2016, 32, 669–679. [Google Scholar] [CrossRef]
- Adebiyi, A.A.; Adewumi, A.O.; Ayo, C.K. Comparison of ARIMA and Artificial Neural Networks Models for Stock Price Prediction. J. Appl. Math. 2014, 2014, 614342. [Google Scholar] [CrossRef] [Green Version]
- Tratar, L.F.; Strmčnik, E. The Comparison of Holt-Winters Method and Multiple Regression Method: A Case Study. Energy 2016, 109, 266–276. [Google Scholar] [CrossRef]
- Maleki, A.; Nasseri, S.; Aminabad, M.S.; Hadi, M. Comparison of ARIMA and NNAR Models for Forecasting Water Treatment Plant’s Influent Characteristics. KSCE J. Civ. Eng. 2018, 22, 3233–3245. [Google Scholar] [CrossRef]
- Thoplan, R. Simple v/s Sophisticated Methods of Forecasting for Mauritius Monthly Tourist Arrival Data. Int. J. Stat. Appl. 2014, 4, 217–223. [Google Scholar]
- Davidescu, A.A.; Apostu, S.-A.; Paul, A. Comparative Analysis of Different Univariate Forecasting Methods in Modelling and Predicting the Romanian Unemployment Rate for the Period 2021-2022. Entropy 2021, 23, 325. [Google Scholar] [CrossRef]
- Chakraborty, T.; Chattopadhyay, S.; Ghosh, I. Forecasting Dengue Epidemics Using a Hybrid Methodology. Phys. Stat. Mech. Its Appl. 2019, 527, 121266. [Google Scholar] [CrossRef]
Figure 1.
Foodgrains production in India (1950–51 to 2019–20).

Figure 2.
Actual wheat versus predicted values using SutteARIMA and H-W.

Figure 3.
Actual rice versus predicted values using SutteARIMA and H-W.

Figure 4.
Actual coarse versus predicted values using SutteARIMA and H-W.

Figure 5.
Actual pulses versus predicted values using SutteARIMA and H-W.

Figure 6.
Actual total crops versus predicted values using SutteARIMA and H-W.


Table 1.
Results of the fitting value of wheat production in India.
| Year | Actual | ARIMA (1,1,0) with Drift | APE | SutteARIMA | APE | H-W | APE | NNAR(1,1) | APE |
|---|---|---|---|---|---|---|---|---|---|
| 2014 | 959 | 960.08 | 0.11 | 969.68 | 1.11 | 959.96 | 0.10 | 934.12 | 2.59 |
| 2015 | 865 | 970.15 | 12.16 | 980.23 | 13.32 | 981.84 | 13.51 | 933.36 | 7.90 |
| 2016 | 923 | 985.99 | 6.82 | 912.37 | 1.15 | 1003.73 | 8.75 | 932.71 | 1.05 |
| 2017 | 985 | 999.61 | 1.48 | 960.48 | 2.49 | 1025.62 | 4.12 | 932.16 | 5.36 |
| 2018 | 999 | 1014.08 | 1.51 | 1005.33 | 0.63 | 1047.50 | 4.85 | 931.68 | 6.73 |
| 2019 | 1036 | 1028.22 | 0.75 | 1036.61 | 0.06 | 1069.39 | 3.22 | 931.26 | 10.10 |
| 2020 | 1076 | 1042.50 | 3.11 | 1058.55 | 1.62 | 1091.27 | 1.42 | 930.91 | 13.48 |
Table 2.
Results of the fitting value of rice production in India.
| Year | Actual | ARIMA (0,1,1) with Drift | APE | SutteARIMA | APE | H-W | APE | NNAR (1,1) | APE |
|---|---|---|---|---|---|---|---|---|---|
| 2014 | 1067 | 1034.46 | 3.05 | 1071.21 | 0.39 | 1037.96 | 2.72 | 1011.00 | 5.24 |
| 2015 | 1055 | 1047.62 | 0.70 | 1075.88 | 1.98 | 1052.62 | 0.23 | 985.60 | 6.57 |
| 2016 | 1044 | 1060.78 | 1.61 | 1058.25 | 1.37 | 1067.28 | 2.23 | 968.77 | 7.20 |
| 2017 | 1097 | 1073.93 | 2.10 | 1057.67 | 3.59 | 1081.94 | 1.37 | 957.16 | 12.74 |
| 2018 | 1128 | 1087.09 | 3.63 | 1097.28 | 2.72 | 1096.59 | 2.78 | 948.92 | 15.87 |
| 2019 | 1165 | 1100.25 | 5.56 | 1126.59 | 3.30 | 1111.25 | 4.61 | 942.96 | 19.05 |
| 2020 | 1184 | 1113.40 | 5.96 | 1159.76 | 2.05 | 1125.91 | 4.91 | 938.61 | 20.72 |
Table 3.
Results of the fitting value of coarse production in India.
| Year | Actual | ARIMA (0,1,1) with Drift | APE | SutteARIMA | APE | H-W | APE | NNAR (2,2) | APE |
|---|---|---|---|---|---|---|---|---|---|
| 2014 | 433 | 398.64 | 7.93 | 412.19 | 4.81 | 416.32 | 3.85 | 387.98 | 10.39 |
| 2015 | 429 | 402.06 | 6.28 | 417.70 | 2.63 | 425.78 | 0.75 | 383.05 | 10.70 |
| 2016 | 385 | 405.48 | 5.32 | 419.04 | 8.84 | 435.23 | 13.05 | 380.02 | 1.29 |
| 2017 | 438 | 408.90 | 6.64 | 395.07 | 9.80 | 444.69 | 1.53 | 378.54 | 13.57 |
| 2018 | 470 | 412.31 | 12.27 | 426.96 | 9.16 | 454.15 | 3.37 | 377.66 | 19.64 |
| 2019 | 431 | 415.73 | 3.54 | 450.85 | 4.61 | 463.60 | 7.56 | 377.19 | 12.48 |
| 2020 | 475 | 419.15 | 11.76 | 433.78 | 8.68 | 473.06 | 0.41 | 376.92 | 20.64 |
Table 4.
Results of the fitting value of pulses production in India.
| Year | Actual | ARIMA (0,1,1) with Drift | APE | SutteARIMA | APE | H-W | APE | NNAR (2,2) | APE |
|---|---|---|---|---|---|---|---|---|---|
| 2014 | 193 | 173.30 | 10.21 | 184.90 | 4.20 | 174.28 | 9.70 | 178.34 | 7.59 |
| 2015 | 172 | 174.63 | 1.53 | 185.82 | 8.03 | 175.71 | 2.16 | 178.53 | 3.80 |
| 2016 | 164 | 175.95 | 7.29 | 174.46 | 6.38 | 177.13 | 8.01 | 178.34 | 8.74 |
| 2017 | 231 | 177.28 | 23.26 | 167.75 | 27.38 | 178.56 | 22.70 | 178.33 | 22.80 |
| 2018 | 254 | 178.61 | 29.68 | 213.26 | 16.04 | 179.99 | 29.14 | 178.32 | 29.80 |
| 2019 | 221 | 179.93 | 18.58 | 232.74 | 5.31 | 181.41 | 17.91 | 178.32 | 19.31 |
| 2020 | 232 | 181.26 | 21.87 | 213.09 | 8.15 | 182.84 | 21.19 | 178.32 | 23.14 |
Table 5.
Results of the fitting value of total food grain production in India.
| Year | Actual | ARIMA (0,1,1) with Drift | APE | SutteARIMA | APE | H-W | APE | NNAR (1,1) | APE |
|---|---|---|---|---|---|---|---|---|---|
| 2014 | 2650 | 2536.40 | 4.29 | 2621.95 | 1.06 | 2550.90 | 3.74 | 2534.96 | 4.34 |
| 2015 | 2520 | 2568.49 | 1.92 | 2644.35 | 4.93 | 2591.82 | 2.85 | 2506.17 | 0.55 |
| 2016 | 2516 | 2600.57 | 3.36 | 2548.88 | 1.31 | 2632.74 | 4.64 | 2482.89 | 1.32 |
| 2017 | 2751 | 2632.66 | 4.30 | 2565.91 | 6.73 | 2673.66 | 2.81 | 2463.88 | 10.44 |
| 2018 | 2850 | 2664.74 | 6.50 | 2727.00 | 4.32 | 2714.58 | 4.75 | 2448.24 | 14.10 |
| 2019 | 2852 | 2696.83 | 5.44 | 2830.45 | 0.76 | 2755.50 | 3.38 | 2435.30 | 14.61 |
| 2020 | 2966 | 2728.91 | 7.99 | 2848.49 | 3.96 | 2796.42 | 5.72 | 2424.52 | 18.26 |
Table 6.
Error values of models for wheat, rice, coarse, pulses, and total foodgrains.
| Foodgrains | Forecasting Models | MAPE | MSE |
|---|---|---|---|
| Wheat | ARIMA (1,1,0) with drift | 3.71 | 339.78 |
| SutteARIMA | 2.91 | 294.93 | |
| Holt-Winters | 5.14 | 520.84 | |
| NNAR (1,1) | 6.74 | 912.86 | |
| Rice | ARIMA (0,1,1) with drift | 3.23 | 260.77 |
| SutteARIMA | 2.20 | 106.32 | |
| Holt-Winters | 2.69 | 180.96 | |
| NNAR (1,1) | 12.49 | 3566.22 | |
| Coarse | ARIMA (0,1,1) with drift | 7.68 | 201.08 |
| SutteARIMA | 6.93 | 153.24 | |
| Holt-Winters | 4.36 | 85.20 | |
| NNAR (2,2) | 12.67 | 586.46 | |
| Pulses | ARIMA (0,1,1) with drift | 16.06 | 272.83 |
| SutteARIMA | 10.78 | 133.09 | |
| Holt-Winters | 15.83 | 260.16 | |
| NNAR (2,2) | 16.45 | 278.95 | |
| Total Foodgrains | ARIMA (0,1,1) with drift | 4.83 | 3082.16 |
| SutteARIMA | 3.29 | 1652.90 | |
| Holt-Winters | 3.98 | 1857.13 | |
| NNAR (2,2) | 9.09 | 14,800.21 |
Table 7.
The SutteARIMA forecast for foodgrains (in lakh tonnes) from 2021 to 2025 in India.
| Year | Wheat | Rice | Coarse | Pulses | Total Food Grain | ||||||||||
|---|---|---|---|---|---|---|---|---|---|---|---|---|---|---|---|
| F * | U | L | F * | U | L | F * | U | L | F * | U | L | F * | U | L | |
| 2021 | 1072.74 | 979.80 | 1165.69 | 1174.26 | 1124.20 | 1174.26 | 446.74 | 411.37 | 482.10 | 229.08 | 180.67 | 277.50 | 2894.25 | 2698.61 | 3089.90 |
| 2022 | 1089.59 | 973.35 | 1205.83 | 1188.76 | 1118.00 | 1188.76 | 451.67 | 416.30 | 487.03 | 236.803 | 186.89 | 286.72 | 2938.14 | 2674.80 | 3201.48 |
| 2023 | 1106.44 | 970.81 | 1242.08 | 1203.27 | 1116.58 | 1203.27 | 456.60 | 421.23 | 491.96 | 244.521 | 193.14 | 295.91 | 2982.03 | 2665.03 | 3299.03 |
| 2024 | 1123.29 | 970.66 | 1275.92 | 1217.77 | 1117.64 | 1217.77 | 461.53 | 426.16 | 496.89 | 252.239 | 199.41 | 305.07 | 3025.91 | 2663.01 | 3388.83 |
| 2025 | 1140.14 | 972.19 | 1308.09 | 1232.27 | 1120.28 | 1232.27 | 466.46 | 431.09 | 501.82 | 259.95 | 205.72 | 314.20 | 3069.80 | 2666.10 | 3473.52 |
* F-Forecasted Value, L-Lower value at 99%, U-Upper Value at 99%.
Disclaimer/Publisher’s Note: The statements, opinions and data contained in all publications are solely those of the individual author(s) and contributor(s) and not of MDPI and/or the editor(s). MDPI and/or the editor(s) disclaim responsibility for any injury to people or property resulting from any ideas, methods, instructions or products referred to in the content. |
© 2023 by the authors. Licensee MDPI, Basel, Switzerland. This article is an open access article distributed under the terms and conditions of the Creative Commons Attribution (CC BY) license (https://creativecommons.org/licenses/by/4.0/).
Share and Cite
MDPI and ACS Style
Ahmar, A.S.; Singh, P.K.; Ruliana, R.; Pandey, A.K.; Gupta, S. Comparison of ARIMA, SutteARIMA, and Holt-Winters, and NNAR Models to Predict Food Grain in India. Forecasting 2023, 5, 138-152. https://doi.org/10.3390/forecast5010006
AMA Style
Ahmar AS, Singh PK, Ruliana R, Pandey AK, Gupta S. Comparison of ARIMA, SutteARIMA, and Holt-Winters, and NNAR Models to Predict Food Grain in India. Forecasting. 2023; 5(1):138-152. https://doi.org/10.3390/forecast5010006
Chicago/Turabian StyleAhmar, Ansari Saleh, Pawan Kumar Singh, R. Ruliana, Alok Kumar Pandey, and Stuti Gupta. 2023. "Comparison of ARIMA, SutteARIMA, and Holt-Winters, and NNAR Models to Predict Food Grain in India" Forecasting 5, no. 1: 138-152. https://doi.org/10.3390/forecast5010006