Article

Diabot: Development of a Diabetic Foot Pressure Tracking Device

1
Centre for Biomedical Engineering, Indian Institute of Technology (IIT), Delhi 110016, India
2
Sperandus Healthcare Private Limited, New Delhi 110019, India
3
Mechanical Engineering Department, Sardar Beant Singh State University, Gurdaspur 143521, India
4
Department of Biomedical Engineering, All India Institute of Medical Science (AIIMS), Delhi 110029, India
*
Author to whom correspondence should be addressed.
J 2023, 6(1), 32-47; https://doi.org/10.3390/j6010003
Submission received: 9 October 2022 / Revised: 30 December 2022 / Accepted: 31 December 2022 / Published: 5 January 2023
(This article belongs to the Section Biology & Life Sciences)

Abstract

:
Foot-related problems are prevalent across the globe, and this issue is aggravated by the presence of diabetes mellitus. Diabetic-foot-related issues include extreme foot pain, plantar corns, and diabetic foot ulcers. To assess these conditions, accurate characterization of plantar pressure is required. In this work, an in-shoe, low-cost, and multi-material pressure measuring insole, based on a piezoresistive material, was developed. The device has a high number of sensors, and was tested on 25 healthy volunteers and 25 patients with different degrees of diabetes. The working range of the device was observed to be 5 kPa to 900 kPa, with an average hysteresis error of 3.25%. Plantar pressure was found to increase from healthy to diabetic volunteers, in terms of both standing and walking. In the case of the diabetic group, the-high pressure contact area was found to strongly and positively correlate (R2 = 0.78) with the peak plantar pressure. During the heel strike phase, the diabetic volunteers showed high plantar pressure on the medial heel region. In regard to the toe-off phase, the central forefoot was found to be a prevalent site for high plantar pressure across the diabetic volunteers. The developed device is expected not only to assist in the prediction of diabetic ulceration or re-ulceration, but also to provide strategies and suggestions for foot pressure alleviation and pain mitigation.

1. Introduction

Human feet are considered to be the body part with the most essential responsibility for posture, ambulation, and balance [1]. Feet have a complex anatomical structure, comprising 26 bones with several joints (including the metatarsophalangeal, proximal interphalangeal, and distal phalangeal joints), tendons, ligaments, and other soft tissues [2,3,4,5]. Given this complex structure, the foot is a critical factor in human health and lifestyle [6]. Several foot-related problems—such as foot pain, diabetic foot and ulcers, posture-induced back pain, stiffness, and arching—are a major concern for the population across the globe [7,8,9,10,11,12]. Specifically, diabetic foot and ulcers are considered to be the most serious and prevalent complications of diabetes mellitus, which affects over 9.3% of the global population [13,14,15]. Additionally, higher plantar pressures are observed in diabetic patients [16], and can lead to possible ulceration or re-ulceration at new sites [17]. Previous studies [16,18] have suggested that a reduction in plantar pressure can effectively overcome the risk of these problems among the diabetic population. Hence, evaluation of plantar pressure among the healthy (to assess posture) and diabetic populations (to assess ulceration risks) is essential.
In a previous study by Sutkowska et al. [19], the medical records of a large diabetic group were studied, and abnormal plantar pressure was observed to be prevalent. Caselli et al. [20] studied under-foot pressure in a diabetic population, and both forefoot and heel were observed to be regions of high plantar pressure; increasing pressure was reported to correlate with an increase in the degree of neuropathic disorder. In a study, by Ahsan et al. [20], 20 diabetic and 20 healthy participants were recruited, and their height, body composition, blood glucose, and plantar pressure were recorded. The average static plantar pressure among the diabetic participants was found to be higher than among the healthy volunteers. In a study, by Cock et al. [21], a force-measuring platform was implemented, to measure plantar pressure and center of pressure. The study reported significant variations among the volunteers, across different gait phases. The literature has reported similar variations in plantar pressure as a result of including complex devices, such as the force-measuring platform; moreover, these devices are expensive, with limited availability in low- or middle-income countries that have high prevalence of such foot problems (e.g., India is deemed to be the world’s capital for diabetes) [22]. In comparison to platform systems, sensor-based insoles are more appealing, because patients can use them outside the clinic, to record data continuously [23,24]. In contrast to platform systems, a few studies have tested shoe-based pressure measuring devices during walking or running [25,26,27]: most of these devices included multiple sensing points, in addition to a wireless data transfer protocol. To ensure the flexibility of the sensors, either force sensitive resistors or piezoresistive materials were generally used [28,29,30,31]. Due to the integration of the sensors inside the insoles, variability in the materials of the insole and sensors often led to poor wearability and discomfort [32]. Hence, owing to the challenges associated with existing plantar pressure measuring devices, an improved and low-cost in-shoe lifestyle device would be indispensable for improved early diagnosis of foot-related problems.
In this work, a low-cost, in-shoe smart pressure insole with high-resolution sensing points was designed and developed. The developed device was tested on 25 healthy volunteers, and on 25 patients with different degrees of diabetes. The volunteers’ plantar pressure values were recorded and compared during standing and different phases of walking. It is anticipated that the results of this novel work will help guide medical practitioners, patients, and the general public, in the early evaluation of several foot-related problems, such as foot pain, ulceration, re-ulceration, posture, and imbalances.

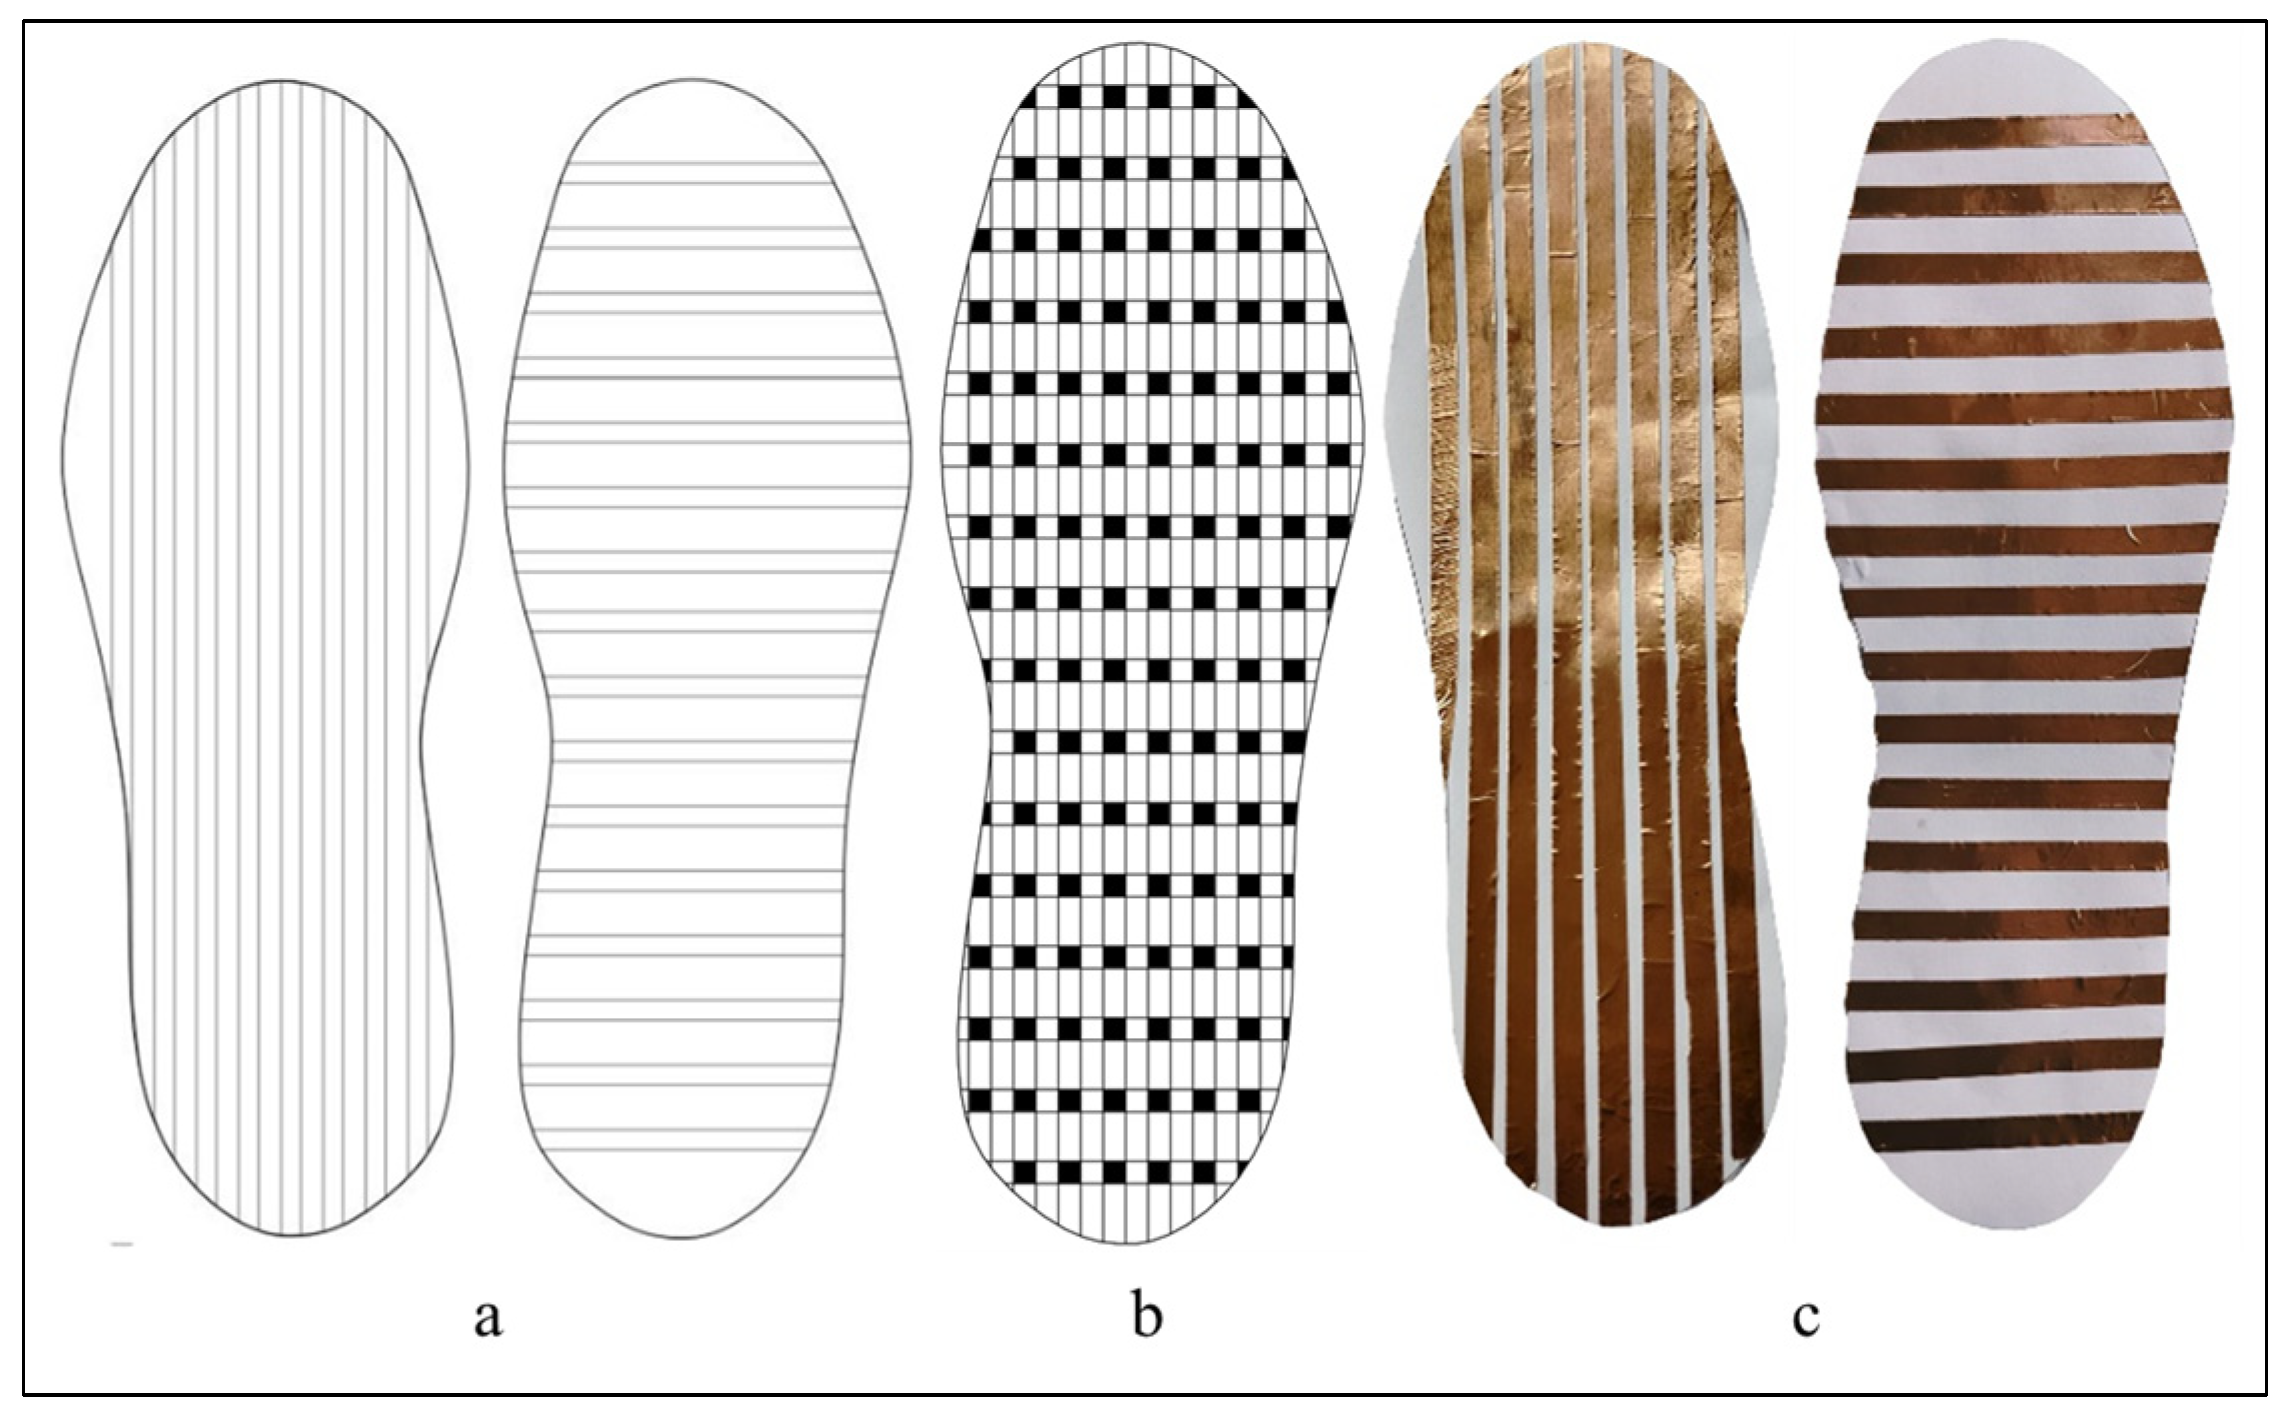
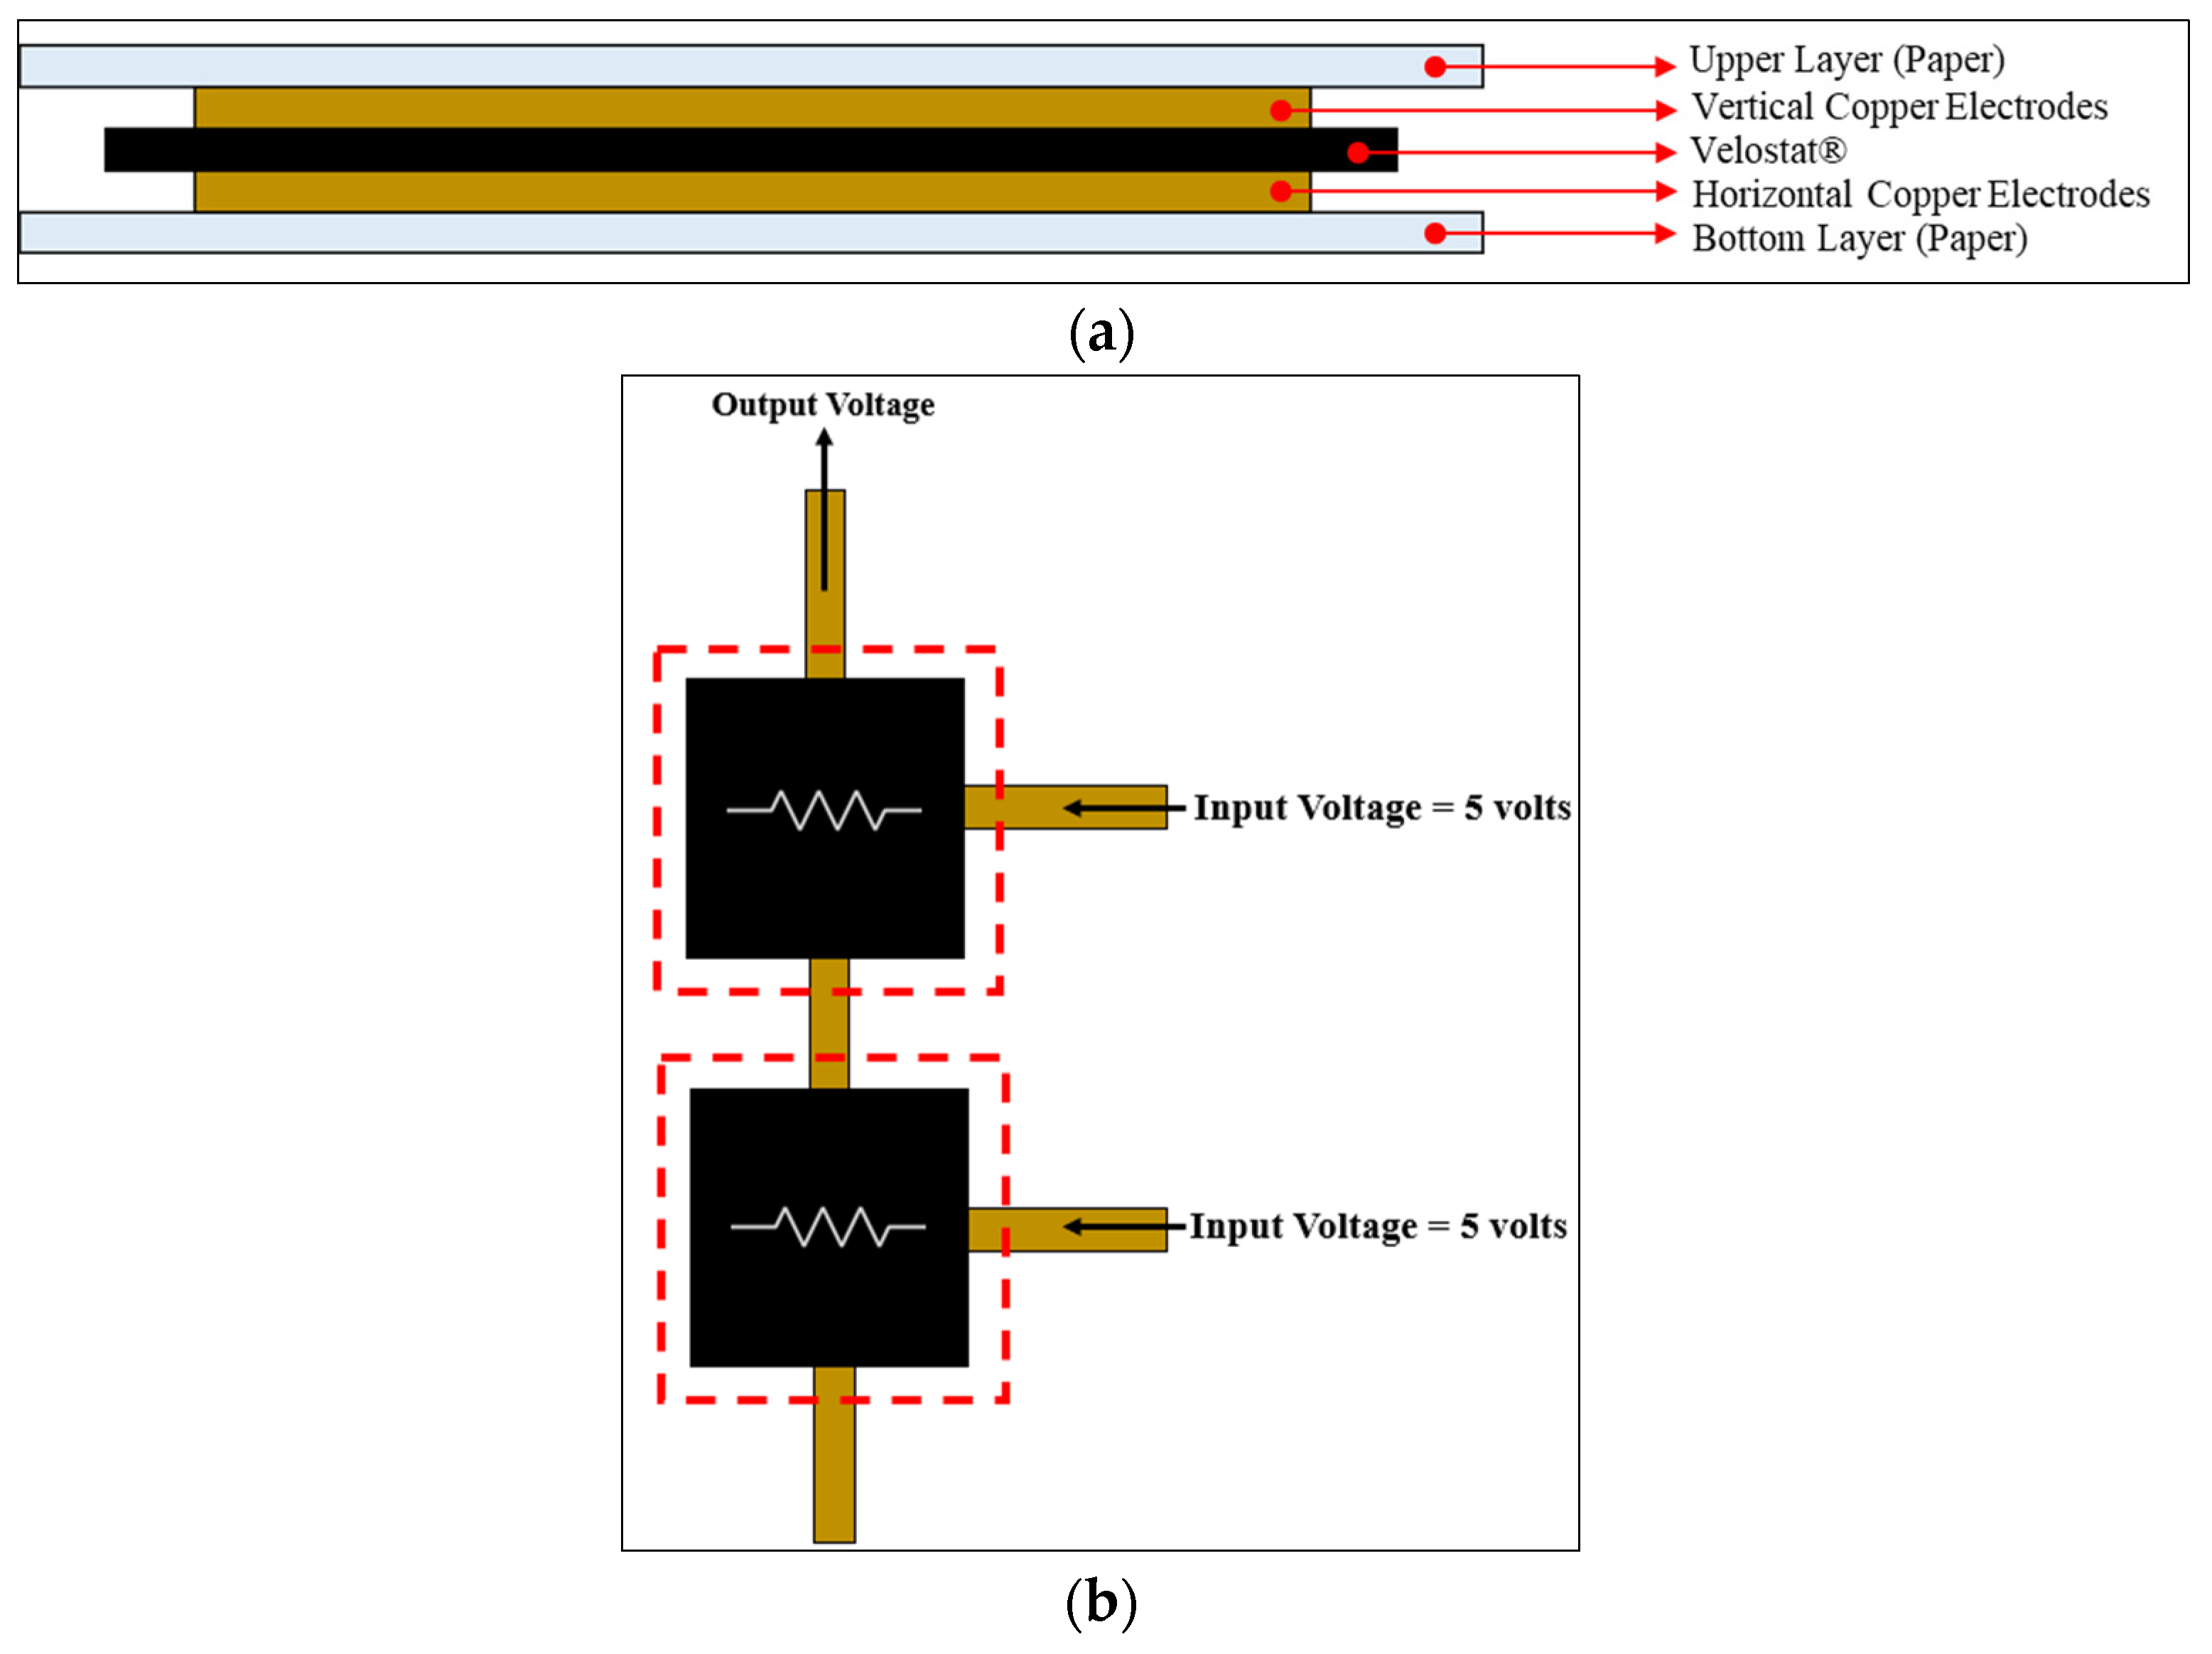
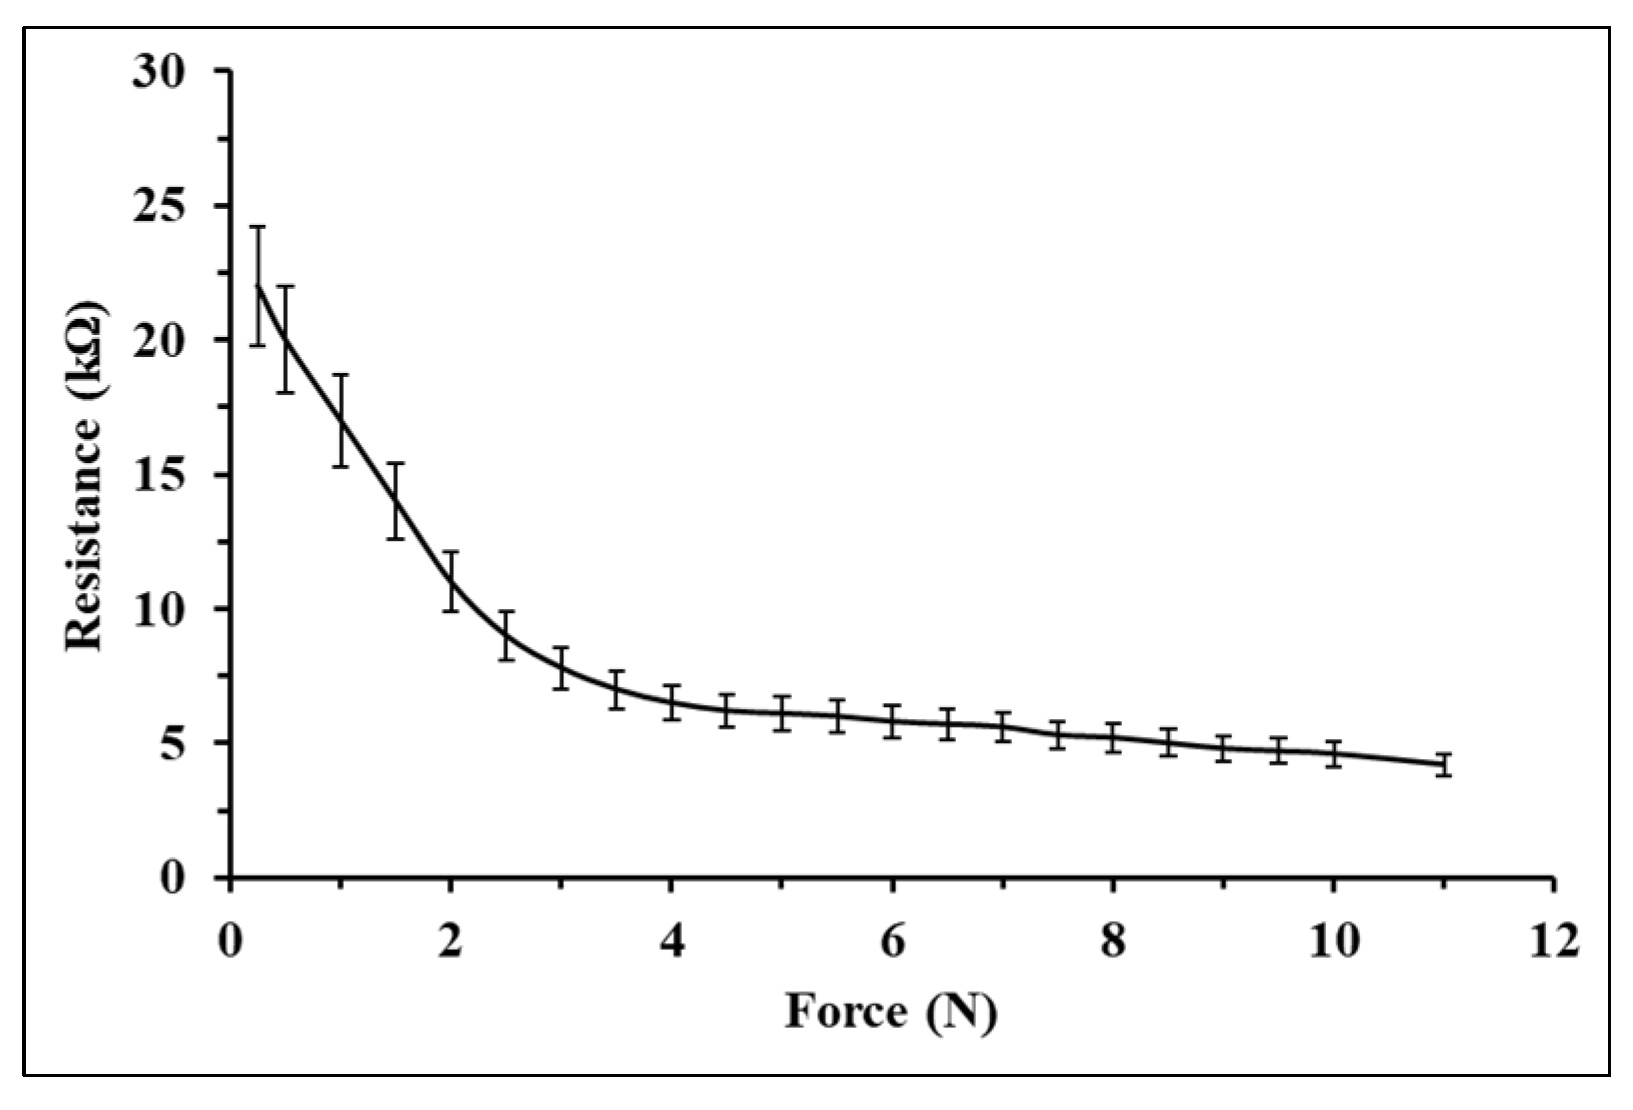
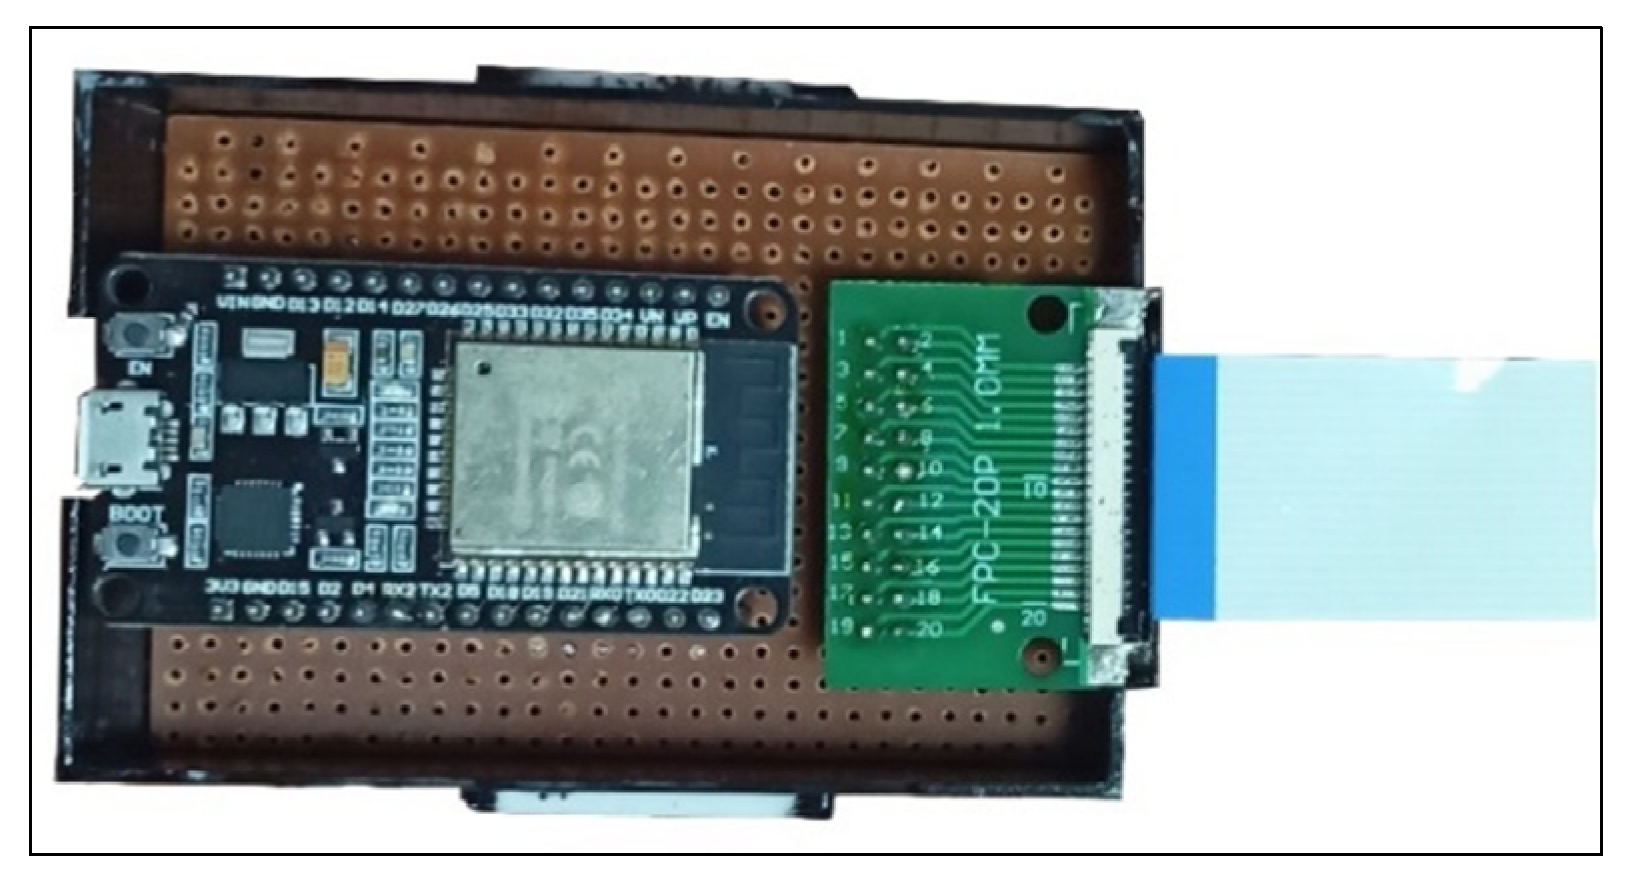
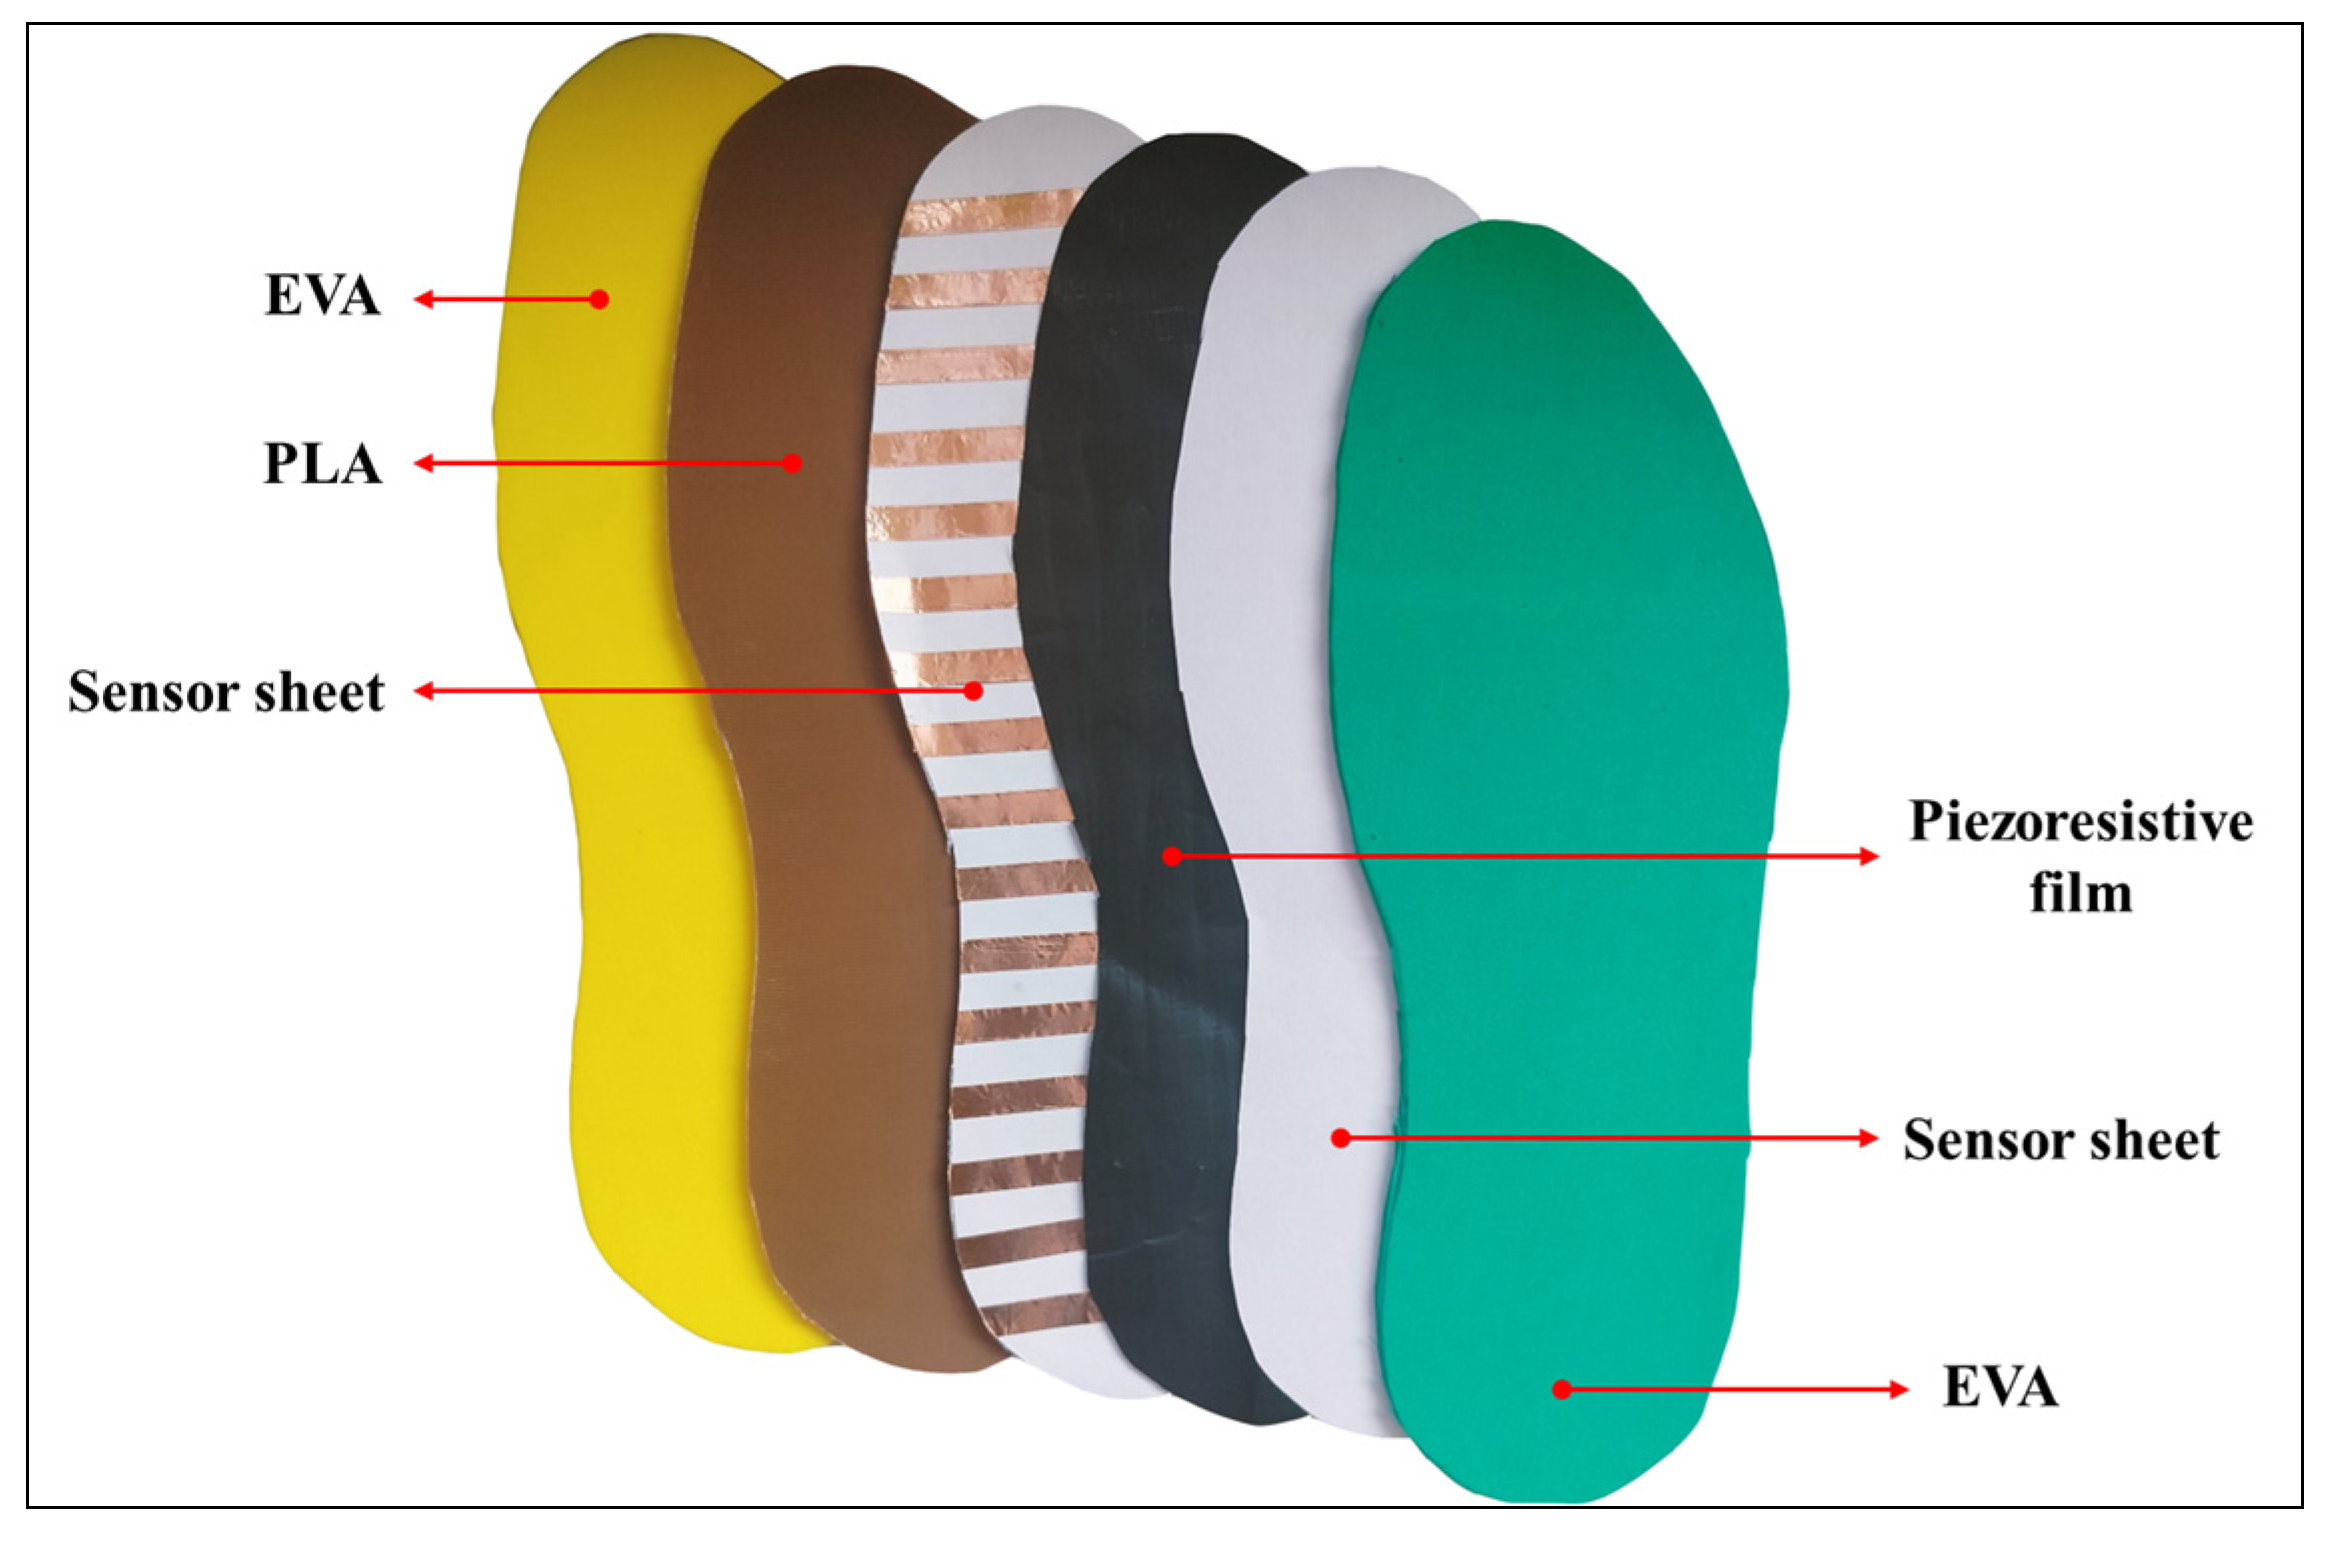
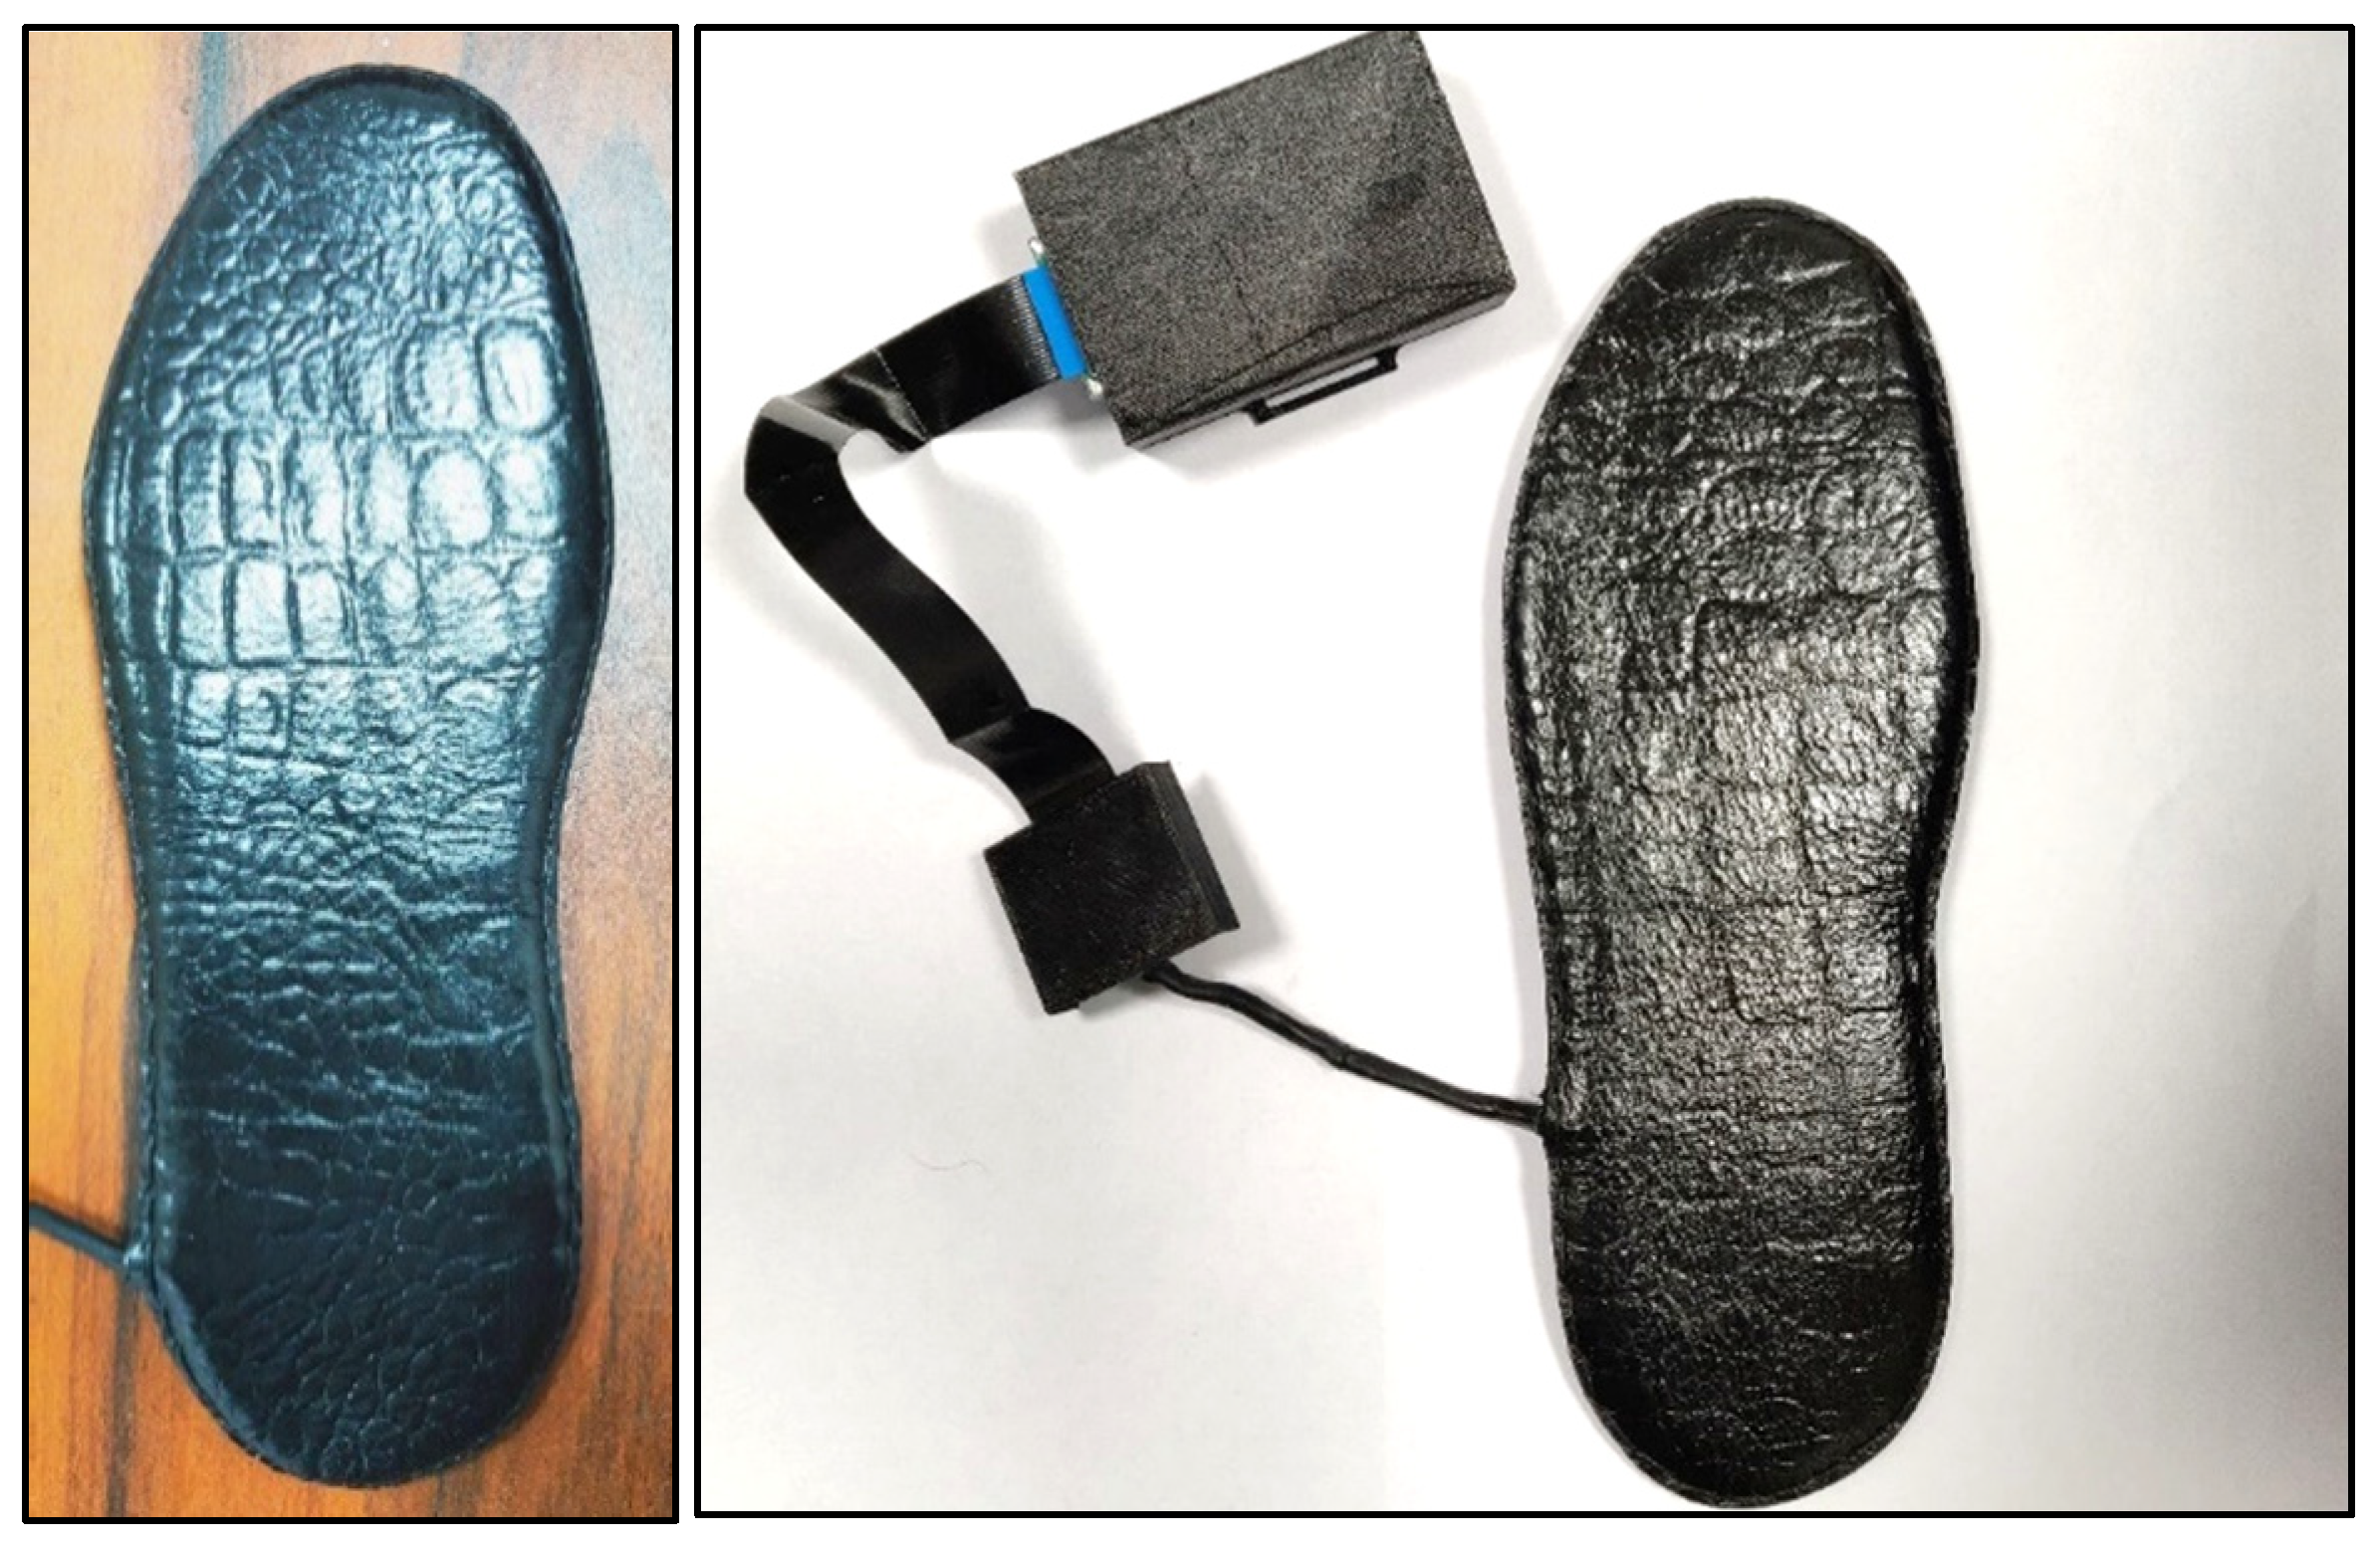
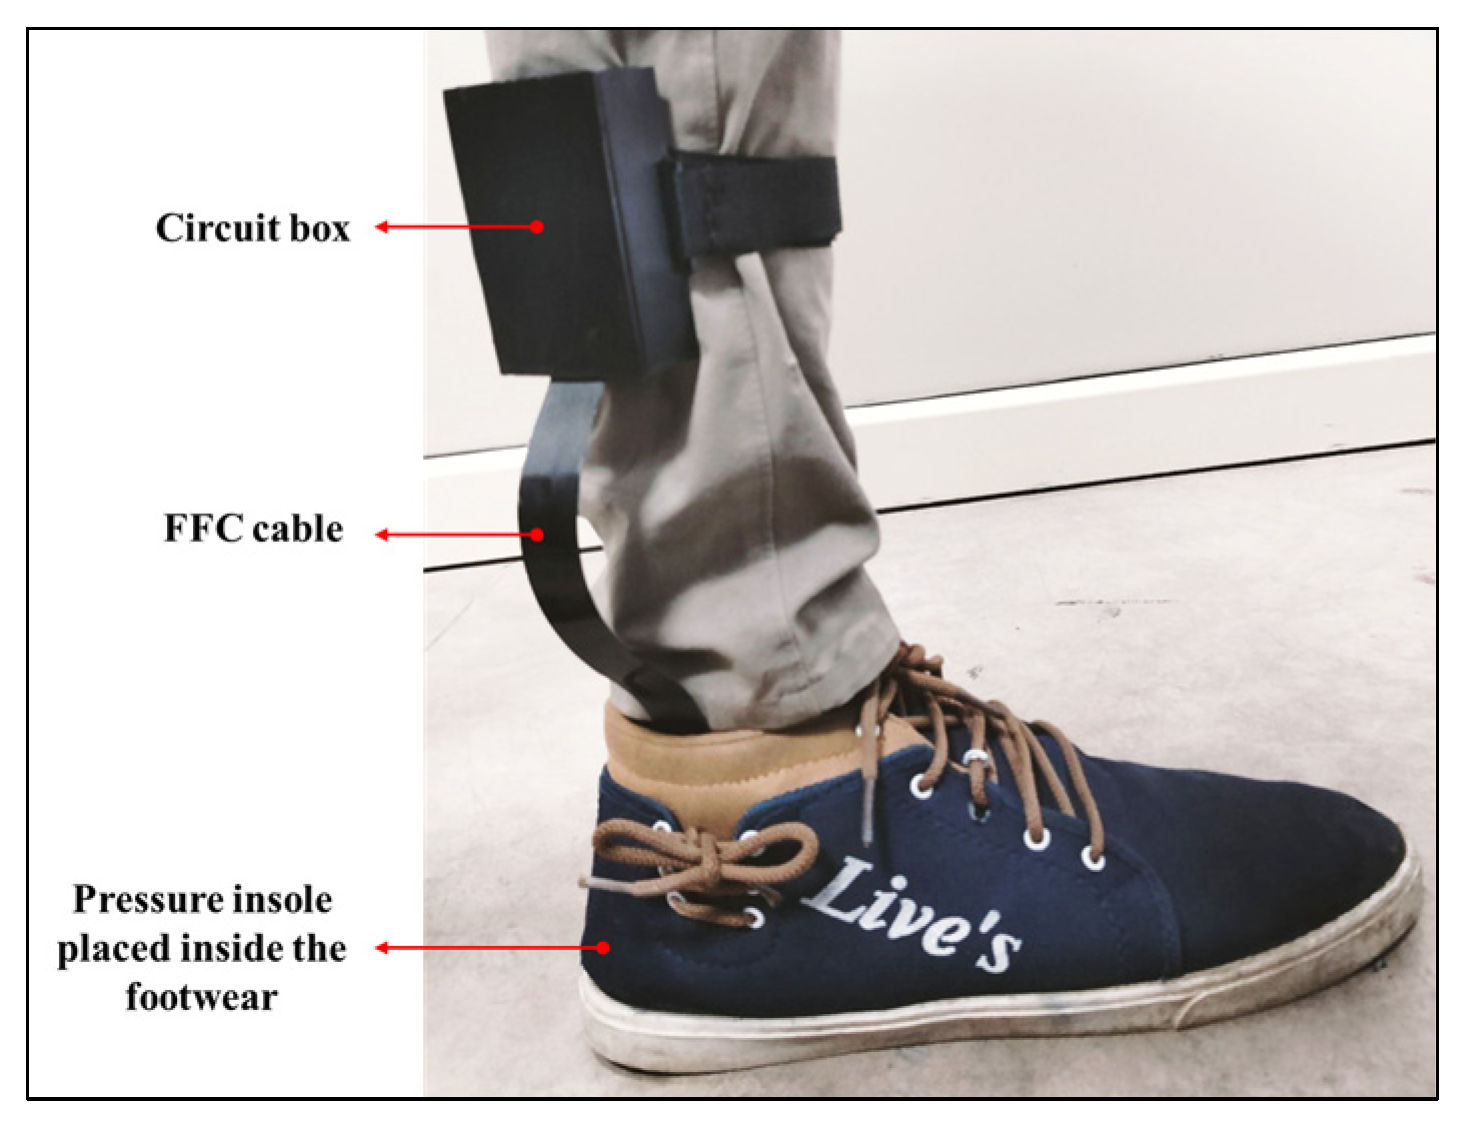
2. Materials and Methods

The outline design of the insole was developed using the 3D modeling CAD software SolidWorks 2020 (Dassault Systèmes, Vélizy-Villacoublay, France). The current work considered an insole of size UK-10. To generate the outer boundary of the insole, 50 points were marked on the curved geometry by using the Mondopoint system (ISO 9407:2019 standard [33]). In order to ensure flexibility, the generated curve was extruded by 0.4 mm. The insole designs were then manufactured using a 3D printer (Creality, Shenzhen, China) and PLA (polylactic acid) (Shenzhen eSUN Industrial Co., Shenzhen, China) thermoplastic, and were evaluated for their flexibility, to allow smooth walking and running. The flexibility of the 3D printed insole was evaluated by bending it across the horizontal and vertical axes passing through the center. The observed bending angle was higher than 40 degrees. In a previous study by Hunt et al. [34], plantar (i.e., under-foot skin) angles were measured during walking, across 19 volunteers. The study reported maximum plantar deformation angles of 12.5 degrees, which was within the bending range of the 3D printed insole. Figure 1a represents the insole outline sketch, containing 50 points. Figure 1b represents the extruded insole model. Figure 1c represents the 3D printed flexible insole, for providing rigidity to the sensors while standing or walking.
After the development of the 3D printed insole, a custom-fabricated flexible piezoresistive sensor array was developed. The development of the sensing nodes consisted of thin conductive adhesive (i.e., made of copper), and a piezoresistive film known as Velostat®, which is a polyethylene–carbon-black-infused composite material. The Velostat® is a force-sensitive material, having a non-linear resistance response. A previous study [35] showed its possible usefulness where flexibility of the device is important. The conductive copper adhesive used in this study had a thickness of 5 mm. The copper adhesive was tested by the manufacturer for several parameters. The backing thickness of the copper adhesive tape was found to be 0.04 mm, which was tested using ASTM D 1000 standard (under non-elastomeric materials), which states the standard test methods for pressure-sensitive, adhesive-coated tapes used for electrical and electronic applications [36]. The breaking strength was measured using the same standard, in which the copper tape was attached to the ends of two pulleys, and stretched up to its fracture. This test was similar to the mechanical tension test, which is used to measure tensile strength across different materials. Finally, the electrical resistance through the adhesive was measured by using Kelvin bridge, which is popularly used to measure unknown resistance. The breaking strength of the copper tape was 4.4 N/mm, and the electrical resistance through the adhesive was 0.005 Ω, which was tested using MIL-STD-202 Method 307 [37].
Two insole sketches were printed on regular paper. Eight vertical and sixteen horizontal markings of 5 mm each were prepared on separate sheets (Figure 2a). The considered vertical and horizontal markings, when placed on each other facing the copper tapes, led to the formation of 126 high-resolution intersection points (Figure 2b).
In order to develop 126 junctions as pressure-sensing nodes, the copper tapes were pasted on the vertical and horizontal markings that represented the conductive electrodes of each sensing point. (Figure 2c). To complete the sensing unit, a layer of pressure-sensitive film (Velostat®) was cut into the shape of an insole, and placed between the copper-pasted insole sheets. Hence, the completion of the circuit included powering up the sixteen horizontal copper connections, and reading the changes in the vertical copper connection present at the sensing node, as based on the schematic in Figure 3.
To obtain the data from the developed sensors, a voltage divider circuit with one variable quantity (i.e., the sensor’s resistance) was used, in addition to the reference resistors. Hence, the sensor’s resistance was calculated using Equation (1), where Voutput is the output voltage, Rs is the resistance of the sensor, Rf is the reference resistance (equal to 10 kΩ), and Vinput is the input voltage (5.0 volts). The output voltage Voutput was used to calculate the Rs of the insole accordingly.
R s = V o u t p u t   ·   R f V i n p u t V o u t p u t
The single node was further tested for the output resistance response (Figure 4), and showed a nonlinear response with respect to the force applied.
To capture the pressure on the 126 sensing nodes, a 12-bit microcontroller unit ESP-32 (Expressif, Shanghai, China) was used. A customized circuit board was developed, to which the digital output pins were soldered, in order to connect it with sixteen horizontal copper electrodes, while the analog input pins were connected to the eight vertical copper electrodes by a flat flexible cable (FFC) through an FFC connector. Furthermore, each analog input channel was connected to an IN4007 1W diode, in order to reduce the reverse noises in the readings. The overall capturing of the data included first powering the digital pins individually, and simultaneously reading their respective analog channels: this method ensured the sensing independence of each sensing node from its neighbor (i.e., the concatenation of values from two sensors was avoided).
Furthermore, as the resistance vs. force plot of the insole displayed non-linear behavior, the response was curve-fitted (R2 =0.99), using a 3-degree polynomial equation (Equation (2)), and was used to code the resistance response with respect to the force applied. In Equation (2), R represents the resistance, while F represents the force applied. The ESP-32 was run in the hotspot mode, and the values were sent through a 2.4 GHz Wi-Fi. The recorded values were manually plotted as contours for visualization. Figure 5 represents the customized circuit board inside a 3D printed circuit box, and the output FFC cables, which were connected to the developed smart insole.
R = 0.0522 F 3 + 1.1319 F 2 7.9672 F + 23.544
As the insole consisted of an array of flexible sensors placed on sheets of paper, several layers of different materials were used, to provide durability, comfort, and an esthetic look, so that the insole could be placed inside footwear, and bear high body loads. In addition to the sensor sheets and the piezoresistive film, a layer of 3D printed insole was pasted at the bottom of the sensing sheet assembly. A medium-density Ethylene–vinyl acetate (Md-EVA) (Swastik Polymers, New Delhi, India), of 0.5 mm thickness, was also used. In a recent study by Tang et al. [38], EVA was used as an insole material to evenly distribute plantar pressure across the diabetic population, for added comfort. In another study by Viswanathan et al. [39], different insole materials were tested for their effective distribution of foot pressure: compared to other materials, EVA was found, across the volunteers, to provide added comfort more conveniently. Based on these studies, two layers of EVA were cut to match the shape of the insole, and were pasted beneath the 3D printed layer and the layer above the sensing sheet assembly (Figure 6). In addition, the insole was covered and stitched with a high-quality leather material across its boundaries. Due to the variability across the added materials, the insole was able to provide increased/decreased pressure values; hence, the insole was calibrated using standard weights, and a safety factor of 1.30 to 1.62 was applied to the output data. Finally, the insole was soldered with an FFC connector, and was attached to the circuit box to complete the overall assembly (Figure 7). Figure 8 shows a volunteer wearing the developed pressure measurement device setup.
The developed high-resolution smart insole was tested on a 25-person healthy control group (HC), and 25 diabetic (D) volunteers. The study was approved by the Ethical Committee of the Indian Institute of Technology Delhi (IIT-Delhi). The volunteers provided a signed consent form before the study was conducted. Initially, this work was conducted as a pilot study; hence, the power of the study was not calculated. Recent research by Tramonti et al. [40] considered 25 healthy and 25 diabetic volunteers, studying gait and reported synergistic effect on locomotion. In another study, by Hussein et al. [41], 68 diabetic volunteers, divided into 4 sub-groups of unequal distribution, and 25 healthy persons, were considered for the study, to assess the insulin resistance of volunteers with type 2 diabetes mellitus. In line with such studies, the inclusion criteria of the patients in this work included age between 18 and 60 years, pain rating scores between 3 and 8, both males and females, and diabetic history of more than one year. For the pain index, the volunteers were asked to rate from 0 to 10, where 0 meant no pain, and 10 meant the most unbearable pain. This measuring technique had been used in a previous study by Puls et al. [42]. The following were the criteria for exclusion from participation: any lower extremity injury; history of hip, knee or ankle contractures; presence of sores in the plantar region; pregnancy; cognitive or psychological disorders; malignancy; neuropathy; or having a pacemaker. Table 1 represents the demographic data of the volunteers.
It was observed that 40% (i.e., 10 volunteers) of the D group had corns and calluses on the plantar region of the foot, and that they also reported an average plantar pain rating of 6 out of 10 on the numeric pain scale: based on this, another group—DC, for diabetic with corns—was assigned throughout this research. The DC was a sub-group, and was derived from the D group. During the assessment of plantar pressure, it was observed that the diabetic volunteers who had corns (i.e., the DC sub-group) represented significant variations in pressure values, compared to the diabetic volunteers who had no corns (i.e., the D group). To validate the developed device across the HC, D, and DC groups, plantar pressure in standing and walking conditions was recorded. For uniformity in the quantification of plantar pressure across the volunteers, the same type of shoe was used, with only the sizes varying, depending on the foot size of the volunteer. The plantar pressure data for each participant, at a sampling rate of 40 Hz, and the maximum resolution of the values measured from the sensors, was maintained at two decimal points. Each volunteer was asked to stand for 10 s, in order for the plantar pressure in standing condition to be recorded, and to walk for 3 min, to capture foot pressure in walking condition. The 10 s metric was considered in line with a recent study by Wang et al. [43], which specifically measured plantar pressure in stroke patients. In the study by Wang et al. [43], the plantar pressure measurement of the volunteers, in static standing condition, was recorded for 10 s: for the plantar pressure measurements, our work considered a similar metric (i.e., standing time of 10 s). The 3 min walking metric was in line with the studies by Nemoto et al. [44] and Baccelli et al. [45], both of which recorded a walking time period of 3 min for the experiments. The correlations between plantar pressures and foot area that showed high plantar pressure (i.e., within 10% below the peak plantar pressure) were considered insignificant in cases of R2 < 0.5, moderate in cases of 0.5 < R2 < 0.75, and significant in cases of R2 > 0.75.

3. Results

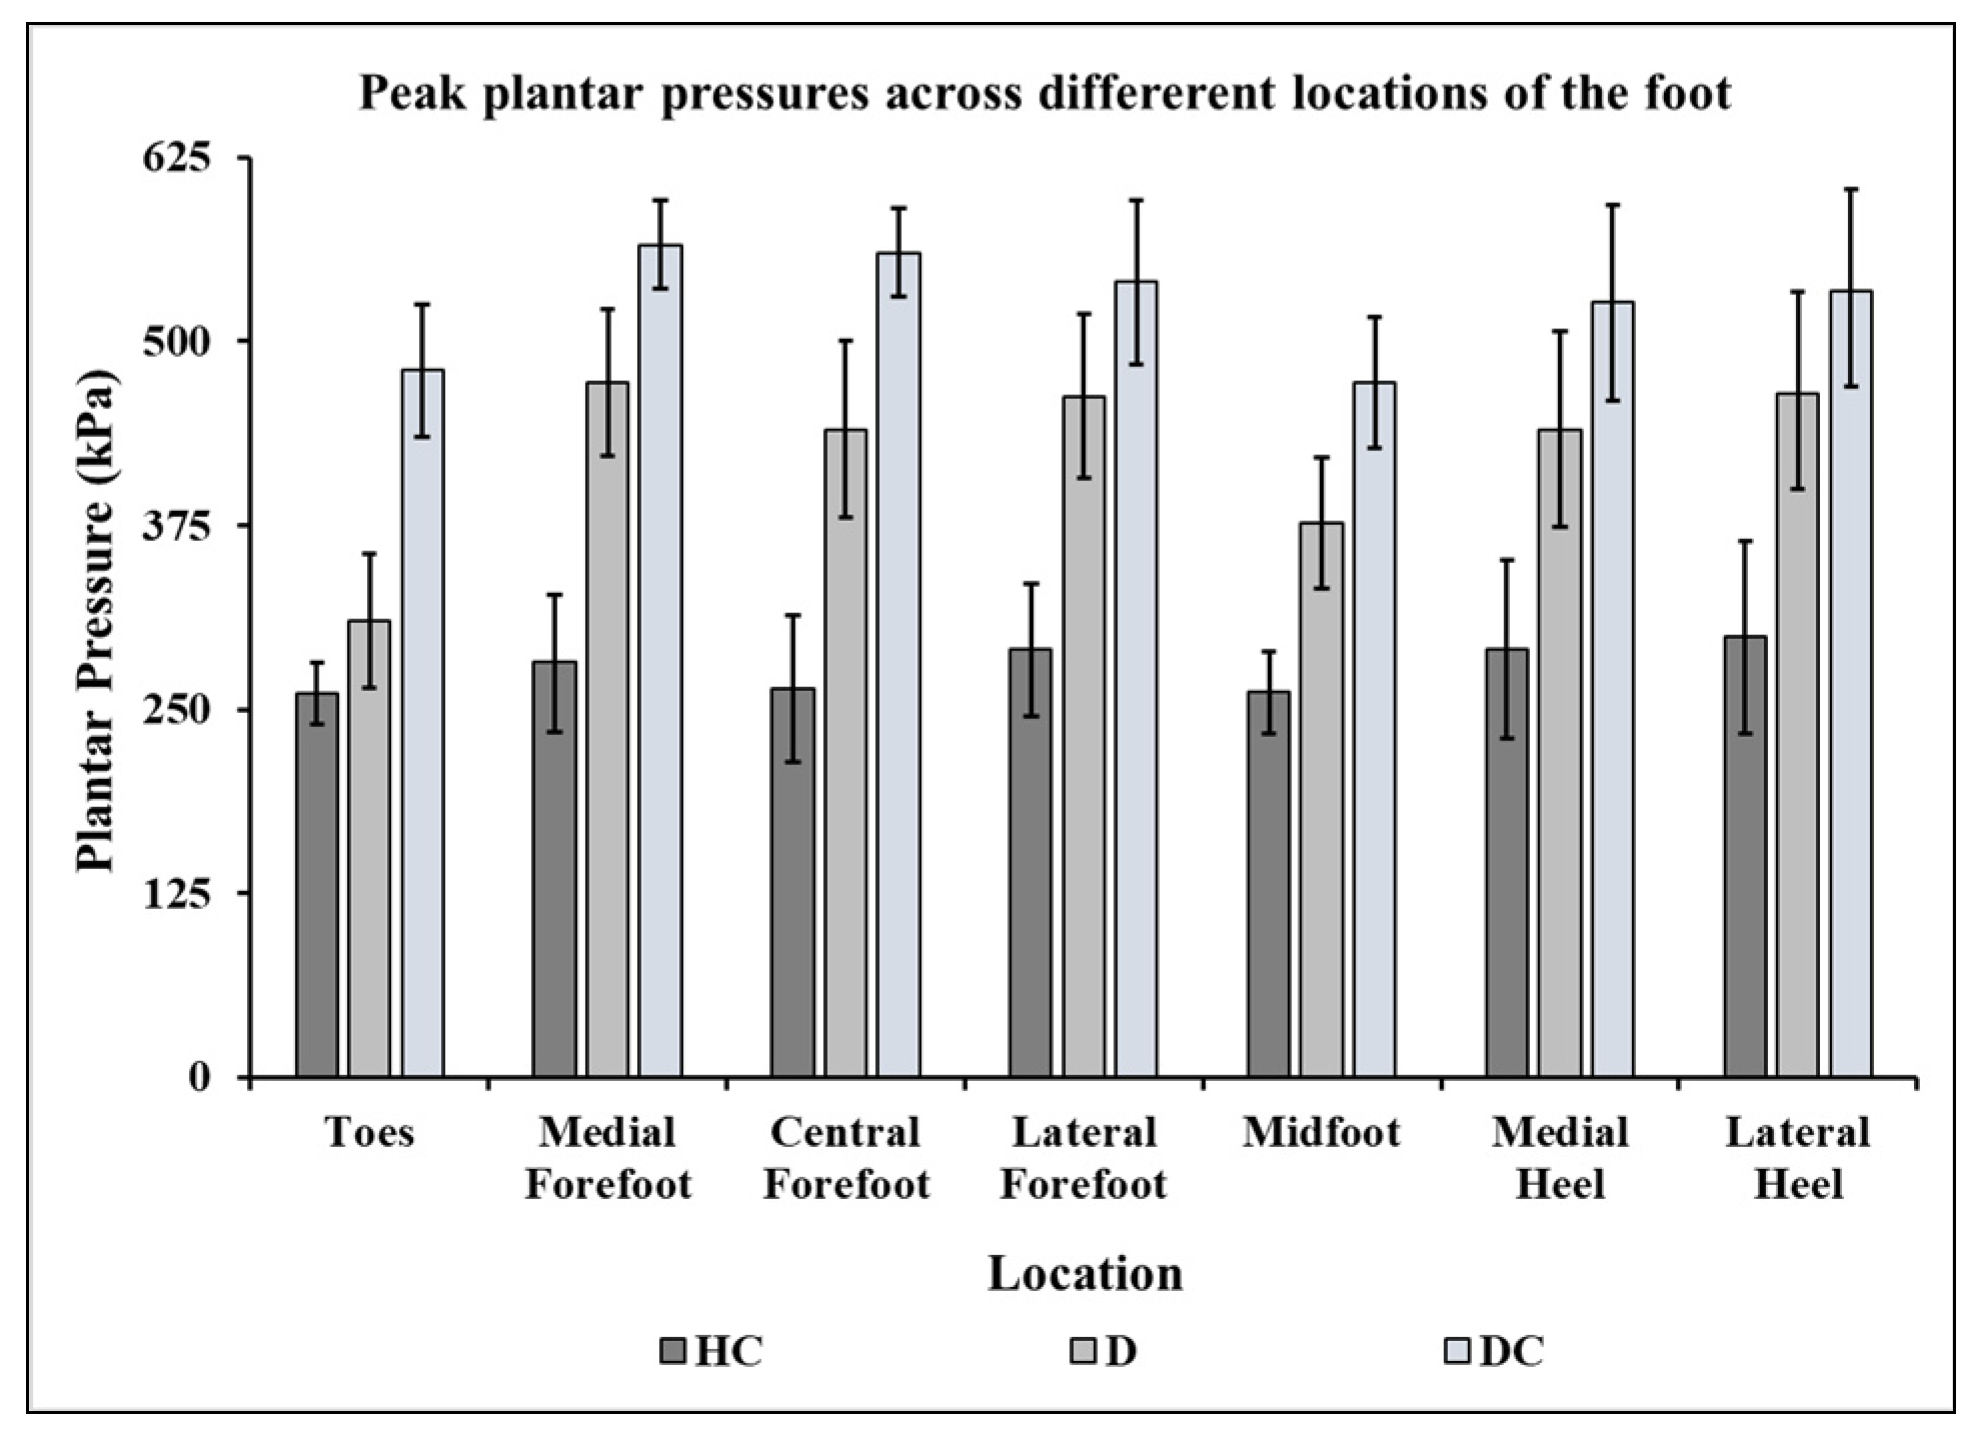
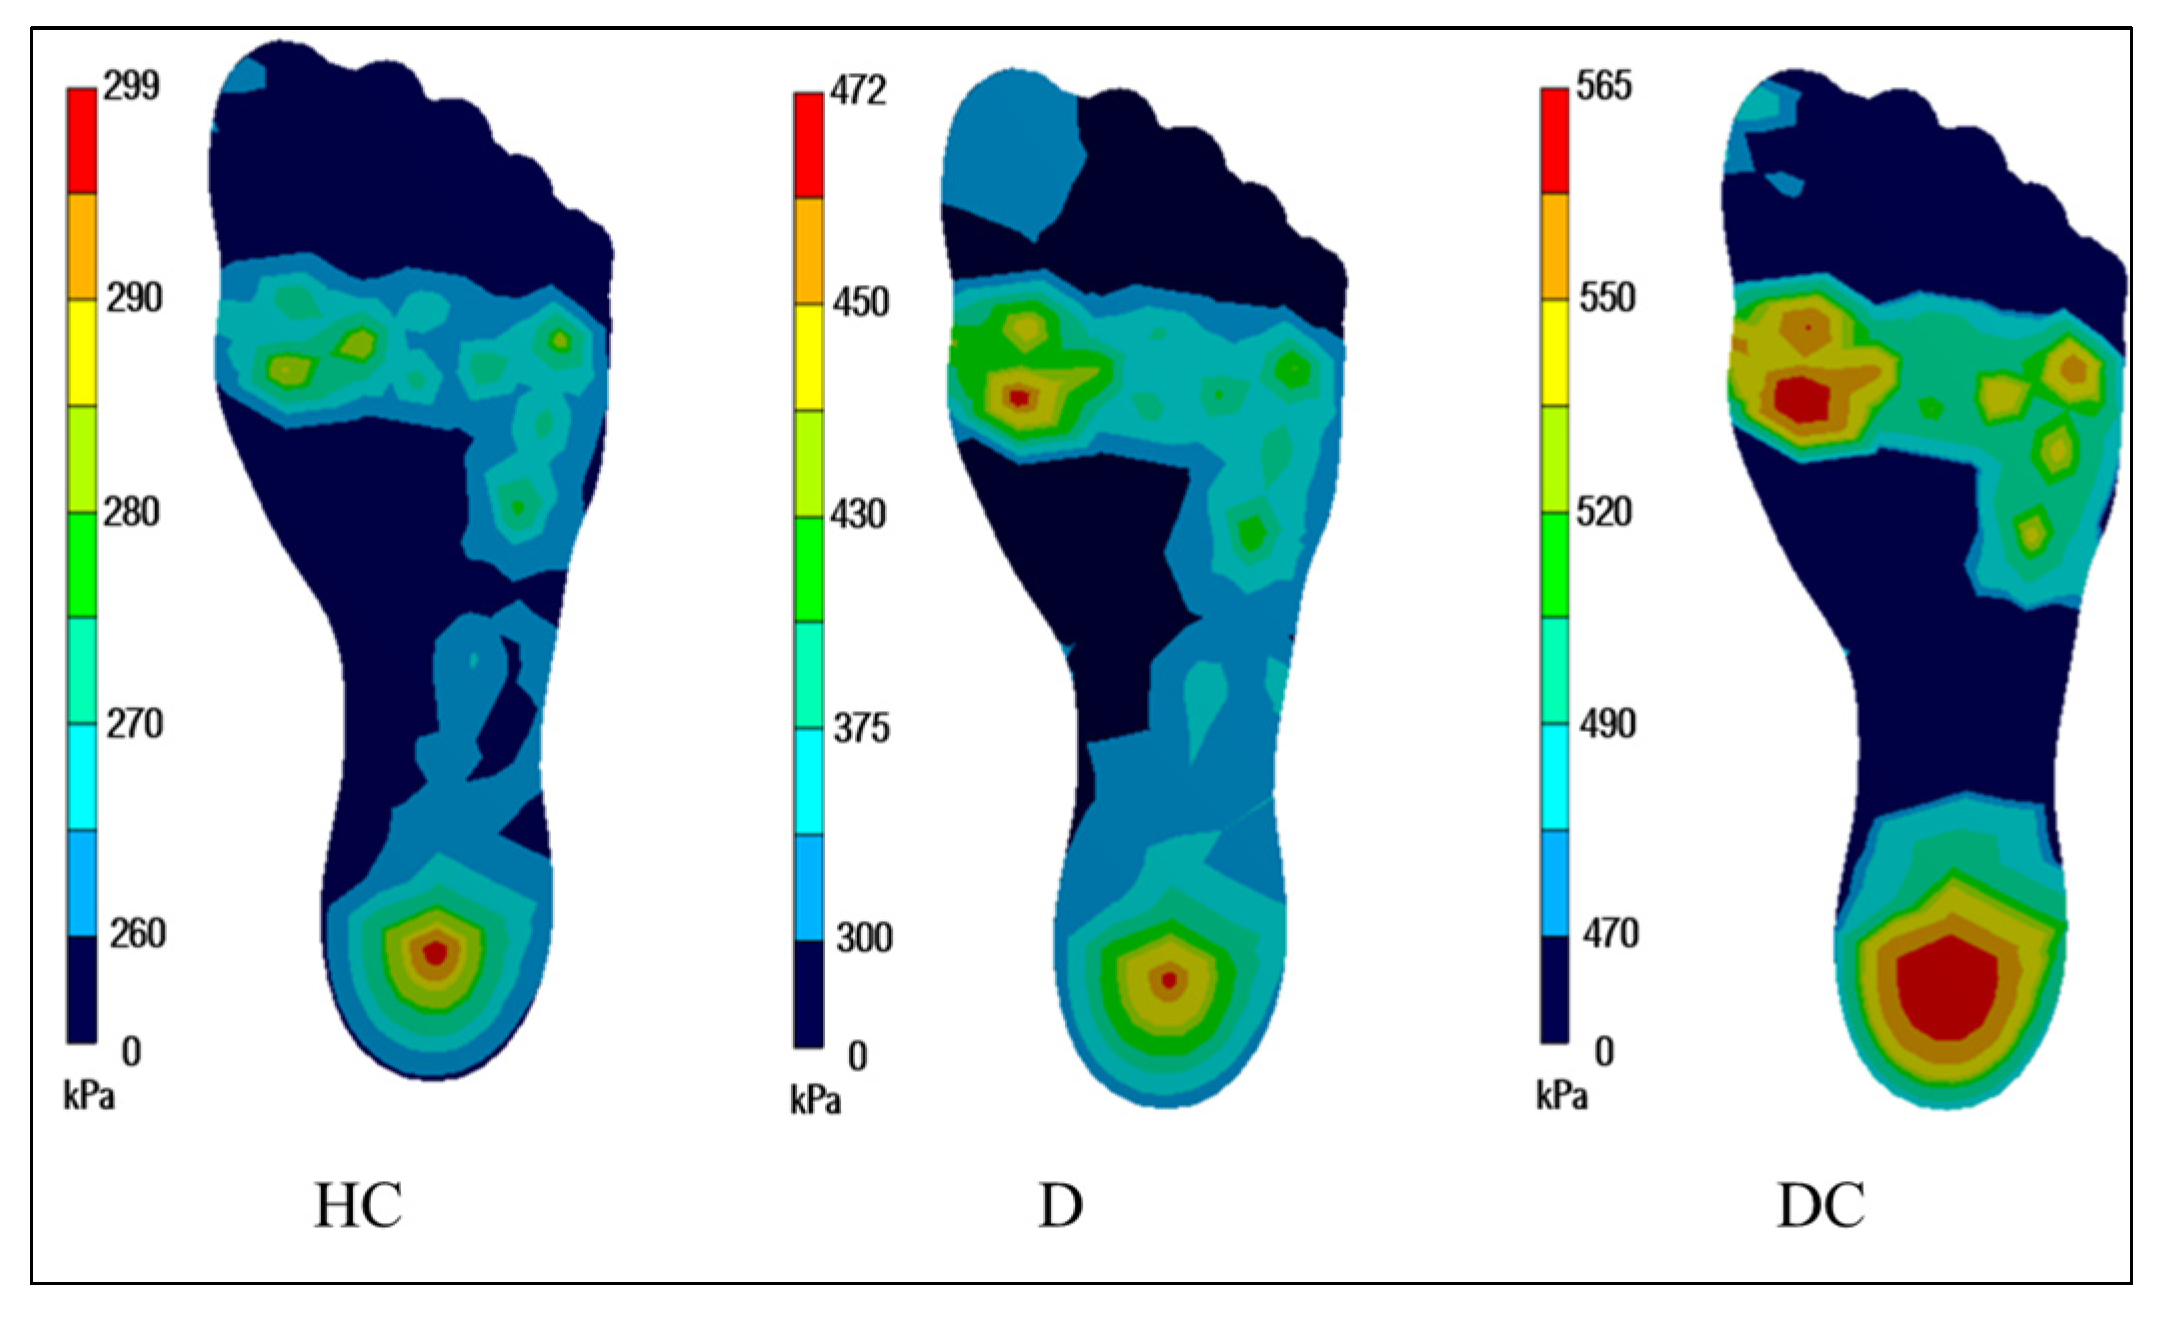
3.1. Plantar Pressure Distribution during Standing

The plantar pressure amongst all the groups varied widely. Figure 9 represents the peak plantar pressure values in kPa across all the volunteers, while Figure 10 represents the contours of the pressure distribution across the plantar region. In the case of the HC group, the peak pressure values ranged from 260.46 kPa to 298.97 kPa. The lowest pressure was observed to be on the toes, whereas the highest pressure was observed to be on the lateral heel. As compared to the peak plantar pressure on the toes, pressure on the medial forefoot was observed to increase by approximately 8%. Pressure on the medial forefoot was evenly distributed, and showed less-to-no pressure concentration. Considering the toes as the baseline pressure value, the central forefoot displayed an overall increase in plantar pressure value of 1.5%. In this case, a few areas were observed to have increased pressure concentration, compared to the medial forefoot. In the case of the lateral forefoot, an increase of approximately 11.5% was observed, compared to the toes: similar to the medial forefoot, no pressure-concentrated locations were observed in this region. With regard to the posterior region of the foot, the midfoot region showed similar peak plantar pressure (i.e., 261.40 kPa) in respect of the toes. In addition to this, plantar pressure across the midfoot region was observed to be evenly distributed. Compared to the toes, plantar regions covering the medial heel and the lateral heel showed the highest increase in pressure values, of approximately 11.5% and 15%, respectively.
In the case of the D group, the peak plantar pressure values ranged from 310.25 kPa to 471.85 kPa. The lowest pressure was observed at the toes, while the highest pressure was observed at the medial forefoot region. Compared to the HC group, the toes region of the D group showed an overall increase of approximately 19%. In addition, increased pressure was observed at much larger areas, compared to previous cases. At the medial forefoot region, plantar pressure in the D group showed the highest increase, of approximately 67%. In addition, localized high pressure points were observed in this region, across the D group. Compared to the HC group, the central forefoot and the lateral forefoot regions across the D group reported overall increases in pressure value, of 66% and 59%, respectively. Furthermore, increased pressure value (44%) was observed around the midfoot region, compared to the HC group. The heel regions—i.e., the medial and lateral—showed increases, in pressure value, of 51% and 55%, respectively.
In the case of the DC group, the peak plantar pressure varied from 472.14 kPa to 565.45 kPa. The lowest pressure was observed at the midfoot, whereas the highest pressure was observed at the medial forefoot. Across the region around the toes, the DC group reported increases of 84% and 54%, respectively, compared to the HC and D groups. After the toe region, an increase in peak plantar pressure (20%, compared to D) among the DC group was observed around the medial forefoot. In this region, high pressure zones, along with localized accumulations, were reported. The regions surrounding the central forefoot and the lateral forefoot of the DC group reported high variations, of 27% and 17%, respectively, compared to the D group. Similarly, high increases in the peak pressure around the midfoot (25%), medial heel (20%), and lateral heel (15%) were reported across the DC group, compared to the D group. Overall, the lowest peak plantar pressure was reported for the HC group, followed by the D group, and the highest peak pressure was observed across the DC group.

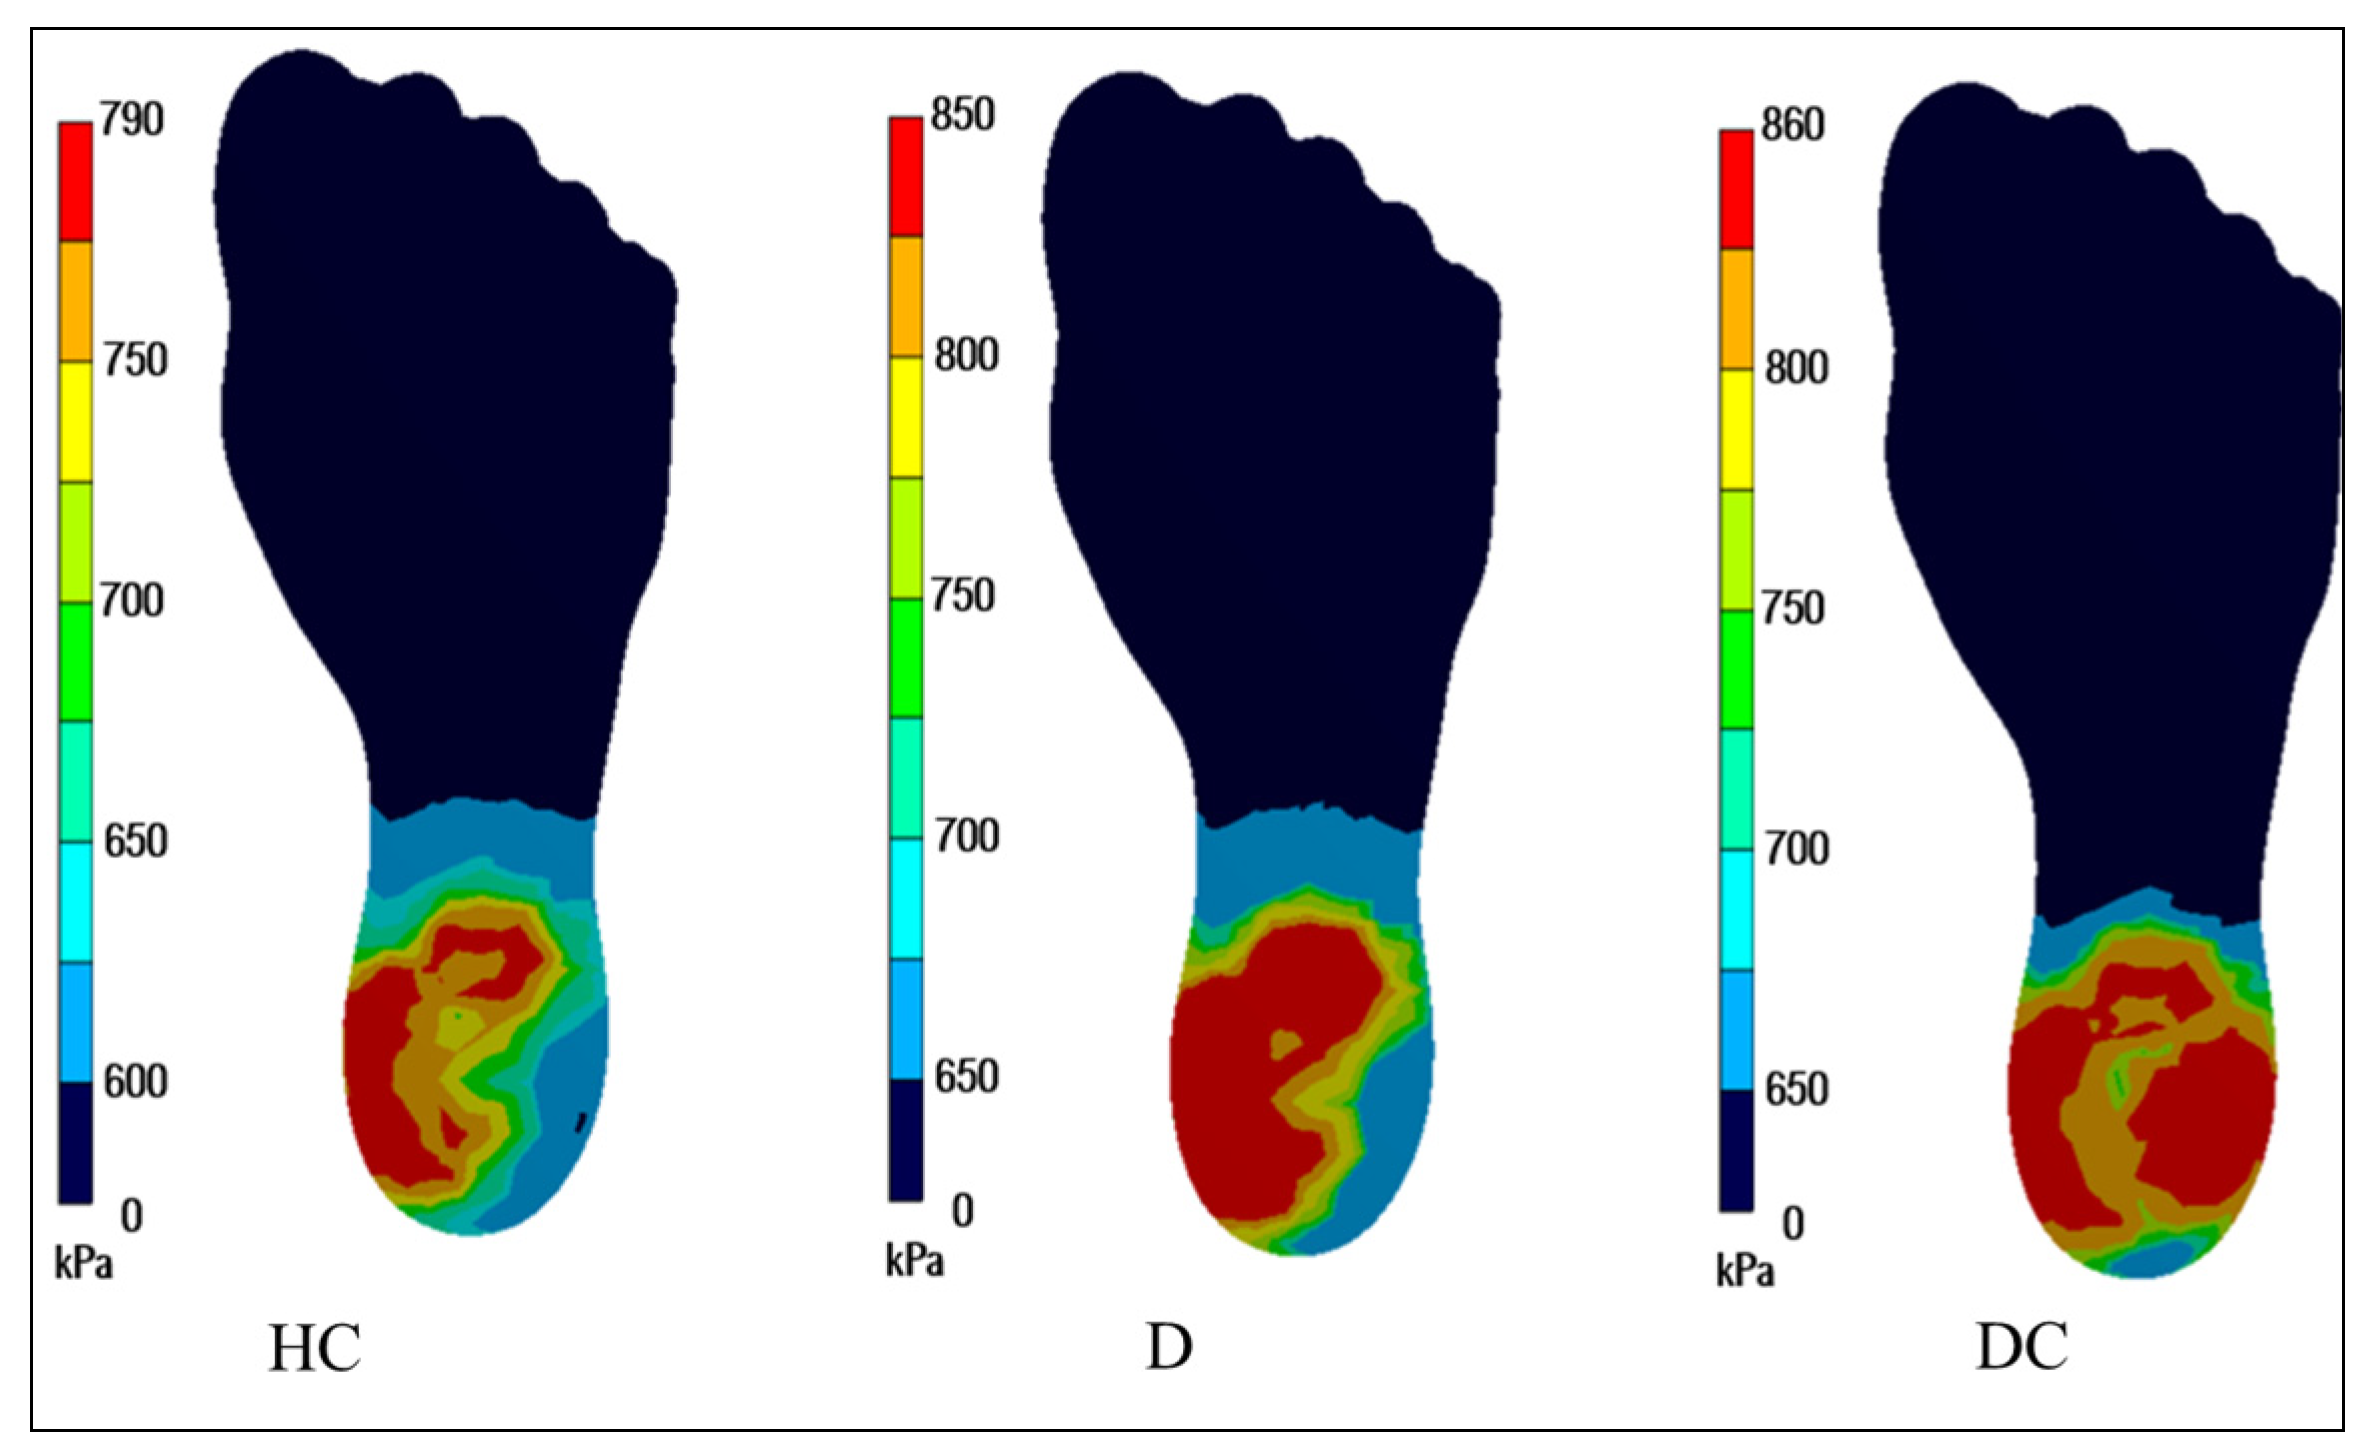
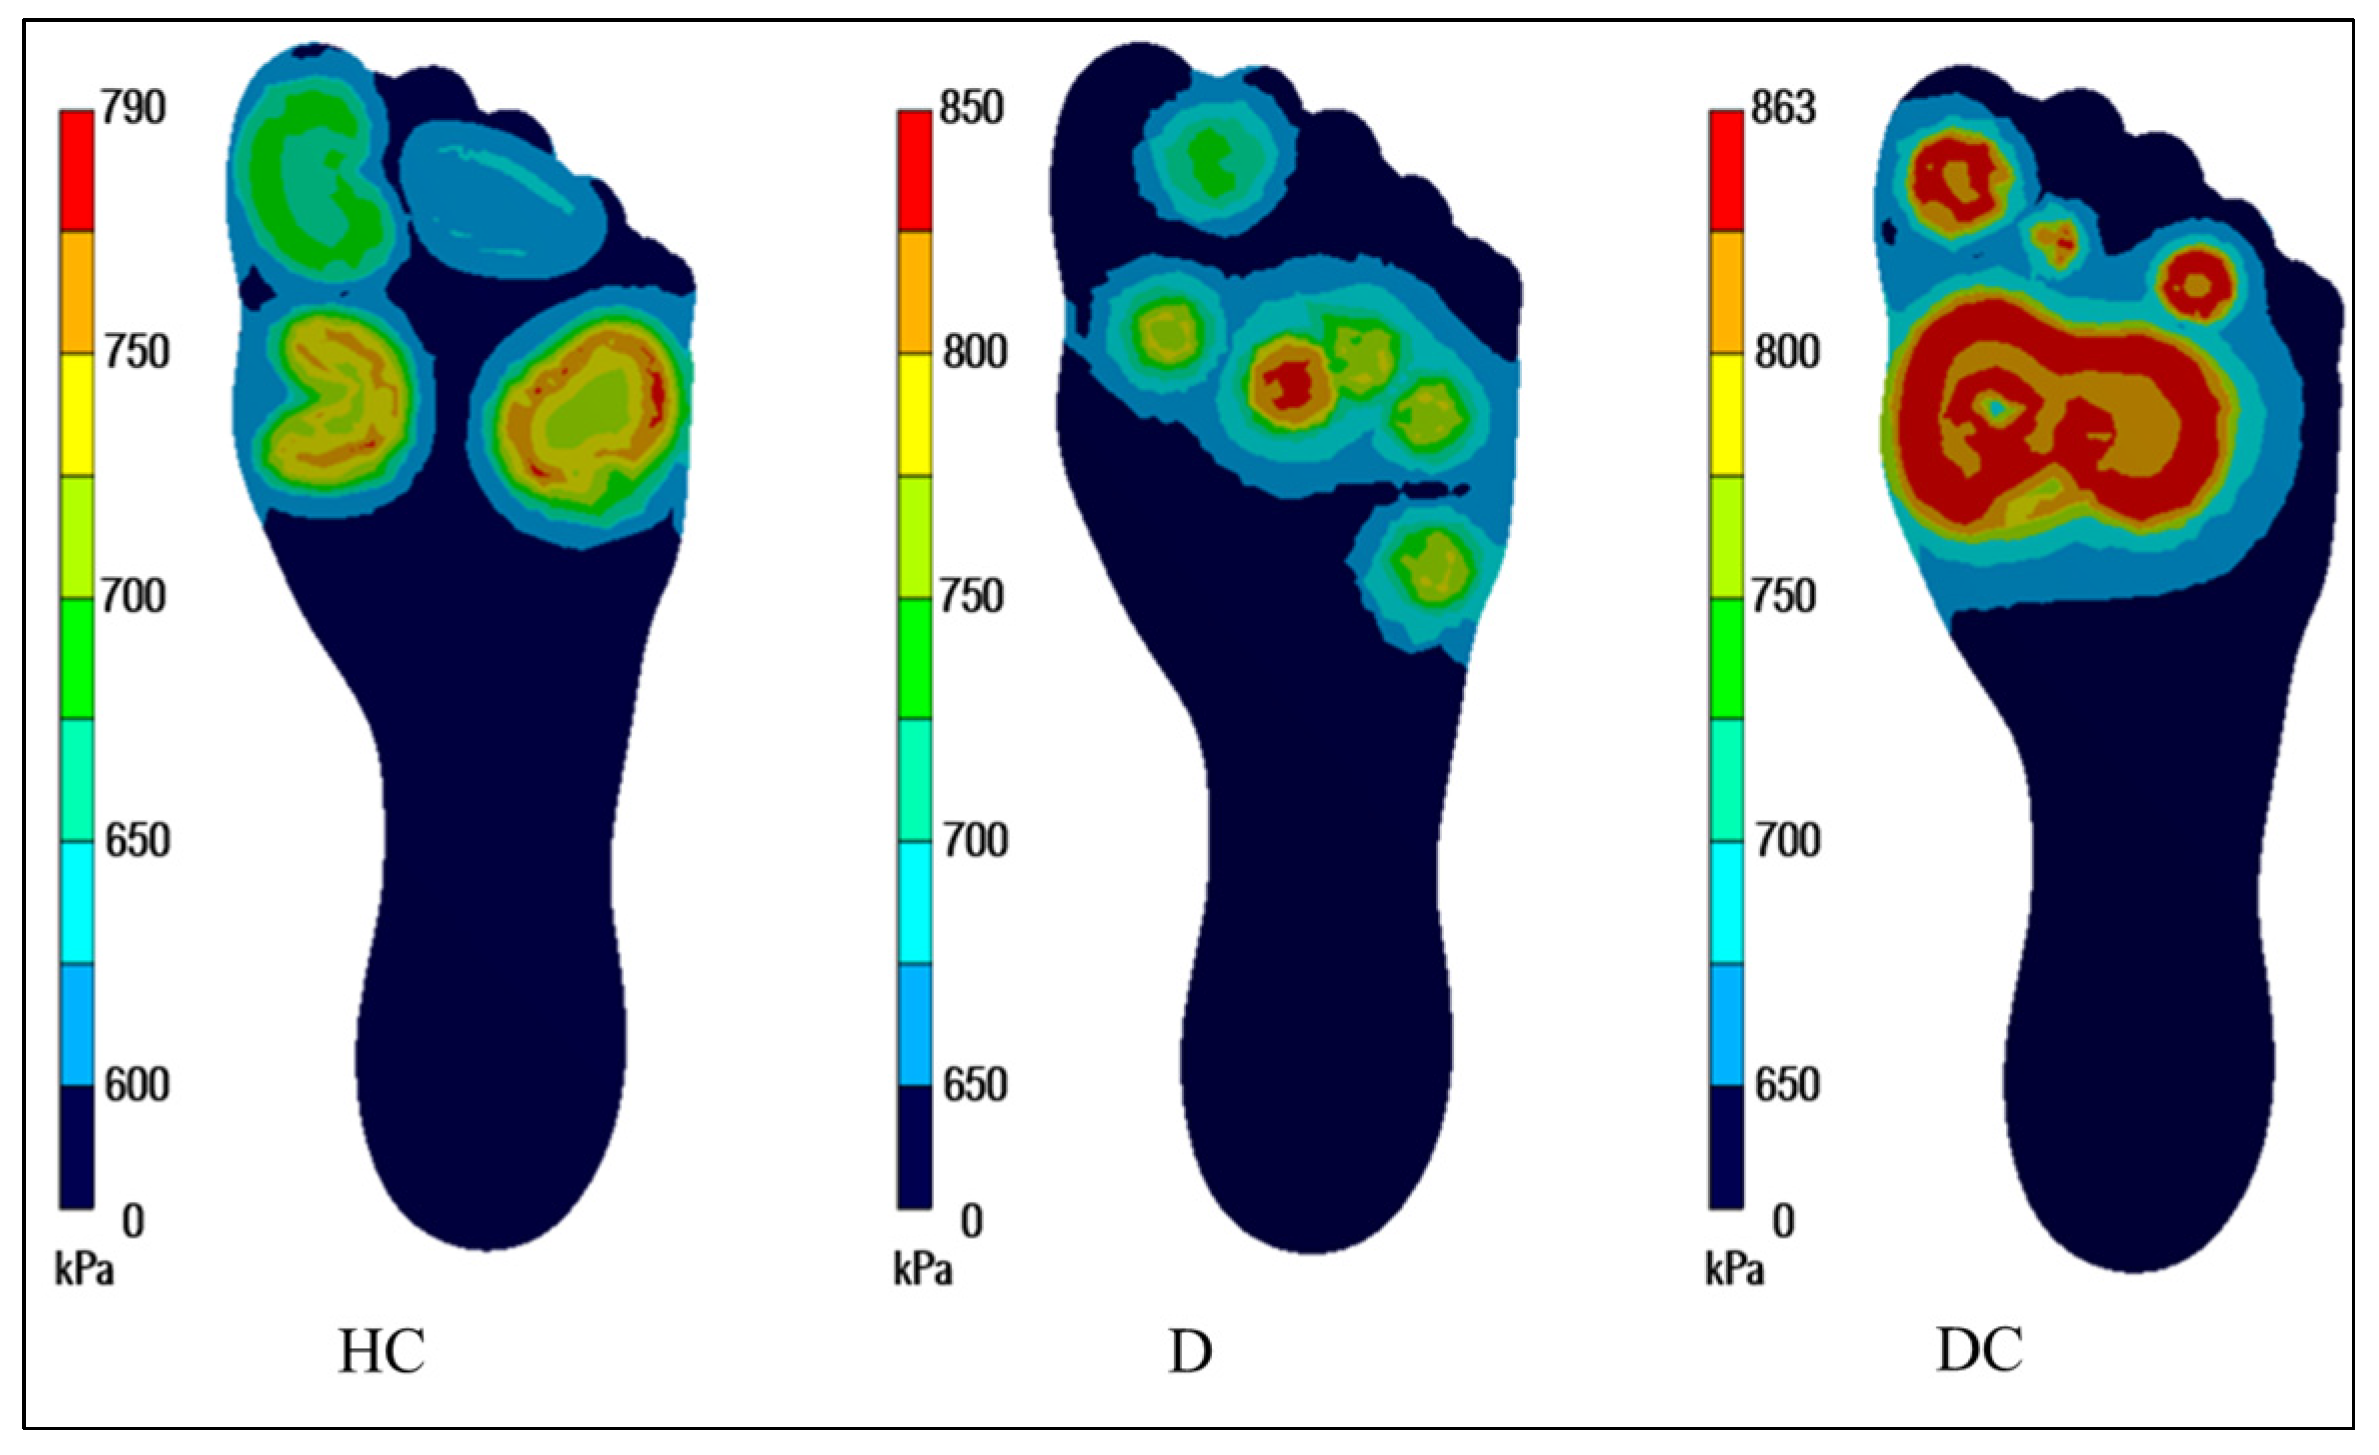
3.2. Plantar Pressure Distribution during Walking Loads

Plantar pressure distribution during walking was quantified in two different gait phases: heel strike and toe-off. Figure 11 shows the mean contour plots of the plantar pressure during the heel strike phase across each group. During the heel strike phase across the HC group, approx. 790 kPa of mean plantar pressure on the medial heel was observed. The next-highest mean pressure was observed in the lateral heel regions. The highest pressure during the heel strike phase across the D group was reported at the medial heel, followed by the lateral heel region: compared to the HC group, an overall increase of a minimum 60 kPa was reported in these regions. Across the DC group, when compared to the D group, an overall increase of approx. 10 kPa was observed at the lateral heel, while an increase of approx. 7 kPa was observed in the medial heel region.
Figure 12 represents the pressure distribution among each group during the toe-off phase. During the toe-off phase across the HC group, the highest plantar pressure was observed at the medial forefoot. The next-highest mean pressure was observed at the central forefoot regions. The mean pressure during the toe-off phase across the D group was reported at the central forefoot (850.46 kPa), followed by the medial (850 kPa), and the lateral forefoot (849.14 kPa) region. As compared to the HC group, an overall increase of a maximum 70 kPa was reported in these regions. Across the DC group, compared to the D group, an overall increase of approx. 13 kPa was observed at the central forefoot, while an increase of approx. 10 kPa was observed at the medial and lateral forefoot regions. Table 2 shows the summary of the results for the walking cycles.

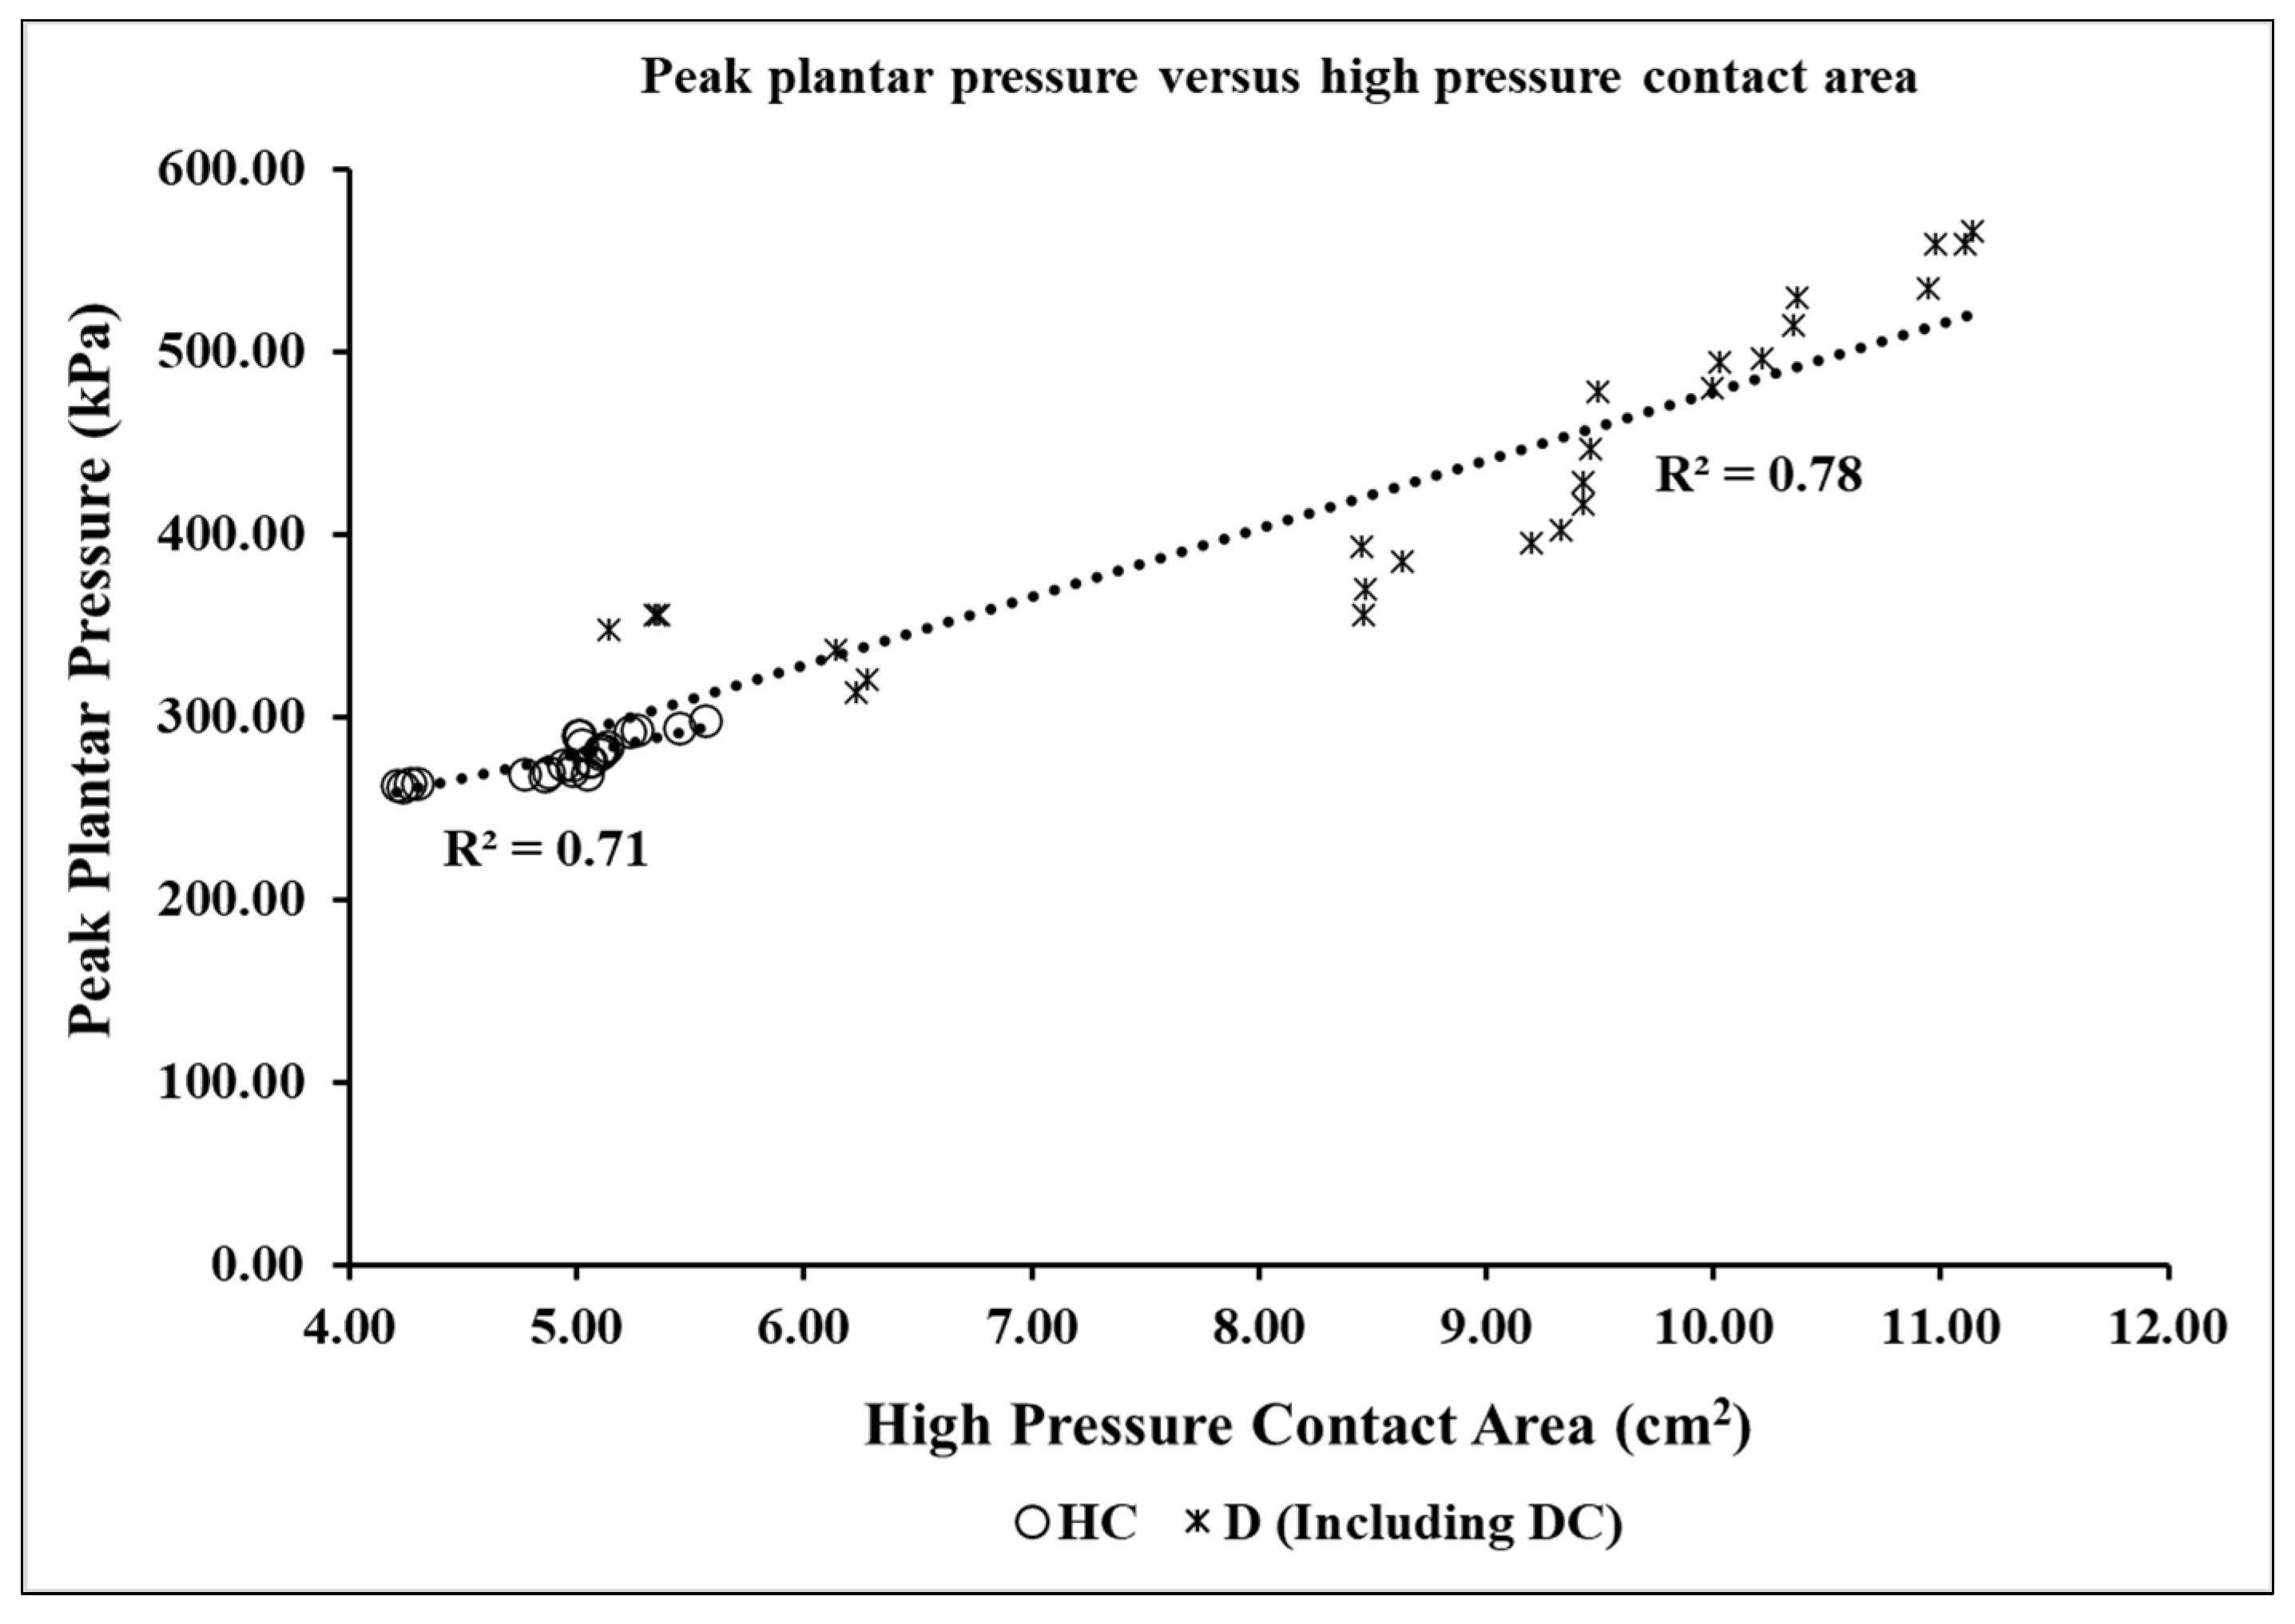
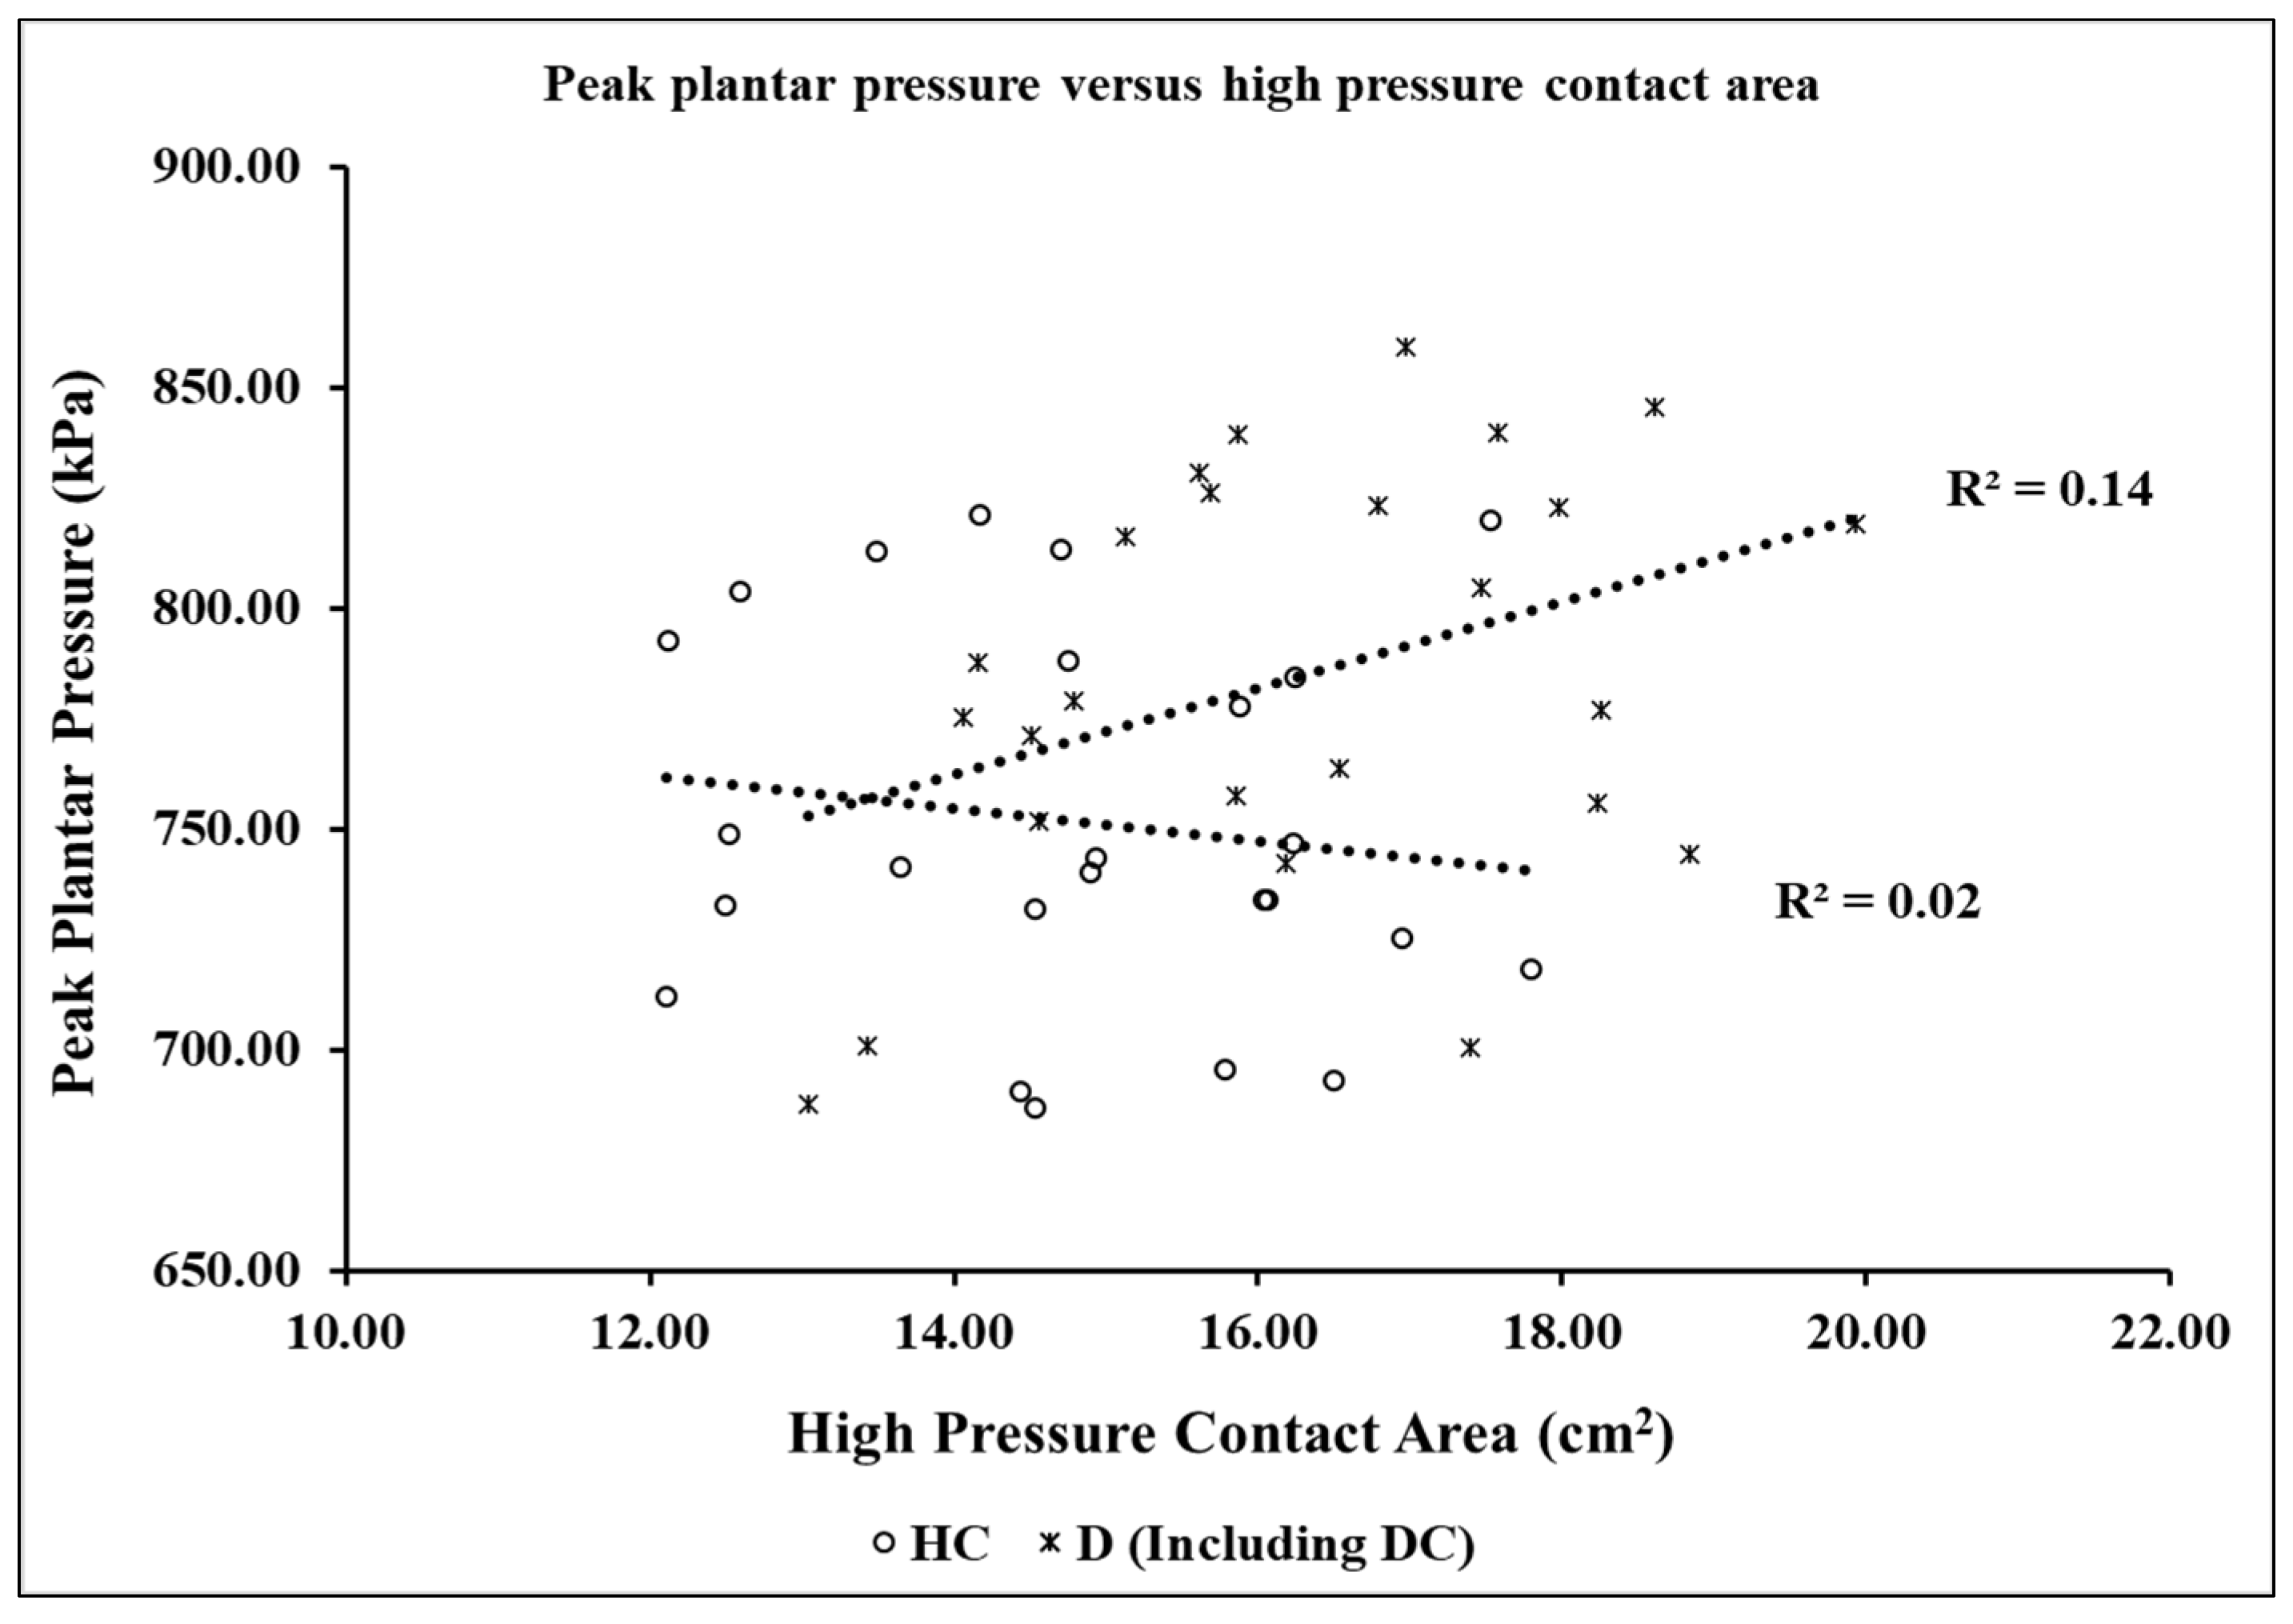
3.3. Effect of Peak Plantar Pressure on the High-Pressure Contact Area

To quantify the effect of the high-pressure contact area (HPCA) on the peak plantar pressure, the quality of correlations between them was calculated. Figure 13 shows the correlation plots between the high-pressure areas and the peak plantar pressure across each volunteer in the HC and D (including DC) groups, while standing. For the HC group, lower pressure in the contact areas was reported, and this metric was found to moderately correlate (R2 = 0.71) with the induced plantar pressure. This moderate correlation showed a positive trend, where increasing pressure in contact areas led to increasing peak plantar pressure. Conversely, in the case of the diabetic group, high-pressure contact areas were found to strongly and positively correlate (R2 = 0.78) with peak plantar pressures. In this case, most of the volunteers showed HPCA of greater than 9 cm2, with mean peak plantar pressure crossing approximately 471 kPa. The highest HPCA observed was approximately 11 cm2, with a peak value of approximately 565 kPa.
Figure 14 shows the correlation plots between the high-pressure areas and the peak plantar pressures across the HC and D (including DC) volunteer groups, while walking. Across both the groups (HC and D), weak correlations were observed between the HPCA and peak plantar pressures. The results varied widely, and an equal number of cases showed low HPCA with high pressure values and vice versa; hence, no strong conclusions can be drawn in this case.

4. Discussion

In this work, a novel in-shoe device, with a high number of sensing points, was developed and tested, to characterize plantar pressure across the volunteers. The device was found to be portable, flexible, and highly responsive. The device consisted of 126 sensing points, to increase the overall sensing resolution. Such a high number of sensing points had not previously been implemented in an in-shoe pressure measuring device, nor tested across so many volunteers (N = 50), to the best of our knowledge. The motivation behind the addition of several materials (EVA, leather, and PLA) in the development of the insole was to enhance comfort, durability, and flexibility, so as to make it a wearable lifestyle device. The working pressure range for the developed device, which was tested by placing several calibrated weights on it, was reported to be 5 kPa to 900 kPa. Furthermore, during loading and unloading, the hysteresis was calculated as the maximum difference in the output at a single load across each sensor. The hysteresis error was measured as a percentage of the full-scale output. The minimum and maximum hysteresis errors observed were 1.42% and 5.15%, respectively, having an average of 3.25% across the device. The insole was tested across healthy and diabetic volunteers while they were standing and walking. High variations among the groups were reported. The plantar pressure was found to increase from healthy to diabetic volunteers: hence, the device was able to capture the differences between these groups.
While they were standing, testing across the healthy participants showed high plantar pressure over the lateral heel region, whereas the diabetic volunteers showed high plantar pressure over the medial forefoot area. Similarly, the diabetic volunteers with corns reported high plantar pressure across the medial forefoot. These results were in line with a previous study by Basnet et al. [46], which reported higher plantar pressure for patients with diabetes, compared to healthy participants. In regard to the peak plantar pressure locations reported in our work, Caravaggi et al. [47] had also previously reported similar locations (i.e., forefoot region), which showed high plantar pressure across the diabetic group. Another study, by Zimmy et al. [48], revealed the forefoot regions of the foot as high plantar pressure zones in diabetic patients.
Testing across the volunteers in different gait phases showed slightly higher plantar pressure during the toe-off, as compared to the heel strike. These findings also emphasized the requirement of specialized foot orthosis, to reduce plantar pressure over the forefoot region. In addition, the areas in which a corn was present showed higher plantar pressure as compared to each group. Analyzing the high-pressure contact areas for each group showed that while standing, increasing contact areas led to an overall increase in peak plantar pressure across the diabetic participants. This finding emphasized the requirement for customizations in the shoe insoles, to provide reduced contact areas. In a recent study by Chanda et al. [49], novel insole designs for diabetic volunteers were developed, and showed the effectiveness of customized insoles for reducing the severity of diabetic foot ulcers. Analyzing the contact areas of each group during walking, no significant correlation was observed, which suggests that contact area is a poor metric for predicting the plantar pressure during different gait phases. These findings will be beneficial for future studies based on plantar pressure and area measurements.
The few limitations of this work should be acknowledged. Although the developed device consisted of a high number of sensing points (126), a greater number of sensors could be implemented by using several multiplexers. Furthermore, the application of several layers of different materials in addition to the stitching could have led to the pre-stressing of the sensors. Although each sensor was calibrated, the pre-stressing of the sensors may have affected the overall maximum measuring range. With the motive being to enhance the overall comfort and durability, the application of several layers of different materials led to the overall thickness of the device being 3 mm. The thickness of the PLA, the two layers of EVA, and the leather implemented in our study was 0.4 mm, 1 mm, and 1.5 mm, respectively. The remaining layers, such as paper and sensor film, led to a thickness of 0.1 mm. Hence, the total thickness of the device corresponded to 3 mm. Although the device was easily inserted, when placed over the flat pre-installed insoles inside the shoes, the overall height of the insoles would be further increased by shoes with arch supports, and would be difficult to wear. Future studies should include a greater number of sensors with decreased insole thickness, while testing on a larger sample size could further increase the accuracy and precision of these types of devices.

5. Conclusions

In conclusion, our novel and low-cost device (under $100) was able to capture plantar pressure using a high number of sensing nodes throughout the plantar region. The device was also successful in differentiating between the plantar pressure observed in the healthy and in the diabetic populations, respectively. While standing, lower peak plantar pressure was reported in the healthy group, followed by the diabetic group, and the highest peak pressure was observed in the diabetic group with corns. During the heel strike phase, the diabetic volunteers showed high plantar pressure on the medial heel region. In the case of the toe-off phase, the central forefoot was found to be a prevalent site for high plantar pressure across the diabetic volunteers. We anticipate that the results and methods produced by this study will provide strategies and guidelines for the public and for medical practitioners, in regard to the possible care for and mitigation of diabetic ulceration or re-ulceration, by timely analysis of high plantar pressure zones.

Author Contributions

S.G.: methodology; validation; conceptualization; investigation; formal analysis; writing—original draft; writing—review and editing. R.J.: investigation; validation; formal analysis. S.S.S.: methodology; investigation; formal analysis. A.M.: data curation; investigation; validation; formal analysis. S.C.: methodology; data curation; formal analysis; investigation. K.C.: data curation; investigation; validation; formal analysis. G.S.: data curation; investigation; formal analysis. A.C.: conceptualization; methodology; validation; formal analysis; supervision; writing—review and editing. All authors have read and agreed to the published version of the manuscript.

Funding

We would like to acknowledge the funding support received from Sperandus Healthcare Private Limited, and IRD-IIT Delhi.

Institutional Review Board Statement

The study was approved by the Ethical Committee of the Indian Institute of Technology Delhi (IIT-Delhi).

Informed Consent Statement

The volunteers provided a signed consent form before the study was conducted.

Data Availability Statement

The datasets generated and/or analyzed during the current study are not publicly available, due to their large sizes, but are available from the corresponding author on reasonable request.

Conflicts of Interest

The authors declare no conflict of interest.

References

  1. López-López, D.; Pérez-Ríos, M.; Ruano-Ravina, A.; Losa-Iglesias, M.E.; Becerro-De-Bengoa-Vallejo, R.; Romero-Morales, C.; Calvo-Lobo, C.; Navarro-Flores, E. Impact of quality of life related to foot problems: A case–control study. Sci. Rep. 2021, 11, 14515. [Google Scholar] [CrossRef] [PubMed]
  2. Wright, W.G.; Ivanenko, Y.P.; Gurfinkel, V.S. Foot anatomy specialization for postural sensation and control. J. Neurophysiol. 2012, 107, 1513. [Google Scholar] [CrossRef] [Green Version]
  3. Lang, L.M.G. The anatomy of the foot. Baillieres Clin. Rheumatol. 1987, 1, 215–240. [Google Scholar] [CrossRef] [PubMed]
  4. Locke, J.; Baird, S.A.; Frankis, J. Preliminary observations of muscle fibre cross sectional area of flexor digitorum brevis in cadaver feet with and without claw toes. J. Foot Ankle Res. 2010, 3, 32–38. [Google Scholar] [CrossRef] [PubMed] [Green Version]
  5. Ghanem, I.; Massaad, A.; Assi, A.; Rizkallah, M.; Bizdikian, A.J.; El Abiad, R.; Seringe, R.; Mosca, V.; Wicart, P. Understanding the foot’s functional anatomy in physiological and pathological conditions: The calcaneopedal unit concept. J. Child. Orthop. 2019, 13, 134–146. [Google Scholar] [CrossRef]
  6. Pita-Fernandez, S.; Gonzalez-Martin, C.; Aalonso-Tajes, F.; Seoane-Pillado, T.; Pertega-Diaz, S.; Perez-Garcia, S.; Seijo-Bestilleiro, R.; Balboa-Barreiro, V. Flat Foot in a Random Population and its Impact on Quality of Life and Functionality. J. Clin. Diagn. Res. 2017, 11, 22–27. [Google Scholar] [CrossRef]
  7. Chhikara, K.; Singh, G.; Gupta, S.; Chanda, A. Progress of additive manufacturing in fabrication of foot orthoses for diabetic patients: A review. Ann. 3D Print Med. 2022, 8, 100085. [Google Scholar] [CrossRef]
  8. Hendry, G.J.; Fenocchi, L.; Woodburn, J.; Steultjens, M. Foot pain and foot health in an educated population of adults: Results from the Glasgow Caledonian University Alumni Foot Health Survey. J. Foot Ankle Res. 2018, 11, 48. [Google Scholar] [CrossRef]
  9. Garrow, A.P.; Silman, A.J.; Macfarlane, G.J. The cheshire foot pain and disability survey: A population survey assessing prevalence and associations. Pain 2004, 110, 378–384. [Google Scholar] [CrossRef]
  10. Dunn, J.E.; Link, C.L.; Felson, D.T.; Crincoli, M.G.; Keysor, J.J.; McKinlay, J.B. Prevalence of foot and ankle conditions in a multiethnic community sample of older adults. Am. J. Epidemiol. 2004, 159, 491–498. [Google Scholar] [CrossRef] [Green Version]
  11. Menz, H.B.; Jordan, K.P.; Roddy, E.; Croft, P.R. Characteristics of primary care consultations for musculoskeletal foot and ankle problems in the UK. Rheumatology 2010, 49, 1391–1398. [Google Scholar] [CrossRef] [Green Version]
  12. Chhikara, K.; Gupta, S.; Chanda, A. Development of a novel foot orthosis for plantar pain reduction. Mater. Today Proc. 2022, 62, 3532–3537. [Google Scholar] [CrossRef]
  13. Bakker, K.; Abbas, Z.G.; Pendsey, S. Step by Step, improving diabetic foot care in the developing world. Pract. Diabetes Int. 2006, 23, 365–369. [Google Scholar] [CrossRef]
  14. Moulik, P.K.; Mtonga, R.; Gill, G.V. Amputation and Mortality in New-Onset Diabetic Foot Ulcers Stratified by Etiology. Diabetes Care 2003, 26, 491–494. [Google Scholar] [CrossRef] [Green Version]
  15. Mohammed, Y.A.; Farouk, H.K.; Gbreel, M.I.; Ali, A.M.; Salah, A.A.; Nourelden, A.Z.; Gawad, M.M.A.-E. Human amniotic membrane products for patients with diabetic foot ulcers. Do they help? A systematic review and meta-analysis. J. Foot Ankle Res. 2022, 15, 71. [Google Scholar] [CrossRef]
  16. Fernando, M.E.; Crowther, R.G.; Lazzarini, P.A.; Sangla, K.S.; Wearing, S.; Buttner, P.; Golledge, J. Plantar pressures are higher in cases with diabetic foot ulcers compared to controls despite a longer stance phase duration. BMC Endocr. Disord. 2016, 16, 51. [Google Scholar] [CrossRef] [Green Version]
  17. Gupta, S.; Singh, G.; Chanda, A. Prediction of diabetic foot ulcer progression: A computational study. Biomed. Phys. Eng. Express 2021, 7, 065020. [Google Scholar] [CrossRef]
  18. Bus, S.A.; Armstrong, D.G.; van Deursen, R.W.; Lewis, J.E.A.; Caravaggi, C.F.; Cavanagh, P.R. IWGDF guidance on footwear and offloading interventions to prevent and heal foot ulcers in patients with diabetes. Diabetes Metab. Res. Rev. 2016, 32 (Suppl. S1), 25–36. [Google Scholar] [CrossRef] [Green Version]
  19. Sutkowska, E.; Sutkowski, K.; Sokołowski, M.; Franek, E.; Dragan, S. Distribution of the Highest Plantar Pressure Regions in Patients with Diabetes and Its Association with Peripheral Neuropathy, Gender, Age, and BMI: One Centre Study. J. Diabetes Res. 2019, 2019, 7395769. [Google Scholar] [CrossRef]
  20. Caselli, A.; Pham, H.; Giurini, J.M.; Armstrong, D.G.; Veves, A. The Forefoot-to-Rearfoot Plantar Pressure Ratio Is Increased in Severe Diabetic Neuropathy and Can Predict Foot Ulceration. Diabetes Care 2002, 25, 1066–1071. [Google Scholar] [CrossRef] [Green Version]
  21. De Cock, A.; Vanrenterghem, J.; Willems, T.; Witvrouw, E.; De Clercq, D. The trajectory of the centre of pressure during barefoot running as a potential measure for foot function. Gait Posture 2008, 27, 669–675. [Google Scholar] [CrossRef] [PubMed]
  22. Pandey, S.; Sharma, V. World Diabetes Day 2018: Battling the Emerging Epidemic of Diabetic Retinopathy. Indian J. Ophthalmol. 2018, 66, 1652. [Google Scholar] [CrossRef] [PubMed]
  23. Di Rosa, M.; Hausdorff, J.M.; Stara, V.; Rossi, L.; Glynn, L.; Casey, M.; Burkard, S.; Cherubini, A. Concurrent validation of an index to estimate fall risk in community dwelling seniors through a wireless sensor insole system: A pilot study. Gait Posture 2017, 55, 6–11. [Google Scholar] [CrossRef] [PubMed]
  24. Taborri, J.; Rossi, S.; Palermo, E.; Patanè, F.; Cappa, P. A Novel HMM Distributed Classifier for the Detection of Gait Phases by Means of a Wearable Inertial Sensor Network. Sensors 2014, 14, 16212–16234. [Google Scholar] [CrossRef] [PubMed]
  25. Shu, L.; Hua, T.; Wang, Y.; Li, Q.; Feng, D.D.; Tao, X. In-shoe plantar pressure measurement and analysis system based on fabric pressure sensing array. IEEE Trans. Inf. Technol. Biomed. 2010, 14, 767–775. [Google Scholar] [CrossRef] [Green Version]
  26. Saito, M.; Nakajima, K.; Takano, C.; Ohta, Y.; Sugimoto, C.; Ezoe, R.; Sasaki, K.; Hosaka, H.; Ifukube, T.; Ino, S.; et al. An in-shoe device to measure plantar pressure during daily human activity. Med. Eng. Phys. 2011, 33, 638–645. [Google Scholar] [CrossRef]
  27. Cui, T.; Yang, L.; Han, X.; Xu, J.; Yang, Y.; Ren, T. A Low-Cost, Portable, and Wireless In-Shoe System Based on a Flexible Porous Graphene Pressure Sensor. Materials 2021, 14, 6475. [Google Scholar] [CrossRef]
  28. Tee, K.S.; Javahar, Y.S.H.; Saim, H.; Zakaria, W.N.W.; Khialdin, S.B.M.; Isa, H.; Awad, M.I.; Soon, C.F. A Portable Insole Pressure Mapping System. TELKOMNIKA Telecommun. Comput. Electron. Control 2017, 15, 1493–1500. [Google Scholar] [CrossRef]
  29. Skelly, M.M.; Chizeck, H.J. Real time gait event detection during FES paraplegic walking. Annu. Int. Conf. IEEE Eng. Med. Biol.-Proc. 1997, 5, 1934–1937. [Google Scholar] [CrossRef]
  30. Pappas, I.P.I.; Popovic, M.R.; Keller, T.; Dietz, V.; Morari, M. A reliable gait phase detection system. IEEE Trans. Neural Syst. Rehabil. Eng. 2001, 9, 113–125. [Google Scholar] [CrossRef]
  31. Pappas, I.P.I.; Keller, T.; Mangold, S. A Reliable, Gyroscope based Gait Phase Detection Sensor Embedded in a Shoe Insole. Proc. IEEE Sens. 2002, 1, 1085–1088. [Google Scholar] [CrossRef]
  32. Zhang, Q.; Wang, Y.L.; Xia, Y.; Wu, X.; Kirk, T.V.; Chen, X.D. A low-cost and highly integrated sensing insole for plantar pressure measurement. Sens. Bio-Sens. Res. 2019, 26, 100298. [Google Scholar] [CrossRef]
  33. ISO 9407:2019(en); Footwear Sizing—Mondopoint System of Sizing and Marking. International Organization for Standardization: Geneva, Switzerland, 2019. Available online: https://www.iso.org/obp/ui/#iso:std:iso:9407:ed-2:v1:en (accessed on 3 October 2022).
  34. Hunt, A.E.; Fahey, A.J.; Smith, R.M. Static measures of calcaneal deviation and arch angle as predictors of rearfoot motion during walking. Aust. J. Physiother. 2000, 46, 9–16. [Google Scholar] [CrossRef]
  35. Dzedzickis, A.; Sutinys, E.; Bucinskas, V.; Samukaite-Bubniene, U.; Jakstys, B.; Ramanavicius, A.; Morkvenaite-Vilkonciene, I. Polyethylene-Carbon Composite (Velostat®) Based Tactile Sensor. Polymers 2020, 12, 2905. [Google Scholar] [CrossRef]
  36. Standard Test Methods for Pressure-Sensitive Adhesive-Coated Tapes Used for Electrical and Electronic Applications. ASTM International: West Conshohocken, PA, USA, 2017. Available online: https://www.astm.org/d1000-17.html (accessed on 3 October 2022).
  37. Test Method Standard Electronic and Electrical Component Parts. Department of Defense: Arlington, VA, USA, 2002. Available online: https://nepp.nasa.gov/DocUploads/1F6AB74B-4517-4AD0-A34813268E75B8EB/MIL-STD-202.pdf (accessed on 3 October 2022).
  38. Hellstrand Tang, U.; Zügner, R.; Lisovskaja, V.; Karlsson, J.; Hagberg, K.; Tranberg, R. Comparison of plantar pressure in three types of insole given to patients with diabetes at risk of developing foot ulcers—A two-year, randomized trial. J. Clin. Transl. Endocrinol. 2014, 1, 121–132. [Google Scholar] [CrossRef] [Green Version]
  39. Viswanathan, V.; Madhavan, S.; Gnanasundaram, S.; Gopalakrishna, G.; Das, B.N.; Rajasekar, S.; Ramachandran, A. Effectiveness of Different Types of Footwear Insoles for the Diabetic Neuropathic FootA follow-up study. Diabetes Care 2004, 27, 474–477. [Google Scholar] [CrossRef] [Green Version]
  40. Tramonti, C.; Iacopi, E.; Cafalli, M.; Riitano, N.; Piaggesi, A.; Chisari, C. Type 2 diabetes mellitus and obesity: The synergistic effects on human locomotor function. Clin. Biomech. 2022, 100, 105759. [Google Scholar] [CrossRef]
  41. Hussein, M.K.; Saifalla, P.H. Estimation of insulin resistance and creatine kinase among Iraqi patients with type 2 diabetes mellitus. Eurasian Chem. Commun. 2022, 4, 1193–1200. [Google Scholar] [CrossRef]
  42. Puls, L.; Hauke, D.; Camathias, C.; Hügle, T.; Barg, A.; Valderrabano, V. Conservative Trio-Therapy for Varus Knee Osteoarthritis: A Prospective Case-Study. Medicina 2022, 58, 460. [Google Scholar] [CrossRef]
  43. Wang, Y.; Lu, Y.; Yao, J.; Yang, C.; Xu, W.; Wang, H. Differential analysis of plantar pressure parameters of lower limbs in stroke patients with different cerebral hemispheric injuries. Chin. J. Tissue Eng. Res. 2022, 26, 5646–5651. [Google Scholar] [CrossRef]
  44. Nemoto, K.I.; Gen-No, H.; Masuki, S.; Okazaki, K.; Nose, H. Effects of high-intensity interval walking training on physical fitness and blood pressure in middle-aged and older people. Mayo Clin. Proc. 2007, 82, 803–811. [Google Scholar] [CrossRef] [PubMed]
  45. Baccelli, G.; Reggiani, P.; Mattioli, A.; Corbellini, E.; Garducci, S.; Catalano, M. The Exercise Pressor Reflex and Changes in Radial Arterial Pressure and Heart Rate During Walking in Patients with Arteriosclerosis Obliterans. Angiology 2016, 50, 361–374. [Google Scholar] [CrossRef]
  46. Basnet, S.; Maiya, A. Comparison of static plantar pressure in patients with diabetes and healthy individuals. J. Sci. Med. Sport. 2012, 15, S361. [Google Scholar] [CrossRef]
  47. Caravaggi, P.; Berti, L.; Leardini, A.; Lullini, G.; Marchesini, G.; Baccolini, L.; Giacomozzi, C. Biomechanical and functional alterations in the diabetic foot: Differences between type I and type II Diabetes. Gait Posture 2017, 57, 12–13. [Google Scholar] [CrossRef]
  48. Zimny, S.; Schatz, H.; Pfohl, M. The role of limited joint mobility in diabetic patients with an at-risk foot. Diabetes Care 2004, 27, 942–946. [Google Scholar] [CrossRef] [Green Version]
  49. Chanda, A.; Unnikrishnan, V. Novel insole design for diabetic foot ulcer management. Proc. Inst. Mech. Eng. Part H J. Eng. Med. 2018, 232, 1182–1195. [Google Scholar] [CrossRef]
Figure 1. Geometrical modeling of insole: (a) insole sketch; (b) extruded (0.4 mm thickness); (c) 3D printed flexible insole.
J 06 00003 g001
Figure 2. Sensor management: (a) horizontal and vertical markings; (b) total sensing points; (c) placement of copper tapes.
J 06 00003 g002
Figure 3. Schematic: (a) for the placement of copper electrodes and the pressure sensitive film; (b) connection of consecutive sensing points.
J 06 00003 g003
Figure 4. Resistance vs. force response for the sensors.
J 06 00003 g004
Figure 5. Circuit box along with the ESP-32, FFC connector, and FFC cable.
J 06 00003 g005
Figure 6. Materials used in the development of the pressure insole.
J 06 00003 g006
Figure 7. Complete device assembly.
J 06 00003 g007
Figure 8. A volunteer wearing the developed pressure measurement device setup.
J 06 00003 g008
Figure 9. Peak plantar pressure at different locations of the foot across each group.
J 06 00003 g009
Figure 10. Plantar pressure distribution across the HC, D, and DC group.
J 06 00003 g010
Figure 11. Plantar pressure distribution across the HC, D, and DC group during heel strike.
J 06 00003 g011
Figure 12. Plantar pressure distribution across the HC, D, and DC group during toe-off phase.
J 06 00003 g012
Figure 13. Correlation plot between the high-pressure contact areas and the peak plantar pressures across the HC and D (including the DC) volunteer groups, while standing.
J 06 00003 g013
Figure 14. Correlation plot between the high-pressure contact areas and the peak plantar pressures across the HC and D (including the DC) volunteer groups, while walking.
J 06 00003 g014
Table 1. Demographic data of the volunteers (group HC and D both having N = 25 volunteers).
GroupMeanStandard DeviationStandard Error Mean
Age
(years)
HC48.269.352.41
D52.205.071.31
Weight
(kg)
HC71.8610.422.69
D72.0610.792.78
Pain ScoreD5.920.89N/A
Duration of Diabetes
(years)
D7.203.96N/A
Table 2. Peak plantar pressures (kPa) across the HC, D, and DC groups during different gait phases.
Gait PhaseGroupPeak Plantar Pressure (kPa) during WalkingLocation
Heel StrikeHC790.15 ± 35.45Medial Heel
780.13 ± 15.77Lateral Heel
D850.46 ± 25.10Medial Heel
849.40 ± 15.85Lateral Heel
DC860.65 ± 18.47Lateral Heel
856.44 ± 17.56Medial Heel
Toe-offHC790.00 ± 20.13Medial Forefoot
788.70 ± 11.11Central Forefoot
779.10 ± 10.47Lateral Forefoot
D850.14 ± 19.88Central Forefoot
850.00 ± 15.46Medial Forefoot
849.14 ± 12.11Lateral Forefoot
DC863.64 ± 10.14Central Forefoot
860.00 ± 9.56Medial Forefoot
859.00 ± 8.44Lateral Forefoot
Disclaimer/Publisher’s Note: The statements, opinions and data contained in all publications are solely those of the individual author(s) and contributor(s) and not of MDPI and/or the editor(s). MDPI and/or the editor(s) disclaim responsibility for any injury to people or property resulting from any ideas, methods, instructions or products referred to in the content.

