
CO2 Emissions of Battery Electric Vehicles and Hydrogen Fuel Cell Vehicles
Faculty of Engineering and Information Technology, Department of Electrical Engineering and Information Technology, George Emil Palade University of Medicine, Pharmacy, Science, and Technology of Targu Mures, Gheorghe Marinescu 38, 540142 Târgu Mureș, Romania
Clean Technol. 2023, 5(2), 696-712; https://doi.org/10.3390/cleantechnol5020035
Submission received: 12 February 2023
/
Revised: 10 March 2023
/
Accepted: 29 May 2023
/
Published: 1 June 2023
Abstract
:During the last few years, electric and hydrogen vehicles have become an alternative to cars that use internal combustion engines. The number of electric and hydrogen vehicles sold has increased due to support from local governments and because car manufacturers will stop the production of internal combustion engines in the near future. The emissions of these vehicles while being driven are zero, but they still have an impact on the environment due to their fuel. In this article, an analysis of carbon dioxide (CO2) emissions for two types of vehicles: battery electric vehicles (BEVs) powered by electricity and fuel cell electric vehicles (FCEVs) powered by hydrogen, is presented. The analysis considers different values for the mix of power generation and hydrogen production options in comparison to other studies. The CO2 emissions were calculated and compared for the two types of vehicles. The results show that the CO2 emissions of BEVs are lower when compared to FCEVs if the hydrogen is obtained from pollutant sources and is higher if the hydrogen is obtained from nuclear power and renewable energy sources. When compared to conventional combustion engine vehicles, BEVs have lower CO2 emissions, while the emissions of FCEVs are dependent on the hydrogen production method.
1. Introduction
The transport sector makes an important contribution to climate change in the form of carbon dioxide (CO2) and greenhouse gas emissions due to the dependency on fossil fuels for vehicles that rely on internal combustion engines. Therefore, it is important to adopt more environmentally friendly vehicles, such as battery electric vehicles (BEVs) and fuel cell electric vehicles (FCEVs) powered by hydrogen [1].
All BEVs comprise an electric motor and a battery that powers the electric motor. The BEVs can be charged at home (outlet) or at a charging station.
FCEVs are powered by the chemical reaction of oxygen and hydrogen in the fuel cell, storing electricity and driving the motor with this energy. FCEVs have the advantage of longer travel distances and shorter charging times compared to BEVs [2].
Considering the fact that the number of BEVs and FCEVs sold has increased in recent years due to support from local governments and because car manufacturers focused their attention on these ecofriendly vehicles, it is important to determine the impact on the environment regarding CO2 emissions due to their fuel [3,4,5,6,7].
The toxic emissions of these vehicles while driven are zero. However, the ecofriendliness of a BEV depends on the power mix, which refers to the composition ratio of the electricity generation sources powering it [2]. The ecofriendliness of an FCEV depends on the production of its fuel, hydrogen. Most of the total hydrogen production is performed via the steam reforming of natural gas and other fossil primary energy, and only a small amount is based on renewable energies [3,4,5].
The consumer preferences for BEVs and FCEVs, the design of hydrogen vehicles and charging stations, the impact on CO2 emissions when considering the power mix, the advantages and disadvantages of hydrogen vehicles, and the optimization and management schemes for networks that included BEVs and FCEVs were investigated by researchers. The remainder of the paper is organized as follows. The work of other researchers is presented in Section 2: Literature Review. In Section 3, the hydrogen production options and mathematical model used to calculate the CO2 emissions for BEVs and FCEVs are presented. In Section 4, the results are given. In Section 5, the discussion and interpretation of the results are presented, and Section 6 presents the conclusions.
2. Literature Review
A comparison between electric and hydrogen vehicles by considering their life cycle assessment was performed in [1]. In [2], the CO2 emission reduction potential of BEVs in China was investigated. The results show that in 2030, the emission in the transportation sector will be lower. In [3], the CO2 emissions associated with the deployment of EVs in Saudi Arabia (considering the energy mix) were investigated. The results showed that the replacement of 1% of petrol cars with EVs reduces emissions by 0.5%. A study was performed in [4] that investigated if the target for reducing emissions in 2050 in the United Kingdom is achievable. The results showed that plug-in hybrid electric vehicles should not be used by 2050 in order to comply with the target. A comparison of the CO2 emissions between internal combustion engines and EVs was performed in [5] for the Canary Islands. The results were similar, with the emissions being lower for the EVs only if the renewable energy sources had a high share in the power mix. Another study performed in [6] estimated that the CO2 emissions are 56% lower for BEVs when compared with internal combustion engines.
In [7,8], the total life-cycle greenhouse gas (GHG) emissions produced by passenger cars were investigated. The results showed that combustion engine vehicles emit the highest amount of GHG emissions, while BEVs can reduce these emissions by 89%. In [9,10,11], the impact of EVs on the emissions inside the European Union was investigated. The results showed that these emissions will not be reduced if fossil fuels still have a significant share in the power mix. The emissions of BEVs in Poland were investigated in [12,13,14]. The results show that the emissions are comparable with those of conventional combustion vehicles due to the high share of fossil fuel power plants in the power mix. A comparison of the CO2 emissions for PHEVs and BEVs was performed in [15]. In [16], the charging infrastructure, technology, and issues related to charging station identification were reviewed. The losses during charging were investigated in [17], with the losses being higher for single-phase charging (20.42%) when compared to three-phase charging (12.79%).
In [18], the consumer preferences for electric vehicles and FCEVs were estimated; then, the greenhouse gas emissions were determined considering the power mix in South Korea. The results show that the reduction in greenhouse gas emissions was 4.7% when compared with the target for 2030. In [19], different hydrogen production methods were compared by considering environmental and economic aspects, with the results being better for electrolysis associated with renewable energy sources. The consumer preferences for electric and hydrogen vehicles were also investigated in [20,21].
The total cost of ownership of hydrogen vehicles was analyzed in [22]. A vehicle de-sign and total cost analysis for three types of fuel cell vehicles (simple fuel cell, hybrid fuel cell with regenerative brakes, and hybrid fuel cell with rooftop photovoltaics) were presented in [23]. Vehicles with an internal combustion engine, BEVs, and FCEVs were compared in [24] by considering uncertainties such as user and acceptance behavior, the security of the supply, and transport requirements. The fuels used in transport, namely, electricity and hydrogen, were analyzed and compared in [25]. The simulation and lifecycle assessment of electric vehicles and FCEVs was performed in [26,27] by considering different hydrogen production methods. The barriers to the acceptance and use of hydrogen vehicles were analyzed in [28]. The development and possible challenges regarding adopting hydrogen vehicles, such as infrastructure and ownership cost, were investigated in [29,30].
In [31], the potential hydrogen demand was determined, and an optimization model was determined in order to achieve the best production/demand cost for hydrogen. The demand for hydrogen in 2030 and the flexible electrolysis production that lowered the operating costs and CO2 emissions were simulated in [32]. The design for a hydrogen fueling station that integrated an ejector was presented in [33], and the proposed model was evaluated, with the results showing an improvement in energy efficiency. The fueling infrastructure of FCEVs was analyzed in [34,35], while in [36], a planning model was developed for a hydrogen supply infrastructure combined with renewable energy sources. In [37], the production cost and emissions for hydrogen from fossil fuels (coal and gas) and renewable energy sources were determined. In [38], a comparison of the emissions for hydrogen vehicles was performed by considering different scenarios between 2010 and 2050. The lowest total emissions were for FCEVs that used gaseous hydrogen. A comparison of two sampling methods for a 70 MPa hydrogen refueling station was presented in [39]. The types of fuel cells for a hydrogen vehicle were presented in [40], while in [41,42,43], the ways in which hydrogen is produced and the emissions in the hydrogen production process were analyzed.
Control strategies were developed in [44,45] for fuel saving in FCEVs. In [46], the power consumption of refueling stations was optimized by considering the number of tanks and the volume and pressure in the tanks. In [47], the possible advantages and disadvantages of the use of hydrogen vehicles in an urban environment were investigated. An off-grid charging station was designed in [48,49] for electric and hydrogen vehicles using solar power. In [50], a stochastic model was designed in order to determine the unit commitment of the power sources and storage of an energy hub that included parking lots for hydrogen vehicles. The operation cost of the energy hub was reduced by 27.58% by considering demand response, by 12.68% when storage systems were used, and by 2.9% when hydrogen vehicles were used. The optimal planning of an islanded microgrid that comprised electric vehicles, hydrogen vehicles, and storage was studied in [51] for different weather conditions. The planning of an integrated power, hydrogen, and gas network that included hydrogen vehicles was optimized in [52,53]. The optimal scheduling of microgrids that comprised hydrogen vehicles in real-time and day-ahead power markets was determined in [54]. The operating cost of an integrated electricity and gas network for electric and hydrogen vehicles was minimized in [55] by considering different availability and capability scenarios.
The optimization of biomass-based hybrid hydrogen/thermal energy storage system operation for a building and hydrogen vehicles was analyzed in [56] by considering two strategies: power demand with hydrogen load and thermal demand with hydrogen load. Power demand with hydrogen load obtained better results by considering the primary energy consumption saving ratio, annual total expenditure reduction ratio, and CO2 emission reduction ratio. A multi-objective optimization was performed in [57] for hybrid renewable energy systems that included BEVs and hydrogen vehicles. The supply performance results were better when only the hydrogen vehicles were connected, while the grid integration, economic, and environmental aspects were better when only the BEVs were connected. The urban heat island intensity and CO2 emissions in an urban city, considering different mobility concepts (conventional, electric, and hydrogen vehicles), regular power mixture, and power supplied only by wind turbines, was analyzed in [58]. The hydrogen vehicles fueled from a regular power mix had higher heat island intensity and CO2 emissions. The CO2 emissions were lower when the electric and hydrogen vehicles were powered with electricity generated from wind turbines. A management scheme was developed in [59] for a building that included solar, wind, and battery storage units, as well as electric and hydrogen vehicles, such that the cost of energy consumption was minimized. The air quality impact of FCEVs that were supplied in a considerable manner by renewable energy sources was investigated in [60], while in [61], the challenges regarding measurement were identified for the hydrogen industry, such as sampling, metering, quality control, and assurance.
The main contributions of this paper are
- Different BEVs and FCEVs were considered in the study and were compared to other studies where only one type of vehicle was taken into account, or only one battery vehicle and one hydrogen vehicle were selected, meaning that different fuel consumptions and battery or tank capacities were studied;
- Hydrogen produced from conventional sources (coal and natural gas) and from renewable energy sources (wind, solar, and hydro) was considered;
- Different power generation mixes for BEVs were considered in the study and are compared to those of other studies where the power mix did not change.
3. Materials and Methods
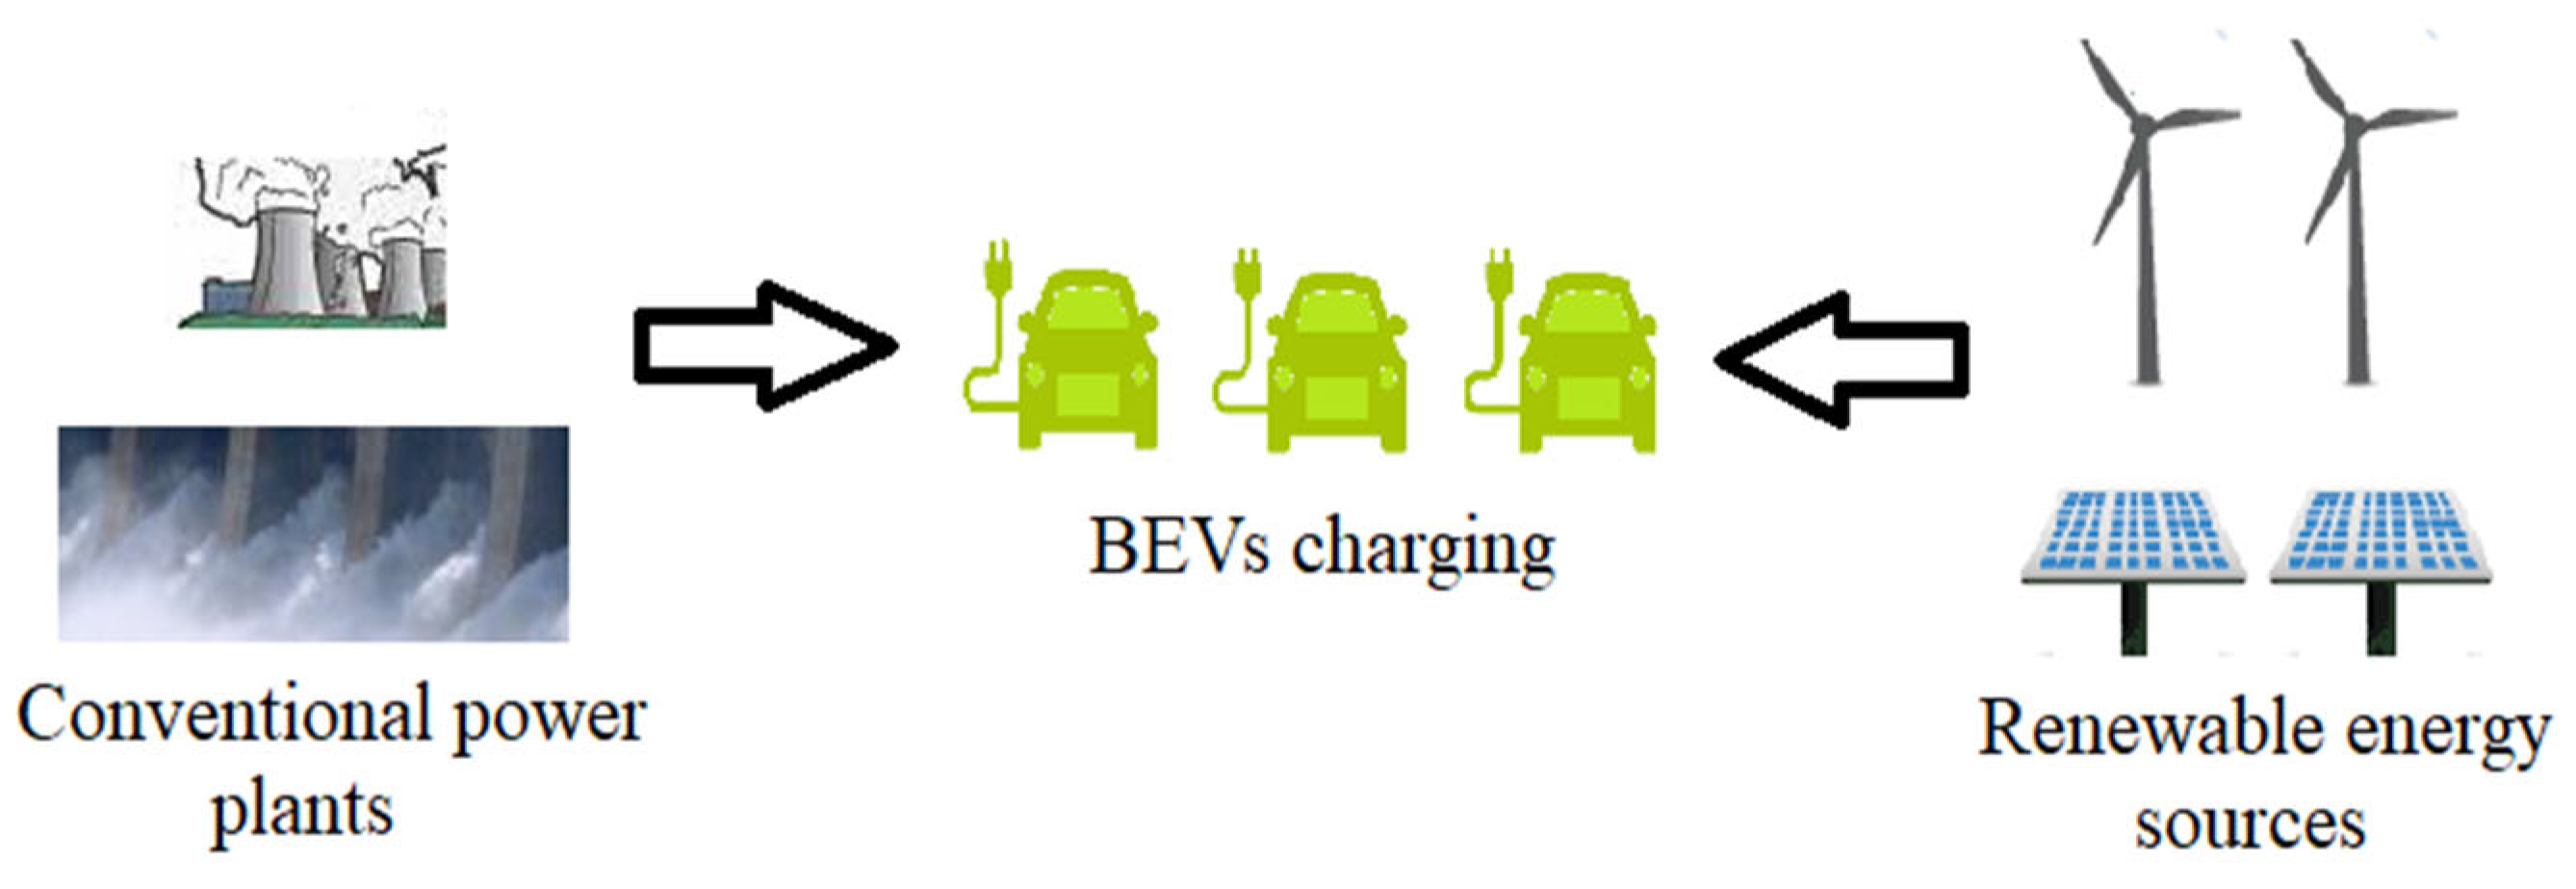
The power supplied to the outlets came from different sources, such as classic power plants (coal, nuclear, gas, and hydro) and renewable energy sources (solar, wind, and biomass) (Figure 1). Each of these sources had a different percentage in the power mix. Additionally, each of these sources has an impact on the environment due to their CO2 emissions.
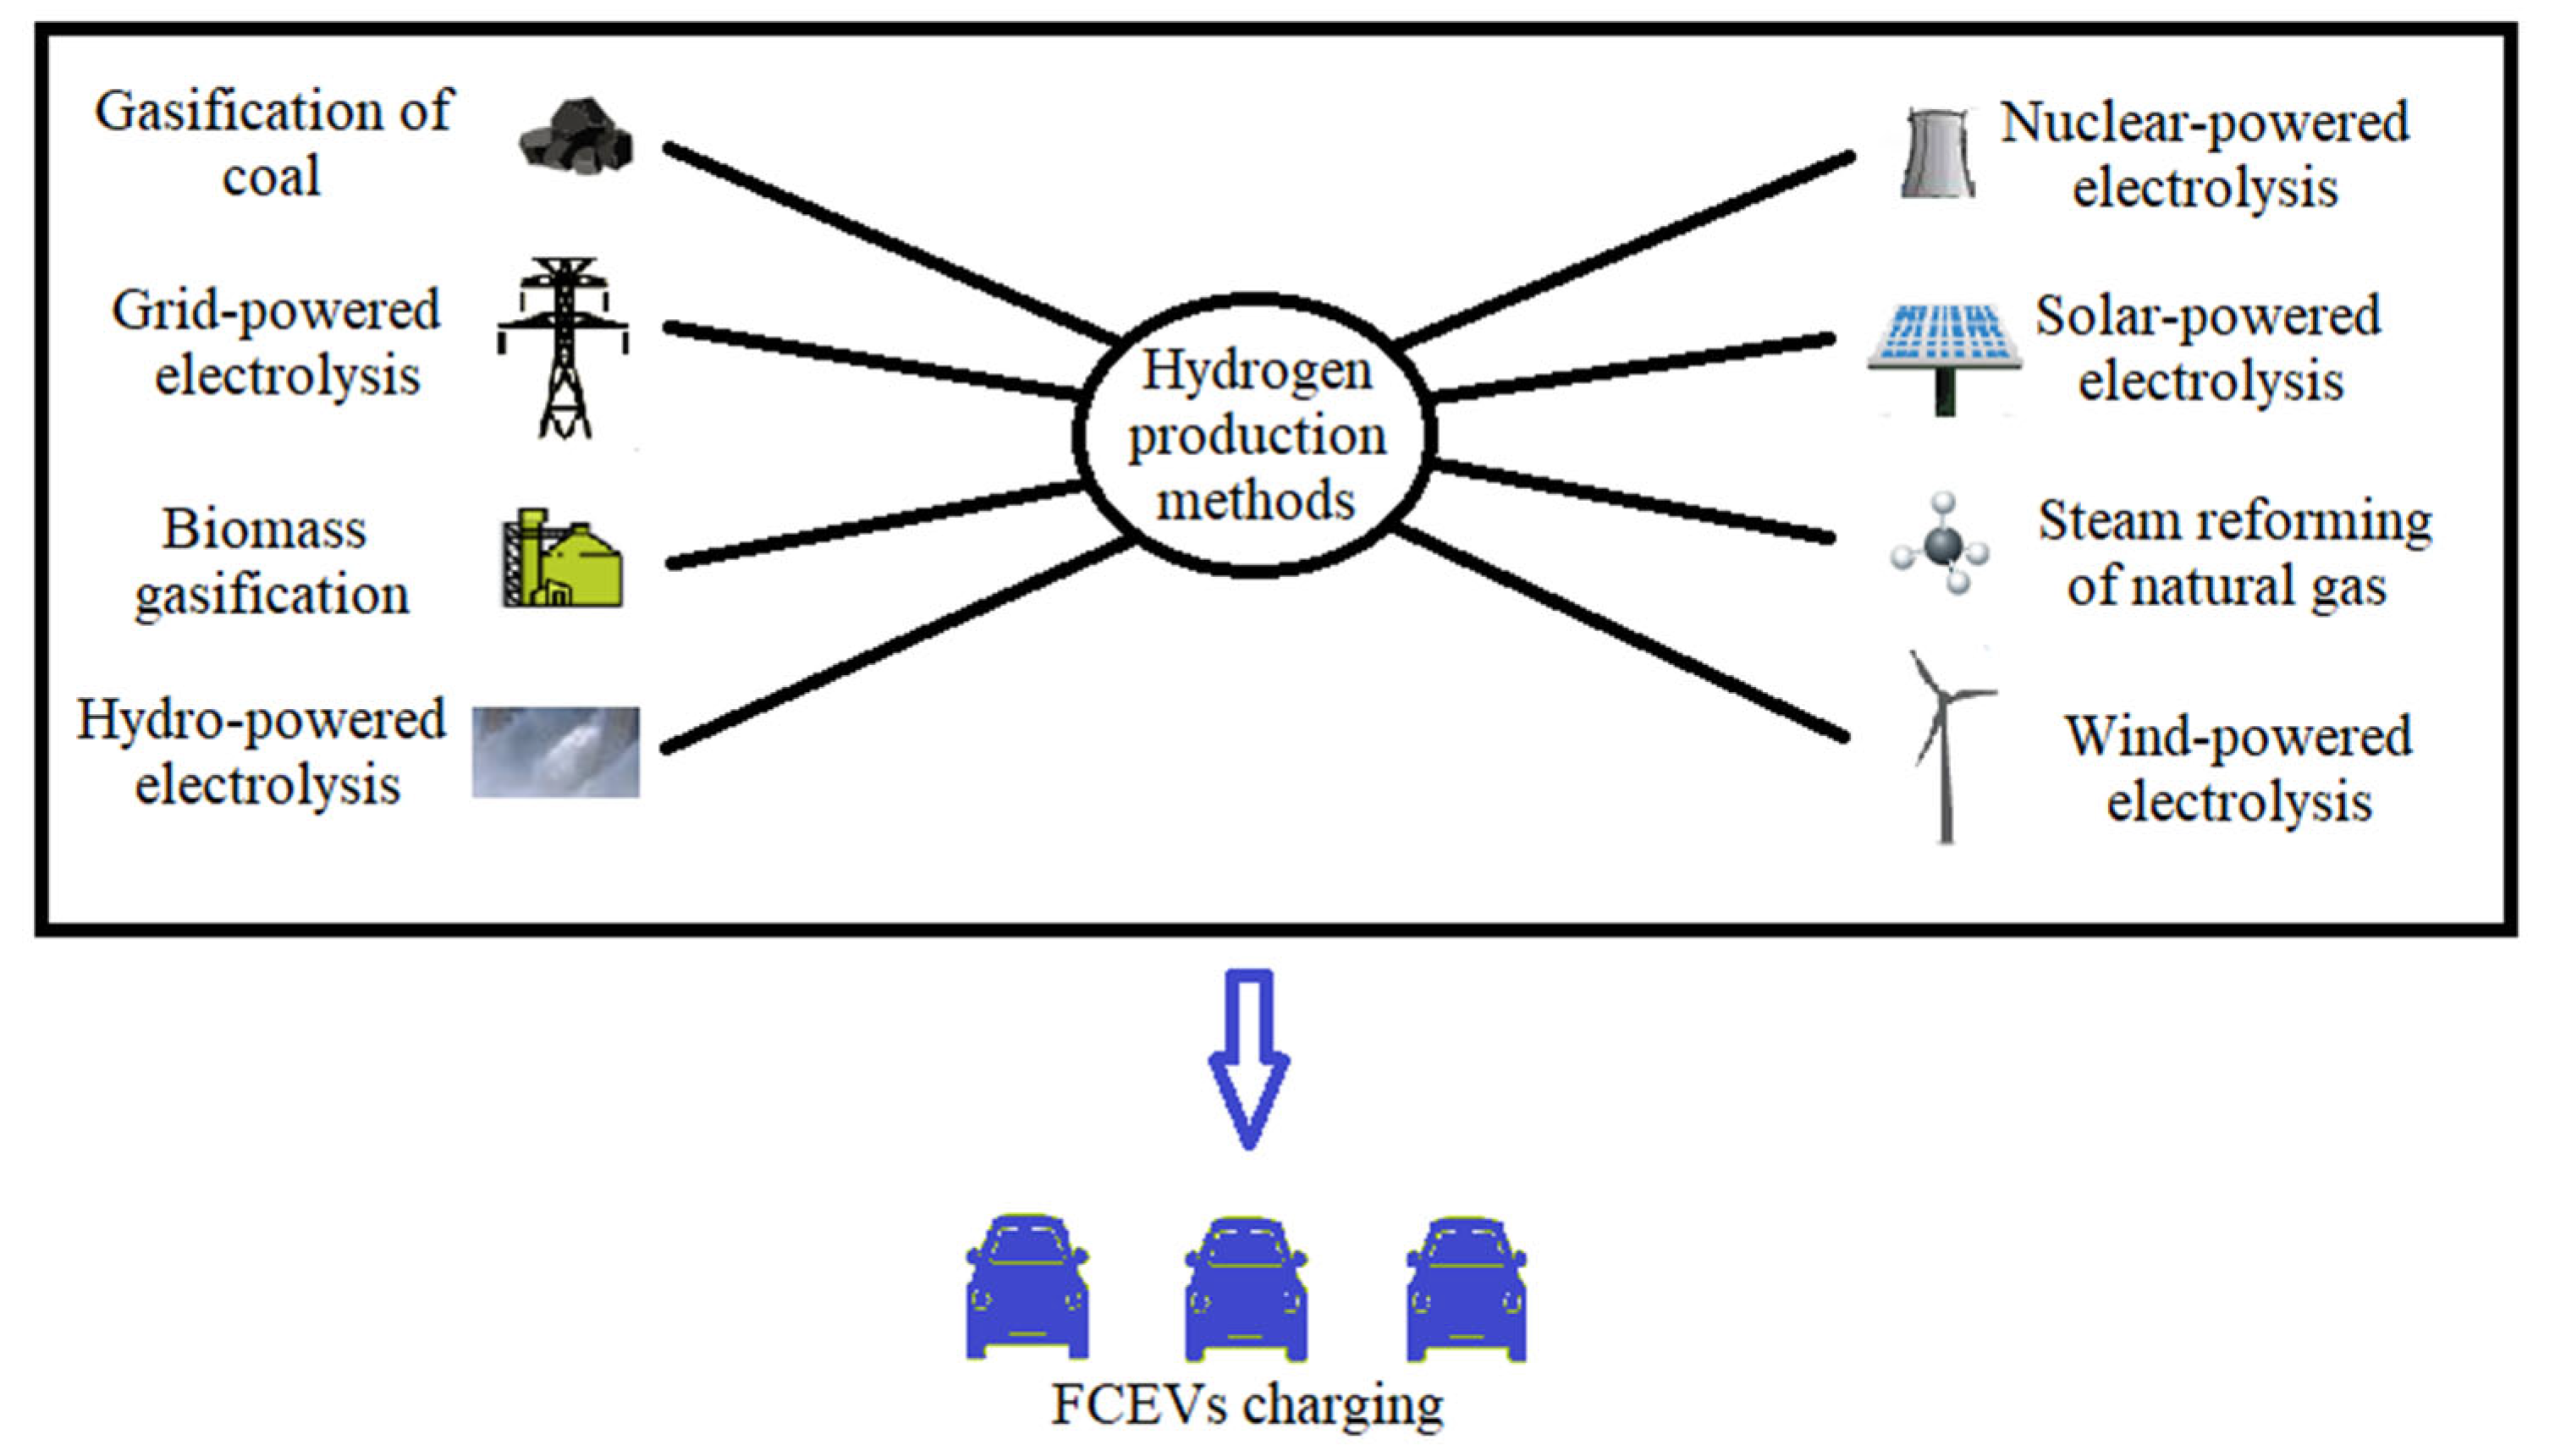
Hydrogen is a secondary energy carrier, which can be produced using various energy sources (e.g., gas, nuclear, and renewable) and production methods (e.g., steam reforming of natural gas, coal gasification, and electrolysis) [19,27,28,42] (Figure 2). Additionally, each of these hydrogen production methods have an impact on the environment. Therefore, the BEVs and FCEVs has an impact on CO2 emissions due to the production of their fuel (power or hydrogen).
The CO2 emissions for different types of power plants are presented in Table 1.
The CO2 emissions from different percentages in the power mix, BEVs, and annual distances traveled are calculated using the following equations.
First, the CO2 emissions from the power sources is calculated:
where PSE represents the total power source emissions in gCO2/kWh, ai represents the CO2 emissions from the power source in gCO2/kWh, and bi represents the share of the particular power source in the power mix.
Second, the CO2 emissions considering BEV fuel consumption are calculated:
where BEVE represents the total emissions of the battery electric vehicle in gCO2/km, and FC represents the fuel consumption in kWh/km.
Third, the CO2 emissions for the BEV considering the annual distance traveled is calculated:
where BEVEDT represents the total emissions of the vehicle in gCO2 considering the annual distance traveled, and DT represents the annual distance traveled in km. The annual distance traveled is considered to be 12,000 km.
Fourth, the CO2 emissions for BEVs considering the range of the vehicle (or one full charge of the battery) are calculated:
where BEVER represents the total emissions of a particular BEV in gCO2 considering the range of the vehicle, and DR represents the range in km.
Fifth, the CO2 emissions during a year considering the number of BEVs are calculated:
where BEVEN represents the total emissions of the BEVs considering the number of vehicles in gCO2, and NB represents the number of BEVs.
For the calculation of the CO2 emissions, the currently installed capacity of the power plants in Romania at the end of 2022 [64] was considered and is presented in Table 2. Additionally, considering the fact that, in Romania, the power mix is different due to the seasons, several days were selected based on reports from [65]. The power mix for the selected days is presented in Table 3.
Considering the installed capacity of the power plants in Romania, the CO2 emissions calculated using Equation (1) are 202.75 gCO2/kWh. If the power mix for the selected days is considered, then the CO2 emissions are 303.55 gCO2/kWh (on 4 March 2022), 246.49 gCO2/kWh (on 29 April 2022), 240.57 gCO2/kWh (on 11 August 2022), 313.96 gCO2/kWh (on 16 November 2022), and 275.33 gCO2/kWh (on 5 December 2022).
The following BEVs from Table 4 were selected, which were several of the most-sold models in 2022 in Europe and USA [66,67]. In Romania, a total of 23,221 BEVs, of which 10,000 are Dacia Spring [68], were registered in 2022. Additionally, the battery capacity, charging time, range, and fuel consumption of these vehicles is different [69].
The CO2 emissions considering hydrogen production methods, fuel cell electric vehicles, and the annual distance traveled were calculated using the following equations.
First, the CO2 emissions considering FCEV fuel consumption are calculated:
where FCEVE represents the total emissions of the hydrogen fuel cell vehicle in gCO2/km, EHP represents the CO2 emissions during hydrogen production in gCO2/kg, and FCH represents the fuel consumption in kg/km.
Second, the CO2 emissions for FCEVs considering the annual distance traveled are calculated:
where FCEVEDT represents the total emissions of an FCEV in gCO2, considering the annual distance traveled.
Third, the CO2 emissions for FCEVs considering the range of the vehicle (or one full charge of the hydrogen tank) are calculated:
where FCEVER represents the total emissions of a particular FCEV in gCO2, considering the range of the vehicle.
The CO2 emissions for different hydrogen production methods are presented in Table 5.
The analysis was performed using the MATLAB software [73].
4. Results
The results are presented in Table 7 (CO2 emissions for BEVs considering fuel consumption), Table 8 (CO2 emissions for BEVs considering the annual distance traveled), Table 9 (CO2 emissions for BEVs considering the driving range), Table 10 (CO2 emissions for FCEVs considering fuel consumption), Table 11 (CO2 emissions for FCEVs considering the annual distance traveled) and Table 12 (CO2 emissions for FCEVs considering the driving range).
The total CO2 emissions for a year considering the number of BEVs (10,000 Dacia Spring and 13,221 vehicles from other manufacturers) are as follows: 9,198,773.38 kgCO2 (considering the installed power of the power plants), 13,772,045.40 kgCO2 (considering the power supplied on 4 March 2022), 11,183,416.44 kgCO2 (considering the power supplied on 29 April 2022),10,914,829.05 kgCO2 (considering the power supplied on 11 August 2022), 14,244,468.85 kgCO2 (considering the power supplied on 16 November 2022) and 12,491,691.11 kgCO2 (considering the power supplied on 5 December 2022).
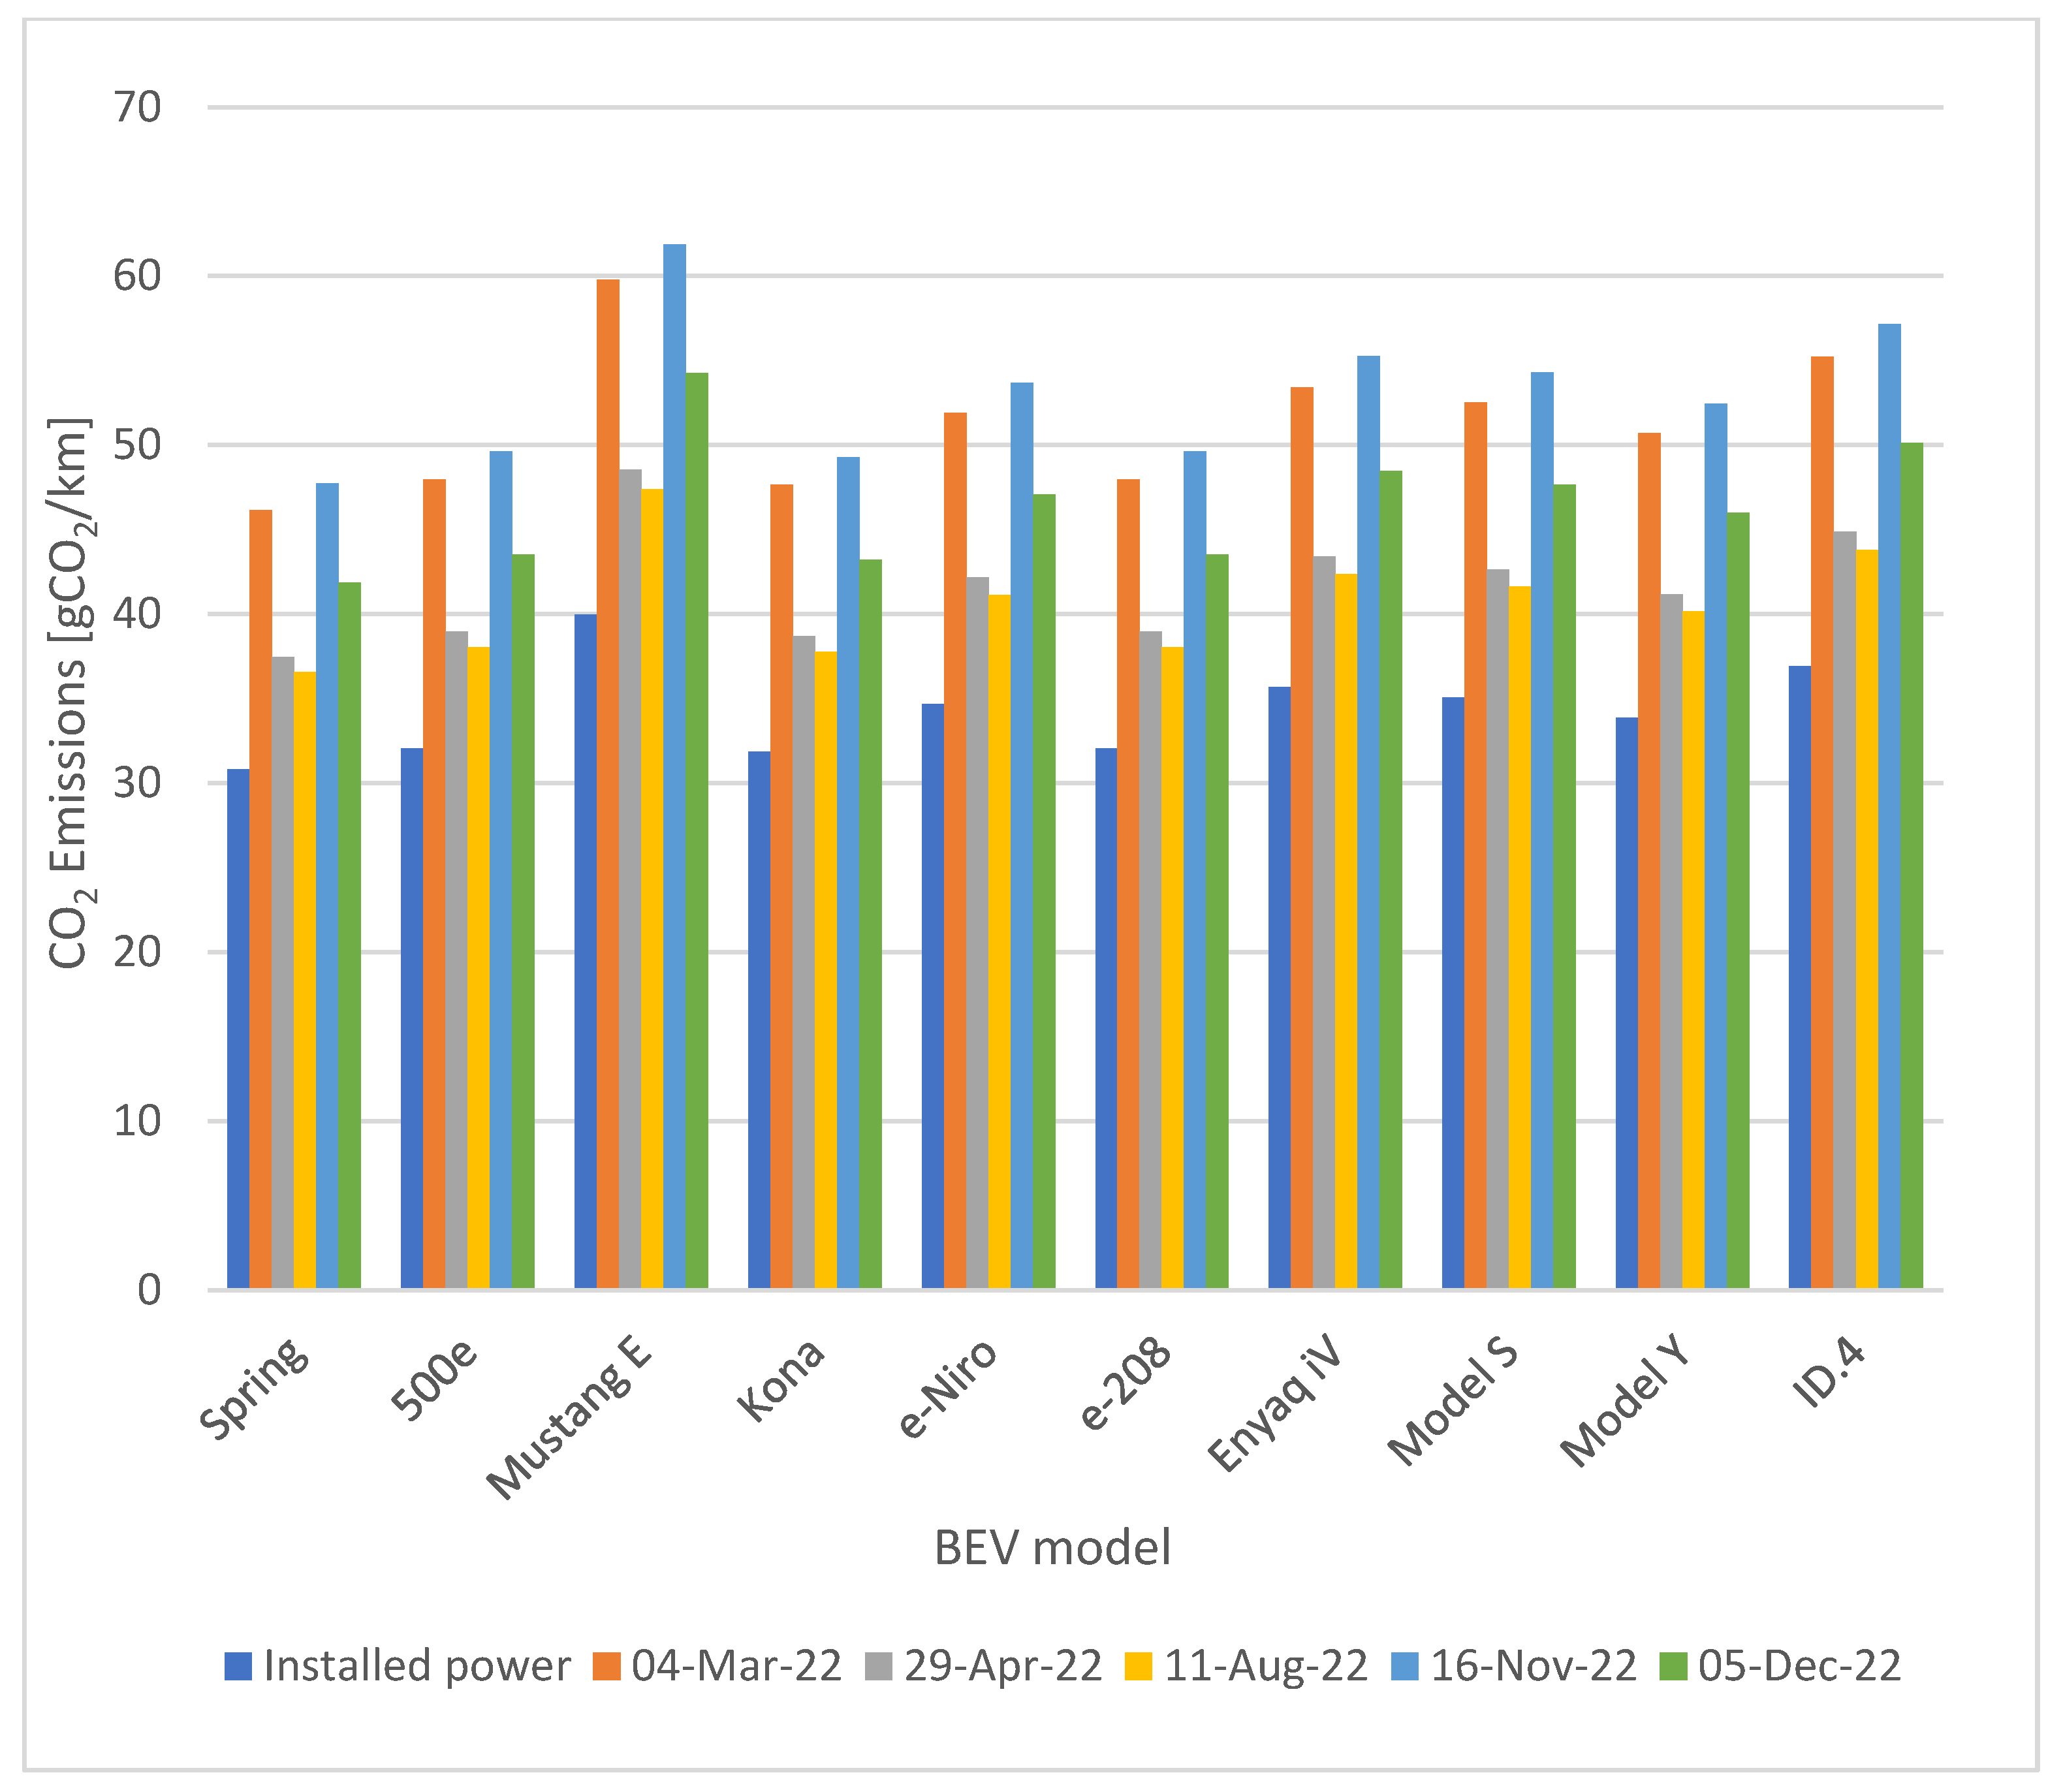
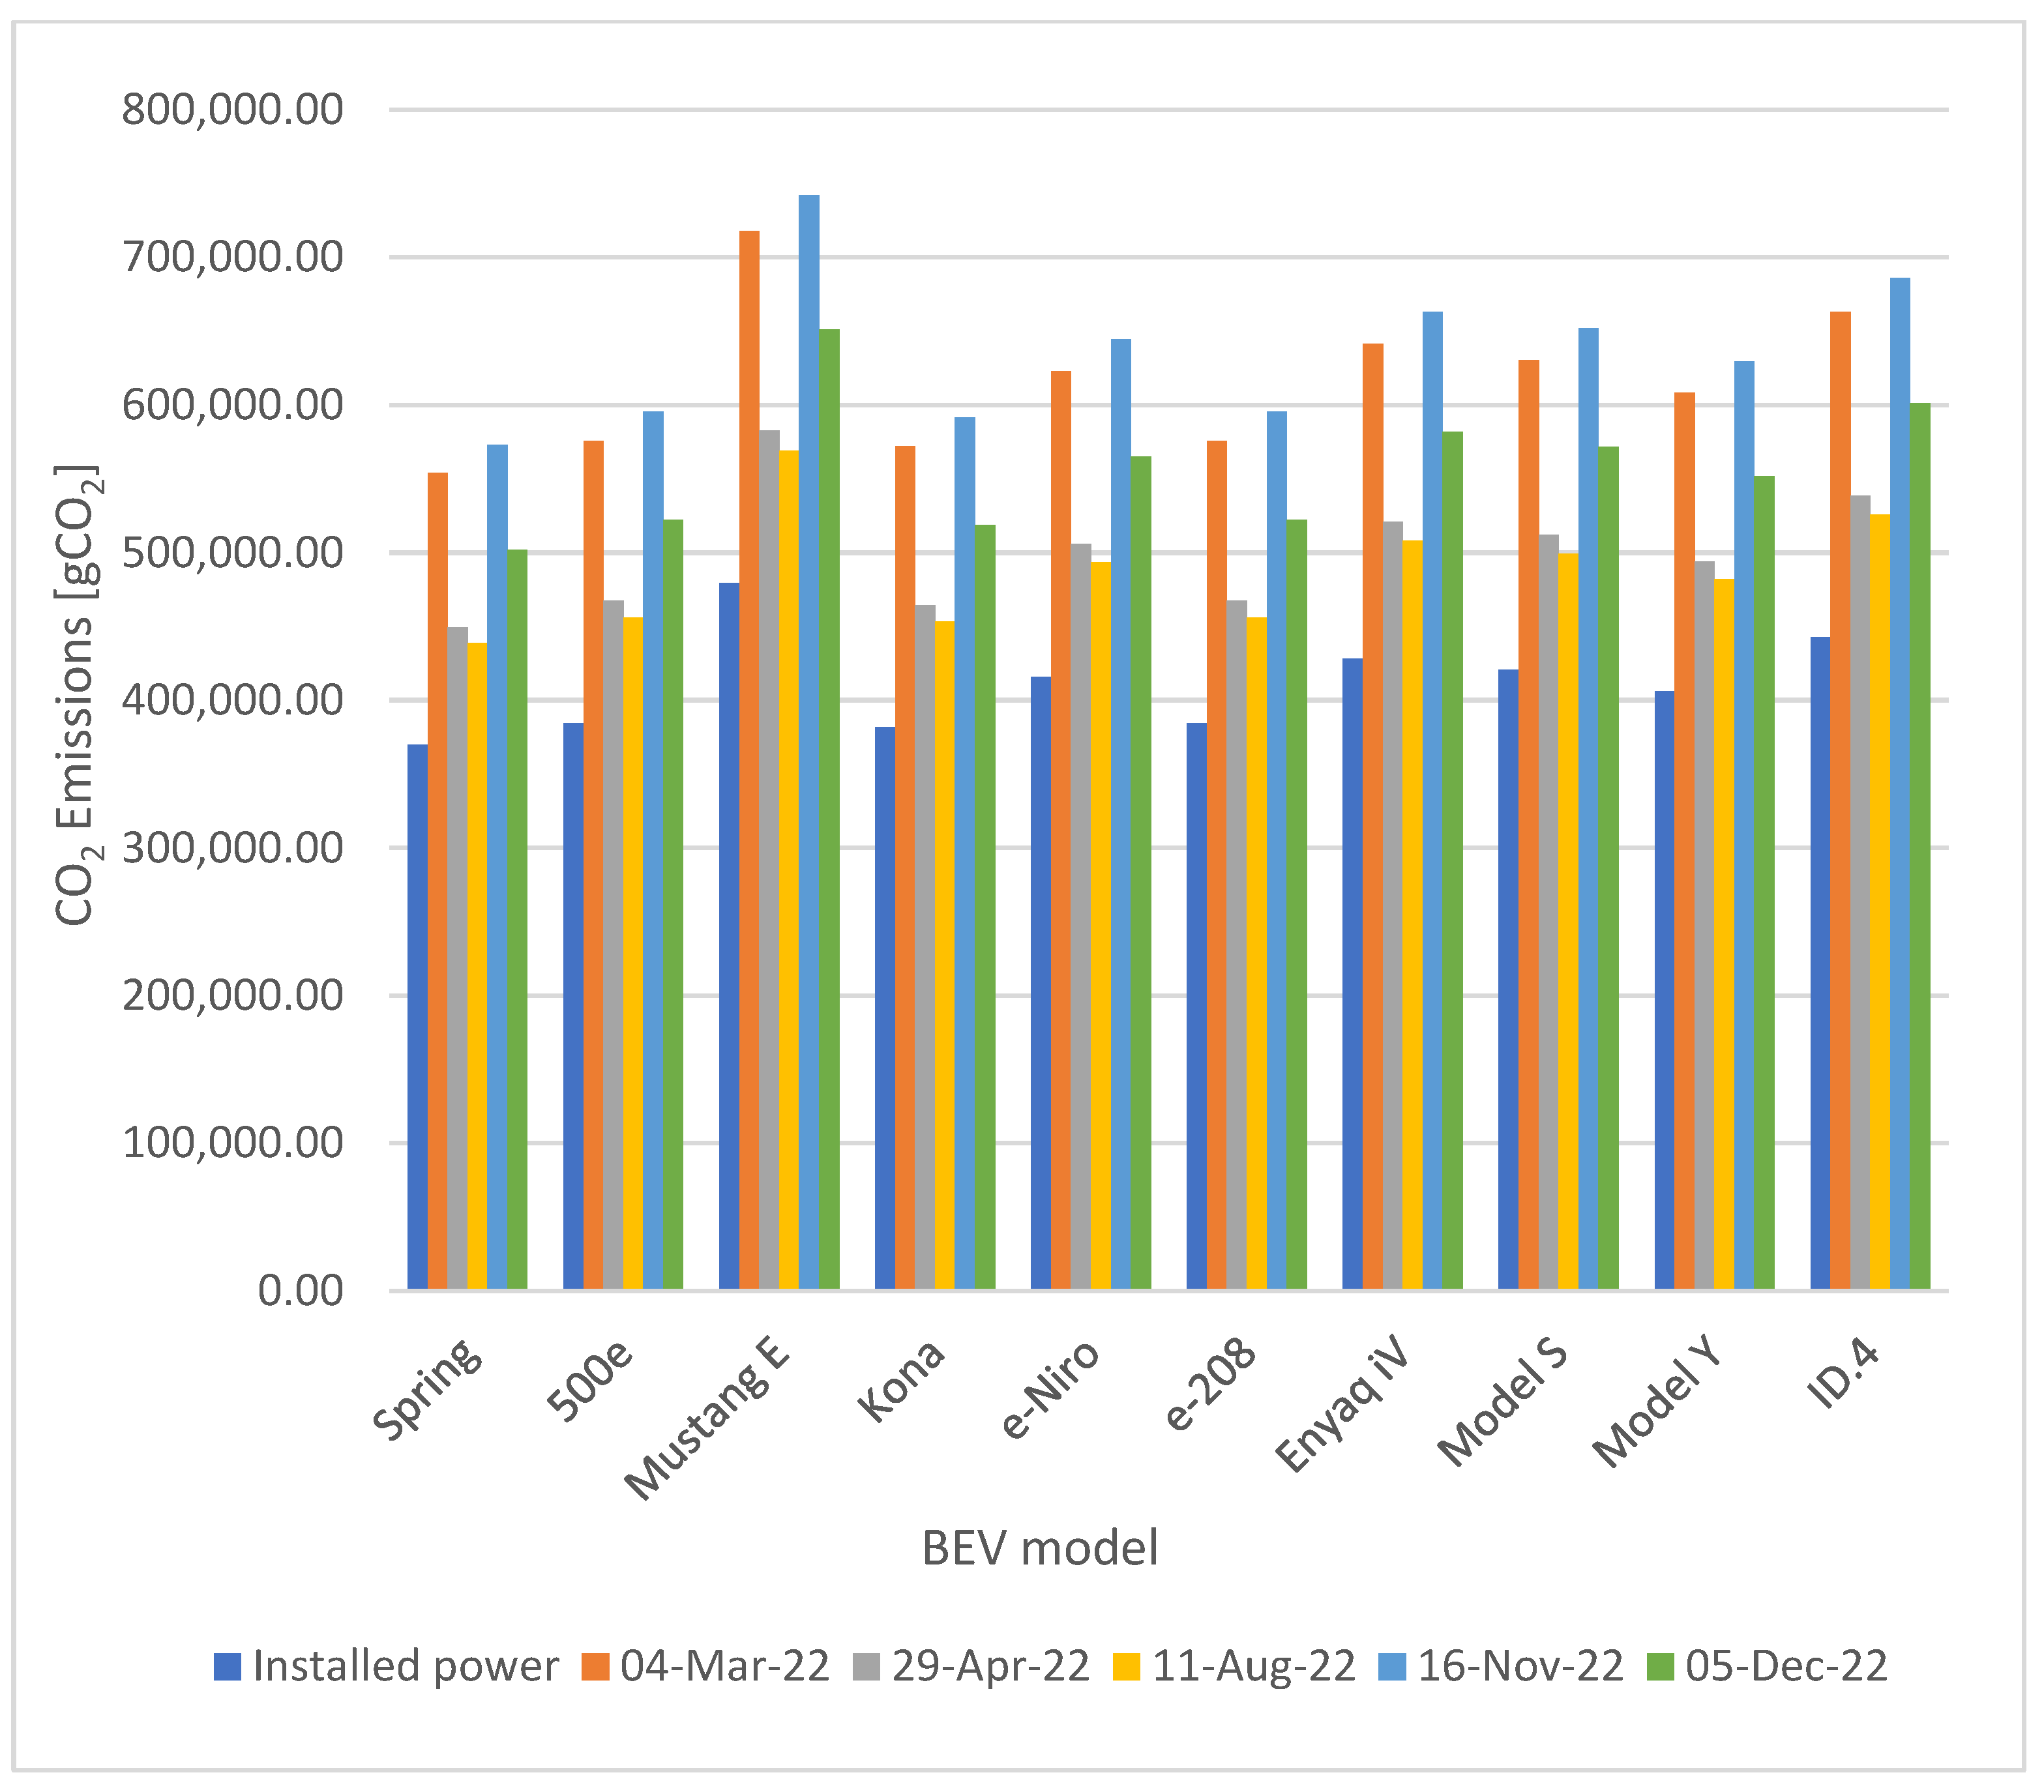
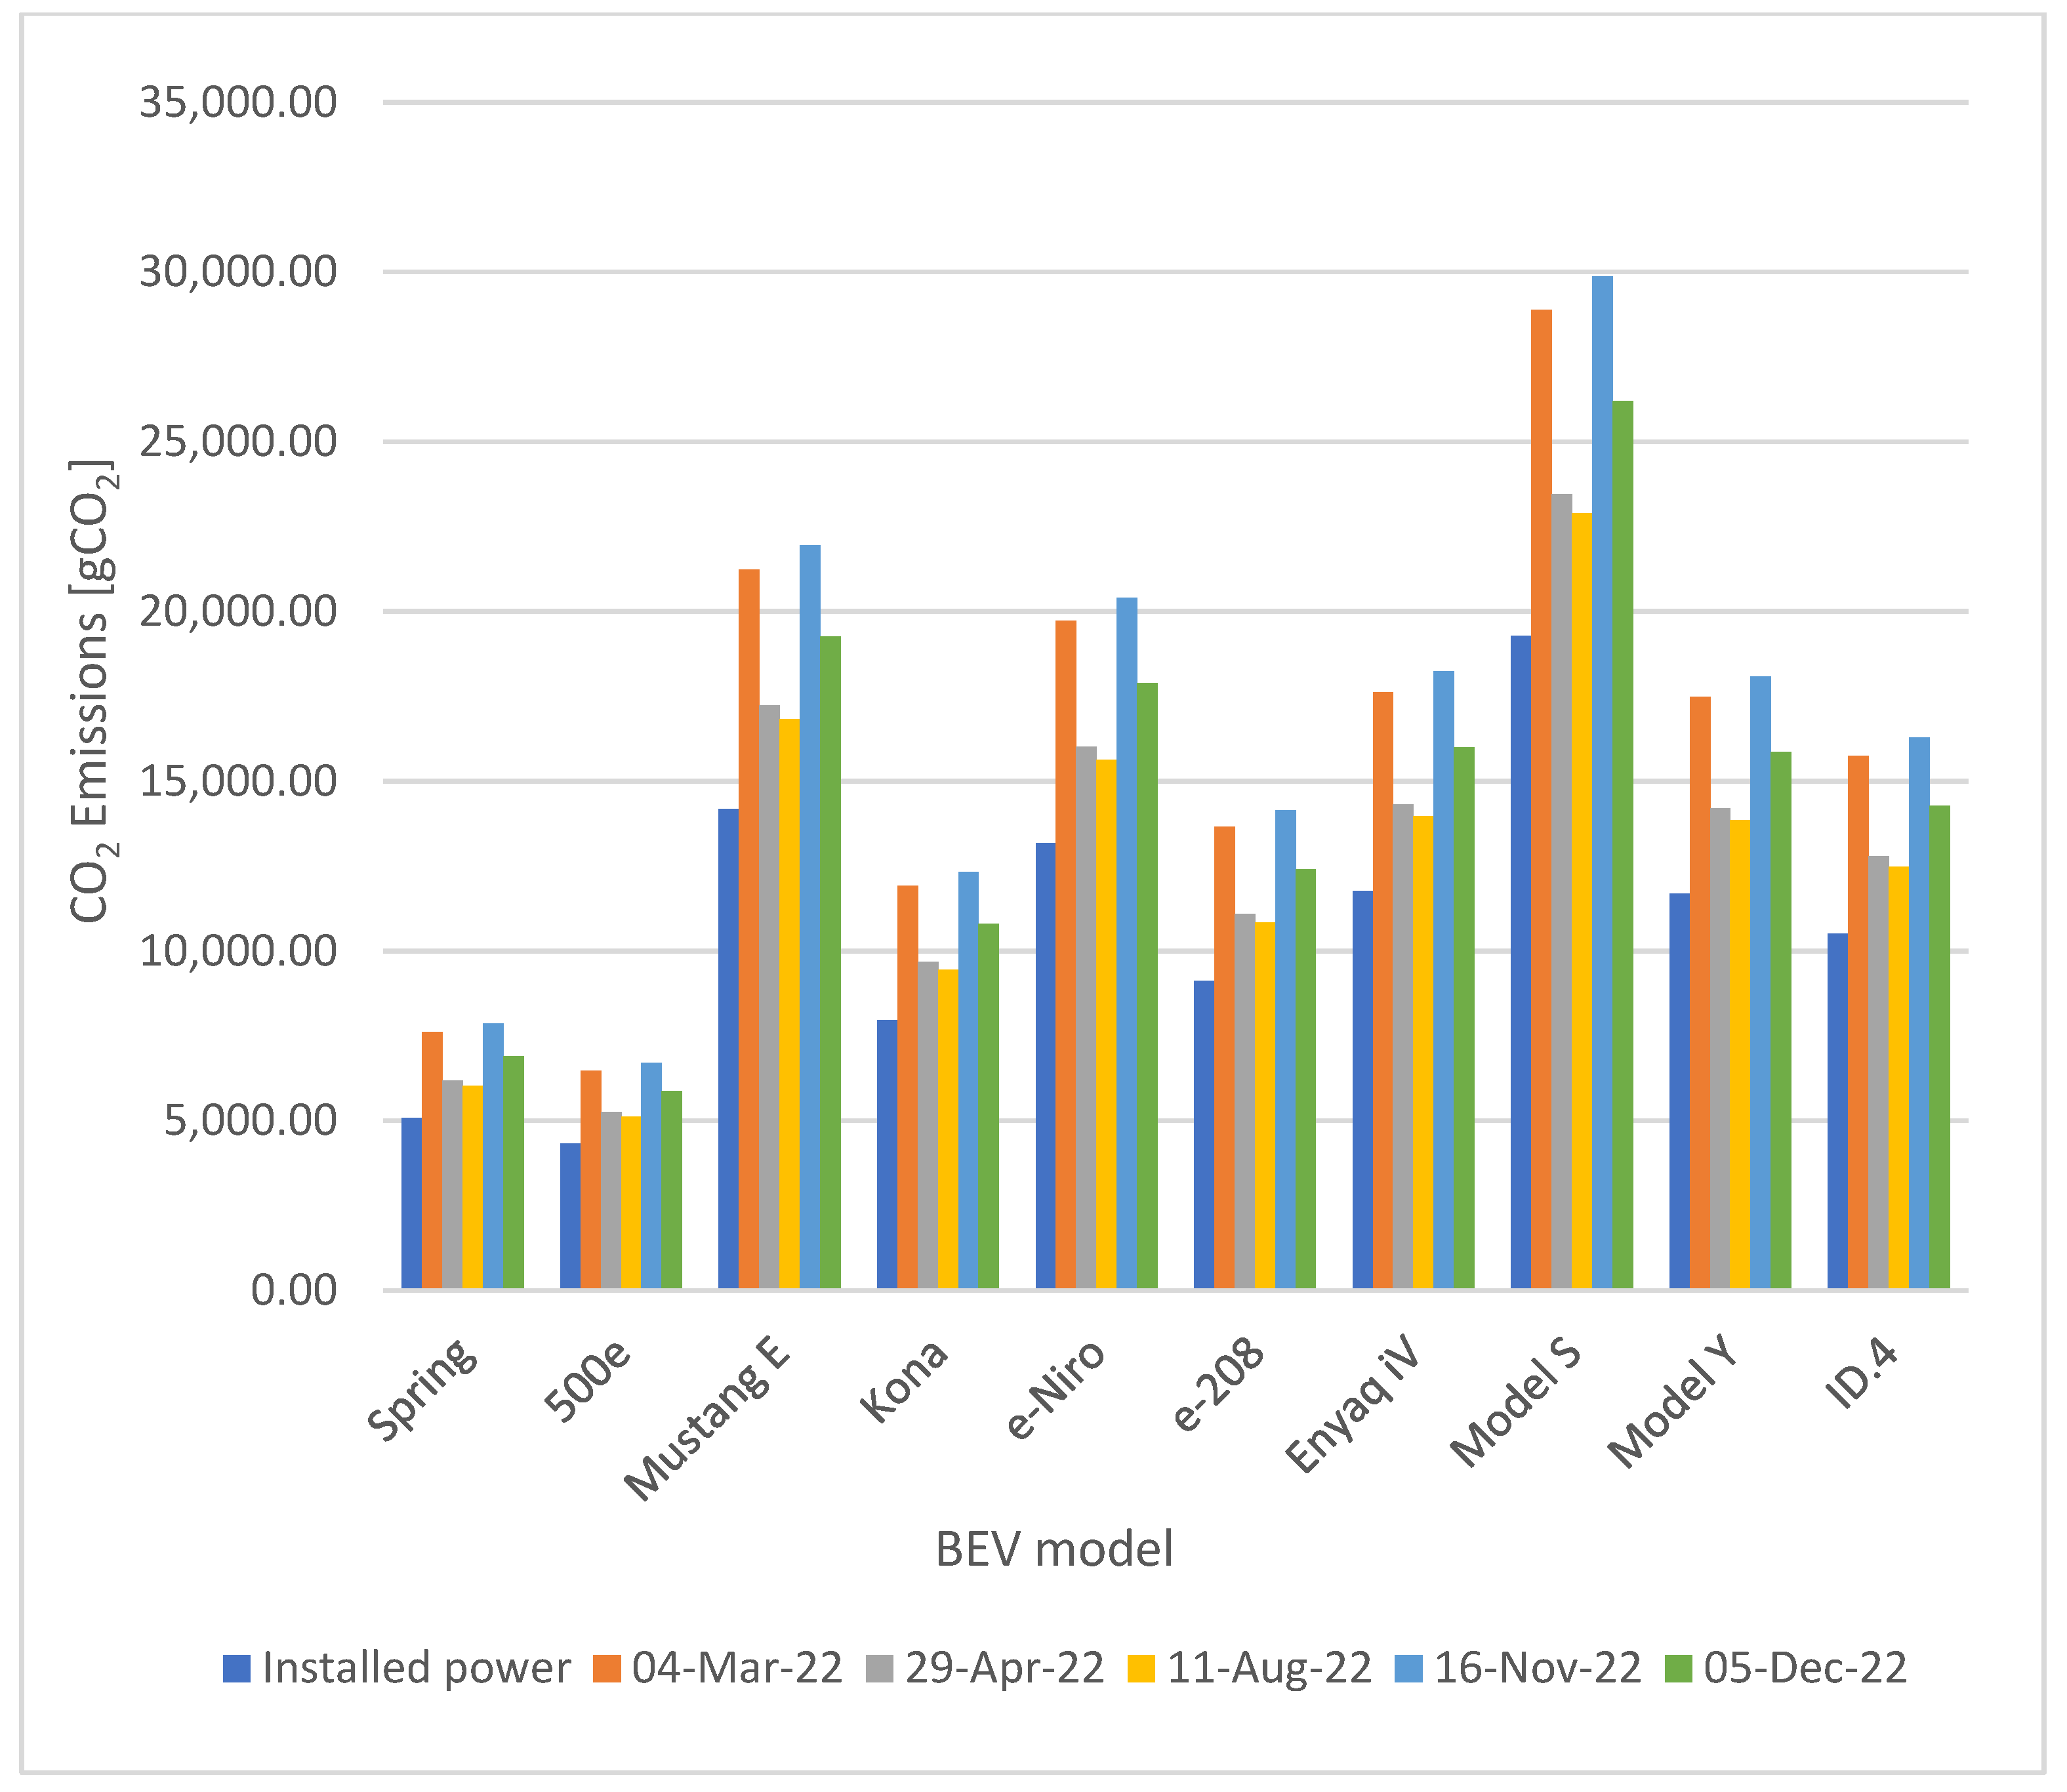
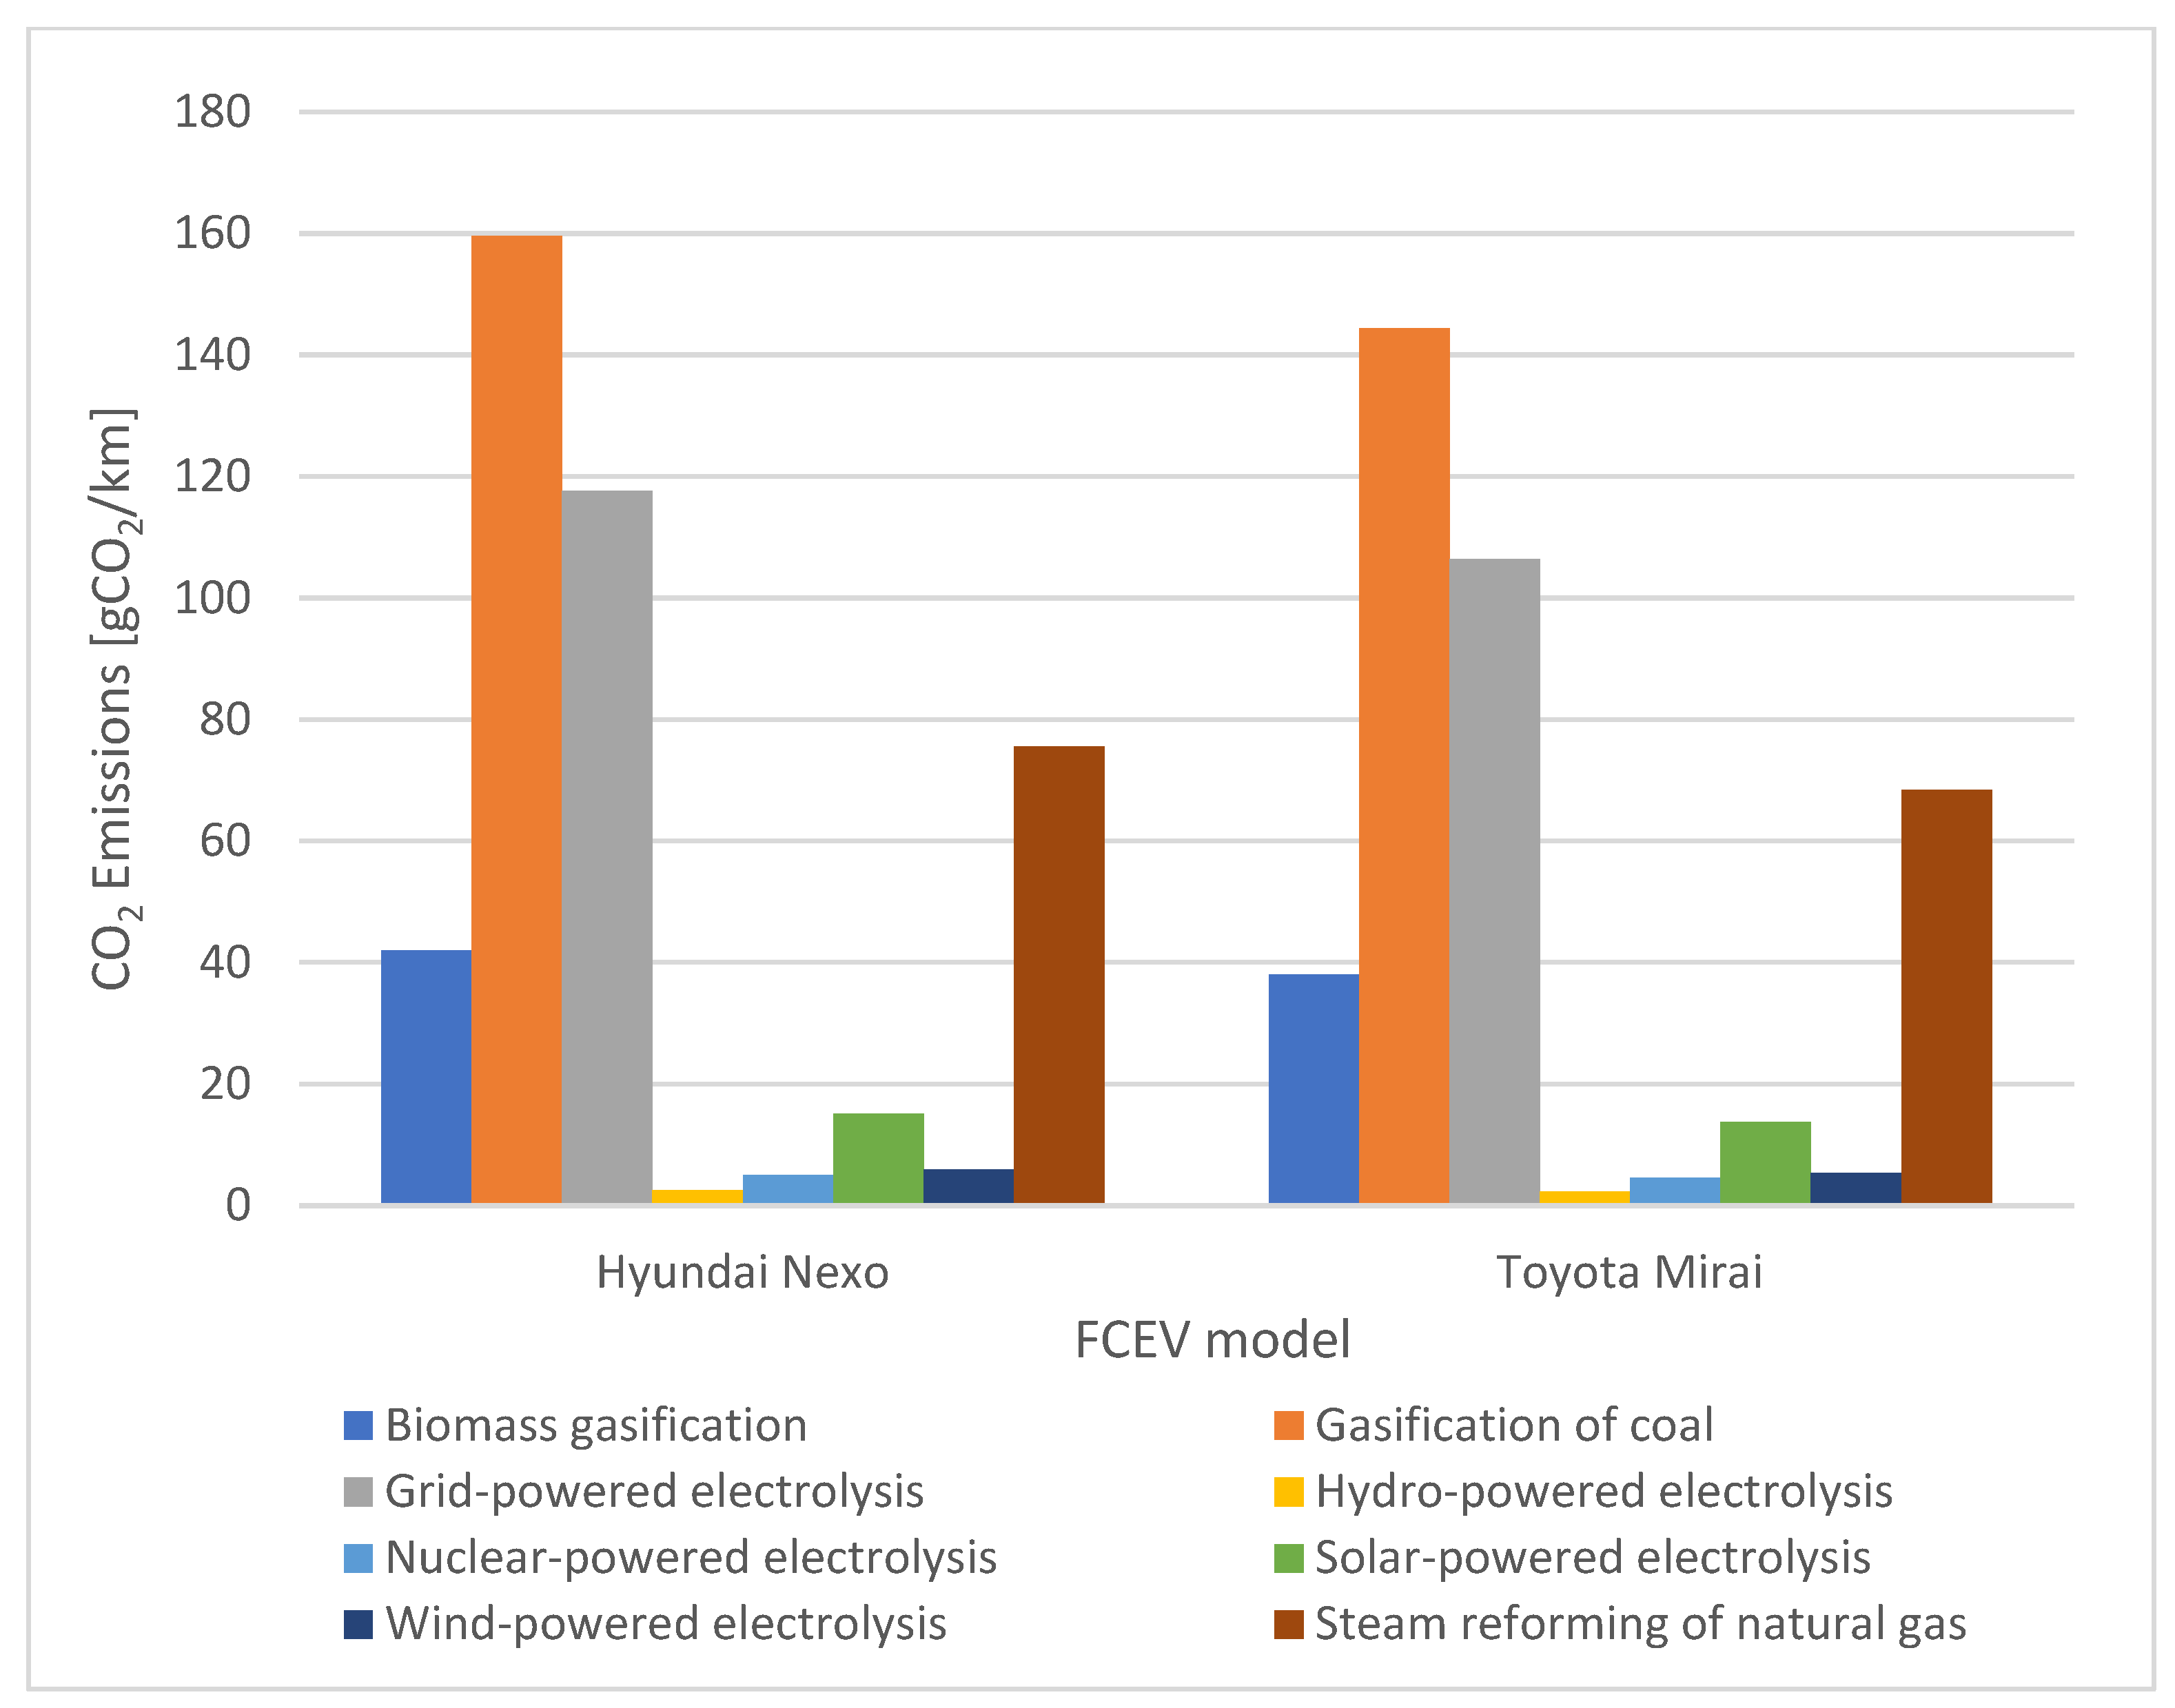
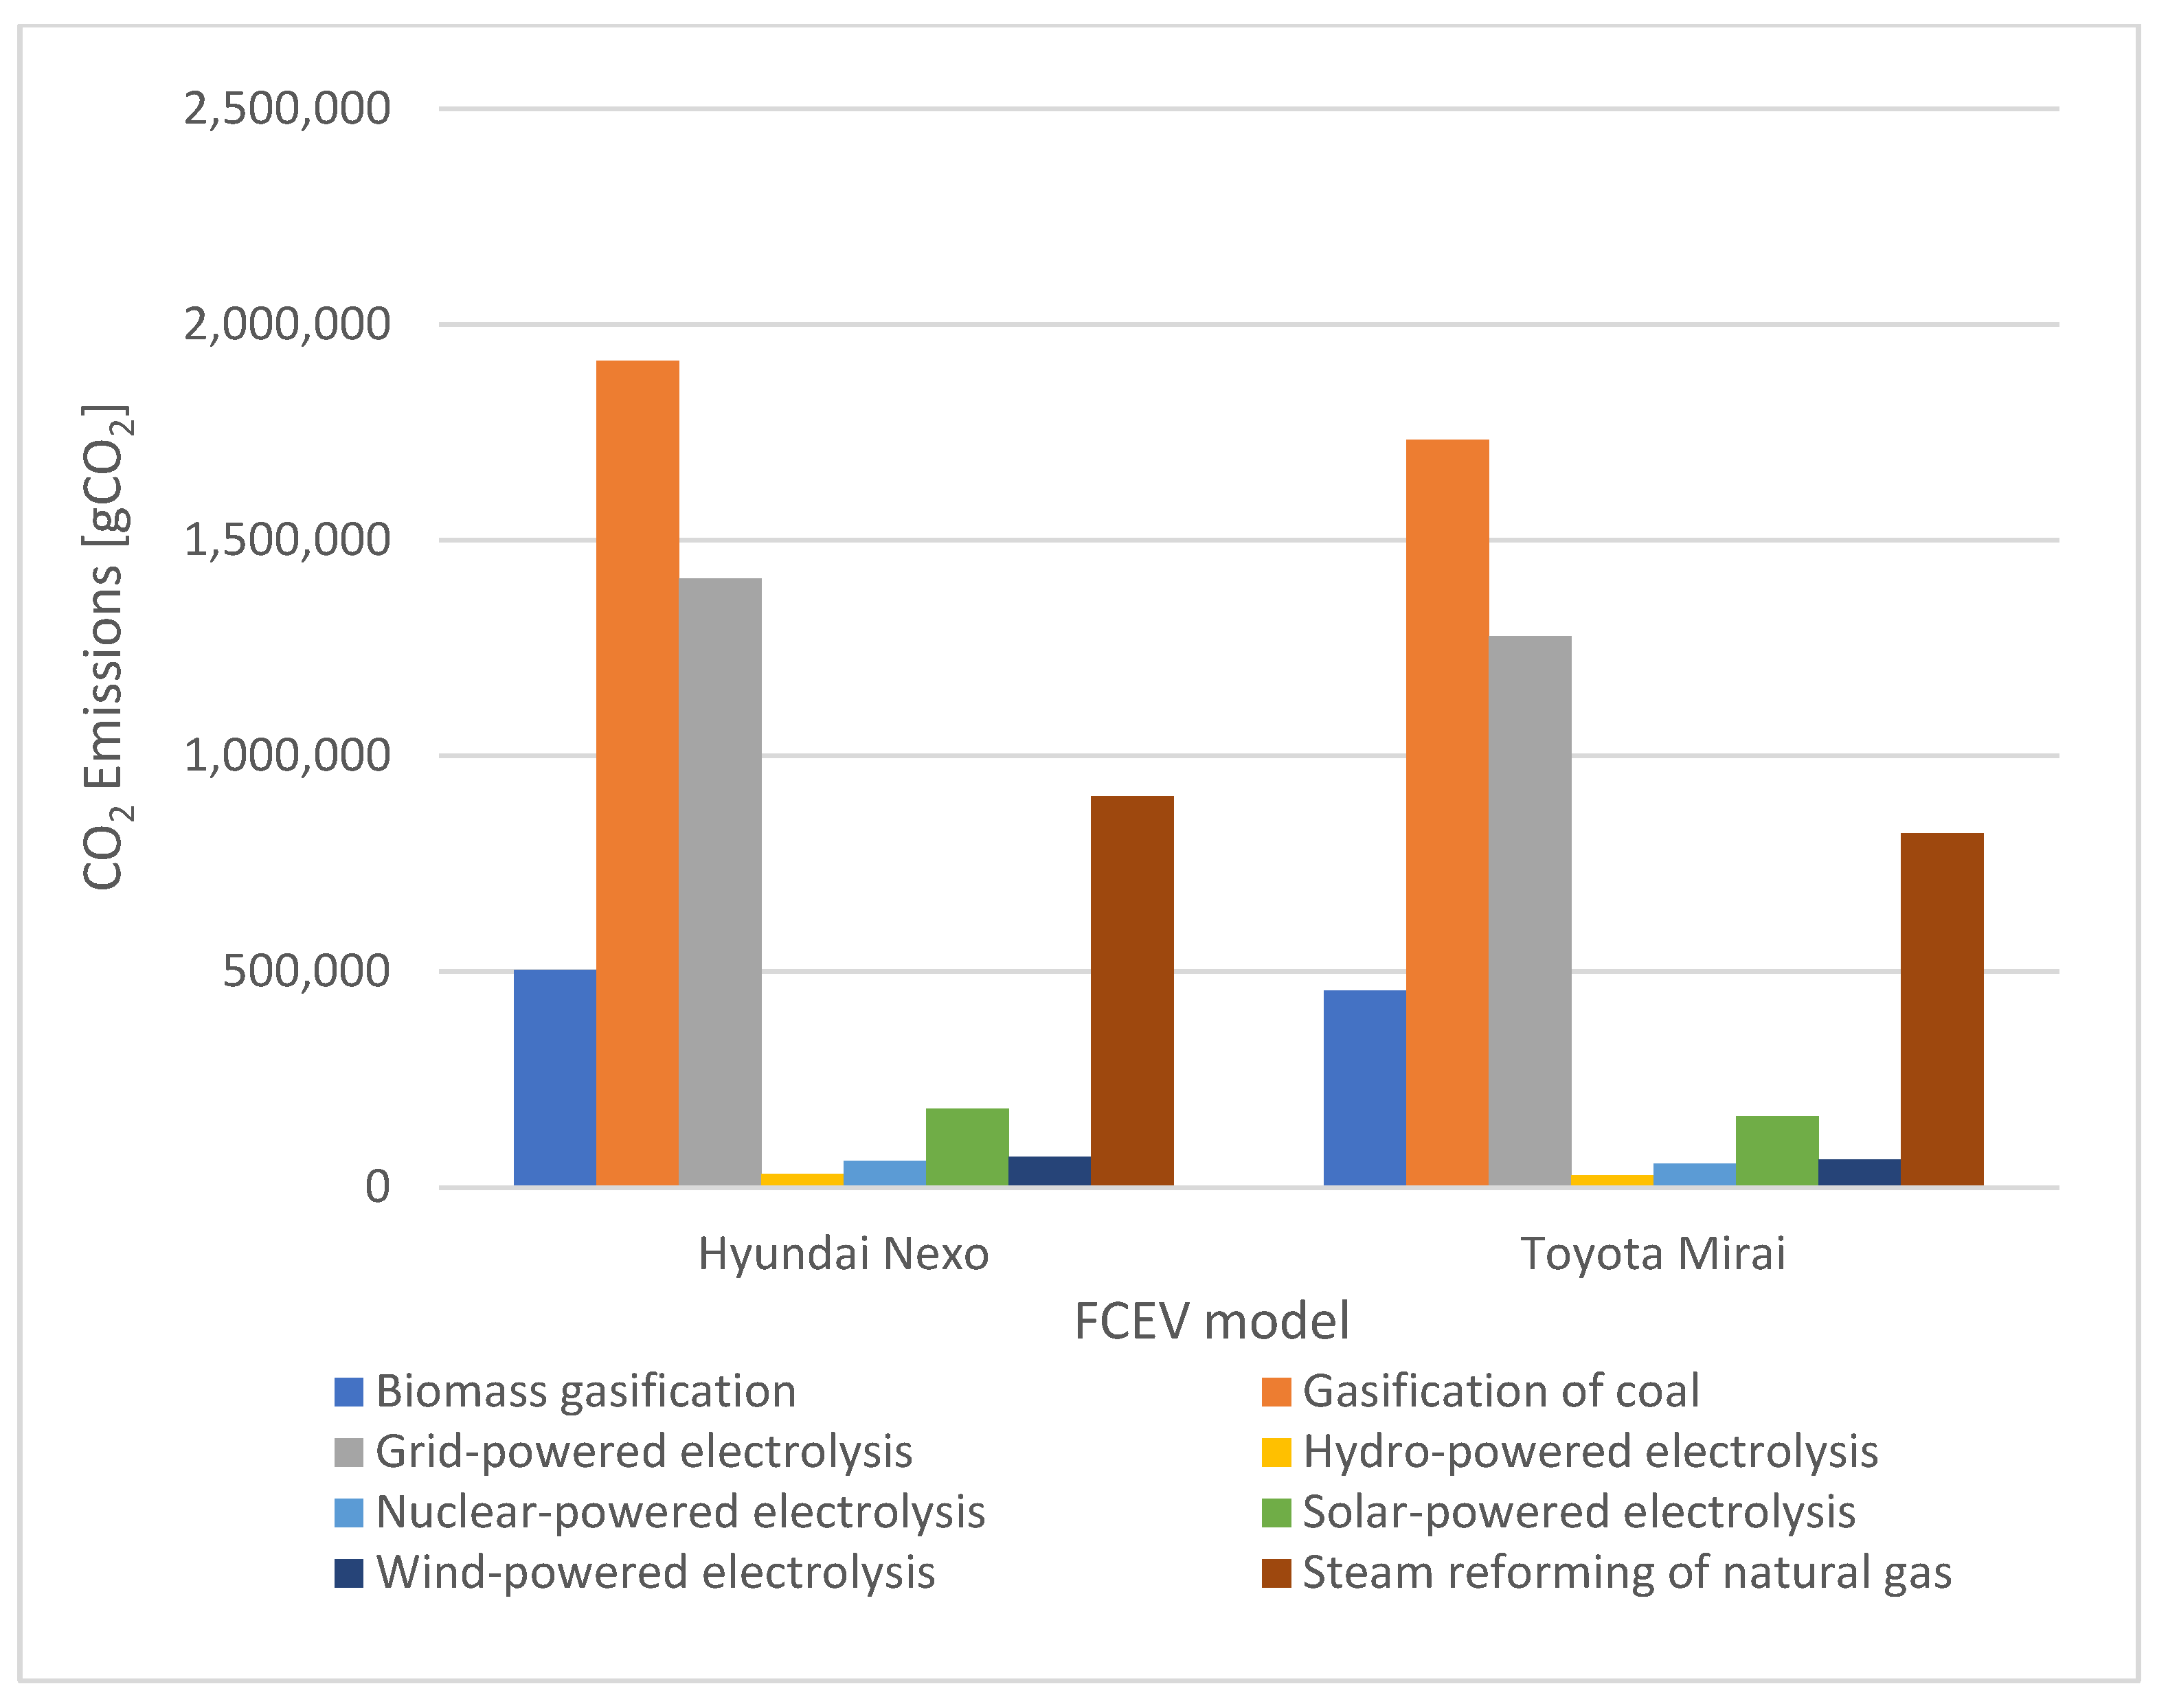
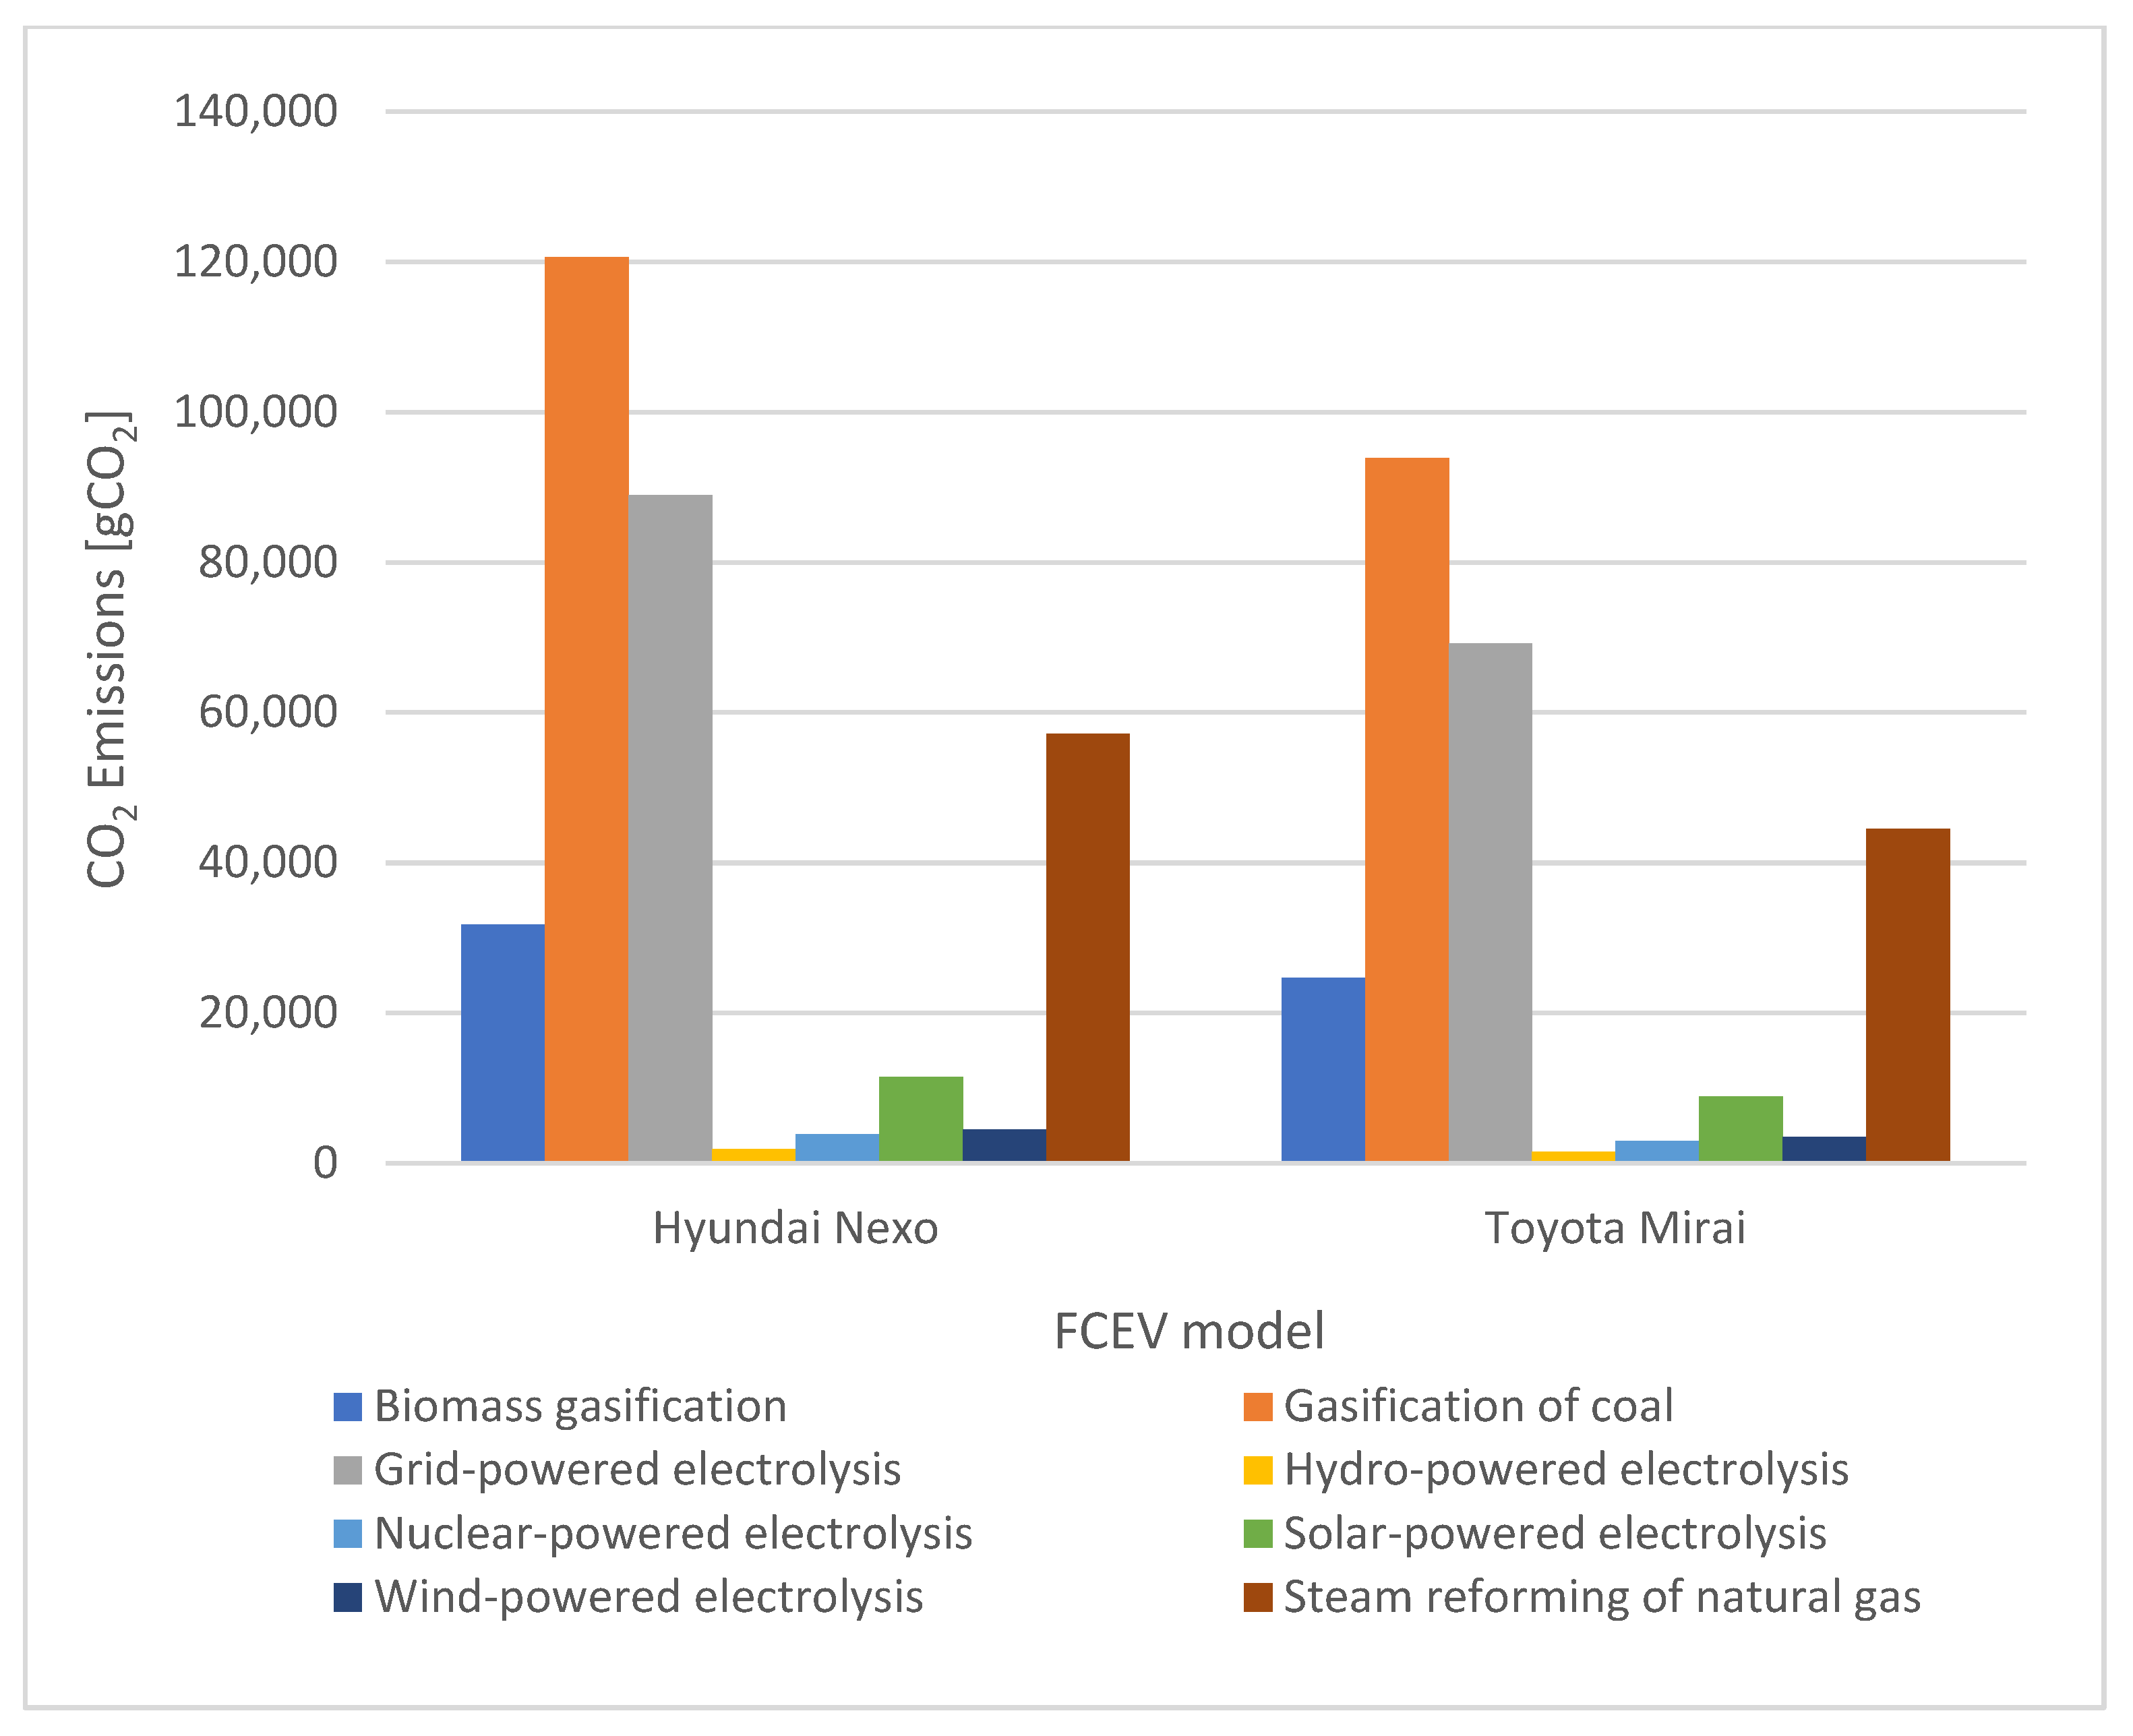
The results are also presented in Figure 3 (CO2 emissions for BEVs considering fuel consumption), Figure 4 (CO2 emissions for BEVs considering the annual distance traveled), Figure 5 (CO2 emissions for BEVs considering the driving range), Figure 6 (CO2 emissions for FCEVs considering fuel consumption), Figure 7 (CO2 emissions for FCEVs considering the annual distance traveled), and Figure 8 (CO2 emissions for FCEVs considering the driving range).
5. Discussion
First, the CO2 emissions of the BEVs were analyzed. The highest CO2 emissions occurred on 16 November 2022, when 46.87% of the total power was supplied by coal, gas, and biomass power plants, although the hydro, nuclear, solar, and wind power plants supplied 51.33% of the total power.
The lowest CO2 emissions were found in the case where BEV charging was performed in relation to the installed power of the power plants in Romania, where 71.32% of the total installed power comes from less pollutant sources (hydro, nuclear, solar, and wind power plants). The second lowest CO2 emissions occurred on 11 August 2022, when the less pollutant sources supplied 62.5% of the total power.
When it comes to the BEV model, the Spring, which has low fuel consumption, had the lowest CO2 emissions per kilometer, while the Mustang Mach-E RWD, with high fuel consumption, had the highest CO2 emissions per kilometer. If the emissions during a year are compared, then the Mustang is 29.6% more pollutant than the Spring. If one full charge of a battery is considered, then the lowest CO2 emissions are found for the Fiat 500 electric, which has the smallest battery and charges faster compared to the other models. Additionally, the highest CO2 emissions were found for the Tesla Model S, which has the biggest battery and requires more time to charge.
Second, the CO2 emissions of the FCEVs were analyzed. The highest CO2 emissions were found for the Nexo, which has a higher fuel consumption when compared to the Mirai. The highest CO2 emissions for both models were found for hydrogen that was obtained via the gasification of coal. The lowest CO2 emissions for both models were found for hydrogen that was obtained by hydro-powered electrolysis. The second lowest CO2 emissions for both models were found for hydrogen that was obtained by nuclear-powered electrolysis. If the highest and lowest CO2 emissions per kilometer are compared, then the latter is 6333.33% lower. Additionally, if the CO2 emissions per kilometer for the hydrogen obtained via the steam reforming of natural gas are compared with the hydrogen obtained via hydro-powered electrolysis, then the latter is 3000% lower. The problem with the CO2 emissions from FCEVs is that most of the hydrogen on the market is produced via the gasification of coal or the steam reforming of natural gas.
Third, the CO2 emissions per kilometer and during a year for BEVs and FCEVs were compared. FCEVs have much lower emissions when considering hydrogen that is obtained from renewable energy sources and nuclear power. If the hydrogen is obtained from a more pollutant source, then the CO2 emissions of FCEVs are higher for hydrogen obtained via the gasification of coal, the steam reforming of natural gas, and grid-powered electrolysis. The emissions are lower for hydrogen that is obtained via biomass gasification.
Fourth, the CO2 emissions of BEVs and FCEVs were compared to those of a conventional combustion engine vehicle. When considering the average CO2 emissions of new passenger vehicles sold in the European Union (110 g CO2/km) [74], the BEVs and FCEVs have lower emissions in most cases. The CO2 emissions are higher for the FCEVs if hydrogen is obtained via the gasification of coal or grid-powered electrolysis. Another aspect worth mentioning is the peculiarity of the CO2 production associated with BEVs and FCEVs when compared to conventional combustion engine vehicles. The power plants are usually located outside cities, while the oil refineries are typically located on the outskirts of a city.
So, BEVs have a smaller impact on the environment regarding CO2 emissions, while FCEVs are highly dependent on the hydrogen production method and have a significant impact on the environment if the hydrogen is obtained from pollutant sources. Similar conclusions have been reached by other researchers. In [25], BEVs had a smaller impact on the environment when compared to vehicles that rely on internal combustion engines, while FCEVs had a higher impact on the environment compared to vehicles that rely on internal combustion engines. In [60], a reduction in emissions was observed for FCEVs that were supplied with hydrogen that was obtained using renewable energy sources. In [38], the impact of FCEVs on the environment was predicted to be similar to that of gasoline vehicles by around 2040 due to advances in hydrogen production.
If other emissions are considered, such as the emissions associated with the production process of batteries and fuel cells and of the entire vehicle, then the results vary according to the reference used. Therefore, the results vary according to the different kinds of materials that are used by various manufacturers and the location of the production facility. Therefore, pollution must be evaluated by considering the countries where car parts and storage systems are manufactured. For example, if a compact car is considered, the production emissions correspond to 9.59 t CO2 eq. in China, while in the USA, they are 6.24 t CO2 eq. [7]. The production emissions of the batteries were estimated to be between 61.6 kg CO2 eq./kWh and 106 kg CO2 eq./kWh [7]. Battery recycling can help reduce the CO2 emissions of BEVs by 34% [8]. If the entire production process is considered, then the total emissions are 8 t for internal combustion vehicles, 11 t for BEVs, and 9 t for FCEVs [7], so the BEVs and FCEVs have higher emissions during the production process. If the total emissions, including production and utilization, are considered, the emissions of BEVs and FCEVs are still lower when compared with an internal combustion vehicle.
6. Conclusions
The number of BEVs and FCEVs produced has increased during recent years due to measures taken to promote them, and the numbers will keep growing because car manufacturers will only produce these types of vehicles in the near future. The problem with these vehicles is that their fuel, either electricity or hydrogen, is produced in facilities that pollute.
In this paper, the CO2 emissions of BEVs and FCEVs during charging were analyzed. The analysis included various BEVs and FCEVs, different power generation mixtures, and different hydrogen production options, and these were compared to the work of other researchers.
The CO2 emissions of the BEVs were lower when the less pollutant power sources had a higher share in the power mix. The Spring had the lowest CO2 emissions per kilometer due to low fuel consumption, while the Mustang Mach-E RWD had the highest CO2 emissions per kilometer due to high fuel consumption.
Nexo, which has higher fuel consumption when compared to the Mirai, had higher CO2 emissions. When the hydrogen was obtained via the gasification of coal, the CO2 emissions were the highest. When the hydrogen was obtained via hydro-powered electrolysis, the CO2 emissions were the lowest.
When compared, FCEVs have much lower emissions if the relevant hydrogen is obtained from nuclear power and renewable energy sources. If the hydrogen is obtained from a more pollutant source, then the CO2 emissions of FCEVs are higher for the hydrogen obtained via the gasification of coal, the steam reforming of natural gas, or grid-powered electrolysis. Similar emissions were found for the hydrogen obtained via biomass gasification. So, the emissions of FCEVs are dependent on the hydrogen production method.
When compared with conventional vehicles, the CO2 emissions of BEVs and FCEVs are lower in most cases. The CO2 emissions were higher for the FCEVs if the hydrogen was obtained via the gasification of coal or grid-powered electrolysis. Therefore, both BEVs and FCEVs can be considered as alternatives to conventional vehicles.
As a future study, considering the numerous advances in the design and manufacturing car business, various new models of BEVs and FCEVs vehicles might be considered.
In the future, as hydrogen production methods and technology advance, it will be possible for hydrogen vehicles to be considered an equal alternative to battery vehicles.
Funding
This research received no external funding.
Institutional Review Board Statement
Not applicable.
Informed Consent Statement
Not applicable.
Data Availability Statement
Not applicable.
Conflicts of Interest
The authors declare no conflict of interest.
References
- Bartolozzi, I.; Rizzi, F.; Frey, M. Comparison between hydrogen and electric vehicles by life cycle assessment: A case study in Tuscany, Italy. Appl. Energy 2013, 101, 103–111. [Google Scholar] [CrossRef]
- Xiong, S.; Wang, Y.; Bai, B.; Ma, X. A hybrid life cycle assessment of the large-scale application of electric vehicles. Energy 2021, 216, 119314. [Google Scholar] [CrossRef]
- Elshurafa, A.M.; Peerbocus, N. Electric vehicle deployment and carbon emissions in Saudi Arabia: A power system perspective. Electr. J. 2020, 33, 106774. [Google Scholar] [CrossRef]
- Küfeoğlu, S.; Hong, D.K.K. Emissions performance of electric vehicles: A case study from the United Kingdom. Appl. Energy 2020, 260, 114241. [Google Scholar] [CrossRef]
- Nuez, I.; Ruiz-García, A.; Osorio, J. A comparative evaluation of CO2 emissions between internal combustion and electric vehicles in small isolated electrical power systems—Case study of the Canary Islands. J. Clean. Prod. 2022, 369, 133252. [Google Scholar] [CrossRef]
- Armenta-Déu, C.; Cattin, E. Real Driving Range in Electric Vehicles: Influence on Fuel Consumption and Carbon Emissions. World Electr. Veh. J. 2021, 12, 166. [Google Scholar] [CrossRef]
- Buberger, J.; Kersten, A.; Kuder, M.; Eckerle, R.; Weyh, T.; Thiringer, T. Total CO2-equivalent life-cycle emissions from commercially available passenger cars. Renew. Sustain. Energy Rev. 2022, 159, 112158. [Google Scholar] [CrossRef]
- Xia, X.; Li, P.; Xia, Z.; Wu, R.; Cheng, Y. Life cycle carbon footprint of electric vehicles in different countries: A review. Sep. Purif. Technol. 2022, 301, 122063. [Google Scholar] [CrossRef]
- Gryparis, E.; Papadopoulos, P.; Leligou, H.C.; Psomopoulos, C.S. Electricity demand and carbon emission in power generation under high penetration of electric vehicles. A European Union perspective. Energy Rep. 2020, 6, 475–486. [Google Scholar] [CrossRef]
- Fuinhas, J.A.; Koengkan, M.; Leitão, N.C.; Nwani, C.; Uzuner, G.; Dehdar, F.; Relva, S.; Peyerl, D. Effect of Battery Electric Vehicles on Greenhouse Gas Emissions in 29 European Union Countries. Sustainability 2021, 13, 13611. [Google Scholar] [CrossRef]
- Koengkan, M.; Fuinhas, J.A.; Teixeira, M.; Kazemzadeh, E.; Auza, A.; Dehdar, F.; Osmani, F. The Capacity of Battery-Electric and Plug-in Hybrid Electric Vehicles to Mitigate CO2 Emissions: Macroeconomic Evidence from European Union Countries. World Electr. Veh. J. 2022, 13, 58. [Google Scholar] [CrossRef]
- Zimakowska-Laskowska, M.; Laskowski, P. Emission from Internal Combustion Engines and Battery Electric Vehicles: Case Study for Poland. Atmosphere 2022, 13, 401. [Google Scholar] [CrossRef]
- Sobol, Ł.; Dyjakon, A. The Influence of Power Sources for Charging the Batteries of Electric Cars on CO2 Emissions during Daily Driving: A Case Study from Poland. Energies 2020, 13, 4267. [Google Scholar] [CrossRef]
- Neugebauer, M.; Żebrowski, A.; Esmer, O. Cumulative Emissions of CO2 for Electric and Combustion Cars: A Case Study on Specific Models. Energies 2022, 15, 2703. [Google Scholar] [CrossRef]
- Boretti, A. Supply of abundant and low-cost total primary energy to a growing world needs nuclear energy and hydrogen energy storage. Int. J. Hydrogen Energy 2022, 46, 20136–20145. [Google Scholar] [CrossRef]
- Savari, G.R.; Sathik, M.J.; Raman, L.A.; El-Shahat, A.; Hasanien, H.M.; Almakhles, D.; Abdel Aleem, S.H.E.; Omar, A.I. Assessment of charging technologies, infrastructure and charging station recommendation schemes of electric vehicles: A review. Ain Shams Eng. J. 2023, 14, 101938. [Google Scholar] [CrossRef]
- Reick, B.; Konzept, A.; Kaufmann, A.; Stetter, R.; Engelmann, D. Influence of Charging Losses on Energy Consumption and CO2 Emissions of Battery-Electric Vehicles. Vehicles 2021, 3, 736–748. [Google Scholar] [CrossRef]
- Kim, I.; Kim, J.; Lee, J. Dynamic analysis of well-to-wheel electric and hydrogen vehicles greenhouse gas emissions: Focusing on consumer preferences and power mix changes in South Korea. Appl. Energy 2020, 260, 114281. [Google Scholar] [CrossRef]
- Kothari, R.; Buddhi, D.; Sawhney, R.L. Comparison of environmental and economic aspects of various hydrogen production methods. Renew. Sustain. Energy Rev. 2008, 12, 553–563. [Google Scholar] [CrossRef]
- Shina, J.; Hwang, W.S.; Choi, H. Can hydrogen fuel vehicles be a sustainable alternative on vehicle market?: Comparison of electric and hydrogen fuel cell vehicles. Technol. Forecast. Soc. Chang. 2019, 143, 239–248. [Google Scholar] [CrossRef]
- Khan, U.; Yamamoto, T.; Sato, H. Consumer preferences for hydrogen fuel cell vehicles in Japan. Transp. Res. Part D Transp. Environ. 2020, 87, 102542. [Google Scholar] [CrossRef]
- Jones, J.; Genovese, A.; Tob-Ogu, A. Hydrogen vehicles in urban logistics: A total cost of ownership analysis and some policy implications. Renew. Sustain. Energy Rev. 2020, 119, 109595. [Google Scholar] [CrossRef]
- Tsuchiya, H. Innovative renewable energy solutions for hydrogen vehicles. Int. J. Energy Res. 2008, 32, 427–435. [Google Scholar] [CrossRef]
- Wanitschke, A.; Hoffmann, S. Are battery electric vehicles the future? An uncertainty comparison with hydrogen and combustion engines. Environ. Innov. Soc. Transit. 2020, 35, 509–523. [Google Scholar] [CrossRef]
- Jorgensen, K. Technologies for electric, hybrid and hydrogen vehicles: Electricity from renewable energy sources in transport. Util. Policy 2008, 16, 72–79. [Google Scholar] [CrossRef]
- Wong, E.Y.C.; Ho, D.C.K.; So, S.; Tsang, C.-W.; Chan, E.M.H. Life Cycle Assessment of Electric Vehicles and Hydrogen Fuel Cell Vehicles Using the GREET Model—A Comparative Study. Sustainability 2021, 13, 4872. [Google Scholar] [CrossRef]
- Ahmadi, P.; Khoshnevisan, A. Dynamic simulation and lifecycle assessment of hydrogen fuel cell electric vehicles considering various hydrogen production methods. Int. J. Hydrogen Energy 2022, 47, 26758–26769. [Google Scholar] [CrossRef]
- Ajanovic, A.; Haas, R. Prospects and impediments for hydrogen and fuel cell vehicles in the transport sector. Int. J. Hydrogen Energy 2021, 46, 10049–10058. [Google Scholar] [CrossRef]
- Tollefson, J. Hydrogen vehicles: Fuel of the future? Nature 2010, 464, 1262–1264. [Google Scholar] [CrossRef]
- Hosseini, S.E.; Butler, B. An overview of development and challenges in hydrogen powered vehicles. Int. J. Green Energy 2020, 17, 13–37. [Google Scholar] [CrossRef]
- Nagasawa, K.; Davidson, F.T.; Lloyd, A.C.; Webber, M.E. Impacts of renewable hydrogen production from wind energy in electricity markets on potential hydrogen demand for light-duty vehicles. Appl. Energy 2019, 235, 1001–1016. [Google Scholar] [CrossRef]
- Zhang, C.; Greenblatt, J.B.; Wei, M.; Eichman, J.; Saxena, S.; Muratori, M.; Guerra, O.J. Flexible grid-based electrolysis hydrogen production for fuel cell vehicles reduces costs and greenhouse gas emissions. Appl. Energy 2020, 278, 115651. [Google Scholar] [CrossRef]
- Wen, C.; Rogie, B.; Kærn, R.M.; Rothuizen, E. A first study of the potential of integrating an ejector in hydrogen fuelling stations for fuelling high pressure hydrogen vehicles. Appl. Energy 2020, 260, 113958. [Google Scholar] [CrossRef]
- Bethoux, O. Hydrogen Fuel Cell Road Vehicles and Their Infrastructure: An Option towards an Environmentally Friendly Energy Transition. Energies 2020, 13, 6132. [Google Scholar] [CrossRef]
- Robinius, M.; Linßen, J.; Grube, T.; Reuß, M.; Stenzel, P.; Syranidis, K.; Kuckertz, P.; Stolten, D. Comparative Analysis of Infrastructures: Hydrogen Fueling and Electric Charging of Vehicles. Energy Environ. 2018, 408, 1–108. [Google Scholar]
- Gan, W.; Yan, M.; Yao, W.; Guo, J.; Fang, J.; Ai, X.; Wen, J. Multi-Network Coordinated Hydrogen Supply Infrastructure Planning for the Integration of Hydrogen Vehicles and Renewable Energy. IEEE Trans. Ind. Appl. 2022, 58, 2875–2886. [Google Scholar] [CrossRef]
- Longden, T.; Beck, F.J.; Jotzo, F.; Andrews, R.; Prasad, M. ‘Clean’ hydrogen?—Comparing the emissions and costs of fossil fuel versus renewable electricity based hydrogen. Appl. Energy 2022, 306, 118145. [Google Scholar] [CrossRef]
- Ugurlu, A. An emission analysis study of hydrogen powered vehicles. Int. J. Hydrogen Energy 2020, 45, 26522–26535. [Google Scholar] [CrossRef]
- Bacquart, T.; Moore, N.; Storms, W.; Chramosta, N.; Morris, A.; Murugan, A.; Gozlan, B.; Lescornez, Y.; Férat, S.; Pinte, G.; et al. Hydrogen fuel quality for transport—First sampling and analysis comparison in Europe on hydrogen refuelling station (70 MPa) according to ISO 14687 and EN 17124. Fuel Commun. 2021, 6, 100008. [Google Scholar] [CrossRef]
- Manoharan, Y.; Hosseini, S.E.; Butler, B.; Alzhahrani, H.; Senior, B.T.F.; Ashuri, T.; Krohn, J. Hydrogen Fuel Cell Vehicles; Current Status and Future Prospect. Appl. Sci. 2019, 9, 2296. [Google Scholar] [CrossRef]
- Howarth, R.W.; Jacobson, M.Z. How green is blue hydrogen? Energy Sci. Eng. 2021, 9, 1676–1687. [Google Scholar] [CrossRef]
- Chakraborty, S.; Dash, S.K.; Elavarasan, R.M.; Kaur, A.; Elangovan, D.; Meraj, S.T.; Kasinathan, P.; Said, Z. Hydrogen Energy as Future of Sustainable Mobility. Front. Energy Res. 2022, 10, 893475. [Google Scholar] [CrossRef]
- Rostrup-Nielsen, J.R.; Rostrup-Nielsen, T. Large-Scale Hydrogen Production. Cattech 2002, 6, 150–159. [Google Scholar] [CrossRef]
- Hames, Y.; Kaya, K.; Baltacioglu, E.; Turksoy, A. Analysis of the control strategies for fuel saving in the hydrogen fuel cell vehicles. Int. J. Hydrogen Energy 2018, 43, 10810–10821. [Google Scholar] [CrossRef]
- Kaya, K.; Hames, Y. Two new control strategies: For hydrogen fuel saving and extend the life cycle in the hydrogen fuel cell vehicles. Int. J. Hydrogen Energy 2019, 44, 18967–18980. [Google Scholar] [CrossRef]
- Rothuizen, E.; Rokni, M. Optimization of the overall energy consumption in cascade fueling stations for hydrogen vehicles. Int. J. Hydrogen Energy 2014, 39, 582–592. [Google Scholar] [CrossRef]
- Turoń, K. Hydrogen-powered vehicles in urban transport systems—Current state and development. Transp. Res. Procedia 2020, 45, 835–841. [Google Scholar] [CrossRef]
- Mehrjerdi, H. Off-grid solar powered charging station for electric and hydrogen vehicles including fuel cell and hydrogen storage. Int. J. Hydrogen Energy 2019, 44, 11574–11583. [Google Scholar] [CrossRef]
- Wang, Y.; Kazemi, M.; Nojavan, S.; Jermsittiparsert, K. Robust design of off-grid solar-powered charging station for hydrogen and electric vehicles via robust optimization approach. Int. J. Hydrogen Energy 2020, 45, 18995–19006. [Google Scholar] [CrossRef]
- Nasir, M.; Jordehi, A.R.; Matin, S.A.A.; Tabar, V.S.; Tostado-Véliz, M.; Mansouri, S.A. Optimal operation of energy hubs including parking lots for hydrogen vehicles and responsive demands. J. Energy Storage 2022, 50, 104630. [Google Scholar] [CrossRef]
- Aslani, M.; Imanloozadeh, A.; Hashemi-Dezaki, H.; Hejazi, M.A.; Nazififard, M.; Ketabi, A. Optimal probabilistic reliability-oriented planning of islanded microgrids considering hydrogen-based storage systems, hydrogen vehicles, and electric vehicles under various climatic conditions. J. Power Sources 2022, 52, 231100. [Google Scholar] [CrossRef]
- Wei, X.; Zhang, X.; Sun, Y.; Qiu, J. Carbon Emission Flow Oriented Tri-Level Planning of Integrated Electricity–Hydrogen–Gas System with Hydrogen Vehicles. IEEE Trans. Ind. Appl. 2022, 58, 2607–2618. [Google Scholar] [CrossRef]
- Tao, Y.; Qiu, J.; Lai, S.; Zhang, X.; Wang, G. Collaborative Planning for Electricity Distribution Network and Transportation System Considering Hydrogen Fuel Cell Vehicles. IEEE Trans. Transp. Electrif. 2020, 6, 1211–1225. [Google Scholar] [CrossRef]
- Lakouraj, M.M.; Niaz, H.; Liu, J.J.; Siano, P.; Anvari-Moghaddam, A. Optimal risk-constrained stochastic scheduling of microgrids with hydrogen vehicles in real-time and day-ahead markets. J. Clean. Prod. 2021, 318, 128452. [Google Scholar] [CrossRef]
- AlHajri, I.; Ahmadian, A.; Elkamel, A. Techno-economic-environmental assessment of an integrated electricity and gas network in the presence of electric and hydrogen vehicles: A mixed-integer linear programming approach. J. Clean. Prod. 2021, 319, 128578. [Google Scholar] [CrossRef]
- Zhang, X.; Yan, R.; Zeng, R.; Zhu, R.; Kong, X.; He, Y.; Li, H. Integrated performance optimization of a biomass-based hybrid hydrogen/thermal energy storage system for building and hydrogen vehicles. Renew. Energy 2022, 187, 801–818. [Google Scholar] [CrossRef]
- Liu, J.; Yang, H.; Zhou, Y. Peer-to-peer trading optimizations on net-zero energy communities with energy storage of hydrogen and battery vehicles. Appl. Energy 2021, 302, 117578. [Google Scholar] [CrossRef]
- Kolbe, K. Mitigating urban heat island effect and carbon dioxide emissions through different mobility concepts: Comparison of conventional vehicles with electric vehicles, hydrogen vehicles and public transportation. Transp. Policy 2019, 80, 1–11. [Google Scholar] [CrossRef]
- Mehrjerdi, H.; Bornapour, M.; Hemmati, R.; Ghiasi, S.M.S. Unified energy management and load control in building equipped with wind-solar-battery incorporating electric and hydrogen vehicles under both connected to the grid and islanding modes. Energy 2019, 168, 919–930. [Google Scholar] [CrossRef]
- Kinnon, M.M.; Shaffer, B.; Carreras-Sospedra, M.; Dabdub, D.; Samuelsen, G.S.; Brouwer, J. Air quality impacts of fuel cell electric hydrogen vehicles with high levels of renewable power generation. Int. J. Hydrogen Energy 2016, 41, 16592–16603. [Google Scholar] [CrossRef]
- Murugan, A.; de Huu, M.; Bacquart, T.; van Wijk, J.; Arrhenius, K.; Ronde, I.; Hemfrey, D. Measurement challenges for hydrogen vehicles. Int. J. Hydrogen Energy 2019, 44, 19326–19333. [Google Scholar] [CrossRef]
- Faria, R.; Moura, P.; Delgado, J.; de Almeida, A.T. A sustainability assessment of electric vehicles as a personal mobility system. Energy Convers. Manag. 2012, 61, 19–30. [Google Scholar] [CrossRef]
- Ramachandran, S.; Stimming, U. Well to wheel analysis of low carbon alternatives for road traffic. Energy Environ. Sci. 2015, 8, 3313–3324. [Google Scholar] [CrossRef]
- Report on the Installed Capacity of the Power Plants in Romania. Available online: https://www.transelectrica.ro/ro/web/tel/productie (accessed on 19 December 2022).
- Production Reports for Romania. Available online: https://www.transelectrica.ro/widget/web/tel/sen-grafic/-/SENGrafic_WAR_SENGraficportlet?display=APE (accessed on 19 December 2022).
- Best-Selling BEV Models in Europe. Available online: https://www.statista.com/statistics/972845/electric-vehicles-leading-models-europe/ (accessed on 19 December 2022).
- Best-Selling BEV Models in USA. Available online: https://www.greencars.com/expert-insights/best-selling-electric-vehicles (accessed on 19 December 2022).
- Statistical Bulletin of the Romanian Automotive Manufacturers and Importers Association. Available online: https://www.apia.ro/en/statistical-bulletin/ (accessed on 19 January 2023).
- Battery Capacity, Range, Fuel Consumption and Charging Time of BEVs. Available online: https://ev-database.org (accessed on 19 January 2023).
- Tong, F.; Michalek, J.; Azevedo, I.L. A review of hydrogen production pathways, cost and decarbonization potential. In Proceedings of the 35th USAEE/IAEE North American Conference, Houston, TX, USA, 12–15 November 2017. [Google Scholar]
- Tenhumberg, N.; Büker, K. Ecological and Economic Evaluation of Hydrogen Production by Different Water Electrolysis Technologies. Chem. Ing. Tech. 2020, 92, 1586–1595. [Google Scholar] [CrossRef]
- Tank Capacity, Range, Fuel Consumption and Charging Time of FCEVs. Available online: https://h2.live/en/fcev (accessed on 19 January 2023).
- MATLAB R2022b. Available online: https://www.mathworks.com/products/matlab.html (accessed on 20 January 2023).
- CO2 Emission Standards for New Cars and Vans. Available online: https://www.europarl.europa.eu/RegData/etudes/BRIE/2022/698920/EPRS_BRI(2022)698920_EN.pdf (accessed on 19 January 2023).
Figure 1.
Charging BEVs.

Figure 2.
Charging FCEVs.

Figure 3.
CO2 emissions for BEVs considering fuel consumption.

Figure 4.
CO2 emissions for BEVs considering the annual distance traveled.

Figure 5.
CO2 emissions for BEVs considering the driving range.

Figure 6.
CO2 emissions for FCEVs considering fuel consumption.

Figure 7.
CO2 emissions for FCEVs considering the annual distance traveled.

Figure 8.
CO2 emissions for FCEVs considering the driving range.


| Power Plant Type | Carbon Dioxide Emissions (gCO2/kWh) |
|---|---|
| Biomass | 340 |
| Coal | 916 |
| Gas | 354 |
| Hydro | 12 |
| Nuclear | 12 |
| Solar | 50 |
| Wind | 10 |
Table 2.
Installed capacity of the power plants in Romania (1 December 2022) [64].
Table 2.
Installed capacity of the power plants in Romania (1 December 2022) [64].
| Power Plant Type | Installed Capacity (MW) | Percentage (%) |
|---|---|---|
| Biomass | 124.23 | 0.75 |
| Coal | 2673.15 | 16.04 |
| Gas | 1981.35 | 11.89 |
| Hydro | 6310.95 | 37.87 |
| Nuclear | 1300 | 7.80 |
| Solar | 1308 | 7.85 |
| Wind | 2965.43 | 17.80 |
Table 3.
Power mix in Romania [65].
Table 3.
Power mix in Romania [65].
| Power Plant Type | Percentage on 4 March 2022 (%) | Percentage on 29 April 2022 (%) | Percentage on 11 August 2022 (%) | Percentage on 16 November 2022 (%) | Percentage on 5 December 2022 (%) |
|---|---|---|---|---|---|
| Biomass | 1.37 | 0.77 | 0.96 | 1.18 | 1.08 |
| Coal | 25.72 | 19.26 | 17.76 | 24.12 | 19.71 |
| Gas | 15.75 | 16.68 | 18.78 | 23.37 | 23.91 |
| Hydro | 29.49 | 34.3 | 14.53 | 22.15 | 21.05 |
| Nuclear | 23.55 | 20.13 | 18.05 | 21.64 | 19.42 |
| Solar | 1.92 | 2.48 | 3.12 | 0.69 | 0.34 |
| Wind | 2.2 | 6.38 | 26.8 | 6.85 | 14.49 |
Table 4.
Battery capacity, range, fuel consumption, and charging time of BEVs [69].
Table 4.
Battery capacity, range, fuel consumption, and charging time of BEVs [69].
| Battery Electric Vehicle | Battery Capacity (kWh) | Range (km) | Fuel Consumption (kWh/km) | Charging Time at 2.3 kW (h) | Charging Time at Regular 22 kW Charging Station (h) | Charging Time at Fast 50 kW DC Charging Station (h) |
|---|---|---|---|---|---|---|
| Dacia Spring | 26.8 | 165 | 0.152 | 13 | 4.5 | 0.633 |
| Fiat 500 electric | 23.8 | 135 | 0.158 | 11 | 2.5 | 0.4 |
| Ford Mustang Mach-E RWD | 75.7 | 355 | 0.197 | 36 | 7.5 | 1.28 |
| Hyundai Kona | 42 | 250 | 0.157 | 20.25 | 6.5 | 0.783 |
| Kia Niro EV (e-Niro) | 68 | 380 | 0.171 | 33.25 | 7 | 1.066 |
| Peugeot e-208 | 50 | 285 | 0.158 | 23.25 | 7.25 | 0.683 |
| Skoda Enyaq iV | 62 | 330 | 0.176 | 29.75 | 6.25 | 0.85 |
| Tesla Model S | 100 | 550 | 0.173 | 48.75 | 7 | 1.4 |
| Tesla Model Y | 57.5 | 345 | 0.167 | 29.5 | 6.25 | 0.933 |
| Volkswagen ID.4 | 55 | 285 | 0.182 | 26.75 | 8.5 | 0.95 |
| Hydrogen Production Method | Carbon Dioxide Emissions (gCO2/kg) |
|---|---|
| Biomass gasification | 5000 |
| Gasification of coal | 19,000 |
| Grid-powered electrolysis | 14,000 |
| Hydro-powered electrolysis | 300 |
| Nuclear-powered electrolysis | 600 |
| Solar-powered electrolysis | 1800 |
| Wind-powered electrolysis | 700 |
| Steam reforming of natural gas | 9000 |
Table 6.
Tank capacity, range, fuel consumption, and charging time of FCEVs [72].
Table 6.
Tank capacity, range, fuel consumption, and charging time of FCEVs [72].
| Fuel Cell Electric Vehicle | Hydrogen Tank Capacity (kg) | Range (km) | Fuel Consumption (kg/km) | Charging Time at 70 MPa H2 Fueling Station (h) |
|---|---|---|---|---|
| Hyundai Nexo | 6.33 | 756 | 0.0084 | 0.0833 |
| Toyota Mirai | 5.6 | 650 | 0.0076 | 0.0833 |
Table 7.
CO2 emissions for BEVs considering fuel consumption.
| BEV | Emissions Considering the Installed Power (gCO2/km) | Emissions Considering the Power Supplied on 4 March 2022 (gCO2/km) | Emissions Considering the Power Supplied on 29 April 2022 (gCO2/km) | Emissions Considering the Power Supplied on 11 August 2022 (gCO2/km) | Emissions Considering the Power Supplied on 16 November 2022 (gCO2/km) | Emissions Considering the Power Supplied on 5 December 2022 (gCO2/km) |
|---|---|---|---|---|---|---|
| Dacia Spring | 30.81 | 46.14 | 37.46 | 36.56 | 47.72 | 41.85 |
| Fiat 500 electric | 32.03 | 47.96 | 38.94 | 38.01 | 49.60 | 43.50 |
| Ford Mustang Mach-E RWD | 39.94 | 59.79 | 48.55 | 47.39 | 61.85 | 54.24 |
| Hyundai Kona | 31.83 | 47.65 | 38.69 | 37.77 | 49.29 | 43.22 |
| Kia Niro EV (e-Niro) | 34.67 | 51.90 | 42.15 | 41.13 | 53.68 | 47.08 |
| Peugeot e-208 | 32.03 | 47.96 | 38.94 | 38.01 | 49.60 | 43.50 |
| Skoda Enyaq iV | 35.68 | 53.42 | 43.38 | 42.34 | 55.25 | 48.45 |
| Tesla Model S | 35.07 | 52.51 | 42.64 | 41.61 | 54.31 | 47.63 |
| Tesla Model Y | 33.85 | 50.69 | 41.16 | 40.17 | 52.43 | 45.98 |
| Volkswagen ID.4 | 36.90 | 55.24 | 44.86 | 43.78 | 57.14 | 50.11 |
Table 8.
CO2 emissions for BEVs considering the annual distance traveled.
| BEV | Emissions Considering the Installed Power (gCO2) | Emissions Considering the Power Supplied on 4 March 2022 (gCO2) | Emissions Considering the Power Supplied on 29 April 2022 (gCO2) | Emissions Considering the Power Supplied on 11 August 2022 (gCO2) | Emissions Considering the Power Supplied on 16 November 2022 (gCO2) | Emissions Considering the Power Supplied on 5 December 2022 (gCO2) |
|---|---|---|---|---|---|---|
| Dacia Spring | 369,820.37 | 553,680.67 | 449,609.43 | 438,811.35 | 572,673.61 | 502,206.29 |
| Fiat 500 electric | 384,418.55 | 575,536.48 | 467,357.17 | 456,132.85 | 595,279.15 | 522,030.23 |
| Ford Mustang Mach-E RWD | 479,306.67 | 717,599.29 | 582,717.48 | 568,722.60 | 742,215.15 | 650,885.79 |
| Hyundai Kona | 381,985.52 | 571,893.85 | 464,399.21 | 453,245.93 | 591,511.56 | 518,726.24 |
| Kia Niro EV (e-Niro) | 416,047.92 | 622,890.75 | 505,810.61 | 493,662.77 | 644,257.82 | 564,982.08 |
| Peugeot e-208 | 384,418.55 | 575,536.48 | 467,357.17 | 456,132.85 | 595,279.15 | 522,030.23 |
| Skoda Enyaq iV | 428,213.06 | 641,103.93 | 520,600.39 | 508,097.35 | 663,095.76 | 581,502.02 |
| Tesla Model S | 420,913.98 | 630,176.02 | 511,726.52 | 499,436.60 | 651,793.00 | 571,590.06 |
| Tesla Model Y | 406,315.80 | 608,320.21 | 493,978.78 | 482,115.10 | 629,187.46 | 551,766.12 |
| Volkswagen ID.4 | 442,811.24 | 662,959.75 | 538,348.13 | 525,418.85 | 685,701.30 | 601,325.96 |
Table 9.
CO2 emissions for BEVs considering the driving range.
| BEV | Emission Considering the Installed Power (gCO2) | Emissions Considering the Power Supplied on 4 March 2022 (gCO2) | Emissions Considering the Power Supplied on 29 April 2022 (gCO2) | Emissions Considering the Power Supplied on 11 August 2022 (gCO2) | Emissions Considering the Power Supplied on 16 November 2022 (gCO2) | Emissions Considering the Power Supplied on 5 December 2022 (gCO2) |
|---|---|---|---|---|---|---|
| Dacia Spring | 5085.03 | 7613.10 | 6182.12 | 6033.65 | 7874.26 | 6905.33 |
| Fiat 500 electric | 4324.70 | 6474.78 | 5257.76 | 5131.49 | 6696.89 | 5872.84 |
| Ford Mustang Mach-E RWD | 14,179.48 | 21,228.97 | 17,238.72 | 16,824.71 | 21,957.19 | 19,255.37 |
| Hyundai Kona | 7958.03 | 11,914.45 | 9674.98 | 9442.62 | 12,323.15 | 10,806.79 |
| Kia Niro EV (e-Niro) | 13,174.85 | 19,724.87 | 16,017.33 | 15,632.65 | 20,401.49 | 17,891.09 |
| Peugeot e-208 | 9129.94 | 13,668.99 | 11,099.73 | 10,833.15 | 14,137.87 | 12,398.21 |
| Skoda Enyaq iV | 11,775.85 | 17,630.35 | 14,316.51 | 13,972.67 | 18,235.13 | 15,991.30 |
| Tesla Model S | 19,291.89 | 28,883.06 | 23,454.13 | 22,890.84 | 29,873.84 | 26,197.87 |
| Tesla Model Y | 11,681.57 | 17,489.20 | 14,201.89 | 13,860.80 | 18,089.13 | 15,863.27 |
| Volkswagen ID.4 | 10,516.76 | 15,745.29 | 12,785.76 | 12,478.69 | 16,285.40 | 14,281.49 |
Table 10.
CO2 emissions for FCEVs considering fuel consumption.
| FCEV | Biomass Gasification (gCO2/km) | Gasification of Coal (gCO2/km) | Grid-Powered Electrolysis (gCO2/km) | Hydro-Powered Electrolysis (gCO2/km) | Nuclear-Powered Electrolysis (gCO2/km) | Solar-Powered Electrolysis (gCO2/km) | Wind-Powered Electrolysis (gCO2/km) | Steam Reforming of Natural Gas (gCO2/km) |
|---|---|---|---|---|---|---|---|---|
| Hyundai Nexo | 42 | 159.60 | 117.60 | 2.52 | 5.04 | 15.11 | 5.88 | 75.59 |
| Toyota Mirai | 38 | 144.40 | 106.40 | 2.28 | 4.56 | 13.68 | 5.32 | 68.40 |
Table 11.
CO2 emissions for FCEVs considering the annual distance traveled.
| FCEV | Biomass Gasification (gCO2) | Gasification of Coal (gCO2) | Grid-Powered Electrolysis (gCO2) | Hydro-Powered Electrolysis (gCO2) | Nuclear-Powered Electrolysis (gCO2) | Solar-Powered Electrolysis (gCO2) | Wind-Powered Electrolysis (gCO2) | Steam Reforming of Natural Gas (gCO2) |
|---|---|---|---|---|---|---|---|---|
| Hyundai Nexo | 504,000 | 1,915,200 | 1,411,200 | 30,240 | 60,480 | 181,440 | 70,560 | 907,199.99 |
| Toyota Mirai | 456,000 | 1,732,800 | 1,276,800 | 27,360 | 54,719.99 | 164,160 | 63,840 | 820,800 |
Table 12.
CO2 emissions for FCEVs considering the driving range.
| FCEV | Biomass Gasification (gCO2) | Gasification of Coal (gCO2) | Grid-Powered Electrolysis (gCO2) | Hydro-Powered Electrolysis (gCO2) | Nuclear-Powered Electrolysis (gCO2) | Solar-Powered Electrolysis (gCO2) | Wind-Powered Electrolysis (gCO2) | Steam Reforming of Natural Gas (gCO2) |
|---|---|---|---|---|---|---|---|---|
| Hyundai Nexo | 31,752 | 120,657.6 | 88,905.59 | 1905.12 | 3810.24 | 11,430.72 | 4445.28 | 57,153.60 |
| Toyota Mirai | 24,700 | 93,860 | 69,160 | 1482 | 2964 | 8892 | 3458 | 44,460 |
Disclaimer/Publisher’s Note: The statements, opinions and data contained in all publications are solely those of the individual author(s) and contributor(s) and not of MDPI and/or the editor(s). MDPI and/or the editor(s) disclaim responsibility for any injury to people or property resulting from any ideas, methods, instructions or products referred to in the content. |
© 2023 by the author. Licensee MDPI, Basel, Switzerland. This article is an open access article distributed under the terms and conditions of the Creative Commons Attribution (CC BY) license (https://creativecommons.org/licenses/by/4.0/).
Share and Cite
MDPI and ACS Style
Dulău, L.-I. CO2 Emissions of Battery Electric Vehicles and Hydrogen Fuel Cell Vehicles. Clean Technol. 2023, 5, 696-712. https://doi.org/10.3390/cleantechnol5020035
AMA Style
Dulău L-I. CO2 Emissions of Battery Electric Vehicles and Hydrogen Fuel Cell Vehicles. Clean Technologies. 2023; 5(2):696-712. https://doi.org/10.3390/cleantechnol5020035
Chicago/Turabian StyleDulău, Lucian-Ioan. 2023. "CO2 Emissions of Battery Electric Vehicles and Hydrogen Fuel Cell Vehicles" Clean Technologies 5, no. 2: 696-712. https://doi.org/10.3390/cleantechnol5020035