
Material Flow Cost Accounting as a Resource-Saving Tool for Emerging Recycling Technologies


Abstract
:1. Introduction
2. Description of Case Studies
2.1. IRETA 2 (Development and Evaluation of Recycling Routes to Recover Tantalum from Electronic Waste 2) Overview
2.2. ReComp (Development of an Innovative, Economically and Ecologically Sensible Recycling Method for Metallised ABS and PC/ABS Composite Waste) Overview
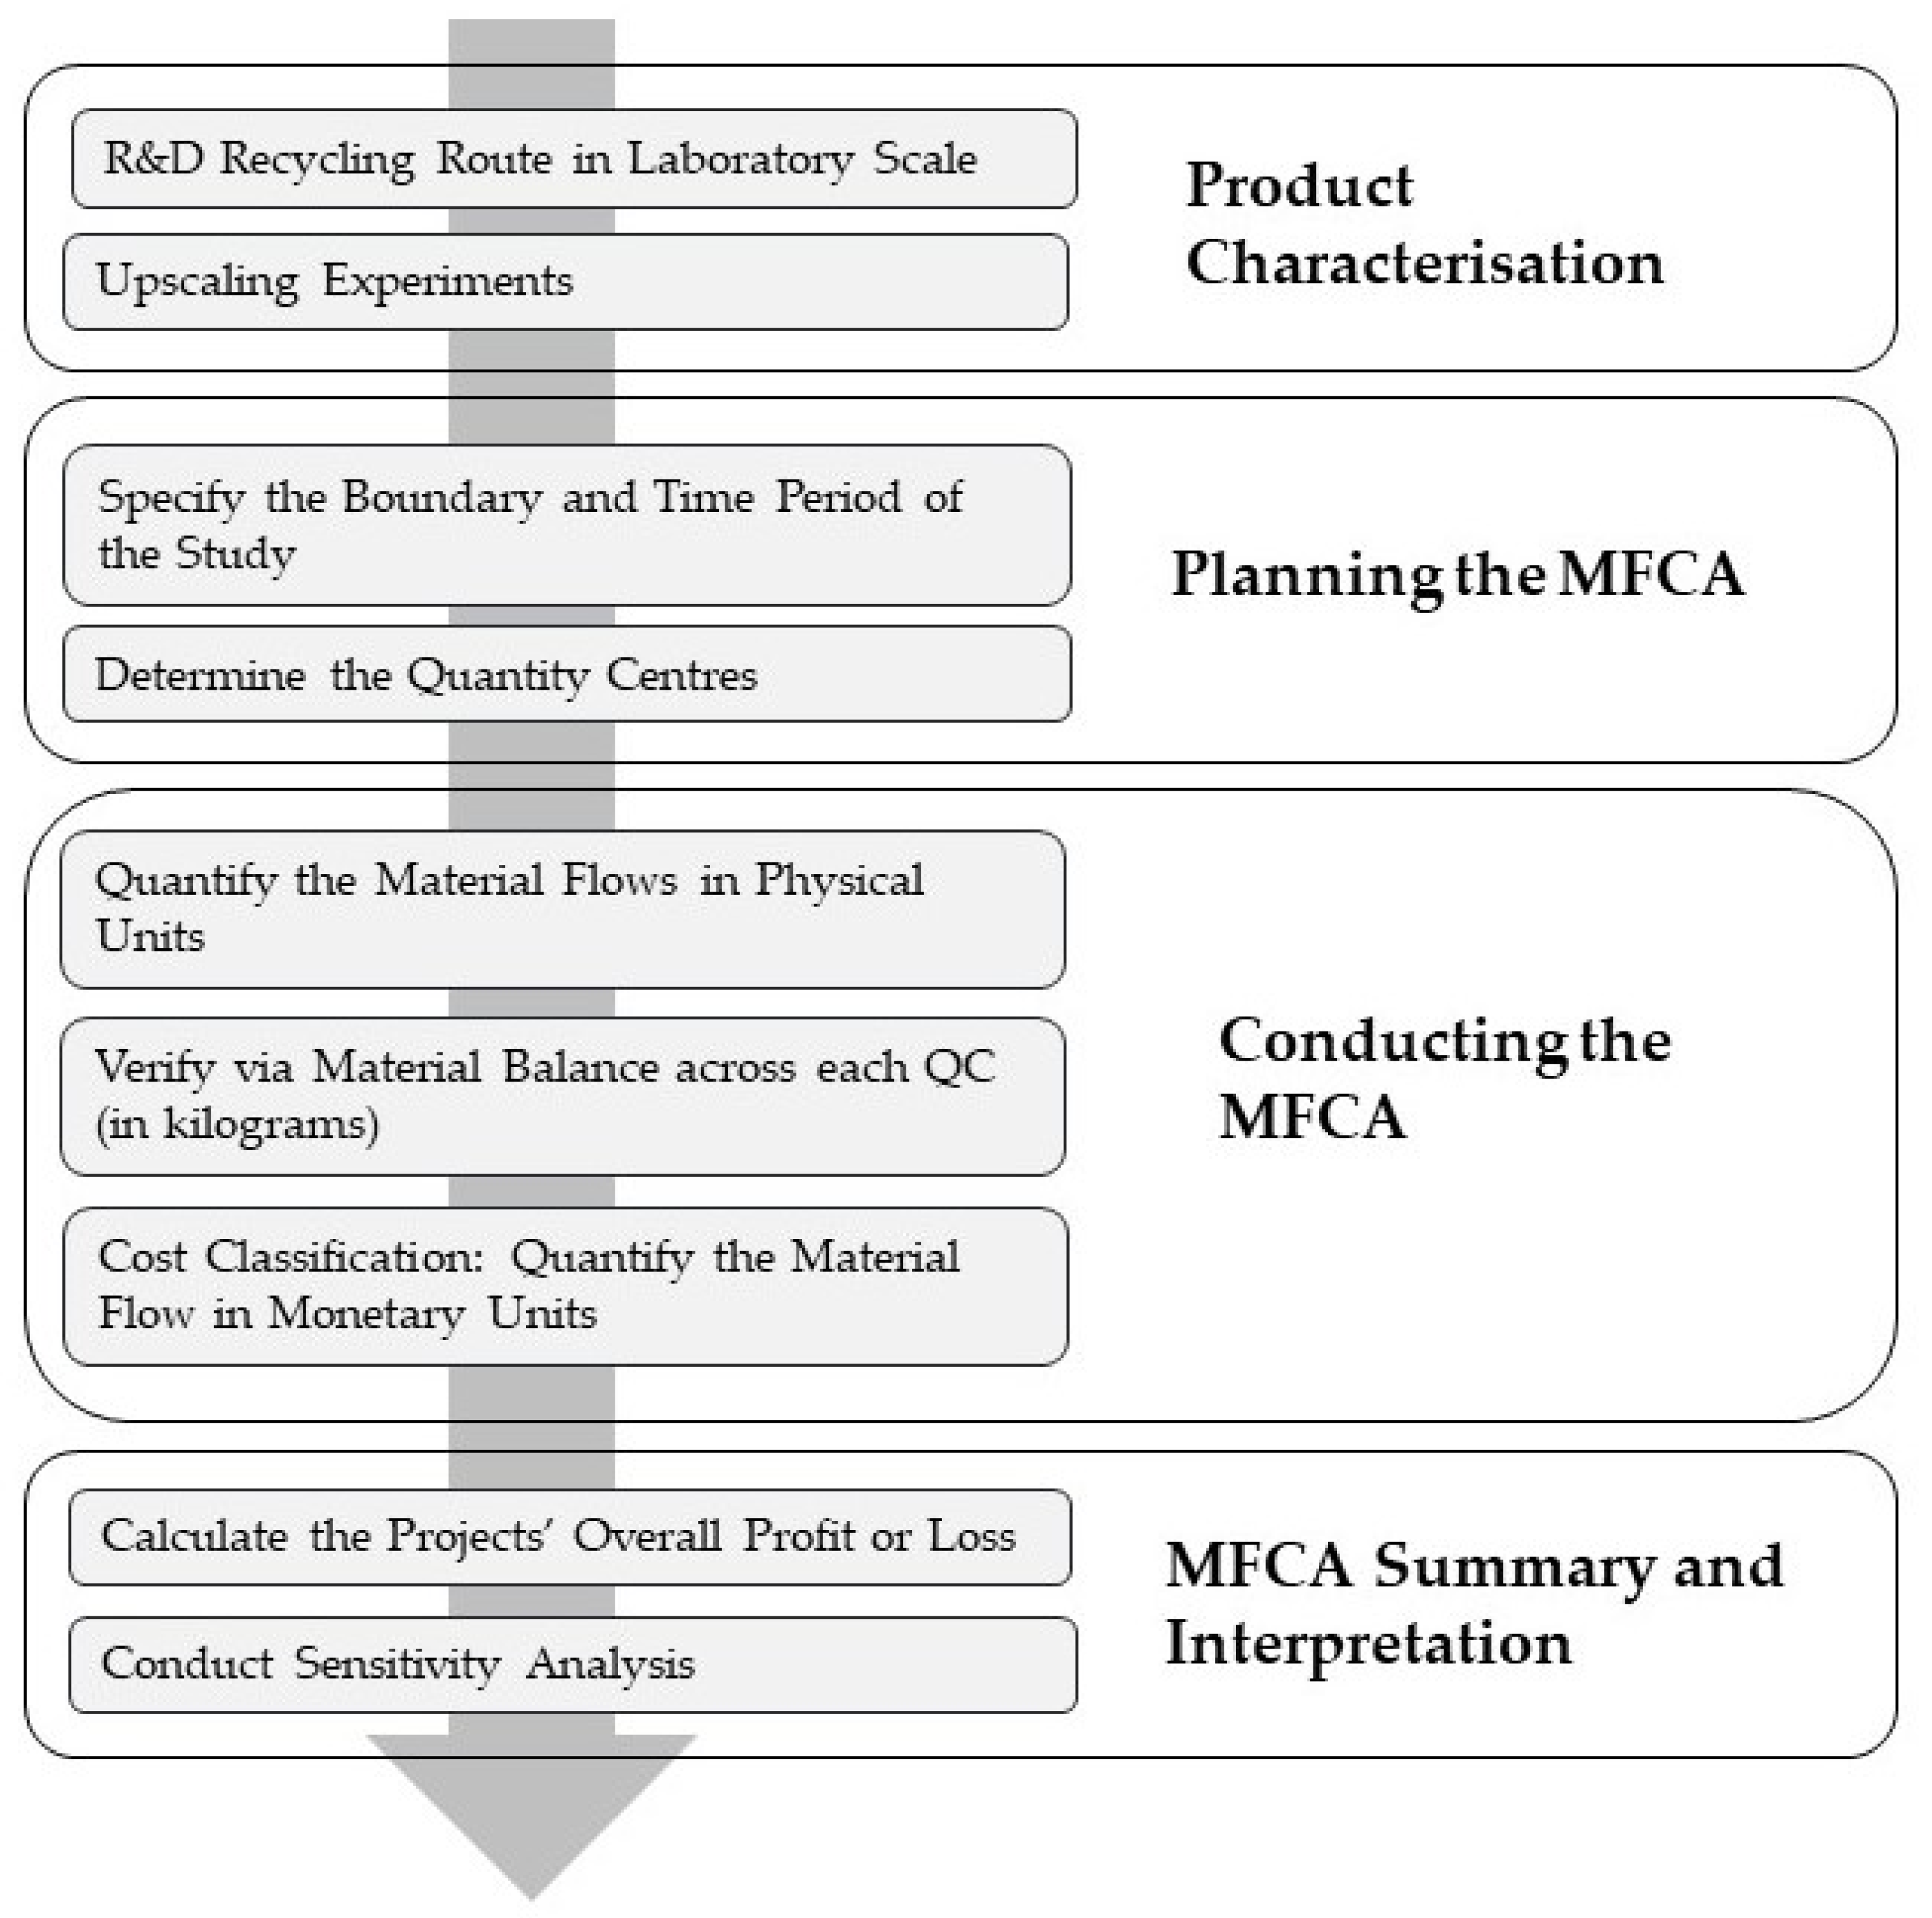
3. Methods
- Involve management.
- Determine the necessary expertise.
- Specify the boundary and time period of the study.
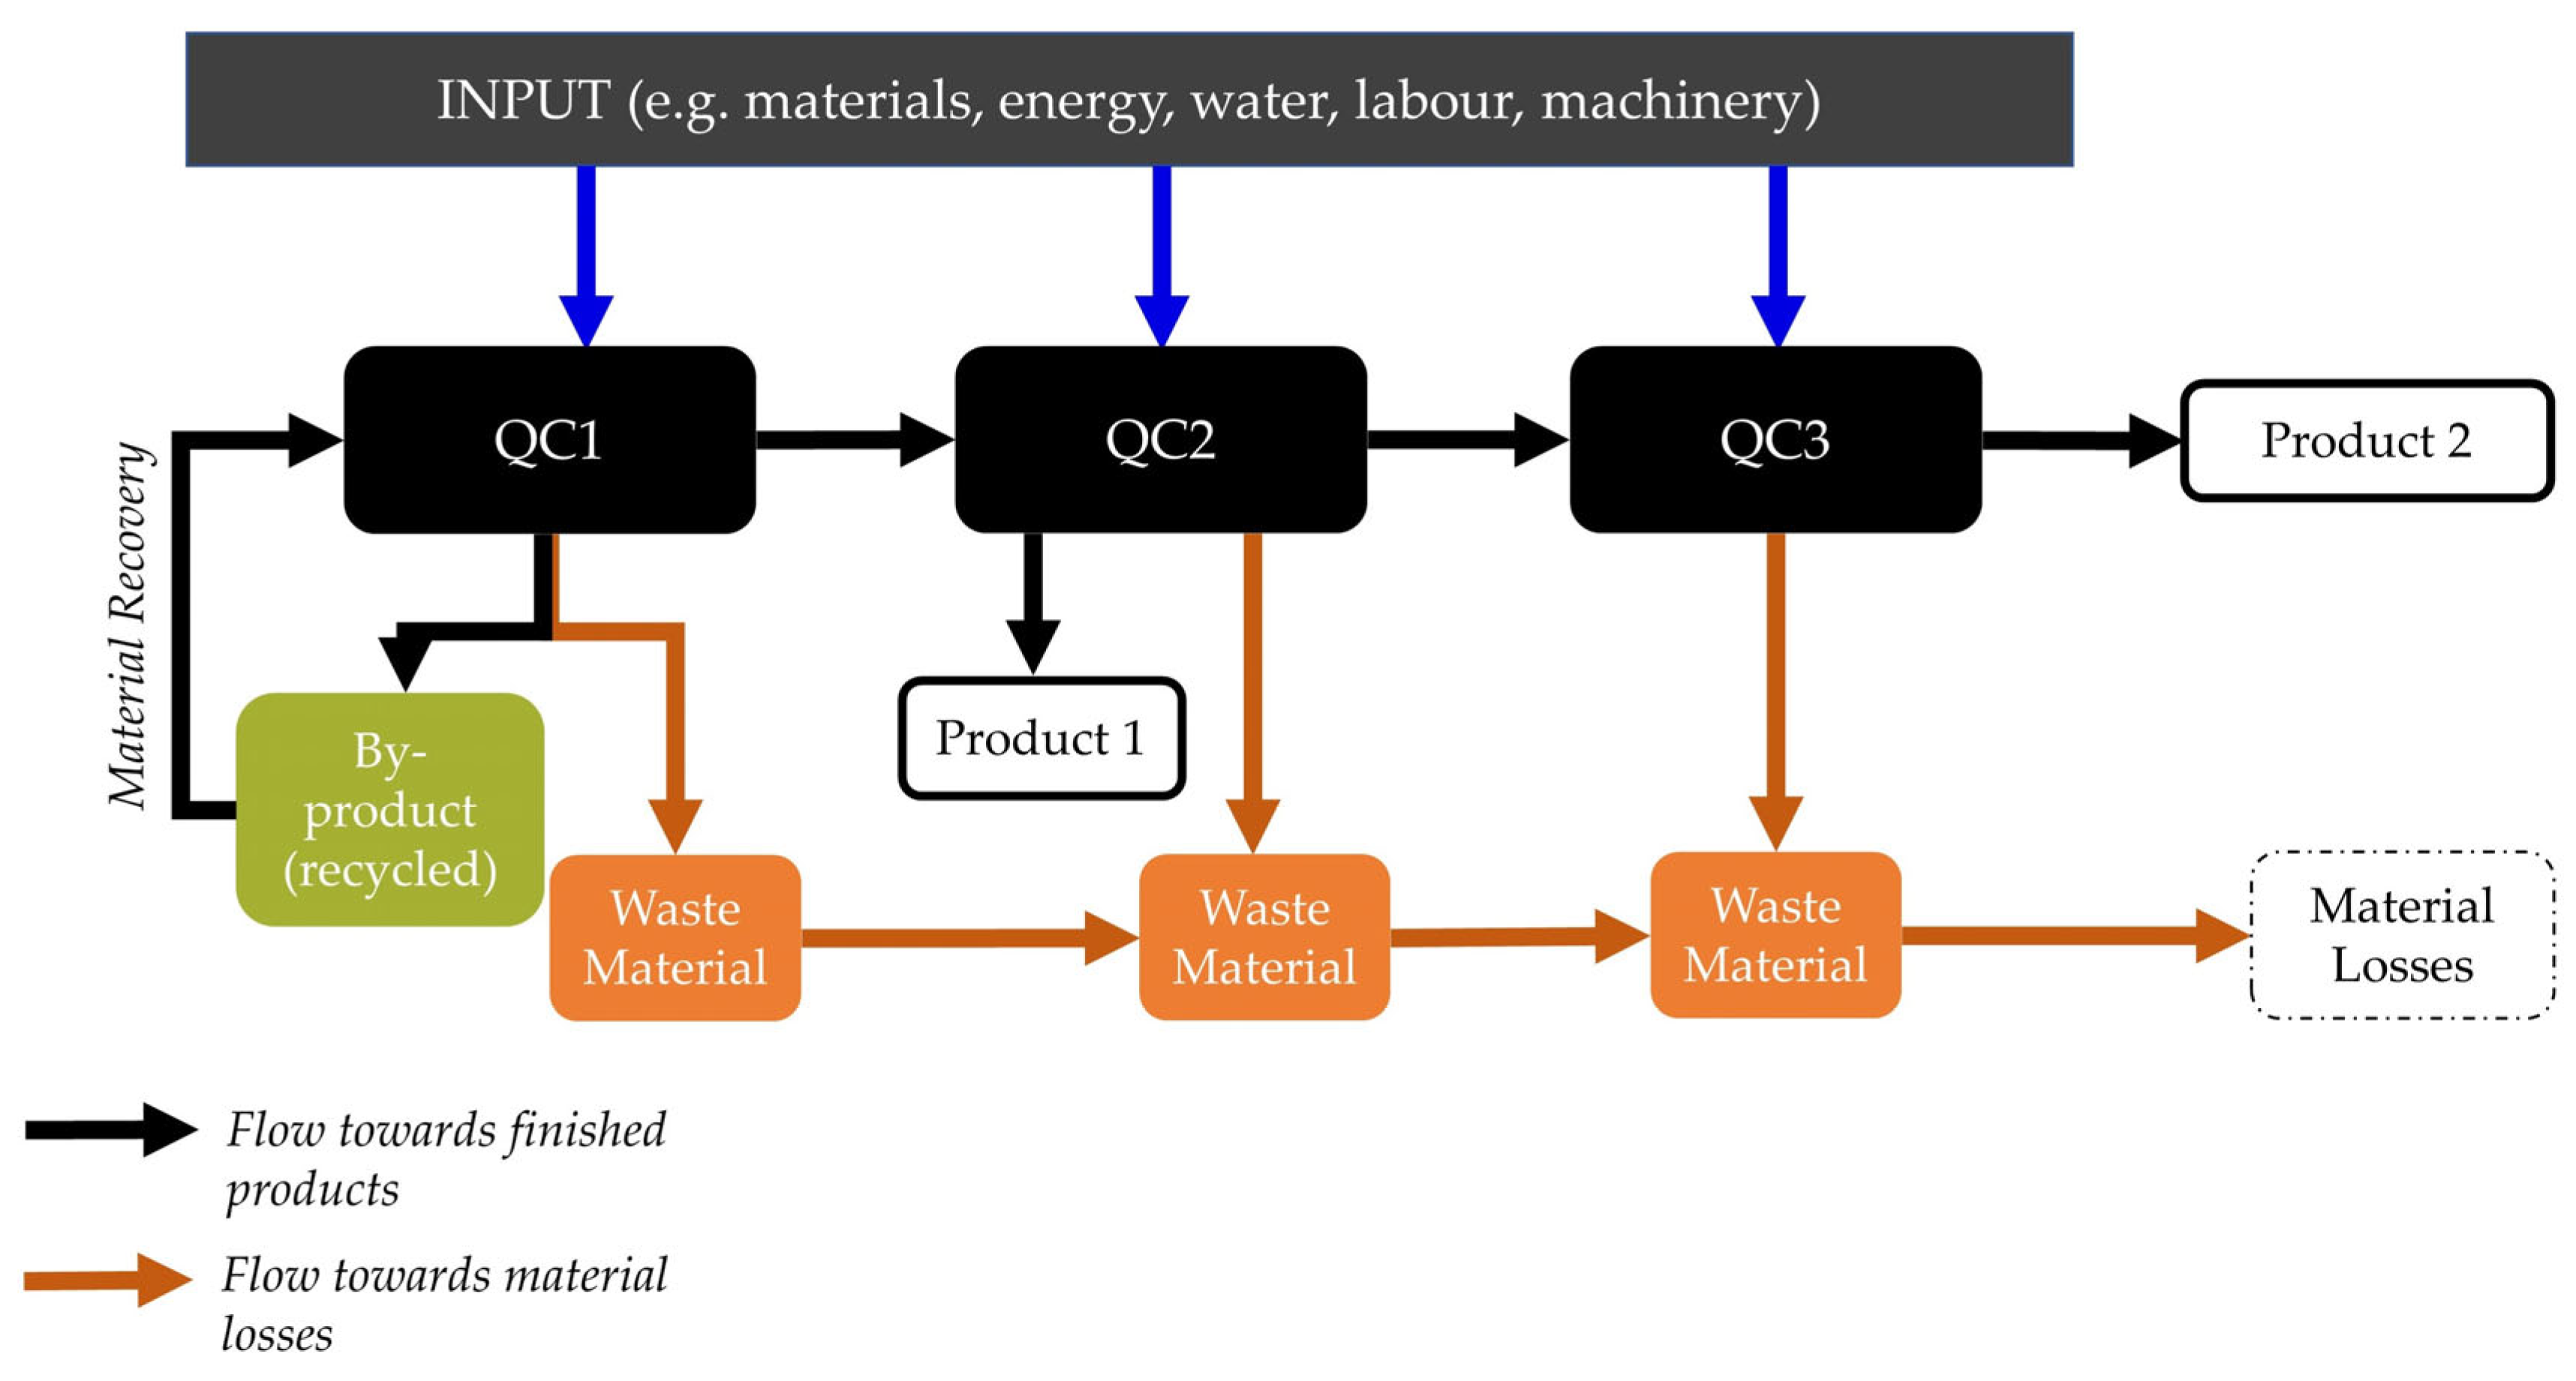
- Determine the quantity centres: defined as the parts of the process where materials are transformed [5].
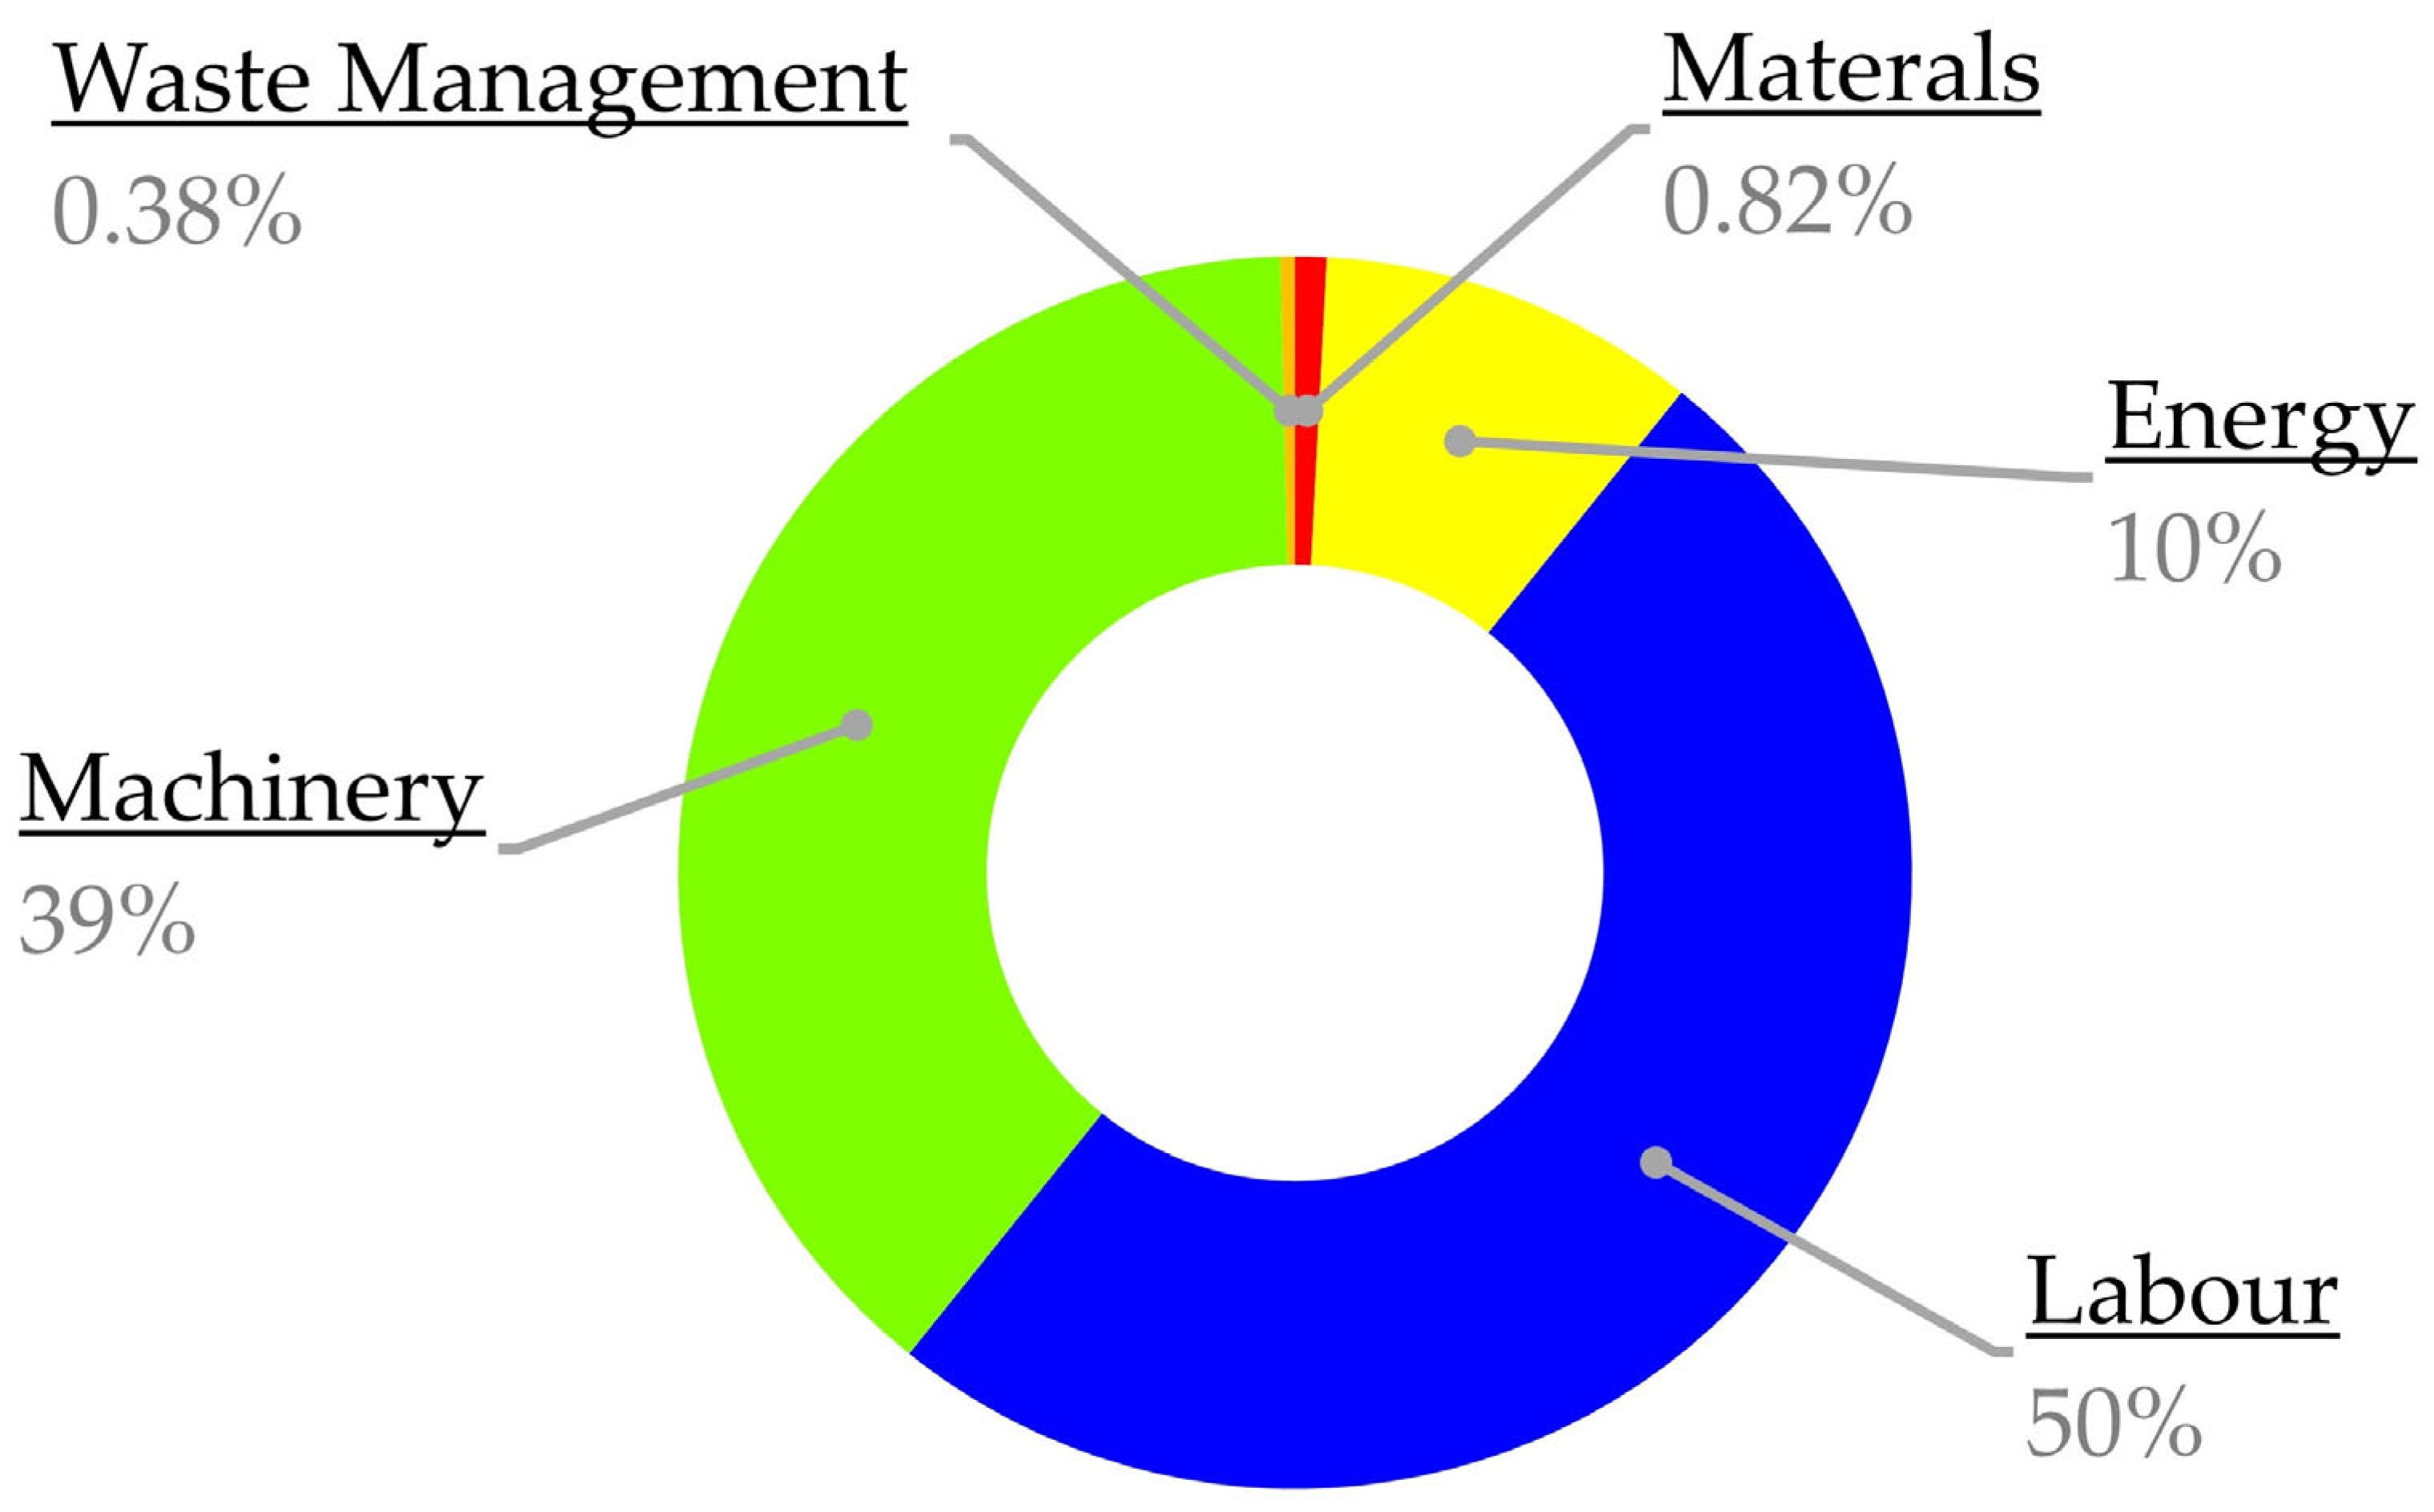
- Quantify the material flows in physical units. Five main categories describe the processes at each quantity centre: materials, energy, system costs (labour and machinery) and waste management.
- Verify via material balance across each QC.
- Cost classification: quantify the material flow in monetary units.
- MFCA data summary and interpretation
- Identification and assessment of improvement opportunities.
3.1. Specify the Boundaries and Time Period of the Study
3.2. Determine the Quantity Centres
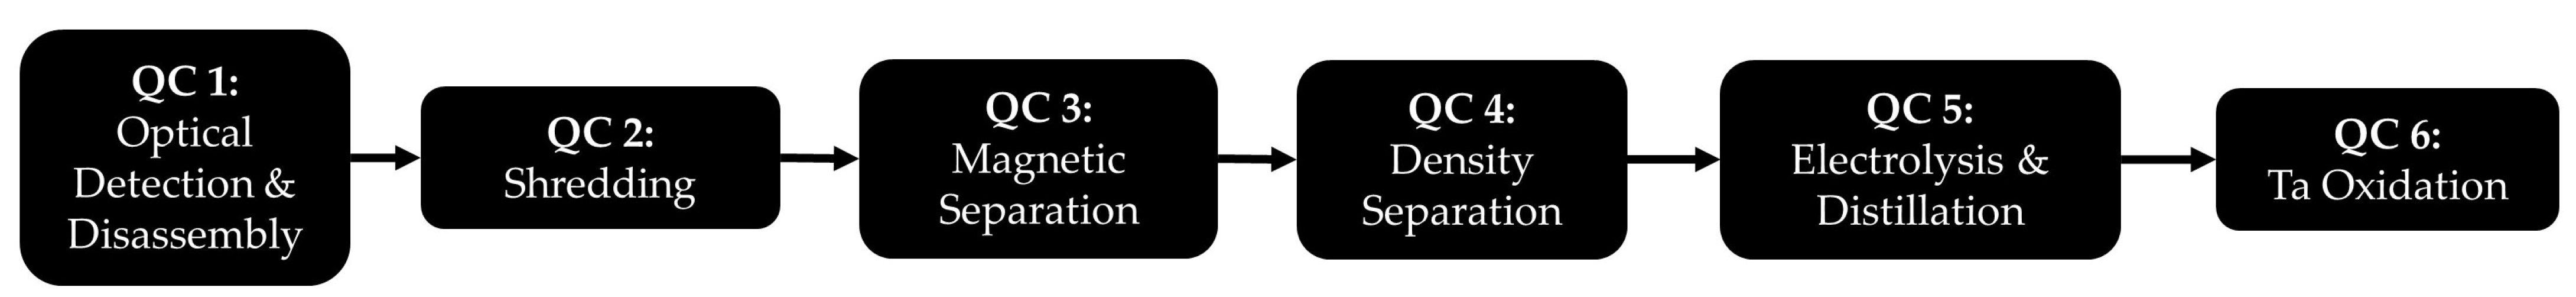
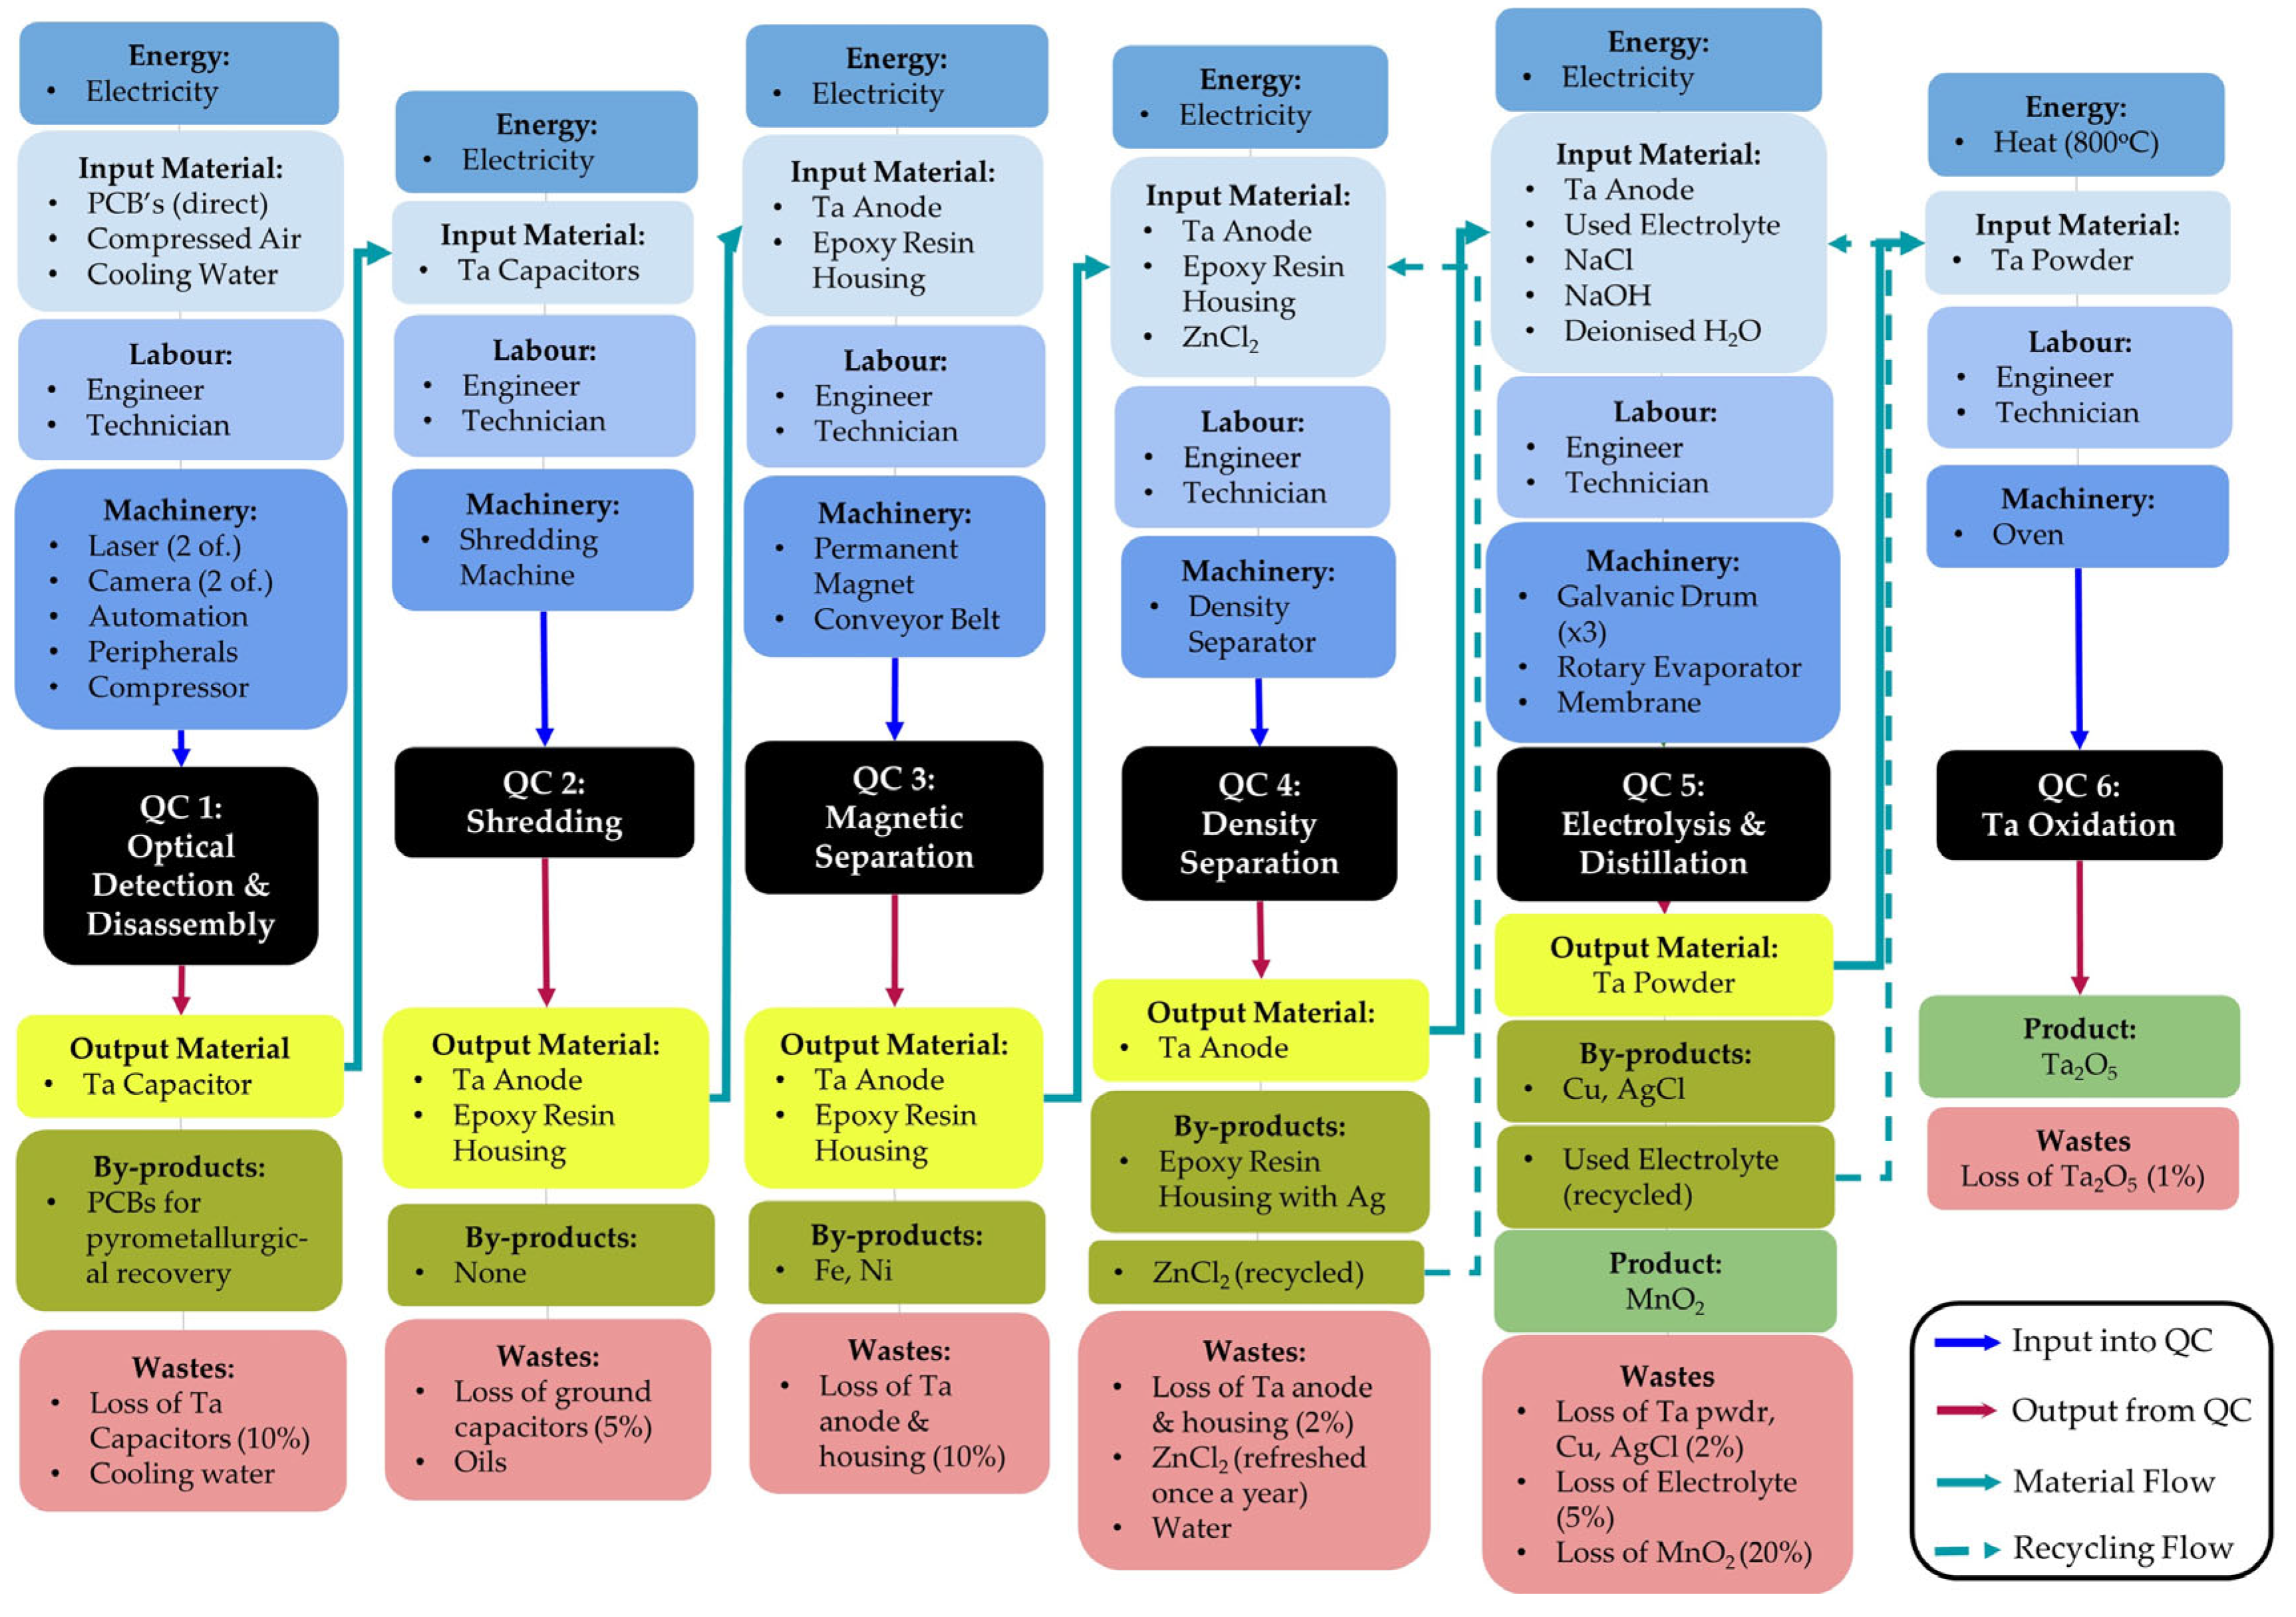
3.2.1. IRETA 2
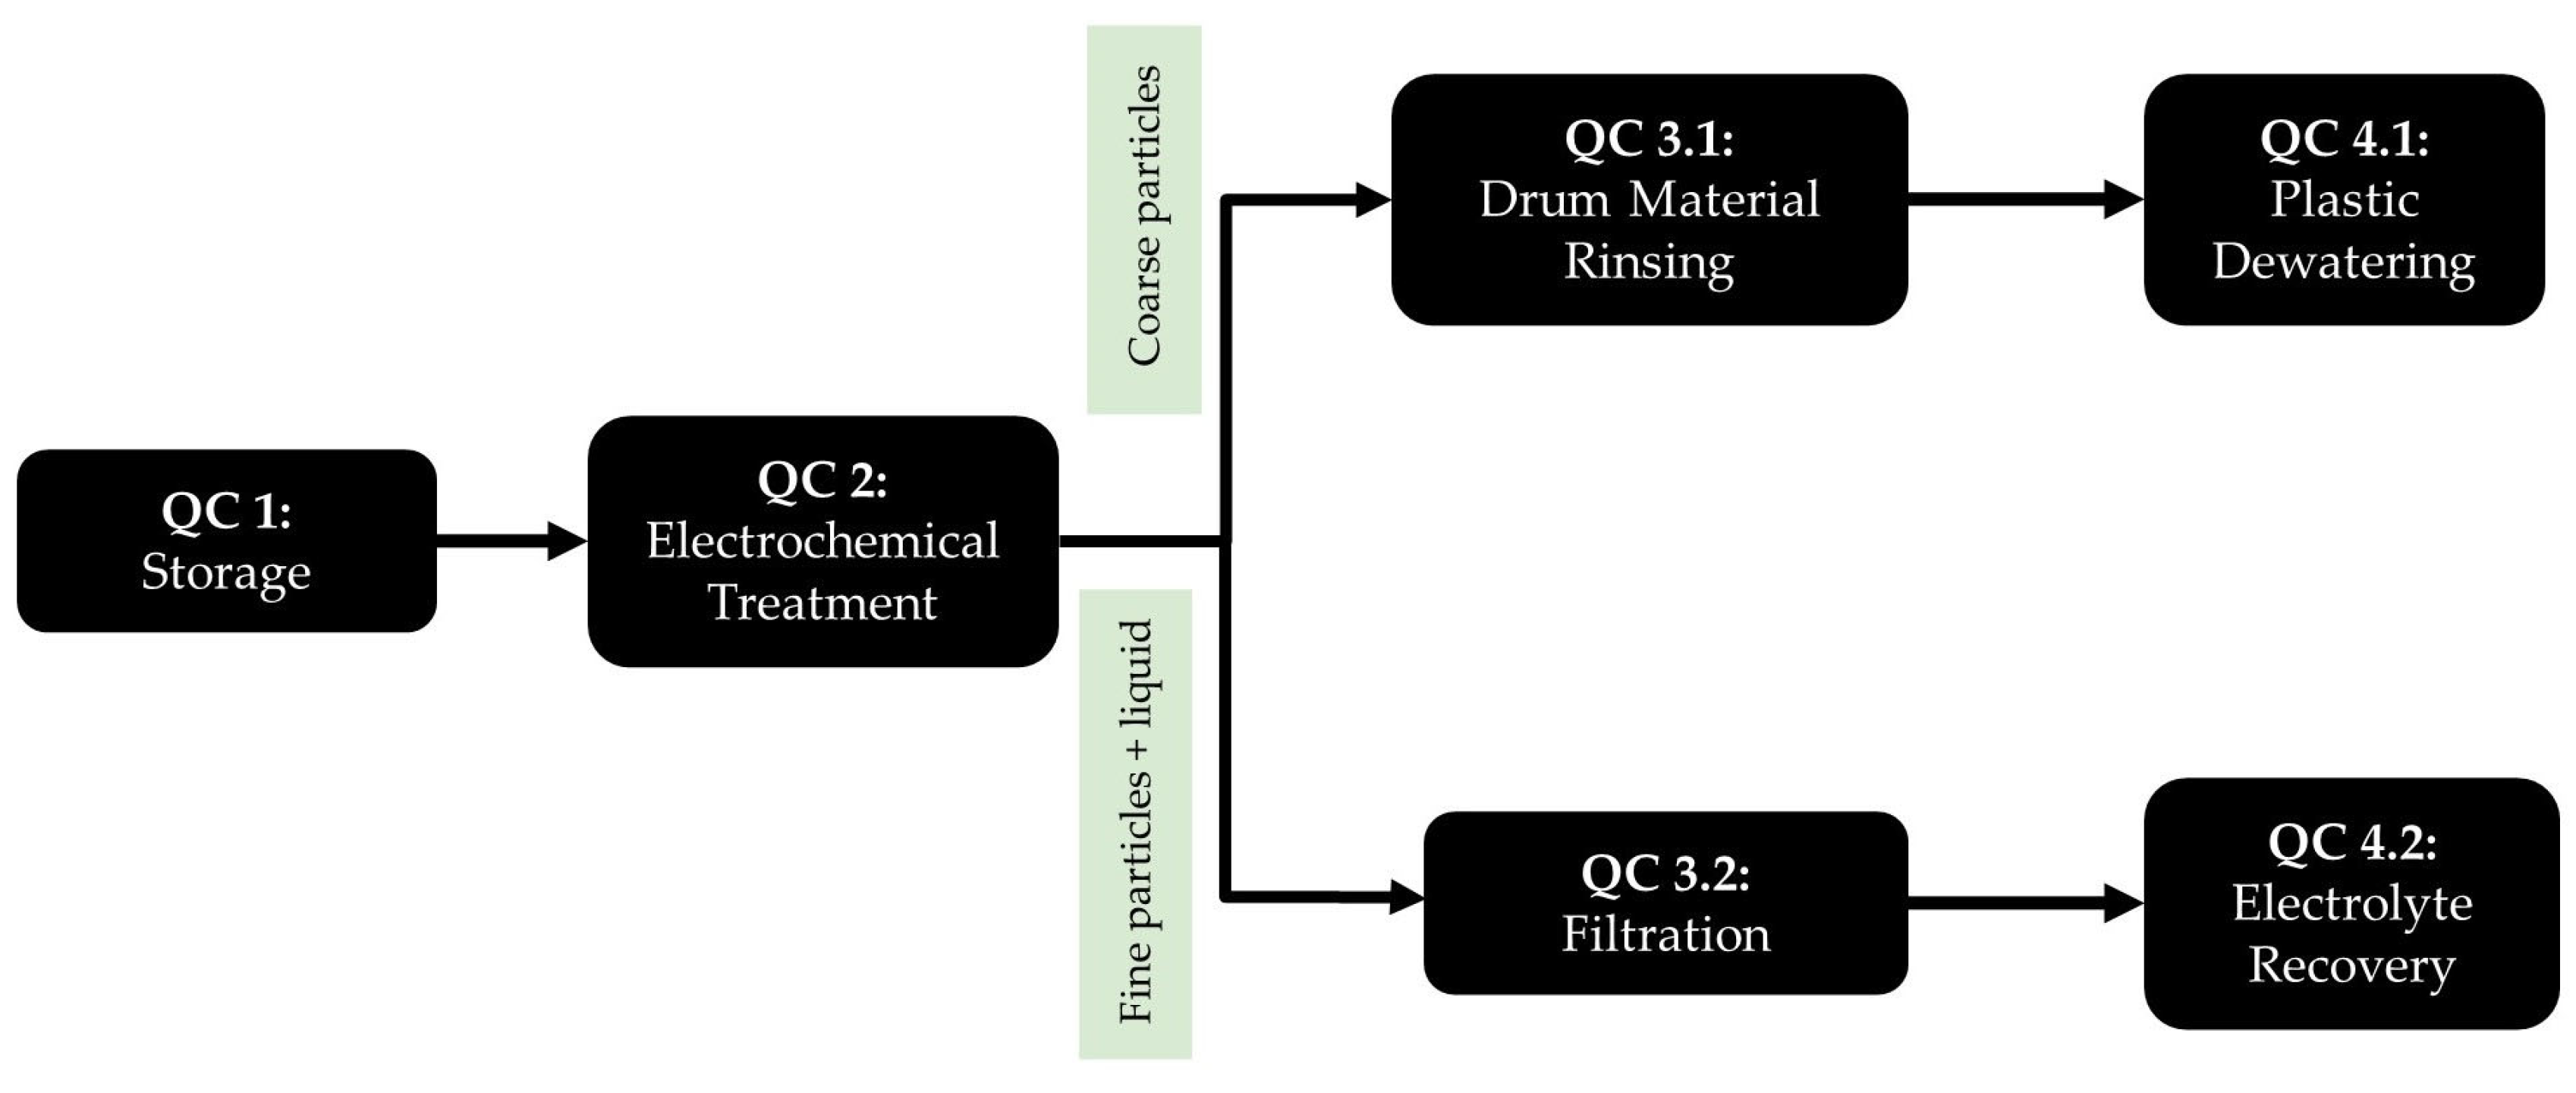
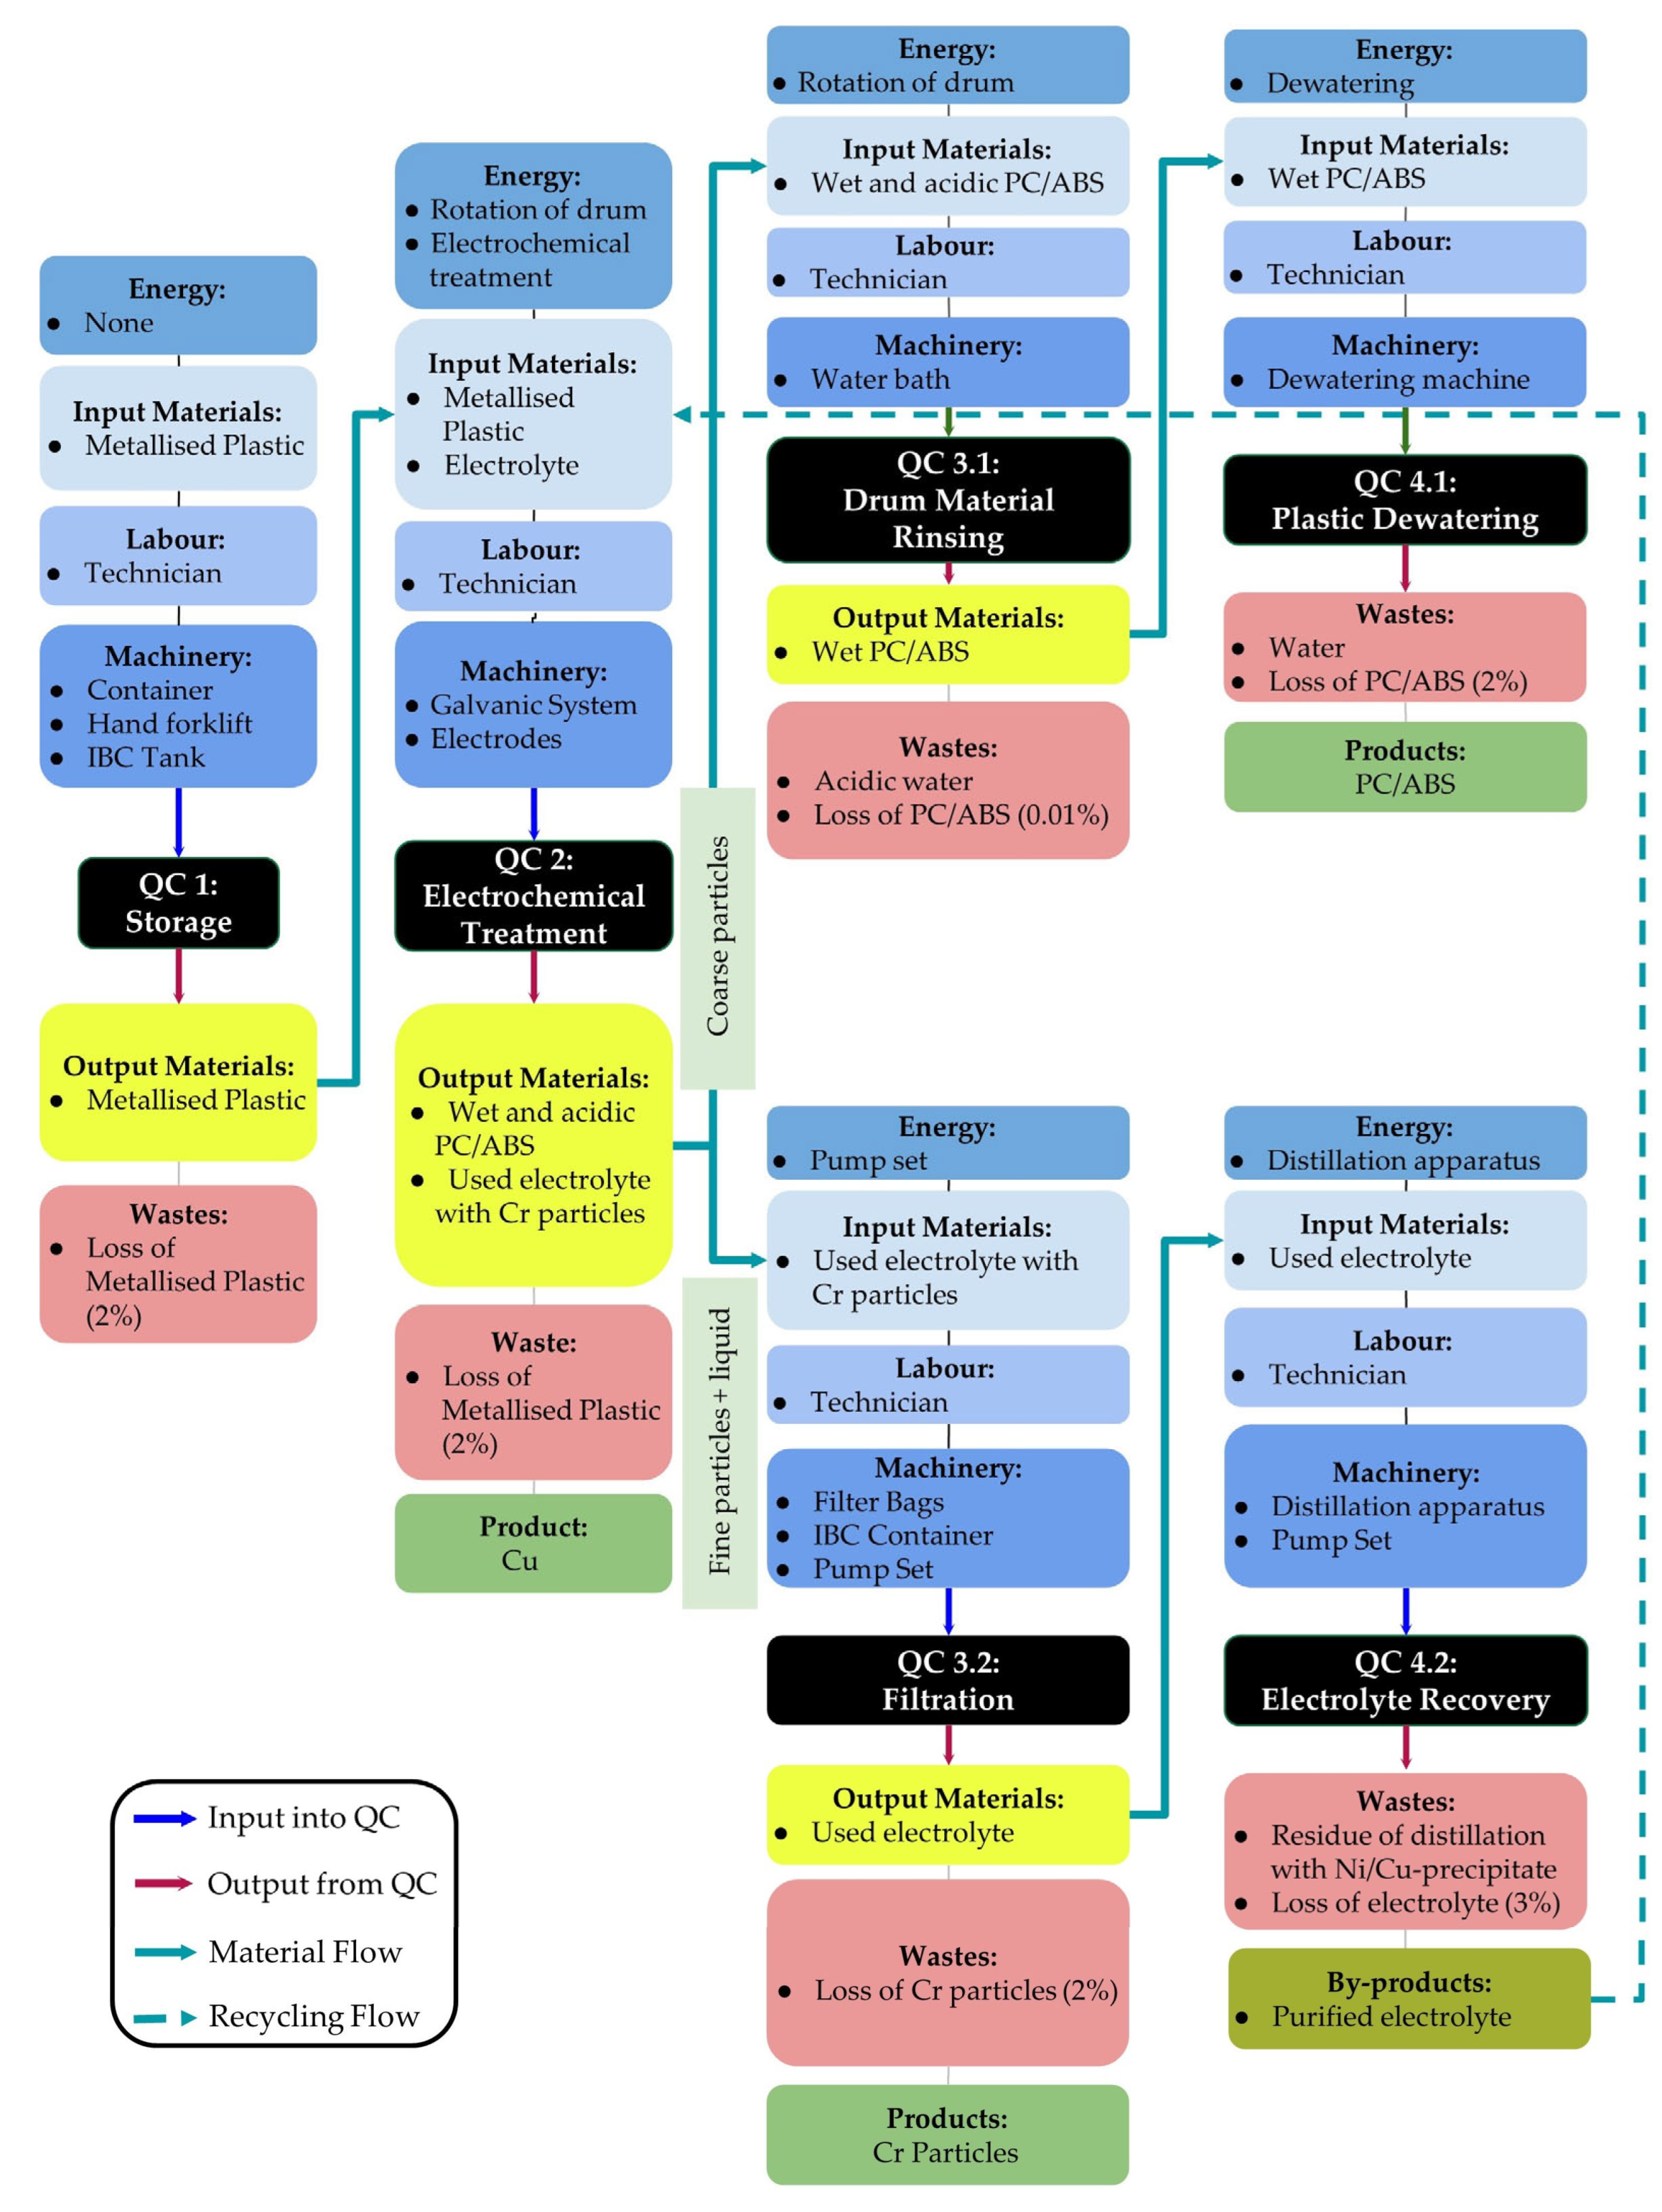
3.2.2. ReComp
3.3. Quantify the Material Flows in Physical Units
3.4. Verify via Material Balance across Each QC
3.5. Cost Classification: Quantify the Material Flow in Monetary Units
- Material costs: The material cost comprises two types: direct and indirect. Direct materials are generally those materials that are input at the beginning of the process (QC1). For IRETA2 the direct materials are the PCBs; for ReComp, the direct materials are the metallised plastics. Indirect materials are materials added at intermediary steps to facilitate the process in that quantity centre, for example, cooling water, compressed air and chemicals such as CH3SO3H or NaCl.
- Energy costs: The energy cost consists of electricity costs required to operate the machinery at each QC. Mairec provided the adopted electricity rate for IRETA2. This company currently purchases electricity from the power market at 0.40 EUR/kWh (source: Mairec). The electricity rates for ReComp were taken from the average industrial prices including tax in Germany for 2022 [22]. The current average industrial rates for 2022 are 0.27 EUR/kWh [22].
- Labour costs: the labour costs were obtained from each company’s average production worker hourly rate (employer’s gross) and were categorised as either a technician at 20 EUR/hr or engineer at 30 EUR/hr (source: company data).
- Machinery costs: The machinery cost calculation consists of three parts: the purchase price of the equipment, salvage value and depreciation rate. The purchase prices were obtained from vendor quotes. The depreciation rate and salvage value were determined based on advice from the various quantity centre owners regarding the operating environment (for example, in dusty environments, the equipment is expected to have a shorter lifespan). All machinery was given a zero-salvage value, with five or ten years of depreciation.
- Waste management costs: The waste management costs include all fees associated with the handling and disposal of waste by third parties. The cost of disposal of wastes other than wastewater was obtained from the Berliner Stadtreinigung (BSR) price list for disposal from trade, crafts, commerce and services with volumes less than 500 kg per producer and year [23]. The costs for disposing chemicals (for example, ZnCl2) were obtained from waste disposal company quotes. The cost of wastewater was obtained from BWB and priced at 0.0022 EUR/kg [17].
3.6. Calculate the Projects’ Overall Profit or Loss
3.6.1. IRETA2
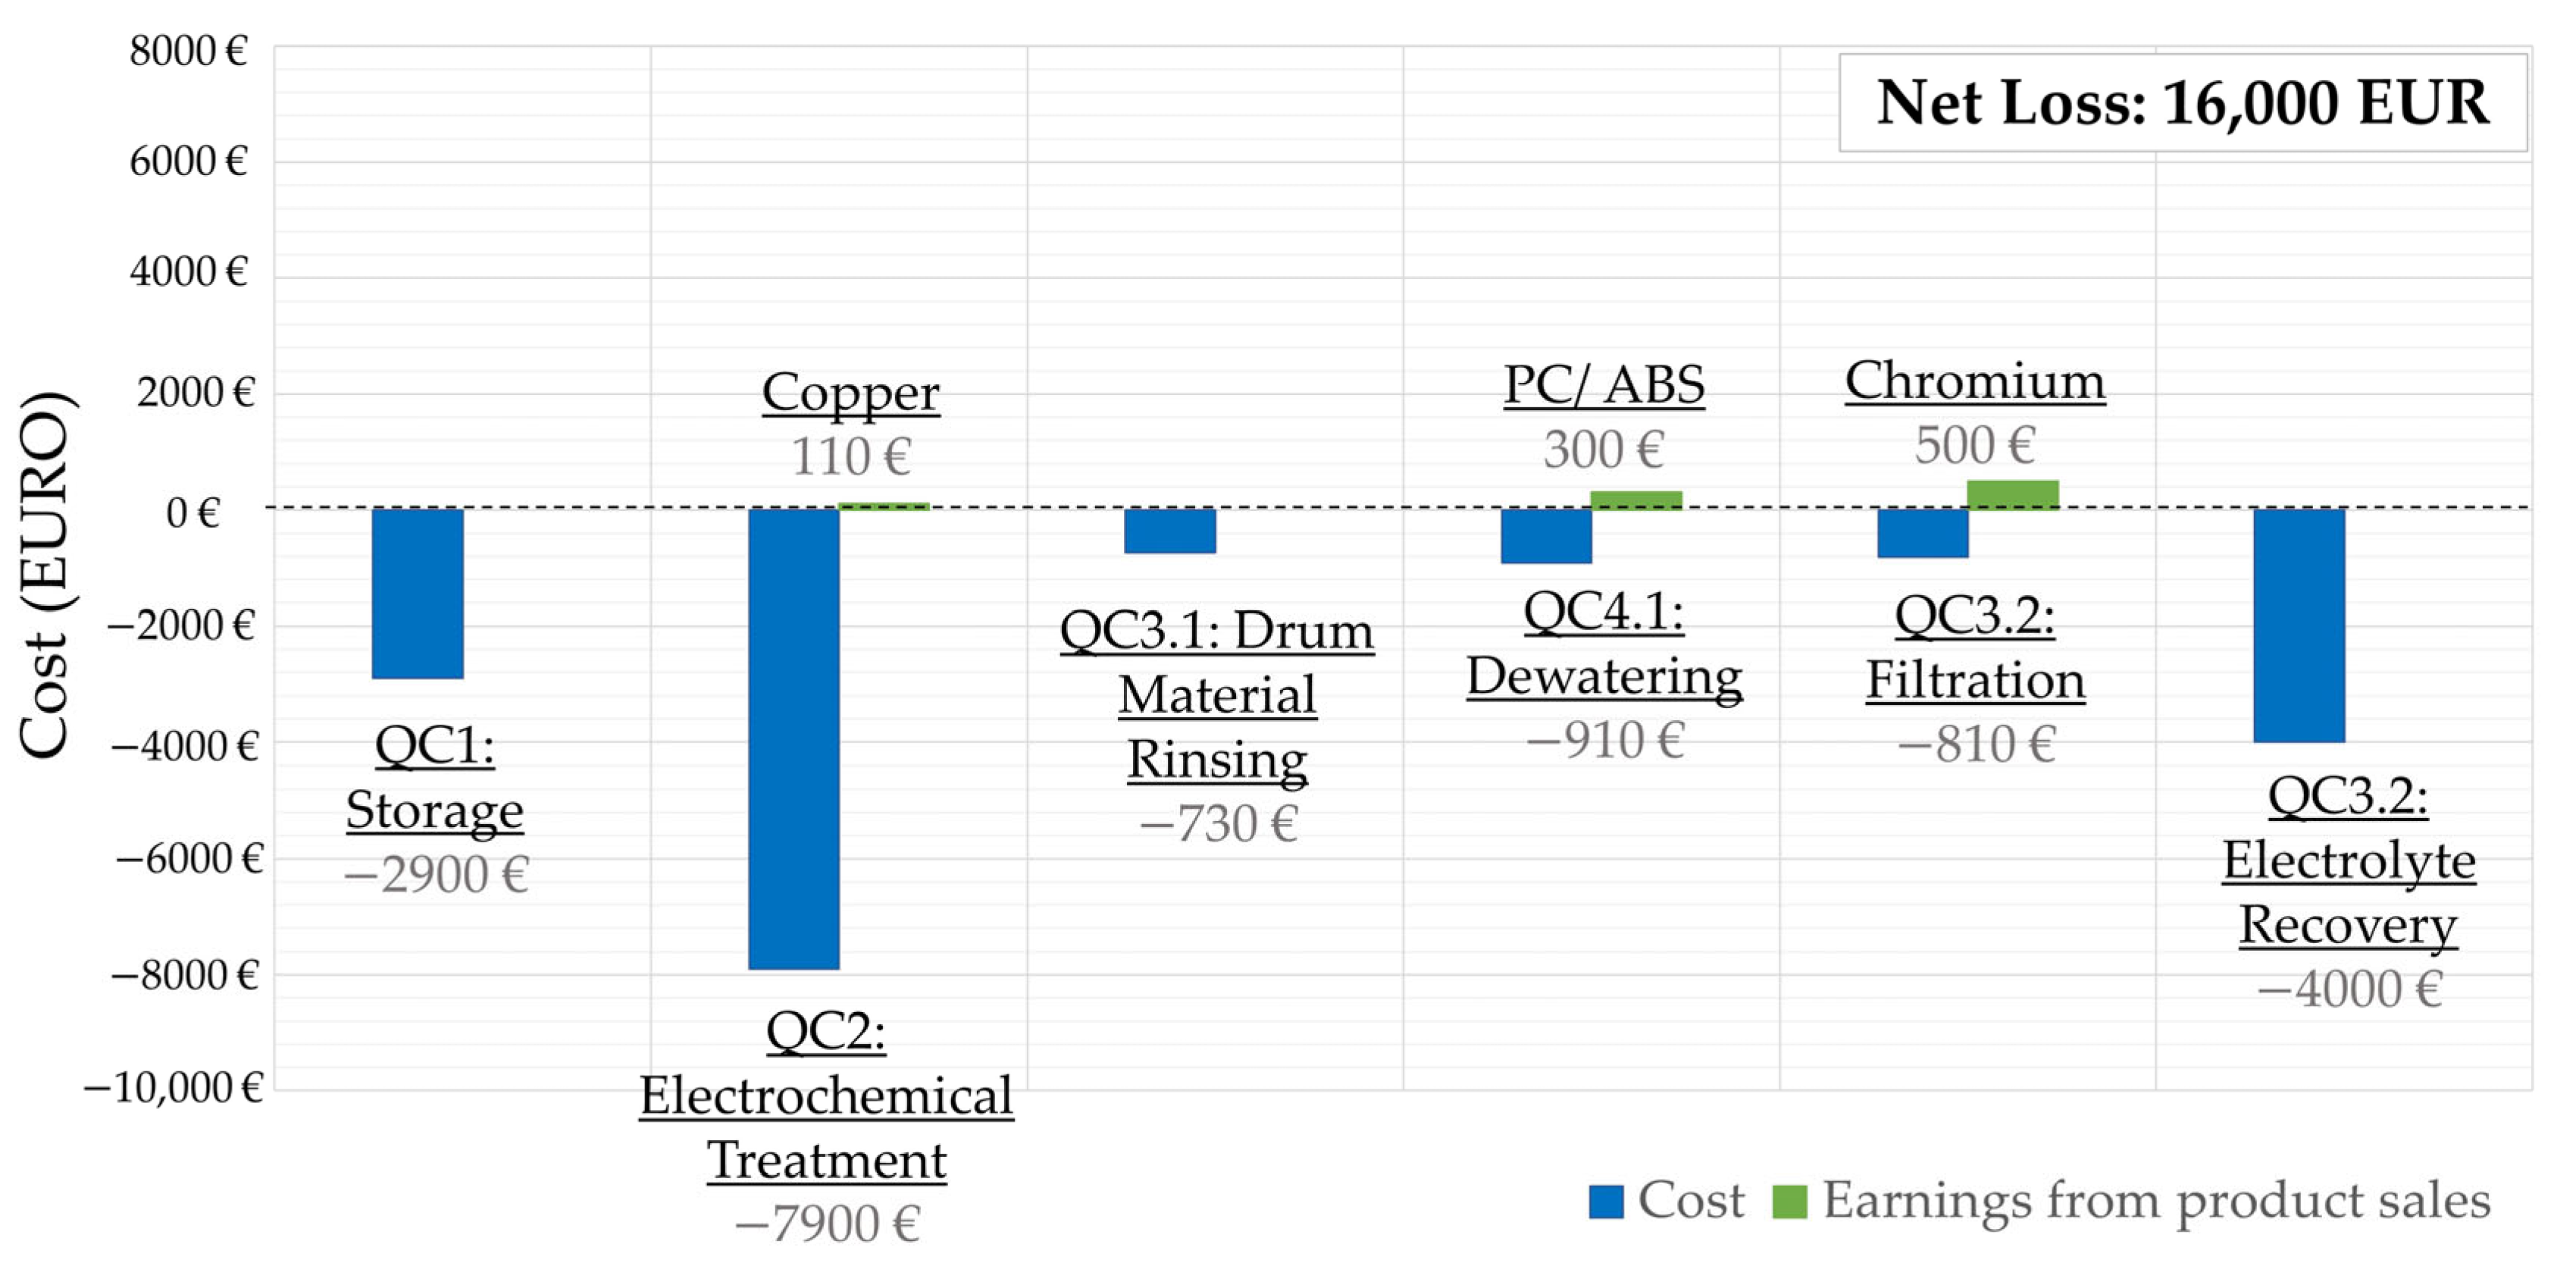
3.6.2. ReComp
3.7. Sensitivity Analysis
4. Results and Discussion
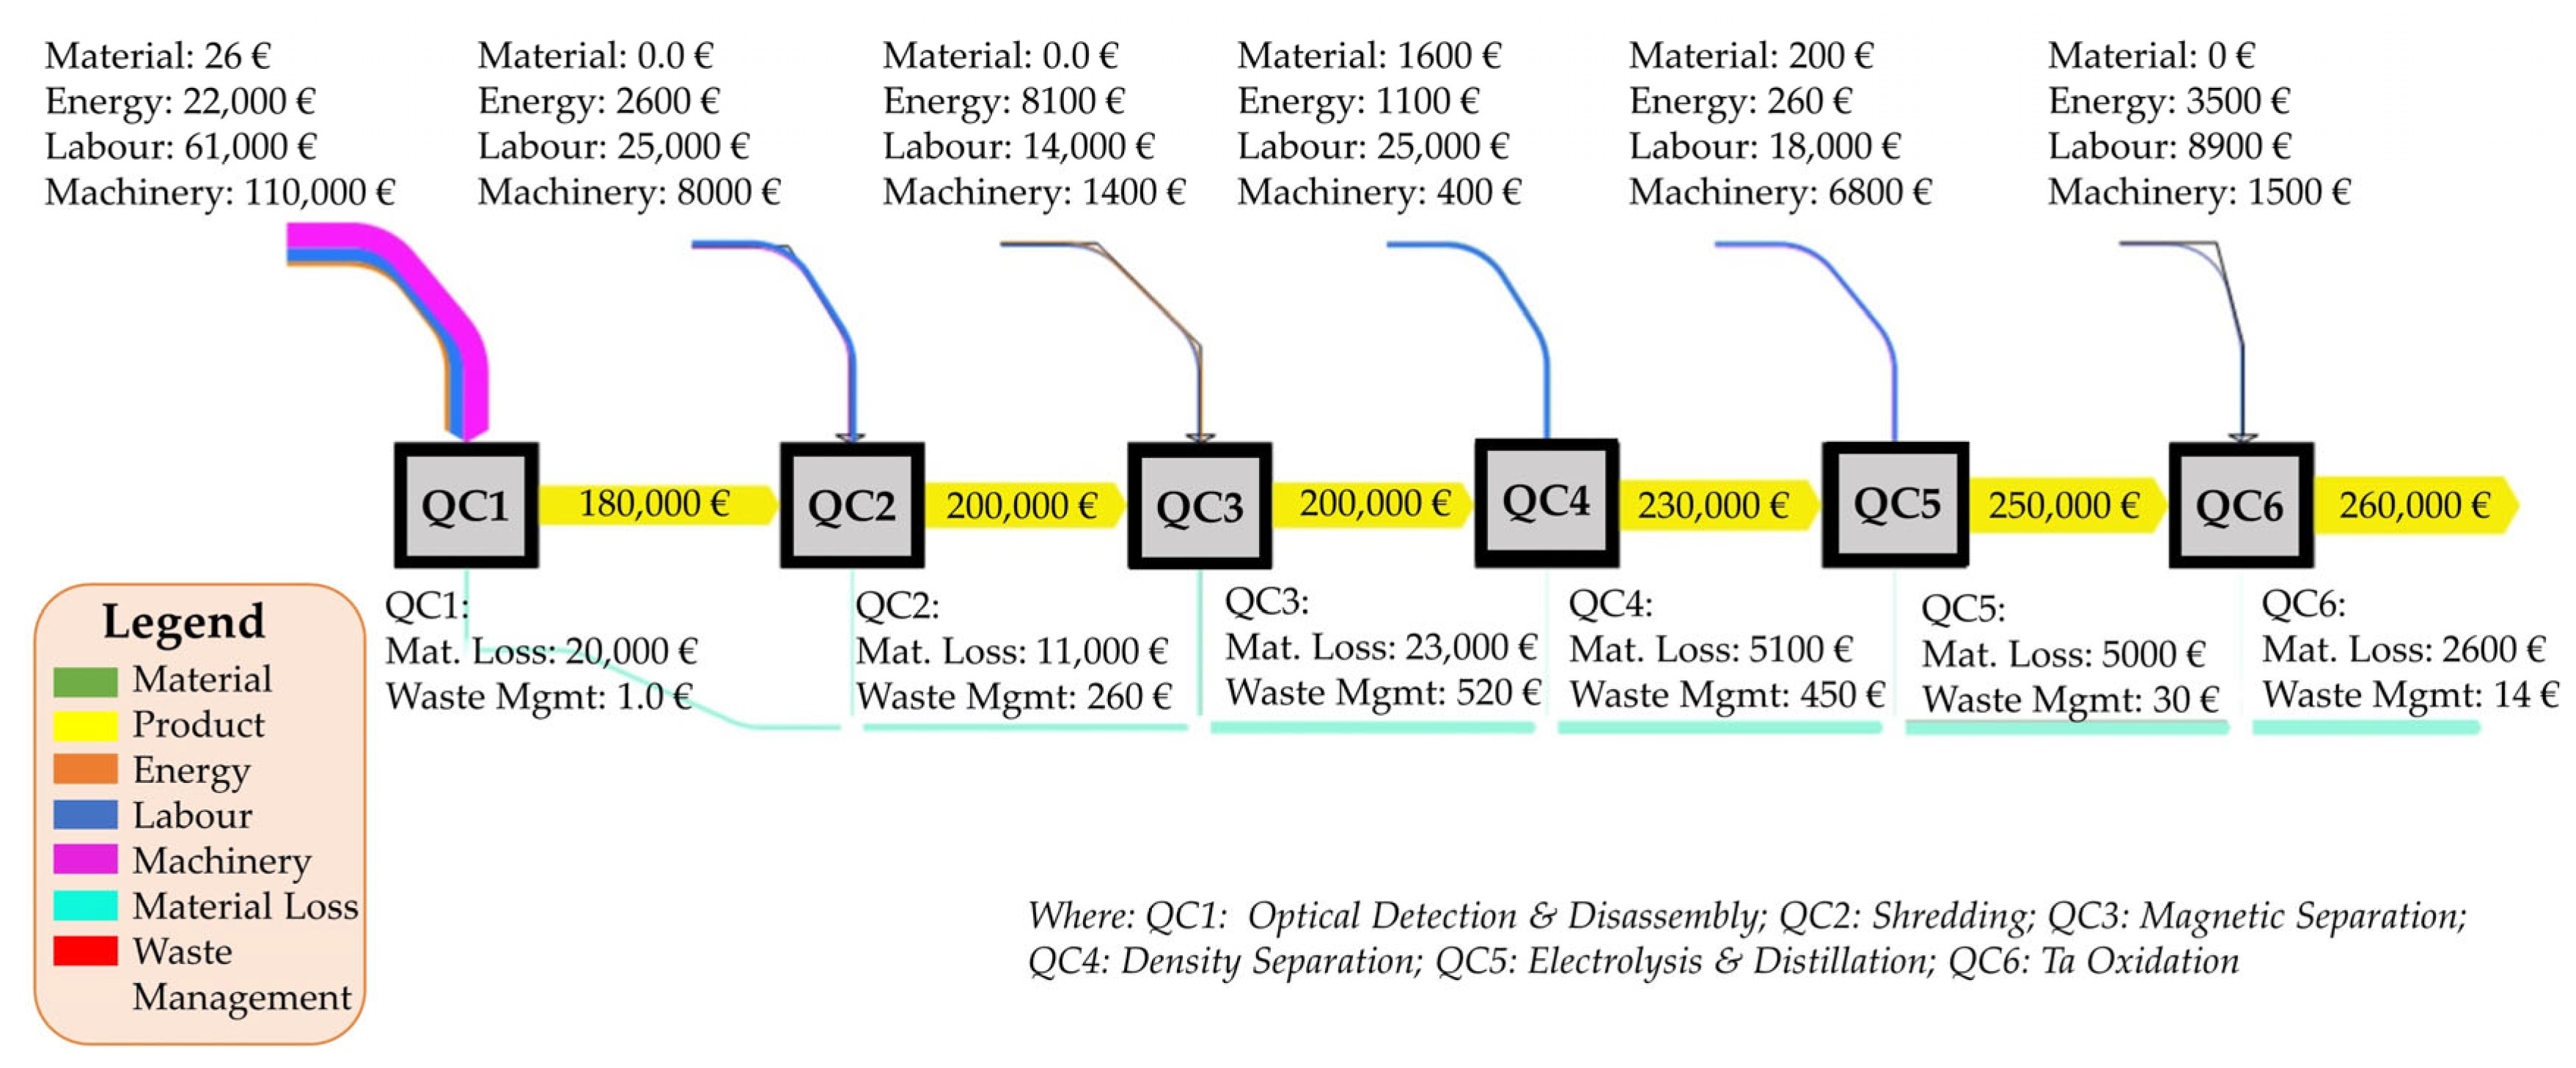
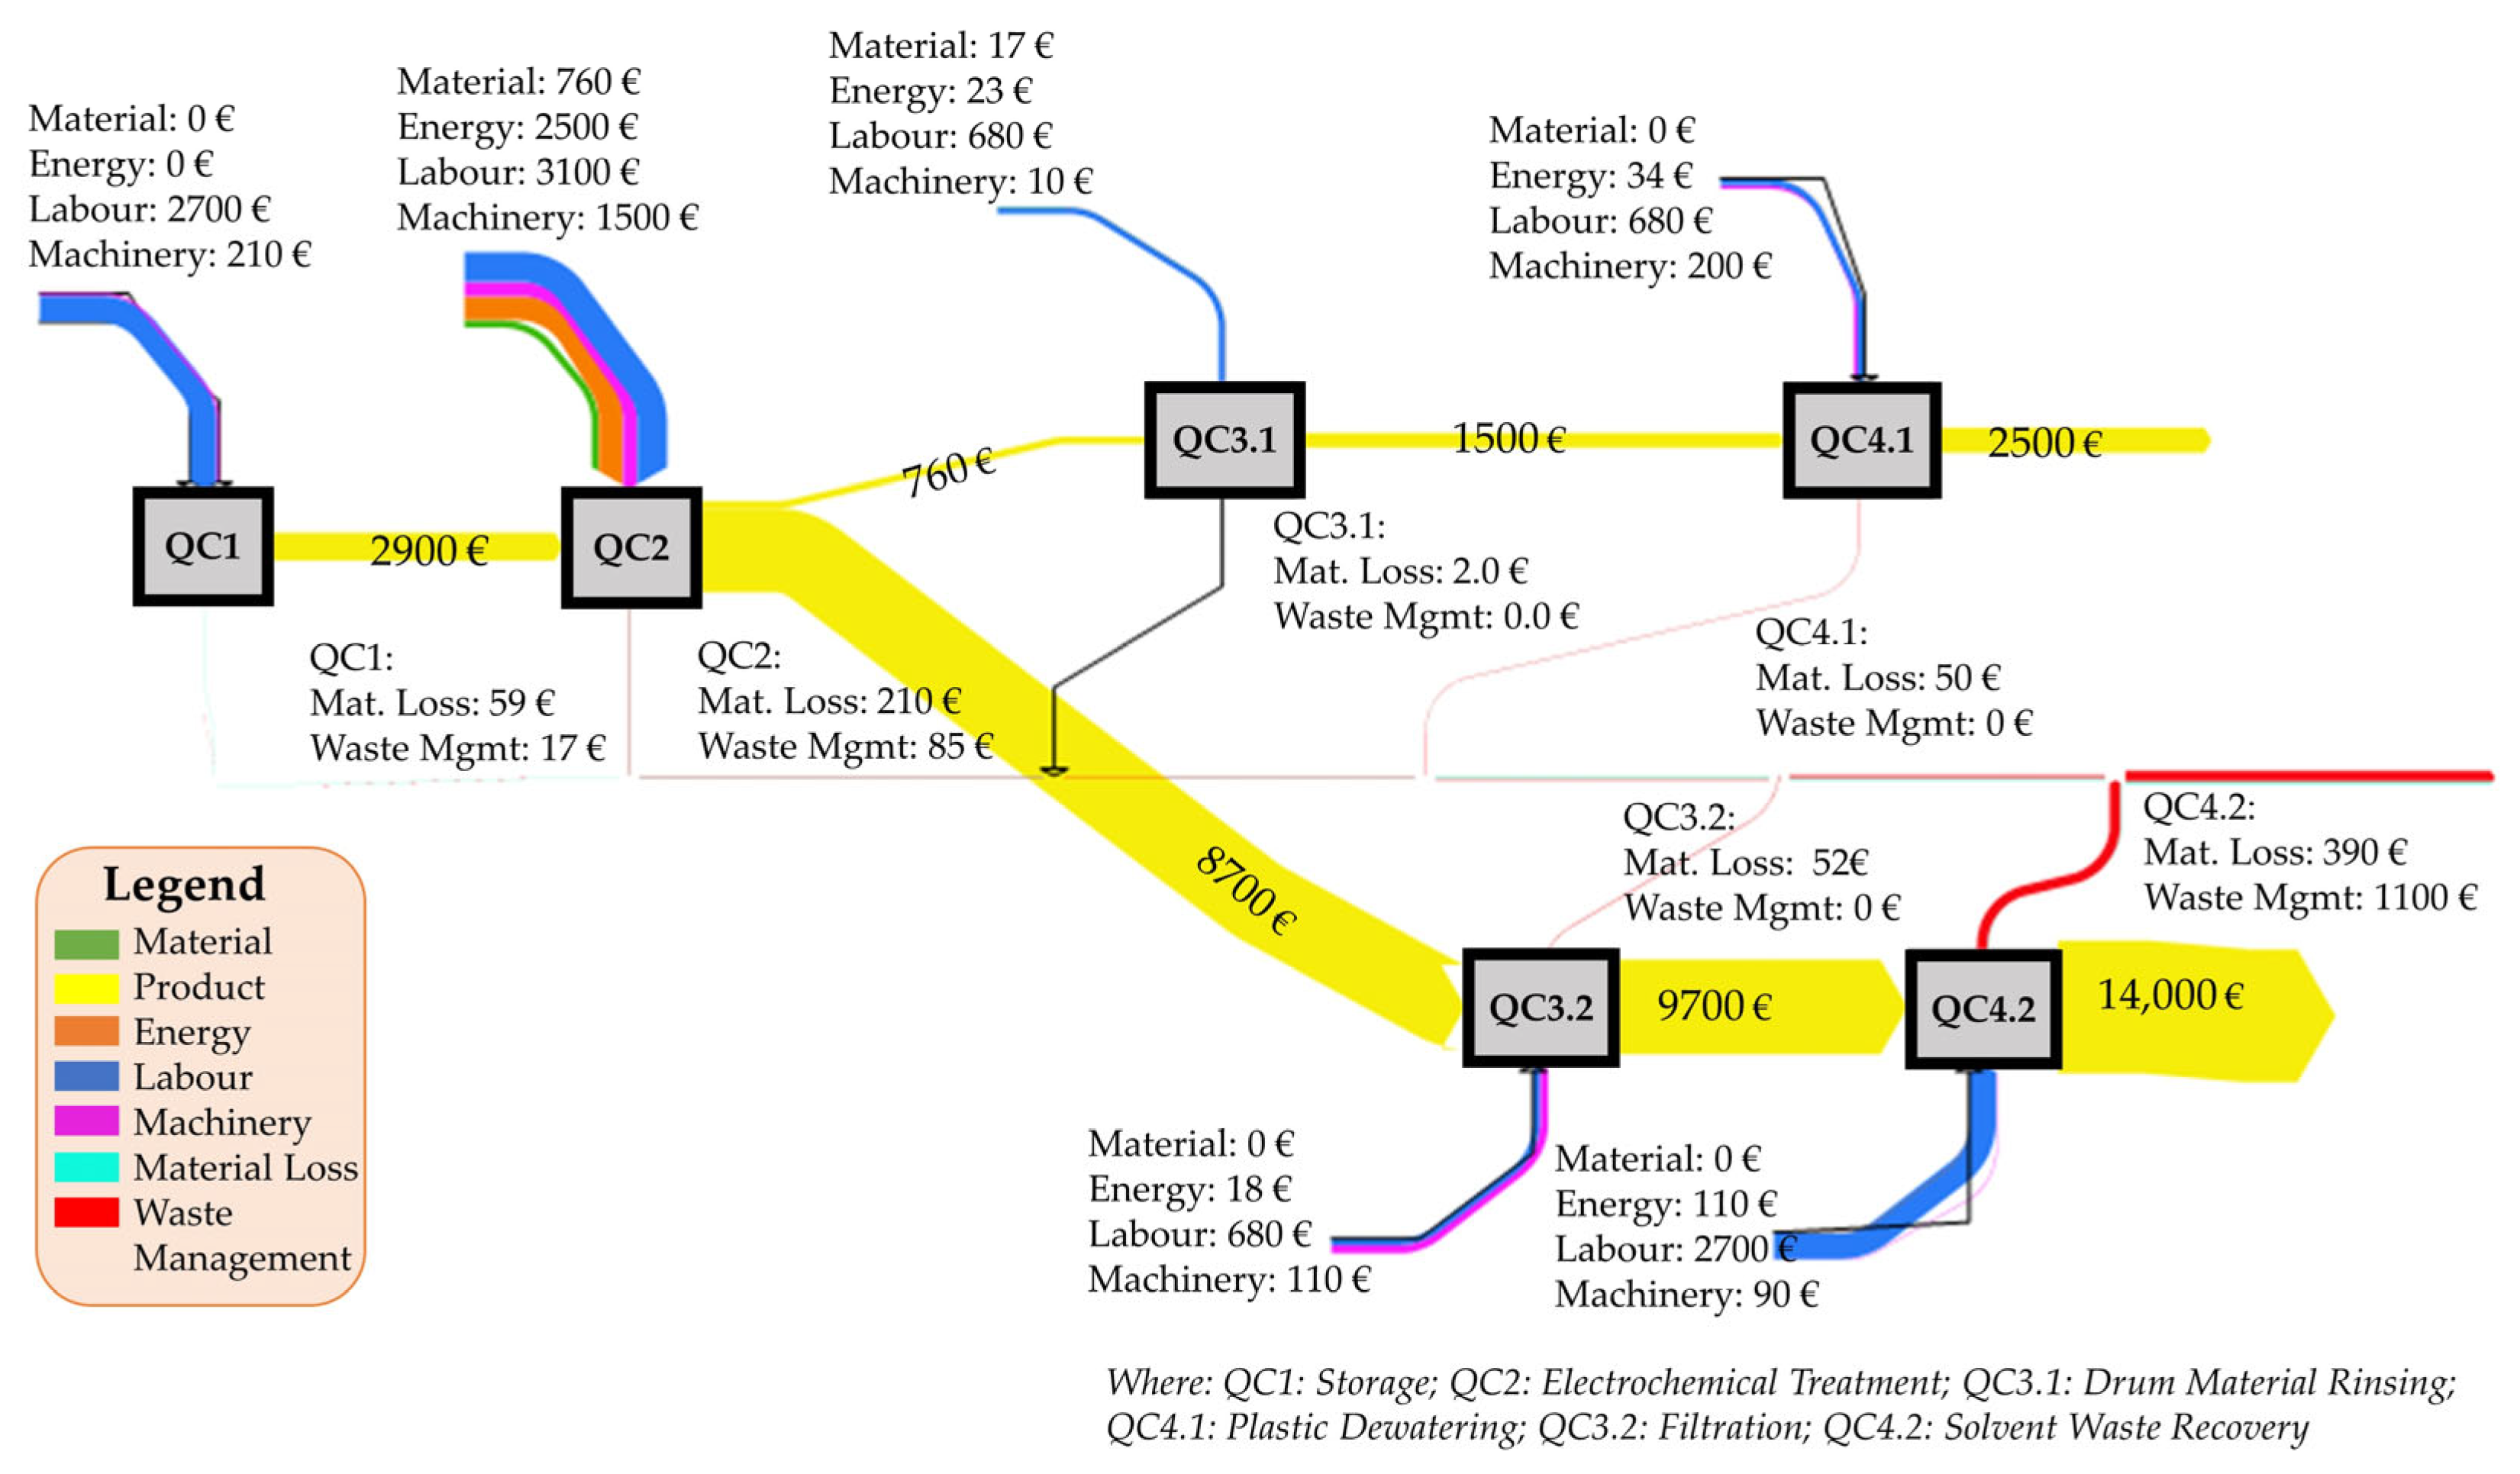
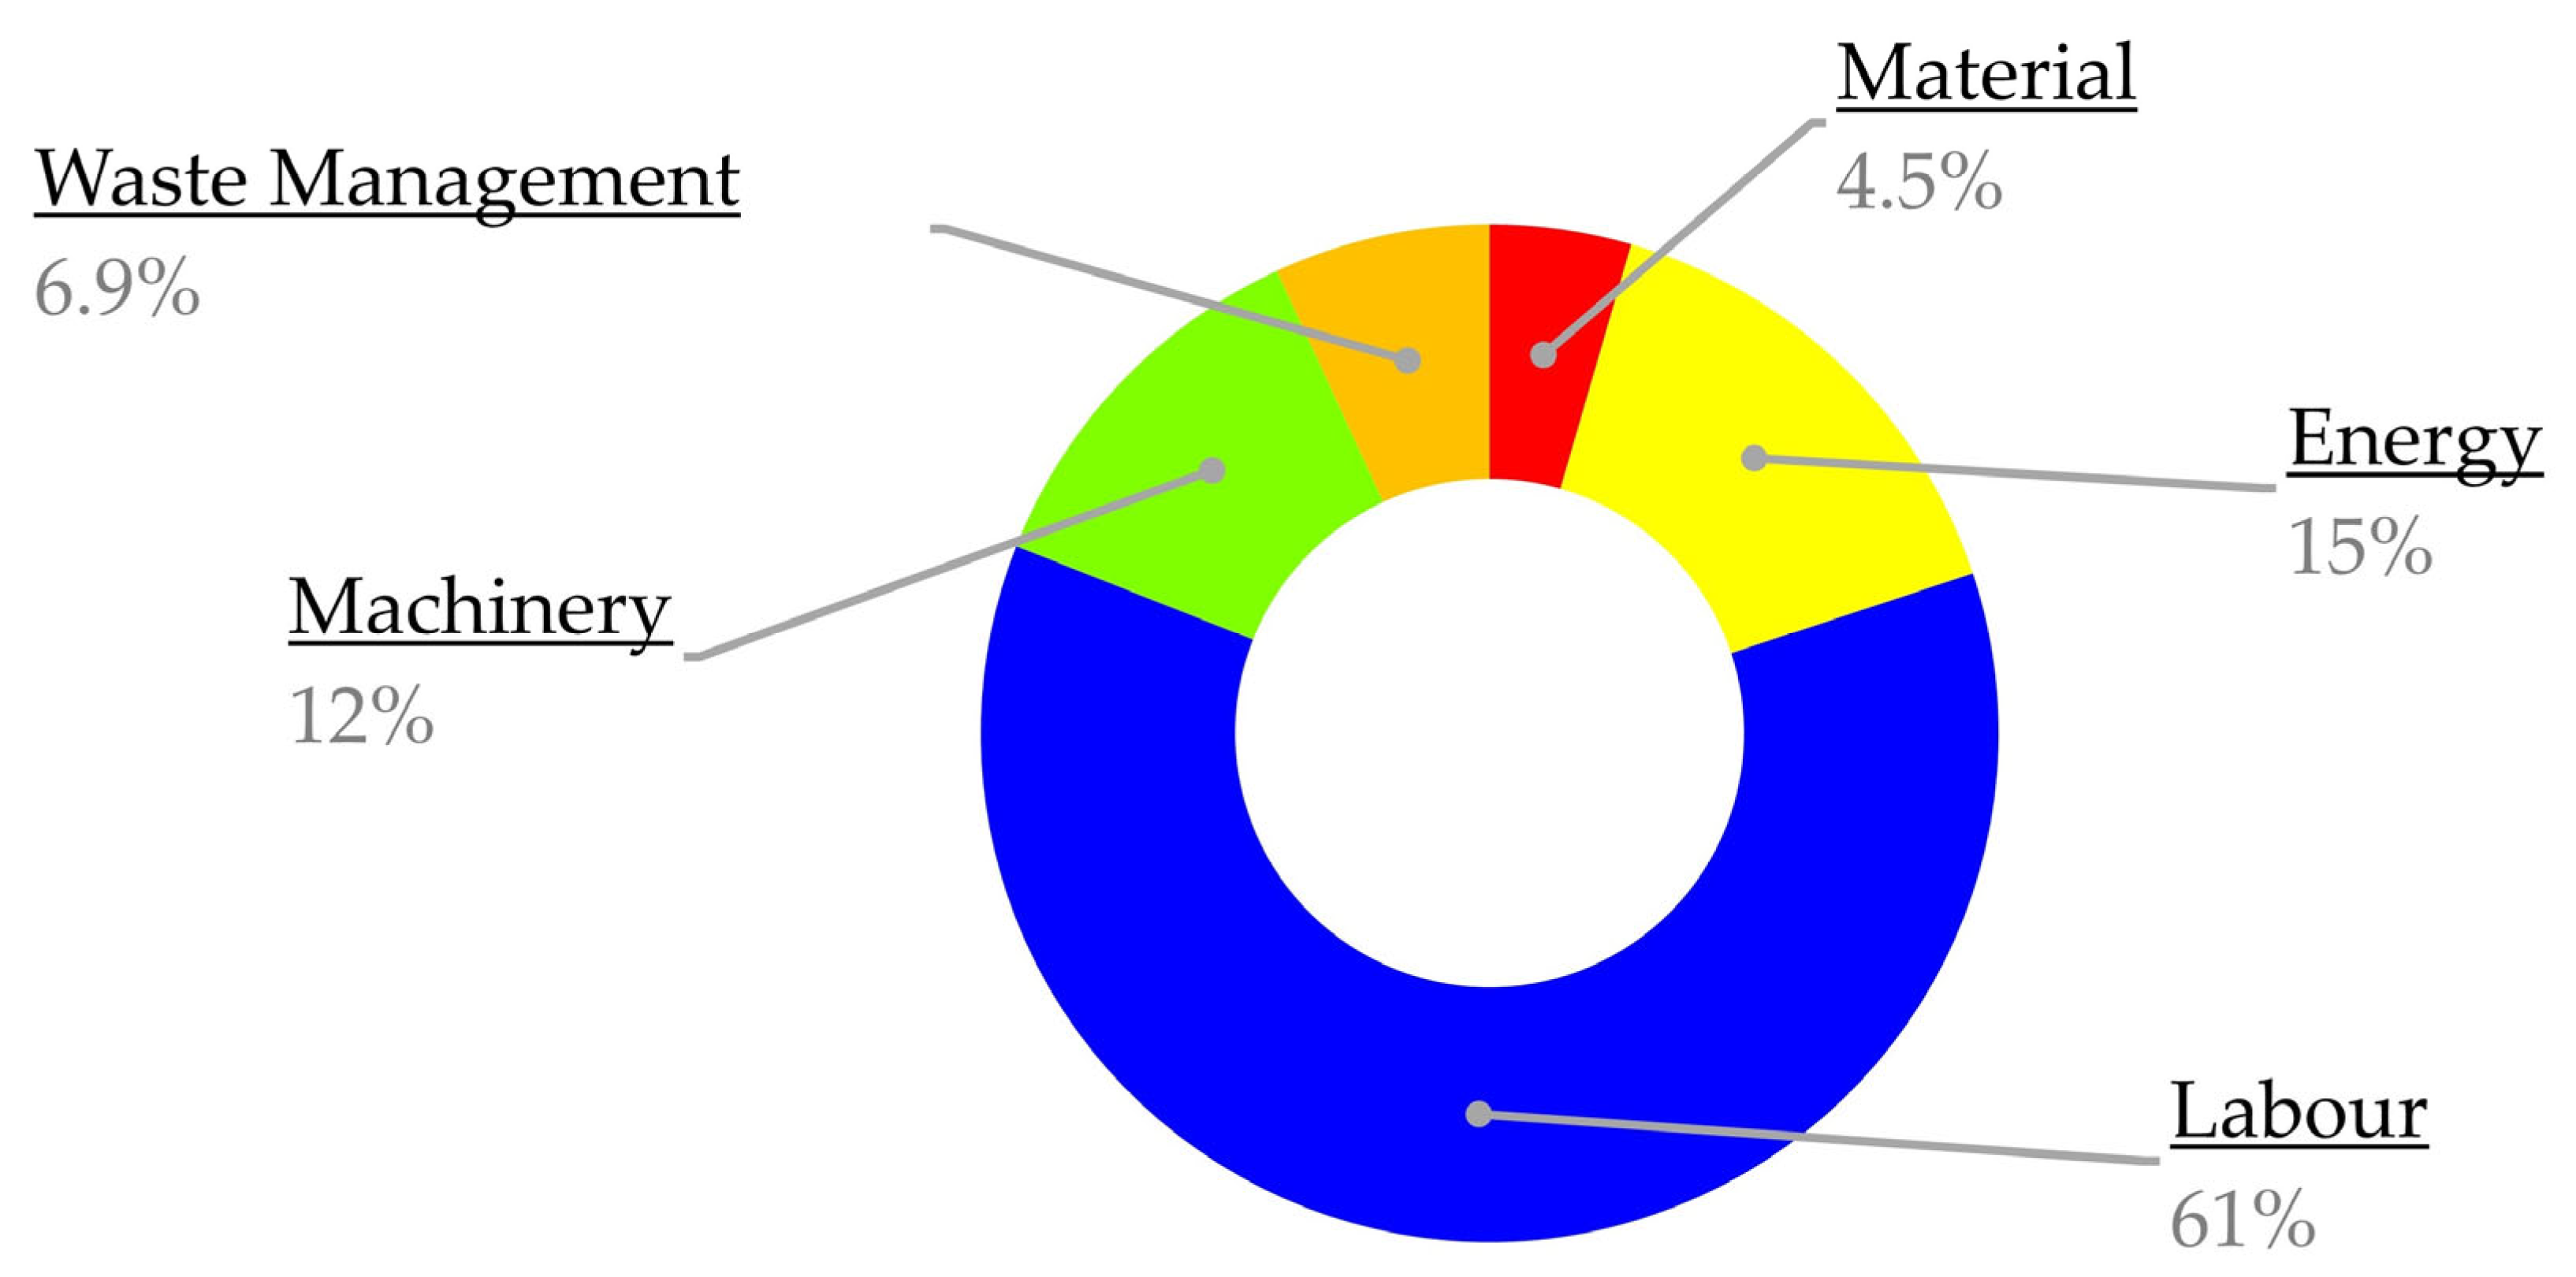
4.1. Cost Flow Results
4.2. Main Results
4.2.1. IRETA2
4.2.2. ReComp
4.3. Sensitivity Analysis
4.3.1. IRETA2
4.3.2. ReComp
4.4. Implications of the Results for Research, Industry and Policy
5. Conclusions
Author Contributions
Funding
Institutional Review Board Statement
Informed Consent Statement
Data Availability Statement
Acknowledgments
Conflicts of Interest
References
- Christ, K.L.; Burritt, R.L. Material flow cost accounting: A review and agenda for future research. J. Clean. Prod. 2015, 108, 1378–1389. [Google Scholar] [CrossRef]
- Asian Productivity Organization. Manual on Material Flow Cost Accounting ISO 14051. Tokyo, 2014. Available online: https://www.apo-tokyo.org/publications/wp-content/uploads/sites/5/Manual_on_Material_Flow_Cost_Accounting_ISO14051-2014.pdf (accessed on 25 January 2023).
- Wagner, B. A report on the origins of Material Flow Cost Accounting (MFCA) research activities. J. Clean. Prod. 2015, 108, 1255–1261. Available online: https://d-nb.info/1235327485/34. (accessed on 25 February 2023). [CrossRef]
- ISO 14051:2011-12; Environmental Management. Technical Committee ISO/TC 207 Environmental Management: Brussels, Belgium, 2011.
- Huang, S.Y.; Chiu, A.A.; Chao, P.C.; Wang, N. The Application of Material Flow Cost Accounting in Waste Reduction. Sustainability 2019, 11, 1270. [Google Scholar] [CrossRef]
- Hyršlová, J.; Vágner, M.; Palásek, J. Material Flow Cost Accounting (MFCA)—Tool for the Optimization of Corporate Production Process. Bus. Manag. Educ. 2011, 9, 5–18. [Google Scholar] [CrossRef]
- Schaltegger, S.; Zvezdov, D. Expanding material flow cost accounting. Framework, review and potentials. J. Clean. Prod. 2015, 108, 1333–1341. [Google Scholar] [CrossRef]
- Tran, T.T.; Herzig, C. Material Flow Cost Accounting in Developing Countries: A Systematic Review. Sustainability 2020, 12, 13. [Google Scholar] [CrossRef]
- Walz, M.; Guenther, E. What effects does material flow cost accounting have for companies? Evidence from a case studies analysis. J. Ind. Ecol. 2020, 25, 593–613. [Google Scholar] [CrossRef]
- Fetting, C. The European Green Deal, ESDN Report Vienna. 2020. Available online: https://www.esdn.eu/fileadmin/ESDN_Reports/ESDN_Report_2_2020.pdf (accessed on 20 April 2023).
- Sauer, F.; Choi, B.-K.; Beck, G.; Wickleder, M. Recovery of Tantalum from Printed Circuit Boards An Overview of the IRETA Project. World Metall. 2019, 72, 216–222. Available online: https://www.researchgate.net/publication/334882118 (accessed on 12 October 2022).
- European Commission. Study on the EU’ s List of Critical Raw Materials: Critical Raw Materials Factsheets; European Commission: Brussels, Belgium, 2020. [Google Scholar] [CrossRef]
- Damm, S. Rohstoffrisikobewertung—Tantal—DERA Rohstoffinformationen 31. 2018. Available online: https://www.deutsche-rohstoffagentur.de/DE/Gemeinsames/Produkte/Downloads/DERA_Rohstoffinformationen/rohstoffinformationen-31.pdf;jsessionid=48281818160AB960B88D9B9A9D1B3FED.1_cid292?__blob=publicationFile&v=4 (accessed on 5 January 2022).
- Knappich, F.; Schlummer, M.; Mäurer, A.; Prestel, H. A new approach to metal- and polymer-recovery from metallized plastic waste using mechanical treatment and subcritical solvents. J. Mater. Cycles Waste Manag. 2018, 20, 1541–1552. [Google Scholar] [CrossRef]
- International Energy Agency. The Role of Critical Minerals in Clean Energy Transitions. 2022. Available online: https://www.iea.org/reports/the-role-of-critical-minerals-in-clean-energy-transitions (accessed on 12 January 2023).
- Plastics Insider. Pursuing Zero Net Waste in the Plastic Industry Association’s D.C. Offices. Plast. Eng. 2017, 73, 38. [Google Scholar] [CrossRef]
- Berlin Wasserbetriebe (BWB). Our Tariffs for Drinking Water and Drainage. 2023. Available online: https://www.bwb.de/en/1720.php#:~:text=2.1 Wastewater,2.210 euros per cubic metre (accessed on 26 February 2023).
- Carl Roth-Germany. Zinc Chloride, 1 kg, CAS No. 7646-85-7 | Zinc Salts, Zn | Salts for Analysis (p.a.) | Salts | Inorganic & Analytical Reagents. Available online: https://www.carlroth.com/de/de/zinksalze-zn/zinkchlorid/p/t887.2 (accessed on 3 March 2023).
- Carl Roth-Germany. Methanesulphonic Acid, 1 l, CAS No. 75-75-2. Available online: https://www.carlroth.com/de/en/a-to-z/methanesulphonic-acid/p/4090.3 (accessed on 3 March 2023).
- Carl Roth-Germany. Sodium Chloride, 1 kg, Plastic, CAS No. 7647-14-5 | Sodium Salts, Na | Salts for Analysis (p.a.) | Salts | Inorganic & Analytical Reagents. Available online: https://www.carlroth.com/de/en/sodium-salts-na/sodium-chloride/p/3957.1 (accessed on 3 March 2023).
- Carl Roth-Germany. Sodium Hydroxide Solution, CAS No. 1310-73-2 | Volumetric Standard Solutions, Ready-to-Use, Reag. Ph. Eur | Volumetric Standard Solutions | Inorganic & Analytical Reagents. Available online: https://www.carlroth.com/de/en/volumetric-standard-solutions-ready-to-use-reag-ph-eur/sodium-hydroxide-solution/p/6785.1 (accessed on 3 March 2023).
- S. BDEW: Bundesverband der Energie-Abnehmer. Industrial Electricity Prices Including Tax Germany 1998-2022 | Statista. Available online: https://www.statista.com/statistics/1050448/industrial-electricity-prices-including-tax-germany/?fbclid=IwAR1-dsnrDrKSxUtuzvp_wegPGoQXOoZD_XiMHGoK0kvLePfvfqE9t9PwMVw (accessed on 26 February 2023).
- BSR. Schadstoff-Kleinmengen. Berlin, 2023. Available online: https://www.bsr.de/assets/downloads/Preisliste_Schadstoffe_Gewerbe_WEB_2021.pdf (accessed on 20 February 2023).
- Roth, C. Manganese(IV) Oxide, 1 kg, CAS No. 1313-13-9 | A to Z | Chemicals | Carl Roth-Germany. Available online: https://www.carlroth.com/de/en/a-to-z/manganese%28iv%29-oxide/p/7751.3 (accessed on 26 February 2023).
- DERA-BGR. Preismonitor Januar 2023. 2023. Available online: https://www.deutsche-rohstoffagentur.de/DERA/DE/Aktuelles/Monitore/2023/01-23/2023-01-preismonitor.pdf;jsessionid=7194A842AB634A04A3B513E925DEB0B3.internet002?__blob=publicationFile&v=2 (accessed on 26 February 2023).
- Plasticker. Plasticker: Market & Prices. Available online: https://plasticker.de/preise/preise_monat_single.php (accessed on 27 February 2023).
- Gold.de. Current Copper Price. Available online: https://www.gold.de/kurse/kupferpreis/ (accessed on 27 February 2023).
- Institute for Rare Earths and Metals. Chrome | Institute for Rare Earths and Metals. Available online: https://en.institut-seltene-erden.de/?s=chromium (accessed on 27 February 2023).
- Pichery, C. Sensitivity Analysis. In Encyclopedia of Toxicology: Third Edition; Academic Press: Cambridge, MA, USA, 2014; pp. 236–237. [Google Scholar] [CrossRef]
- DERA-BGR. BGR-Price Monitor. Available online: https://www.deutsche-rohstoffagentur.de/DERA/DE/Produkte/Rohstoffpreise/Preismonitor/preismonitor_node.html (accessed on 26 February 2023).
- European Commission. EU Agrees New Law on More Sustainable and Circular Batteries. Press Release, 9 December 2022. Available online: https://ec.europa.eu/commission/presscorner/detail/en/ip_22_7588 (accessed on 17 April 2023).
- Press and Information Office of the Federal Government. The new Supply Chain Act. 2023. Available online: https://www.bundesregierung.de/breg-en/service/archive/supply-chain-act-1872076 (accessed on 17 April 2023).


| Quantity Centre | Process Description |
|---|---|
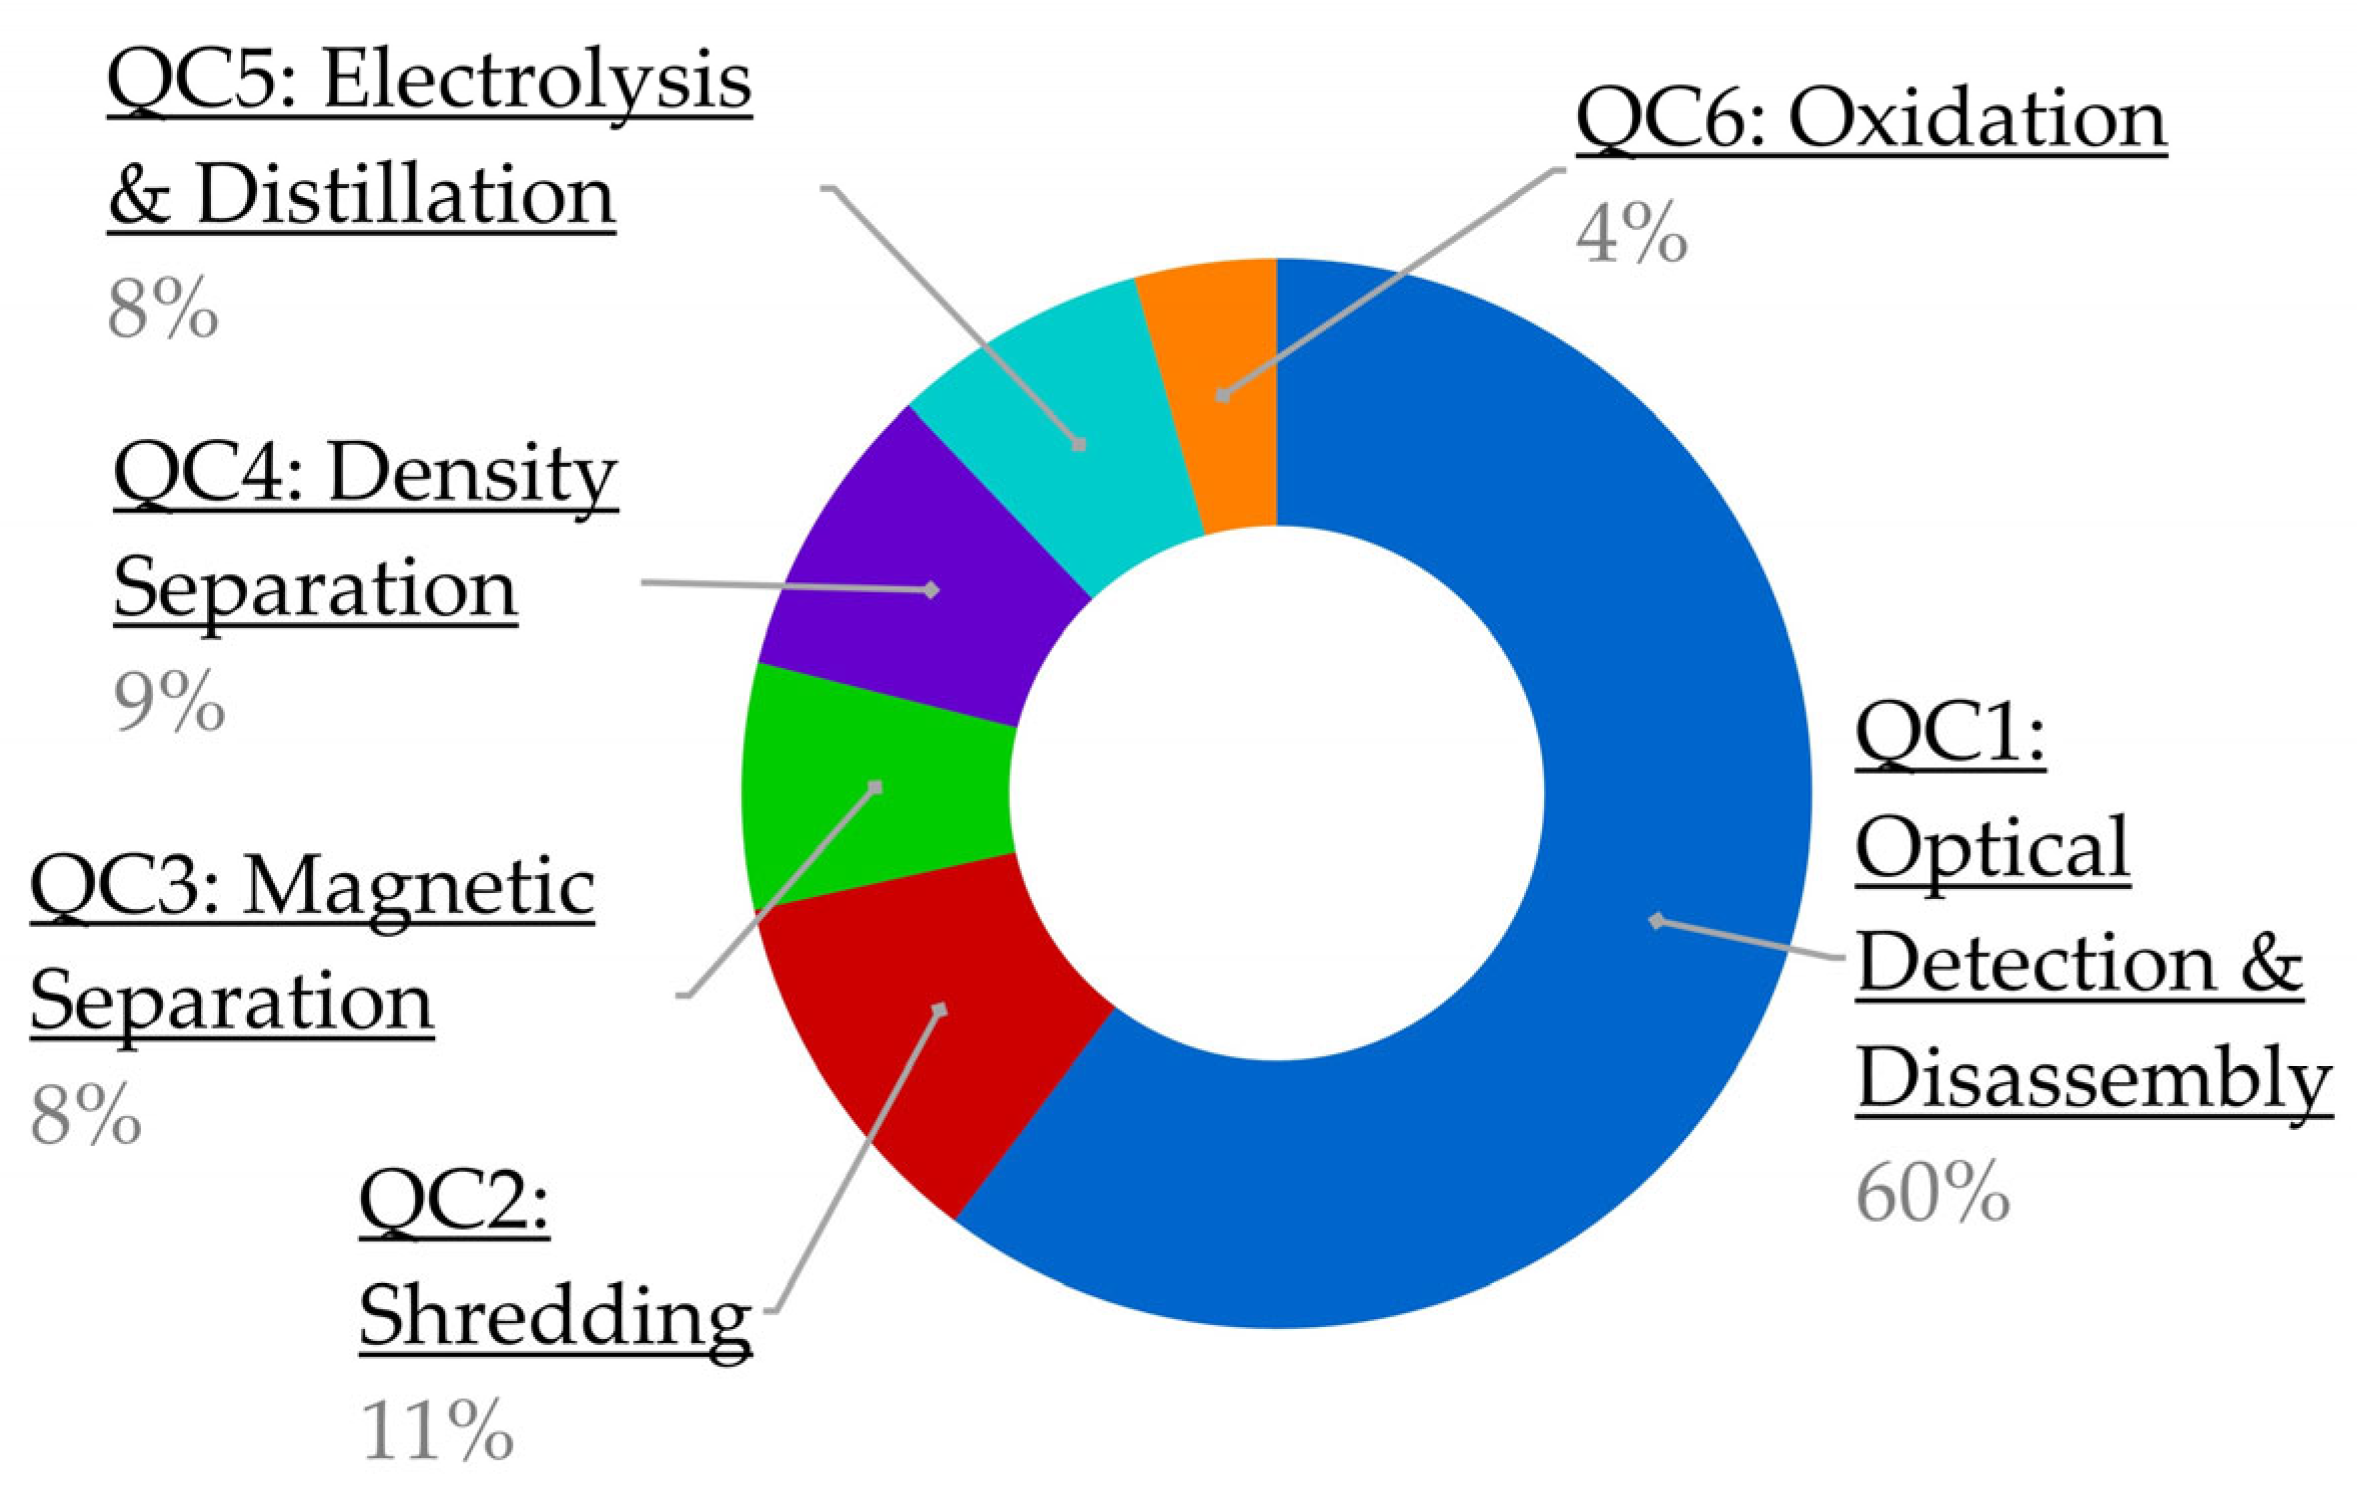
| QC 1: Optical Detection and Disassembly | Detection of the tantalum capacitors and removal from the PCB utilising a camera, fibre laser, conveyer belt and robots with grippers and accessory items. The capacitors are removed from the PCB via laser and compressed air to achieve the shortest processing rate possible (1 s per PCB + 0.3 s per capacitor). The PCB is turned and the capacitors from the other side are removed. |
| QC2: Shredding | Mechanical treatment via shredding to achieve comminution and separation of the epoxide resin and the metal contacts. |
| QC3: Magnetic Separation | Removal of ferrous metal contacts (Ni and Fe) from the shredded product using a permanent magnet and conveyer belt. Ni and Fe are returned to Mairec. |
| QC4: Density Separation | Removal of the epoxy resin casing (epoxy resin, Ag and C) via density separation with ZnCl2 solution. ZnCl2 solution is recycled. The epoxy resin casing and 90% of the silver (which sticks to the resin after shredding) is removed. The silver is returned to Mairec. |
| QC5: Electrolysis & Distillation | A 4 step-electrolysis process within a rotary drum electrode in 1-molaric methanesulfonic acid (CH3SO3H with sodium chloride) at room temperature is used to deliver mainly deposited Cu, precipitated AgCl, purified MnO2 and purified Ta. CH3SO3H is distilled. Cu and AgCl are returned to Mairec. MnO2 is sold as a product. |
| QC6: Oxidation | Oxidation of tantalum via heating to (800–900) °C for to remove traces of resin in air atmosphere to achieve high-purity Ta2O5. |
| Quantity Centre | Process Description |
|---|---|
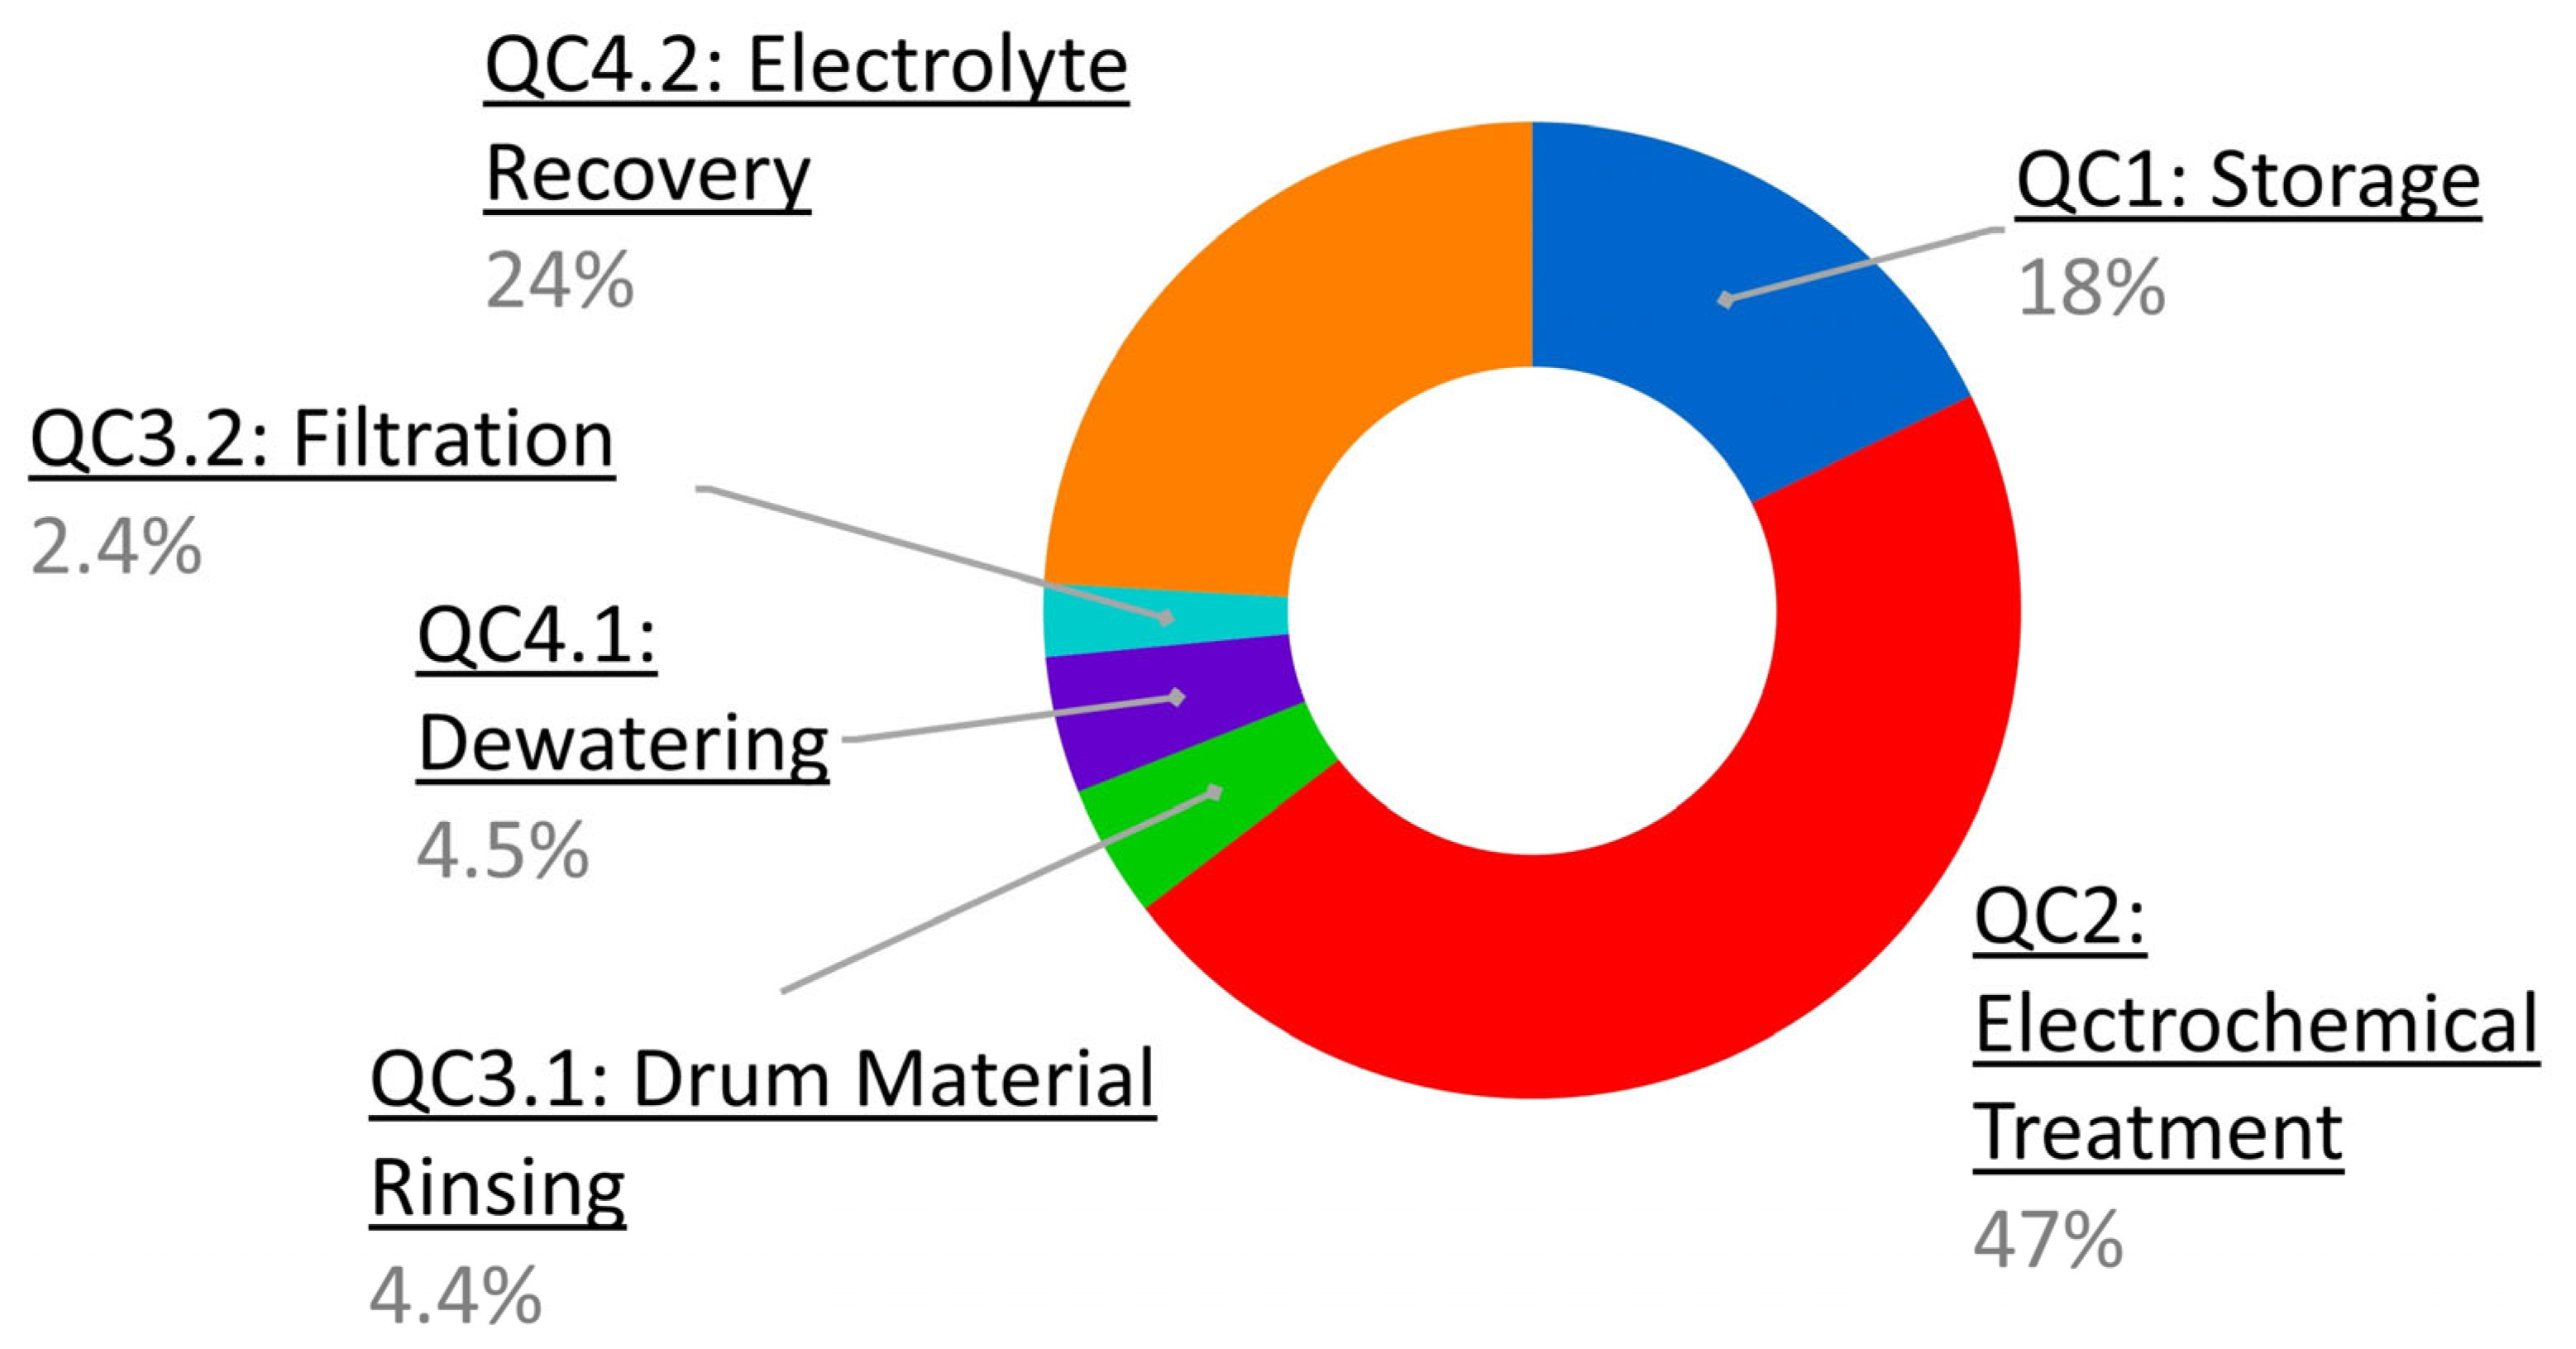
| QC 1: Storage | The shredded metallised plastics are stored and prepared for the next batch in this quantity centre. |
| QC 2: Electrochemical Treatment (including Cu Deposition and Recovery of Cr as Flakes) | The pre-processed metallised plastic particles are filled in a rotary drum electrode. The drum is placed in a bath with an electrolyte (methanesulfonic acid, CH3SO3H) in a three-electrode setup (the drum is the working electrode, Cu foil as counter and standard-hydrogen as reference electrode). An electrical voltage is used to dissolve copper and nickel from the plastic (PC/ABS). The voltage is applied in a way that copper is deposited and chromium is not dissolved but separated as metal flakes. |
| QC 3.1: Drum Material Rinsing | Cleaning PC/ABS by using the drum from the former quantity centre and immersing it in water. Thereby the leftover of acid is neutralised and the plastic cleaned. This process can clean large volumes of plastic very effectively. |
| QC 4.1: Plastic Dewatering | Plastic dewatering is the removal of water from the solid. This process includes vacuum, centrifugation, filtration, solid–liquid separation processes, and removing residual liquids with a filter press. |
| QC 3.2: Filtration | Filtration is used to separate the Cr flakes from the electrolyte. A ceramic filter is required to carry this out. The solid (chromium) parts remain on the filter, and the liquid passes through the pores. |
| QC 4.2: Electrolyte Recovery | A distillation system designed to recover electrolyte by distillation. Nickel salt is produced as a waste. The distillation system can purify and concentrate various acids and mixed acid solutions. |
| Energy | Materials (Input/Output) | Labour | Machinery | Wastes | Products | Byproducts |
|---|---|---|---|---|---|---|
| Kilowatt Hour | Kilogram | Hours | Quantity | Kilogram | Kilogram | Kilogram |
| Auxiliary Material | Project | Quality | Provider/Manufacturer | Price EUR/kg (excl. VAT) |
|---|---|---|---|---|
| Water | IRETA2/ ReComp | Deionised Water | Berlin Wasserbetriebe (BWB) | 0.05182 [17] |
| ZnCl2 | IRETA2 | Purity ≥ 97.0% p.a. | Carl Roth GmbH Co. KG. | 99.90 [18] |
| CH3SO3H | IRETA2/ReComp | Purity 99.5% p.a. ACS | Carl Roth GmbH and Co. KG | 94.90 [19] |
| NaCl | IRETA2 | Purity 99.5% p.a. ACS, ISO | Carl Roth GmbH Co. KG. | 20.50 [20] |
| NaOH | IRETA2 | Purity 99.0% p.a. | Carl Roth GmbH Co. KG.) | 18.18 [21] |
| Material | Price | Source |
|---|---|---|
| PC/ABS | Min: 1.27 EUR/kg | Plasticker [26] |
| Max: 2.88 EUR/kg | ||
| Ave: 2.36 EUR/kg | ||
| Copper | Min: 7.00EUR/kg | Gold.de [27] |
| Max: 9.36 EUR/kg | ||
| Ave: 8.18 EUR/kg | ||
| Chromium | Min: 1260 EUR/kg | Institute for Rare Earths and Metals [28] |
| Max: 1836 EUR/kg | ||
| Ave: 1548 EUR/kg |
| QC1 | QC2 | QC3 | QC4 | QC5 | QC6 |
|---|---|---|---|---|---|
| Ta capacitors 90% | Ground capacitors 95% | Ta anode & housing 90% | Ta anode & housing 98% | Ta pwdr, Cu, AgCl 98% Electrolyte 95% MnO2 80% | Ta2O5 99% |
| QC1 | QC2 | QC3.1 | QC4.1 | QC3.2 | QC4.2 |
|---|---|---|---|---|---|
| Metallised plastic 98% | Metallised plastic 98% | PC/ABS 99.99% | PC/ABS 98% | Cr particles 98% | Electrolyte 97% |
| Process | Quantity Produced kg/annum | Costs/Earnings EUR/annum |
|---|---|---|
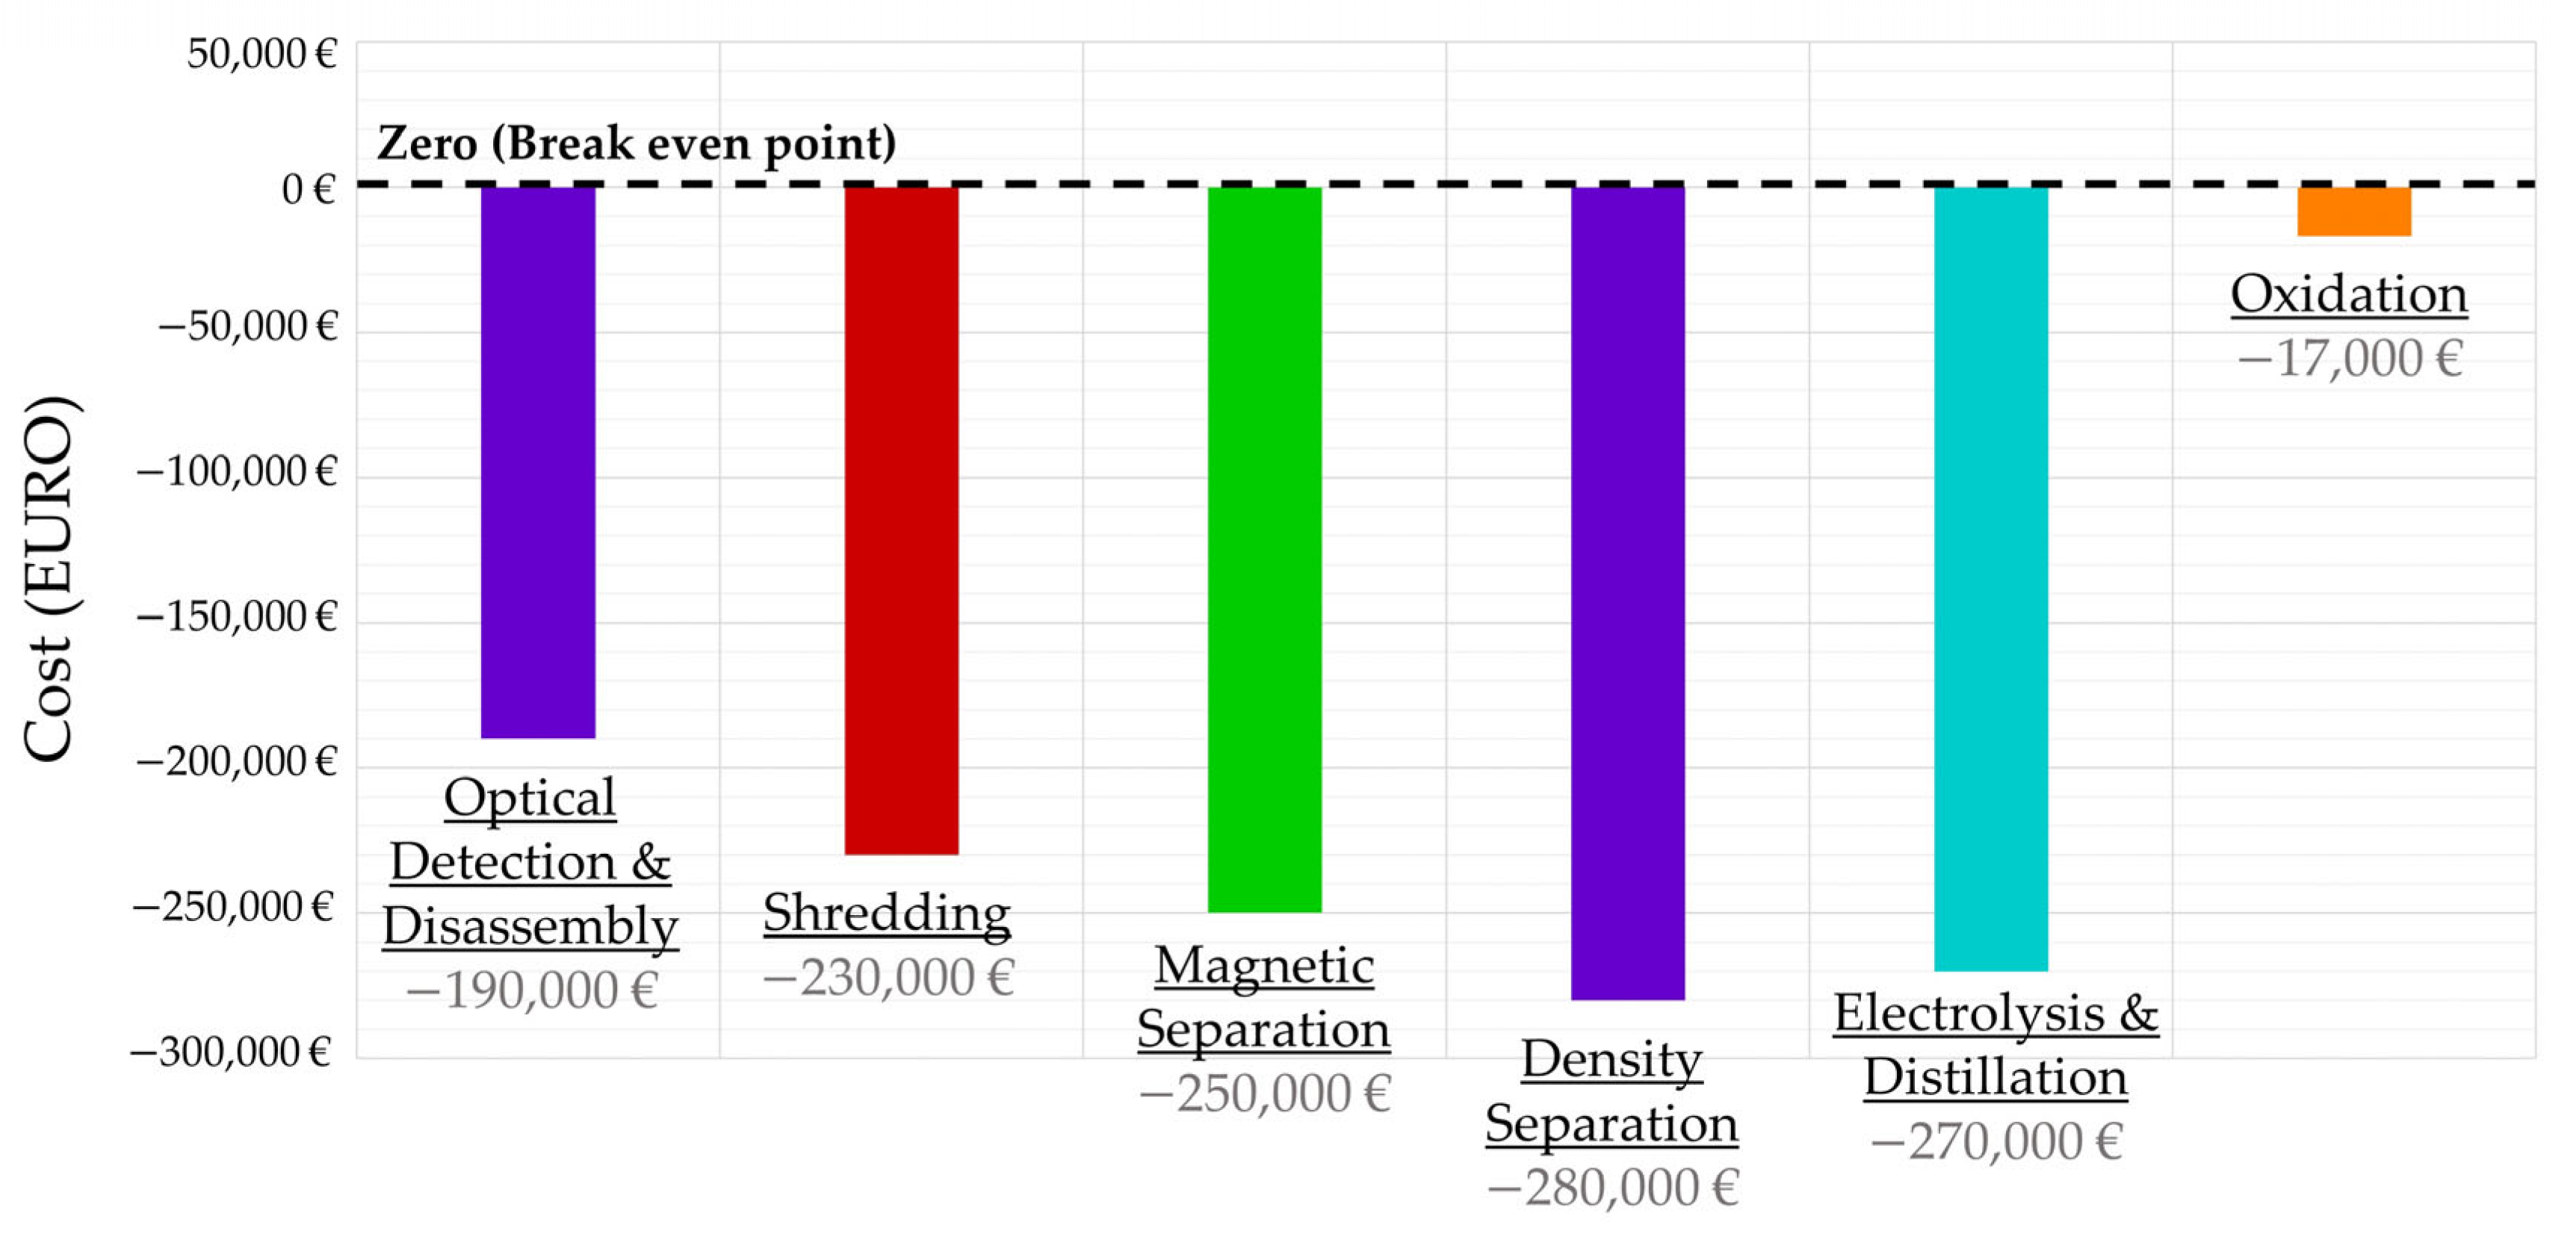
| Cost of Total Process | - | −320,000 |
| Earnings from Ta2O5 (Sold at 263 EUR/kg) | 980 | 260,000 |
| Earnings from MnO2 (Sold at 135 EUR/kg) | 320 | 43,000 |
| Profit/Loss | - | −17,000 |
| Process Costs/Earnings | Quantity Produced kg/annum | Costs/Earnings EUR/annum |
|---|---|---|
| Cost of Total Process | - | −17,000 |
| Earnings from Copper (Sold at 8.18 EUR/kg) | 13 | 110 |
| Earnings from PC/ABS (Sold at 2.36 EUR/kg) | 130 | 310 |
| Earnings from Chromium (Sold at 1548 EUR/kg) | 0.32 | 500 |
| Profit/Loss | - | −16,000 |
Disclaimer/Publisher’s Note: The statements, opinions and data contained in all publications are solely those of the individual author(s) and contributor(s) and not of MDPI and/or the editor(s). MDPI and/or the editor(s) disclaim responsibility for any injury to people or property resulting from any ideas, methods, instructions or products referred to in the content. |
© 2023 by the authors. Licensee MDPI, Basel, Switzerland. This article is an open access article distributed under the terms and conditions of the Creative Commons Attribution (CC BY) license (https://creativecommons.org/licenses/by/4.0/).
Share and Cite
Walls, C.; Putri, A.R.K.; Beck, G. Material Flow Cost Accounting as a Resource-Saving Tool for Emerging Recycling Technologies. Clean Technol. 2023, 5, 652-674. https://doi.org/10.3390/cleantechnol5020033
Walls C, Putri ARK, Beck G. Material Flow Cost Accounting as a Resource-Saving Tool for Emerging Recycling Technologies. Clean Technologies. 2023; 5(2):652-674. https://doi.org/10.3390/cleantechnol5020033
Chicago/Turabian StyleWalls, Caitlin, Almy Ruzni Keumala Putri, and Gesa Beck. 2023. "Material Flow Cost Accounting as a Resource-Saving Tool for Emerging Recycling Technologies" Clean Technologies 5, no. 2: 652-674. https://doi.org/10.3390/cleantechnol5020033