Article

Distribution of Soil Nutrients and Ancient Agriculture on Young Volcanic Soils of Ta‘ū, American Samoa

1
Department of Tropical Plant and Soil Sciences, University of Hawai‘i at Mānoa, 3190 Maile Way, St. John 102, Honolulu, HI 96822, USA
2
Department of Anthropology, University of Hawai‘i at Mānoa, 2424 Maile Way, Saunders 346, Honolulu, HI 96822, USA
3
Department of Soil, Water, and Climate, University of Minnesota-Twin Cities, 1991 Upper Buford Circle, Saint Paul, MN 55108, USA
4
Department of Geoscience, North Dakota State University, 1340 Bolley Drive, Fargo, ND 58102, USA
5
Sunrise Archaeology, Mangonui 0420, New Zealand
*
Author to whom correspondence should be addressed.
Soil Syst. 2023, 7(2), 52; https://doi.org/10.3390/soilsystems7020052
Submission received: 10 March 2023 / Revised: 1 May 2023 / Accepted: 15 May 2023 / Published: 18 May 2023
(This article belongs to the Special Issue Soils in Archaeological Research)

Abstract

:
Soils and agriculture are inextricably linked, in the past as well as today. The Pacific islands, which often represent organized gradients of the essential soil-forming factors of substrate age and rainfall, represent excellent study systems to understand interactions between people and soils. The relationship between soil characteristics and indigenous agricultural practices are well documented for some locations, but there is a paucity of data for much of the region. Given the extent of ecological adaptation that has been documented, specifically for Hawai‘i, new Pacific datasets are expected to provide important insights into indigenous agricultural practices. To contribute to this discussion, we analyzed patterns in soil chemistry and vegetation in the Manu‘a islands of American Samoa. Soils were sampled along transects that crossed through precontact settlement zones in the upland of Fiti‘uta on Ta‘ū island, a location characterized by young (<100 ky) volcanic substrates and very high (>3800 mm y−1) annual rainfall. Soils were analyzed for several soil fertility properties that have been proposed as predictors of intensive rainfed tuber production in Hawai‘i and Rapa Nui. Surveys of remnant economic plants were conducted to assess patterns of past land use. Soils demonstrated moderate values of soil fertility as measured by pH, base saturation, exchangeable calcium, and total and exchangeable phosphorus, despite the high rainfall. Previously identified soil fertility indicators had some application to the distribution of traditional agriculture, but they also differed in important ways. In particular, low exchangeable calcium in the soils may have limited the agricultural form, especially the cultivation of tubers. Significant shifts in both soil parameters and remnant economic crops were documented, and alignment suggests cropping system adaptation to soil biochemistry. Archaeological samples combined with surveys of relict vegetation suggest that agroforestry and arboriculture were key components of past agricultural practices.

1. Introduction

Soil characteristics are fundamental to the nature and outcome of agricultural practices. The ability of soil to sustain consistent plant growth by providing essential nutrients is critical for agricultural development, even more so prior to the development of industrial fertilizers [1,2]. Soil properties determine the supply and retention of essential nutrients and water necessary for plant growth, which are primarily influenced by the parent material, the age of the substrate, and climate [3,4]. Prior research has demonstrated the importance of Pacific islands as study systems to understand interactions between people and soils given their organized gradients of geomorphic surface age and rainfall [5,6]. Like elsewhere in the world, soil fertility on Pacific islands was an important factor in the decision to develop and maintain cultivation systems [6,7], along with the local climate and weather. While in some locations, such as the Hawaiian Islands, the relationship between soils and past agricultural production has received intensive study [6,7,8,9], other regions still lack information due to a lack of documentation, minimal field studies, and a rapid abandonment of the traditional agricultural systems following European contact [10]. This is the case of the Samoan archipelago, where neither the soils [11] nor the archaeology [10] have received much investigation.
Soil fertility indicators have been shown to strongly correlate to the extent of various indigenous Polynesian agricultural systems [6,9,12], suggesting a high level of adaptation to the biogeochemical landscape by traditional cultivators [13,14]. Previous studies in Hawai‘i and Rapa Nui (Easter Island) have demonstrated that threshold levels of pH, base saturation (BS%), exchangeable calcium, and total and extractable phosphorus all demonstrate a strong relationship to the development of intensive, rainfed agricultural infrastructure [9]. Large-scale conversions of landscapes to other forms of agriculture, such as arboriculture, also appear to be driven by thresholds in soil fertility, but differ in the levels confining their development [12,15]. The adaption of agricultural form to soil capacity by indigenous Polynesians appears clear, and the relative distribution of agricultural forms within and between islands has important social and cultural outcomes due to their differences in required infrastructural investment and labor needs, and agricultural yields, stability, and resilience to local weather variation [7,13,16].
Substantial gaps in our understanding of these dynamics, however, persist. Of concern here, is that there is a lack of data examining the relationship between agricultural patterns and soils in environments with relatively young soils and high precipitation rates. The goal of this study is to examine the behavior of young volcanic soils and their relationship to agroecological usage. We assess patterns of soil fertility through sampling and analysis along an elevation gradient, agricultural form as a function of remnant plant species, and their interactions on Ta‘ū island in the Manu‘a group of American Samoa. Our analysis considers non-linear shifts in the biogeochemical environment and how these relate to patterns of landscape usage.

2. Materials and Methods

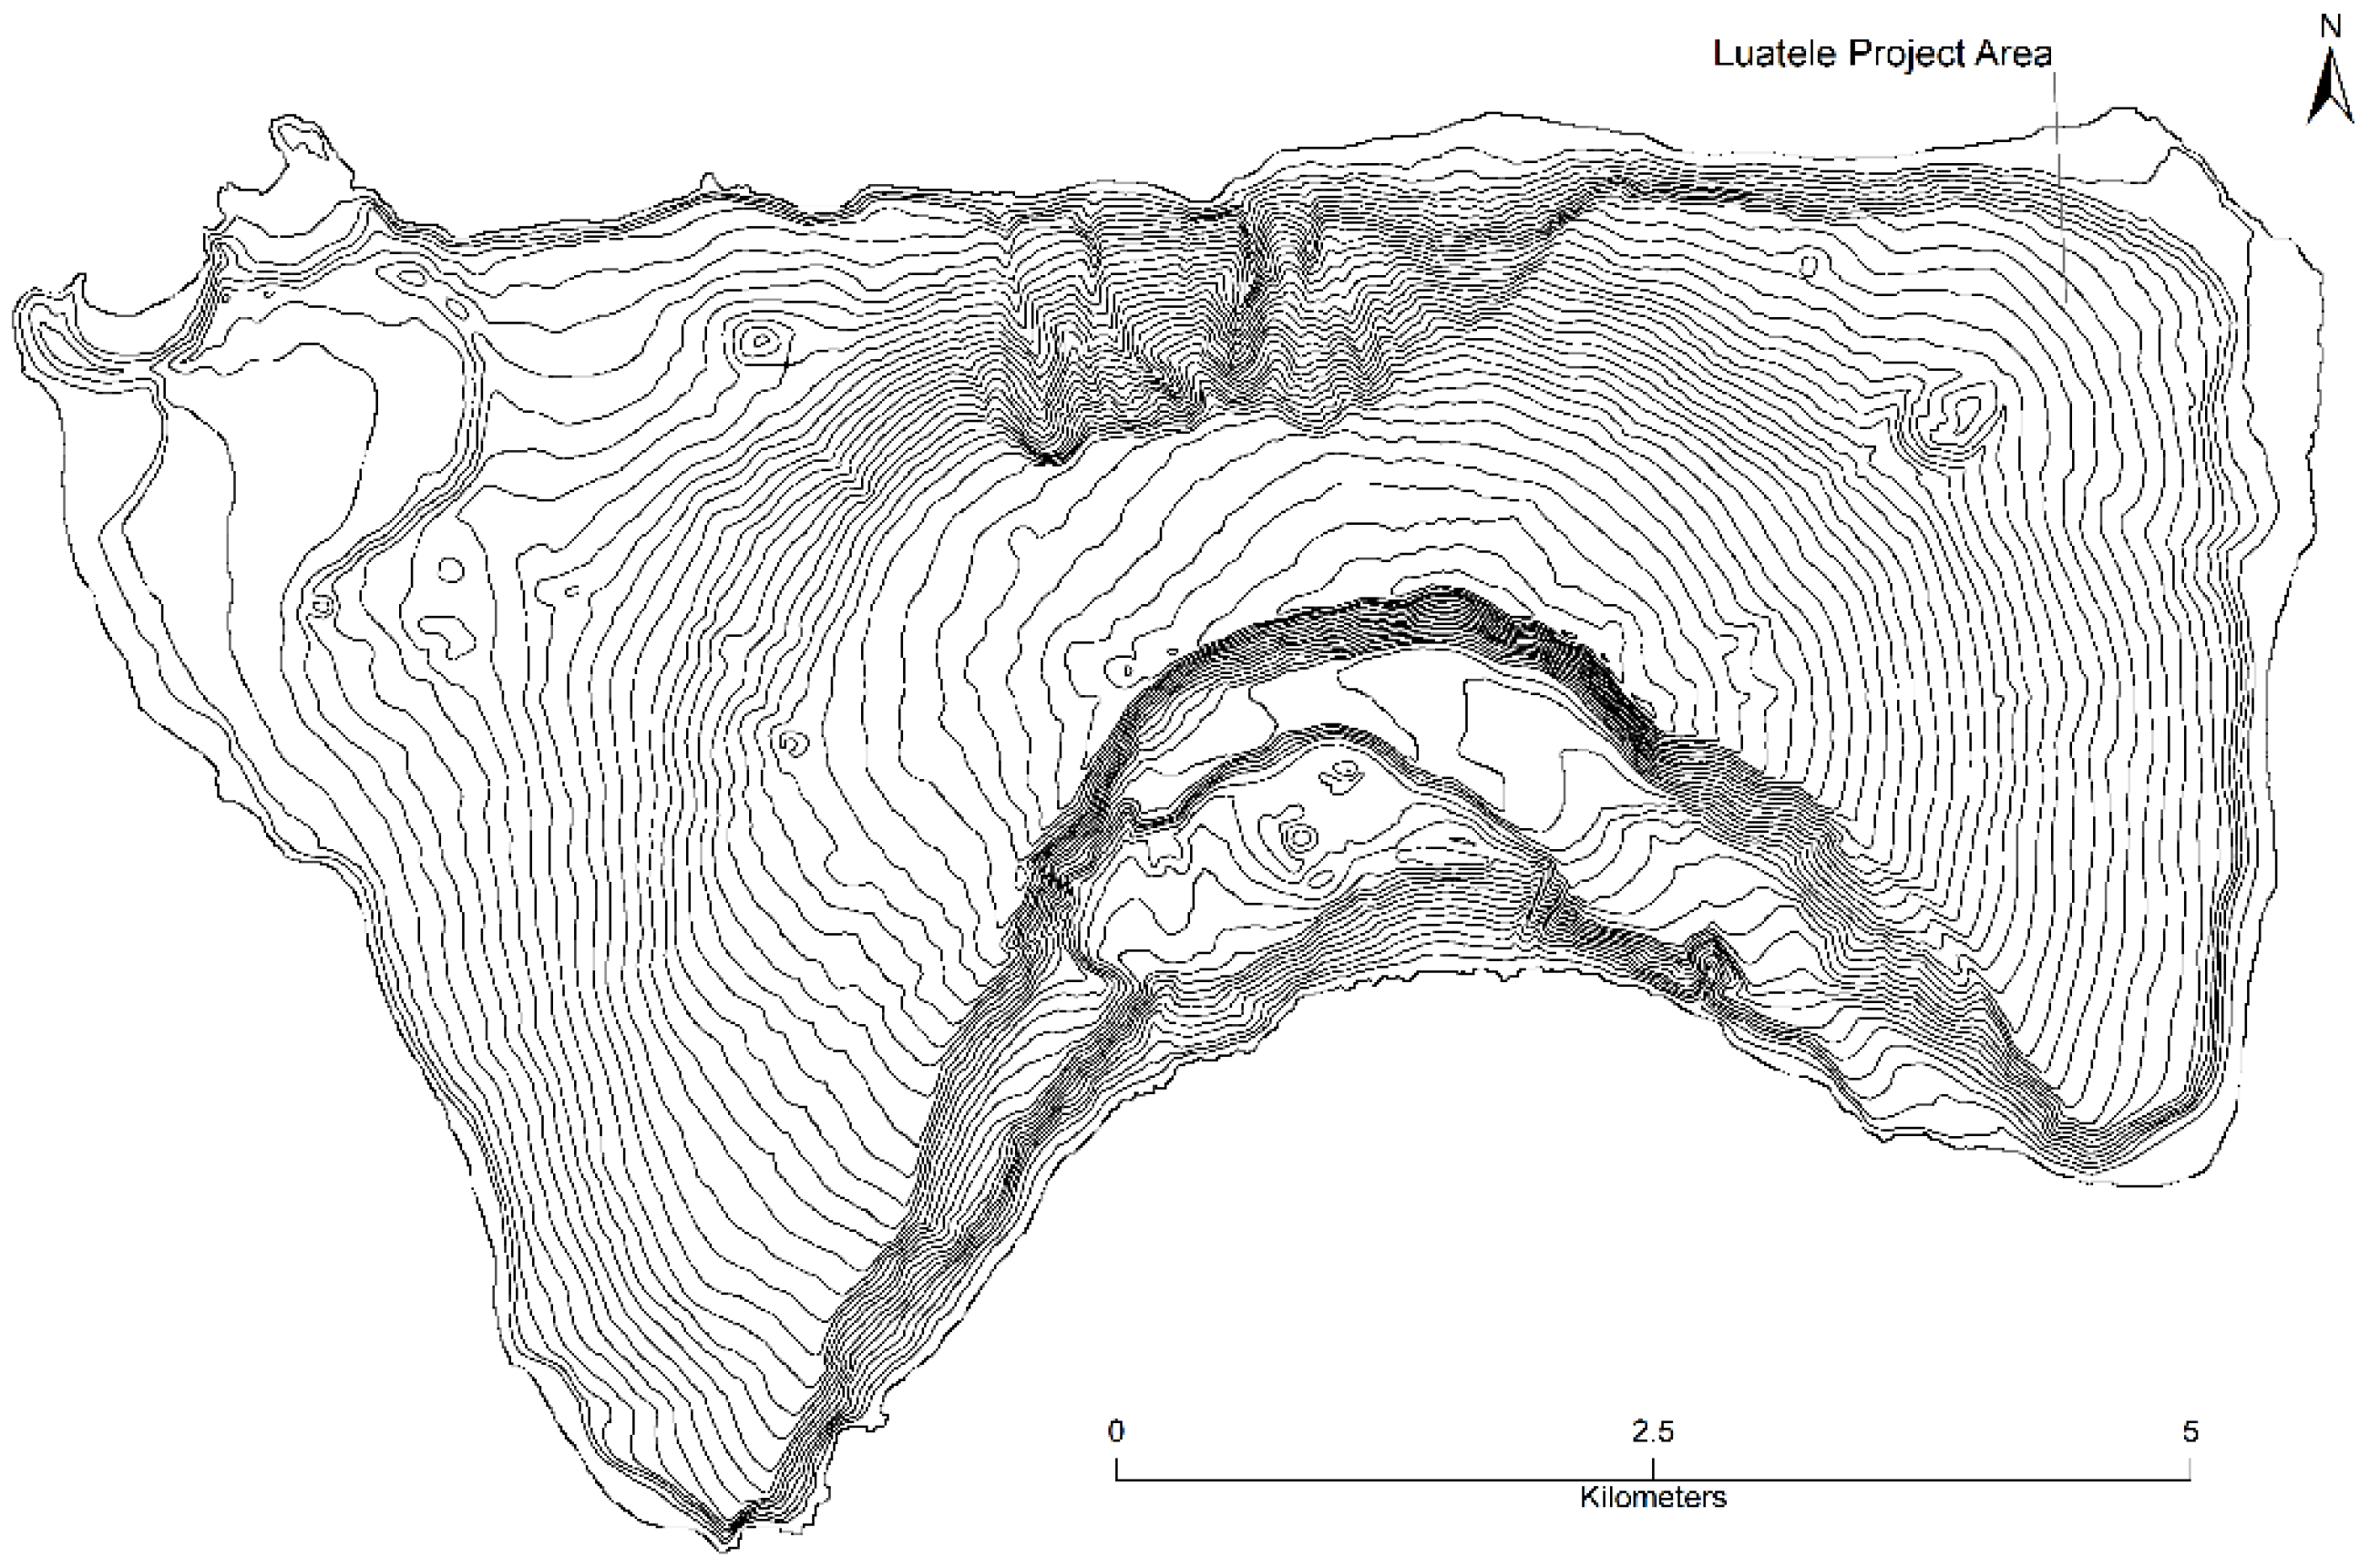
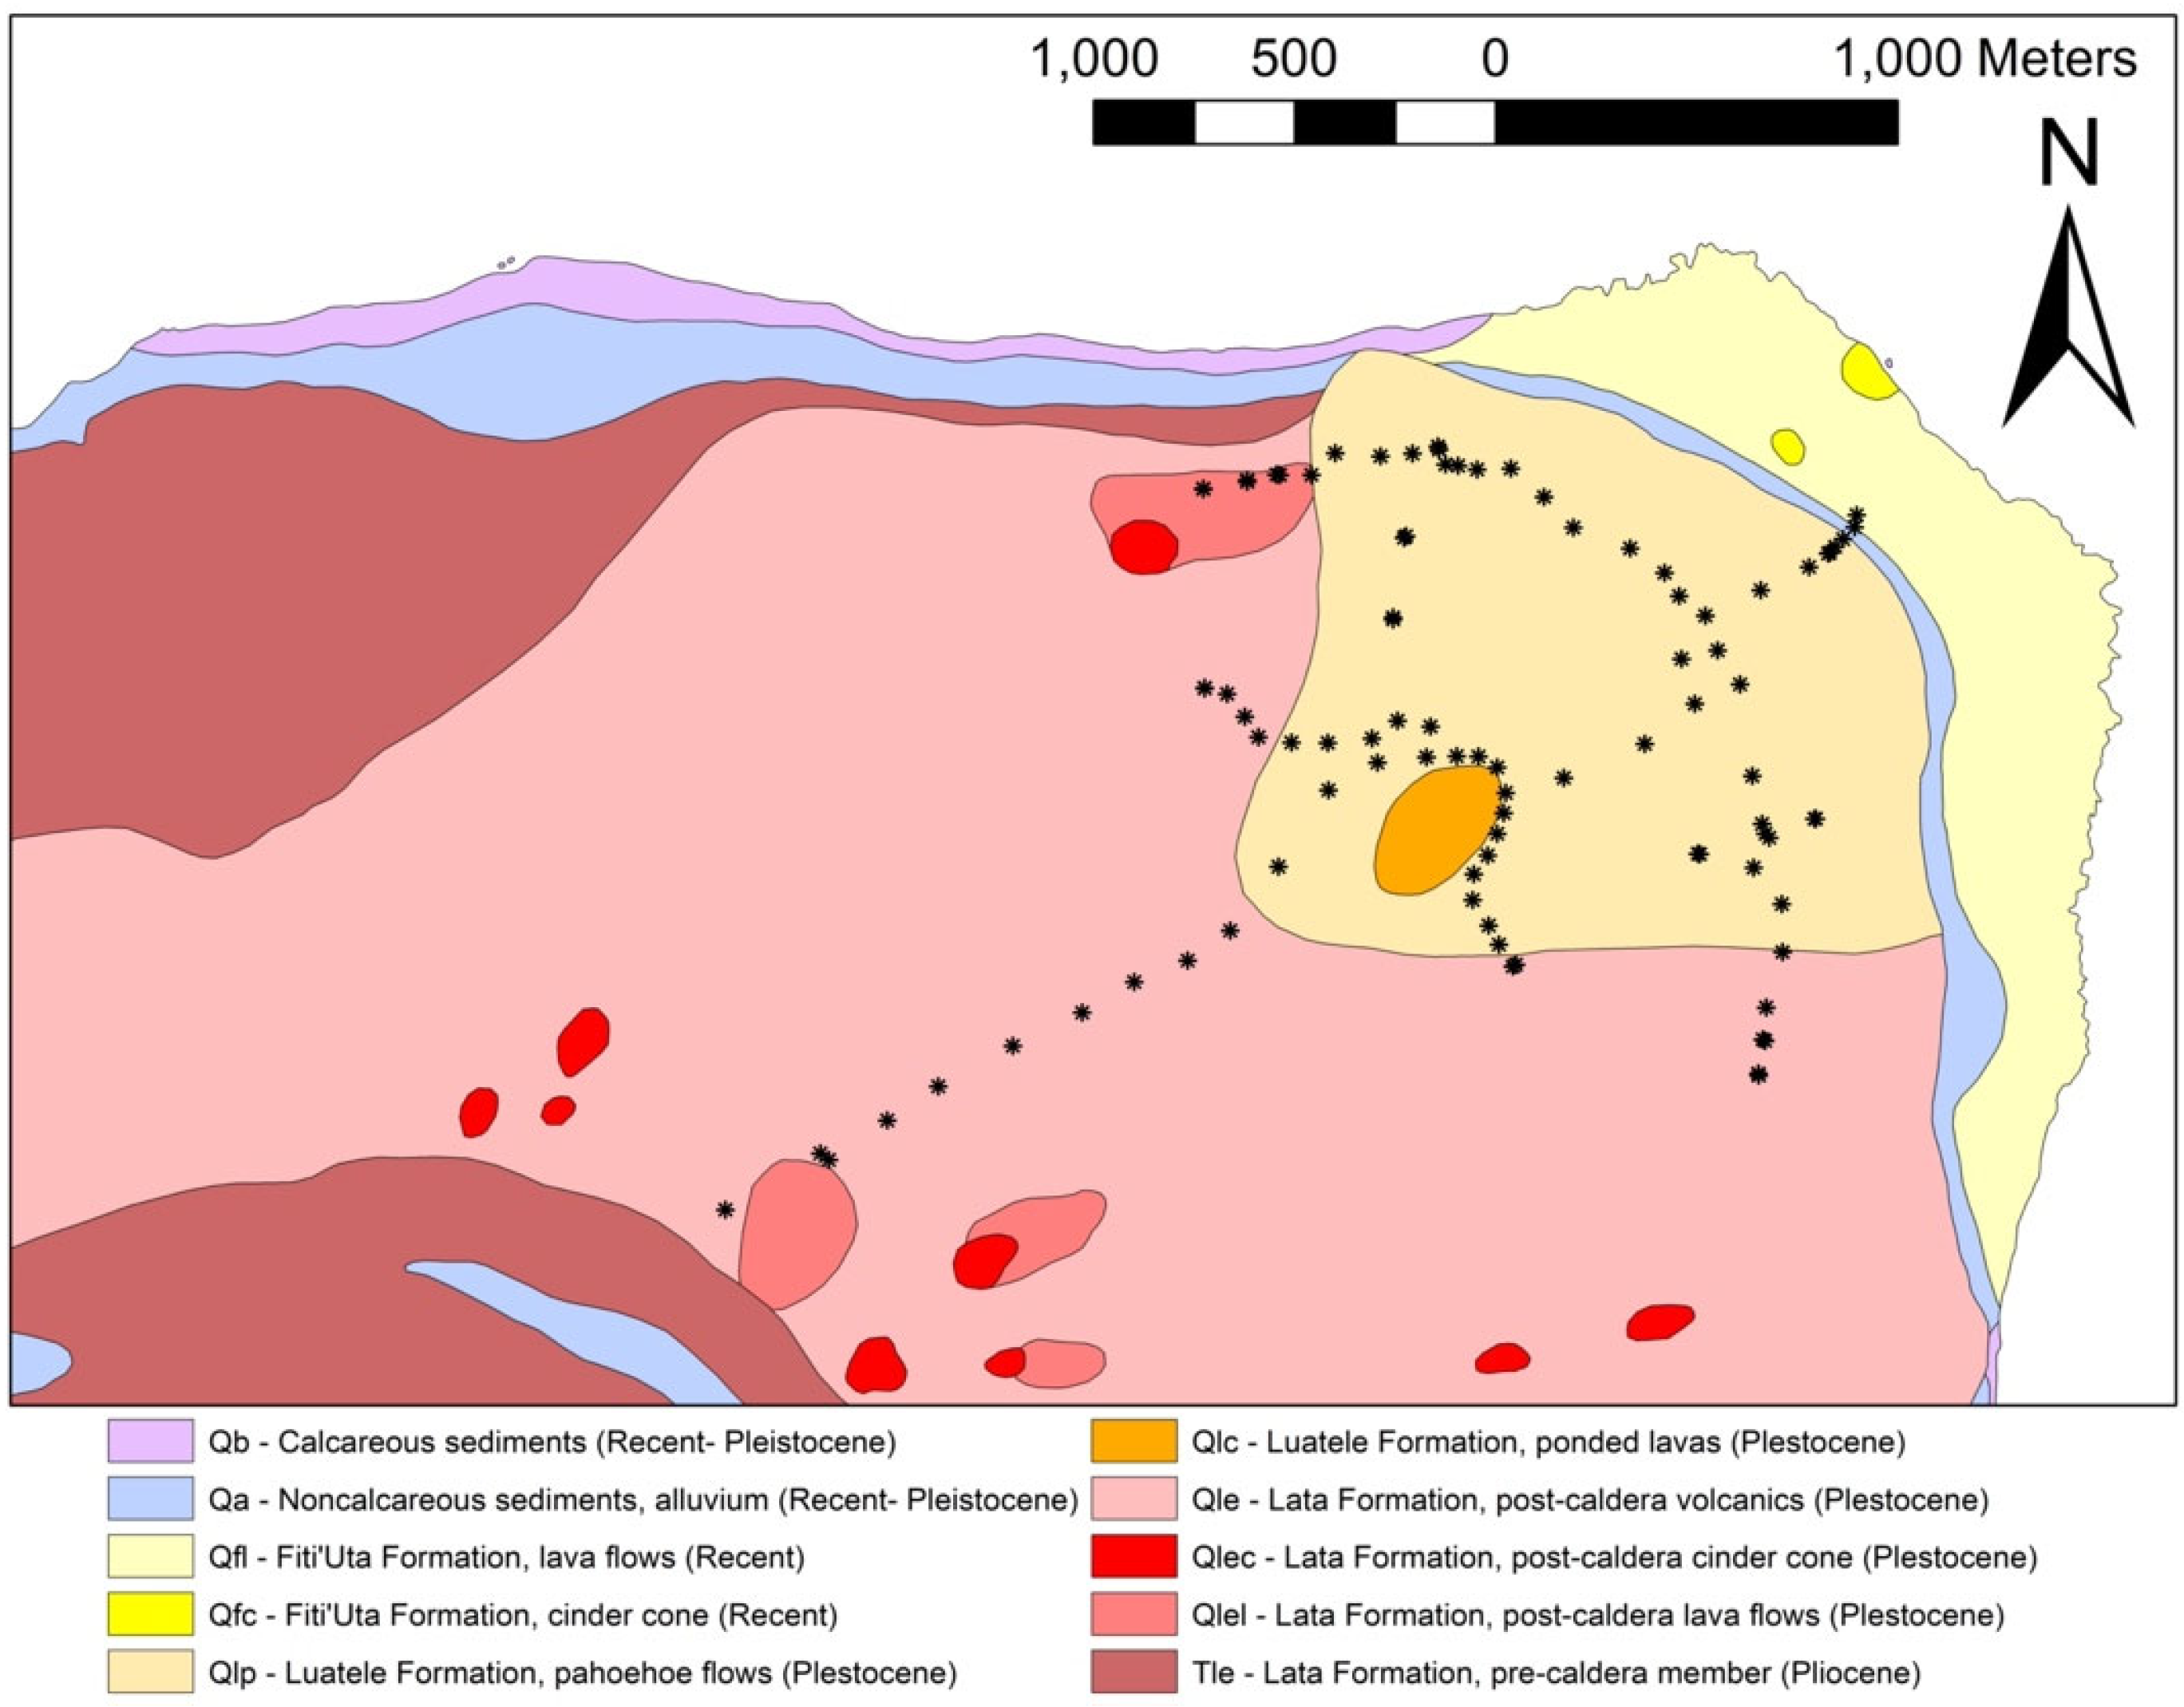
2.1. Site Description

The Samoan archipelago currently constitutes two geopolitical units: the independent nation of Samoa in the western half of the archipelago and the territory of American Samoa in the eastern half. The entire archipelago is formed from volcanic activity resulting from a tectonically driven hotspot, causing the formation of the islands in a generally linear chain from west to east [17]. The selected area of study is situated on Ta‘ū island of the Manu‘a group (Figure 1). Ta‘ū is the easternmost and youngest island of the Samoa archipelago, and the largest (~45.5 km2) and tallest (966 m) island of the Manu‘a group [18,19,20]. The island is extremely wet, with rainfall ranging from ~3175 mm y−1 near the coast up to ~7000 mm y−1 at the summit [19], which increases from west to east. Like most tropical islands, the island is heavily vegetated. Currently, the project area is covered by secondary forest, including Hibiscus tiliaceus (fau, sea hibiscus), Rhus species, and common agricultural crops such as Artocarpus altilis (‘ulu, breadfruit), Cocos nucifera (niu, coconut), Cordyline fruticosa (ti), and Morinda citrifolia (nonu, Indian mulberry) [21,22].
The primary surface basalt flows stemming from Mount Lata formed less than 70 ky ago, with all dated samples from the Lata flow series having radiometric ages older than 20 ky [17,20]. Several subsequent eruptions stemming from crater vents, such as Luatele, are believed to be younger. Unfortunately, the surface substrates on the island have not been extensively dated (but see [20]). While the exact ages of these surface substrates are still ambiguous, Luatele is younger than adjacent sections of the Lata flow based on stratigraphic grounds [17]. From the available information, it seems that the Luatele shield may have formed sometime around or after 20 ky ago based on the dates of the youngest Lata flows, though some estimate that it is older [23].
Soils on Ta‘ū consist of several soil series formed from volcanic basalt and volcanic ash deposits [18]. The project area is covered by Olotania, Pavaiai, and Sogi soil series associated with the two different volcanic substrates stemming from Lata and Luatele. These soil series are Andisols formed from volcanic ash. The lowest areas of our project area consist of steep Pavaiai soil series medial-skeletal, amorphic, isohyperthermic Eutric Fulvudands, underlain with dense lava at depths of 50 to 100 cm and layers of stony clay loam to bedrock. Upslope, soils of the main Luatele shield are Sogi series classified as medial over ashy, amorphic, isohyperthermic Eutric Hapludands which consist of clay loam soil. The remaining area surrounding the primary project site is the Olotania series occurring on the Lata substrates, classified as medial, amorphic, isohyperthermic Hydric Hapludands, which typically consist of ~100 cm of silty clay loam over bedrock [18,24].
The Samoan archipelago was settled ~2800 years ago [25], with the islands of Manu‘a settled around 2650–2750 years ago [26,27]. Occupation occurred primarily along the coast in Manu‘a for the first 1500 years of settlement, though it is likely that resources were exploited from the island’s interior. More intensive use of interior landscapes is documented toward the end of the first millennium AD, when communities began engineering these landscapes in the form of terraces, walls, and other earthworks [22,28]. These earthworks cover the Luatele substrate and extend, at lower density, onto the Lata substrate in the northeastern quadrant of the island. Three hundred and twelve terraces have been documented through pedestrian surveys, and over 400 more have been identified using a lidar dataset in the area [22,28]. Interspersed amongst these terraces are low linear mounds of stone and earth that seem to function as land boundaries or walls. Feature density is highest in the lower elevation, with terrace density decreasing substantially above 300–320 masl. The range of archaeological features and comparisons with adjacent islands suggest that the Luatele site represents an integrated residential and agricultural landscape. This type of settlement pattern, wherein food production was practiced in proximity to and amongst houses, occurred widely in Samoa in the past (see [29]), including on the adjacent islands of Ofu and Olosega [30].

2.2. Soil Sampling

Soil samples were primarily collected along three transects, with an emphasis on sampling the main Luatele shield (Figure 2). One transect ran on a SW bearing from near the coast to the summit of Lata mountain, with sampling occurring every 50 m of elevation (n = 20). Two transects ran cross-slope (roughly SE bearing): one located just below the Luatele crater at ~370 m above sea level (n = 22) and another located near the coastal edge of the agricultural system at ~210 m above sea level (n = 28). Additional samples were collected throughout the study area with an emphasis on the western and eastern sides of the Luatele shield (n = 12). Position of all sample locations was recorded with GPS. At each sample point, composite soil samples to the depth of 30 cm were collected by combining three subsamples captured within close proximity (~20 m). The horizontal transects continued past the first major riverbed on either side of the Luatele shield, which we presumed extended off the Luatele shield. Where possible, samples were collected separately from soils captured behind artificial terraces and from neighboring unmodified slopes. All soil samples were transferred into zip lock bags, air-dried, and shipped to Sherman Lab at the University of Hawai‘i at Mānoa, Honolulu, for soil physical and chemical analysis.

2.3. Soil Physical and Chemical Analyses

All samples were air-dried and divided into fine and coarse fractions with a 2 mm sieve. From the fine fraction, one subset was used to measure soil pH in deionized water in a 1:1 ratio. A second subset was used to measure exchangeable cations by rinsing soils with NH4CH3CO2 buffered at pH 7 [31]. NH4CH3CO2 was rinsed out using 80% ethanol, then soil was rinsed with 1 M KCl and brought to final volume. Cation-exchange capacity (CEC) was calculated from exchanged NH4-N per sample, and BS% as the sum of exchangeable cations divided by CEC. A third subset of samples was subjected to total elemental analysis of Al, Mn, S, B, Nb, Na, Mg, Fe, K, P, and Ca. The samples were analyzed at the University of Hawai‘i at Hilo with ICP-MS (Thermo Fisher Scientific, Waltham, MA, USA) after lithium borate fusion followed by acid dissolution. A fourth subset was used to measure resin-extractable phosphate by shaking soil with mixed anion–cation exchange resin in deionized water for 16 h, then shaking the resin in 0.5 M HCl for one hour [31]. A fifth subset was oven-dried at 105 °C, and then mass loss was determined after ignition at 350 °C for 16 h [32]. Most analyses were performed for all samples collected on the Luatele shield, except for total elemental analysis which was conducted on ~1/3 of the samples. Soil pH and loss on ignition were typically assessed for each of the replicates, while triplicates were composited for other analyses. Fewer samples were run for the high-elevation samples which were not the emphasis of the study.

2.4. Vegetative Survey

Two vegetation surveys were conducted. One followed the soil sampling along the cross-slope and up-slope transects, with the presence and abundance of all economic crops within a 5 m radius recorded [33,34]. A second survey followed four up-slope pedestrian archaeological surveys, with the presence of economic crops on archaeological terraces recorded. Occurrence data for the five most common economic species (fau, ti, ‘ulu, nonu, and niu) are reported for the sampling schemes independently. The occurrence data were used to build a maximum entropy model using the MaxEnt package [35,36,37] in R [38]. Crops were classified as having either primary food or resource values, and a collective habitat model for each classification was run using all occurrence points by applying explanatory variables of rainfall [39], elevation (https://catalog.data.gov/ accessed on 5 March 2019), geologic substrate [40], and slope. The point-by-point difference between the two spatial models was calculated to represent the relative application of agriculture (i.e., food- or resource-dominated) [41,42].

2.5. Archaeological Sampling

Excavations utilizing test pits (30 cm × 30 cm, 50 cm × 50 cm) dug directly into the facing of terraces and controlled excavations (1 m × 1 m, 2 m × 1 m) of archaeological features resulted in the recovery of botanical charcoal samples. Charcoal samples were identified by Jennifer Huebert using an archived reference collection [43]. Material was dated using AMS at the University of Arizona Accelerator Mass Spectrometry Lab and the University of Georgia Center for Applied Isotope Studies. Dating calibration was performed in Oxcal 4.4 [44] using the IntCal20 calibration curve [45].

2.6. Statistical analysis

Summary statistics were generated for the soils. Percentage remaining of elements was calculated using Nb as an immobile index [46] with the following equation:
τ j ,   w = 100 × C j , w × C Nb ,   p C Nb ,   w × C j , p  
where Cj is the concentration of element j, CNb is the concentration of Nb, the subscript w refers to the weathered horizon, and p refers to the parent material. Parent material values were derived from the mean of all relevant values reported in [47]. Percentage of carbon was calculated from LOI using a conservative ratio of 0.45 [48]. ANOVA was used to compare soil properties in distinct groups. Rainfall data produced by the PRISM Group at Oregon State University [39] were utilized to conduct linear and non-linear regressions of soil properties, and total elemental analysis against environmental parameters was conducted using R statistical software (RStudio, Public Benefit Coorporation; Boston, MA, USA). Segmented R package [49] was used to determine the breakpoints in soil properties and total elemental concentration patterns against rainfall (as in [50]).

3. Results

3.1. Soil Properties

Substantial variations in soil properties were found across the two substrates and rainfall gradients. All soil data are included as a Supplementary Table (Table S1). Soils were high in organic matter, with carbon contents ranging from 12.8 to 23.4% (mean 18.2%), and very strongly acidic to neutral with pH values ranging from 4.62 to 6.78 (mean 5.78). CEC showed generally moderate values of 7.5 to 28.5 cmol kg−1 (mean 18.1). All paired sampling targeting soils behind anthropogenic terraces and from neighboring unmodified slopes showed no significant differences in any measured soil parameters (ANOVA, p > 0.05), and samples were therefore included but not distinguished by type in further analyses. A visual assessment utilizing a LOESS smoother function (alpha 0.7) suggested that soil parameters potentially exhibited non-linearities in response to the gradient of annual rainfall (Figure 3).

3.2. Soil Predictors of Traditional Agricultural Development

Indicator soil properties (as identified by [9]) are summarized in groups using data from the cross-slope transects (Table 1). The threshold values of five soil properties were found to be good predictors of formal, rainfed agricultural systems in Hawai‘i and Rapa Nui, including exchangeable calcium (10.2 cmol kg−1), base saturation (30%), pH (5.68), resin-extractable P (50 μg g−1), and percent P remaining (102%), where areas with soil values above these five thresholds were developed into formal agricultural systems, while areas below the threshold were not [6,9,15]. These prior investigations suggest that these soil parameters do not necessarily indicate thresholds required for the development of formal rainfed agriculture, merely that they appear to reliably predict where intensive rainfed agricultural systems were developed. The archaeological infrastructure on Ta‘ū is reminiscent of the “formal” rainfed agricultural systems observed in Hawai‘i—it is one of the few locations in the Pacific identified outside of Hawai‘i with similar infrastructural development. As previous investigations occurred in much drier conditions than we investigated on Ta‘ū, we sought to assess the relationship between these soil predictors and the extent of agriculture on Ta‘ū.
The Ta‘ū soils were generally more apt to be above the prediction thresholds in the lower elevation (~210 m) compared to those in the higher transect (~370 m). While the indicators all moved in concert, they were mixed in their relation to the previously suggested thresholds. The base saturation and the fractional % P remaining from the parent material suggest that all locations exceed the threshold, while exchangeable Ca indicated that none of the locations were above the required threshold. Extractable P and pH showed mixed results, with the lower transect on the Luatele shield being the only site consistently above the threshold. Overall, the lower elevation transect demonstrates significantly higher values of the fertility indicators, as expected. However, the younger soils stemming from Luatele substrates do not appear to be substantially more fertile than the older Lata substrates, except for pH and extractable P in the lower elevations.

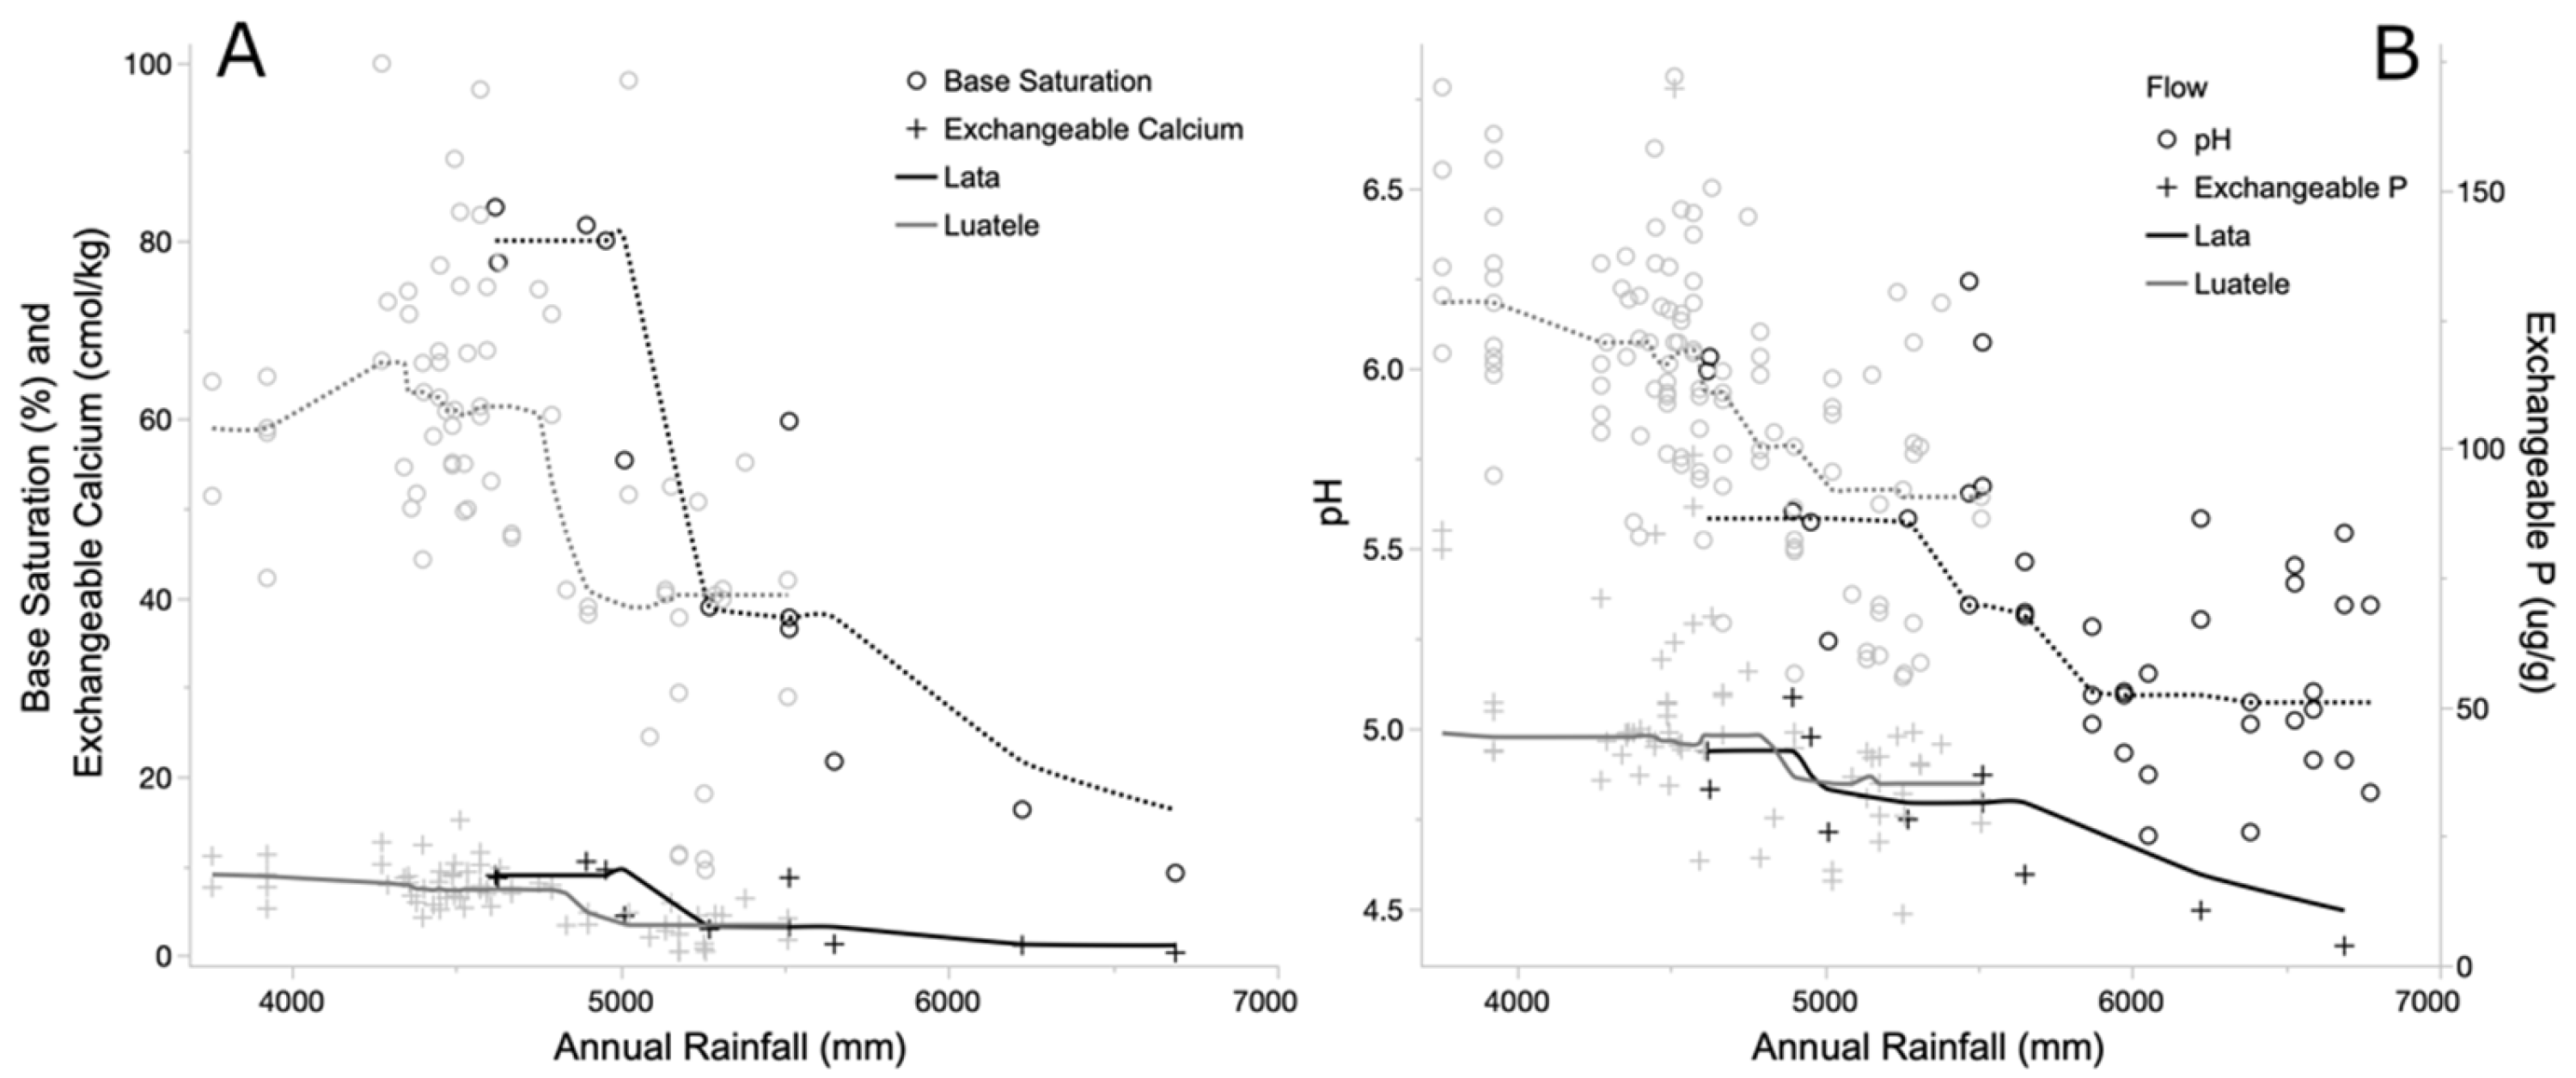
3.3. Segmented Regression Analysis

Segmented linear regression was used to explore non-linearities in the response of soil parameters to the climatic forcing of rainfall (Table 2). Due to limited sampling, this analysis was only conducted for the well-sampled soils of the main Luatele shield. Several soil parameters demonstrated significant breakpoints ranging from 4127 mm to 4804 mm, but clustered around, and averaged, ~4500 mm of annual precipitation, suggesting a significant shift in the chemical behavior of the soils occurring at this point.

3.4. Vegetative Survey

A total of 25 economic plant species were recorded in the vegetation survey areas (Table 3). The most dominant economic plant recorded was fau, followed by ti, nonu, ‘ulu, and niu. The distribution of these common crop plants was used to ascertain the overall extent and utilization of the agricultural landscape of Luatele (Table 4). The soil transect survey results were more limited in area but more comprehensive in terms of plant types, while observations made during the archaeological survey reflect our focus on crop taxa. However, both datasets were determined to be useful, as the resulting vegetation patterns are strongly aligned.
All of the five economic species of interest decreased in occurrence along the gradient from low to high elevations, and from west to east across the Luatele shield, with the patterns holding for both survey types (Table 4). At lower elevations (200–250 m), they are consistently found throughout the Luatele shield. At the upper elevation (400–350 m), the hardier, more resource-oriented crops of ti, nonu, and fau are still commonly found while, with the exception of a single outlier, the food-producing trees ‘ulu and niu do not occur at the upper elevations.
The maximum entropy (MaxEnt) models were conducted using occurrence data from the economic species in two categories (Supplemental Figures S1 and S2). The categories were selected to represent (1) crops that are primarily used for food and typically associated with managed agroforestry practices and (2) crops primarily utilized for resources that can be associated with a range of less-intensive cultivation strategies such as novel forests, low-management arboricultural systems, and shifting/swidden agriculture. To examine the management gradient that may have been maintained in the past, the difference between the two predicted likelihoods was calculated. The resulting map illustrates the likelihood of a relative dominance of either a resource crop or food crop throughout the study area (Figure 4). Resource crops are spread throughout the area, while food crops have a clear concentration only in the lower elevations. The difference between the models illustrates a strong geographical trend in crop distribution, suggesting two distinctly different strategies on the Luatele shield. The transition point closely aligns with the 4500 mm y−1 rainfall isohyet, which is the rainfall level at which the Luatele flows exhibit a cluster of non-linearities in the soil data (although this alignment does break down on the far western flank).

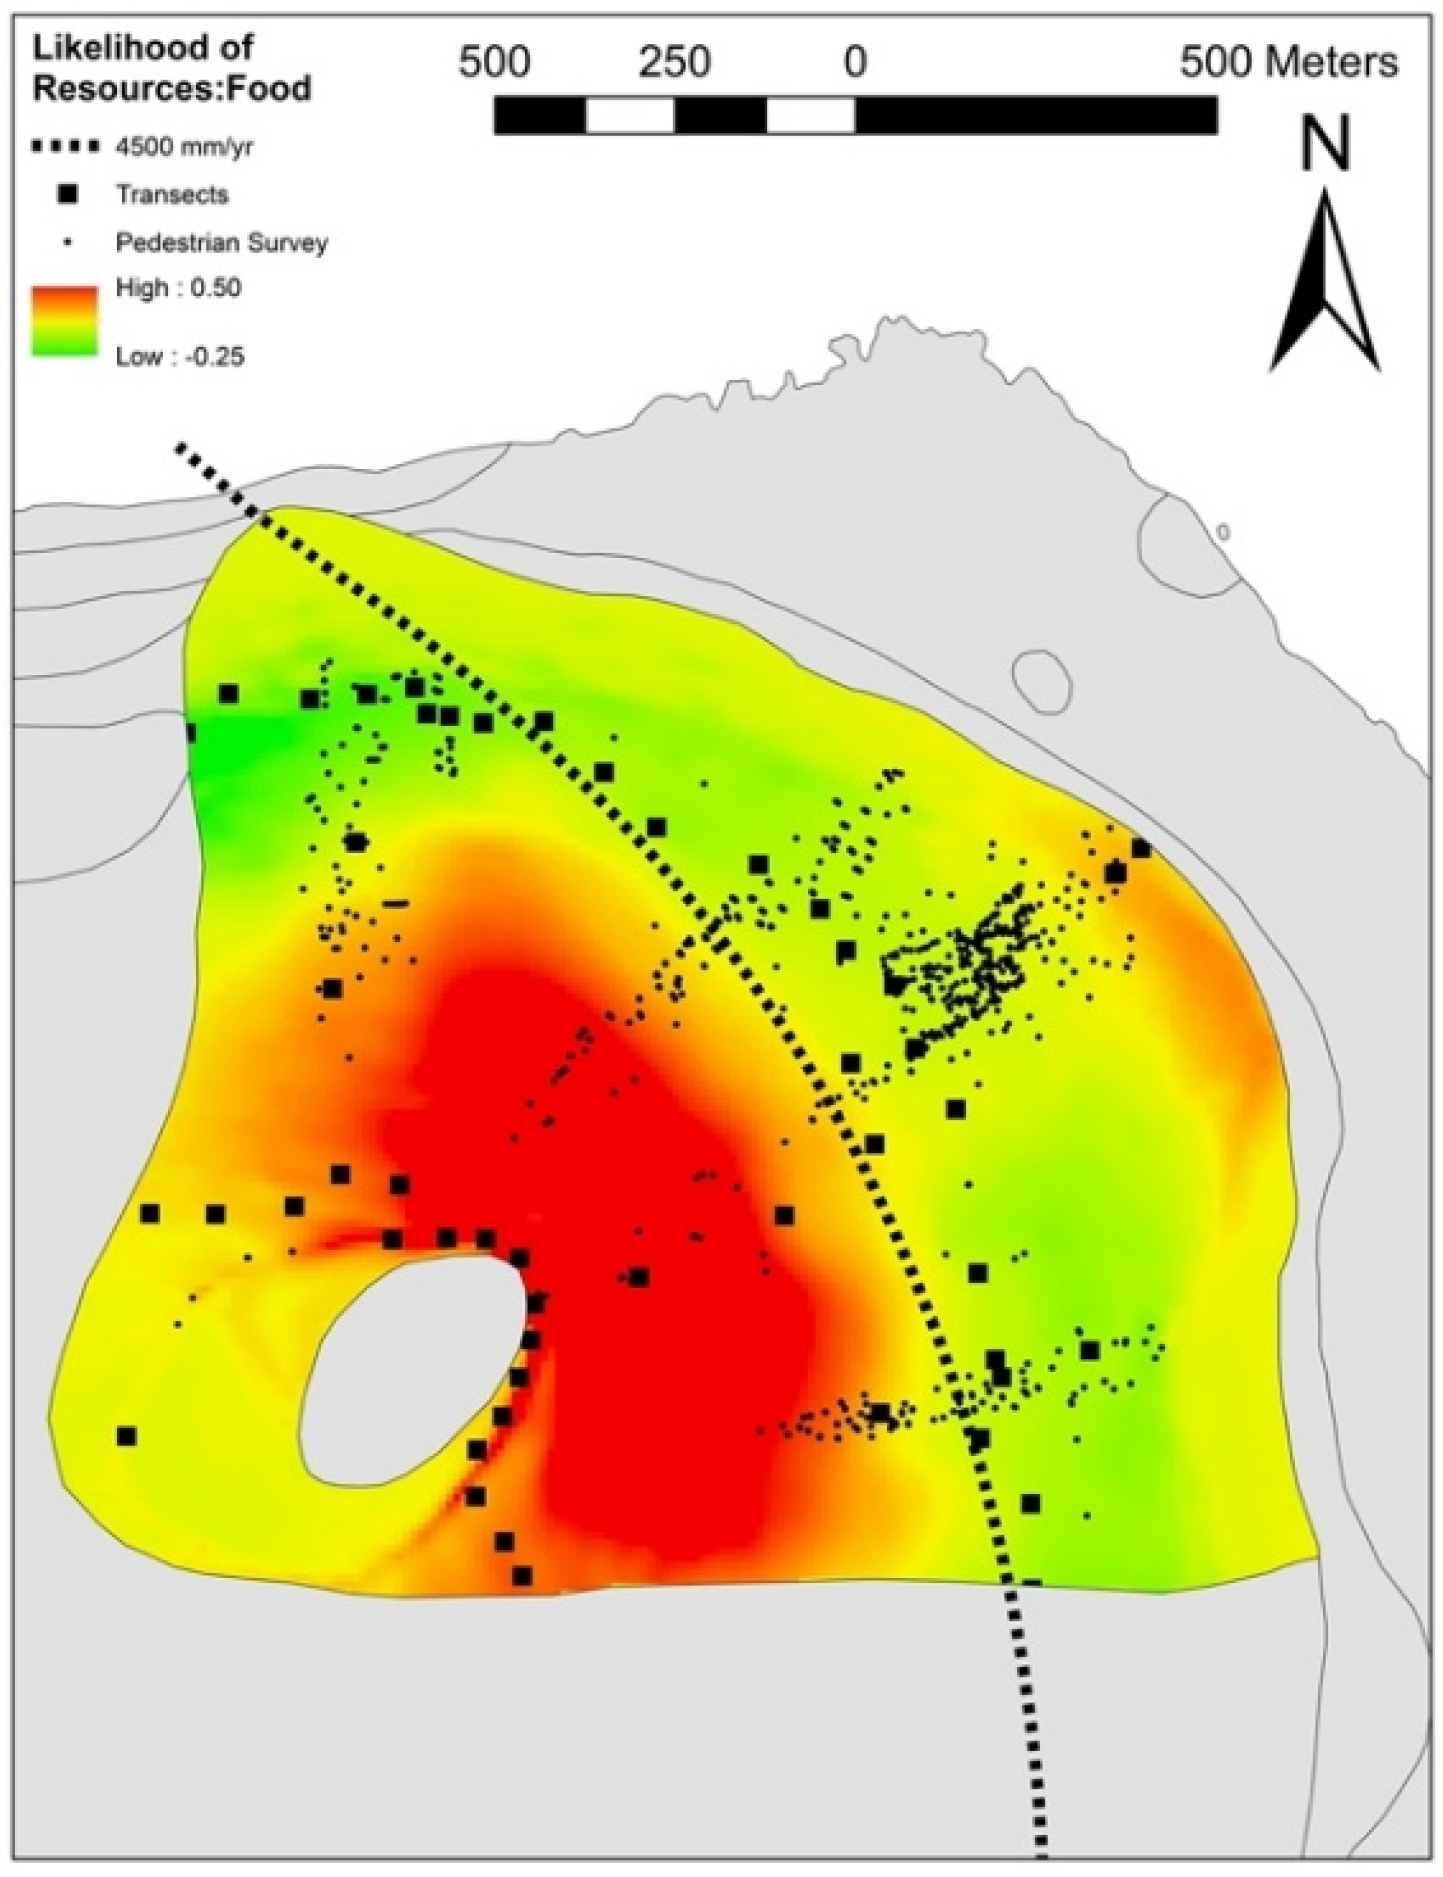
3.5. Archaeological Vegetation Analysis

Directly dated economic species (fau, niu, ‘ulu, and ifi) provide a means to assess the time depth of this trend. In addition to the radiocarbon dates reported previously in our archaeological analysis [28], seven new dates were obtained from ‘ulu wood charcoal and one from ifi (Inocarpus fagifer; Tahitian chestnut) wood charcoal (Table 5). Considered together, these dates provide evidence that at least some stands of economic trees were in place in Luatele by the end of the first millennium AD. There are also indications that economic vegetation was growing in the study area before substantial human geomorphic engineering took place as some samples are from contexts beneath standing architecture, notably terrace-retaining walls. These results provide support, albeit limited, to our argument that the observed vegetation patterns reflect past land use practices in this area.

4. Discussion

A strong rainfall gradient and different geologic substrates drove substantial differences in Ta‘ū soils across the study site. Rainfall increased with elevation and across slope from west to east and is a major driver of bulk soil properties. Differences in soils were noticeable during sampling, with stronger aggregation and lower clay content occurring in the western and lower portions of the Luatele shield.
One proposed outcome of this work was to examine the validity of soil predictors for formal Polynesian rainfed agriculture, but in a much wetter environment than studied previously. The predictors were largely developed along a rainfall gradient in Kohala, Hawai‘i, where the total rainfall gradient spanned from ~300 to ~3000 mm y−1, with the formal agricultural systems occupying the space falling between ~750 and 2200 mm y−1 [6]. These predictors were further validated in Rapa Nui at a rainfall of ~1000 mm y−1 [9], in Kona, Hawai‘i using a rainfall gradient of ~650–1800 mm y−1 [15], and in Ka’u, Hawai‘i using a rainfall gradient of ~600–1400 mm y−1 [51]. The previous application of these soil predictors for Polynesian investment into formal rainfed agricultural developments contrasts starkly with Ta‘ū, where the rainfall ranges from ~3500 to ~7000 mm y−1 and the agricultural developments occupy the space falling between ~3750 and 5500 mm y−1. We sought to investigate the relevance of these soil predictors under the severe increase in weathering and leeching potential associated with the high rainfall on Ta‘ū.
In terms of the predictor values, being drier on Ta‘ū is associated with an increase in all indicators. Soils from the lower elevations of the Luatele substrates had, with the exception of exchangeable calcium, soil parameter values that would predict the development of formal Polynesian rainfed field systems. The upper elevations of the Luatele shield are more marginal, with predictor values falling below or at the previously suggested threshold levels. All soil pH values were very strongly acidic to neutral with pH ranging from 4.62 to 6.78. Soils were less acidic in the lower transect. Soil pH and BS% were similar in magnitude and patterning to investigations of intensive Polynesian cropping systems in ~150 ky [6] and ~7.5 and 12 ky substrates [15,52] on Hawai‘i Island, despite the noticeable difference that Ta‘ū receives ~3000 mm y−1 more precipitation. The overall exchange capacity of the Ta‘u soils (max 28.5, mean 18.1 cmol kg−1) generally saw a linear decline with rainfall, with values from the Lata substrate being higher than the younger Luatele substrate (Table S1). It has been suggested that exchange capacity is constrained in very young soils (<20 ky) by coarse minerals with low surface area [50,53]. A low surface area reduces mineral and water reactions and could increase the transport of materials in the younger soils, with these kinetic limitations being increasingly overcome as soils further develop. That said, it is important to recognize that the “older” soil substrates stemming from the Lata flows are still fairly young in comparison to the Kohala substrates (~150 ky) that served to develop the predictor values.
To compare these predictors to the well-studied Hawai‘i soils, we plotted our data along with data from Hawai‘i [6,15,54,55] using an axis of cumulative rainfall to normalize the data across age and climate (Figure 5). In doing so, we see that at a broad scale, the situation of the Ta‘u soils fits within similar patterns witnessed in Hawai‘i, although with considerable noise and some discrepancies, particularly regarding base saturation. These patterns are further discussed in the following paragraphs.
The %P remaining showed values generally in excess of 100%, likely resulting from the combination of biological uplift and dust deposition to exceed losses from the soil system. Despite the elevated elemental P present, resin-extractable P was moderate and generally at or below the predictor value. The biological uplift of nutrient cations including P with subsequent enrichments in soils has been commonly observed [56,57]. Enrichments of P in surface soils relative to the underlying parent materials are found to be associated with the surface accumulation of organically bound P and P occluded in secondary clay and iron oxide minerals, despite the intensive losses of apatite [58]. Ta‘ū soils are very wet Andisols with high contents of organic matter and amorphous minerals/clay, both of which have high capacity to keep P out of labile P pools [59,60]. There may also be differences in the elemental concentrations of the parent material, although broad sampling of Ta‘ū basalt shows fairly consistent elemental concentrations [47]. Surprisingly, CEC showed weak correlation to soil carbon in the Ta‘ū samples (Table S1), while all sampling from leeward Hawai‘i showed moderate to strong correlations between soil carbon and CEC [15,55,58].
Exchangeable calcium, which was considered the most reliable predictor of cultivation in Hawai‘i and Rapa Nui [9], exhibited levels well below the threshold levels through the study site. Despite low levels of total and exchangeable calcium, both appear substantially elevated compared to what we expected in response to the high precipitation. Ca is often a limiting nutrient in Samoan soils due to leaching [61]. The parent material of Ta‘ū has relatively high calcium concentrations (~8%) [47] in comparison to Hawai‘i Island (~5%) [54]. The coarse soil texture could simultaneously contribute to the low exchangeable Ca by limiting the exchange capacity and be a source of Ca from the unweathered material. What ultimately matters for plant or crop uptake is Ca dissolved in water, which is sourced not only from an exchangeable Ca pool but also from organic matter decomposition, the dissolution of Ca-bearing minerals, and, potentially important in the Ta‘u system, marine inputs. Soil organic matter contains a significant amount of Ca in its molecular structure, which does not participate in an exchangeable pool [62], while marine inputs can be a considerable and consistent input of exchangeable Ca [63]. Considering the high organic matter contents and the rich presence of coarse rocks in the soils we examined, low exchange Ca in the soils should not necessarily be used as evidence for Ca being a limiting nutrient. Indeed, the weathering of basalt rock is considered integral to the nutrient cycles of rock gardens in Rapa Nui [9]. Such high-flux systems with rapid weathering release but low retention capacity in the soil have been suggested as prime locations for the development of indigenous agroforestry [15].
An analysis of soil properties and elemental concentrations was conducted to consider the Ta‘ū soils in terms of soil domains (as forwarded by [55]). The three soil domains described for the Hawi soil series on Hawai‘i Island (a basalt-derived flow series ~150 ky) are pedogenic carbonate (<750 mm y−1), active weathering and uplift (750–2200 mm y−1), and iron enrichment (>2200 mm y−1), which are delineated by multiple, rapid shifts in soil properties. However, in the domain of iron enrichment, most soil properties (e.g., BS%, pH, and exchangeable P) have stabilized at very low levels. Despite occurring at substantially higher rainfall, our analysis of Ta‘ū soils demonstrates a similar range and shift in these properties with rainfall (Figure 3) compared to Kohala [55]. In the Hawi soils (150 ky), the transition between the uplift and the iron enrichment domain occurs at ~2200 mm y−1 rainfall, in Mauna Kea soils (40 ky) this transition occurs at ~2600 mm y−1, while this transition appears to occur at ~4500 mm y−1 rainfall on the Luatele shield (~20 ky). Despite our expectation that the extreme wetness of Ta‘ū would create a system of high leaching and low fertility, the soils remain largely fertile and metals remain largely immobile. This may be explained by the total cumulative weathering potential, which we assume is linearly related to the cumulative rainfall that a soil has received during its formation (Figure 5). With a further assumption of relatively constant rainfall over the course of soil formation, the Hawi soil has a cumulative rainfall of 330,000 m of rain (2.2 m y−1 rainfall × 150 ky), Mauna Kea 104,000 m (2.6 m y−1 × 40 ky). These cumulative rainfalls are significantly greater than the 90,000 m that we calculated for Luatele soil (4.5 m y−1 × 20 ky). This suggests that Ta‘ū does fall in the same pattern as the Hawai‘i soils, even if the magnitude is not perfectly in alignment.
In addition to the differences in cumulative rainfall, there may be other contributing factors at play, which we speculate on here. The accuracy of both soil age and rainfall is questionable, especially for rainfall which is modeled with only a single rainfall station with a short history on the island. The highly significant, positive linear relationship between the relatively immobile element niobium and rainfall (Table 2) suggests that the patterning of rainfall is reasonably accurate, but we cannot speak directly to the magnitude of rainfall. The exceptional drainage anecdotally observed in the Ta‘ū soils, coupled with the concentrated delivery of precipitation, may drive rainfall to bypass the soils through preferential flow paths, reducing the interaction and causing the soils to behave as if they were drier [64]. This high bypass of rainfall could also be driving the redistribution of soil particles, causing higher concentrations of coarse material in the upper layers that were sampled. We did not examine infiltration rates or particle size distribution in the profiles and cannot assess this hypothesis. Furthermore, the fact that Ta‘ū is forested, in contrast to the pasture ecosystems targeted in Hawai‘i, may also affect the patterns observed due to an enhanced short-term biological uplift and redeposition of nutrients, and in particular cations, which may help to maintain elevated BS% and pH compared to the Hawai‘i samples. Although Hawaiian soils were also forested in the past (200+ years ago), the impact of land cover on more mobile elements can substantially shift soil properties within this time frame [65]. Finally, Ta‘ū could be subjected to elevated off-island inputs, either of marine aerosols or dust transport, which could be enhanced by the elevated rainfall. These have been shown to be important inputs in Hawai‘i [57], but their degree are unknown for Ta‘ū.
The distribution of remnant economic crops surveyed indicates that the lower elevations of both the Lata and Luatele substrates were cultivated with food and resource crops, while the upper elevations of the Luatele shield appear to have been used more sparingly, and the upper elevations of the Lata substrates show evidence of minimal, sporadic cultivation. These results are consistent with the distribution of archaeological infrastructure throughout the study area [22,28]. On the younger Luatele substrate, the distribution of ‘ulu and niu are relegated to the lower elevations. When examining the crops in categorical terms, there is an apparent inland transition in cropping systems from one based on both resource and food crops to exclusively resource crops. The point of this transition closely aligns with the 4500 mm y−1 rainfall isohyet and the cluster of segmented regression breakpoint identified on the Luatele shield. We interpret this as the development of agricultural zones that align with domains of soil processes [15,53,55]. Specifically, we believe that the relict distribution of vegetation and secondary growth suggests some form of mixed agroforestry was practiced at the lower elevations, which we have proposed are also the primary habitation area [28], while more expansive, but less intensive, shifting cultivation was practiced inland. The misalignment of the transition as it occurs on the western edge of the Luatele shield may be explained by the extremely coarse and unverified rainfall maps that were applied to the analyses of this study, or true differences in the soil resulting from elevated ash or tephra deposits. Our observations in the field were that the westerns soils were much drier and less weathered than soils elsewhere across the study site.
In the Kona and Kohala regions of Hawai‘i Islands, very young (<10 ky) and moderate (~150 ky) age substrates were extensively converted to various agricultural systems, including intensive tuber cropping [13,66] and extensive arboricultural systems [67], and we suggest that the inland Ta‘ū agricultural system would have had to rely on a similar partitioning of cropping systems in coordination with the potential of the soil system.
Studying the time depth of agroforestry practices has been challenging in Oceania, but work has been carried out on important arboreal crops such as ‘ulu (breadfruit) and lama (candlenut) (e.g., [68,69]). Our work provides some indication as to when arboreal cultivation developed at inland locations on Ta‘u. The radiocarbon dates obtained from economic trees suggest that by the end of the first millennium AD, novel economic forests had become established on lower elevations of the Luatele shield. This chronology suggests that the development of the novel economic forest occurred at the same time or before the expansive construction of terracing and well before the construction of walls. The archaeobotanical evidence, mainly wood charcoal, further suggests that the economic trees were grown in the presence of a well-developed secondary forest. This finding is consistent with agroforestry solutions known today and in the past [70].

5. Conclusions

Soils are a critical driver of human land use and societies, in the past as well as today. Based on previous studies, the nature of the soils and climate of Ta‘ū would likely have been more conducive to an arboricultural or mixed-agroforestry cropping system rather than intensive tuber production as seen in leeward Hawai‘i, and our evidence suggests it was the case for Luatele. Such adaptive land management is a hallmark of indigenous agroecology that leverages ecomimicry to install sustainable, low-input agricultural endeavors in traditional land management. Understanding the patterns of traditional agroecological adaptation of cropping systems to ecosystem parameters can inform contemporary practices to improve the efficient allocation of land to agriculture, suggest the most productive sustainable cropping systems for a given environment, and provide scenarios for understanding ecosystem services and other non-economic outcomes associated with agricultural production.

Supplementary Materials

The following supporting information can be downloaded at: https://www.mdpi.com/article/10.3390/soilsystems7020052/s1, Table S1: All Soil Data, Figure S1: Maximum entropy model of food crops identified in the botanical survey, Figure S2: Maximum entropy model of resource crops identified in the botanical survey.

Author Contributions

Conceptualization, S.Q. and N.K.L.; methodology, D.A. and N.K.L.; software, D.A., S.Q. and N.K.L., formal analysis, D.A., S.Q. and N.K.L.; investigation, D.A., S.Q. and N.K.L.; resources, S.Q. and N.K.L.; data curation, D.A., S.Q. and N.K.L.; writing—original draft preparation, D.A., S.Q. and N.K.L.; writing—review and editing, K.Y., J.D., S.D. and J.H.; visualization, D.A., S.Q. and N.K.L.; supervision, S.Q. and N.K.L.; project administration, S.Q., N.K.L. and S.D.; funding acquisition, S.Q. and N.K.L. All authors have read and agreed to the published version of the manuscript.

Funding

This research was primarily funded by NSF Archaeology, grant number 1732360. In addition, the East–West Center provided funding for DA graduate assistantship, and NIFA HATCH H-8053 and NSF grant number 1941595 provided some supplemental support.

Data Availability Statement

Full data set is available as a Supplementary Table. All data products are available upon request to corresponding author.

Conflicts of Interest

The authors declare no conflict of interest, and the funders had no role in the design of the study; in the collection, analyses, or interpretation of data; in the writing of the manuscript, or in the decision to publish the results.

References

  1. Stockdale, E.A.; Shepherd, M.A.; Fortune, S.; Cuttle, S.P. Soil Fertility in Organic Farming Systems–Fundamentally Different? Soil Use Manag. 2002, 18, 301–308. [Google Scholar] [CrossRef]
  2. Vitousek, P.M.; Mooney, H.A.; Lubchenco, J.; Melillo, J.M. Human Domination of Earth’s Ecosystems. Science 1997, 277, 494–499. [Google Scholar] [CrossRef]
  3. Vitousek, P.M.; Bateman, J.B.; Chadwick, O.A. A “Toy” Model of Biogeochemical Dynamics on Climate Gradients. Biogeochemistry 2021, 154, 183–210. [Google Scholar] [CrossRef]
  4. Vitousek, P.M.; Treseder, K.K.; Howarth, R.W.; Menge, D.N. A “Toy Model” Analysis of Causes of Nitrogen Limitation in Terrestrial Ecosystems. Biogeochemistry 2022, 160, 381–394. [Google Scholar] [CrossRef]
  5. Kirch, P.V. Hawaii as a Model System for Human Ecodynamics. Am. Anthropol. 2007, 109, 8–26. [Google Scholar] [CrossRef]
  6. Vitousek, P.M.; Ladefoged, T.N.; Kirch, P.V.; Hartshorn, A.S.; Graves, M.W.; Hotchkiss, S.C.; Tuljapurkar, S.; Chadwick, O.A. Soils, Agriculture, and Society in Precontact Hawaii. Science 2004, 304, 1665–1669. [Google Scholar] [CrossRef]
  7. Ladefoged, T.N.; Kirch, P.V.; Gon III, S.M.; Chadwick, O.A.; Hartshorn, A.S.; Vitousek, P.M. Opportunities and Constraints for Intensive Agriculture in the Hawaiian Archipelago Prior to European Contact. J. Archaeol. Sci. 2009, 36, 2374–2383. [Google Scholar] [CrossRef]
  8. Vitousek, P.M.; Chadwick, O.A.; Hilley, G.; Kirch, P.V.; Ladefoged, T.N. Erosion, Geological History, and Indigenous Agriculture: A Tale of Two Valleys. Ecosystems 2010, 13, 782–793. [Google Scholar] [CrossRef]
  9. Vitousek, P.M.; Chadwick, O.A.; Hotchkiss, S.C.; Ladefoged, T.N.; Stevenson, C.M. Farming the Rock: A Biogeochemical Perspective on Intensive Agriculture in Polynesia. J. Pac. Archaeol. 2014, 5, 51–61. [Google Scholar]
  10. Quintus, S.; Cochrane, E.E. Pre-Contact Samoan Cultivation Practices in Regional and Theoretical Perspective. J. Isl. Coast. Archaeol. 2018, 13, 474–500. [Google Scholar] [CrossRef]
  11. Naidu, R.; Morrison, R.J.; Janik, L.; Asghar, M. Clay Mineralogy and Surface Charge Characteristics of Basaltic Soils from Western Samoa. Clay Miner. 1997, 32, 545–556. [Google Scholar] [CrossRef]
  12. Lincoln, N.K. Agroforestry Form and Ecological Adaptation in Ancient Hawai‘i: Extent of the Pākukui Swidden System of Hāmākua, Hawai‘i Island. Agric. Syst. 2020, 181, 102808. [Google Scholar] [CrossRef]
  13. Lincoln, N.K.; Vitousek, P. Indigenous Polynesian Agriculture in Hawai‘i. In Oxford Research Encyclopedia of Environmental Science; Oxford University Press: Oxford, UK, 2017. [Google Scholar]
  14. Winter, K.; Lincoln, N.; Berkes, F.; Alegado, R.; Kurashima, N.; Frank, K.; Pascua, P.; Rii, Y.; Reppun, F.; Knapp, I. Ecomimicry in Indigenous Resource Management: Optimizing Ecosystem Services to Achieve Resource Abundance, with Examples from Hawai‘i. Ecol. Soc. 2020, 25. [Google Scholar] [CrossRef]
  15. Lincoln, N.; Chadwick, O.; Vitousek, P. Indicators of Soil Fertility and Opportunities for Precontact Agriculture in Kona, Hawai‘i. Ecosphere 2014, 5, 1–20. [Google Scholar] [CrossRef]
  16. Kirch, P.V.; Zimmerer, K.S. Roots of Conflict; School of Advanced Research Press: Santa Fe, NM, USA, 2011. [Google Scholar]
  17. Stice, G.D.; McCoy, F.W., Jr. The Geology of the Manu‘a Islands, Samoa. Pac. Sci. 1968, 22, 427–457. [Google Scholar]
  18. Nakamura, S. Soil Survey of American Samoa; Soil Conservation Service, USDA: Washington, DC, USA, 1984. [Google Scholar]
  19. Craig, P. Natural History Guide to American Samoa; National Park of American Samoa, Department of Marine and Wildlife Resouces, American Samoa Community College: Pago, American Samoa, 2009. [Google Scholar]
  20. McDougall, I.A.N. Age of Volcanism and Its Migration in the Samoa Islands. Geol. Mag. 2010, 147, 705–717. [Google Scholar] [CrossRef]
  21. Liu, Z.; Gurr, N.E.; Schmaedick, M.A.; Whistler, W.A.; Fischer, L. Vegetation Mapping of American Samoa; United States Department of Agriculture Forest Service American Samoa Community College: Pago, American Samoa, 2011. [Google Scholar]
  22. Quintus, S.; Day, S.S.; Smith, N.J. The Efficacy and Analytical Importance of Manual Feature Extraction Using Lidar Datasets. Adv. Archaeol. Pract. 2017, 5, 351–364. [Google Scholar] [CrossRef]
  23. Williams, S.P. Ocean-Island Flank Collapse on the South of Ta‘u, Manu‘a Group, Samoa Islands: Implications for Risk Management. Unpublshed. MSc Thesis, University of Canterbury, Christchurch, New Zealand, 2009. [Google Scholar]
  24. United States Department of Agriculture (USDA). Olotania Series. 1981. Available online: soilseries.sc.egov.usda.gov/ (accessed on 15 April 2018).
  25. Petchey, F.J. Radiocarbon Determinations from the Mulifanua Lapita Site, Upolu, Western Samoa. Radiocarbon 2001, 43, 63–68. [Google Scholar] [CrossRef]
  26. Clark, J.T.; Quintus, S.; Weisler, M.; St Pierre, E.; Nothdurft, L.; Feng, Y. Refining the Chronology for West Polynesian Colonization: New Data from the Samoan Archipelago. J. Archaeol. Sci. Rep. 2016, 6, 266–274. [Google Scholar] [CrossRef]
  27. Petchey, F.; Kirch, P.V. The Importance of Shell: Redating of the To’aga Site (Ofu Island, Manu‘a) and a Revised Chronology for the Lapita to Polynesian Plainware Transition in Tonga and Sāmoa. PLoS ONE 2019, 14, e0211990. [Google Scholar] [CrossRef]
  28. Quintus, S.; Huebert, J.; Day, S.; Lincoln, N.; Yoo, K.; Lee, T.; Filimoehala, D.; Autufuga, D. Tempo and Tradjectory of the Built Landscape on Ta‘u Island, Manu‘a Group, American Samoa: Integrating Extensive Radiocarbon Dating with Joint Posterior Modeling. Radiocarbon 2020, 62, 1317–1337. [Google Scholar] [CrossRef]
  29. Jennings, J.D.; Holmer, R.N. Archaeological Excavations in Western Samoa; Pacific Anthropolological Records, Biship Museum: Honolulu, HI, USA, 1980. [Google Scholar]
  30. Quintus, S. Historicizing Food Production in Polynesia: A Case Study of 2700 Years of Land Use on Ofu Island, American Samoa. J. Field Archaeol. 2018, 43, 222–235. [Google Scholar] [CrossRef]
  31. Burt, R. Soil Survey Laboratory Methods Manual; National Resource Conservation Service, USDA: Washington, DC, USA, 1992. [Google Scholar]
  32. Robertson, S. Direct Estimation of Organic Matter by Loss on Ignition: Methods. SFU Soil Sci. Lab. 2011, 1–11. [Google Scholar]
  33. Elzinga, C.L.; Salzer, D.W. Measuring & Monitoring Plant Populations; US Department of the Interior, Bureau of Land Management: Washington, DC, USA, 1998. [Google Scholar]
  34. Schreuder, H.T.; Ernst, R.; Ramirez-Maldonado, H. Statistical Techniques for Sampling and Monitoring Natural Resources; United States Forest Service, US Department of Agriculture: Washington, DC, USA, 2004. [Google Scholar]
  35. Phillips, S.J.; Dudik, M.; Schapire, R.E. A Maximum Entropy Approach to Species Distribution Modeling. In Proceedings of the Twenty-First International Conference on Machine Learning, Banff, AL, Canada, 4–8 July 2004; pp. 655–662. [Google Scholar]
  36. Phillips, S.J.; Anderson, R.P.; Schapire, R.E. Maximum Entropy Modeling of Species Geographic Distributions. Ecol. Model. 2006, 190, 231–259. [Google Scholar] [CrossRef]
  37. Elith, J.; Phillips, S.J.; Hastie, T.; Dudík, M.; Chee, Y.E.; Yates, C.J. A Statistical Explanation of MaxEnt for Ecologists. Divers. Distrib. 2011, 17, 43–57. [Google Scholar] [CrossRef]
  38. R Team. R: A Language and Environment for Statistical Computing. 2013. Available online: gbif.org/tool/81287/r-a-language-and-environment-for-statistical-computing (accessed on 13 November 2018).
  39. Daly, C.; Smith, J.; Doggett, M.; Halbleib, M.; Gibson, W. High-Resolution Climate Maps for the Pacific Basin Islands, 1971–2000; Report submitted to National Park Service Pacific West Regional Office; PRISM Group, Oregon State University: Corvallis, OR, USA, 2006. [Google Scholar]
  40. National Park Service (NPS) Geologic Resources Inventory (GRI) Program. Digital Geologic Map of Tau, American Samoa, Adapted from a Geological Society of America Bulletin Map by Winger (Compiler) and Pereira (Prefacer) (1981). Available online: datadiscoverystudio.org/geoportal/rest/metadata/item/fa63cc6e3eeb46baade94feb10bde119 (accessed on 15 April 2018).
  41. Broennimann, O.; Fitzpatrick, M.C.; Pearman, P.B.; Petitpierre, B.; Pellissier, L.; Yoccoz, N.G.; Thuiller, W.; Fortin, M.-J.; Randin, C.; Zimmermann, N.E. Measuring Ecological Niche Overlap from Occurrence and Spatial Environmental Data. Glob. Ecol. Biogeogr. 2012, 21, 481–497. [Google Scholar] [CrossRef]
  42. Brown, J.L.; Carnaval, A.C. A Tale of Two Niches: Methods, Concepts, and Evolution. Front. Biogeogr. 2019, 11, 4158. [Google Scholar] [CrossRef]
  43. Allen, M.S.; Huebert, J.M. Short-Lived Plant Materials, Long-Lived Trees, and Polynesian 14C Dating: Considerations for 14C Sample Selection and Documentation. Radiocarbon 2014, 56, 257–276. [Google Scholar] [CrossRef]
  44. Ramsey, C.B. Bayesian Analysis of Radiocarbon Dates. Radiocarbon 2009, 51, 337–360. [Google Scholar] [CrossRef]
  45. Reimer, P.J.; Austin, W.E.; Bard, E.; Bayliss, A.; Blackwell, P.G.; Ramsey, C.B.; Butzin, M.; Cheng, H.; Edwards, R.L.; Friedrich, M. The IntCal20 Northern Hemisphere Radiocarbon Age Calibration Curve (0–55 Cal KBP). Radiocarbon 2020, 62, 725–757. [Google Scholar] [CrossRef]
  46. Kurtz, A.C.; Derry, L.A.; Chadwick, O.A.; Alfano, M.J. Refractory Element Mobility in Volcanic Soils. Geology 2000, 28, 683–686. [Google Scholar] [CrossRef]
  47. Hart, S.R.; Jackson, M.G. Ta‘u and Ofu/Olosega Volcanoes: The “Twin Sisters” of Samoa, Their P, T, X Melting Regime, and Global Implications. Geochem. Geophys. Geosystems. 2014, 15, 2301–2318. [Google Scholar] [CrossRef]
  48. Jensen, J.L.; Christensen, B.T.; Schjønning, P.; Watts, C.W.; Munkholm, L.J. Converting Loss-on-Ignition to Organic Carbon Content in Arable Topsoil: Pitfalls and Proposed Procedure. Eur. J. Soil Sci. 2018, 69, 604–612. [Google Scholar] [CrossRef]
  49. Muggeo, V.M. Segmented: An R Package to Fit Regression Models with Broken-Line Relationships. R News 2008, 8, 20–25. [Google Scholar]
  50. Bateman, J.B.; Chadwick, O.A.; Vitousek, P.M. Quantitative Analysis of Pedogenic Thresholds and Domains in Volcanic Soils. Ecosystems 2019, 22, 1633–1649. [Google Scholar] [CrossRef]
  51. Quintus, S.; Lincoln, N.K. Integrating Local and Regional in Pre-Contact Hawaiian Agriculture at Kahuku, Hawai‘i Island. Environ. Archaeol. 2020, 25, 53–68. [Google Scholar] [CrossRef]
  52. Chadwick, O.A.; Gavenda, R.T.; Kelly, E.F.; Ziegler, K.; Olson, C.G.; Elliott, W.C.; Hendricks, D.M. The Impact of Climate on the Biogeochemical Functioning of Volcanic Soils. Chem. Geol. 2003, 202, 195–223. [Google Scholar] [CrossRef]
  53. Chadwick, O.A.; Chorover, J.; Chadwick, K.D.; Bateman, J.B.; Slessarev, E.W.; Kramer, M.; Thompson, A.; Vitousek, P.M. Constraints of Climate and Age on Soil Development in Hawai‘i. In Biogeochemistry of the Critical Zone; Springer International Publishing: Cham, Switzerland, 2022. [Google Scholar]
  54. Porder, S.; Hilley, G.E.; Chadwick, O.A. Chemical Weathering, Mass Loss, and Dust Inputs across a Climate by Time Matrix in the Hawaiian Islands. Earth Planet. Sci. Lett. 2007, 258, 414–427. [Google Scholar] [CrossRef]
  55. Vitousek, P.M.; Chadwick, O.A. Pedogenic Thresholds and Soil Process Domains in Basalt-Derived Soils. Ecosystems 2013, 16, 1379–1395. [Google Scholar] [CrossRef]
  56. Jobbagy, E.G.; Jackson, R.B. The Distribution of Soil Nutrients with Depth: Global Patterns and the Imprint of Plants. Biogeochemistry 2001, 53, 51–77. [Google Scholar] [CrossRef]
  57. Vitousek, P.M. Nutrient Cycling and Limitation; Princeton University Press: Priceton, NJ, USA, 2018. [Google Scholar]
  58. Eger, A.; Yoo, K.; Almond, P.C.; Boitt, G.; Larsen, I.J.; Condron, L.M.; Wang, X.; Mudd, S.M. Does Soil Erosion Rejuvenate the Soil Phosphorus Inventory? Geoderma 2018, 332, 45–59. [Google Scholar] [CrossRef]
  59. Sanchez, P.A. Properties and Management of Soils in the Tropics. Soil Sci. 1977, 124, 187. [Google Scholar] [CrossRef]
  60. Uehara, G.; Gillman, G. The Mineralogy, Chemistry, and Physics of Tropical Soils with Variable Charge Clays; Westview Press, Inc.: Boulder, CO, USA, 1981. [Google Scholar]
  61. Guinto, D.F.; Lauga, S.; Dauara, L.; Walasi, E.; Autufuga, D.; Perera, H.; Seuoti, D.; Tauati, S. Soil Health Assessment of Taro (Colocasia Esculenta) Farms in Samoa; Occasional Report No. 28; Fertilizer and Lime Research Centre, Massey University: Palmerston North, New Zealand, 2015. [Google Scholar]
  62. Resner, K.; Yoo, K.; Sebestyen, S.D.; Aufdenkampe, A.; Hale, C.; Lyttle, A.; Blum, A. Invasive Earthworms Deplete Key Soil Inorganic Nutrients (Ca, Mg, K, and P) in a Northern Hardwood Forest. Ecosystems 2015, 18, 89–102. [Google Scholar] [CrossRef]
  63. Palmer, M.A.; Graves, M.; Ladefoged, T.N.; Chadwick, O.A.; Ka ‘eo Duarte, T.; Porder, S.; Vitousek, P.M. Sources of Nutrients to Windward Agricultural Systems in Pre-Contact Hawai‘i. Ecol. Appl. 2009, 19, 1444–1453. [Google Scholar] [CrossRef] [PubMed]
  64. Jefferson, A.J.; Ferrier, K.L.; Perron, J.T.; Ramalho, R. Controls on the Hydrological and Topographic Evolution of Shield Volcanoes and Volcanic Ocean Islands. Galapagos Nat. Lab. Earth Sci. 2014, 204, 185–213. [Google Scholar]
  65. Ladefoged, T.N.; Preston, A.; Vitousek, P.M.; Chadwick, O.A.; Stein, J.; Graves, M.W.; Lincoln, N. Soil Nutrients and Pre-European Contact Agriculture in the Leeward Kohala Field System, Island of Hawai‘i. Archaeol. Ocean. 2018, 53, 28–40. [Google Scholar] [CrossRef]
  66. Marshall, K.; Koseff, C.; Roberts, A.L.; Lindsey, A.; Kagawa-Viviani, A.K.; Lincoln, N.K.; Vitousek, P.M. Restoring People and Productivity to Puanui: Challenges and Opportunities in the Restoration of an Intensive Rain-Fed Hawaiian Field System. Ecol. Soc. 2017, 22, 99. [Google Scholar] [CrossRef]
  67. Lincoln, N.; Ladefoged, T. Agroecology of Pre-Contact Hawaiian Dryland Farming: The Spatial Extent, Yield and Social Impact of Hawaiian Breadfruit Groves in Kona, Hawai‘i. J. Archaeol. Sci. 2014, 49, 192–202. [Google Scholar] [CrossRef]
  68. Huebert, J.M.; Allen, M.S. Six Centuries of Anthropogenic Forest Change on a Polynesian High Island: Archaeological Charcoal Records from the Marquesas Islands. Quat. Sci. Rev. 2016, 137, 79–96. [Google Scholar] [CrossRef]
  69. Lincoln, N.; Zhang, Q.; Chen, Q. State of the State Tree: Historical and Modern Ecology of Kukui (Candlenut, Aleurites Moluccanus) in Hawai‘i. Pac. Sci. 2021, 74, 419–434. [Google Scholar] [CrossRef]
  70. Quintus, S.; Huebert, J.; Kirch, P.V.; Lincoln, N.K.; Maxwell, J. Qualities and Contributions of Agroforestry Practices and Novel Forests in Pre-European Polynesia and the Polynesian Outliers. Hum. Ecol. 2019, 47, 811–825. [Google Scholar] [CrossRef]
Figure 1. Ta‘ū Island, indicating the location of the project study area.
Soilsystems 07 00052 g001
Figure 2. Geologic map [17] showing the Luatele flows, ~20,000 years old (oranges) and the Lata flow, <70,000 years old (reds), and indicating the soil sampling locations.
Soilsystems 07 00052 g002
Figure 3. Selected soil parameters of (A) base saturation (open circles) and exchangeable calcium (crosses) and (B) pH (open circles) and resin-extractable phosphorus (crosses) for Lata (black) and Luatele (gray) substrates with a LOESS smoother function (span = 0.7).
Soilsystems 07 00052 g003
Figure 4. A depiction of the difference in maximum entropy likelihood of occurrence of resource crops and food crops on the Luatele flow series (colored area), with red indicating a higher likelihood of resource crops and green indicating a higher likelihood of food crops. A strong delineation approximately halfway up the main Luatele shield is evident. The transect and the pedestrian vegetation survey occurrences are represented by the large square and small circles, respectively, and the dashed line represents the 4500 mm y−1 rainfall isohyet.
Soilsystems 07 00052 g004
Figure 5. Comparison of soil fertility indicators from current study in Ta‘u and previous studies in Hawai‘i [6,15,54,55], plotted against cumulative rainfall based on average annual rainfall and substrate geologic age.
Soilsystems 07 00052 g005
Table 1. Mean values (and standard error) for the upper and lower cross-slope transects in the study area of the five best “indicators” of intensified Polynesian sweet potato cultivation.
Exchangeable Ca
(cmol kg−1)
Base Saturation (%)pHExtractable P (μg g−1)P Remaining (%)
LuateleLower7.48 (0.47)63.44 (2.2)6.13 (0.06)56.44 (5.78)133 (7.7)
Upper3.05 (0.43)33.07 (3.4)5.55 (0.08)33.32 (2.21)107 (7.4)
LataLower8.43 (1.05)75.68 (5.17)5.69 (0.15)39.44 (4.45)117 (9.8)
Upper4.54 (1.39)43.25 (5.53)5.57 (0.15)31.98 (1.78)103 (25)
Fertility Threshold10.229.55.6850102
Table 2. Rainfall level at which significant segmented linear regression breakpoints occur in soil properties, suggesting points in climate forcing in which chemical buffering mechanisms are overcome.
Soil PropertynRainfall
Base Saturation (%)664587 ***
pH1174512 ***
Resin-Extractable P (mg kg−1)69--
Total P (mg kg−1)194127 ***
Exchangeable Ca (cmol kg−1)664574 **
Total Ca (mg kg−1)194437 **
Cation-Exchange Capacity (cmol kg−1)66--
Soil Moisture Capacity at 70 kPa (%)1094670 ***
%C113--
Niobium (ppm)194804 *
-- no breakpoint detected, * p < 0.05, ** p < 0.01, *** p < 0.001.
Table 3. List of economic plants identified in the vegetation surveys, along with their classification and the number of unique point occurrences.
Common Name Scientific NameClassificationTotal Occurrences
Fau (Sea Hibiscus)Hibiscus tiliaceusResource215
TiCordyline fruticosaResource212
‘Ulu (Breadfruit)Artocarpus altilisFood129
Niu (Coconut)Cocos nuciferaFood84
Nonu (Indian Mulberry)Morinda citrifoliaResource56
Oli’olī (Tree Fern)Cyathea spp.Resource31
Mati (Dye Fig)Ficus tinctoriaFood29
Lau maileAlyxia stellataResource22
ToiAlphitonia zizyphoidesResource21
Tamaligi (Tamarind)Tamarindus indicaModern14
Maota (Ivory Mahogany)Dysoxylum gaudichaudianumResource13
Ufi (Yam)Dioscorea spp.Food11
Ifi (Tahitian Chestnut)Inocarpus fagiferFood8
LaupataMacaranga harveyanaResource8
Ofe (Polyneisian Bamboo)Schizostachyum glaucifoliumResource4
Fala Screwpine)Pandanus tectoriusResource3
Koko (Cacao)Theobroma cacaoModern3
Lopā (Red Bean Tree)Adenanthera pavoninaModern3
PoumuliFlueggea flexuosaResource3
Fiu (Shampoo Ginger)Zingiber zerumbetResource2
Oketi pa’epa’e (Fairy Orchid)Caladenia marginataResource2
MangoMangifera indicaModern1
Mosooi (Ylang ylang)Cananga odorataResource1
Tipolo (Lime)Citrus aurantifoliaModern1
Table 4. Occurrence data for the five most common economic species surveyed on formal transects and less-formal pedestrian surveys.
SpeciesLowerUpperEasternCentralWestern
TransectsHau89.3%54.5%82.4%64.7%70.6%
Niu35.7%0.0%11.8%29.4%17.7%
Noni39.3%18.2%58.8%23.5%5.9%
Ti78.6%54.5%82.4%58.8%58.8%
‘Ulu71.4%4.5%58.8%29.4%29.4%
Transect Average62.9%26.3%58.8%41.2%36.5%
SurveysHau54.4%54.4%47.0%39.4%27.0%
Niu25.4%1.8%25.8%23.0%7.0%
Noni14.7%0.0%0.0%3.6%1.6%
Ti57.9%38.6%36.3%44.5%28.6%
‘Ulu42.5%1.8%36.6%27.3%14.3%
Survey
Average
39.0%19.3%29.1%27.6%15.7%
Total Average50.9%22.8%44.0%34.4%26.1%
Table 5. Radiocarbon dates and botanical taxa for material recovered from archaeological features.
Lab NumberContextElevationMaterialConventional
13C/12CDateCalendar Dates
Wk-55019Below Terrace221Artocarpus altilis woodNA1241 ± 20AD 681–745, 762–766, 771–779, 785–839, 844–878
Wk-55015Below Terrace188Artocarpus altilis woodNA981 ± 20AD 1021–1051, 1080–1154
Wk-55021Firepit on Terrace211Artocarpus altilis woodNA964 ± 20AD 1026–1054, 1075–1157
Wk-55017Below Terrace229Inocarpus fagifer woodNA955 ± 20AD 1031–1054, 1061–1158
AA113186 *Under Linear Mound186Cocos nucifera endocarp−24934 ± 21AD 1037–1162
UGAMS43805 *Under Terrace211Cocos nucifera endocarp−23.53920 ± 20AD 1040–1176, 1195–1198
Wk-55022Below Terrace229Artocarpus altilis woodNA771 ± 22AD 1225–1279
AA112171 *Below Terrace212Cocos nucifera endocarp−24.4696 ± 26AD 1271–1308, 1362–1386
Wk-55018Below Terrace212Artocarpus altilis woodNA672 ± 19AD 1280–1313, 1361–1388
AA112178 *Under Terrace180Cocos nucifera endocarp−22.9388 ± 23AD 1446–1521, 1582–1623
AA112177 *Under Linear Mound180Aleurites moluccanus endocarp−24.3367 ± 29AD 1452–1528, 1552–1634
Wk-55020Buried Terrace Surface203Artocarpus altilis woodNA371 ± 19AD 1455–1523, 1574–1627
UGAMS43802 *Firepit on Terrace212Hibiscus tiliaceus−27.77370 ± 20AD 1455–1524, 1572–1630
AA113193 *Below Terrace228Cocos nucifera endocarp−23.2253 ± 32AD 1520–1587, 1622–1680, 1740–1753, 1762–1800, 1940
Wk-55016Buried Terrace Surface229Artocarpus altilis woodNA206 ± 19AD 1651–1684, 1735–1804, 1929
AA112173 *Below Terrace228Cocos nucifera endocarp−23.5146 ± 25AD 1669–1711, 1718–1780, 1797–1822, 1831–1894, 1905
AA112176 *Under Terrace176Cocos nucifera endocarp−24.5104 ± 37AD 1680–1740, 1752–1763, 1800–1940
AA113188 *Under Linear Mound213Hibiscus tiliaceus−25.9131 ± 20AD 1680–1740, 1752–1763, 1800–1940
AA113189 *Under Linear Mound214Cocos nucifera endocarp−24.5129 ± 20AD 1681–1740, 1753–1763, 1800–1940
AA113190 *Below Terrace260Hibiscus tiliaceus−27.797 ± 20AD 1693–1727, 1811–1918
AA113187 *Under Terrace190Hibiscus tiliaceus−25.890 ± 19AD 1694–1726, 1811–1917
UGAMS43807 *Under Linear Mound200Cocos nucifera wood−25.1170 ± 20AD 1695–1725, 1811–1860, 1869–1871, 1876–1917
* Originally reported in [28]; wood charcoal species identification by Jennifer Huebert; calibration performed using Oxcal 4.4 [44] using the IntCal20 calibration curve [45].
Disclaimer/Publisher’s Note: The statements, opinions and data contained in all publications are solely those of the individual author(s) and contributor(s) and not of MDPI and/or the editor(s). MDPI and/or the editor(s) disclaim responsibility for any injury to people or property resulting from any ideas, methods, instructions or products referred to in the content.

