
Changes in Soil Water Retention and Micromorphological Properties Induced by Wetting and Drying Cycles

Laboratory of Physics Applied to Soils and Environmental Sciences, Department of Physics, State University of Ponta Grossa, Ponta Grossa 84030-900, Brazil
Soil Syst. 2023, 7(2), 51; https://doi.org/10.3390/soilsystems7020051
Submission received: 27 March 2023
/
Revised: 10 May 2023
/
Accepted: 11 May 2023
/
Published: 17 May 2023
(This article belongs to the Special Issue Research on Soil Management and Conservation)
Abstract
:Wetting and drying (W-D) cycles are responsible for significant changes in soil structure. Soil often undergoes irreversible changes affecting infiltration and solute retention through W-D cycles. Thus, it becomes essential to evaluate how soils under natural conditions are altered by W-D cycles. This study analyzed two non-cultivated (from grassland and secondary forest) Oxisols (Typic Hapludox and Rhodic Hapludox) of different textures under 0 and 6 W-D cycles. The main results obtained showed that soil water retention was mainly affected in the driest regions (smaller pore sizes). The contribution of residual pores to total porosity increased with 6 W-D and transmission pores decreased in both soils. The Rhodic Hapludox presented differences in water content at field capacity (increase), while the Typic Hapludox showed alterations at the permanent wilting point (increase), affecting the amount of free water (Rhodic Hapludox) and water available to plants (Typic Hapludox). Both soils showed increases in imaged porosity with 6 W-D. Variations in the contribution of small and medium rounded pores, mainly large and irregular (with an increase in both soils not significant in the Rhodic Hapludox), could explain the results observed. The micromorphological properties were mainly influenced by changes in the number of pores, in which smaller pores joined, forming larger ones, increasing the areas occupied by larger pores. Overall, this study showed that the investigated soils presented pore systems with adequate water infiltration and retention capacities before and after continuous W-D cycles.
1. Introduction
A good soil structure is fundamental for ideal agricultural development and for the prevention of environmental damage [1]. When the soil has a good structure, water infiltrates adequately, and this soil has a proper capacity to hold water for the plants [2]. Suitable water drainage is vital to avoid processes that lead to sediment transport, such as erosion [3]. Such a good structure is also fundamental for the appropriate development of the root system of crops [4]. Naturally, soils are subjected to numerous processes involving rainfall, temperature variations, wind action, and the decomposition of organic material, among many others [5]. All these processes modify the soil over time and provoke changes mainly in its structure. In the broadest sense, soil structure relates to how the soil components (primary particles, organic material, iron and aluminum oxides, carbonates, etc.) are arranged [5]. This results in an arrangement containing particles (matrix) and pores, usually filled by the soil solution and gases [6].
Observing the pore system is vital for understanding the processes that occur in the soil. This pore system results from the arrangement of particles and aggregates within the soil; therefore, different pore size distributions are related to particular soils [7]. Pore sizes are fundamental to the retention and movement of solutes in the soil profile [8]. In addition to different pore sizes, their shapes also influence the dynamics of solutes in the soil [9,10]. In micromorphology studies, pores can usually be classified as rounded, elongated, and complex (irregular), with each shape having a distinct origin and exerting different influences on the soil’s processes [11,12,13]. Wetting and drying (W-D) cycles are among the processes that cause changes in soil structure. These cycles occur naturally through rainfall but can also be artificially induced when irrigating the soil. Many studies have reported that soil when subjected to numerous W-D cycles, can undergo alterations that are often non-reversible due to the modifications that occur in the soil’s pore system [14,15,16,17]. These changes often cause pore size distribution and shape alterations, impacting infiltration and water retention [18,19,20].
Hussein and Adey [14] demonstrated the influence of W-D cycles in soil pore systems with the shape of pores changing from planar to compound due to the wetting effect on water dynamics. An et al. [16] showed that the proportion of micropores and mesopores decreased under W-D cycles with an increasing number of macropores in granite soils. Those authors claimed that changes in the clay microstructure explained the observed results. Pardini et al. [17] found that W-D cycles increased porosity resulting from the formation of large cracks and fissures. Those authors also observed increases in the number of pores after 3 W-D cycles. Xia et al. [18] noticed decreases in the saturated and residual water contents with increased alternate W-D cycles and increases in the saturated hydraulic conductivity. The soil structure degradation was pointed out by them as the cause of changes under W-D cycles. Thus, it has become crucial to analyze how the pore system of natural soils behaves when subjected to W-D cycles. It is known that when managed, the soil structure suffers substantial changes. Therefore, analyzing how these cycles affect natural soils can provide insights into their susceptibility to modifications under W-D.
One tool successfully used to characterize the soil pore system is the analysis of resin-impregnated blocks [9,21,22,23,24]. In this technique, two-dimensional (2D) images of sections in the soil blocks allow for the analysis of numerous morphological properties on the micrometer scale [25]. By using image analysis, it is possible to quantify changes in pore shape and size distribution. Numerous scientific papers have shown that alterations in soil morphological properties can affect the proper development of crops and modify solute and gas dynamics [4,26,27,28,29,30,31]. Thus, micromorphological analysis has become a useful method to check how soils behave when subjected to W-D cycles. Therefore, the objectives of this paper are two-fold: namely, to analyze how the water-holding capacity of two Oxisols under natural conditions is affected after repeated W-D cycles and to evaluate how the micromorphological properties of the soils are influenced by W-D cycles. Concerning the first objective, water retention data were employed to generate some indices related to soil quality and to assess the contribution of pores based on their roles in total porosity.
2. Materials and Methods
2.1. Soil Sampling
This research was conducted using soil samples collected in 2013 at experimental areas of the University of São Paulo (USP) research farm (22°72′ S, 47°62′ W) and Agronomic Institute of Campinas (IAC) research station (22°70′ S, 47°64′ W), both located in Piracicaba, Brazil. The soils collected were classified as Typic Hapludox (USP) and Rhodic Hapludox (IAC) [32]. The former has a sandy clay loam texture (69% sand, 10% silt, and 21% clay), while the latter has a clay loam texture (22% sand, 28% silt, and 50% clay) (USDA soil texture triangle). The Typic Hapludox samples were collected in an area covered with natural grass, while the Rhodic Hapludox samples were collected in a secondary forest area. The organic carbon content in the experimental sites was c. 16.2 g dm−3 (Typic Hapludox) and c. 26.9 g dm−3 (Rhodic Hapludox), respectively.
Undisturbed soil cores were collected in the topsoil layer (0–10 cm) using stainless steel cylinders (c. 5 cm in diameter and c. 3 cm in height) for the soil–water retention curve (SWRC) and micromorphological analysis. The Kopeck ring method was used to collect the samples in which a woody castle was employed, with the cylinder inserted into the soil surface using a rubber hammer [33]. The cylinder was slowly introduced into the soil to avoid damage to its structure. After cylinder insertion, the surrounding soil was carefully excavated with trowels to remove the cylinder. The excess soil outside the cylinder was removed with a palette knife to leave the soil volume equal to the internal volume of the cylinder. Next, the samples were wrapped in plastic film and taken to the laboratory.
The samples were collected with soil moisture near field capacity to avoid damage to the soil structure due to sampling. In the laboratory, the samples used for the micromorphological analysis were left to dry in the air for a few weeks, and close to the impregnation process, they were placed in an oven (forced air circulation) and dried at 40 °C for 48 h. A total of 44 undisturbed soil samples were collected for this study.
2.2. Wetting and Drying (W-D) Cycles
The capillary rise process was used to wet the samples [34]. This procedure was performed by placing a 1 cm layer of water around the cylinders, and then every hour, 0.5 cm of water was poured out up to approximately half the height of the cylinder. After a period of 24 h, 0.5 cm of water was again placed until approximately 9/10 of the height of the cylinder had been filled. Samples were left in water for 24 h to ensure they were saturated. Drying was achieved by placing the samples in Richards’s chamber and subjecting them to a pressure head (h) of 40 kPa. After the thermodynamic hydraulic equilibrium was achieved, the samples were submitted to a new wetting and drying process. Thus, samples not subjected to W-D cycles (0 W-D) and subjected to six W-D cycles (6 W-D) were analyzed. Two sample sets were prepared for this study, one for SWRC analysis (24 samples—6 samples × 2 soils × 2 W-D cycles) and another for micromorphological analysis (20 samples − 5 samples × 2 soils × 2 W-D cycles).
2.3. Water Retention Measurement
The SWRC determination was carried out using a suction table (Eijkelkamp Sandbox for pF determination) and low- to high-pressure Richards’s chambers (Soil Moisture Equipment Co., Goleta, CA, USA). Suctions of 3, 6, 9, and 10 kPa (suction table) and pressures of 30, 50, 150, 500, and 1500 kPa (Richards’s chambers) were selected for this study. The thermodynamic hydraulic equilibrium was defined when the water stopped leaving the undisturbed soil samples [35]. Thus, the samples previously subjected to 0 and 6 W-D were also submitted to the pressure heads (suctions and pressures) described above. After applying all the pressure heads, the samples were oven dried at 105 °C for 24–48 h. The gravimetric water content was obtained by the ratio between the wet soil mass (for each suction and pressure) and the dry soil mass. The volumetric water content (θ) was determined by considering the relation between the gravimetric water content (G), soil bulk density (ρs), and water density (ρw): [5,36].
The measured θ data related to each h were fitted to the van Genuchten–Mualem (VGM) model [37] according to:
where θr and θs are the residual and saturated water contents, and α and n are the VGM model fitting parameters. The fitting of Equation (1) was performed in the SWRC Fit program [38]. The coefficient of determination (r2) and root mean square error (RMSE) was used to assess the experimental data fit quality.
The equivalent pore diameter (Equation (2)) was determined based on the Young–Laplace equation [39]:
where d is the equivalent pore diameter (µm), h is the pressure head (kPa), σ is the water surface tension, ρw is the water density, g is the acceleration of gravity, and φ is the water-pore contact angle.
The water content at saturation was measured after the samples had undergone the capillary rise saturation procedure. Water contents at the field capacity (θfc) and permanent wilting point (θpwp) were obtained with the samples submitted to pressure heads of 10 kPa and 1500 kPa, respectively [1]. The gravitational or free-soil water content (θfw), plant-available soil water (θaw), and critical plant-available water (θcwc) were calculated based on the following set of equations [40,41]:
2.4. Micromorphological Analysis
Before the impregnation procedure, the undisturbed samples were very carefully taken out of the volumetric rings by exerting pressure on one of their surfaces. Next, the samples were impregnated under vacuum using a non-saturated polyester resin (Crystic SR 17449) mixed with a styrene monomer. To facilitate image segmentation, fluorescent pigments (Unitex OB) were added to the resin. After the impregnated blocks had hardened (about two months), they were cut with special tools (diamond cut-off saw), and one of the sides was polished [25]. Finally, a block of each sample with a thickness of approximately 1 cm and an area of approximately 4.5 × 3.0 cm2 was extracted from the impregnated blocks.
Digital images were acquired using a CCD camera with 1024 × 768-pixel resolution coupled to a petrographic microscope with the optical lens at ten (×10) times magnification. Blacklight lamps illuminated the blocks during image acquisition [42]. The two-dimensional (2D) images were processed and analyzed using Noesis-Visilog® 5.4 software. Each 2D image was related to an area of approximately 1.4 × 1.1 cm2. Three images were obtained for each impregnated block. The imaged porosity (P) was determined by dividing the total area occupied by the voids (pores) by the total area of the image (ROI—region of interest) [43].
The areas occupied by the pores in the 2D images were also characterized based on their shapes and sizes. The pores were classified into the following shapes: rounded, elongated, and complex [22]. Two indices (Equations (6) and (7)) were employed to classify the pores in terms of shape [25]. Concerning size, the pores were grouped into the following classes: 20–50, 50–100, 100–200, 200–300, 300–400, 400–500, 500–1000, and >1000 μm:
where Pe and A represent the perimeter and the area of the pore, NI is the number of intercepts of the object in the direction i (i = 0°, 45°, 90°, and 135°), DF is the diameter of Feret of an object in the direction j (j = 0° and 90°), and z and v are the number of i and j directions, respectively.
Table 1 shows the values of indices Γ1 and Γ2, which were used to discriminate the pores according to their shape.
The pores that were classified according to shape were also classified as small (0.00016 to c. 0.016 mm2), medium (>0.016 to c. 0.16 mm2), and large (>0.16 mm2).
2.5. Statistical Analysis
The variance analysis statistical model was applied to compare the treatments (samples submitted to W-D cycles). Assumptions of residual normality and homoscedasticity were verified by the Shapiro–Wilk and Bartlett tests and the F-test was employed. Mean values were compared using Student’s t-test (p < 0.05). All the statistical data processing was performed using the PAST software (version 3.20) [44].
3. Results
3.1. Water Retention Measurements
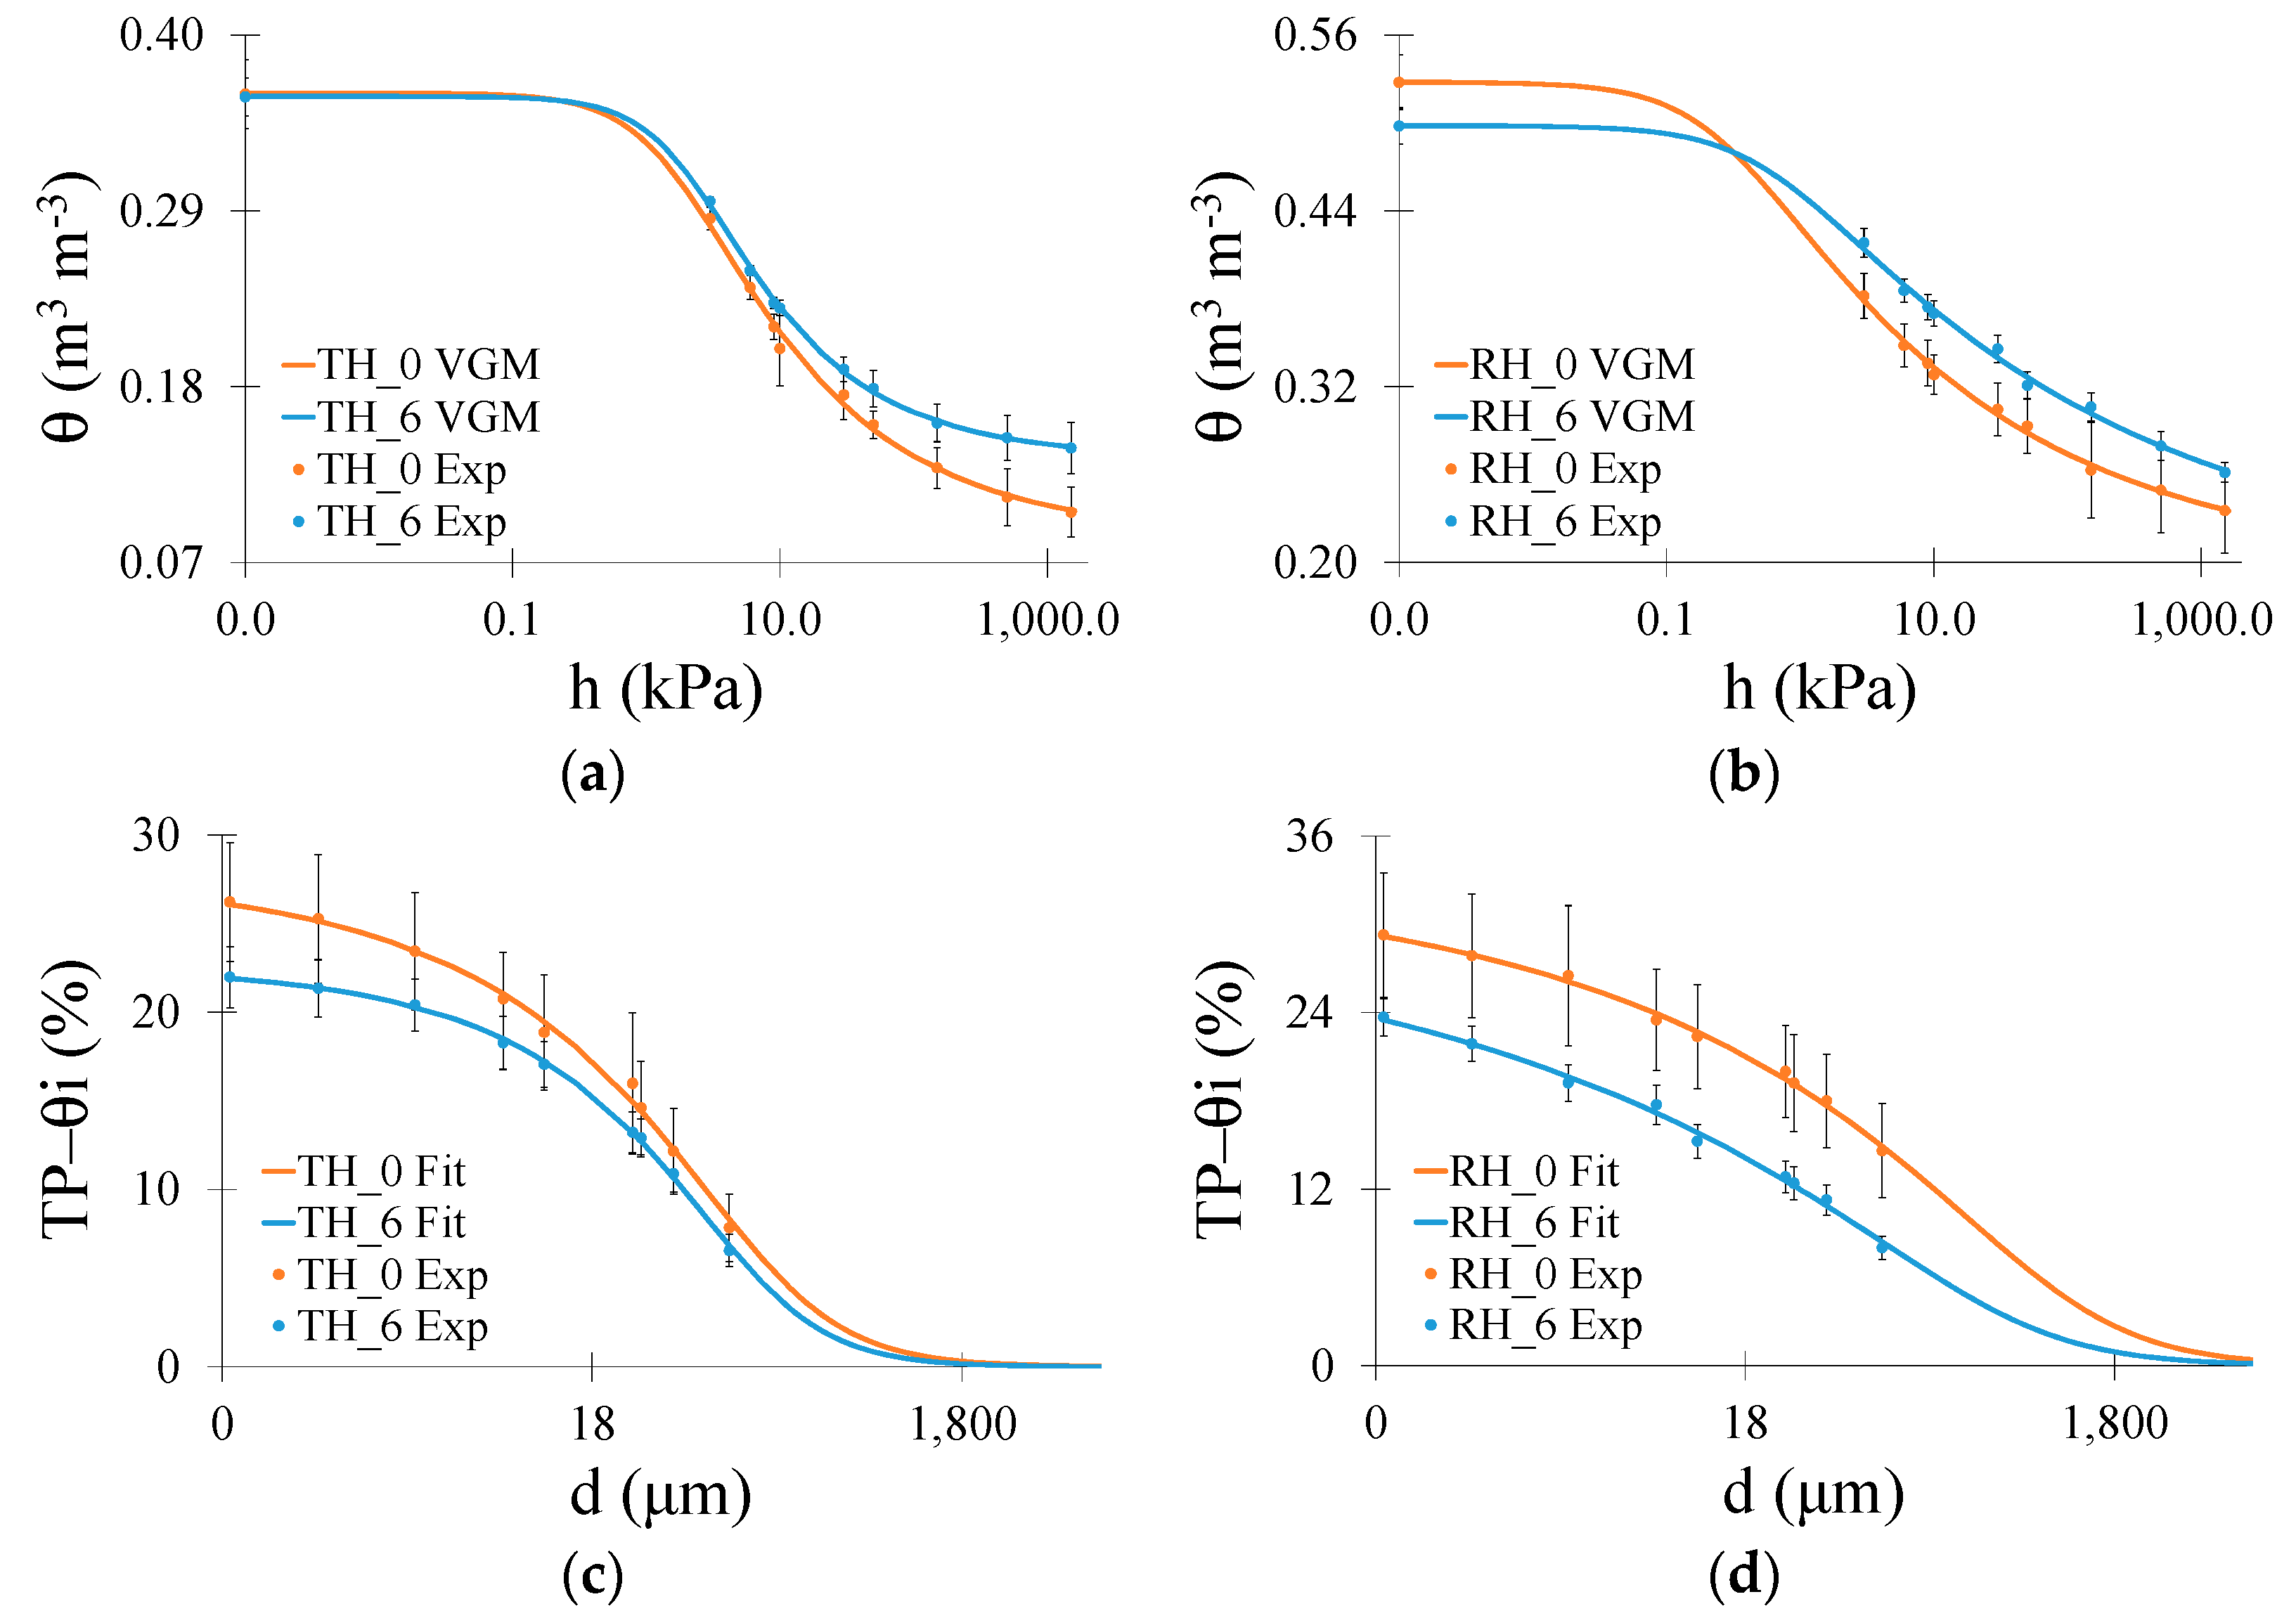
The soil water retention and air-filled porosity curves of both soils are illustrated in Figure 1. The VGM model was a good fit for the SWRC data [37]. The coefficient of determination and root mean square error was used to verify the fitting data quality. The lowest r2 was 0.94 (Rhodic Hapludox), while the highest was 0.98 (Typic Hapludox). The root mean square error presented minimum and maximum values of 0.005 and 0.014, respectively (Typic Hapludox).
In the Typic Hapludox, the most remarkable differences occurred in the driest region (micropores) of the SWRC (Figure 1a). The W-D cycles increased θ at the permanent wilting point by c. 40%, which was also confirmed by a higher residual θ following the cycles (Table 2). The parameters n and α (VGM model) varied by only a minor extent (p > 0.05), with cycles indicating similarities in the SWRC shape and air-entry region (Table 2). For Rhodic Hapludox (Figure 1b), a higher θ was observed for the largest pore sizes for 0 W-D cycles. The saturation θ adjusted by the VGM model was reduced by 0.030 m3 m−3 after the W-D cycles, which resulted in significant differences (Table 2), whereas θpwp increased by c. 11% (no significant differences compared to 0 W-D cycles). The slight differences in n indicate similarities in the shape of SWRCs similar to the Typic Hapludox (Table 2). Concerning the α parameter (Table 2), related to the point at the largest pores where air could enter the soil [1,5], it decreased by c. 54% with 6 W-D cycles.
The air-filled porosity curves (Figure 1c,d) showed only slight differences in the region of the largest pores in both soils. However, as the soil dried, samples under 0 W-D began to exhibit greater volumes of air in the region from mesopores to micropores in the Rhodic Hapludox. In the Typic Hapludox, TP–θ varied by only a minor extent (p > 0.05) within the W-D cycles. For example, the application of W-D cycles decreased the air-filled porosity by c. 16% (Typic Hapludox) and c. 19% (Rhodic Hapludox) for the smallest pore size (0.2 μm) analyzed. Aiming to complement the results of SWRC and air-filled porosities, an analysis of the water retention for different pore sizes based on their functions is presented in Figure 2.
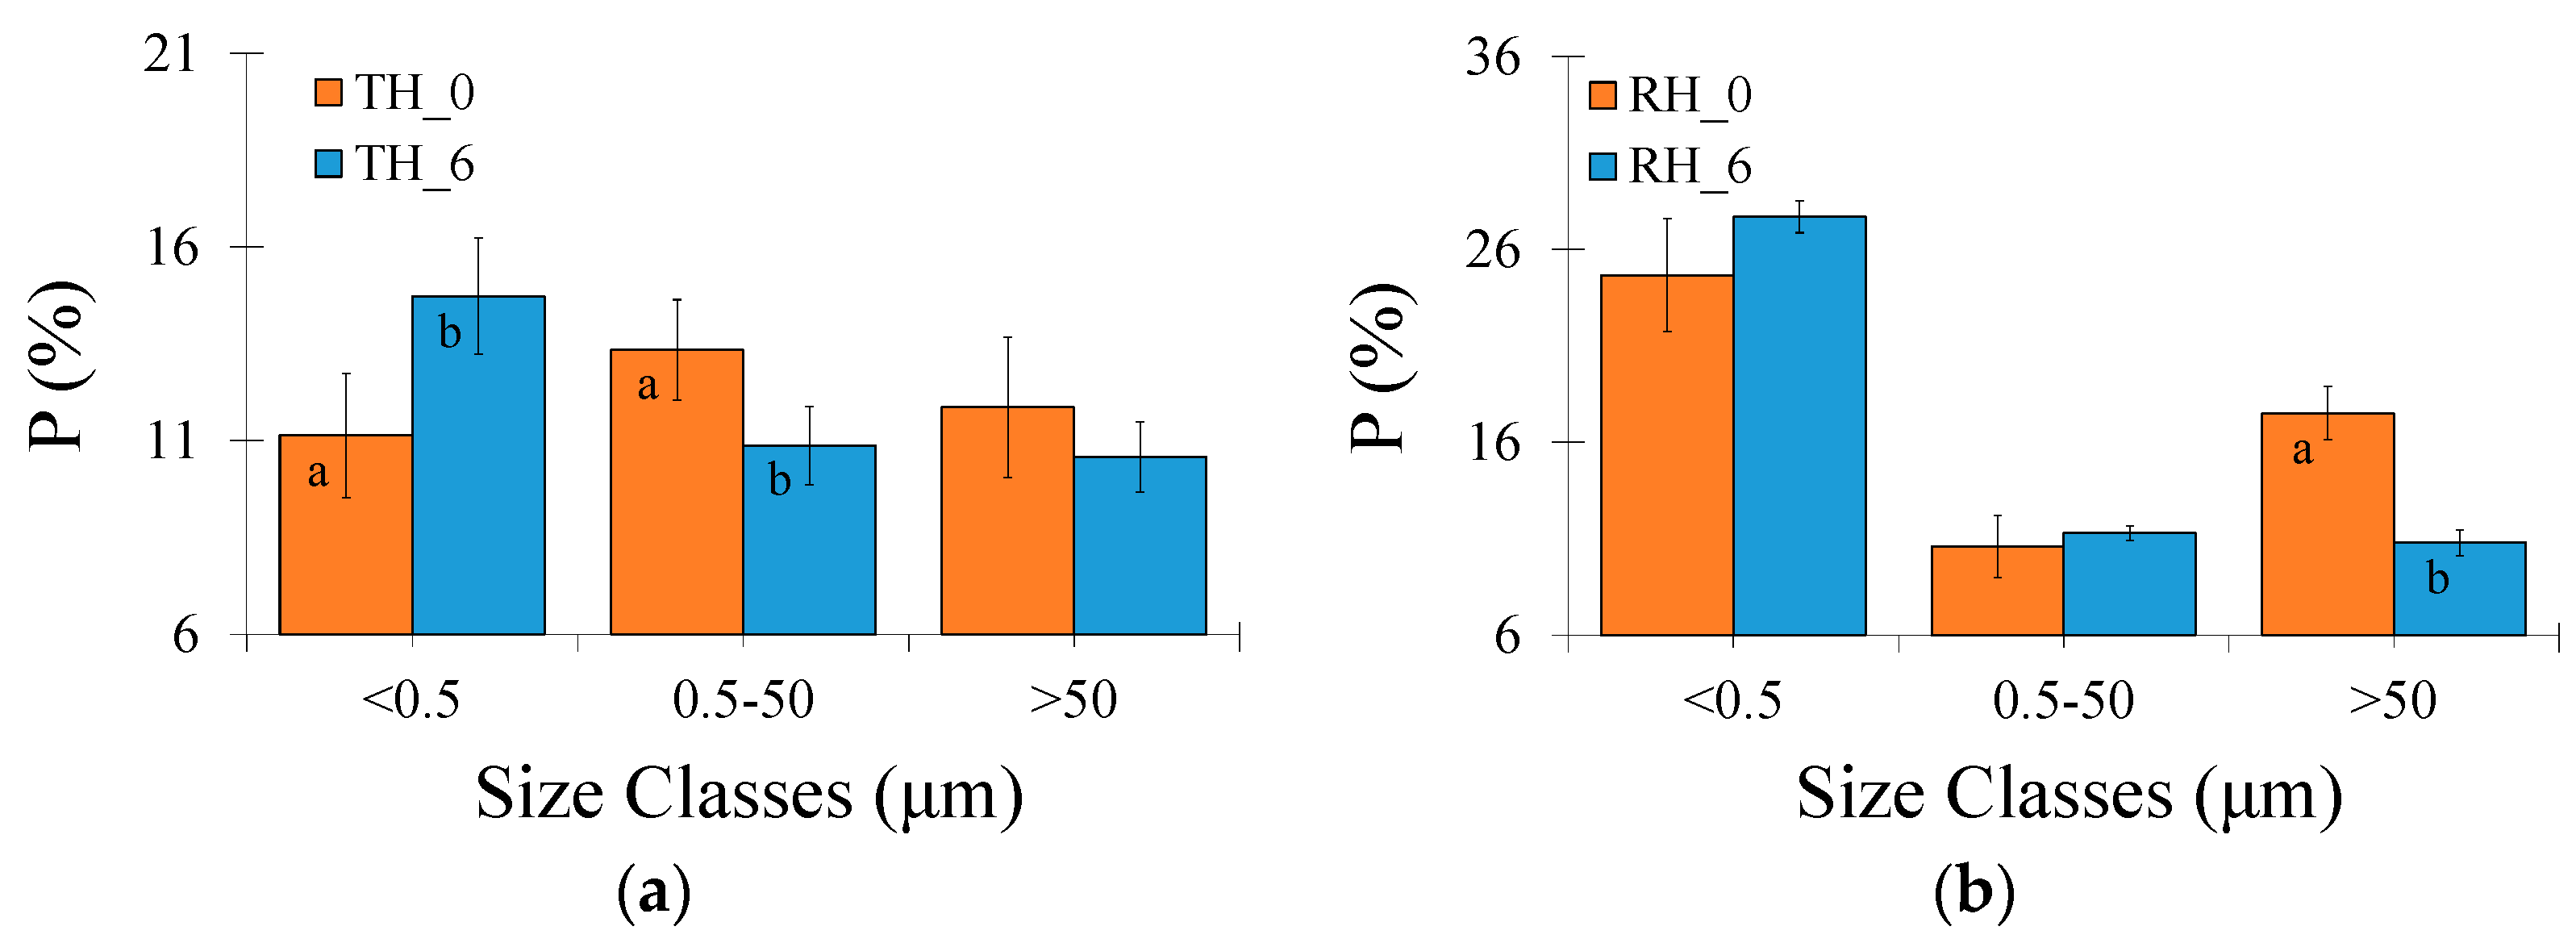
The contribution of different pore sizes to the total porosity was obtained based on the classification suggested by Greenland [45]. According to that author, pores <0.5 μm are classified as residual or bonding pores, between 0.5 and 50 μm are storage pores, and >50 μm are transmission and macropores. In the Typic Hapludox, residual pores increased by c. 32% while the storage ones decreased by c. 19% after 6 W-D cycles (Figure 2a). Regarding θ at saturation, field capacity, and permanent wilting point, the latter increased by c. 40% after 6 W-D cycles with only minor differences for θsat and θfc (p > 0.05) (Figure 2c). The W-D cycle application decreased the plant-available water content by c. 24% (Figure 2e). In the Rhodic Hapludox, transmission pores decreased by c. 38% after 6 W-D cycles, while the other pore types varied by only a minor extent (p > 0.05) (Figure 2b). The analysis of θ for specific pressure heads showed differences for θfc, which increased by c. 13% (Figure 2d); θfw decreased by c. 36%, and θcwc increased by c. 13% after 6 W-D cycles (Figure 2f).
3.2. Micromorphological Soil Properties
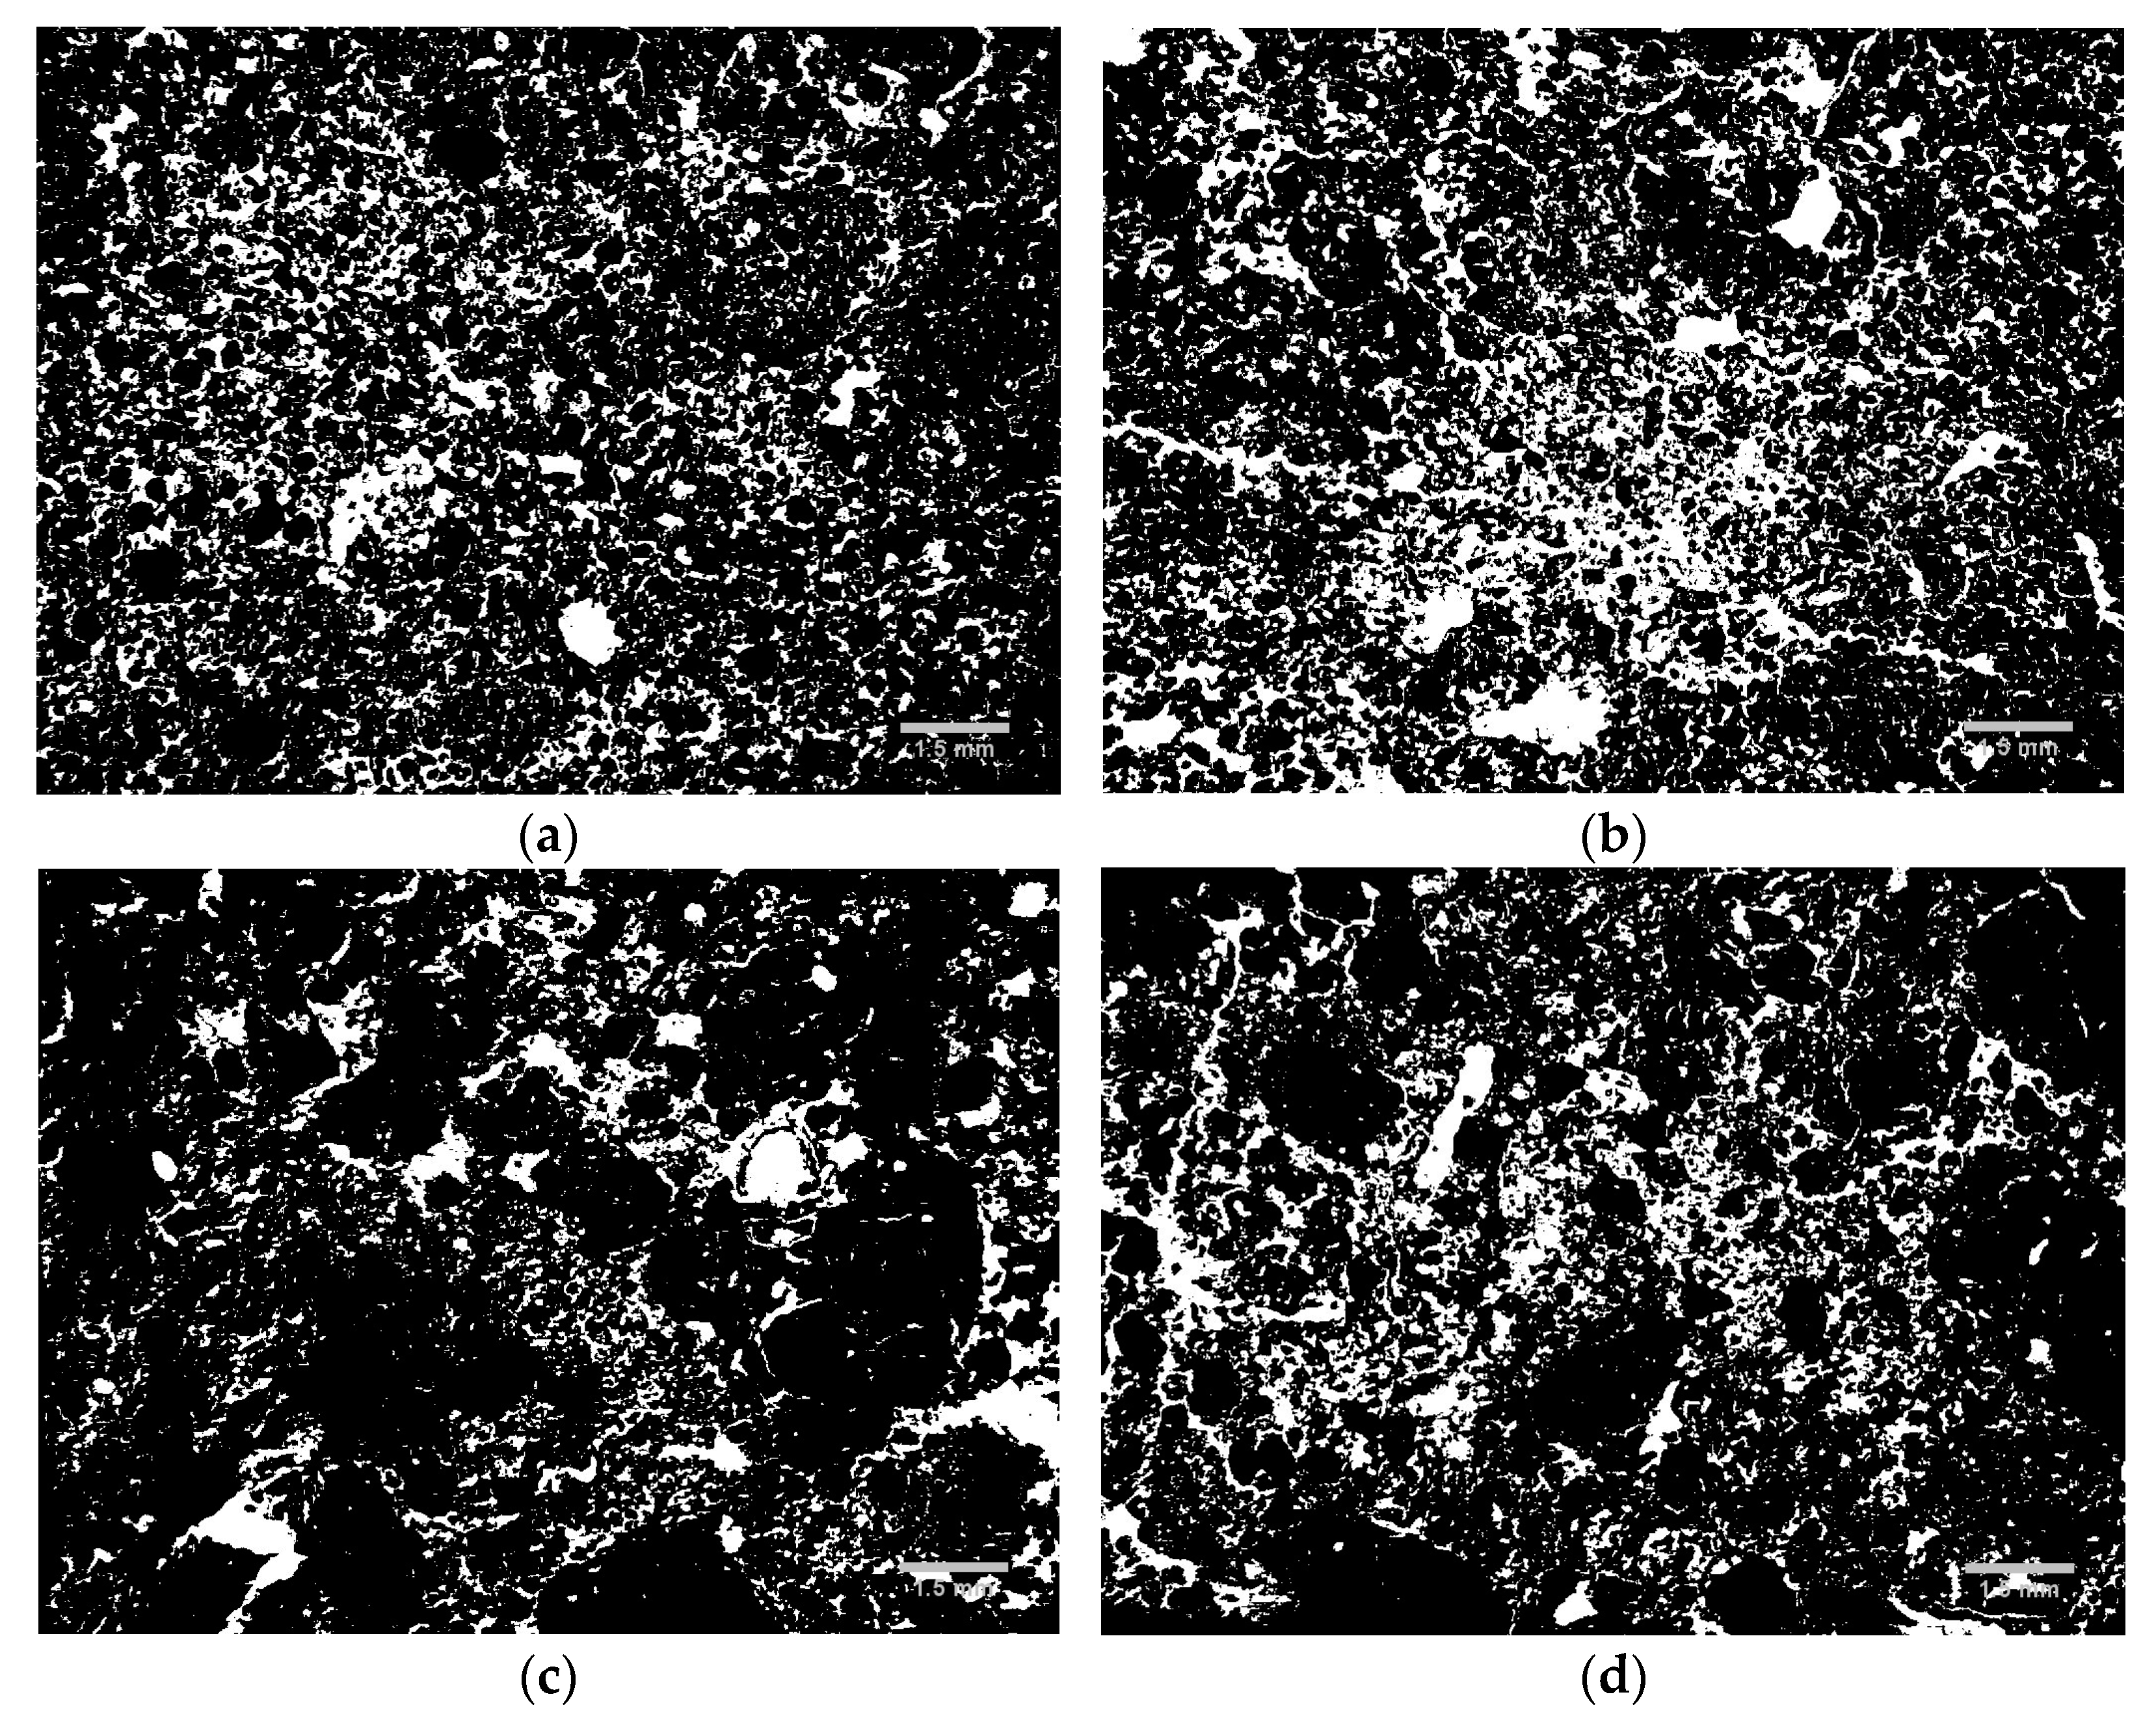
The soil pore system was also studied using 2D image data with a micrometer resolution (Figure 3). This analysis was carried out to complement the measurements based on water retention.
The 2D binary images show that both soils suffered changes in their soil pore system with 6 W-D cycles. In the Typic Hapludox (Figure 3a,b), sequences of W-D cycles seemed to increase the soil porosity, which is probably associated with the connection of small pores. Large and complex pores could be seen in this soil after 6 W-D cycles. The Rhodic Hapludox (Figure 3c,d) also indicated an increase in soil porosity with the cycles. The increment in the number of small pores, the appearance of medium-sized pores, and the connection of pores were evident after 6 W-D cycles in this soil. Thus, aiming to complement the qualitative image analysis, the result of the micromorphological analysis (pore size and shape distribution) of the Typic Hapludox is presented in Figure 4. It is worth pointing out that for these samples, porosity was obtained by image analysis, i.e., named here as imaged porosity [9,10].
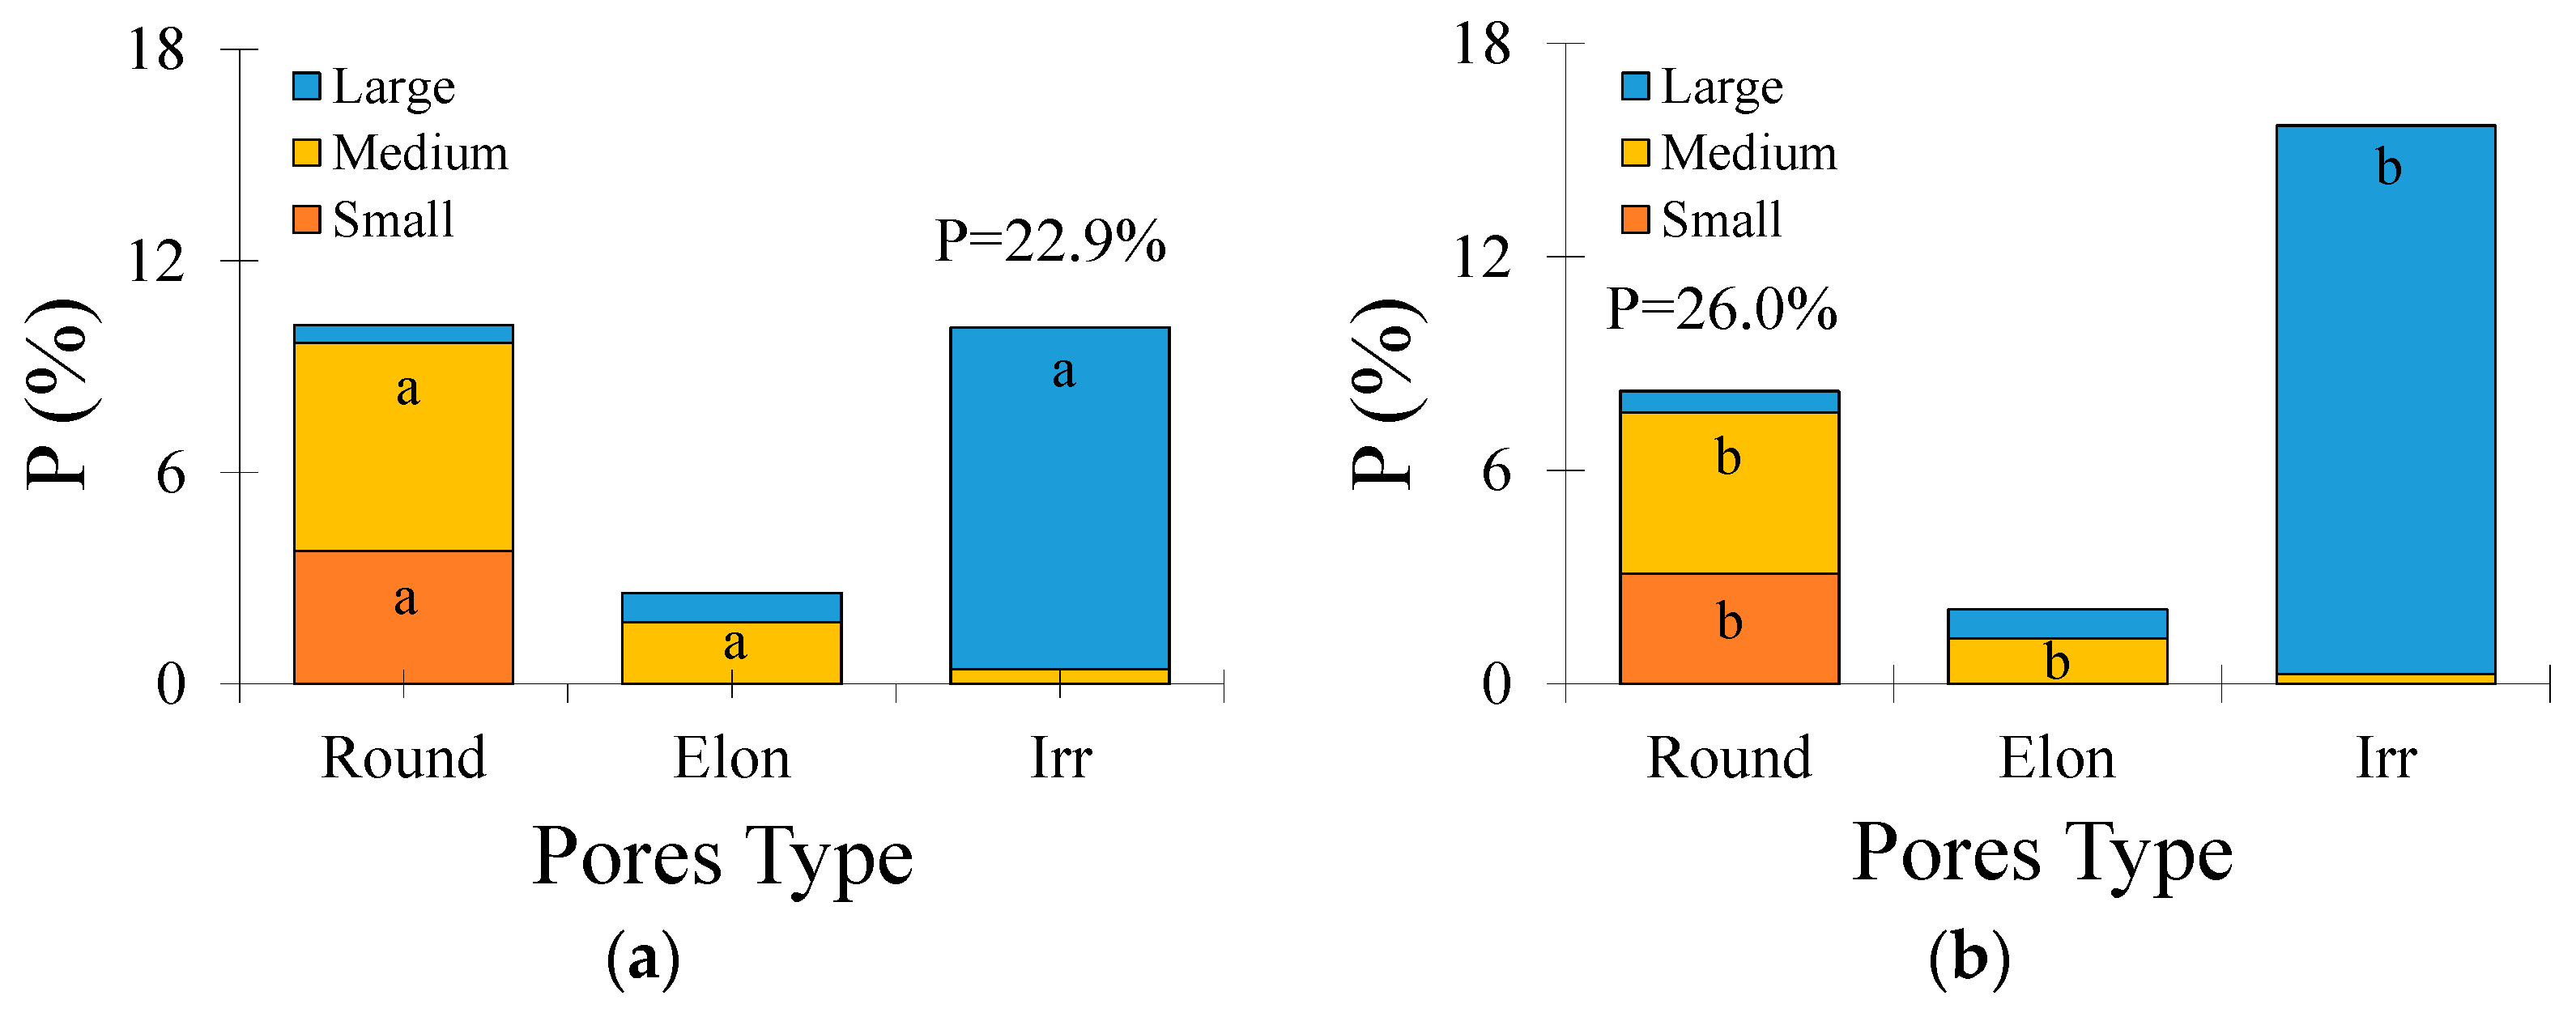
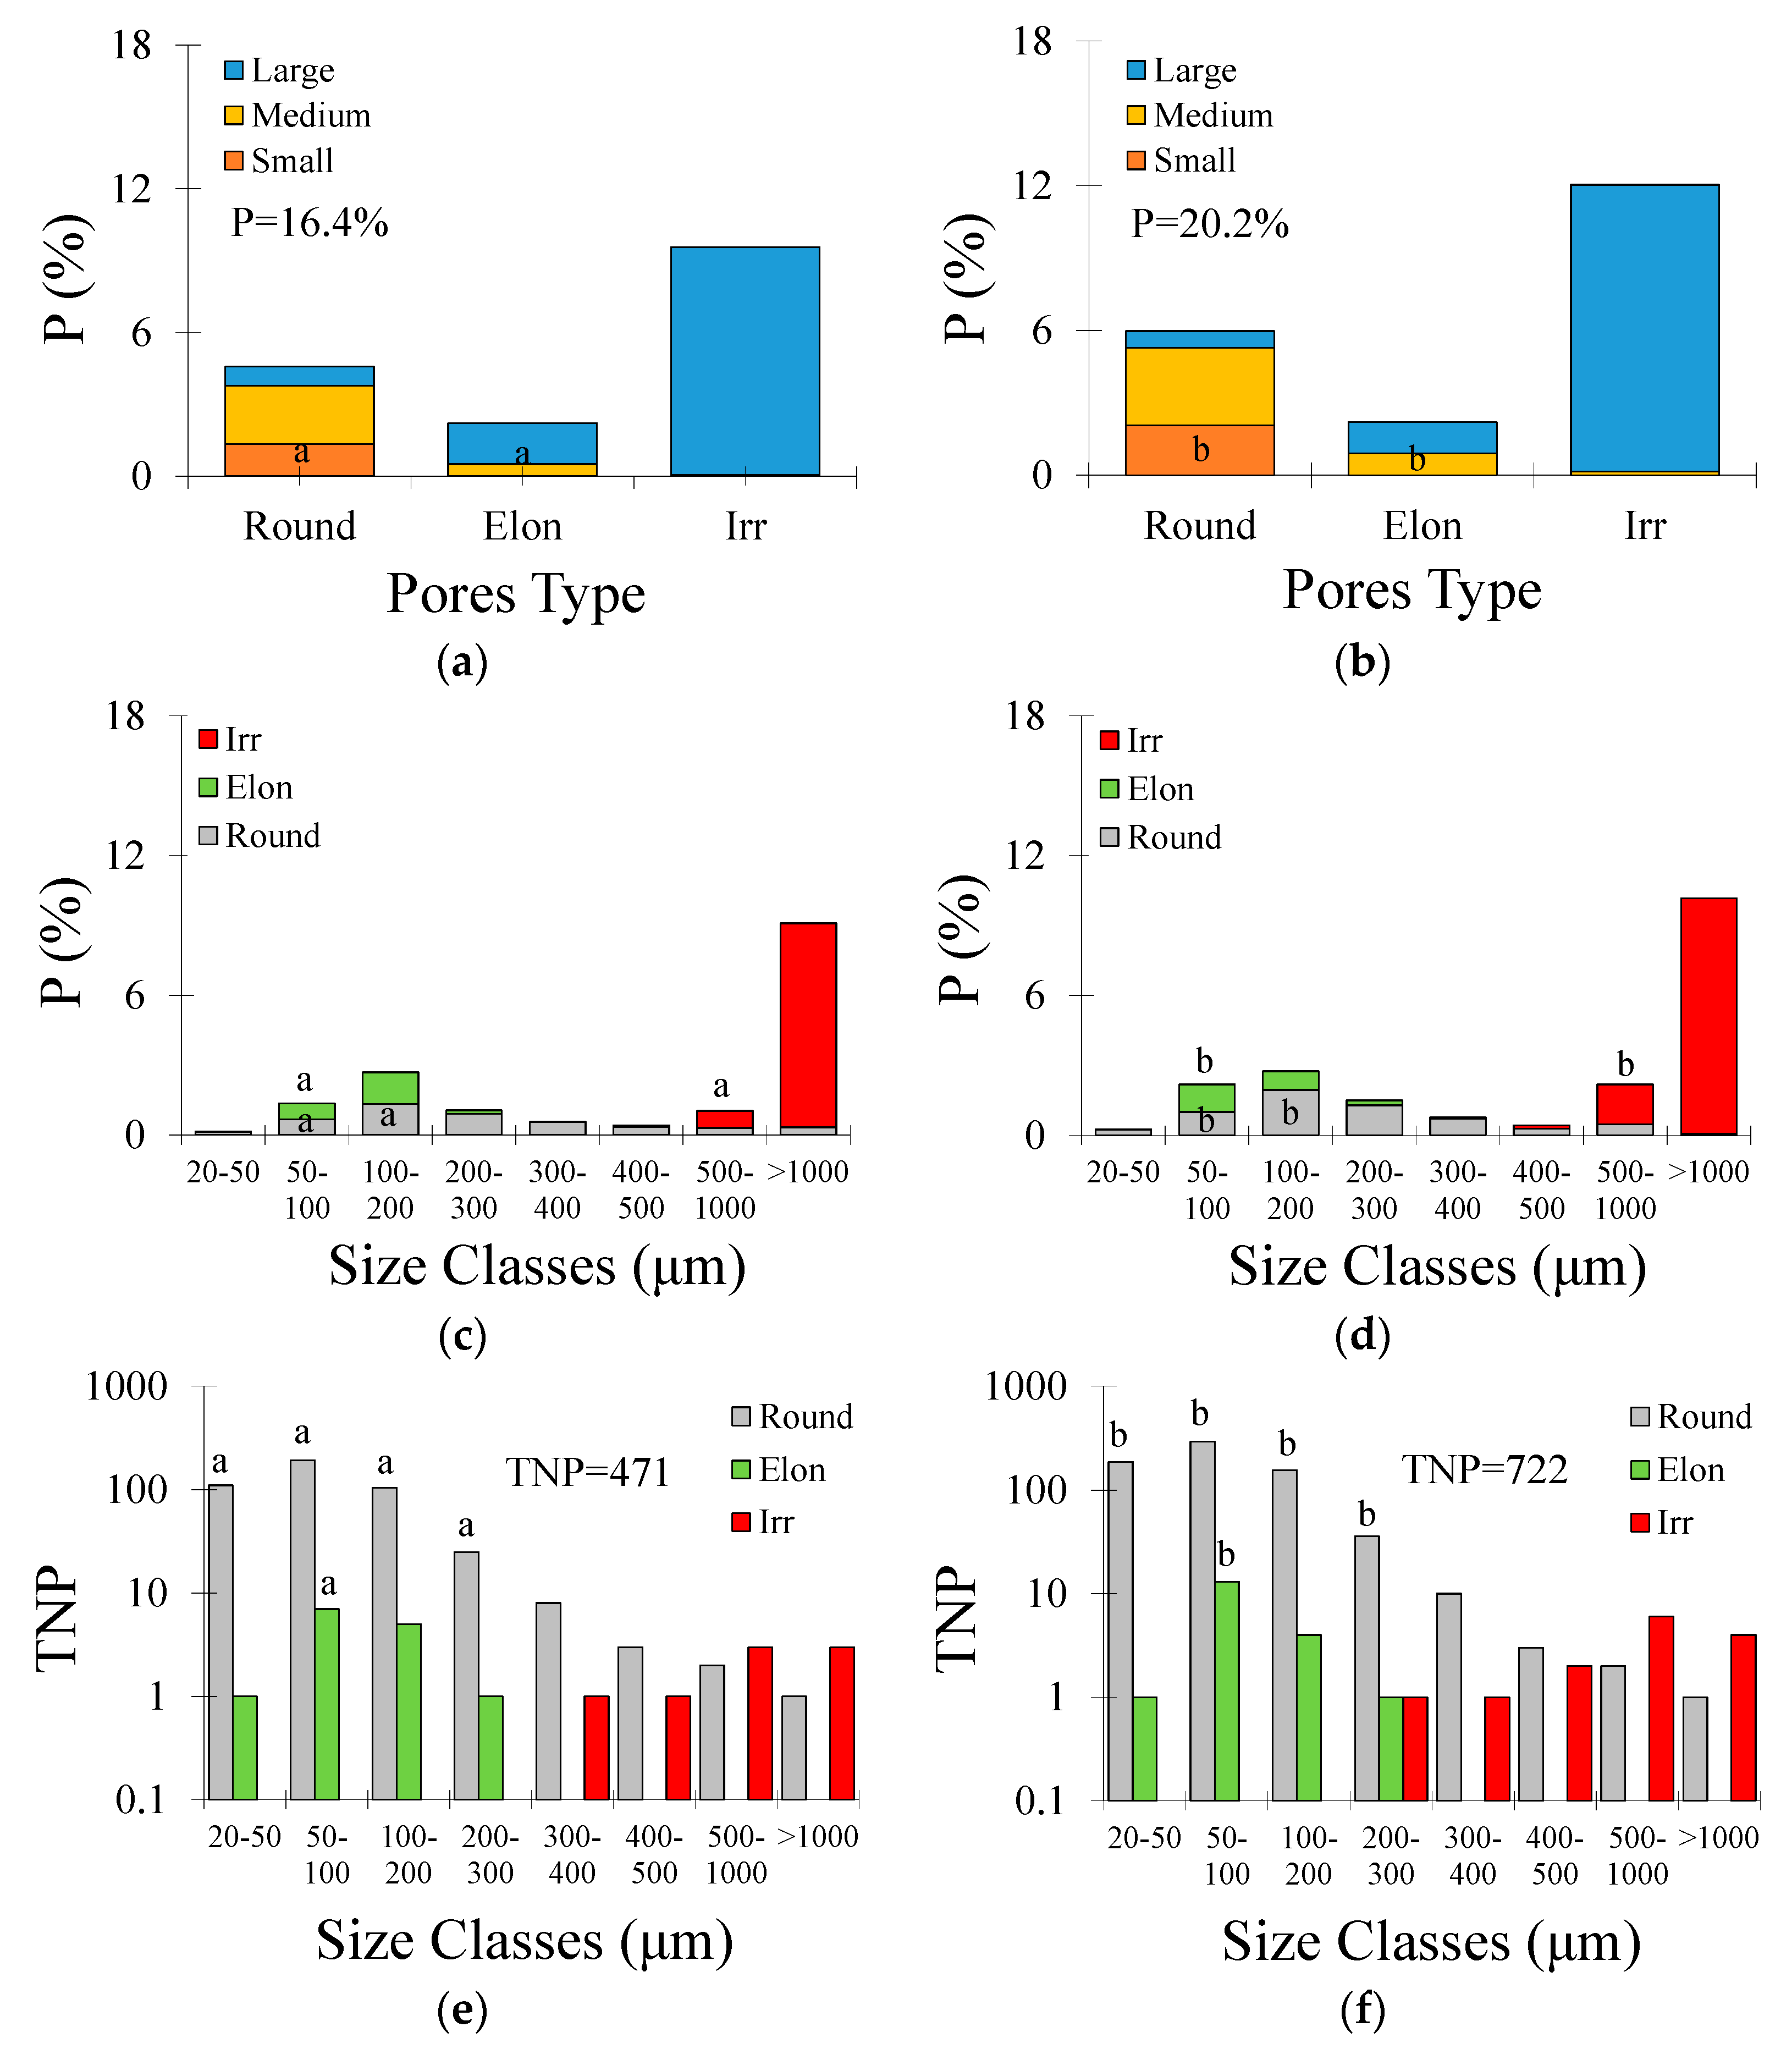
Concerning the pore shape and size in the Typic Hapludox (Figure 4a,b), small and medium rounded pores decreased by c. 18% and c. 23%, medium elongated pores decreased by c. 27%, and irregular-shaped pores increased by c. 59% after 6 W-D cycles. Considering all these pore types and sizes, the imaged porosity had an increment of c. 14% following the W-D cycles. Regarding pore size distribution and shape (Figure 4c,d), rounded pores decreased by c. 20% (size intervals from 20 to 200 μm) and c. 28% (200–300 μm), elongated pores decreased by c. 21% (50–100 μm), and irregular-shaped pores increased by c. 96% (>1000 μm) after 6 W-D cycles. When the total number of pores (TNP) was analyzed (Figure 4e,f), only the rounded-shaped pores comprising between 20 and 400 μm showed significant differences (p < 0.05). This pore type decreased by c. 17% (size intervals from 20 to 300 μm) and c. 40% (300–400 μm) after 6 W-D cycles, respectively. When all the pore types were analyzed, TNP was seen to decrease by c. 18% after the application of W-D cycles.
The effect of W-D cycles applied on the pore size and shape distribution of the Rhodic Hapludox samples is shown in Figure 5.
The pore shape and size analyses (Figure 5a,b) showed that only the small rounded and medium elongated pores exhibited significant differences (p < 0.05) between 0 W-D and 6 W-D in the Rhodic Hapludox. The former increased by c. 54% while the latter increased by c. 90% after 6 W-D cycles, respectively. The other pore types varied by only a minor extent (p > 0.05) following the W-D cycles. Similar to the findings of the Typic Hapludox, imaged porosity had an increment of c. 23% after 6 W-D cycles. The distribution of pores based on their size and shape (Figure 5c,d) exhibited differences for some rounded pores (increases of c. 52%—50–100 μm and c. 46%—100–200 μm), elongated pores (increase of c. 71%—50–100 μm), and irregular-shaped pores (increase of c. 2.3 times—500–1000 μm). The total number of pores showed differences (p < 0.05) only for rounded pores up to 300 μm and elongated pores between 50 and 100 μm (Figure 5e,f). Unlike the Typic Hapludox, the Rhodic Hapludox had an increment of c. 53% in TNP.
4. Discussion
This study aimed to evaluate how soils under natural conditions change when submitted to W-D cycles based on the idea that a few cycles provoke modifications in their micromorphological and water retention properties. The water retention and air-filled porosity curves (Figure 1) presented a similar behavior between the soils for the driest region (micropores). In the Typic Hapludox (Figure 1a,c), an increase in the contribution of smaller pores to soil porosity explained the results obtained. The detachment of sand particles (more weakly bound to other particles) from small aggregates under continuous wetting might cause the appearance of smaller pores resulting in a large amount of water retained in high-pressure heads [46]. The migration of soil sediments under W-D cycles had been reported by Pires et al. [47], indicating particle detachment from aggregates. On the other hand, the presence of organic materials at the topsoil, which enhances soil aggregation, also helped to keep a more stable structure under W-D cycles, as verified here by SWRC shape similarities [48]. Pires et al. [22], working with both tilled and untilled soils, demonstrated that even sandy soils were subject to changes in the textural and structural pore regions under continuous W-D cycles [49,50]. In another study [51], the same authors reported increases in the water retained at high-pressure heads, corroborating with the results presented here. The Rhodic Hapludox (Figure 1b,d) showed a similar behavior to that of Typic Hapludox for high-pressure heads, but with differences in θ in the region of mesopores (30–100 μm) and micropores (<30 μm) [6]. Despite differences in textural soil compositions and, consequently, in mineralogy (not evaluated in this study) [52], the water retention and air-filled porosity curves showed similar behavior between the soils. Lu et al. [53] reported that variations in the amount of clay affect the distribution of pores, mainly the smallest ones, explaining the differences between the soils (Table 2). In addition, the presence of organic materials (barks, leaves, etc.) in the secondary forest area was expected to affect water retention, as demonstrated by Kodešová et al. [54] and Cooper et al. [55] in the Rhodic Hapludox. Due to the high amount of clay, a more stable structure was expected in this soil under W-D cycles. However, as the samples were confined in cylinders, the creation of larger pores (mainly in the Rhodic Hapludox) after W-D cycles might press the soil against the cylinder walls contributing to the appearance of smaller pores, as observed here [56]. Peng et al. [57] demonstrated that W-D cycles affect larger pores increasing the total porosity, whereas Leij et al. [58] found that the cycles reduce structural porosity due to the coalescence of soil aggregates. In the Rhodic Hapludox, the soil structure changes observed caused a reduction in the aeration capacity after W-D cycles, which was influenced by variations in the regions of small to medium pore sizes.
The changes verified in the SWRC following W-D cycles increased the contribution of residual and bonding pores to the total porosity and decreased the importance of storage pores in the Typic Hapludox [1,5] (Figure 2a). This finding meant that the sandy soil maintained a good water transmission capacity even after W-D cycles. According to Greenland [45], fine pores (<0.5 μm) are responsible for the retention and diffusion of ions and for supporting major forces between the soil particles. Pores with sizes between 0.5 and 50 μm play a vital role in the retention of water against gravity and release, while pores >50 μm act in the air movement and drainage of excess water. The increase in the frequency of residual and bonding pores could be directly related to a higher θpwp after 6 W-D cycles verified in the Typic Hapludox [41] (Figure 2c). As a consequence, θaw decreased after 6 W-D cycles (Figure 2e); this could be explained by the differences observed in θpwp and θfc. Nonetheless, the results of θfw and θaw indicated adequate soil aeration capacity before and after W-D cycles, as pointed out by Reynolds [2,36]. However, θaw was close to the limits defined as droughty for root development, though the reference value of <0.10 m3 m−3 (poor soil capacity to store and provide water to plants) might not be adequate for sandy soils [59]. The application of W-D cycles decreased the contribution of transmission pores to the total porosity in the Rhodic Hapludox (Figure 2b). This reduction might affect air movement and soil water infiltration, as demonstrated by Cooper et al. [55]. The water content at field capacity increased with the application of 6 W-D cycles (Figure 2d), which was mainly associated with the contribution of residual and storage pores, as indicated by Tarawally et al. [41]. The free water content decreased with 6 W-D cycles (Figure 2f), which was mainly influenced by the reduction in transmission pores, indicating a decrease in the soil aeration capacity after W-D cycles. However, θfw measured is still considered adequate for root development [2,36]. The critical plant-available water followed the same trend of θfc, which could be explained by variations in storage and residual pores after 6 W-D cycles.
The resin impregnated in the soil blocks was employed to complement the results of the SWRC data. However, it is important to mention that the 2D micromorphological analysis (area-based analysis) was not performed on the same samples of SWRCs (volume-based analysis). In the Typic Hapludox, the most important changes in pore distribution occurred for the rounded (small and medium), elongated (medium), and irregular (large) shaped pores after 6 W-D cycles (Figure 4a,b). Rounded pores, associated with soil air trapping following drying and the influence of biological activity (grass roots and soil fauna), created chambers and channels [60] and decreased their contribution to the imaged porosity with W-D cycles (Figure 3a,b). In addition, a decrease in the number of these pore types was noticed after 6 W-D cycles, which were probably converted into large irregular-shaped pores [61,62] (Figure 4c–f). The increase in the contribution of complex pores (irregular) to the imaged porosity might have resulted from the connection of small pores, as the number of rounded pores (from 20 to 400 μm) was reduced after 6 W-D cycles [61] (Figure 4e,f). Pardini et al. [17] reported that W-D cycles produce fissures, increasing the contribution of large pores to porosity, similar to the findings observed here (Figure 3b). These interconnected macropores (drainage pores), usually found in tropical soils, play an important role in water dynamics [8,21,63]. The Rhodic Hapludox exhibited differences only for small rounded and medium elongated-shaped pores with a negligent influence of the latter to imaged porosity after 6 W-D cycles (Figure 3c,d and Figure 5a,b). This result is mainly associated with the increased contribution of pore sizes between 50 and 200 μm to imaged porosity after W-D cycles (Figure 5c,d). In addition, an increase in the number of rounded-shaped pores from 20 to 300 μm and elongated-shaped pores between 50 and 100 μm also helped to explain the increment of the contribution of these pore types to imaged porosity [64,65] (Figure 5e,f). The increased contribution of elongated-shaped pores to imaged porosity following W-D cycles could probably be associated with the appearance of fine fissures, while that of large (500–1000 μm) irregular-shaped pores was due to a slight increase in the number of these pore types [16,19,60].
Finally, the imaged porosity allowed to classify both soils (Figure 4a,b and Figure 5a,b) as moderately porous (10–25%) to highly porous (25–40%), indicating suitable soil structures to water infiltration [66]. This kind of finding has been reported by many other authors [67,68]. Pires et al. [22] found increases in porosity for tropical tilled and untilled soils, especially after 9 W-D cycles. Hussein and Adey [14] showed similar results after 4 W-D cycles, employing capillarity as one of the wetting procedures. However, imaged porosity results contradicted those of SWRC (Figure 1a,b). One possible explanation for these contradictory results is that micromorphological analysis allowed to access only pores with sizes >20 μm. In both soils, residual (<0.5 μm) and storage (0.5–50 μm) pores showed a considerable contribution to the total porosity (Figure 2a,b). The great contribution of larger pores (>500 μm) to imaged porosity can also be associated with an adequate soil structure to plant root development and water drainage (Figure 4c,d and Figure 5c,d). However, when the influence of these large pores exceeded 70–80% of the soil porosity, it indicates poor soil structure [60,69]. In the Typic Hapludox, an increase in the contribution of larger pores to the imaged porosity after 6 W-D cycles were observed, whereas in the Rhodic Hapludox, the contribution remained stable, but these numbers were <60%.
5. Conclusions
The results obtained in this study have implications for understanding the way that soils under natural conditions (secondary forest and grassland) can change under continuous wetting and drying cycles. Water retention was influenced by W-D cycles, mainly in the region of micropores (Typic Hapludox) and mesopores to micropores (Rhodic Hapludox), with an increase in the soil water holding capacity following the cycles. As a consequence of these changes, the contribution of residual (increase) and storage (decrease) pores to total porosity was affected by W-D cycles in the Typic Hapludox, while in the Rhodic Hapludox, only transmission pores (decrease) were influenced. Water content at the permanent wilting point increased after 6 W-D cycles in the Typic Hapludox, while the water available to plants decreased. In the Rhodic Hapludox, the water retained at field capacity increased after 6 W-D, affecting the free-soil water content (decrease) and critical plant-available water (increase). These results highlight that even under natural conditions, the soil water retention capacity was modified by sequences of W-D cycles. The main implications of the variations observed in the water retained at different pore sizes concerned changes in the amount of water available to the plants (Typic Hapludox) and soil aeration (Rhodic Hapludox). However, even after 6 W-D cycles, both soils kept soil structures that were adequate for plant root development and were capable of retaining reasonable amounts of water available to plants based on the water retention parameters measured.
The pore size and shape distributions based on 2D images presented significant alterations in the rounded (small and medium), elongated (medium), and irregular (large) shaped pores in the Typic Hapludox after 6 W-D cycles. In the Rhodic Hapludox, only the small rounded and medium elongated pores were modified significantly by the cycles. However, the large (>500 μm) irregular-shaped pores increased their contribution to porosity after 6 W-D while also contributing to an increase in the imaged porosity in the Rhodic Hapludox and Typic Hapludox. This finding indicates that both soils improved their aeration capacity and water flux after the cycles. In the Typic Hapludox, rounded-shaped pores (20–300 μm) decreased their contribution to imaged porosity, followed by a decrease in the number of these pore types. On the other hand, the opposite was found in the Rhodic Hapludox, with an increase in the contribution of rounded pores (50–200 μm) to imaged porosity followed by an increase in the number of these pore types (50–300 μm). Overall, the two Oxisols were characterized by significant contributions of rounded pores to imaged porosity (before and after the cycles), indicating intense biological activity. Finally, it seems relevant to mention that the micromorphological properties of the soils under natural conditions were changed by W-D cycles with impacts on the distribution of pore sizes and shapes responsible for water retention and movement.
Funding
This research was partially funded by the Brazilian National Council for Scientific and Technological Development (CNPq) (Grant 304925/2019-5).
Data Availability Statement
All data are available upon reasonable request to [email protected].
Acknowledgments
The author is thankful to “Laboratório de Análise Morfológica do Solo da Universidade de São Paulo (USP/ESALQ)” (Soil Morphological Analysis Laboratory of the University of São Paulo) for the infrastructure related to the micromorphological analysis.
Conflicts of Interest
The authors declare no conflict of interest.
References
- Lal, R.; Shukla, M.K. Principles of Soil Physics; Marcel Dekker, Inc.: New York, NY, USA, 2004. [Google Scholar]
- Reynolds, W.D.; Bowman, B.T.; Drury, C.F.; Tan, C.S.; Lu, X. Indicators of Good Soil Physical Quality: Density and Storage Parameters. Geoderma 2002, 110, 131–146. [Google Scholar] [CrossRef]
- Correchel, V.; Bacchi, O.O.S.; De Maria, I.C.; Dechen, S.C.F.; Reichardt, K. Erosion Rates Evaluated by the 137Cs Technique and Direct Measurements on Long-Term Runoff Plots under Tropical Conditions. Soil Tillage Res. 2006, 86, 199–208. [Google Scholar] [CrossRef]
- Tracy, S.R.; Black, C.R.; Roberts, J.A.; Sturrock, C.; Mairhofer, S.; Craigon, J.; Mooney, S.J. Quantifying the Impact of Soil Compaction on Root System Architecture in Tomato (Solanum lycopersicum) by X-Ray Micro-Computed Tomography. Ann. Bot. 2012, 110, 511–519. [Google Scholar] [CrossRef] [PubMed]
- Hillel, D. Environmental Soil Physics; Academic Press: San Diego, CA, USA, 1998. [Google Scholar]
- Reichardt, K.; Timm, L.C. Soil, Plant and Atmosphere: Concepts, Processes and Applications; Springer Nature: Cham, Switzerland, 2020. [Google Scholar]
- Nimmo, J.R. Porosity and Pore Size Distribution; Reference Module in Earth Systems and Environmental Sciences; Elsevier: Amsterdam, The Netherlands, 2013. [Google Scholar]
- Juhász, C.E.P.; Cooper, M.; Cursi, P.R.; Ketzer, A.O.; Toma, R.S. Savanna Woodland and Soil Micromorphology Related to Water Retention. Sci. Agric. 2007, 64, 344–354. [Google Scholar] [CrossRef]
- Bouma, J.; Jongerius, A.; Boersma, O.; Jager, A.; Schoonderbeek, D. The Function of Different Types of Macropores During Saturated Flow through Four Swelling Soil Horizons. Soil Sci. Soc. Am. J. 1977, 41, 945–950. [Google Scholar] [CrossRef]
- Fox, D.M.; Bryan, R.B.; Fox, C.A. Changes in Pore Characteristics with Depth for Structural Crusts. Geoderma 2004, 120, 109–120. [Google Scholar] [CrossRef]
- De Pierri Castilho, S.C.; Cooper, M.; Simões da Silva, L.F. Micromorphometric Analysis of Porosity Changes in the Surface Crusts of Three Soil in the Piracicaba Region, São Paulo State, Brazil. Acta Sci. Agron. 2015, 37, 385–395. [Google Scholar] [CrossRef]
- Cooper, M.; Vidal-Torrado, P. Caracterização Morfológica, Micromorfológica e Físico-Hídrica de Solos com Horizonte B Nítico. Rev. Bras. Ciênc. Solo 2005, 29, 581–595. [Google Scholar] [CrossRef]
- Pagliai, M.; Marsili, A.; Servadio, P.; Vignozzi, N.; Pellegrini, S. Changes in Some Physical Properties of a Clay Soil in Central Italy Following the Passage of Rubber Tracked and Wheeled Tractors of Medium Power. Soil Tillage Res. 2003, 73, 119–129. [Google Scholar] [CrossRef]
- Hussein, J.; Adey, M.A. Changes in Microstructure, Voids and b-Fabric of Surface Samples of a Vertisol Caused by Wet/Dry Cycles. Geoderma 1998, 85, 63–82. [Google Scholar] [CrossRef]
- Tang, C.S.; Cui, Y.J.; Shi, B.; Tang, A.M.; Liu, C. Desiccation and Cracking Behaviour of Clay Layer from Slurry State under Wetting-Drying Cycles. Geoderma 2011, 166, 111–118. [Google Scholar] [CrossRef]
- An, R.; Zhang, X.; Kong, L.; Liu, X.; Chen, C. Drying-Wetting Impacts on Granite Residual Soil: A Multi-Scale Study from Macroscopic to Microscopy Investigations. Bull. Eng. Geol. 2022, 81, 447. [Google Scholar] [CrossRef]
- Pardini, G.; Vigna Guidi, G.; Pini, R.; Regüés, D.; Gallart, F. Structure and Porosity of Smectitic Mudrocks as Affected by Experimental Wetting—Drying Cycles and Freezing—Thawing Cycles. Catena 1996, 27, 149–165. [Google Scholar] [CrossRef]
- Xia, J.; Zhang, L.; Ge, P.; Lu, X.; Wei, Y.; Cai, C.; Wang, J. Structure Degradation Induced by Wetting and Drying Cycles for the Hilly Granitic Soils in Collapsing Gully Erosion Areas. Forests 2022, 13, 1426. [Google Scholar] [CrossRef]
- Louati, F.; Trabelsi, H.; Jamei, M.; Taibi, S. Impact of Wetting-Drying Cycles and Cracks on the Permeability of Compacted Clayey Soil. Eur. J. Environ. Civ. 2018, 25, 696–721. [Google Scholar] [CrossRef]
- Ng, C.W.W.; Peprah-Manu, D. Pore Structure Effects on the Water Retention Behaviour of a Compacted Silty Sand Soil Subjected to Drying-Wetting Cycles. Eng. Geol. 2023, 313, 106963. [Google Scholar] [CrossRef]
- Momoli, R.S.; Cooper, M.; de Pierri Castilho, S.C. Sediment Morphology and Distribution in a Restored Riparian Forest. Sci. Agric. 2007, 64, 486–494. [Google Scholar] [CrossRef]
- Pires, L.F.; Cooper, M.; Cássaro, F.A.M.; Reichardt, K.; Bacchi, O.O.S.; Dias, N.M.P. Micromorphological Analysis to Characterize Structure Modifications of Soil Samples Submitted to Wetting and Drying Cycles. Catena 2008, 72, 297–304. [Google Scholar] [CrossRef]
- Lima, H.V.; Silva, A.P.; Santos, M.C.; Cooper, M.; Romero, R.E. Micromorphology and Image Analysis of a Hardsetting Ultisol (Argissolo) in the State of Ceará (Brazil). Geoderma 2006, 132, 416–426. [Google Scholar] [CrossRef]
- Lipiec, J.; Walczak, R.; Witkowska-Walczak, B.; Nosalewicz, A.; Słowińska-Jurkiewicz, A.; Sławiński, C. The Effect of Aggregate Size on Water Retention and Pore Structure of Two Silt Loam Soils of Different Genesis. Soil Tillage Res. 2007, 97, 239–246. [Google Scholar] [CrossRef]
- Cooper, M.; Vidal-Torrado, P.; Chaplot, V. Origin of Microaggregates in Soils with Ferralic Horizons. Sci. Agric. 2005, 62, 256–263. [Google Scholar] [CrossRef]
- Hobson, D.; Harty, M.; Tracy, S.R.; McDonnell, K. The Effect of Tillage Depth and Traffic Management on Soil Properties and Root Development during Two Growth Stages of Winter Wheat (Triticum aestivum L.). Soil 2022, 8, 391–408. [Google Scholar] [CrossRef]
- Dal Ferro, N.; Sartori, L.; Simonetti, G.; Berti, A.; Morari, F. Soil Macro- and Microstructure as Affected by Different Tillage Systems and their Effects on Maize Root Growth. Soil Tillage Res. 2014, 140, 55–65. [Google Scholar] [CrossRef]
- Budhathoki, S.; Lamba, J.; Srivastava, P.; Williams, C.; Arriaga, F.; Karthikeyan, K.G. Impact of Land Use and Tillage Practice on Soil Macropore Characteristics Inferred from X-ray Computed Tomography. Catena 2022, 210, 105886. [Google Scholar] [CrossRef]
- Helliwell, J.R.; Sturrock, C.J.; Grayling, K.M.; Tracy, S.R.; Flavel, R.J.; Young, I.M.; Whalley, W.R.; Mooney, S.J. Applications of X-ray Computed Tomography for Examining Biophysical Interactions and Structural Development in Soil Systems: A Review. Eur. J. Soil Sci. 2013, 64, 279–297. [Google Scholar] [CrossRef]
- Kravchenko, A.N.; Negassa, W.C.; Guber, A.K.; Rivers, M.L. Protection of Soil Carbon within Macro-Aggregates depends on Intra-Aggregate Pore Characteristics. Sci. Rep. 2015, 5, 16261. [Google Scholar] [CrossRef]
- Koestel, J.; Schlüter, S. Quantification of the Structure Evolution in a Garden Soil over the Course of Two Years. Geoderma 2019, 338, 597–609. [Google Scholar] [CrossRef]
- Soil Survey Staff. Simplified Guide to Soil Taxonomy; USDA Natural Resources Conservation Service, National Soil Survey Center: Lincoln, NE, USA, 2013. [Google Scholar]
- Booman, G.; Leiker, S. Soil Sampling Guide; Document ID: RND_SSG_001; Regen Network Development, Inc.: Northfield, MA, USA, 2021. [Google Scholar]
- Klute, A. Water Retention: Laboratory Methods. In Methods of Soil Analysis. Part 1: Physical and Mineralogical Methods; Black, C.A., Ed.; Soil Science Society of America: Madison, WA, USA, 1986; pp. 635–662. [Google Scholar]
- Dane, J.H.; Hopmans, J.W. Pressure Plate Extractor. In Methods of Soil Analysis. Part 4: Physical Methods; Dane, J.H., Topp, G.C., Eds.; Soil Science Society of America: Madison, WA, USA, 2002; pp. 688–690. [Google Scholar]
- Reynolds, W.D.; Drury, C.F.; Yang, X.M.; Tan, C.S. Optimal Soil Physical Quality Inferred Through Structural Regression and Parameter Interactions. Geoderma 2008, 146, 466–474. [Google Scholar] [CrossRef]
- Van Genuchten, M.T. A Closed-Form Equation for Predicting the Hydraulic Conductivity of Unsaturated Soils. Soil Sci. Soc. Am. J. 1980, 44, 892–898. [Google Scholar] [CrossRef]
- Seki, K. SWRC Fit—A Nonlinear Fitting Program with a Water Retention Curve for Soils Having Unimodal and Bimodal Pore Structure. Hydrol. Earth Syst. Sci. Discuss. 2007, 4, 407–437. [Google Scholar]
- Jury, W.A.; Horton, R. Soil Physics; Willey: New Jersey, NJ, USA, 2004. [Google Scholar]
- Reynolds, W.D.; Drury, C.F.; Tan, C.S.; Fox, C.A.; Yang, X.M. Use of Indicators and Pore Volume-Function Characteristics to Quantify Soil Physical Quality. Geoderma 2009, 152, 252–263. [Google Scholar] [CrossRef]
- Tarawally, M.A.; Medina, H.; Frómeta, M.E.; Alberto Itza, C. Field Compaction at Different Soil-Water Status: Effects on Pore Size Distribution and Soil Water Characteristics of a Rhodic Ferralsol in Western Cuba. Soil Tillage Res. 2004, 76, 95–103. [Google Scholar] [CrossRef]
- Ringrose-Voase, A.J.; Bullock, P. The Automatic Recognition and Measurement of Soil Pore Types by Image Analysis and Computer Programs. J. Soil Sci. 1984, 35, 673–684. [Google Scholar] [CrossRef]
- Huf dos Reis, A.M.; Armindo, R.A.; Pires, L.F. Physical Assessment of a Haplohumox Soil Under Integrated Crop-Livestock System. Soil Tillage Res. 2019, 194, 104294. [Google Scholar] [CrossRef]
- Hammer, Ø.; Harper, D.A.T.; Ryan, P.D. PAST: Paleontological Statistics Software Package for Education and Data Analysis. Palaeont. Elect. 2001, 4, 1–9. [Google Scholar]
- Greenland, D.J. Soil Damage by Intensive Arable Cultivation: Temporary or Permanent? Philos. Trans. R. Soc. B 1977, 281, 193–208. [Google Scholar]
- Cássaro, F.A.M.; Pires, L.F.; dos Santos, R.A.; Gimenez, D.; Reichardt, K. Funil de Haines Modificado: Curvas de Retenção de Solos Próximos à Saturação. Rev. Bras. Ciênc. Solo 2008, 32, 2555–2562. [Google Scholar] [CrossRef]
- Pires, L.F.; Villanueva, F.C.A.; Dias, N.M.P.; Bacchi, O.O.S.; Reichardt, K. Chemical Migration During Soil Water Retention Curve Evaluation. Annu. Acad. Bras. Cienc. 2011, 83, 1097–1107. [Google Scholar] [CrossRef]
- Dapla, P.; Hriník, D.; Hrabovský, A.; Simkovic, I.; Zarnovican, H.; Sekucia, F.; Kollár, J. The Impact of Land-Use on the Hierarchical Pore Size Distribution and Water Retention Properties in Loamy Soils. Water 2020, 12, 339. [Google Scholar]
- Kutílek, M.; Jendele, L.; Panayiotopoulos, K.P. The Influence of Uniaxial Compression upon Pore Size Distribution in Bi-Modal Soils. Soil Tillage Res. 2006, 86, 27–37. [Google Scholar] [CrossRef]
- Bodner, G.; Scholl, P.; Kaul, H.-P. Field Quantification of Wetting–Drying Cycles to Predict Temporal Changes of Soil Pore Size Distribution. Soil Tillage Res. 2013, 133, 1–9. [Google Scholar] [CrossRef] [PubMed]
- Pires, L.F.; Bacchi, O.O.S.; Reichardt, K. Assessment of Soil Structure Repair due to Wetting and Drying Cycles through 2D Tomographic Image Analysis. Soil Tillage Res. 2007, 94, 537–545. [Google Scholar] [CrossRef]
- Testoni, S.A.; de Almeida, J.A.; da Silva, L.; Pugliese Andrade, G.R. Clay Mineralogy of Brazilian Oxisols with Shrinkage Properties. Rev. Bras. Ciênc. Solo 2017, 41, e0160487. [Google Scholar] [CrossRef]
- Lu, S.-G.; Malik, Z.; Chen, D.-P.; Wu, C.-F. Porosity and Pore Size Distribution of Ultisols and Correlations to Soil Iron Oxides. Catena 2014, 123, 79–87. [Google Scholar] [CrossRef]
- Kodešová, R.; Pavlů, L.; Kodeš, V.; Žigová, A.; Nikodem, A. Impact of Spruce Forest and Grass Vegetation Cover on Soil Micromorphology and Hydraulic Properties of Organic Matter Horizon. Biologia 2007, 62, 565–568. [Google Scholar] [CrossRef]
- Cooper, M.; Dalla Rosa, J.; Medeiros, J.C.; de Oliveira, T.C.; Toma, R.S.; Juhász, C.E.P. Hydro-Physical Characterization of Soils under Tropical Semi-Deciduous Forest. Sci. Agric. 2012, 69, 152–159. [Google Scholar] [CrossRef]
- Tang, C.-S.; Cheng, Q.; Gong, X.; Shi, B.; Inyang, H.I. Investigation on Microstructure Evolution of Clayey Soils: A Review Focusing on Wetting/Drying Process. J. Rock Mech. Geotech. Eng. 2023, 15, 269–284. [Google Scholar] [CrossRef]
- Peng, X.; Horn, R.; Smucker, A. Pore Shrinkage Dependency of Inorganic and Organic Soils on Wetting and Drying Cycles. Soil Sci. Soc. Am. J. 2007, 71, 1095–1104. [Google Scholar] [CrossRef]
- Leij, F.J.; Ghezzehei, T.A.; Or, D. Modeling the Dynamics of the Soil Pore-Size Distribution. Soil Tillage Res. 2002, 64, 61–78. [Google Scholar] [CrossRef]
- Hall, D.G.M.; Reeve, M.J.; Thomasson, A.J.; Wright, V.F. Water Retention, Porosity and Density of Field Soils; Soil Survey Technical Monograph; Rothamsted: Harpenden, UK, 1977; Volume 9. [Google Scholar]
- Pagliai, M.; La Marca, M.; Lucamante, G. Micromorphometric and Micromorphological Investigations of a Clay Loam Soil in Viticulture under Zero and Conventional Tillage. J. Soil Sci. 1983, 34, 391–403. [Google Scholar] [CrossRef]
- Ringrose-Voase, A.J. Measurements of Soil Macropore Geometry by Image Analysis of Sections Through Impregnated Soil. Plant Soil 1996, 183, 27–47. [Google Scholar] [CrossRef]
- Cooper, M.; Medeiros, J.C.; Dalla Rosa, J.; Soria, J.E.; Toma, R.S. Soil Functioning in a Toposequence under Rainforest in São Paulo, Brazil. Rev. Bras. Ciênc. Solo 2013, 37, 392–399. [Google Scholar] [CrossRef]
- Huf dos Reis, A.; Auler, A.C.; Armindo, R.A.; Cooper, M.; Pires, L.F. Micromorphological Analysis of Soil Porosity under Integrated Crop-Livestock Management Systems. Soil Tillage Res. 2021, 205, 104783. [Google Scholar] [CrossRef]
- Wen, T.; Chen, X.; Shao, L. Effect of Multiple Wetting and Drying Cycles on the Macropore Structure of Granite Residual Soil. J. Hydrol. 2022, 614, 128583. [Google Scholar] [CrossRef]
- Diel, J.; Vogel, H.J.; Schlüter, S. Impact of Wetting and Drying Cycles on Soil Structure Dynamics. Geoderma 2019, 345, 63–71. [Google Scholar] [CrossRef]
- Pagliai, M. Soil porosity aspects. Int. Agrophys. 1988, 4, 215–232. [Google Scholar]
- Sartori, G.; Ferrari, G.A.; Pagliai, M. Changes in Soil Porosity and Surface Shrinkage in a Remolded, Saline Clay Soil Treated with Compost. Soil Sci. 1985, 139, 523–530. [Google Scholar] [CrossRef]
- Pagliai, M.; La Marca, M.; Lucamante, G. Changes in Soil Porosity in Remoulded Soils Treated with Poultry Manure. Soil Sci. 1987, 144, 128–140. [Google Scholar] [CrossRef]
- Pagliai, M.; Guidi, G.; La Marca, M.; Giachetti, M.; Lucamante, G. Effect of sewage sludges and composts on soil porosity and aggregation. J. Environ. Qual. 1981, 10, 556–561. [Google Scholar] [CrossRef]
Figure 1.
(a) Soil water retention curve (SWRC) obtained for Typic Hapludox (TH); (b) SWRC for Rhodic Hapludox (RH); (c) Air-filled porosity (TP–θi) for Typic Hapludox; (d) TP–θi for Rhodic Hapludox. Numbers 0 and 6 indicate that the soil samples were submitted to 0 and 6 wetting and drying (W-D) cycles. Bars are the standard deviations. VGM: van Genuchten–Mualem model. Exp: experimental data. Fit: fitting.

Figure 2.
(a) Porosity (P) variation as a function of pore sizes in the Typic Hapludox (TH); (b) P variation as a function of pore sizes in the Rhodic Hapludox (RH); (c) Water content at saturation (sat), field capacity (fc), and permanent wilting point (pwp) in the Typic Hapludox; (d) Water content at saturation, field capacity, and permanent wilting point in the Rhodic Hapludox; (e) Free-soil water content (fw), plant-available soil water (aw), and critical plant-available water (cwc) in the Typic Hapludox; (f) Free-soil water content, plant-available soil water, and critical plant-available water in the Rhodic Hapludox. Numbers 0 and 6 indicate that the soil samples were submitted to 0 and 6 wetting and drying (W-D) cycles. Bars are the standard deviations. Different lowercase letters on the bars indicate a significant difference between W-D cycles (same soil) at p < 0.05.


Figure 3.
2D binary images (pores appear in white and solid matrix in black) for: (a) Typic Hapludox and 0 wetting and drying cycles; (b) Typic Hapludox and 6 W-D cycles; (c) Rhodic Hapludox and 0 W-D cycles; (d) Rhodic Hapludox and 6 W-D cycles.
Figure 3.
2D binary images (pores appear in white and solid matrix in black) for: (a) Typic Hapludox and 0 wetting and drying cycles; (b) Typic Hapludox and 6 W-D cycles; (c) Rhodic Hapludox and 0 W-D cycles; (d) Rhodic Hapludox and 6 W-D cycles.

Figure 4.
(a) Contribution of different pore shapes and sizes to porosity (P) in the Typic Hapludox submitted to 0 wetting and drying (W-D) cycles; (b) Contribution of different pore shapes and sizes to P after 6 W-D; (c) Pore size distribution as a function of shape and size after 0 W-D; (d) Pore size distribution as a function of shape and size after 6 W-D; (e) Total number of pores (TNP) as a function of shape and size after 0 W-D; (f) TNP as a function of shape and size after 6 W-D. Round: rounded-shaped pores; Elon: elongated-shaped pores; Irr: irregular-shaped pores. Different lowercase letters indicate significant differences between W-D cycles at p < 0.05.


Figure 5.
(a) Contribution of different pore shapes and sizes to porosity (P) in the Rhodic Hapludox submitted to 0 wetting and drying (W-D) cycles; (b) Contribution of different pore shapes and sizes to P after 6 W-D; (c) Pore size distribution as a function of shape and size after 0 W-D; (d) Pore size distribution as a function of shape and size after 6 W-D; (e) Total number of pores (TNP) as a function of shape and size after 0 W-D; (f) TNP as a function of shape and size after 6 W-D. Round: rounded-shaped pores; Elon: elongated-shaped pores; Irr: irregular-shaped pores. Different lowercase letters indicate significant differences between W-D cycles at p < 0.05.


Table 1.
Classification of pores according to shapes based on indices Γ1 (Equation (6)) and Γ2 (Equation (7)).
Table 1.
Classification of pores according to shapes based on indices Γ1 (Equation (6)) and Γ2 (Equation (7)).
| Pore Shapes | Γ1 | Γ2 |
|---|---|---|
| Rounded (Round) | ≤5 | - |
| Elongated (Elon) | 5 < Γ1 ≤ 25 | ≤2.2 |
| Irregular (Irr) | 5 < Γ1 ≤ 25 or >25 | >2.2 |
Table 2.
van Genuchten–Mualem (VGM) mathematical model parameters [37] used to fit the soil water retention data for the two soils (Typic Hapludox and Rhodic Hapludox) subjected to 0 and 6 wetting and drying (W-D) cycles. Different lowercase letters indicate significant differences between W-D cycles (same soil) at p < 0.05.
| VGM Parameters | Typic Hapludox | Rhodic Hapludox | ||
|---|---|---|---|---|
| 0 W-D | 6 W-D | 0 W-D | 6 W-D | |
| θs (m3 m−3) | 0.364 | 0.362 | 0.528 a | 0.498 b |
| θr (m3 m−3) | 0.087 a | 0.136 b | 0.195 | 0.190 |
| α (kPa−1) | 0.613 | 0.493 | 3.677 a | 1.695 b |
| n | 1.416 | 1.533 | 1.244 | 1.183 |
| m 1 | 0.294 | 0.348 | 0.196 | 0.155 |
1 Parameter m was calculated as: [37].
Disclaimer/Publisher’s Note: The statements, opinions and data contained in all publications are solely those of the individual author(s) and contributor(s) and not of MDPI and/or the editor(s). MDPI and/or the editor(s) disclaim responsibility for any injury to people or property resulting from any ideas, methods, instructions or products referred to in the content. |
© 2023 by the author. Licensee MDPI, Basel, Switzerland. This article is an open access article distributed under the terms and conditions of the Creative Commons Attribution (CC BY) license (https://creativecommons.org/licenses/by/4.0/).
Share and Cite
MDPI and ACS Style
Pires, L.F. Changes in Soil Water Retention and Micromorphological Properties Induced by Wetting and Drying Cycles. Soil Syst. 2023, 7, 51. https://doi.org/10.3390/soilsystems7020051
AMA Style
Pires LF. Changes in Soil Water Retention and Micromorphological Properties Induced by Wetting and Drying Cycles. Soil Systems. 2023; 7(2):51. https://doi.org/10.3390/soilsystems7020051
Chicago/Turabian StylePires, Luiz F. 2023. "Changes in Soil Water Retention and Micromorphological Properties Induced by Wetting and Drying Cycles" Soil Systems 7, no. 2: 51. https://doi.org/10.3390/soilsystems7020051