
Spatial Variability of Topsoil Properties on a Semi-Arid Floodplain

1
School of the Environment, University of Technology Sydney, 15 Broadway, Ultimo, NSW 2007, Australia
2
Department of Civil and Construction Engineering, Swinburne University of Technology, Hawthorn, VIC 3122, Australia
3
Centre for Urban Research, School of Global, Urban and Social Studies, Royal Melbourne Institute of Technology University, Melbourne, VIC 3001, Australia
*
Author to whom correspondence should be addressed.
Soil Syst. 2023, 7(2), 42; https://doi.org/10.3390/soilsystems7020042
Submission received: 14 October 2022
/
Revised: 5 April 2023
/
Accepted: 12 April 2023
/
Published: 23 April 2023
Abstract
:This study relates the spatial heterogeneity (or patterning) of geochemical elements in the topsoil of a semi-arid floodplain/hillslope system in north-eastern Australia to vegetation distribution and rates of flood inundation. A total of 540 topsoil samples were collected from six flood frequency zones, ranging from a frequently flooded area (RI = 1:1–2 yrs) to two zones that have not flooded in living memory (RI > 50 yrs). Within each zone, topsoil samples were collected from both vegetated and non-vegetated surfaces, and each sample was analysed for 26 parameters. A combination of multi- and univariate analyses reveals that vegetation is an important contributor to topsoil heterogeneity. In zones subject to relatively frequent flooding, the spatial distribution of parameters in the topsoil is greatly influenced by the movement of water, with vegetation acting as a sink rather than a source. However, as floods become increasingly rare, distinct resource-rich units become evident in the topsoil beneath the vegetation. These findings indicate that topsoils in semi-arid floodplains are altered when their natural flooding regimes are reduced, beginning to approximate hillslopes when flood frequencies exceed 1-in-7 to 10 years. This points to the need for frequent flood (overbank) releases that are able to cover the 1-in-20-year floodplain to maintain the character of the soils and support vegetation growth in these environments.
Keywords:
ecosystems; geochemistry; resilience; resource islands; soil nutrients; soil heterogeneity1. Introduction
Semi-arid floodplains often contain highly productive ecological systems that represent biological hotspots in what are otherwise nutrient-poor landscapes [1,2,3,4]. The floodplains of the semi-arid Murray–Darling River system in eastern Australia, for example, are critical environments for a range of aquatic and terrestrial organisms that are not found on the dry landscapes surrounding them, including waterbirds (both migratory and non-migratory), aquatic and terrestrial plants, fish, frogs and invertebrates [5,6,7,8,9,10].
Not surprisingly, research into the impacts of overbank events reveals that floods drive process functioning in semi-arid floodplain systems. In addition to transporting water, which is directly used by organisms for their biochemical functioning and influences soil processes such as nitrogen and carbon mineralization [11,12], floods deliver sediments and nutrients (both in particulate and dissolved form) to the floodplain surfaces [13,14,15]. Indeed, the presence of nutrients in semi-arid soils is often closely linked to water availability, largely because water releases them from the soil particles to which they are bound [16]. As such, the spatial distribution of materials such as organic carbon, nitrogen and phosphorous across semi-arid floodplains is linked to flood inundation [17]. In addition, the materials transported by floods (particularly water and nutrients) support biological growth and, therefore, the distribution (both spatial and temporal) of floodplain ecosystems and the extent of process functioning within them also tend to be reflective of patterns of inundation [18,19].
Although semi-arid floodplains derive their high ecosystem values from the rivers that supply them with water and nutrient-rich sediments [7], they are also sources of nutrients and sediments that are transported back into rivers as floods recede [13,20]. Thus, semi-arid floodplain units are intimately linked with their adjacent waterways, and the distribution of the ecosystems located in both environments (i.e., on the floodplains and in the rivers) is dependent upon the maintenance of these links [21,22,23]. We need to better understand how organic nutrients are distributed within these systems to ensure the effective management of these environments.
While patterns of organic nutrients in semi-arid floodplain soils will clearly be influenced by rates of flooding, research into semi-arid hillslopes suggest floodplain nutrient distributions may also be affected by the presence or absence of vegetation, which stores and releases organic material as it grows and dies [24,25]. Studies have shown that concentrations of soil nutrients under vegetated canopies on semi-arid hillslopes can be 1.3 to 3.0 times greater than those in the exposed soils between the vegetation [26,27,28]. This means that hillslope soils under perennial vegetation become resource islands (also referred to as ‘islands of fertility’) where nutrients and organic matter accumulate and are cycled [29,30]. The development of these resource islands on semi-arid hillslopes is reinforced by the redistribution of soil nutrients from the surfaces between vegetation canopies (i.e., bare intershrub surfaces) to the surfaces beneath vegetation canopies, making the resource islands nutrient rich in otherwise relatively nutrient-poor environments. This nutrient redistribution is driven by a combination of biotic and abiotic processes, including: (1) shrub entrapment of soil particles and organic matter propelled by wind or raindrops [27]; (2) the movement of nutrients and water from interspaces in the rhizosphere [31]; (3) the deposition of nutrients beneath shrubs via litter fall [32]; (4) the occurrence of higher microbial, invertebrate and vertebrate activity under vegetation [33,34]; and (5) the preferential loss of nutrients from the bare non-vegetated surfaces through wind and water erosion [35,36].
The ecological benefits of resource islands for plants and animals depend on the extent of the concentration of soil nutrients beneath vegetation canopies, but these are typically sites of heightened biological activity [28]. Shade and enhanced nutrient levels enhance seedling survival and provide protection, resources and habitat for terrestrial organisms [37]. Litter also provides organic material that enhances soil structure and infiltration. These conditions combine to support the growth of vegetation in these comparatively fertile zones [38,39].
Once established, the spatial heterogeneity of soil resources on semi-arid hillslopes is thought to maintain and even enhance the uneven distribution of the overlying vegetation [39,40]. Thus, the evident patchiness of soil parameters and perennial vegetation on semi-arid hillslope surfaces is influenced by a combination of biological and physical process functioning, with perennial vegetation (typically tree- and/or shrub-dominated) communities growing on relatively resource-rich soil units that are surrounded by mostly bare (non-vegetated) and resource impoverished surfaces [41,42].
Although spatial variability is a recognised dimension of semi-arid hillslope topsoils, its occurrence (and the implications thereof) on semi-arid floodplains has not been extensively investigated. Floodplains are typically flat or gently sloping depositional landscape features located adjacent to rivers. These features are produced through a combination of lateral and vertical fluvial accretion (the dominating process varies depending upon the system) and are routinely inundated by overbank flows [43,44].
The relatively flat and accessible terrain of floodplains and their often highly productive soils (especially in semi-arid environments) make them valuable landscape units, and, as a consequence, they have been extensively settled and modified by humans. Unfortunately, the propensity for floodplains to become inundated (i.e., to flood) often results in the subsequent emplacement of structures aimed at reducing flooding, such as levees or flood-check dams [45]. These structures limit overbank events and disconnect the floodplain unit from the fluvial system that is responsible for both its formation and its maintenance.
In semi-arid environments, where water resources are in short supply, large volumes of water are also diverted from rivers or impounded in-channel to support human activities, such as providing for irrigated agriculture or drinking water. The highly variable and relatively low rainfall in these environments means the impoundments (i.e., dams) are often much larger than similar structures in humid environments. The total volume of storage in the Murray–Darling Basin, for example, is equivalent to the average year’s runoff for the entire basin [46]. Once again, this level of impoundment and diversion results in fewer overbank events and decouples semi-arid river-floodplain systems [47].
During overbank events, soil nutrients are transported onto the floodplain surface from the river while in situ materials are mobilised and redistributed. The potential for flows to constantly move floodplain materials around means that it is more likely that soil parameters on semi-arid floodplains will be less clustered (less spatially variable) than those on semi-arid hillslopes, although this has not been previously investigated. This study sought to examine this by investigating the spatial distribution of geochemical parameters in the topsoil of a semi-arid hillslope–floodplain system, with a view to considering the impact of flood frequency on spatial patterning. The aim was to determine whether nutrients in the topsoil of a semi-arid floodplain in north-eastern Australia are more evenly spatially distributed than nutrients on the surface of the adjacent hillslopes and, if they are, we may then be able to use this information to understand the hydrologic conditions necessary to help maintain floodplain soil condition. This research is critically important because, despite their ecological significance, semi-arid floodplains are being degraded at an alarming rate [48,49,50]. If these environments are to be better managed, we need to understand how nutrients are moving across these surfaces and how direct and/or indirect modifications to floodplains (particularly alterations in the frequency and/or duration of flood inundation) might impact process functioning within these environments.
2. Materials and Methods
2.1. Study Region
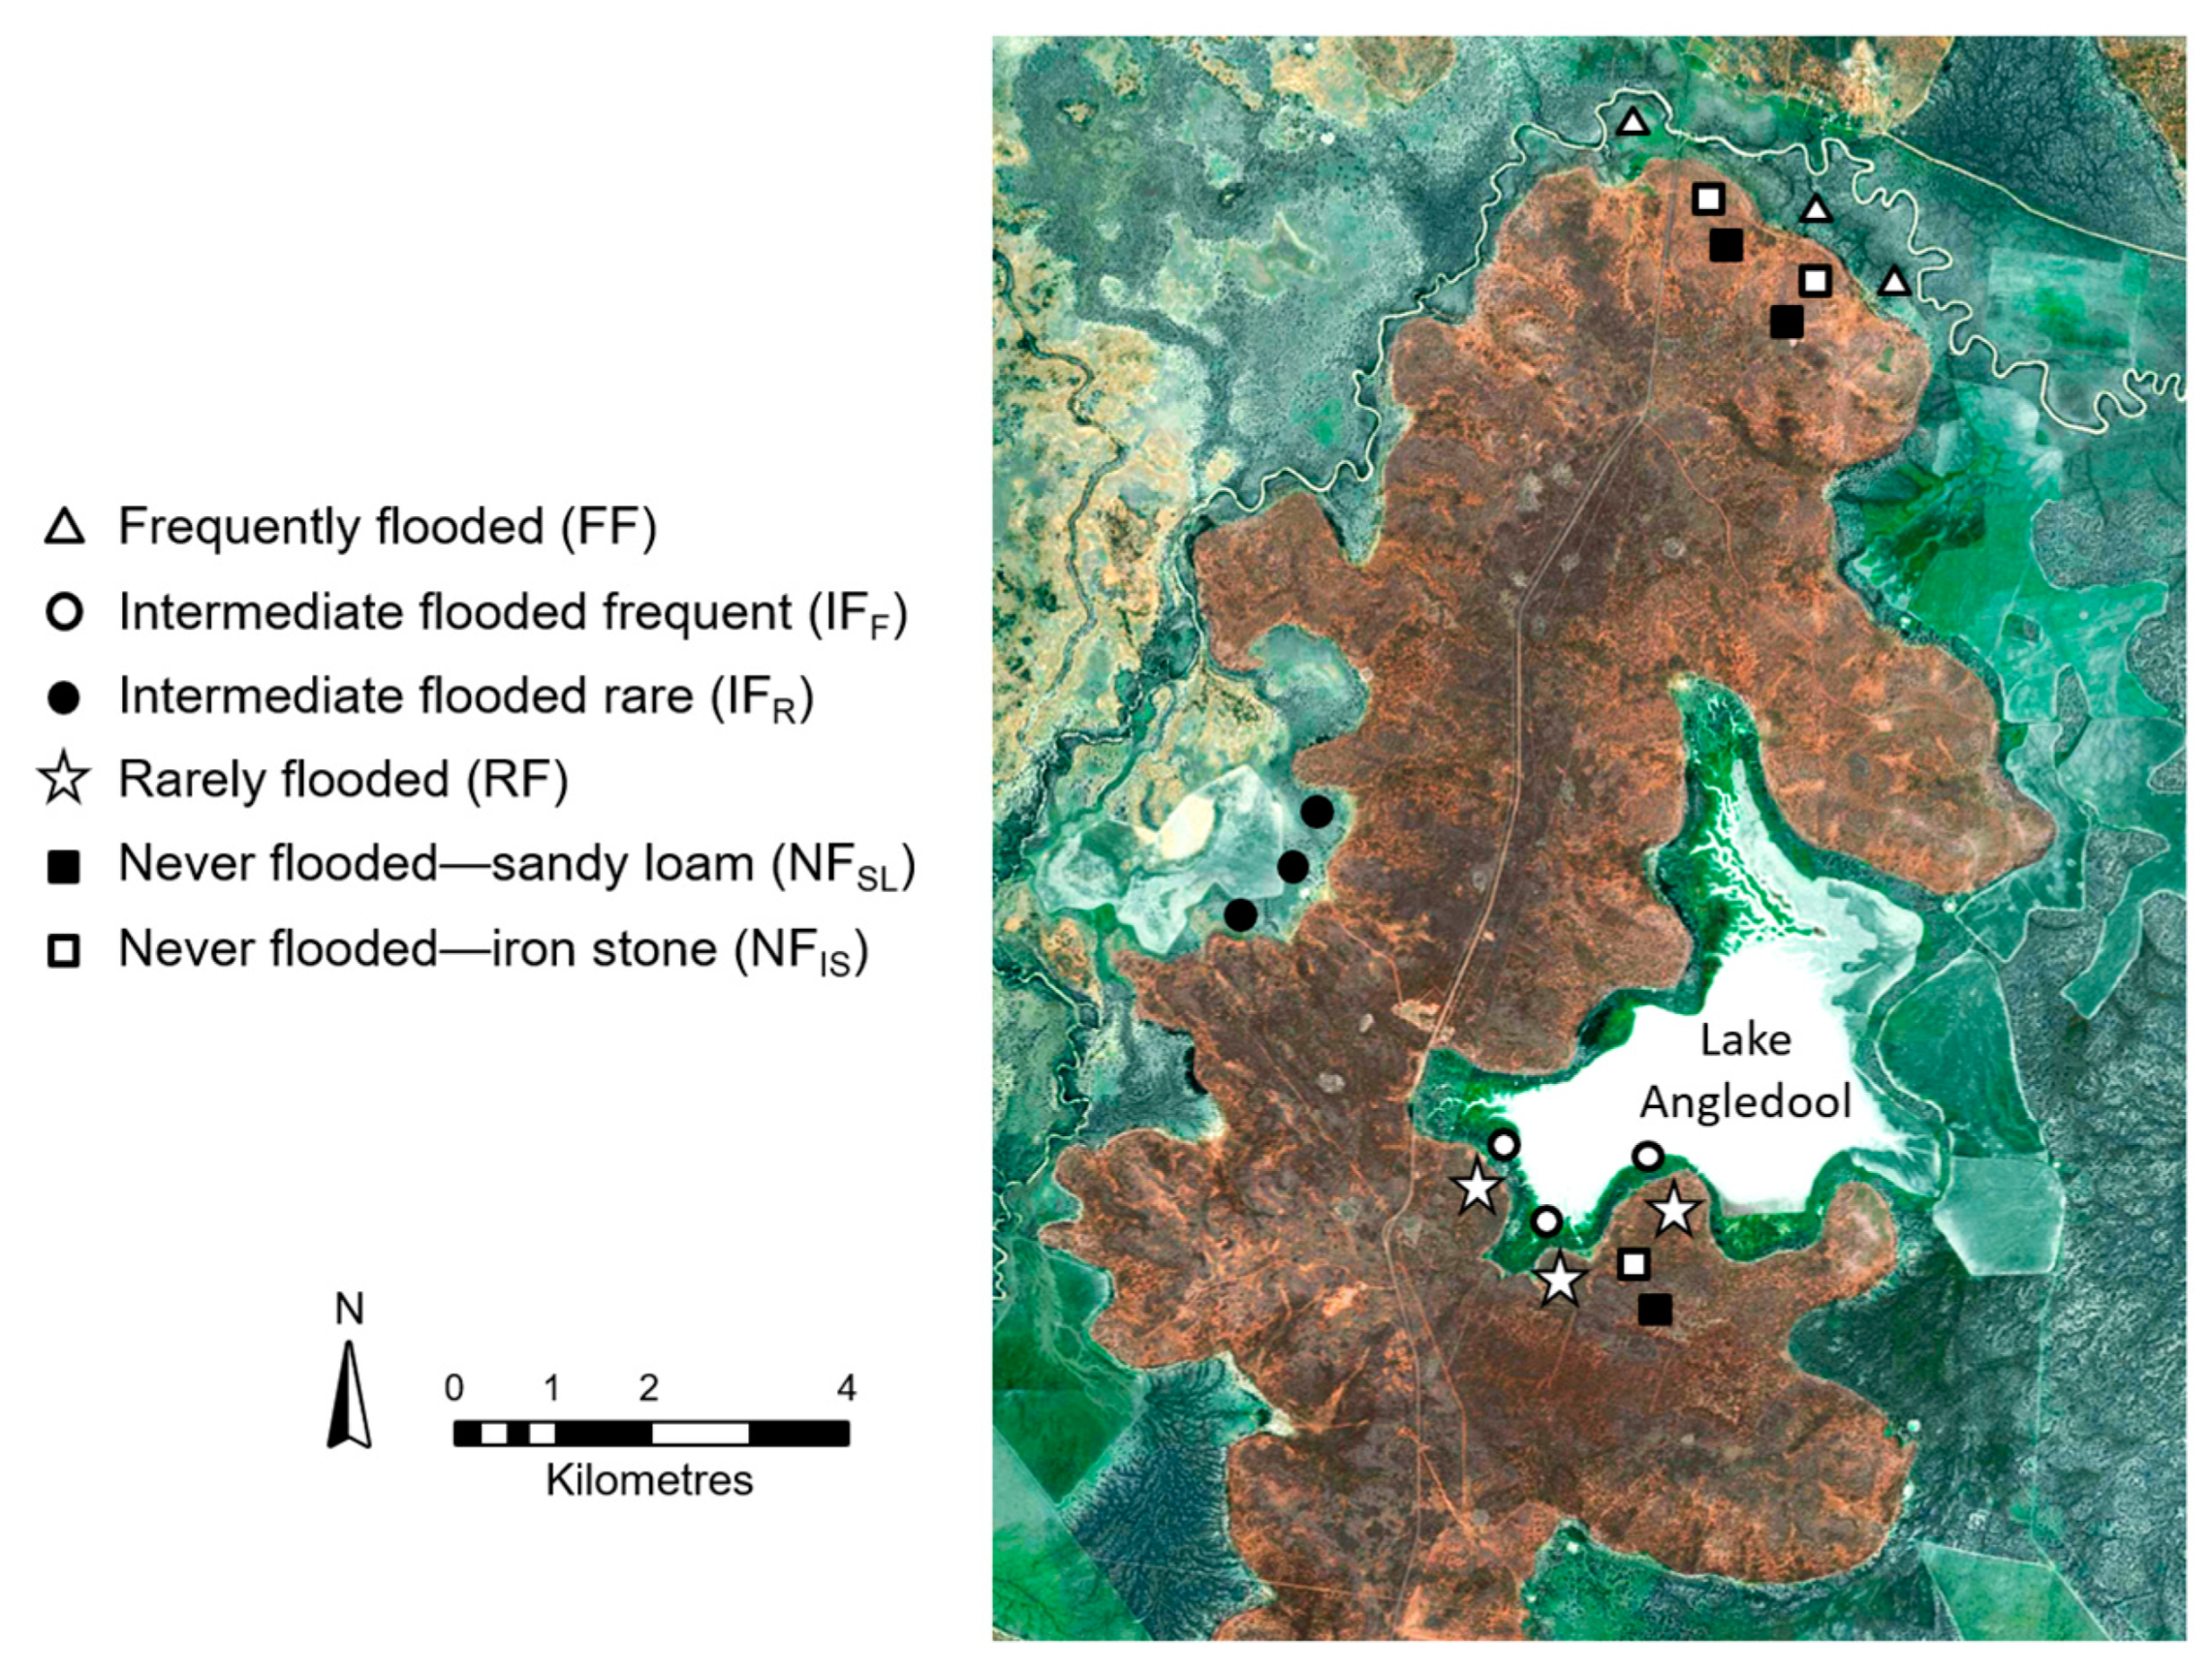
This study was conducted on Angledool Station, a mixed-farming property located approximately 45 km north of Lightning Ridge in semi-arid north-western New South Wales, Australia (Figure 1). Angledool Station is a privately owned large agricultural enterprise that includes Lake Angledool, a terminal lake in the Condamine–Balonne catchment that is intermittently filled by overbank flows from the Narran River. In addition to the lake, Angledool Station is covered by floodplain landscapes (which comprise approximately 75% of the property) and red soil ridges (hillslope areas that never flood). This region is one component in a series of floodplain–lake–wetland complexes that originate in southern Queensland and terminate in the Narran Lakes in northern New South Wales. This particular complex is supplied by flows from the Narran River, a distributary of the Condamine–Balonne River that splits into five major tributaries (Culgoa, Ballandool, Bokhara, Briarie and Narran) downstream of the Queensland township of St. George [51]. Angledool Station was selected for this study because it provided access to a combination of flooding regimes that enabled the research objectives to be addressed.
The Narran River catchment sits within the much larger Murray–Darling River basin in eastern Australia (Figure 1a) and experiences dry, mild to cold winters and hot summers, with most of the average annual rainfall occurring in the summer months of December through March [52]. Historically, flows down the Narran River are extremely variable, exhibiting extended periods of little to no flow punctuated by small, intermediate and large flood events. Thus, the Narran River is dry about 60% of the time but, during flood years, can carry sizable flows (in excess of 8000 mL/day). This irregular flow regime reflects the highly variable nature of the regional rainfall, which averages approximately 480 mm/year but exhibits pronounced wet/dry (summer/winter) periodicity (averaging 60 mm in January and 24 mm in August) and interannual variability (varying from 988 mm in 1950 to <10 mm in 1888 and 1891). Regional temperatures are also variable [44], ranging from summer daily highs in excess of 45 °C to winter daily lows of below 10 °C [53]. In all seasons, evaporation rates far exceed precipitation rates, with the lower catchment experiencing an average annual evaporation rate of approximately 2000 mm [54]. This indicates that over the course of an average year, there is a large negative water balance (more moisture is lost to evaporation than comes in through precipitation) in the Narran River system, including at Lake Angledool.
Angledool Station is situated in the western section of the Northern Floodplains Region of New South Wales. This region is dominated by Quaternary sands, largely of aeolian origin, with isolated outcrops of cretaceous siltstones, shales and sandstones, some capped by tertiary silcrete. The soils within Angledool Station can be classified into four broad types: (1) soft red earth; (2) hard red earth; (3) deep heavy grey clays; and (4) heavy clays overlain by sand deposits [55]. The Station also contains two distinct landform systems, heavy clay floodplains adjacent to the Narran River that stretch along the eastern half of the property from its northern to its southern boundary and slightly hard red and soft red earth ridges in the south-west corner of the Station in the vicinity of the Narran River.
Vegetation in the study region is patchy, with significant spatial and temporal variability in the abundance and diversity of species. Typically, annual vegetation is widely present everywhere during rainfall or flooding events but is largely absent during drier periods. In contrast, perennial vegetation communities are commonly located on river floodplains, riparian zones, lake shores and the adjoining undulating ridge country [55]. The spacing between mature trees or shrubs on the floodplains ranges from sparse to moderate or dense (i.e., one plant every 5 to 100 m), with closer spacing often evident on the adjoining ridges (i.e., one plant every 5 to 40 m) [56]. Proximate to Lake Angledool, rushes (Juncus spp.) and annual herbs grow together with coolabah (Eucalyptus microtheca) and widely scattered swamp box (Eucalyptus largiflorens), belah (Causuarina cristata), gidgee (Acacia cambagei), river cooba (Acacia stenophylla) and river red gum (Eucalyptus camaldulensis) trees. On the broader floodplains, shrub cover is approximately 70%, with Lignum (Muehlenbeckia cunninghamii) and salt bush (Chenopodium spp.) being the most common. The surrounding ridges are mainly dominated by white cypress pine (Callitris columellaris), bimblebox (Eucalyptus populnea) and ironwood (Acacia excelsa), with wilga (Geijera parviflora), silver-leaved ironbark (Eucalyptus melanophloia), whitewood (Endospermum medullosum) and leopardwood (Flindersia maculosa) being locally important in some areas. Other species of significance on the ridges include budda (Eremophila mitchellii), quinine bush (Alstonia constricta), African box thorn (Lycium ferrocissimum) and dogwood (Myoporum deserti), which all show local dominance in certain areas.
Following colonization and until the 1980s, land in the Condamine–Balonne catchment was mainly used for sheep or cattle grazing and mineral exploration, with some low-impact cropping undertaken on floodplains immediately following flood events. Since the 1980s, however, the lower sections of the Condamine–Balonne catchment (at least on the Queensland side of the border) have been converted for intensive irrigated cropping—mainly cotton. This has resulted in a substantial increase in the allocation and use of regional water resources [44]. In conjunction with several government water storages, artificial storage capacity in the lower Condamine–Balonne catchment now exceeds 1,145,000 mL, and on average more than 50% of the available water in the catchment is diverted for human use each year.
2.2. Field Sampling
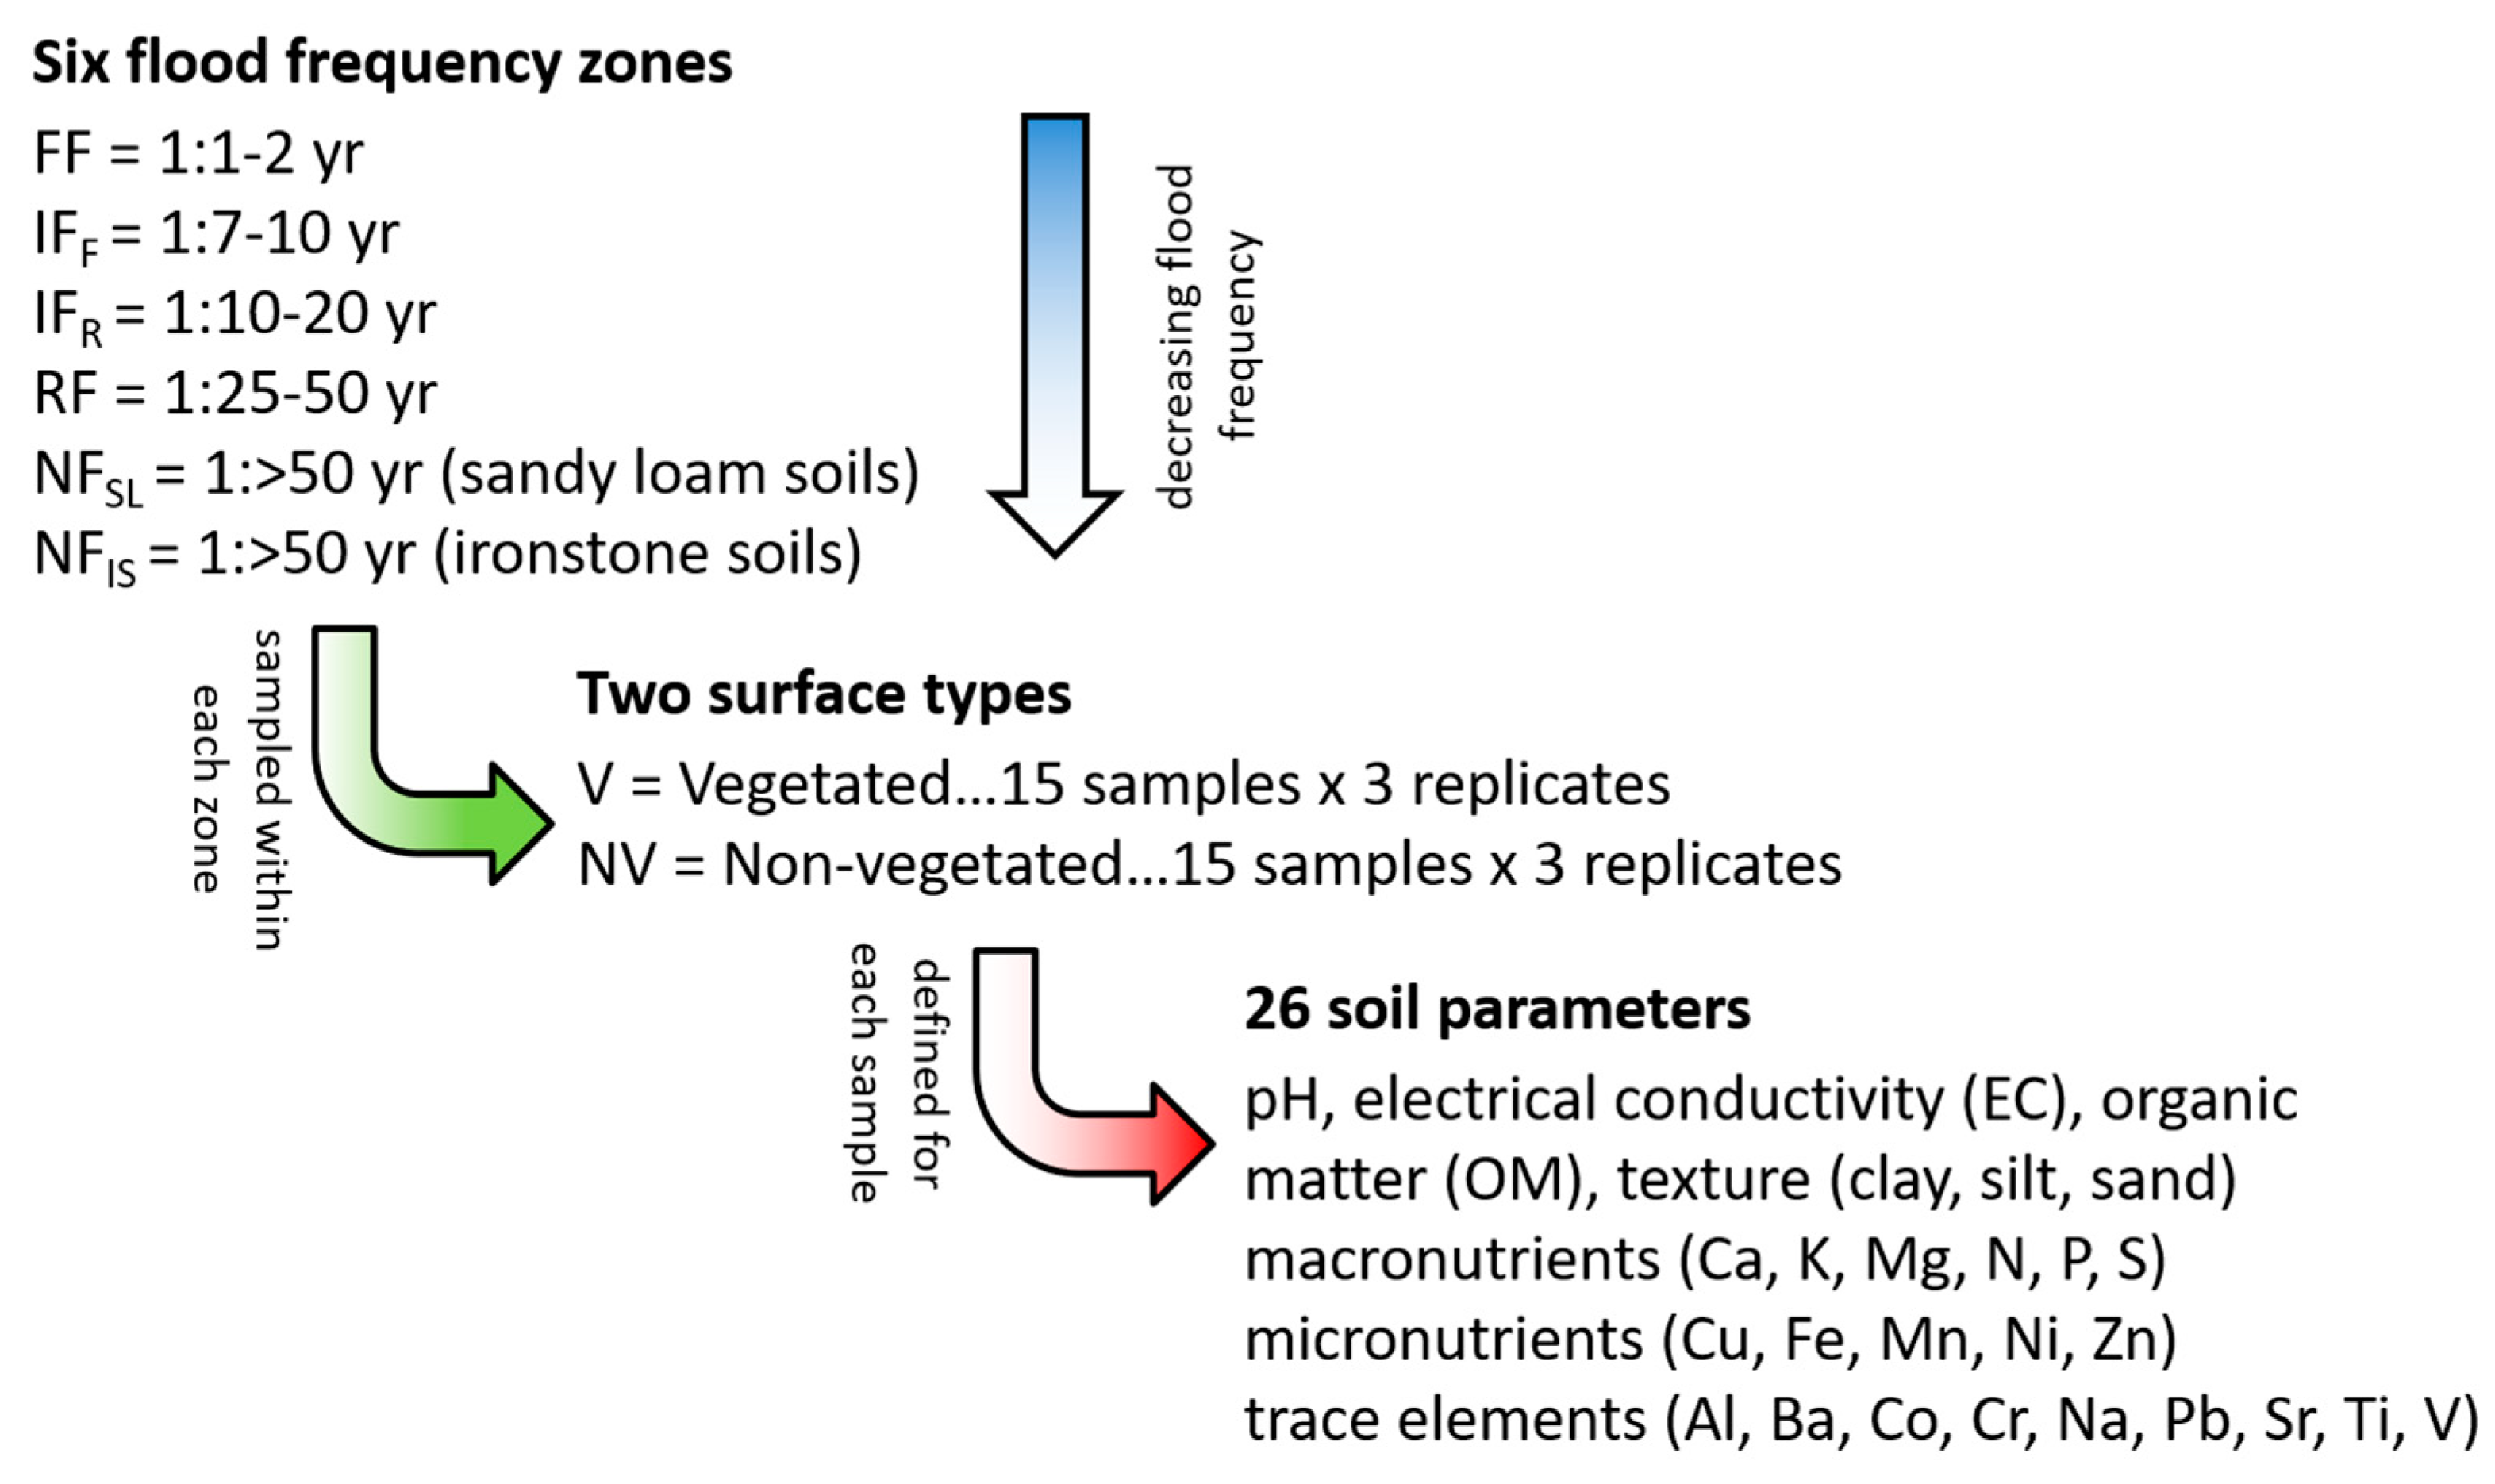
To assess the relationship between topsoil heterogeneity and flooding, six flood frequency zones were identified at Angledool Station (Figure 2). These zones were characterized by their frequency of inundation and soil type and included: a frequently flooded zone (FF = flood recurrence interval of 1:1–2 years), two intermediately flooded zones (IFF = flood recurrence interval of 1:7–10 years and IFR = flood recurrence interval of 1:10–20 years), a rarely flooded zone (RF = flood recurrence interval of 1:25–50 years), and two never flooded zones differentiated according to their dominant soil type (NFIS = located on iron stone soils and NFSL = located on sandy loam soils).
Within each of these six flood-frequency zones, 30 soil samples were collected from three replicate sites. Thus, a total of 90 topsoil samples were obtained from each of the six flood frequency zones, yielding a total of 540 samples for analysis. The soil sample collection method involved extracting approximately 500 g of soil from the top 5–10 cm of the soil profile using a trowel. After extraction, the soil samples were double-bagged, labelled and stored in insulated containers for transport to the laboratory for analysis.
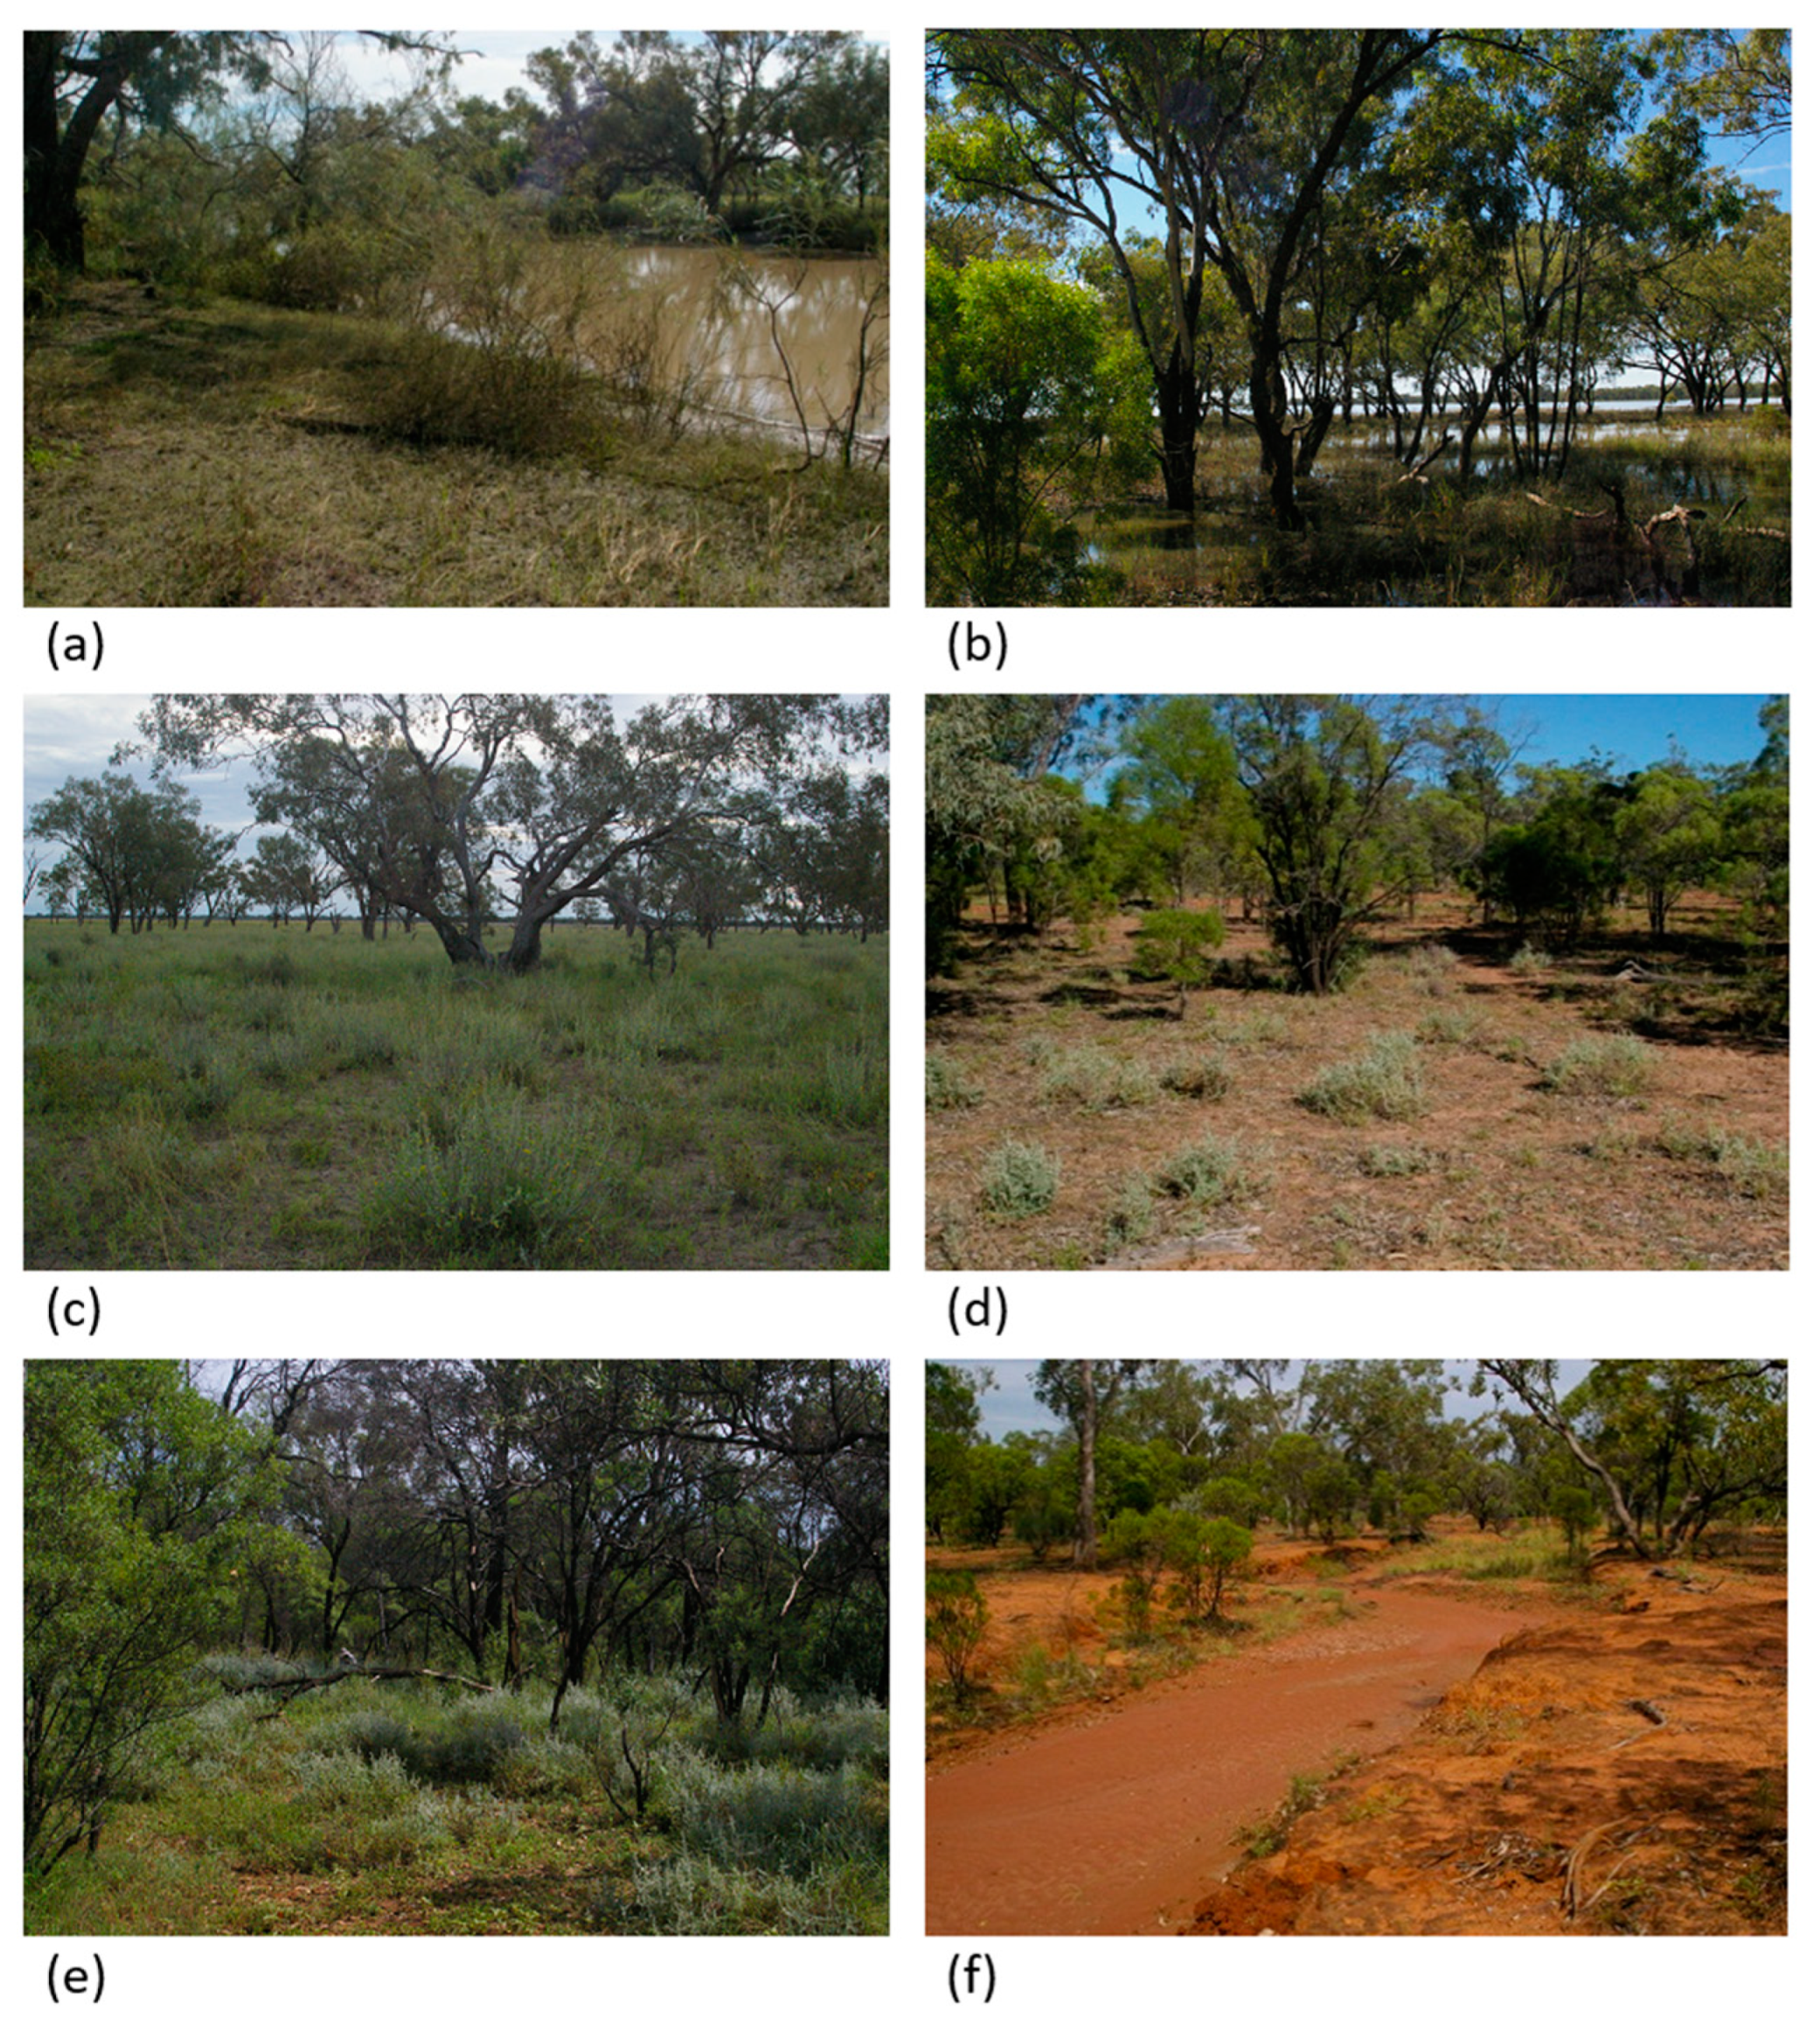
To investigate the relationship between vegetation and the spatial character of the topsoil, the samples in the six flood frequency zones were collected from both beneath and between the dominant vegetation. Collecting samples in this manner enabled consideration of whether resource clustering beneath plants was occurring and if/how it was related to the frequency of inundation (or a lack of flooding). Thus, 15 of the 30 topsoil samples collected within each of the six flood frequency zones came from beneath vegetation canopies, and 15 samples came from the bare zones between the vegetation (providing a total of 270 vegetated and 270 non-vegetated samples). The vegetated samples were collected from beneath the dominant vegetation type in the relevant flood frequency zone (Figure 3). Thus, in the frequently flooded zone (FF), the vegetated samples were collected from beneath lignum (Muehlenbeckia cunninghamii) canopies. In the zones that flooded every 7–10 years (IFF) and 25–50 years (RF), the vegetated samples were collected from beneath coolabah (Eucalyptus microtheca) canopies. In the zone that flooded every 10–20 years (IFR), the vegetated samples were collected from beneath salt bush (Chenopodium spp.) canopies, while on the iron stone (NFIS) and sandy loam (NFSL) hillslope zones, the vegetated samples were collected from beneath canopies containing a mixture of bimblebox (Eucalyptus populnea) and budda (Eremophila mitchellii) trees. All samples collected from beneath canopies were taken within 30 cm of the main trunk of the dominant species to ensure they were well within the canopy boundary.
2.3. Laboratory Analyses
After their collection, the soil samples were taken to a laboratory where they were dried at 35 °C for 24 h to prepare them for analysis [57]. Once dried, the samples were ground and then stored in a cool refrigerated room to avoid further chemical or biological changes. The samples were subsequently analysed for 26 parameters, including: texture (per cent sand, silt and clay), pH, electrical conductivity (EC), organic matter (%OM), and 20 geochemical elements. These analyses were undertaken using the following procedures.
Soil texture was calculated using a hydrometer according to Australian standards method 1289.3.6.3. This method involved passing a 40 g sub-sample through a 2 mm sieve. The soil sub-sample was then mixed with 800 mL of deionized water and 5 g of a dispersing agent (Calgon), after which it was placed in a 1-litre hydrometer cylinder and mixed thoroughly. Temperature and hydrometer readings were then taken after 0.5, 1, 3, 10, 30, 60, 90, 120 and 1440 min and used to calculate the percentages of sand (2000–50 µm), silt (2–50 µm) and clay (<2 µm) in the sub-sample. Once the hydrometer analyses were complete, the sub-sample was wet-sieved to confirm the reported size fractions.
Soil pH and electrical conductivity (EC) were both calculated in the laboratory following Australian Standards procedure 1289.4.3.1. To measure soil pH, 5 g sub-samples were prepared according to the 4A1 (1:5 soil/water suspension) and the 4B1 (1:5 soil/0.01 M calcium chloride extract without stirring) methods. For electrical conductivity, a 5 g sub-sample was prepared according to method 3A1 (1:5 soil/water extract) [57]. Calibrated desktop digital meters were then used to measure the pH and EC of these sub-sample mixtures.
A Leco TRuSpec CN nutrient analyser, which is an automated combustion instrument, was used to measure the organic matter content of the soil samples. The samples were prepared according to the 6B2 and the 7A5 Dumas high-temperature combustion method and then tested for organic content using the nutrient analyser.
Finally, a suite of 20 geochemical variables was measured for each soil sample using inductively coupled plasma atomic emission spectrometry (ICP-AES). This is a multi-element acid digestion process that was undertaken according to method 17C1 (pseudo-total elements of soil and sediments using conventional aqua regia block digestion). To prepare samples for this process, 0.5 g ground soil (<2 mm fraction) sub-samples were mixed with 10 mL ultra-high purity water, 2 mL analytical grade Nitric Acid (16 M) and 2 mL analytical grade Hydrochloric Acid (10 M). These liquid sub-samples were subsequently analysed using an ICP-AES instrument, which returned the total elemental composition for Aluminum (Al), Barium (Ba), Calcium (Ca), Cobalt (Co), Chromium (Cr), Copper (Cu), Iron (Fe), Lead (Pb), Magnesium (Mg), Manganese (Mn), Nickel (Ni), Nitrogen (N), Phosphorus (P), Potassium (K), Sodium (Na), Strontium (Sr), Sulfur (S), Titanium (Ti), Vanadium (V) and Zinc (Zn). To improve the readability of the data for this study, these geochemical variables have been categorised into the following sub-groups: Macronutrients (Ca, K, Mg, N, P and S); Micronutrients (Cu, Fe, Mn, Ni and Zn); and other (Al, Ba, Co, Cr, Na, Pb, Sr, Ti and V).
Thus, in summary, 26 soil parameters were assessed for each of the 540 topsoil samples that had been collected in the field. This yielded a total of 14,040 individual data points for inclusion in this study. A schematic representation of the sampling collection and analysis strategy employed is presented in Figure 4.
2.4. Statistical Analyses
Relationships between the distributions of the 26 soil parameters across the floodplain were assessed in this study using a combination of descriptive, univariate and multivariate statistics. To facilitate these analyses, the data were initially sub-divided into two groups—vegetated and non-vegetated. This sub-division allowed for an assessment of whether vegetation exerts an influence on the spatial character of the topsoil at the whole site scale. Each vegetated and non-vegetated soil group was then further subdivided into the six floodplain zones, resulting in a total of 12 sub-groups (vegetated and non-vegetated for each floodplain zone). This subdivision enabled an investigation of the extent to which flooding influenced topsoil character. The following statistical techniques were then applied to these two data sub-sets.
Descriptive statistics (mean and coefficient of variation) were calculated for each of the 26 soil parameters. These provided a sense of the magnitude of differences between the vegetated and non-vegetated soils at the two spatial scales (whole site and floodplain zones). The results of these analyses were coupled with Mann–Whitney U tests that were used to assess whether the means for the vegetated and non-vegetated data sets were statistically different.
A Mann–Whitney U test is a non-parametric statistical test that compares the distributions of two independent groups to determine whether they come from the same population. In this study, Man–Whitney U tests were first used to compare the distributions of each of the 26 soil parameters for the vegetated and non-vegetated samples. This involved a comparison of two groups (vegetated and non-vegetated) of 270 data points for each of the 26 soil parameters. Mann–Whitney U tests were also used to compare the vegetated and non-vegetated soils for the 26 soil parameters within each floodplain zone. These tests compared sub-sets of 45 data points each. In all cases, results with p < 0.05 were considered statistically different.
Multi-dimensional scaling (MDS) was used to ascertain whether the data exhibited patterns or groupings. One advantage of MDS, which is an ordination technique, is that it can graphically represent complex data sets in two-dimensional space, helping the reader to visually appreciate the output. In this study, two MDS plots were generated. The first depicted the 26 soil parameters ordered according to whether they were vegetated or non-vegetated. This provided an analysis of the entire data set at the whole site scale. The second MDS plot further sub-divided the vegetated and non-vegetated data into the six floodplain zones. Both MDS plots also include an indication of geochemical variables that had an axis of enrichment that was statistically significant in its association with the MDS spatial distribution. These data are represented as directional arrows on the MDS plots.
Finally, an analysis of similarity (ANOSIM) test was undertaken to identify whether there were any differences between the floodplain zone soil groupings. An ANOSIM is a non-parametric multivariate test, and in this study, it was used to complement the MDS plots in this study. The ANOSIM statistic is an R value that ranges between zero and one, with values close to zero representing the greater similarity between the paired data sets. In this study, R values of 0.75 or greater, at p < 0.01, were considered to indicate strong separation between the pair-wise groups.
3. Results
3.1. Whole Site Scale
Summary statistics (mean and coefficient of variation) for each of the 26 soil parameters on the vegetated and non-vegetated surfaces (270 samples for each surface type) are presented in Table 1, along with p-values for the Mann–Whitney U tests that compared the pair-wise results. Significant differences between vegetated and non-vegetated soil properties were evident for certain parameters, with 13 of the 26 parameters being statistically different (p < 0.05). Of these 13 parameters, 11 were significantly higher in the vegetated topsoil samples, including the 6 essential nutrients of Ca, K, Mg, N, P and S.
A multi-dimensional scaling (MDS) plot illustrating the spatial patterning of the vegetated and non-vegetated topsoil samples in multi-dimensional space is presented in Figure 5. The high degree of overlap evident in the MDS plot and the low ordination stress of 0.0978 indicate that the vegetated and non-vegetated topsoils are not separating at this scale. These results are supported by an ANOSIM analysis that returned a very low R value of 0.093, which also indicates there is no separation between the properties of the vegetated and the non-vegetated topsoils at the whole site scale.
3.2. Within Flood Frequency Zones
Summary statistics (mean and coefficient of variation) for the vegetated and non-vegetated soil parameters within each flood frequency zone are presented in Table 2 and Table 3, respectively. Mann–Whitney U values for comparing the vegetated and non-vegetated distributions for each topsoil parameter and within each flood frequency zone are presented in Table 4. Approximately 60% of the vegetated and non-vegetated topsoil comparisons within flood frequency zones were statistically different, indicating that at this scale, there is a separation between the characteristics of vegetated and non-vegetated topsoil when individual soil parameters are considered, although the extent of this varies depending upon inundation.
In the frequently flooded (FF) inundation zone, over 72% (19 out of 26) of the vegetated to non-vegetated comparisons were statistically different, and the majority of these results (15/19) were higher for the non-vegetated topsoil than the vegetated topsoil. Likewise, the never flooded sandy loam topsoil (NFSL) showed a high number of significant differences between the vegetated and non-vegetated topsoil samples (77% or 20/26), but the majority of these (19/20) were higher beneath the vegetation than away from it. Over 60% (16/26) of both the never flooded iron stone (NFIS) and the rarely flooded (RF) topsoil exhibited significant differences between the vegetated and non-vegetated samples for individual topsoil parameters. In the rarely flooded zone, the topsoil parameters tended to be higher beneath vegetation (13/16), whereas the never flooded iron stone topsoil parameters showed no particular tendency to be higher or lower in association with vegetation. Finally, less than half (9/26 and 12/26, respectively) of the samples from the two infrequently flooded zones (IFF and IFR) exhibited significant differences between the vegetated and non-vegetated topsoil samples, but where they occurred, these tended to be higher in the vegetated topsoil (near, 80% of the significantly different samples in both zones).
Significant differences between vegetated and non-vegetated topsoil samples were most evident for the macronutrients (28 out of 36 comparisons) and the parameters of pH, EC and organic matter (17/18 comparisons) across all the flood frequency zones. These parameters also tended to be higher for the vegetated (43 out of 45 statistically different comparisons) than the non-vegetated surfaces. In contrast, micronutrients and other trace elements returned fewer statistically significant differences (39 out of 84 comparisons). These parameters tended to be higher for the non-vegetated surfaces in the frequently flooded (FF) and ironstone (NFIS) zones but were otherwise typically higher for the vegetated surfaces.
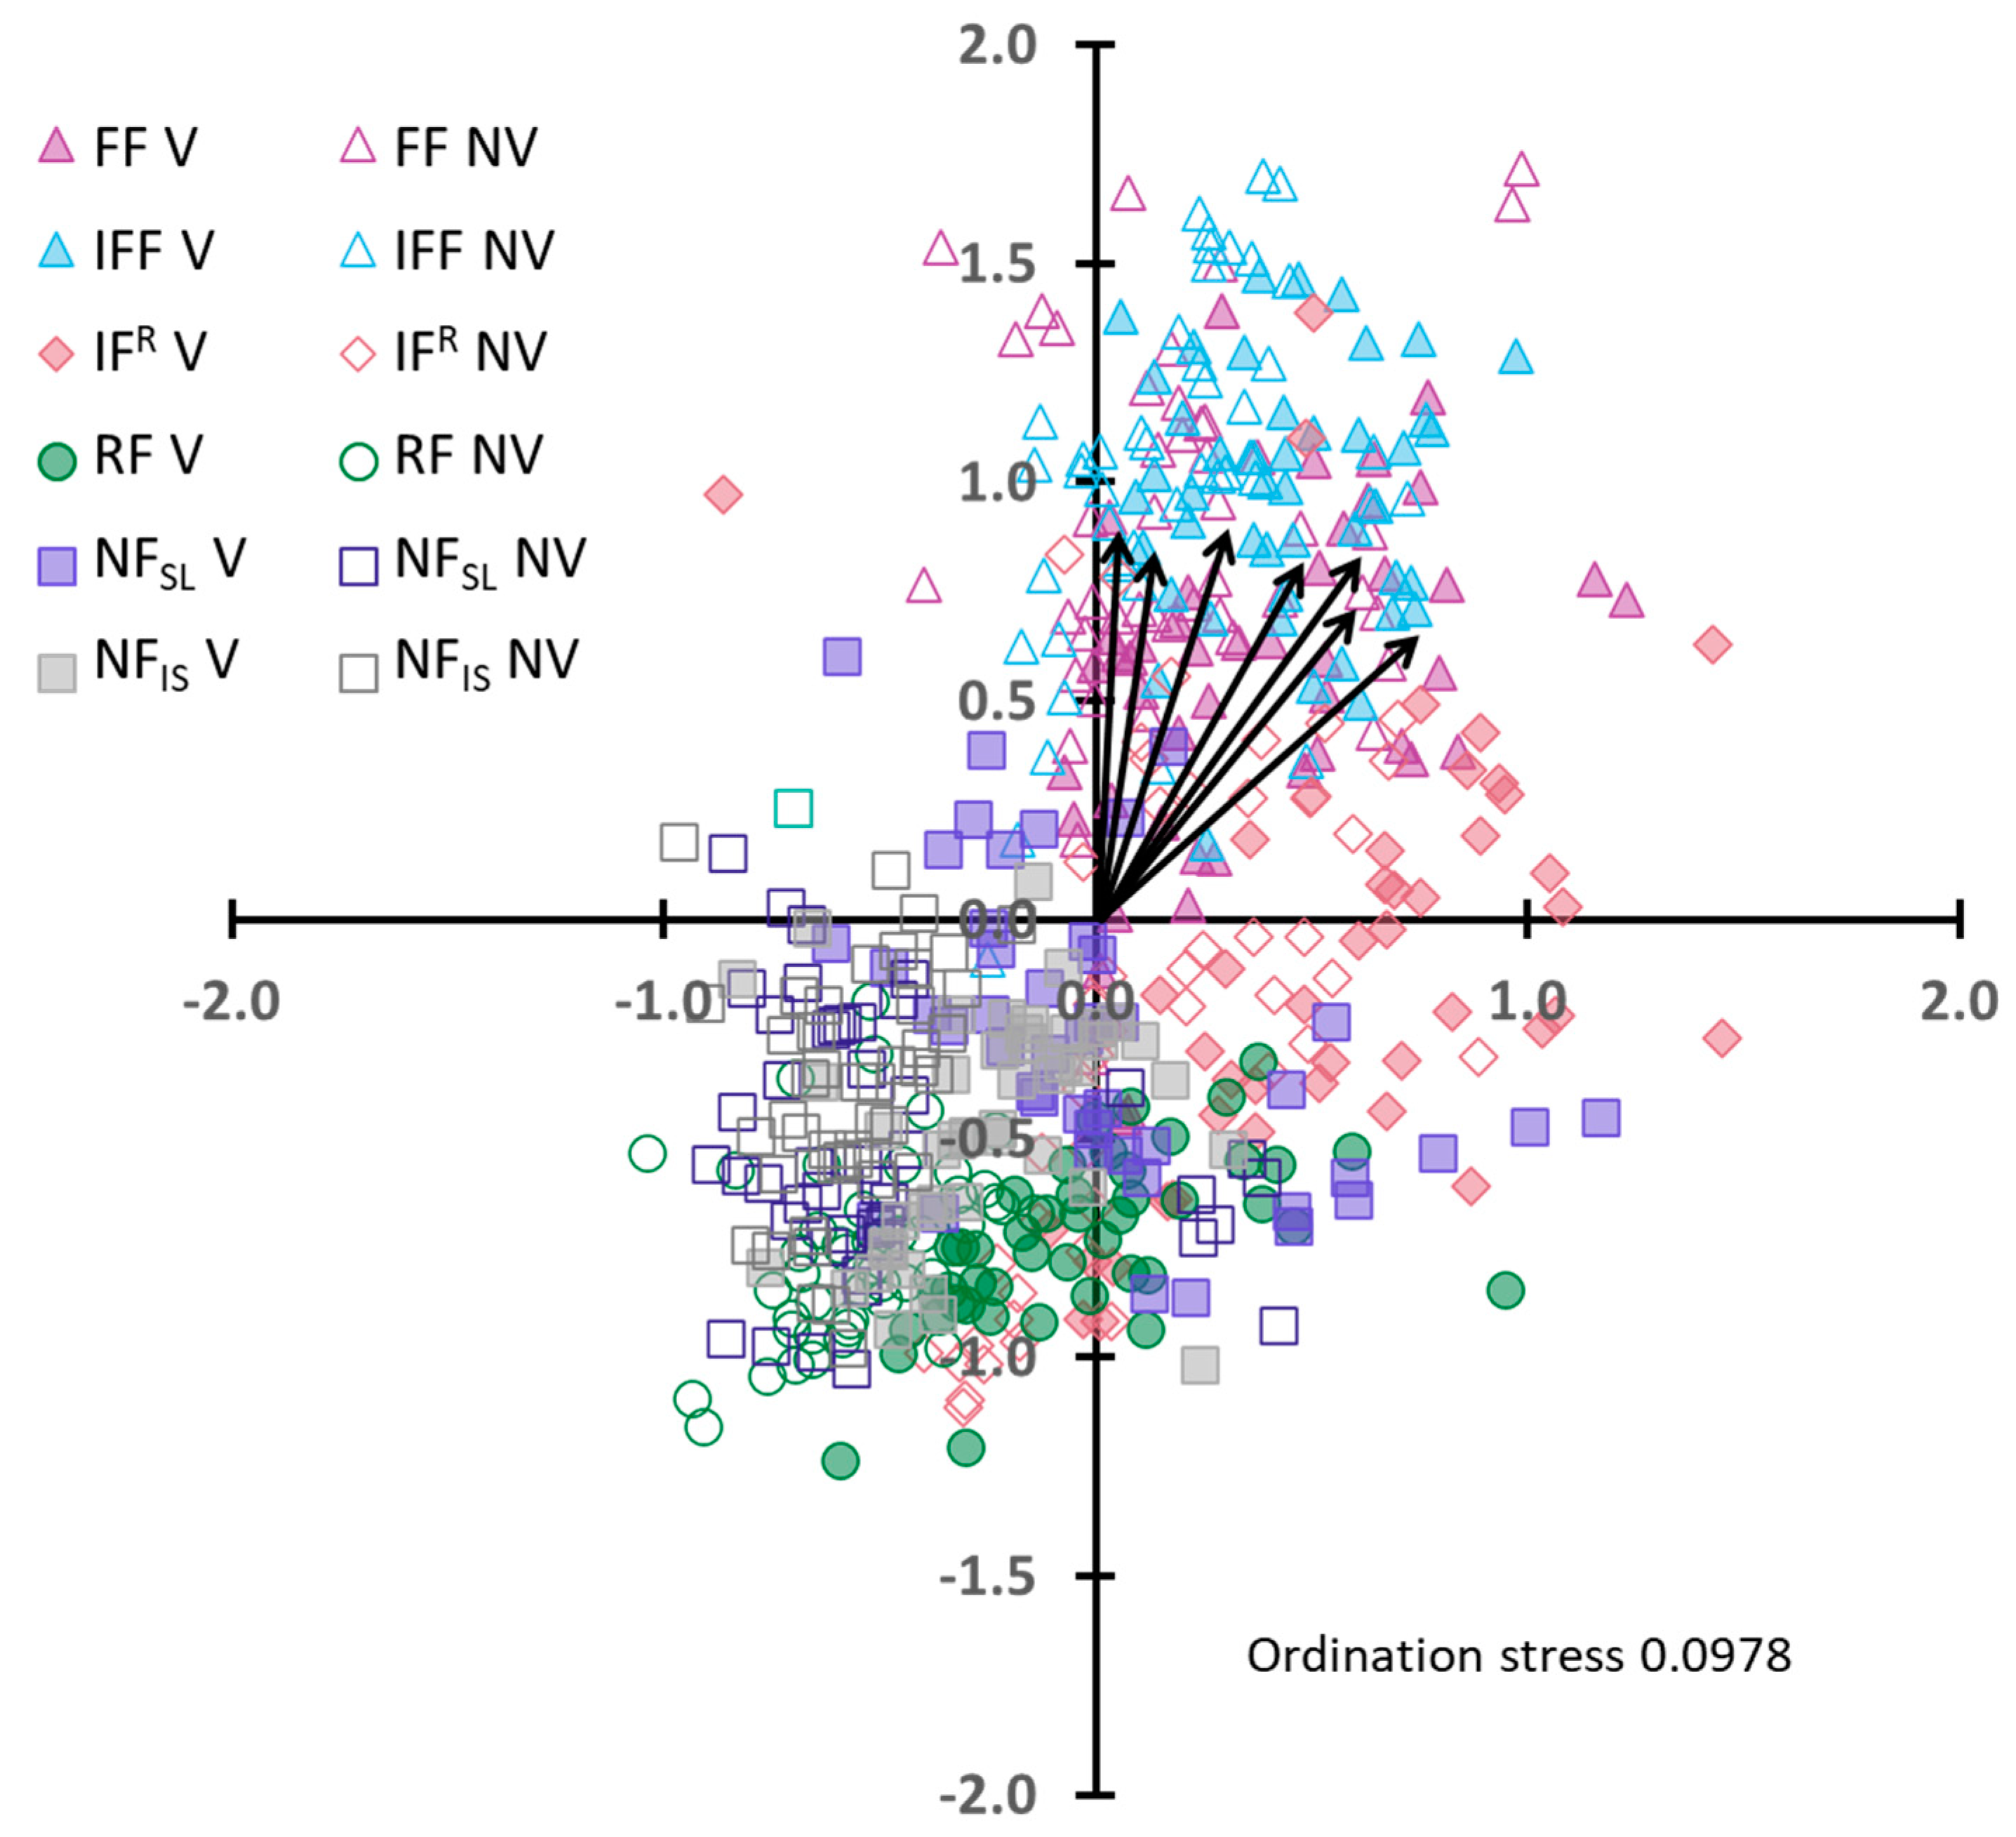
To further investigate whether flooding influenced topsoil character, a second MDS plot was produced that compares the vegetated and non-vegetated topsoils within each of the six flood frequency zones. This plot (Figure 6) indicates there is once again a high degree of overlap between vegetated and non-vegetated topsoils within most zones, and the ANOSIM results (Table 5) confirm that none of these six comparisons (V vs. NV for each of the six flood frequency zones) exhibits strong separation (all six returned R values of <0.750). However, the R values increase with decreasing flood frequency. Thus, R values are higher for comparisons of the vegetated (V) to non-vegetated (NV) topsoils in the rarely flooded (RF) and never flooded (NFSL and NFIS) zones (R values of 0.368, 0.408 and 0.341, respectively) than in the more frequently flooded zones. This suggests separation may be developing between the vegetated and non-vegetated topsoils in the less frequently flooded areas. The R values in the more frequently flooded (FF, IFF and IFR) zones are all below 0.250 (R values of 0.120, 0.177 and 0.233, respectively), suggesting the vegetated and non-vegetated topsoils within these zones are not different to one another when all the soil parameters are considered collectively.
3.3. Between Flood Frequency Zones
The ANOSIM data in Table 5 can also be used to compare the vegetated (or the non-vegetated) topsoil data between flood frequency zones. The R values for these comparisons tend to be high, especially between soils with relatively different flood recurrence intervals. For example, the R value for the comparison of the vegetated topsoil from the frequently flooded (FF) and intermediately flooded frequent (IFF) zones was 0.454 (i.e., FF V vs. IFF V in Table 5), indicating these two soil groups generally overlapped but had some minor separation. In contrast, the R values for comparisons between the vegetated frequently flooded (FF) and vegetated never flooded (NF) topsoil samples (i.e., FF V vs. NFIS V and FF V vs. NFSL V) both exceeded 0.800, indicating these were clearly different sample groups.
The summary statistics (mean and coefficient of variation) in Table 2 and Table 3 indicate that topsoil in the more frequently flooded zones (FF, IFF and IFR) tends to exhibit higher parameter values than topsoil in the less frequently flooded zones (RF, NFIS and NFSL). This finding is evident both for the vegetated (Table 2) and the non-vegetated (Table 3) samples.
4. Discussion
This study examined the spatial distribution of soil variables on the surface of a semi-arid floodplain in north-eastern Australia. The aim of the research was to identify whether the floodplain soils exhibit heterogenous patterning similar to that observed on semi-arid hillslopes, with the objective of determining the relative importance of flooding and vegetation enrichment in this system.
Research into semi-arid floodplains identifies the significance of flooding to ecosystems in these environments [58,59,60,61]. For example, [62] examined floodplain ecosystem responses to river control and climate change in the Lower Volga basin. Their research revealed that ecosystems transformed into mono-dominant vegetation communities in association with alterations in river flow and precipitation rates and timing. Research such as this highlights the importance of hydrologic connectivity to floodplain ecosystem composition, structure and resilience in semi-arid environments [63,64].
One aspect of the impact of flooding on semi-arid floodplain ecosystems is its relationship with soil processes. Studies of soil composition and microbial community distributions reveal that they are both influenced by the occurrence of flood events [65,66]. However, the nature of these distributions is complex, with semi-arid floodplains serving as both sources and sinks of the nutrients that support riparian ecosystems [67,68]. This leads to the question of whether it is possible to identify a relationship between flood occurrence and soil composition. To investigate this, the present study examined the spatial patterning of soil variables to see whether there is a link between topsoil heterogeneity and flood recurrence interval. The underlying presumption was that soils dominated by flood-related processes are likely to be more homogenous than those that experience less frequent flooding. This was informed by an understanding of the patterns of soil properties in semi-arid hillslopes that are not subject to flood events.
Semi-arid hillslopes are often comprised of patchy distributions of resource-rich vegetated ‘islands’ interspersed with sites of reduced to no plant cover [69,70]. These conditions, which can occur over a range of spatial scales, create highly dynamic and heterogenous landscapes [71,72] and contribute to ecosystem resilience in these regions [73,74].
Previous research into the spatial distribution of soil properties on semi-arid hillslopes indicated that their spatial diversity is closely related to the distribution of these resource islands [75,76,77]. Soils beneath vegetation are often resource sinks, with higher nutrient concentrations and soil moisture levels than adjacent non-vegetated soils [36,78], although the extent of this can be dependent on the dominant species [79]. This promotes the growth of plants that take advantage of those resource-rich conditions. However, plants also play a critical role in the formation of these resource-rich patches. For example, vegetation directly contributes organic material to the soil through the delivery of litter, while microbial and animal communities that play roles in nutrient cycling and delivery are preferentially active beneath vegetation canopies [80,81]. Vegetation also provides a protective cover to the soil, reducing raindrop erosion underneath the canopy, while litter mounds that accumulate beneath canopies help deflect runoff away from them [35,82]. This points to the crucial role vegetation plays as a controlling agent on semi-arid hillslopes.
This study investigated: (a) whether a similar relationship between vegetation and the spatial distribution of topsoil parameters can be observed in a semi-arid floodplain zone; and (b) the extent to which flooding influences topsoil character and, therefore, potentially impacts the resilience of these systems. To achieve this, soil parameters were compared between vegetated and non-vegetated floodplain topsoil samples collectively and within six flood frequency zones on a semi-arid floodplain in northern New South Wales, Australia. At the whole site scale (all flood frequency zones combined), when all 26 soil properties were considered together in a multivariate analysis, topsoil samples from beneath the vegetated and the non-vegetated surfaces were not statistically different. This indicates that at this scale, vegetation alone cannot be used to explain the spatial distribution of topsoil properties collectively. There were, however, significant differences between vegetated and non-vegetated sites for individual parameters, particularly for the characteristics of pH, EC, organic matter and macronutrients. In most cases and at the whole site scale, these parameters were higher in the vegetated topsoil than the non-vegetated topsoil. Thus, vegetation exerts an influence on semi-arid floodplain topsoil characteristics, but there is considerable noise within the data, and some of this may be explained in terms of flood history.
If the data are defined according to flood frequency zone, some evidence of the influence of flooding on topsoil character can be identified. When multivariate analyses are used to investigate the soil parameters collectively, there is no difference between the vegetated and non-vegetated topsoil in the more frequently inundated zones (FF and IFF—inundated every 1–10 years). This indicates that vegetation alone is not controlling the distribution of geochemical in the topsoil of this environment and potentially points to the role of flooding in reorganizing soil properties. In contrast, there is a growing separation between vegetated and non-vegetated soils in the less frequently (RF—inundated every 25–50 years) or never flooded (NFSL, NFIS) zones. Collectively, this indicates that topsoil properties in the study site are becoming increasingly patchy with decreasing flood frequency and suggests that semi-arid floodplain topsoil begins to resemble hillslope topsoil as flooding is reduced.
An examination of the individual (rather than lumped) soil parameters reveals that the micronutrients and other trace elements are somewhat unrelated and even negatively related to vegetation distribution for surfaces with flood recurrence intervals of up to about 20 years. Indeed, for surfaces that are frequently flooded (once every 1–2 years), the resource island phenomenon appears to be inverted, with high parameter values generally recorded for the non-vegetated topsoil. This suggests that at this flood interval, vegetation acts as a resource sink rather than the source that it becomes at lower flood intervals (>20 years). This also points to the role of flooding in redistributing nutrients across floodplain surfaces during overbank events.
For zones that are flooded on average every 7–20 years (IFF and IFR), the micronutrient and trace element parameters show little separation between the vegetated and non-vegetated surfaces, again suggesting that flooding is redistributing these resources homogeneously across the floodplain surface. Macronutrients, pH, EC and organic matter, on the other hand, tend to be higher under vegetation than away from it, pointing to the growing development of resource islands on these surfaces.
Combined, these results indicate that vegetation on the semi-arid floodplain surfaces of the study site produces nutrient clusters (or resource islands) analogous to those observed on semi-arid hillslopes [83,84], particularly as flood recurrence interval increases (or floods become less frequent). In addition, every soil property investigated within the study exhibited significant differences between the vegetated and non-vegetated topsoil samples in at least one flood frequency zone, suggesting that plants play a critical role in determining levels or concentrations of all the soil parameters considered in this study, even those not traditionally associated with biological controls and irrespective of the frequency of flood inundation. However, the strength and importance of vegetation as a determinant of topsoil character is directly related to the importance of the soil properties to the plants themselves. Thus, while critical plant nutrients, pH and organic matter are strongly related to the presence or absence of vegetation, other soil properties (such as micronutrients and other trace elements) are only weakly influenced by vegetation presence or absence.
Although resource islands were found to exist on both floodplain and hillslope (i.e., the non-flooded) surfaces at the study site, they are not ubiquitous across the landscape. Rather, resource islands were found to be: 1) common and strongly developed in rarely flooded and never flooded (hillslope) areas; 2) inverted in frequently flooded areas (where soil resources tend to be higher away from vegetation); and 3) undergoing development and strengthening in intermediately flooded areas (those that flood on average once every 10–20 years). Hence, this study provides some initial evidence as to the formation time of floodplain resource islands (i.e., 10–20 years) and shows that there is a distinct difference between vegetation-related topsoil heterogeneity on semi-arid floodplains and on hillslopes. In addition, this study shows the comparative strength of multi-scale influences on topsoil heterogeneity. Frequent floods overwhelm the vegetative topsoil redistribution processes that generate resource islands, but these vegetative processes become dominant once flood frequencies are reduced beyond about once in 10 years. Hence, within zones that infrequently or never flood, vegetation has an influence on the overall heterogeneity of the soils by contributing to the development of a binary surface of resource plenty (beneath vegetation) and resource scarcity (between vegetation).
The formation of resource clusters on semi-arid floodplains has significant ecological implications [85]. Once they have developed, resource islands exert a significant influence over the spatial distribution of nutrients, which can reciprocally affect other ecological processes [86,87]. Hence, perennial trees and shrubs tend not to encroach into the bare soil areas (between existing vegetation) because these zones are depleted in soil resources [88]. Consequently, changes to hydrology (e.g., in response to water resource development or climate change) that might result in reduced flood frequencies (e.g., altering a flood recurrence interval from less than to greater than once in 10 years) could irreversibly alter the spatial distribution of both vegetation and topsoil properties within semi-arid floodplains.
5. Conclusions
This study investigated whether soil parameter clustering (manifesting as patchiness) is evident in the topsoil of a semi-arid floodplain system and, if it is, aimed to identify the comparative influence of vegetation and flood enrichment on this process. The results indicate that vegetation plays a role in determining topsoil character on both the semi-arid hillslopes (that never flood) and the floodplains (that have varying flood frequency intervals) at this study site. However, the apparent strength of vegetation as an agent of topsoil modification depends on the scale of investigation, the frequency of inundation and the parameters under consideration. At the whole landscape scale and considering all soil properties collectively, the vegetated and non-vegetated topsoil was not statistically different. Within zones of different flood frequency intervals, however, variations between vegetated and non-vegetated topsoil become increasingly apparent as flood frequency decreases. The tendency for non-vegetated topsoils to exhibit higher parameter values than vegetated topsoils in the frequently flooded zones (RI = 1–2 yrs) suggests that inundation is a more important driver of soil spatial character in these areas. In contrast, the topsoil beneath vegetation in rarely and never flooded zones is very different to that away from the vegetation, with the vegetated surfaces exhibiting consistently higher values. Thus, the vegetation becomes an important controller of topsoil character as floods become increasingly rare or absent.
The nature of the vegetated topsoil could best be described as enriched relative to the non-vegetated topsoil in all zones except for the frequently flooded zone, but the differences are considerably more obvious in the rarer or never flooded zones. This enrichment is especially evident for critical plant nutrients, such as organic matter, Ca, N, P and S, but can also be seen, albeit to a lesser degree, in many other soil properties. Thus, the topsoil data indicate that the relative strength of vegetation as an agent of soil modification in semi-arid hillslope/floodplain environments (as evidenced by the presence or absence of resource islands) is closely related to the frequency of inundation, with vegetation becoming an important determinant of topsoil character at intermediate (i.e., 1-in-7 to 10 years) or longer flood recurrence intervals.
The current study suggests that semi-arid floodplains have low resilience to alterations in their wetting patterns, a finding that must be considered when water resource management decisions that might impact flood recurrence intervals are undertaken. If semi-arid floodplain ecosystems are to be effectively managed, it is essential that they receive relatively frequent floods. Failing to appreciate this may result in large-scale irreversible changes to soil character and concomitant impacts on the biological functioning of these systems, with more spatially homogenous floodplain topsoil environments effectively transforming to spatially heterogeneous hillslope topsoil environments with decreased flooding.
The findings of this study provide evidence of topsoil resource clustering on semi-arid floodplains; however, additional research is required to ascertain how pervasive this phenomenon is and to understand its implications for process functioning in these environments. Such work needs to focus on both small (e.g., within floodplain zones) and landscape scale processes to examine how these systems work. Collectively, such work also has the potential to contribute to the growing literature on connectivity in semi-arid environments.
Author Contributions
Conceptualization, T.-A.C.-M. and S.R.; methodology, T.-A.C.-M. and S.R.; formal analysis, T.-A.C.-M. and S.R.; investigation, T.-A.C.-M. and S.R.; writing—original draft preparation, T.-A.C.-M., S.R. and M.N.; writing—review and editing, T.-A.C.-M., S.R. and M.N.; visualization, T.-A.C.-M., S.R. and M.N.; supervision, S.R. and M.N.; All authors have read and agreed to the published version of the manuscript.
Funding
This research received no external funding.
Institutional Review Board Statement
Not applicable.
Informed Consent Statement
Not applicable.
Data Availability Statement
The data presented in this study are available on request from the corresponding author.
Acknowledgments
We would like to thank Rory and Joan Treweeke at Angledool Station for providing access to the field site and information about regional flooding. We would also like to thank Tom Savage, Andrew Malecki, Sue Fenechat, Katie Ashe and Amanda Fernandez for providing assistance with the laboratory work and Alicia Cook, Tim Morrison and Bec Herron for assistance with the fieldwork. We would also like to acknowledge the contributions of two anonymous reviewers whose comments greatly improved the quality of the manuscript.
Conflicts of Interest
The authors declare no conflict of interest.
References
- Hillman, T.J. Billabongs. In Limnology in Australia; de Deckker, P., Williams, W.D., Eds.; CSIRO Publishing: Melbourne, Australia, 1986; pp. 457–470. [Google Scholar]
- Ogden, R.; Reid, M.; Thoms, M. Soil fertility in a large dryland floodplain: Patterns, processes and the implications of water resource development. Catena 2007, 70, 114–126. [Google Scholar] [CrossRef]
- Mac Nally, R.; Cunningham, S.C.; Baker, P.J.; Horner, G.J.; Thomson, J.R. Dynamics of Murray-Darling floodplain forests under multiple stressors: The past, present, and future of an Australian icon. Water Resour. Res. 2011, 47, W00G05. [Google Scholar] [CrossRef]
- Leauthaud, C.; Kergoat, L.; Hiernaux, P.; Grippa, M.; Musila, W.; Duvail, S.; Albergel, J. Modelling the growth of floodplain grasslands to explore the impact of changing hydrological conditions on vegetation productivity. Ecol. Model. 2018, 387, 220–237. [Google Scholar] [CrossRef]
- Boon, P.I.; Frankenberg, J.; Hillman, T.; Oliver, R.; Shiel, R. Billabongs. In The Murray; Mackay, N., Eastburn, D., Eds.; Murray Darling Basin Commission: Canberra, Australia, 1990; pp. 167–181. [Google Scholar]
- Hillman, T.J.; Shiel, R.J. Macro- and microinvertebrates in Australian billabongs. Int. Ver. Theor. Angew. Limnol. 1991, 24, 1581–1587. [Google Scholar] [CrossRef]
- Kingsford, R.T.; Johnson, W. The impact of water diversions on colonially nesting waterbirds in the Macquarie Marshes in arid Australia. Colon. Waterbirds 1999, 21, 159–170. [Google Scholar] [CrossRef]
- Jansen, A.; Healey, M. Frog communities and wetland condition: Relationships with grazing by domestic livestock along an Australian floodplain river. Biol. Conserv. 2003, 109, 207–219. [Google Scholar] [CrossRef]
- Jolly, I.D.; McEwan, K.L.; Holland, K.L. A review of groundwater–surface water interactions in arid/semi-arid wetlands and the consequences of salinity for wetland ecology. Ecohydrology 2008, 1, 43–58. [Google Scholar] [CrossRef]
- Gell, P.A.; Reid, M.A.; Wilby, R.L. Management pathways for the floodplain wetlands of the southern Murray–Darling Basin: Lessons from history. River Res. Appl. 2019, 2019, 1291–1301. [Google Scholar] [CrossRef]
- Ford, D.J.; Cookson, W.R.; Adams, M.A.; Grierson, P.F. Role of soil drying in nitrogen mineralization and microbial community function in semi-arid grasslands of north-west Australia. Soil Biol. Biochem. 2007, 39, 1557–1569. [Google Scholar] [CrossRef]
- McIntyre, R.E.S.; Adams, M.A.; Grierson, P.F. Nitrogen mineralization potential in rewetted soils from a semi-arid stream landscape, north-west Australia. J. Arid Environ. 2009, 73, 48–54. [Google Scholar] [CrossRef]
- Junk, W.J.; Bayley, P.B.; Sparks, R.E. The flood pulse concept in river-floodplain systems. Can. Spec. Publ. Fish. Aquat. Sci. 1989, 106, 110–127. [Google Scholar]
- Thoms, M.C. Floodplain–river ecosystems: Lateral connections and the implications of human interference. Geomorphology 2003, 56, 335–349. [Google Scholar] [CrossRef]
- Olde Venterink, H.; Vermaat, J.E.; Pronk, M.; Wiegman, F.; van der Lee, G.E.M.; van den Hoorn, M.W.; Higler, L.W.G.; Verhoeven, J.T.A. Importance of sediment deposition and denitrification for nutrient retention in floodplain wetlands. Appl. Veg. Sci. 2006, 9, 163–174. [Google Scholar] [CrossRef]
- Prusty, B.A.K.; Chandra, R.; Azeez, P.A. Macronutrients along the sediment profile in a subtropical monsoonal wetland in India. Wetl. Ecol. Manag. 2010, 18, 91–105. [Google Scholar] [CrossRef]
- Steiger, J.; Gurnell, A.M. Spatial hydrogeomorphological influences on sediment and nutrient deposition in riparian zones: Observations from the Garonne River, France. Geomorphology 2002, 49, 1–23. [Google Scholar] [CrossRef]
- Ward, J.V.; Tockner, K.; Arscott, D.B.; Claret, C. Riverine landscape diversity. Freshw. Biol. 2002, 47, 517–539. [Google Scholar] [CrossRef]
- Reid, M.A.; Ogden, R.; Thoms, M.C. The influence of flood frequency, geomorphic setting and grazing on plant communities and plant biomass on a large dryland floodplain. J. Arid Environ. 2011, 75, 815–826. [Google Scholar] [CrossRef]
- Duarte, C.; Magurran, A.E.; Zuanon, J.; Deus, C.P. Trophic ecology of benthic fish assemblages in a lowland river in the Brazilian Amazon. Aquat. Ecol. 2019, 53, 707–718. [Google Scholar] [CrossRef]
- Sanchez-Carrillo, S.; Alvarez-Cobelas, M.; Angeler, D.G. Sedimentation in the semi-arid freshwater wetland Las Tablas De Daimiel (Spain). Wetlands 2001, 21, 112–124. [Google Scholar] [CrossRef]
- Baldwin, D.S.; Colloff, M.J.; Rees, G.N.; Chariton, A.A.; Watson, G.E.; Court, L.N.; Hartley, D.M.; Morgan, M.J.; King, A.J.; Wilson, J.S.; et al. Impacts of inundation and drought on eukaryote biodiversity in semi-arid floodplain soils. Mol. Ecol. 2013, 22, 1746–1758. [Google Scholar] [CrossRef]
- Higgisson, W.; Higgisson, B.; Powell, M.; Driver, P.; Dyer, F. Impacts of water resource development on hydrological connectivity of different floodplain habitats in a highly variable system. River Res. Appl. 2019, 36, 542–552. [Google Scholar] [CrossRef]
- Angers, D.A.; Caron, J. Plant-induced changes in soil structure: Processes and feedbacks. Biogeochemistry 1998, 42, 55–72. [Google Scholar] [CrossRef]
- Ehrenfeld, J.G.; Ravit, B.; Elgersma, K. Feedback in the plant-soil system. Annu. Rev. Environ. Resour. 2005, 30, 75–115. [Google Scholar] [CrossRef]
- Schlesinger, W.H.; Raikes, J.A.; Hartely, A.E.; Cross, A.F. On the spatial pattern of soil nutrients in desert ecosystems. Ecology 1996, 77, 364–375. [Google Scholar] [CrossRef]
- Schlesinger, W.H.; Pilmanis, A.M. Plant-soil interactions in deserts. Biogeochemistry 1998, 42, 169–187. [Google Scholar] [CrossRef]
- Thompson, D.B.; Walker, L.R.; Landau, F.H.; Stark, L.R. The influence of elevation, shrub species and biological soil crust on fertile islands in the Mojave Desert, USA. J. Arid Environ. 2005, 61, 609–629. [Google Scholar] [CrossRef]
- Butterfield, B.J.; Briggs, J.M. Patch dynamics of soil biotic feedbacks in the Sonoran Desert. J. Arid Environ. 2009, 73, 96–102. [Google Scholar] [CrossRef]
- Segoli, M.; Ungar, E.D.; Shachak, M. Fine-scale spatial heterogeneity of resource modulation in semi-arid “Islands of Fertility”. Arid Land Res. Manag. 2012, 26, 344–354. [Google Scholar] [CrossRef]
- Azcón-Aguilar, C.; Palenzuela, J.; Roldán, A. Analysis of the mycorrhizal potential in the rhizosphere of representative plant species from desertification-threatened Mediterranean shrublands. Appl. Soil Ecol. 2003, 22, 29–37. [Google Scholar] [CrossRef]
- Zaady, E.; Groffman, P.M.; Shachak, M. Litter as a regulator of N and C dynamics in macrophytic patches in Negev desert soils. Soil Biol. Biochem. 1996, 28, 39–46. [Google Scholar] [CrossRef]
- Whitford, W.G. Animal feedbacks in desertification: An overview. Rev. Chil. Hist. Nat. 1993, 66, 243–251. [Google Scholar]
- Ridolfi, L.; Laio, F.; D’Odorico, P. Fertility island formation and evolution in dryland ecosystems. Ecol. Soc. 2008, 13, 5. Available online: http://www.ecologyandsociety.org/vol13/iss1/art5/ (accessed on 3 June 2022). [CrossRef]
- Neave, M.; Abrahams, A.D. Impact of small mammal disturbances on sediment yield from grassland and shrubland ecosystems in the Chihuahuan Desert. Catena 2001, 44, 285–303. [Google Scholar] [CrossRef]
- Neave, M.; Rayburg, S. Nonlinear biofluvial responses to vegetation change in a semiarid environment. Geomorphology 2007, 89, 217–239. [Google Scholar] [CrossRef]
- Cheng, F.-S.; Zeng, D.-H.; He, X.-Y. Small-Scale spatial variability of soil nutrients and vegetation properties in semi-arid Northern China. Pedosphere 2006, 16, 778–787. [Google Scholar] [CrossRef]
- Dean, W.R.J.; Milton, S.J.; Jeltsch, F. Large trees, fertile islands and birds in arid savanna. J. Arid Environ. 1999, 41, 61–78. [Google Scholar] [CrossRef]
- Maestre, F.T.; Reynolds, J.F. Small-scale spatial heterogeneity in the vertical distribution of soil nutrients has limited effects on the growth and development of Prosopis glandulosa seedlings. Plant Ecol. 2006, 183, 65–75. [Google Scholar] [CrossRef]
- Neave, M.; Rayburg, S. A field investigation into the effects of progressive rainfall-induced soil seal and crust development on runoff and erosion rates: The impact of surface cover. Geomorphology 2007, 87, 378–390. [Google Scholar] [CrossRef]
- Ludwig, J.A.; Tongway, D.J. Spatial organisation of landscapes and its function in semi-arid woodlands, Australia. Landsc. Ecol. 1995, 10, 51–63. [Google Scholar] [CrossRef]
- Collins, B.; Wein, G. Soil Heterogeneity effects on canopy structure and composition during early succession. Plant Ecol. 1998, 138, 217–230. [Google Scholar] [CrossRef]
- Kroes, D.E.; Brinson, M.M. Occurrence of riverine wetlands of floodplains along a climatic gradient. Wetlands 2004, 24, 167–177. [Google Scholar] [CrossRef]
- James, C.S.; Thoms, M.C.; Quinn, G.P. Zooplankton dynamics from inundation to drying in a complex ephemeral floodplain-wetland. Aquat. Sci. 2008, 70, 259–271. [Google Scholar] [CrossRef]
- Gergel, S. Assessing cumulative impacts of levees and dams on floodplain ponds: A neutral-terrain model approach. Ecol. Appl. 2002, 12, 1740–1754. [Google Scholar] [CrossRef]
- Kirby, M.; Evans, R.; Walker, G.; Cresswell, R.; Coram, J.; Khan, S.; Paydar, Z.; Mainuddin, M.; McKenzie, N.; Ryan, S. The Shared Water Resources of the Murray-Darling Basin. Part I in a Two Part Series on the Shared Water Resources of the Murray-Darling Basin Prepared for the Murray-Darling Basin Commission; MDBC Publication: Canberra, Australia, 2006. [Google Scholar]
- Kingsford, R.T. Ecological impacts of dams, water diversions and river management on floodplain wetlands in Australia. Austral Ecol. 2000, 25, 109–127. [Google Scholar] [CrossRef]
- Semeniuk, V.; Semeniuk, C.A. A geomorphic approach to global classification for natural inland wetlands and rationalization of the system used by the Ramsar Convention—A discussion. Wetl. Ecol. Manag. 1997, 5, 145–158. [Google Scholar] [CrossRef]
- Castañeda, C.; Herrero, J.; Auxiliadora Casterad, M. Landsat monitoring of laya-lakes in the Spanish monegros desert. J. Arid Environ. 2005, 63, 497–516. [Google Scholar] [CrossRef]
- Minckley, T.A.; Turner, D.S.; Weinstein, S.R. The relevance of wetland conservation in arid regions: A re-examination of vanishing communities in the American Southwest. J. Arid Environ. 2013, 88, 213–221. [Google Scholar] [CrossRef]
- Rayburg, S.; Thoms, M. A coupled hydraulic modeling approach to driving a water balance model for a complex floodplain wetland system. Hydrol. Res. 2009, 40, 364–379. [Google Scholar] [CrossRef]
- Rolls, R.J.; Wilson, G.G. Spatial and temporal patterns in fish assemblages following an artificial extended floodplain inundation event, Northern Murray-Darling Basin, Australia. Environ. Manag. 2010, 45, 822–833. [Google Scholar] [CrossRef]
- Bureau of Meteorology, 2015. Climate Data Online. Viewed 20 January 2019. Available online: https://www.bom.gov.au/climate/data/ (accessed on 20 January 2019).
- Rayburg, S.; Thoms, M.; Lenon, E. Unraveling the physical template of a terminal flood plain-wetland sediment storage system. In Sediment Dynamics and the Hydrology of Fluvial Systems, Proceedings of a Symposium held in Dundee, UK, July 2006; IAHS Publication: Wallingford, UK, 2006; Volume 306, pp. 304–313. [Google Scholar]
- King, D.P. Vegetation Communities of the Northern Floodplains Western New South Wales; Northern Floodplains Regional Planning Committee: Walgett, Australia, 2004. [Google Scholar]
- Condon, R.W. Angledool Station—New Angledool; Western Lands Commission: Sydney, Australia, 1975. [Google Scholar]
- Rayment, G.; Lyons, D. Soil Chemical Methods—Australasia; CSIRO Publishing: Collingwood, Australia, 2010; 495p. [Google Scholar]
- James, C.S.; Capon, S.J.; Quinn, G.P. Nurse plant effects of a dominant shrub (Duma florulenta) on understorey vegetation in a large, semiarid wetland in relation to flood frequency and drying. J. Veg. Sci. 2015, 26, 985–994. [Google Scholar] [CrossRef]
- James, C.S.; Capon, S.J.; White, M.G.; Rayburg, S.C.; Thoms, M.C. Spatial variability of the soil seed bank in a heterogeneous ephemeral wetland system in semi-arid Australia. Plant Ecol. 2007, 190, 205–217. [Google Scholar] [CrossRef]
- Fernando, D.R.; Lynch, J.P.; Reichman, S.M.; Clark, G.J.; Miller, R.E.; Doody, T.M. Inundation of a floodplain lake woodlands system: Nutritional profiling and benefit to mature Eucalyptus largiflorens (Black Box) trees. Wetl. Ecol. Manag. 2018, 26, 961–975. [Google Scholar] [CrossRef]
- Kobayashi, T.; Ralph, T.J.; Sharma, P.; Mitrovic, S.M. Influence of historical inundation frequency on soil microbes (Cyanobacteria, Proteobacteria, Actinobacteria) in semi-arid floodplain wetlands. Mar. Freshw. Res. 2020, 71, 617. [Google Scholar] [CrossRef]
- Kuzmina, Z.V.; Treshkin, S.E.; Shinkarenko, S.S. Effects of river control and climate changes on the dynamics of the terrestrial ecosystems of the Lower Volga region. Arid Ecosyst. 2018, 8, 231–244. [Google Scholar] [CrossRef]
- Capon, S.J. Plant community responses to wetting and drying in a large arid floodplain. River Res. Appl. 2003, 19, 509–520. [Google Scholar] [CrossRef]
- Sandi, S.G.; Saco, P.M.; Saintilan, N.; Wen, L.; Riccardi, G.; Kuczera, G.; Willgoose, G.; Rodríguez, J.F. Detecting inundation thresholds for dryland wetland vulnerability. Adv. Water Resour. 2019, 128, 168–182. [Google Scholar] [CrossRef]
- Thapa, R.; Thoms, M.; Parsons, M. An adaptive cycle hypothesis of semi-arid floodplain vegetation productivity in dry and wet resource states. Ecohydrology 2016, 9, 39–51. [Google Scholar] [CrossRef]
- Argiroff, W.A.; Zak, D.R.; Lanser, C.M.; Wiley, M.J. Microbial community functional potential and composition are shaped by hydrologic connectivity in riverine floodplain soils. Microb. Ecol. 2017, 73, 630–644. [Google Scholar] [CrossRef]
- Wohl, E.; Knox, R.L. A first-order approximation of floodplain soil organic carbon stocks in a river network: The South Platte River, Colorado, USA as a case study. Sci. Total Environ. 2022, 852, 158507. [Google Scholar] [CrossRef]
- Morra, B.; Brisbin, H.; Stringham, T.; Sullivan, B.W. Ecosystem carbon and nitrogen gains following 27 years of grazing management in a semiarid alluvial valley. J. Environ. Manag. 2023, 337, 117724. [Google Scholar] [CrossRef]
- Barbosa-Briones, E.; Cardona-Benavides, A.; Reyes-Hernández, H.; Muñoz-Robles, C. Ecohydrological function of vegetation patches in semi-arid shrublands of central Mexico. J. Arid Environ. 2019, 168, 36–45. [Google Scholar] [CrossRef]
- Davids, L.; Pryke, J.S.; Seymour, C.L. High species turnover of arthropod communities associated with distinct vegetation patches (“heuweltjies”) in an arid shrubland. J. Arid Environ. 2023, 213, 104967. [Google Scholar] [CrossRef]
- D’Odorico, P.; Okin, G.S.; Bestelmeyer, B.T. A synthetic review of feedbacks and drivers of shrub encroachment in arid grasslands. Ecohydrology 2012, 5, 520–530. [Google Scholar] [CrossRef]
- Stewart, J.; Parsons, A.J.; Wainwright, J.; Okin, G.S.; Bestelmeyer, B.T.; Fredrickson, L.; Schlesinger, W.H. Modeling emergent patterns of dynamic desert ecosystems. Ecol. Monogr. 2014, 84, 373–410. [Google Scholar] [CrossRef]
- Morris, L.R.; Monaco, T.A.; Blank, R.; Sheley, R.L. Long-term redevelopment of resource islands in shrublands of the great basin, USA. Ecosphere 2013, 4, 12. [Google Scholar] [CrossRef]
- Harman, C.J.; Lohse, K.A.; Troch, P.A.; Sivapalan, M. Spatial patterns of vegetation, soils, and microtopography from terrestrial laser scanning on two semiarid hillslopes of contrasting lithology. J. Geophys. Res. Biogeosci. 2014, 119, 163–180. [Google Scholar] [CrossRef]
- Boyd, D.S.; Davies, K.W. Differential seedling performance and environmental correlates in shrub canopy vs. interspace microsites. J. Arid Environ. 2012, 87, 50–57. [Google Scholar] [CrossRef]
- Chimal-Sánchez, E.; Montaño, N.O.; Camargo-Ricalde, S.L.; García-Sánchez, R.; Hernández Cuevas, L.V. Endemic Mimosa species, forming resource islands or not, and rainfall seasonality jointly influence arbuscular mycorrhizal fungi communities in a semiarid ecosystem of Mexico. Trees 2022, 36, 609–625. [Google Scholar] [CrossRef]
- Vogel, B.; Rostagno, C.M.; Molina, L.; Antilef, M.; La Manna, L. Cushion shrubs encroach subhumid rangelands and form fertility islands along a grazing gradient in Patagonia. Plant Soil 2022, 475, 623–643. [Google Scholar] [CrossRef]
- Minnick, T.J.; Alward, R.D. Plant-soil feedbacks and the partial recovery of soil spatial patterns on abandoned well pads in a sagebrush shrubland. Ecol. Appl. 2015, 25, 3–10. [Google Scholar] [CrossRef]
- García-Sánchez, R.; Camargo-Ricalde, S.L.; García-Moya, E.; Luna-Cavazos, M.; Romero-Manzanares, A.; Manuel Montaño, N. Prosopis laevigata and Mimosa biuncifera (Leguminosae), jointly influence plant diversity and soil fertility of a Mexican semiarid ecosystem. Rev. Biol. Trop./Int. J. Trop. Biol. Conserv. 2012, 60, 87–103. [Google Scholar] [CrossRef]
- Aguilera, L.E.; Gutiérrez, J.R.; Meserve, P.L. Variation in soil micro-organisms and nutrients underneath and outside the canopy of Adesmia bedwellii (Papilionaceae) shrubs in arid coastal Chile following drought and above average rainfall. J. Arid. Environ. 1999, 42, 61–70. [Google Scholar] [CrossRef]
- Hortal, S.; Bastida, F.; Armas, C.; Lozano, Y.M.; Moreno, J.L.; García, C.; Pugnaire, F.I. Soil microbial community under a nurse-plant species changes in composition, biomass and activity as the nurse grows. Soil Biol. Biochem. 2013, 64, 139–146. [Google Scholar] [CrossRef]
- Ludwig, J.A.; Wilcox, B.P.; Breshears, D.D.; Tongway, D.J.; Imeson, A.C. Vegetation patches and runoff-erosion as interacting ecohydrological processes in semiarid landscapes. Ecology 2005, 86, 288–297. [Google Scholar] [CrossRef]
- Maestre, F.T.; Cortina, J. Spatial patterns of surface soil properties and vegetation in a Mediterranean semi-arid steppe. Plant Soil 2002, 241, 279–291. [Google Scholar] [CrossRef]
- Yao, Y.; Shao, M.; Fu, X.; Wang, X.; Wei, X. Effects of shrubs on soil nutrients and enzymatic activities over a 0–100 cm soil profile in the desert-loess transition zone. Catena 2019, 174, 362–370. [Google Scholar] [CrossRef]
- Hanan, E.J.; Ross, M.S. Across scale patterning of plant-soil-water interactions surrounding tree islands in Southern Everglades landscapes. Landsc. Ecol. 2010, 25, 463–476. [Google Scholar] [CrossRef]
- Maestre, F.T.; Eldridge, D.J.; Soliveres, S.; Kefi, S.; Delgado-Baquerizo, M.; Bowker, M.A.; Garcıa-Palacios, P.; Gaitan, J.; Gallardo, A.; Lazaro, R.; et al. Structure and functioning of dryland ecosystems in a changing world. Annu. Rev. Ecol. Evol. Syst. 2016, 47, 215–237. [Google Scholar] [CrossRef]
- Baartman, J.E.M.; Temme, A.J.A.M.; Saco, P.M. The effect of landform variation on vegetation patterning and related sediment dynamics. Earth Surf. Process. Landf. 2018, 43, 2121–2135. [Google Scholar] [CrossRef]
- Li, W.; Li, X.; Huang, Y.; Wang, P.; Zhang, C. Spatial patch structure and adaptive strategy for desert shrub of Reaumuria soongorica in arid ecosystem of the Heihe River Basin. J. Geogr. Sci. 2019, 29, 1507–1526. [Google Scholar] [CrossRef]
Figure 1.
Site map illustrating: (a) the location of Angledool Station in New South Wales, Australia; (b) the location of Angledool Station within the context of the lower Narran River system (broken red line indicates approximate position of the Narran River channel).
Figure 1.
Site map illustrating: (a) the location of Angledool Station in New South Wales, Australia; (b) the location of Angledool Station within the context of the lower Narran River system (broken red line indicates approximate position of the Narran River channel).

Figure 2.
Landscape units identified on Angledool Station in New South Wales, Australia and the location of the six study sites (three replicates sampled in each site).
Figure 2.
Landscape units identified on Angledool Station in New South Wales, Australia and the location of the six study sites (three replicates sampled in each site).

Figure 3.
Typical examples of surfaces and vegetation in the six flood frequency zones of Angledool Station in New South Wales, Australia: (a) Frequently Flooded zone (FF = RI of 1:1–2 yrs); (b) Intermediately Flooded Frequent zone (IFF = RI of 1:7–10 yrs); (c) Intermediately Flooded Rare zone (IFR = RI of 1:10–20 yrs): (d) Rarely Flooded zone (RF = RI of 1:25–50 yrs); (e) Never Flooded Sandy Loam zone (NFSL); (f) Never Flooded Ironstone zone (NFIS).

Figure 4.
Outline of the topsoil sample collection and analysis strategy employed in this study. A total of 14,040 data points were used in the analyses. Schemes follow the same formatting.
Figure 4.
Outline of the topsoil sample collection and analysis strategy employed in this study. A total of 14,040 data points were used in the analyses. Schemes follow the same formatting.

Figure 5.
Multi-dimensional scaling (MDS) plot comparing the soil properties of vegetated and non-vegetated topsoil samples on Angledool Station in New South Wales, Australia. Note: Arrows on plot indicate directions of geochemical enrichment for the following elements listed in order of increasing distance along the x-axis: Pb, Fe, Al, Ni, Cu, An, Mg.

Figure 6.
Multi-dimensional scaling (MDS) plot comparing the soil properties for vegetated and non-vegetated topsoil samples in six flood frequency zones on Angledool Station in New South Wales, Australia. Note: Arrows on plot indicate directions of geochemical enrichment for the following elements listed in order of increasing distance along the x-axis: Pb, Fe, Al, Ni, Cu, An, Mg. FF = Frequently Flooded; IFF = Intermediately Flooded Frequent; IFR = Intermediately Flooded Rare; RF = Rarely Flooded, NFSL = Never Flooded Sandy Loam, NFIS = Never Flooded Ironstone. V = vegetated, NV = non-vegetated.


Table 1.
Summary Statistics and Mann–Whitney U results for the soil properties of vegetated and non-vegetated surfaces on Angledool Station in northern New South Wales, Australia.
Table 1.
Summary Statistics and Mann–Whitney U results for the soil properties of vegetated and non-vegetated surfaces on Angledool Station in northern New South Wales, Australia.
| Vegetated (V) | Non-Vegetated (NV) | V vs. NV | |||
|---|---|---|---|---|---|
| Parameter | Mean | CV | Mean | CV | p |
| pH | 6.54 | 0.06 | 5.96 | 0.11 | <0.0001 |
| EC (µS/cm) | 170.4 | 0.66 | 63.0 | 0.68 | <0.0001 |
| OM (%) | 1.83 | 0.78 | 0.71 | 0.91 | <0.0001 |
| Clay (%) | 16.2 | 0.54 | 18.7 | 0.46 | <0.0001 |
| Silt (%) | 78.0 | 0.11 | 75.0 | 0.10 | <0.0001 |
| Sand (%) | 5.73 | 0.77 | 6.28 | 0.77 | 0.247 |
| Macronutrients | |||||
| Ca | 2974 | 0.88 | 1639 | 0.80 | <0.0001 |
| K | 2870 | 0.71 | 2561 | 0.71 | 0.033 |
| Mg | 2204 | 0.71 | 2099 | 0.80 | 0.027 |
| N | 1451.4 | 0.64 | 561.9 | 1.01 | <0.0001 |
| P | 254.4 | 0.32 | 202.4 | 0.33 | <0.0001 |
| S | 139.6 | 0.61 | 55.9 | 0.69 | <0.0001 |
| Micronutrients | |||||
| Cu | 9.31 | 0.34 | 9.47 | 0.41 | 0.835 |
| Fe | 16,960 | 0.48 | 18,045 | 0.51 | 0.328 |
| Mn | 390.5 | 0.51 | 376.9 | 0.63 | 0.153 |
| Ni | 12.0 | 0.51 | 12.3 | 0.60 | 0.925 |
| Zn | 25.7 | 0.59 | 25.0 | 0.65 | 0.170 |
| Other | |||||
| Al | 21,398 | 0.52 | 22,188 | 0.57 | 0.979 |
| Ba | 1088.9 | 3.96 | 894.2 | 3.93 | 0.174 |
| Co | 7.99 | 0.91 | 7.74 | 0.55 | 0.835 |
| Cr | 21.1 | 0.37 | 22.9 | 0.43 | 0.106 |
| Na | 127.5 | 1.15 | 146.0 | 1.17 | 0.541 |
| Pb | 6.06 | 0.45 | 6.36 | 0.48 | 0.243 |
| Sr | 34.6 | 0.78 | 22.9 | 0.74 | <0.0001 |
| Ti | 201.7 | 0.47 | 233.9 | 0.45 | <0.0001 |
| V | 33.6 | 0.47 | 37.1 | 0.52 | 0.083 |
Note: Shaded signifies highest mean value for each statistically different pair-wise comparison. Bold indicates statistically significant Mann–Whitney values (p < 0.05). All geochemistry parameters are in ppm.
Table 2.
Summary statistics for the soil properties of vegetated (V) surfaces within the six flood frequency zones on Angledool Station in northern New South Wales, Australia.
Table 2.
Summary statistics for the soil properties of vegetated (V) surfaces within the six flood frequency zones on Angledool Station in northern New South Wales, Australia.
| FF | IFF | IFR | RF | NFSL | NFIS | |||||||
|---|---|---|---|---|---|---|---|---|---|---|---|---|
| Parameter | Mean | CV | Mean | CV | Mean | CV | Mean | CV | Mean | CV | Mean | CV |
| pH | 6.42 | 0.02 | 6.87 | 0.02 | 6.58 | 0.03 | 6.52 | 0.06 | 6.65 | 0.08 | 6.21 | 0.08 |
| EC (µS/cm) | 117.8 | 0.37 | 167.4 | 0.36 | 231.1 | 0.37 | 103.6 | 0.56 | 290.7 | 0.52 | 111.8 | 0.83 |
| OM% | 1.48 | 0.52 | 1.32 | 0.50 | 3.59 | 0.63 | 1.70 | 0.57 | 1.89 | 0.49 | 1.05 | 0.48 |
| Clay% | 14.0 | 0.17 | 18.2 | 0.49 | 11.3 | 0.39 | 17.0 | 0.68 | 13.5 | 0.47 | 23.5 | 0.41 |
| Silt% | 73.9 | 0.04 | 74.4 | 0.10 | 83.8 | 0.06 | 79.7 | 0.14 | 81.8 | 0.07 | 74.7 | 0.12 |
| Sand% | 12.15 | 0.29 | 7.48 | 0.32 | 4.97 | 0.33 | 3.25 | 0.42 | 4.76 | 1.00 | 1.79 | 1.01 |
| Macronutrients | ||||||||||||
| Ca | 2877.8 | 0.26 | 3343.4 | 0.18 | 5301.5 | 0.82 | 2363.7 | 0.95 | 2759.9 | 0.93 | 1196.4 | 0.56 |
| K | 3010.3 | 0.24 | 6097.9 | 0.16 | 4200.9 | 0.42 | 1166.7 | 0.63 | 1346.1 | 0.26 | 1396.0 | 0.23 |
| Mg | 3489.5 | 0.20 | 4285.6 | 0.18 | 2834.1 | 0.46 | 1052.2 | 0.37 | 893.3 | 0.27 | 671.8 | 0.30 |
| N | 1006.5 | 0.58 | 1311.2 | 0.43 | 2637.1 | 0.48 | 1176.3 | 0.52 | 1620.3 | 0.38 | 957.1 | 0.50 |
| P | 230.8 | 0.36 | 195.4 | 0.19 | 274.3 | 0.37 | 287.5 | 0.33 | 283.6 | 0.23 | 254.9 | 0.21 |
| S | 106.1 | 0.44 | 123.1 | 0.31 | 242.8 | 0.52 | 120.5 | 0.49 | 150.1 | 0.44 | 95.0 | 0.42 |
| Micronutrients | ||||||||||||
| Cu | 10.70 | 0.20 | 13.41 | 0.13 | 10.23 | 0.28 | 5.85 | 0.22 | 8.12 | 0.25 | 7.58 | 0.19 |
| Fe | 25,297.9 | 0.21 | 26,911.2 | 0.15 | 15,234.2 | 0.37 | 9664.2 | 0.50 | 13,637.3 | 0.33 | 11,015.3 | 0.22 |
| Mn | 530.2 | 0.27 | 609.1 | 0.15 | 175.8 | 0.41 | 215.3 | 0.64 | 357.9 | 0.42 | 454.8 | 0.25 |
| Ni | 18.15 | 0.19 | 19.43 | 0.13 | 12.11 | 0.38 | 5.80 | 0.46 | 9.05 | 0.27 | 7.36 | 0.38 |
| Zn | 41.3 | 0.21 | 44.8 | 0.20 | 27.3 | 0.37 | 11.6 | 0.46 | 15.0 | 0.26 | 14.3 | 0.25 |
| Other | ||||||||||||
| Al | 33,346.8 | 0.21 | 36,325.5 | 0.14 | 18,759.3 | 0.38 | 11,237.7 | 0.19 | 16,051.7 | 0.27 | 12,667.8 | 0.20 |
| Ba | 106.2 | 0.26 | 134.1 | 0.15 | 87.9 | 0.31 | 44.1 | 0.31 | 6121.4 | 1.47 | 39.6 | 0.40 |
| Co | 11.02 | 0.20 | 13.36 | 0.12 | 5.36 | 0.43 | 6.31 | 2.47 | 6.14 | 0.30 | 5.75 | 0.21 |
| Cr | 26.9 | 0.26 | 28.5 | 0.13 | 17.7 | 0.32 | 14.8 | 0.39 | 20.7 | 0.40 | 18.3 | 0.29 |
| Na | 146.7 | 0.22 | 387.6 | 0.42 | 74.8 | 0.30 | 35.3 | 0.49 | 34.4 | 0.37 | 86.2 | 1.21 |
| Pb | 7.80 | 0.30 | 9.75 | 0.21 | 5.54 | 0.30 | 3.19 | 0.49 | 5.31 | 0.26 | 4.78 | 0.18 |
| Sr | 36.9 | 0.21 | 45.3 | 0.14 | 60.9 | 0.76 | 27.9 | 0.78 | 22.4 | 0.61 | 14.2 | 0.52 |
| Ti | 272.9 | 0.29 | 307.2 | 0.29 | 115.2 | 0.36 | 125.3 | 0.29 | 227.0 | 0.29 | 162.5 | 0.24 |
| V | 48.2 | 0.31 | 45.2 | 0.17 | 30.3 | 0.39 | 20.6 | 0.85 | 32.0 | 0.37 | 25.2 | 0.23 |
Note: FF = Frequently Flooded, IFF = Intermediately Flooded Frequent, IFR = Intermediately Flooded Rare, RF = Rarely Flooded, NFSL = Never Flooded Sandy Loam, NFIS = Never Flooded Ironstone. Bold = Highest mean value across all floodplain zones for that specific parameter. Underline = Lowest mean value across all floodplain zones for that specific parameter. All geochemistry parameters are in ppm.
Table 3.
Summary Statistics for the soil properties of non-vegetated (NV) surfaces within the six flood frequency zones on Angledool Station in northern New South Wales, Australia.
Table 3.
Summary Statistics for the soil properties of non-vegetated (NV) surfaces within the six flood frequency zones on Angledool Station in northern New South Wales, Australia.
| FF | IFF | IFR | RF | NFSL | NFIS | |||||||
|---|---|---|---|---|---|---|---|---|---|---|---|---|
| Parameter | Mean | CV | Mean | CV | Mean | CV | Mean | CV | Mean | CV | Mean | CV |
| pH | 6.47 | 0.04 | 6.84 | 0.02 | 6.15 | 0.03 | 5.36 | 0.06 | 5.50 | 0.09 | 5.42 | 0.05 |
| EC (µS/cm) | 79.3 | 0.24 | 83.6 | 0.27 | 99.9 | 0.44 | 30.3 | 0.62 | 68.2 | 0.73 | 16.5 | 0.35 |
| OM % | 0.73 | 0.51 | 0.52 | 0.53 | 1.30 | 0.98 | 0.59 | 0.44 | 0.67 | 0.54 | 0.46 | 0.35 |
| Clay % | 13.6 | 0.23 | 16.7 | 0.29 | 18.3 | 0.26 | 23.0 | 0.61 | 17.9 | 0.45 | 22.6 | 0.34 |
| Silt % | 72.9 | 0.05 | 74.0 | 0.07 | 76.7 | 0.06 | 73.1 | 0.17 | 78.6 | 0.08 | 75.0 | 0.10 |
| Sand % | 13.51 | 0.31 | 9.39 | 0.29 | 4.99 | 0.43 | 3.91 | 0.70 | 3.45 | 0.88 | 2.45 | 0.63 |
| Macronutrients | ||||||||||||
| Ca | 3191.6 | 0.23 | 3078.4 | 0.23 | 1860.7 | 0.54 | 483.1 | 0.48 | 587.8 | 0.49 | 636.8 | 0.51 |
| K | 3138.0 | 0.18 | 4896.8 | 0.20 | 3948.4 | 0.51 | 1051.0 | 0.62 | 1082.4 | 0.40 | 1249.4 | 0.39 |
| Mg | 3952.7 | 0.16 | 4171.9 | 0.20 | 2435.2 | 0.56 | 691.3 | 0.30 | 657.0 | 0.42 | 685.4 | 0.36 |
| N | 496.4 | 0.76 | 510.9 | 0.48 | 1161.9 | 0.87 | 344.2 | 0.79 | 613.0 | 0.52 | 245.2 | 0.69 |
| P | 203.9 | 0.37 | 147.9 | 0.23 | 192.9 | 0.37 | 239.0 | 0.23 | 200.4 | 0.28 | 230.1 | 0.23 |
| S | 71.1 | 0.34 | 66.7 | 0.28 | 95.2 | 0.66 | 36.8 | 0.48 | 40.6 | 0.40 | 25.1 | 0.33 |
| Micronutrients | ||||||||||||
| Cu | 12.33 | 0.18 | 13.54 | 0.16 | 10.55 | 0.42 | 5.48 | 0.27 | 6.79 | 0.30 | 8.10 | 0.26 |
| Fe | 29,524.8 | 0.20 | 27,225.8 | 0.17 | 15,672.6 | 0.47 | 9550.2 | 0.24 | 12,662.4 | 0.37 | 13,633.8 | 0.32 |
| Mn | 649.1 | 0.39 | 571.0 | 0.17 | 185.2 | 0.51 | 148.7 | 0.36 | 267.5 | 0.35 | 439.7 | 0.36 |
| Ni | 21.09 | 0.17 | 19.90 | 0.17 | 11.54 | 0.56 | 5.09 | 0.40 | 6.59 | 0.56 | 9.49 | 0.36 |
| Zn | 44.1 | 0.15 | 43.7 | 0.22 | 25.1 | 0.45 | 11.8 | 0.92 | 12.0 | 0.25 | 13.4 | 0.31 |
| Other | ||||||||||||
| Al | 38,277.5 | 0.16 | 36,836.1 | 0.16 | 19,277.8 | 0.49 | 11,081.4 | 0.17 | 13,435.2 | 0.29 | 14,221.3 | 0.30 |
| Ba | 129.2 | 0.36 | 138.2 | 0.21 | 74.7 | 0.32 | 36.4 | 0.31 | 4942.0 | 1.49 | 44.6 | 0.42 |
| Co | 12.31 | 0.19 | 13.20 | 0.15 | 5.62 | 0.52 | 3.46 | 0.38 | 5.28 | 0.31 | 6.60 | 0.36 |
| Cr | 32.2 | 0.31 | 29.3 | 0.15 | 17.8 | 0.40 | 15.2 | 0.27 | 20.8 | 0.47 | 22.4 | 0.42 |
| Na | 226.5 | 0.23 | 444.8 | 0.33 | 104.9 | 1.06 | 34.0 | 0.70 | 26.9 | 0.48 | 38.8 | 0.43 |
| Pb | 9.03 | 0.21 | 9.90 | 0.27 | 5.26 | 0.49 | 3.54 | 0.26 | 4.76 | 0.41 | 5.66 | 0.27 |
| Sr | 42.88 | 0.22 | 43.27 | 0.18 | 23.82 | 0.47 | 7.97 | 0.31 | 8.49 | 0.46 | 10.71 | 0.39 |
| Ti | 310.4 | 0.28 | 349.4 | 0.36 | 164.4 | 0.39 | 172.9 | 0.20 | 198.9 | 0.35 | 207.4 | 0.28 |
| V | 59.4 | 0.43 | 45.6 | 0.22 | 32.9 | 0.50 | 21.6 | 0.37 | 30.1 | 0.39 | 32.7 | 0.36 |
Note: FF = Frequently Flooded, IFF = Intermediately Flooded Frequent, IFR = Intermediately Flooded Rare, RF = Rarely Flooded, NFSL = Never Flooded Sandy Loam, NFIS = Never Flooded Ironstone. Bold = Highest mean value across all floodplain zones for that specific parameter. Underline = Lowest mean value across all floodplain zones for that specific parameter. All geochemistry parameters are in ppm.
Table 4.
Mann–Whitney U values comparing the soil properties of vegetated (V) and non-vegetated (NV) surfaces within flood frequency zones on Angledool Station in northern New South Wales, Australia.
Table 4.
Mann–Whitney U values comparing the soil properties of vegetated (V) and non-vegetated (NV) surfaces within flood frequency zones on Angledool Station in northern New South Wales, Australia.
| Parameter | FF V v FF NV | IFF V v IFF NV | IFR V v IFR NV | RF V vs. RF NV | NFSL V v NFSL NV | NFIS V v NFIS NV |
|---|---|---|---|---|---|---|
| pH | 0.771 | 0.045 (V) | <0.0001 (V) | <0.0001 (V) | <0.0001 (V) | <0.0001 (V) |
| EC (µS/cm) | <0.0001 (V) | <0.0001 (V) | <0.0001 (V) | <0.0001 (V) | <0.0001 (V) | <0.0001 (V) |
| OM% | <0.0001 (V) | <0.0001 (V) | <0.0001 (V) | <0.0001 (V) | <0.0001 (V) | <0.0001 (V) |
| Clay% | 0.647 | 0.653 | <0.0001 (NV) | <0.0001 (NV) | 0.001 (NV) | 0.822 |
| Silt% | 0.253 | 0.267 | <0.0001 (V) | <0.0001 (V) | 0.002 (V) | 0.742 |
| Sand% | 0.138 | 0.002 (NV) | 0.930 | 0.602 | 0.243 | 0.002 (NV) |
| Macronutrients | ||||||
| Ca | 0.042 (NV) | 0.086 | <0.0001 (V) | <0.0001 (V) | <0.0001 (V) | <0.0001 (V) |
| K | 0.333 | <0.0001 (V) | 0.519 | 0.313 | <0.0001 (V) | 0.024 (V) |
| Mg | 0.002 (NV) | 0.458 | 0.149 | <0.0001 (V) | <0.0001 (V) | 0.968 |
| N | <0.0001 (V) | <0.0001 (V) | <0.0001 (V) | <0.0001 (V) | <0.0001 (V) | <0.0001 (V) |
| P | 0.087 | <0.0001 (V) | <0.0001 (V) | 0.012 (V) | <0.0001 (V) | 0.024 (V) |
| S | <0.0001 (V) | <0.0001 (V) | <0.0001 (V) | <0.0001 (V) | <0.0001 (V) | <0.0001 (V) |
| Micronutrients | ||||||
| Cu | 0.001 (NV) | 0.600 | 0.904 | 0.226 | 0.001 (V) | 0.420 |
| Fe | 0.002 (NV) | 0.410 | 0.994 | 0.349 | 0.269 | 0.006 (NV) |
| Mn | 0.028 (NV) | 0.087 | 0.628 | 0.016 (V) | 0.005 (V) | 0.420 |
| Ni | <0.0001 (NV) | 0.358 | 0.784 | 0.315 | 0.001 (V) | 0.044 (NV) |
| Zn | 0.117 | 0.717 | 0.341 | 0.594 | <0.0001 (V) | 0.262 |
| Other | ||||||
| Al | 0.002 (NV) | 0.503 | 0.878 | 0.865 | 0.005 (V) | 0.165 |
| Ba | 0.026 (NV) | 0.550 | 0.028 (V) | 0.002 (V) | 0.001 (V) | 0.153 |
| Co | 0.013 (NV) | 0.704 | 0.704 | 0.146 | 0.020 (V) | 0.156 |
| Cr | 0.007 (NV) | 0.149 | 0.675 | 0.223 | 0.415 | 0.017 (NV) |
| Na | <0.0001 (NV) | 0.018 (NV) | 0.556 | 0.040 (V) | <0.0001 (V) | 0.910 |
| Pb | 0.011 (NV) | 0.156 | 0.594 | 0.109 | 0.366 | 0.003 (NV) |
| Sr | 0.007 (NV) | 0.259 | <0.0001 (V) | <0.0001 (V) | <0.0001 (V) | 0.040 (V) |
| Ti | 0.036 (NV) | 0.217 | <0.0001 (NV) | <0.0001 (NV) | 0.084 | <0.0001 (NV) |
| V | 0.044 (NV) | 0.929 | 0.710 | 0.006 (NV) | 0.370 | 0.001 (NV) |
Note: FF = Frequently Flooded, IFF = Intermediately Flooded Frequent, IFR = Intermediately Flooded Rare, RF = Rarely Flooded, NFSL = Never Flooded Sandy Loam, NFIS = Never Flooded Ironstone. Bold indicates statistically significant difference between vegetated and non-vegetated pairs (p < 0.05). (V) indicates that the vegetated surfaces returned the higher average parameter value. (NV) indicates that the non-vegetated surface returned the higher average parameter value. All geochemistry parameters are in ppm.
Table 5.
ANOSIM (R value) results comparing the soil properties of vegetated (V) and non-vegetated (NV) soils within six flood frequency zones on Angledool Station in northern New South Wales, Australia. R values above 0.750 (represented in Bold) indicate a strong separation between pair-wise groups.
| FF V | FF NV | IFF V | IFF NV | IFR V | IFR NV | RF V | RF NV | NFSL V | NFSL NV | NFIS V | NFIS NV | |
|---|---|---|---|---|---|---|---|---|---|---|---|---|
| FF V | ||||||||||||
| FF NV | 0.120 | |||||||||||
| IFF V | 0.454 | 0.419 | ||||||||||
| IFF NV | 0.443 | 0.270 | 0.177 | |||||||||
| IFR V | 0.631 | 0.800 | 0.751 | 0.824 | ||||||||
| IFR NV | 0.435 | 0.589 | 0.624 | 0.624 | 0.233 | |||||||
| RF V | 0.905 | 0.967 | 0.988 | 0.978 | 0.454 | 0.345 | ||||||
| RF NV | 0.950 | 0.976 | 0.998 | 0.988 | 0.741 | 0.441 | 0.368 | |||||
| NFSL V | 0.825 | 0.939 | 0.957 | 0.956 | 0.431 | 0.409 | 0.314 | 0.640 | ||||
| NFSL NV | 0.895 | 0.954 | 0.993 | 0.972 | 0.704 | 0.363 | 0.402 | 0.188 | 0.408 | |||
| NFIS V | 0.888 | 0.954 | 0.987 | 0.968 | 0.612 | 0.386 | 0.341 | 0.457 | 0.316 | 0.296 | ||
| NFIS NV | 0.883 | 0.933 | 0.991 | 0.960 | 0.753 | 0.449 | 0.607 | 0.304 | 0.573 | 0.144 | 0.341 |
Note: p = 0.01, Global R = 0.631. FF = Frequently Flooded, IFF = Intermediately Flooded Frequent, IFR = Intermediately Flooded Rare, RF = Rarely Flooded, NFSL = Never Flooded Sandy Loam, NFIS = Never Flooded Ironstone. Direct comparisons between vegetated (V) and non-vegetated (NV) surfaces within each flood frequency zone are shaded.
Disclaimer/Publisher’s Note: The statements, opinions and data contained in all publications are solely those of the individual author(s) and contributor(s) and not of MDPI and/or the editor(s). MDPI and/or the editor(s) disclaim responsibility for any injury to people or property resulting from any ideas, methods, instructions or products referred to in the content. |
© 2023 by the authors. Licensee MDPI, Basel, Switzerland. This article is an open access article distributed under the terms and conditions of the Creative Commons Attribution (CC BY) license (https://creativecommons.org/licenses/by/4.0/).
Share and Cite
MDPI and ACS Style
Carroll-MacDonald, T.-A.; Rayburg, S.; Neave, M. Spatial Variability of Topsoil Properties on a Semi-Arid Floodplain. Soil Syst. 2023, 7, 42. https://doi.org/10.3390/soilsystems7020042
AMA Style
Carroll-MacDonald T-A, Rayburg S, Neave M. Spatial Variability of Topsoil Properties on a Semi-Arid Floodplain. Soil Systems. 2023; 7(2):42. https://doi.org/10.3390/soilsystems7020042
Chicago/Turabian StyleCarroll-MacDonald, Tiffany-Anne, Scott Rayburg, and Melissa Neave. 2023. "Spatial Variability of Topsoil Properties on a Semi-Arid Floodplain" Soil Systems 7, no. 2: 42. https://doi.org/10.3390/soilsystems7020042