Article

Quantifying the Immediate Response of Soil to Wild Boar (Sus scrofa L.) Grubbing in Mediterranean Olive Orchards

1
Department of Agricultural, Environmental and Food Sciences, University of Molise, 86100 Campobasso, Italy
2
Department of Biology, University of Naples Federico II, 80126 Naples, Italy
3
BAT Center—Interuniversity Center for Studies on Bioinspired Agro-Environmental Technology, University of Naples Federico II, 80055 Portici, Italy
4
NBFC—National Biodiversity Future Center, 90133 Palermo, Italy
5
Institute of Food Sciences, National Research Council, ISA-CNR, 83100 Avellino, Italy
6
Department of Pharmacy, University of Naples Federico II, 80131 Naples, Italy
*
Authors to whom correspondence should be addressed.
Soil Syst. 2023, 7(2), 38; https://doi.org/10.3390/soilsystems7020038
Submission received: 11 January 2023 / Revised: 25 March 2023 / Accepted: 12 April 2023 / Published: 17 April 2023
(This article belongs to the Special Issue Soil Metabolism and Biogenic Emissions of CO2 and N2O)

Abstract

:
The goals of the current research were to assess the immediate impact of invasive wild boar (Sus scrofa L.) in olive orchards of southern Italy. Over a one-year study, in grubbed and ungrubbed areas, we measured the seasonal changes on the fast soil biological and chemical responses at depths of 0–15 cm and 15–40 cm, and several leaf and fruit characteristics. The impact factor, IFG, was used to quantify the effects of wild boar on individual soil parameters. Grubbing induced an increase in the soil moisture at both depths. Soil pH, organic matter, and C/N ratio were higher in grubbed soils at 0–15 cm and lower at 15–40 cm compared to ungrubbed soils. These trends were reflected in the higher microbial community biomass and the inhibition of fungal fraction in grubbed topsoil, while an opposite tendency at 15–40 cm was found. Microbial biomass had the highest IFG in topsoil (94%) and metabolic quotient (85%) at a 15–40 cm depth. Microbial stress condition and C loss were found in grubbed soil at both depths. Furthermore, these soils were also shown to be of lower quality than ungrubbed soils, especially at 0–15 cm (SQI = 0.40 vs. 0.50, respectively). A stronger negative impact of wild boar grubbing was observed in the Autumn/Winter and for fruit polyphenol content.

1. Introduction

The Mediterranean area is represented by several peculiar diversified ecosystems in time and space. A number of human activities, namely, land use changes, overgrazing, wood removal, and fires, occur in the Mediterranean regions in combination with stressors such as alien species invasion and loss of biodiversity, making soil more vulnerable in terms of properties and functioning [1,2,3,4]. Among the stressors of the Mediterranean area, overgrazing is particularly remarkable because it alters the natural soil processes by impacting the overall soil quality (specifically structure, nutrient availability, and microbial activity) and productivity [5]. Previous studies have shown a link between grazing activity, mainly represented by sheep and cows [6,7,8], and soil degradation; however, to date, little is known about this relation in terms of many wildlife mammals, including wild boars. The actual wild boar (Sus scrofa L.) emergency, as a result of demographic increases and animal invasion in anthropic environments, negatively affects the local biodiversity and damages the agriculture [9,10,11]. In particular, in agricultural areas where Sus scrofa L. is responsible for 90% of agriculture loss, the investigations of soil are still poor [12]. The broad spectrum of food (plants and animals) ingested by wild boar [13] indicates that these animals preferentially root on ground surfaces up to depths of 40–50 cm. The wild boar’s grubbing and rooting activities modify the geomorphologic process [14] and soil structure stability, being comparable to a deep tillage treatment obtained by tillage machines in Mediterranean cultivated land [15]. Furthermore, Sus scrofa L. is reported to alter nutrient cycling and decomposition rates, although conflicting data are shown in the literature. Singer et al. [16] and Siemann et al. [17] stated that wild boar activity modifies nitrogen processes by accelerating mineralization; on the other hand, Tierney and Cushman [18] and Moody and Jones [19] demonstrated that nitrogen mineralization is not affected. These authors found a low impact of grubbing on other indicators of animal grazing, e.g., soil texture, pH, moisture, and organic matter. Contrasting results are reported for soil biological characteristics such as microbial activity and biomass, bacterial structure, and diversity. More specifically, Mohr et al. [20] evidenced an intense reduction in microbial activity and biomass and a simplification in the composition of the microbial community induced by grubbing, while Wirthner et al. [21] found no significant effect. In the present framework of contrasting evidence, assessing the dynamics of soil abiotic and biotic parameters and the overall soil quality in the Mediterranean ecosystem of southern Italy, where the grazing of wild boar is frequent, becomes pivotal to understand how the soil functions in preserving its primary production. The ability of the soil to retain its functions and its capacity to withstand overgrazing by wild boar depends on several properties and environmental conditions and may provide information about the short-term effects of stressors such as grubbing [22,23]. In this context, the integration of several soil parameters into a single index can be a powerful tool to detect the overall impact of wild boar on soil quality. However, wild boar grazing and grubbing may also affect plants, directly as target of the boar diet, or indirectly by modifying soil properties. The intensity of these impacts strictly depends on plant species such as crops that provide a rich food source with minimal foraging effort [15,24]. Some authors [25] reported that in cultivated lands, wild boars can consume or trample crops, being one of the most important causes of crop loss, while others [26] estimated that only 5–10% of crop destruction is a consequence of actual consumption and 85–90% due to trampling activity.
Generally, damage due to wild boars can affect both herbaceous and arboreal plants, including olive trees (Olea europaea L.) [15]. In tree cover systems, wild boar excavation activities can have negative effects on plant regeneration because the animals may eat or damage seeds, causing a drop in germination. Seeds and roots may be a preferential food because of their high digestibility and protein richness. In addition, changes in the soil characteristics at grubbing areas indirectly affect the plant growth and fitness [8,15]. This issue is of great concern in southern Italy, where the wild boar population has rapidly increased in size and spread throughout most of the natural lands. The main reasons for this include its reproductive rate, adaptability to different habitats, diversified diet, and lack of natural predators, except wolves [11]. In fact, in the National Park of “Cilento e Vallo di Diano” (Campania region, southern Italy), wild boar activity is a significant issue for the agricultural production of Olea europaea L. that represents about 8% of the National Park, where the manufacture of olives is estimated to be 110 q ha1 per year with a maximum yield of 22% in oil according to the Italian Department of Agriculture, Campania region section [27]. For these reasons, this study was conducted in the National Park of “Cilento, Vallo di Diano and Alburni”, in areas planted with olive trees and greatly impacted by wild boar. In the studied areas, the wild boar population is high and several incidents of damage due to wild boar grubbing have been reported by local farmers [28]. In this context, our study aimed to assess the abrupt impact of Sus scrofa L. on the soil of olive orchards in the Mediterranean area of Cilento over one year of measurements, by comparing the effect of wild boar grubbing activity (G) with ungrubbed (UG) areas. The specific objectives were: (1) to quantify the immediate impact of wild boar grubbing on soil quality, first analyzing each of the soil traits and then calculating an integrated soil quality index (SQI) at depths of 0–15 cm and 15–40 cm; (2) to highlight the seasonal changes of the soil’s immediate biological and chemical responses to the direct or indirect impact of grubbing; and (3) to assess the leaf functional traits and fruit characteristics of Olea europaea L. and highlight the correlation between soil quality and the features of olive trees.
In addition, given the heterogeneity of the soil’s responses to wild boar activity, a synthetic impact factor (IFG) is proposed to quantify the immediate effects of grubbing on individual soil components. IFG is calculated in both grubbed and ungrubbed soils in order to estimate which biotic and abiotic soil traits are the most sensitive to grubbing, and how wild boar activity has modified, in a short time, soil functioning and quality.

2. Materials and Methods

2.1. Study Area and Soil Sampling

The research was carried out in the National Park of “Cilento, Vallo di Diano and Alburni”, within the site of community importance (SCI) named “Monte Licosa and Dintorni” (40°15′18.71″ N, 14°54′38.25″ E), located in southern Italy (Salerno, Campania region, Italy). The park is the largest Italian protected area, measuring approximately 181,048 ha, and is one of the major systems for the conservation of Mediterranean biota [28]. Here, the notable expansion of the wild boar (Sus scrofa L.) population (high intensity, as they can number 20 individuals per km2) that mostly show interest in the cultivated areas makes this SCI territory an interesting study area [9,28,29].
The site covers a surface of about 1000 ha, with an elevation ranging from 0 to 300 m a.s.l. More than 50% of the dominant vegetation coverage consists of Mediterranean maquis, characterized mainly by Quercus ilex L., Phillyrea latifolia L., Pistacea lentiscus L., Myrtus communis L., Arbutus unedo L., Erica arborea L., and Cistus spp. In addition, Pinus pinea L., Pinus halepensis Mill., and Carduus spp. were also detected [28,29,30]. The specific study area, subjected to a high intensity of wild boar activity (Figure 1), is covered by olive groves (Olea europaea L.) of about 60 years old, with an extension of approximately 2 ha, and located along the coast at 0–100 m a.s.l. The management of the orchards is not very intensive, only requiring mowing, pruning, and the occasional application of fertilizer. The soils were not fertilized over the study year. In this area, the soils were classified as Eutric Cambisols [31] for their beginning of horizon differentiation, due to the nature of the parent material, derived from a wide range of sedimentary rocks. The rock substrate is mainly formed by stratified carbonatic clayey–silty arenaceous layers, which have led to an enrichment of the soil in lime and clay fractions. These Cambisols are very widespread in the central Apennines and intensively used for the production of valuable fruit trees and homemade products such as olive oil and local crops in Mediterranean areas [31]. The soil sampling was carried out seasonally over one year from Spring to the following Spring (24 March 2010, 7 July 2010, 27 November 2010, 25 March 2011). The Spring samples were averaged, while only one sampling was conducted in the Autumn and Winter seasons. The homogeneity of the measurements and the lack of significant differences between the data collected for the two consecutive Spring seasons justify the decision to average the values of the two samples. The climate is typical Mediterranean, with dry summers and mild winters, and during the study year, the annual temperature and rainfall were 17.3 °C and 1204.3 mm (Policastro Bussentino weather station located at 40°04′15″ N, 15°31′05″ E, Santa Maria municipality, Salerno province, Italy).
Specifically, in the studied olive orchards (Olea europaea L. cv. Pisciottana), the soil sampling was carried out in five sub-areas of approximately 800 m2. In each sub-area, five soil cores were sampled at depths of 0–15 and 15–40 cm in the grubbed zones (G) and then mixed to obtain a representative sample. The same procedure was applied to the ungrubbed soil (UG), where five cores were sampled and mixed at a distance of approximately 20 m from the grubbed zones. The sample collection was performed within one day for each season (Spring, Summer, Autumn/Winter, and the next Spring), after five days without rainfall to minimize the variability due to climatic conditions. The grubbed zones were selected among those impacted by wild boar within the previous 24 h, and recognized by the appearance of the soil and uprooted herbaceous vegetation. The ungrubbed zones were chosen for their intact vegetation cover and compacted soil, which ruled out recent boar grubbing action. Finally, the soil samples were sieved through a mesh (<2 mm) and split in two aliquots for physical and chemical analyses, and for biological measurements. Biological analyses were conducted on fresh soil stored in plastic bags at 4 °C within one week after soil collection. All of the analyses were performed in triplicate. The physical, chemical, and biological soil properties were reported as means and standard errors on five field points and three laboratory replicates (n = 15) in grubbed and ungrubbed areas for each depth and season. The values are reported as annual (n = 60) and seasonal (n = 15) means, except for CEC, WHC, and BD, which are only reported as annual means (two subsequent Springs, Summer, and Autumn/Winter data).

2.2. Soil Physical and Chemical Analysis

The physical and chemical features of the soil were evaluated according to the Italian Official Methods of soil analysis [32]. The pH was measured by the electrometric method in soil: distilled water (1:2.5 = v:v) suspension and cation exchange capability (CEC) was measured in a solution at pH 8.1 made of barium chloride dihydrate and triethanolamine. The soil moisture (SM) was determined by drying fresh soil at 105 °C until a constant weight was reached, whereas the water-holding capacity (WHC) was evaluated by adding water to soils until complete saturation and drying the samples at 105 °C in a ventilated oven. The WHC was expressed as percentage of the difference between the soil mass at saturation and dry mass on dry mass. The bulk density (BD) was measured starting from undisturbed soil cores after drying for 48 h at 105 °C. WHC and BD were only determined at a 0–15 cm depth. The soil organic matter (SOM) was obtained by multiplying by 1.724 the organic carbon content [33] determined by dry combustion (CNS elemental analyzer, Thermo Finnigan-Flash EA 1112) in samples previously treated with HCl (10%) to remove carbonates. The total C and N contents were measured in oven-dried (105 °C) and finely ground (Fritsch Analysette Spartan 3 Pulverisette 0) samples using an elemental analyzer. In addition, the C/N ratio was calculated from the total C and N contents as an indicator of soil organic matter quality.

2.3. Soil Biological Analysis

The microbial biomass (MB) was measured according to Degens et al. [34] through the substrate-induced respiration (SIR) method and expressed as microbial carbon (mg Cmic g d.w.−1). This was determined after glucose addition (3 mL, 75 mM) to soils (3 g) as substrate for the CO2 evolution in a 72 h incubation period at 25 °C in the dark. The evolved CO2 was trapped in NaOH (0.1 N) and measured by two-phase titration with HCI (0.05 N). The respiration was determined by measuring the CO2 evolved in a 10-day incubation at 25 °C in the dark after the addition of distilled water (3 mL) to the soil samples (3 g) [34]. The soil metabolic quotient (qCO2) was calculated as the ratio between the C-CO2 obtained by respiration and C-CO2 by MB, and the coefficient of endogenous mineralization (CEM) was calculated as the ratio between the C-CO2 obtained by respiration and organic carbon [35,36]. The fungal biomasses (total: TFB and active: AFB) were assayed using the membrane filter method [37]. In brief, fungal mycelia were extracted from the soils (0.5 g) and dispersed in phosphate buffer (50 mL, 60 mM, pH 7.5). After staining with aniline blue, the intersections of the fungal mycelia were counted by means of optical microscopy for TFB. AFB was measured after pre-treatment with fluorescein diacetate for fungal vital mycelia coloration by means of fluorescence microscopy. The ratio between the AFB and TFB was calculated as the percentage of active fungal biomass on the total fungal biomass (AFB (% TFB)) and the ratio between the TFB and MB as a percentage of fungal biomass on the total microbial biomass (TFB (% MB)) [37].

2.4. Soil Quality Index

The soil quality index (SQI) is an integrated index calculated by taking into account physical, chemical, and biological parameters to assess the general soil capacity of functioning [38]. In the current study, the SQI was useful to assess the effect of wild boar grazing. Linear scoring functions were applied to characterize the relationship between a soil parameter and overall soil quality: more-is-better and less-is-better functions, where an increase in a soil attribute results in an increase or a decrease in soil quality, respectively [39]. The considered parameters were: pH, SM, SOM, N, C/N, Resp, MB, AFB, and TFB, while the derivative biological indices such as CEM and qCO2 or AFB (% TFB) and TFB (% MB) were not considered to avoid the redundancy of parameters. The SQI was calculated according to Andrews et al. [40], as reported below (Equation (1)):
S Q I = n = i i S i n
where S is the score assigned to each indicator and n is the number of the investigated parameters. Three specific classes of increasing quality can be attributed to the investigated soils: low quality (<0.55), medium quality (0.55–0.70), and high quality (>0.70) [37].

2.5. Grubbing Impact Factor (IFG)

In order to assess the influence of wild boar grubbing on the investigated soils from Mediterranean olive orchards, we employed an integrated method to calculate an impact factor (IFG) for each parameter. The IFG was calculated by taking into account the ungrubbed (not recently disturbed) soils used as a reference (Equation (2)):
I F G = ( U n g r u b b e d   s o i l G r u b b e d   s o i l ) U n g r u b b e d   s o i l × 100
This impact factor is shown as a heatmap reporting the annual mean value for each parameter. The differences among the values are shown by the color scale: red and blue indicate a decrease or increase, respectively.

2.6. Leaf and Fruit Sampling and Analyses

In both the grubbed and ungrubbed areas of the olive orchards, sampling of the leaves and fruits was carried out in order to highlight the relationship between the soil’s responses to grubbing and some plant features. In detail, leaves and fruits were sampled in the same five sub-areas previously described, from trees placed where soil sampling was carried out in grubbed or ungrubbed areas. The chosen trees were all similar in age (about 60 years old), height (3–5 m), and canopy cover (30–40 m2).
Only healthy one-year-old leaves of Olea europaea L. cv. Pisciottana from full light positions and with no pathogen damage were collected [41] on the same days as the soil samplings. The determination of the leaf traits (leaf area, relative water content, N content, C/N ratio) was carried out on ten fully expanded leaves sampled from five branches of five specimens in both grubbed and ungrubbed areas of the olive orchards in order to obtain a representative sample. The leaf data were reported as annual means and standard errors (n = 60) at grubbed and ungrubbed areas. The sampled leaves were stored at 5 °C until the analyses.
The leaf area (LA) was determined using ImageJ software (Image Analysis Software, Rasband, NIH, Bethesda, MD, USA). The leaf relative water content (RWC) was calculated as follows (Equation (3)):
R W C = ( L e a f   f r e s h   m a s s L e a f   d r y   m a s s ) ( L e a f   s a t u r a t e d   f r e s h   m a s s L e a f   d r y   m a s s ) × 100
after the leaves had been oven-dried at 75 °C for 48 h. The total N and total C were determined using a CNS elemental analyzer after grinding the oven-dried leaves, as reported for the soil measurements, and were used to calculate the C/N ratio [42].
The fruit analysis (pulp/stone ratio, dry matter, total polyphenols) was conducted on olives at the full maturation and pigmentation stage, without any sign of structural damage, on the same individuals used for the leaves collected for the leaf trait determination. Twenty olives per tree (five trees per area) in grubbed and ungrubbed areas were collected. The fruits were sampled at the same time as the soil and leaves in the Autumn/Winter season, and the fruit characteristics were reported as means and standard errors on fifteen field and three laboratory replicates (n = 45) in grubbed and ungrubbed areas.
The pulp/stone ratio (P/S) was measured as the ratio between the fresh weight of the pulp and the weight of the stone [43]. The dry matter (DM) was calculated as a percentage of the ratio between the dry (75 °C for 48 h until constant weight) and fresh weight of the pulp [44]. The total polyphenols (Tp) were measured according to Savarese et al. [45] and subsequent dosage reported by Hajimahmoodi et al. [46]. In brief, 2 g of pulp was mixed with 20 mL methanol:water (80:20 = v:v), homogenized, and vortexed for 5 min. The sample was then centrifuged for 20 min at 4000 rpm and filtered with Whatman 40 papers. The filtered aliquot was mixed with methanol 80%, and 20 µL of the sample was mixed with Folin–Ciocalteu reagent, H2O, and Na2CO3 6%. The absorbance was measured at 725 nm by means of a UV–Vis spectrophotometer (model DU 730, Beckman Coulter, Brea, CA 92821 USA). Gallic acid was used as standard and Tp was expressed as mg of gallic acid equivalent (GAE) per 100 g of dry weight.

2.7. Statistical Analysis

A paired t-test was performed in order to emphasize any statistically significant differences among the grubbed and ungrubbed soils at 0–15 and 15–40 cm depths, with the soil characteristics reported as annual means. A paired t-test was also used to assess the statistical differences in leaf traits and fruit characteristics in the grubbed and ungrubbed olive orchards. The test was applied to the normally distributed data according to the Shapiro–Wilk analysis and when this failed, the Wilcoxon signed rank test was performed. A three-way analysis of variance (ANOVA) was carried out to highlight statistical differences between the grubbed and ungrubbed soils, at both superficial and deep layers (0–15 and 15–40 cm depths), considering the seasons. All pairwise multiple comparison procedures were performed using the Holm-Sidak method. The Spearman rank order correlation was achieved to evaluate the relationships among the soils’ physical and chemical characteristics, microbial biomass and activity, and leaf and fruit traits. The statistical tests were significant at p < 0.05. Systat_SigmaPlot_12.2 software (Jandel Scientific, San Rafael, CA, USA) was used for the statistical analyses and for graphs.
Cluster analysis was performed on soil IFG data to highlight the similarities and differences among wild boar grazing and soil parameters. The Euclidean similarity index of the paired group (UPGMA) algorithm was calculated and the results, expressed as distance, were graphed by means of hierarchical clustering. This analysis was performed using Past 4.03 (Øyvind Hammer, Oslo, Norway).

3. Results

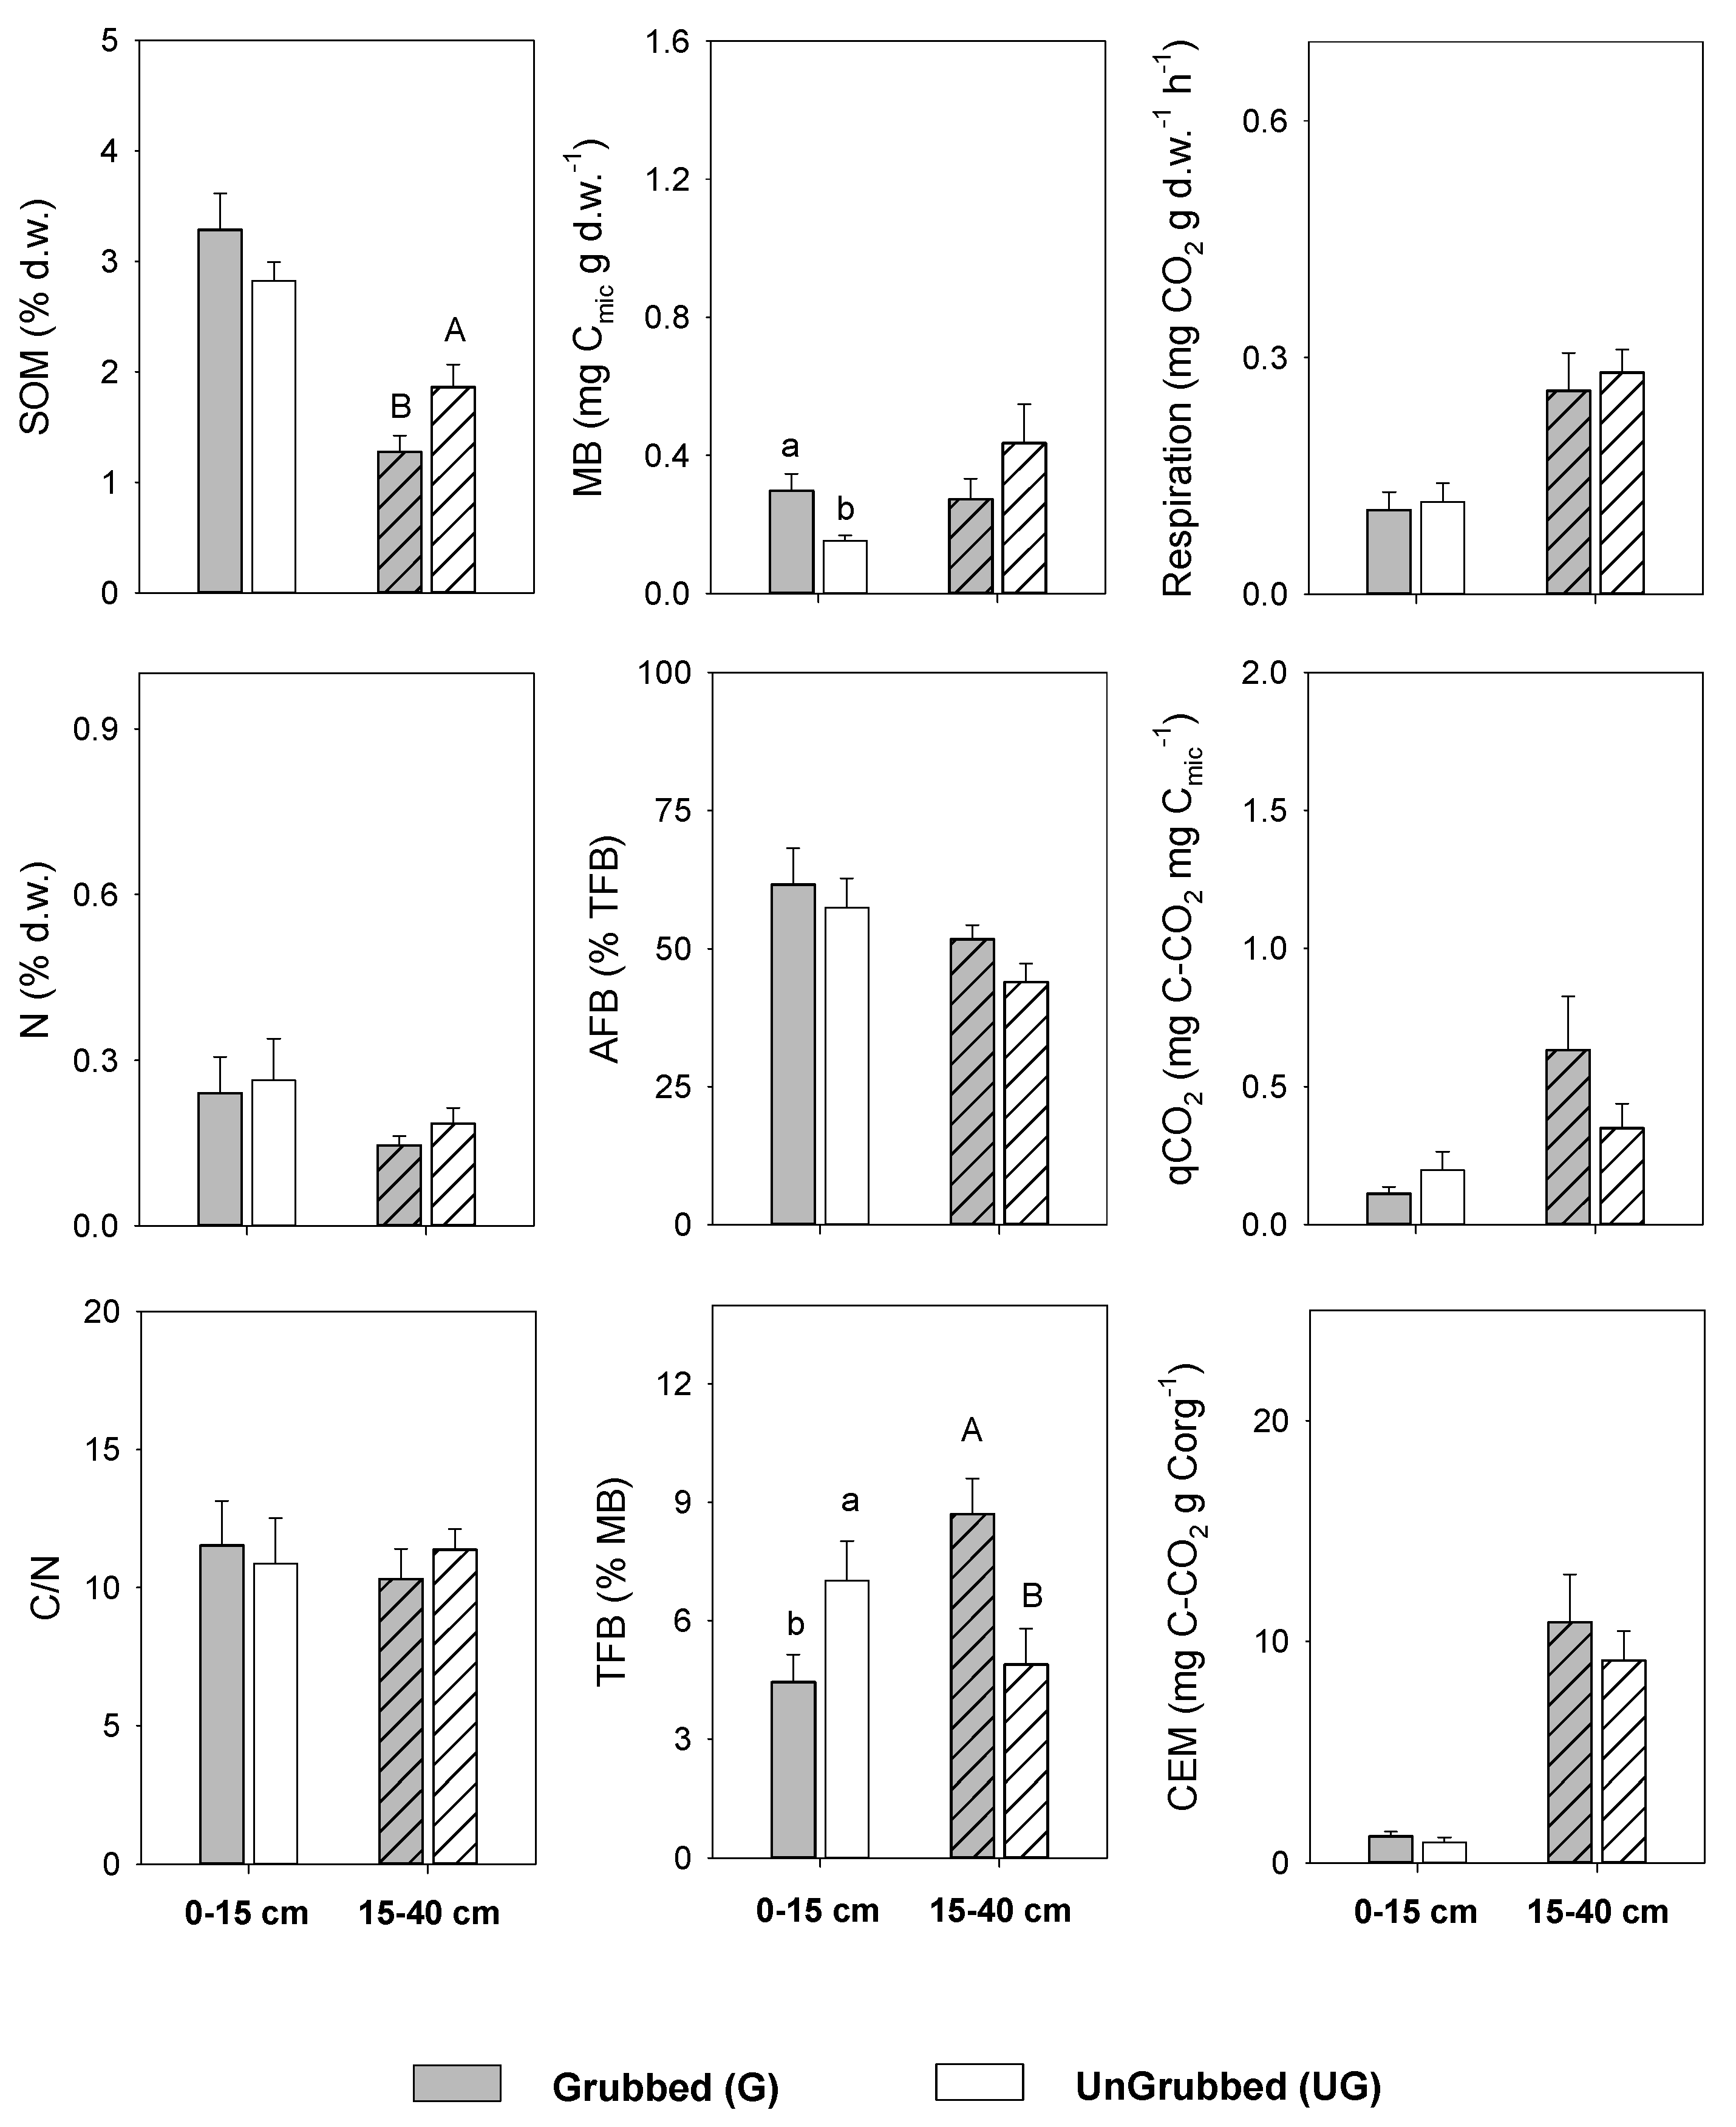
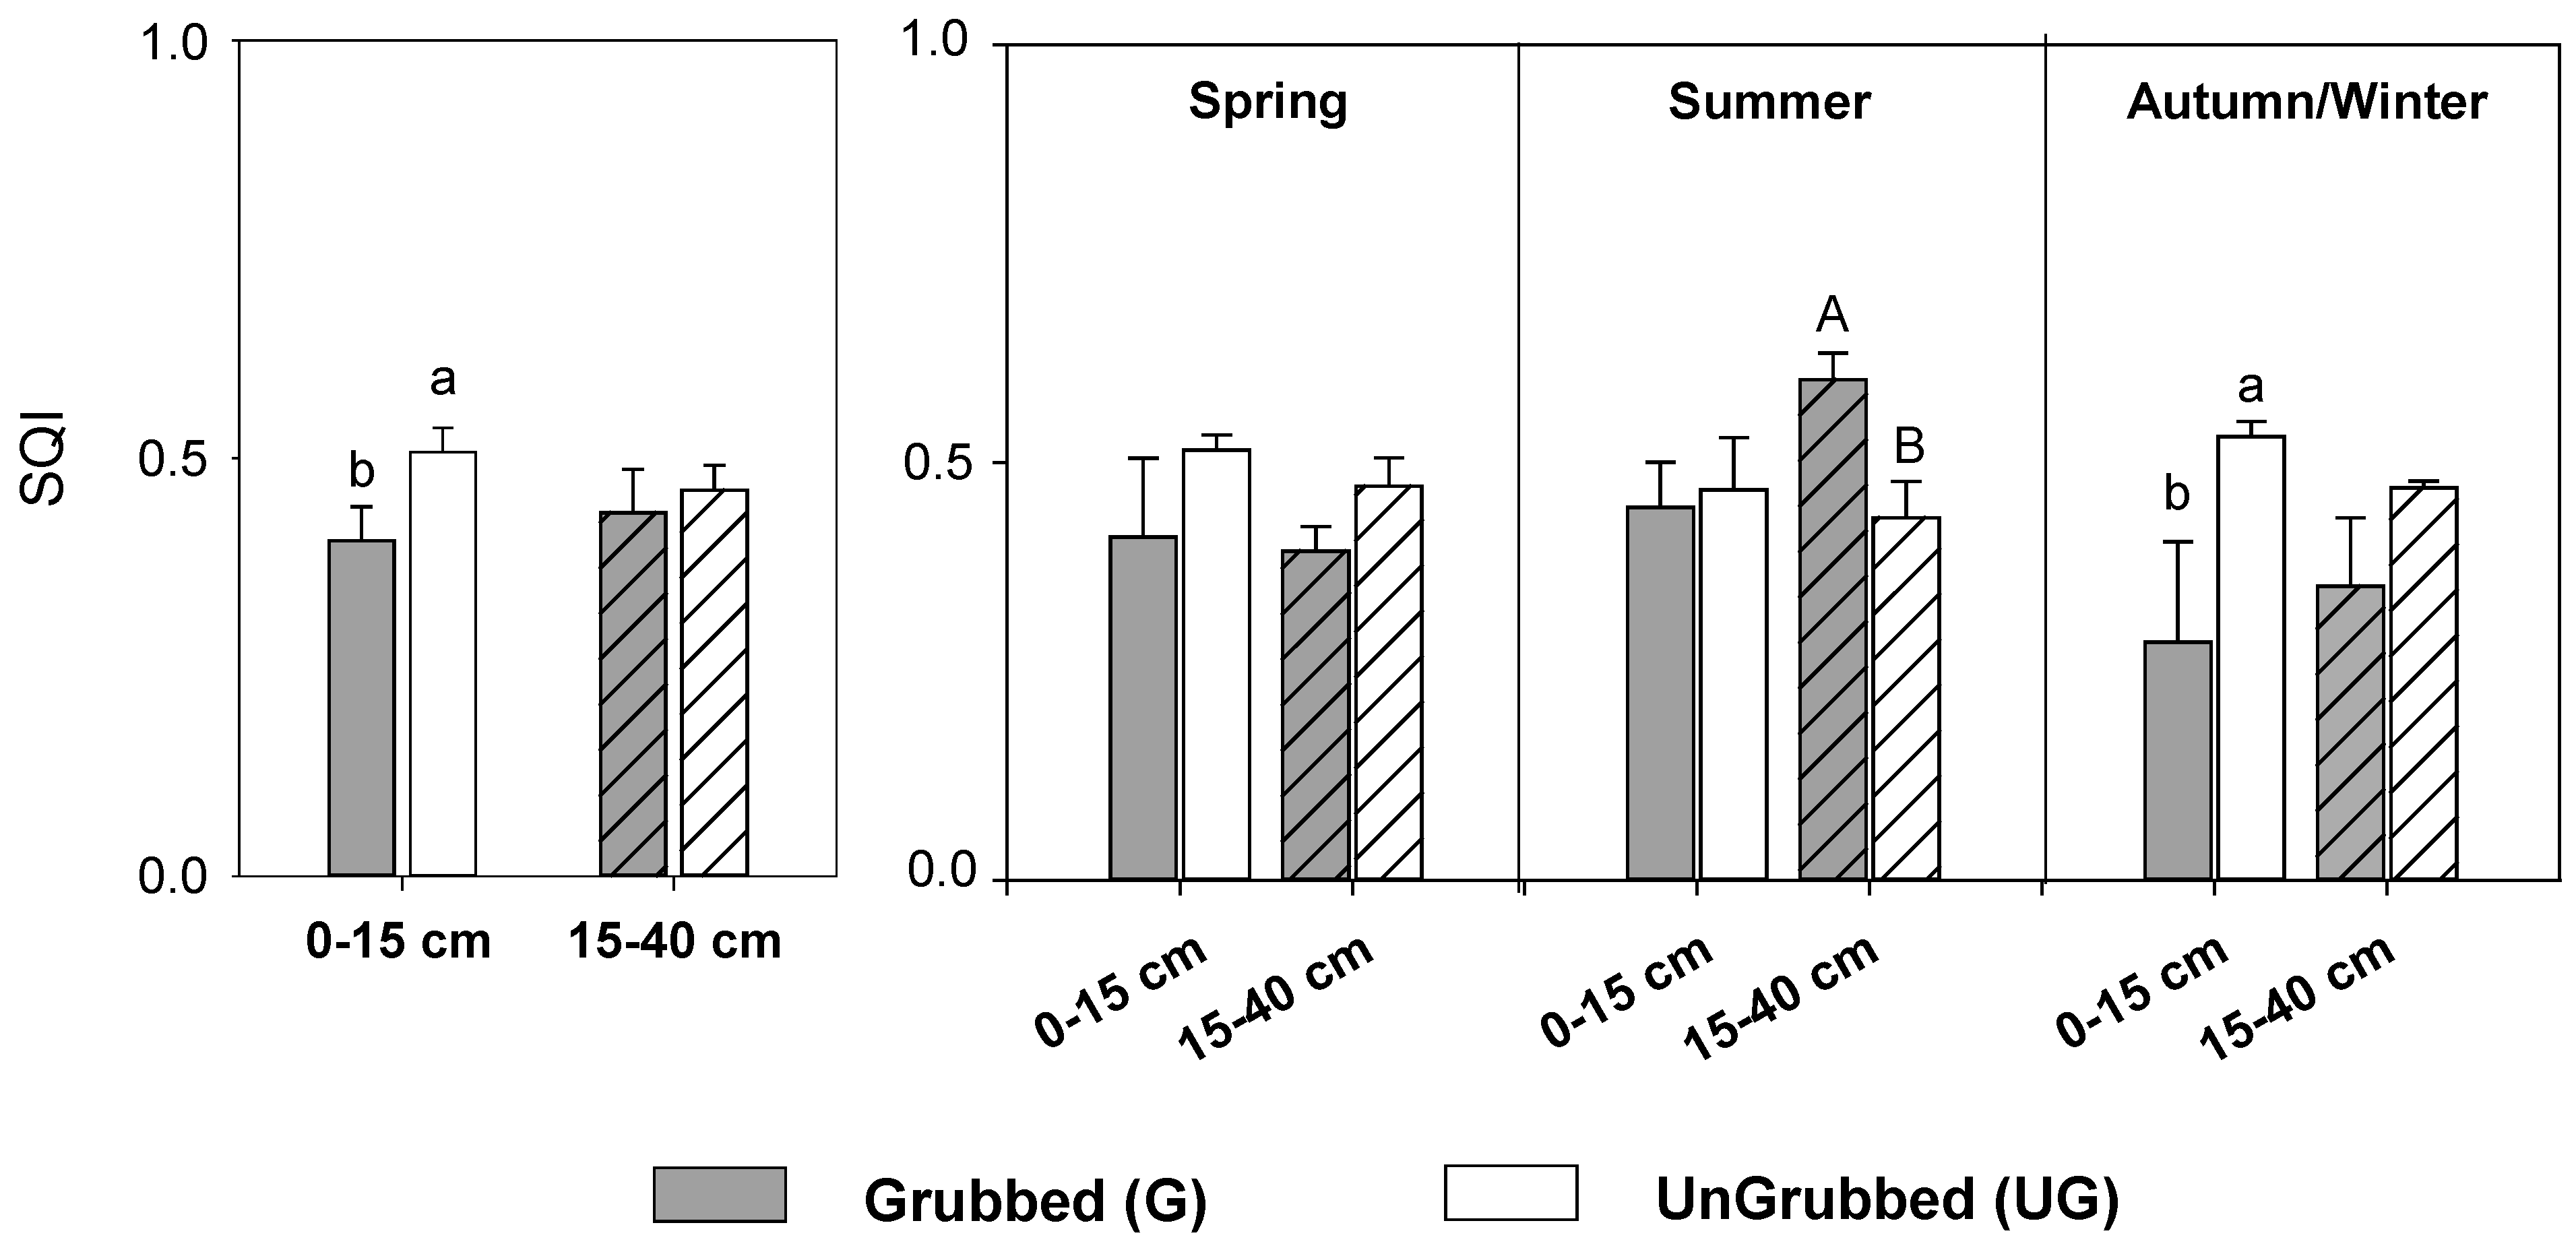
3.1. Effect of Wild Boar Grubbing on Soil Quality

Table 1 reports the physical and some of the chemical characteristics of the grubbed (G) and ungrubbed (UG) soils as means of one year of observations, and shows significant differences due to wild boar activity. At the depth of 0–15 cm (Table 1, Supplementary material Figure S1), the grubbed soils exhibited values of pH, SM, and WHC (7.07 ± 0.16, 15.1 ± 1.6% d.w. and 27.6 ± 3.8% d.w., respectively) significantly higher than the ungrubbed soils (6.68 ± 0.08, 12.8 ± 1.7% d.w. and 20.3 ± 2.3% d.w., respectively). An opposite trend was observed for CEC and BD in which the UG soils showed higher values (11.5 ± 0.02 cmol+ kg−1 and 1.32 ± 0.02 g cm−3, respectively) compared to the G soils (9.18 ± 0.01 cmol+ kg−1 and 1.27 ± 0.04 g cm−3, respectively). At the depth of 15–40 cm (Table 1, Supplementary Material Figure S1), the pH was statistically higher in the UG soils (7.77 ± 0.06) than in the G soils (7.12 ± 0.04), and the SM was higher in the G soils (16.5 ± 1.7% d.w.) than in the UG soils (14.1 ± 1.8% d.w).
The wild boar grubbing significantly affected the annual SOM content at the 15–40 cm depth (Figure 2), with significantly higher amounts found in the UG soil (1.86 ± 0.21%) than in the G soil (1.27 ± 0.15%) (Figure 2). The annual mean of the soil N content and the C/N ratio did not show significant differences between the grubbed and ungrubbed areas (Figure 2).
The soil biological characteristics, namely, microbial biomass (MB), percentage of active fungal biomass (AFB) on total fungi, and fungal biomass on microbial biomass (TFB (% MB)) are also shown in Figure 2. The annual values were statistically different for MB in the topsoil and for TFB (% MB) in both the top and deep soils. At the 0–15 cm depth, G soils had higher (0.30 ± 0.05 mg C g d.w.−1) microbial biomass than UG soils (0.15 ± 0.01 mg C g d.w.−1). Although no specific trend was shown by the TFB values in the grubbed and ungrubbed soils (Supplementary Material Figure S2), the percentage of active fungal biomass (AFB (%TFB)) showed higher values in the grubbed (upper soil: 61.6 ± 6.6% and deep soil: 51.7 ± 2.6% of TFB) than in the ungrubbed soil (upper soil: 57.4 ± 5.4% and deep soil: 43.9 ± 3.4% of TFB), without statistical differences (Figure 2). The percentage of fungi on the total microbial biomass was significantly lower in the grubbed (4.40 ± 0.70%) than in the ungrubbed soil (7.01 ± 1.01%) at a depth of 0–15 cm. The percentage of fungi showed an opposite trend in the soil at a depth of 15–40 cm (Figure 2).
Similarly, no statistical difference was detected for the annual values of respiration, metabolic quotient (qCO2), or the coefficient of endogenous mineralization (CEM) at 0–15 and 15–40 cm depths between the grubbed and ungrubbed soils (Figure 2).
The Spearman coefficients highlighted correlations among pH, SM, SOM, C/N, and N with the investigated biological parameters that differed for the grubbed and ungrubbed soils and for soil depth (Supplementary Material Table S1). In fact, for grubbed soils at 0–15 cm, MB showed a positive correlation with SM; TFB with pH; AFB (%TFB) with SOM; and qCO2 with N, whereas negative correlations were detected for AFB (%TFB) with pH and SM; TFB (%MB) with SM; and TFB with N. In this area, at deeper layer, positive correlations were shown among MB, TFB, TFB (%MB) with SOM, respiration, and qCO2 with N. On the contrary, negative correlations were displayed for MB with N, for TFB (%MB) and qCO2 with SM, for respiration with SM and C/N, and for CEM with SOM (Supplementary Material Table S1). In the ungrubbed soil, positive correlations for AFB (%TFB) with SM and for respiration, qCO2 and CEM with pH at 0–15 cm, and for MB with SM, for TFB (%MB) and qCO2 with C/N at 15–40 cm were shown. In addition, negative correlations were displayed for TFB and TFB (%MB) with SM, and for respiration, qCO2, and CEM with SOM at 0–15 cm and for MB with C/N, for TFB with pH, SM, and SOM and for respiration and CEM with SOM at 15–40 cm (Supplementary Material Table S1).
The soil quality index (SQI) estimated for the annual measurements in the olive groves showed values near to or below 0.50, regardless of wild boar activity (Figure 3). In detail, the annual SQI showed a significantly lower value in the grubbed (0.40) than the ungrubbed (0.50) soil at a 0–15 cm depth.

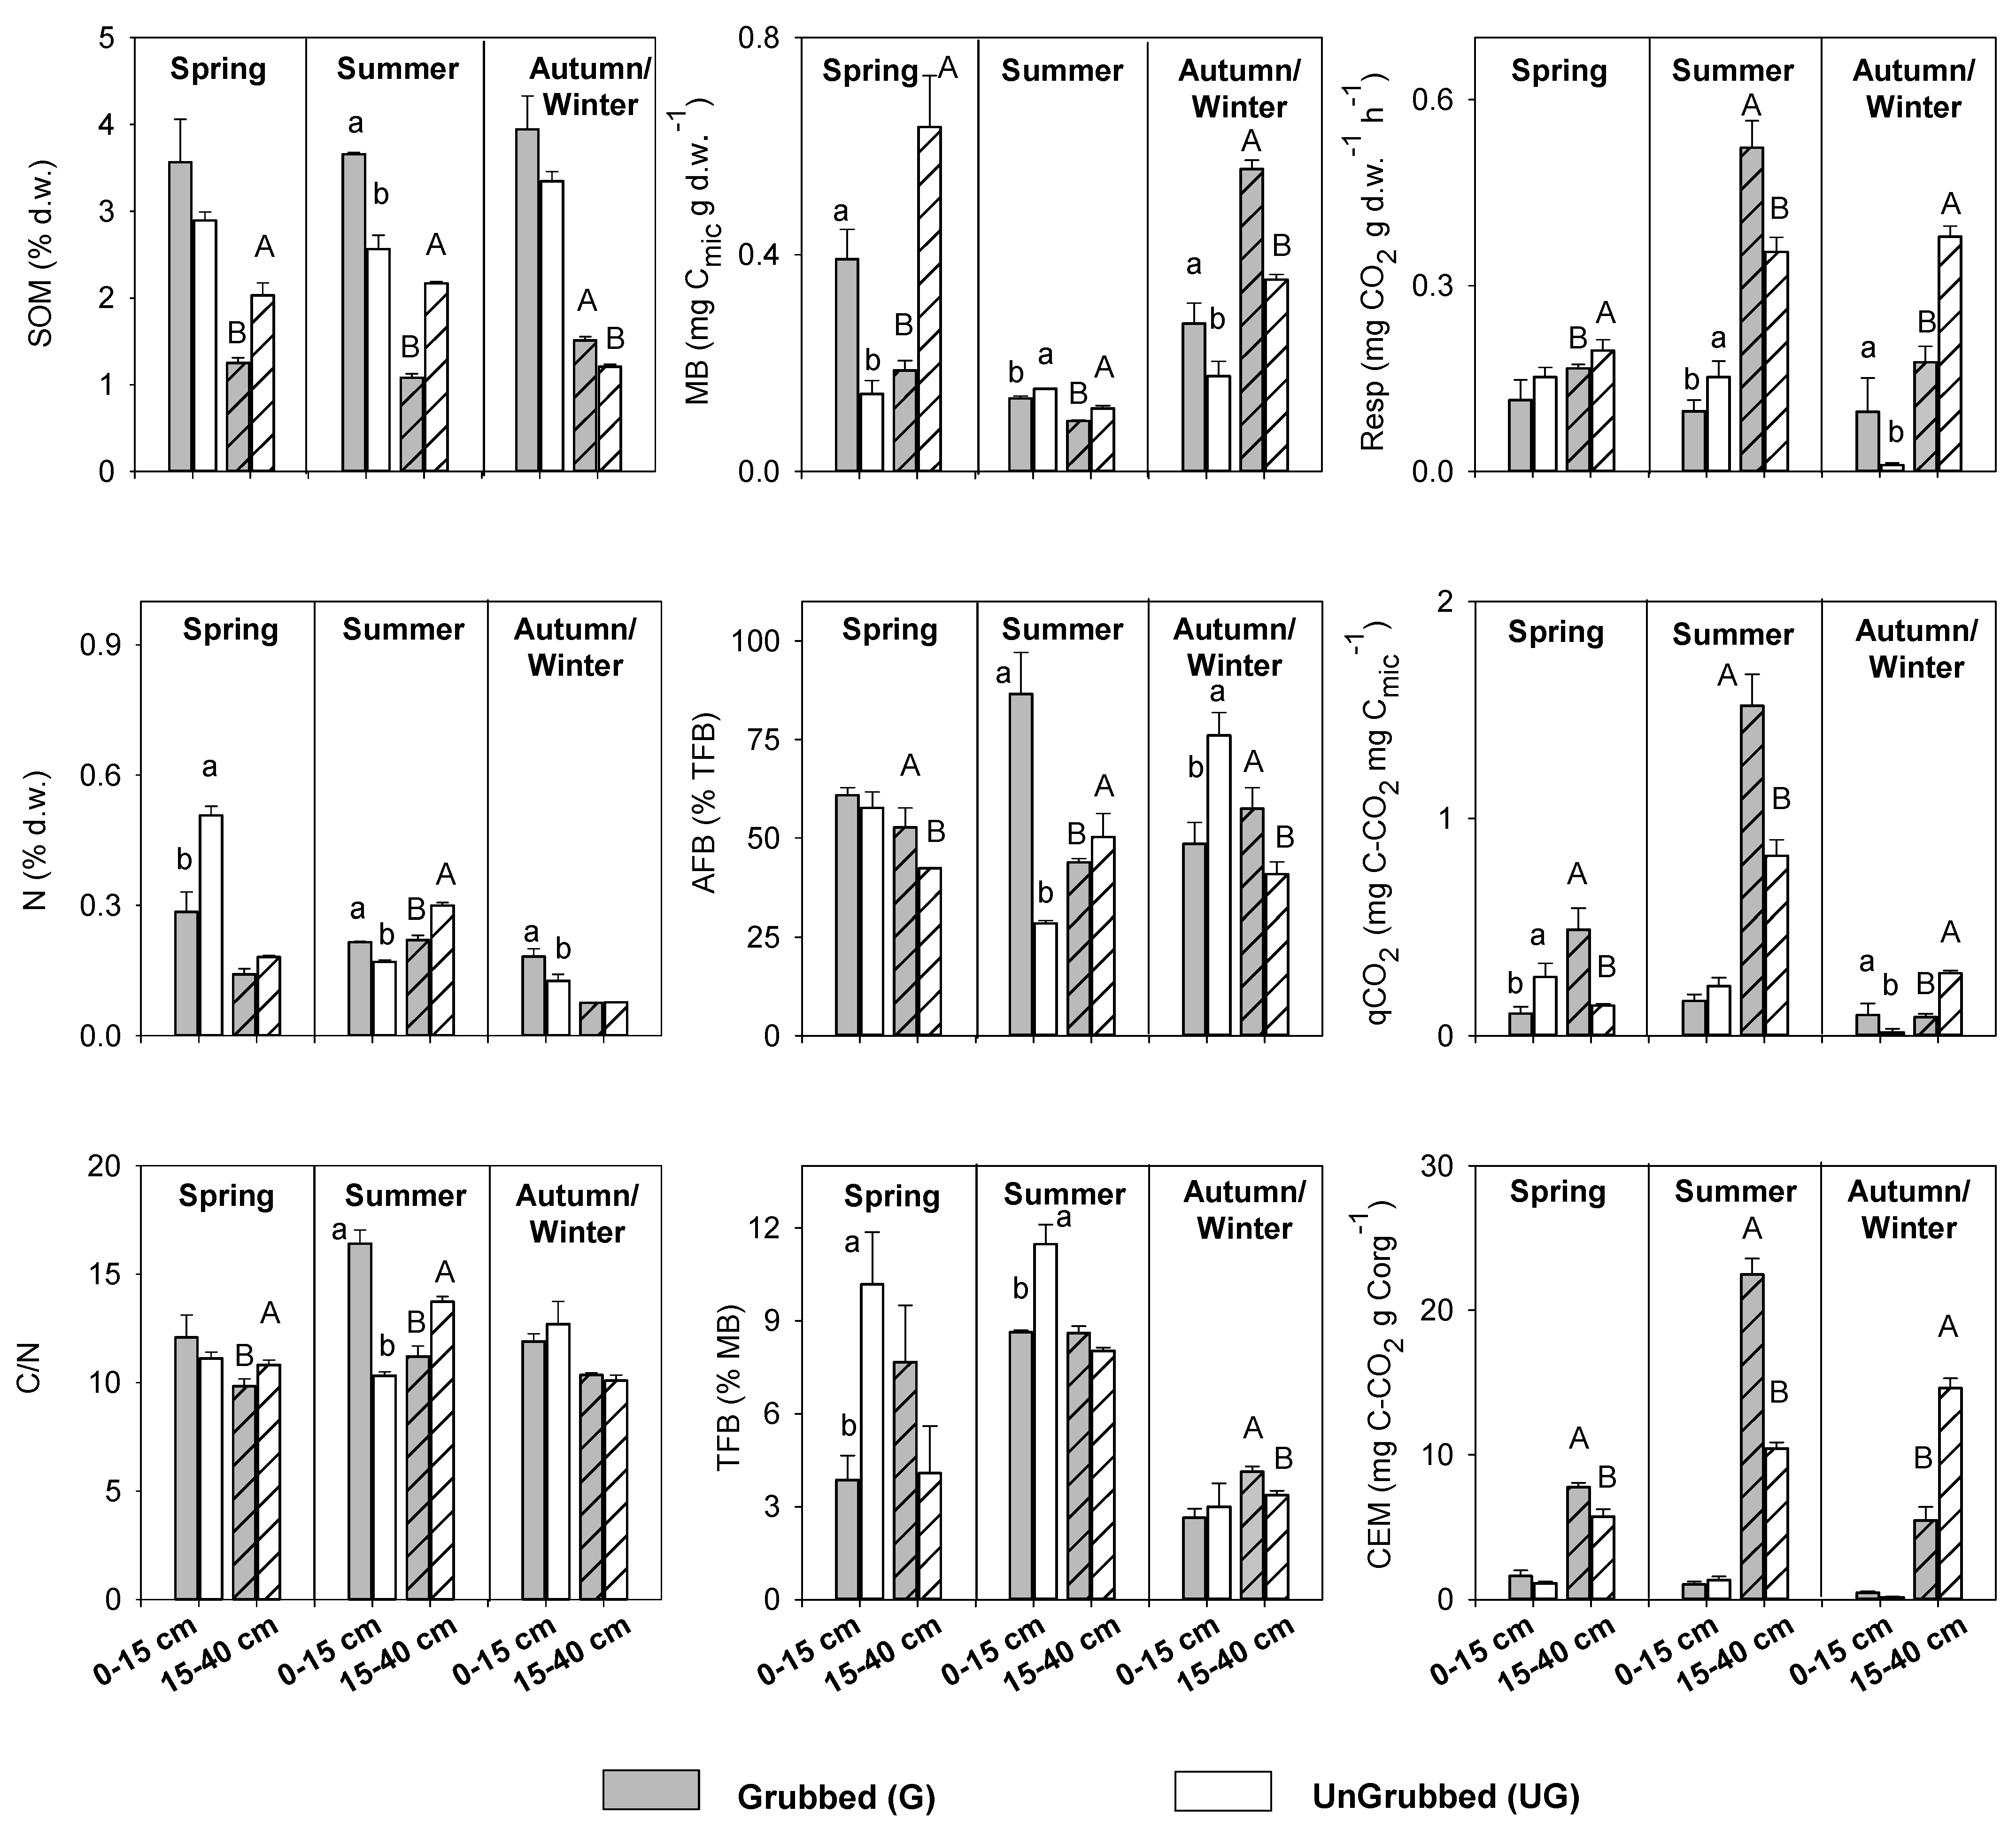
3.2. Seasonal Responses to Soil Grubbing

The effect of wild boar activity on the soil is most evident and significant when examining the data by seasons (Figure 4). Table 2 reports the statistically significant differences as p-values assessed by a three-Way ANOVA of individual soil parameters and the SQI resulting from seasons, grazing, and depth, and their interactions (Table 2).
In detail, during the investigated seasons, the soil moisture (SM) was higher in G soil than in UG; at a 15–40 cm depth, the differences were always statistically significant, as well as for topsoil during Autumn/Winter (Supplementary Material Figure S1). In addition, the deeper grubbed soil showed significantly lower values of pH than the ungrubbed soil in all seasons (Supplementary Material Figure S1).
At 0–15 cm, G soils showed higher amounts of SOM than UG soils, with significant differences observed in the Summer samples (3.66 ± 0.02% d.w. in G soil and 2.56 ± 0.16% d.w. in UG soil). On the other hand, at a 15–40 cm depth, UG soils exhibited higher amounts of SOM in Spring and Summer (2.80 ± 0.03 and 2.17 ± 0.02% d.w., respectively) and the opposite trend for Autumn/Winter (Figure 4, Table 2).
In addition, wild boar grazing significantly increased the N content in the upper layer during Summer and Autumn/Winter. In contrast, for the Spring samples, the N content in UG soil was statistically higher (0.51 ± 0.02% d.w.) than in G soil (0.29 ± 0.05% d.w.). In the deeper layer, for Summer, UG soils contained significantly higher values of N (0.29 ± 0.01% d.w.) than G soils (0.22 ± 0.01% d.w.) (Figure 4). In terms of the C/N ratio, at a depth of 0–15 cm, G soils only exhibited statistically higher values in the Summer samples. At a depth of 15–40 cm, the C/N ratio showed a similar trend for Spring and Summer, with higher values in the UG than G soils (Figure 4).
Specifically, at a 0–15 cm depth, MB displayed statistically higher values in G soils for Spring and Autumn/Winter (0.39 ± 0.06 and 0.27 ± 0.04 mg C g d.w.−1, respectively) compared to UG soils (0.14 ± 0.03 and 0.18 ± 0.03 mg C g d.w.−1, respectively) (Figure 4). For Summer, MB was significantly higher in the UG (0.15 ± 0.0001 mg C g d.w.−1) than in the G soils (0.14 ± 0.004 mg C g d.w.−1). At a 15–40 cm depth, Spring and Summer showed significantly higher values for the UG soils, whereas, on the contrary, Autumn/Winter reflected higher results for the G soils (Figure 4). The total fungal biomass was shown to have significantly higher values for the upper layer in the grubbed soils during Autumn/Winter compared to the ungrubbed soil, and a similar trend was also measured for the deep soil taken in the same sampling period (Supplementary Material Figure S2). The reverse was detected in the samples taken in Summer in both the upper and deeper soil layers (Supplementary Material Figure S2). The percentage of AFB on TFB showed lower values in G than UG soil for Autumn/Winter at 0–15 cm and for Summer at 15–40 cm depth (Figure 4). By contrast, at a 0–15 cm depth, the G soils displayed higher values for Summer (86.6 ± 10.5%) compared to the UG soils (28.5 ± 0.8%) and at 15–40 cm depth, for Spring (G: 52.7 ± 4.9% and UG: 42.4 ± 0.1%) and Autumn/Winter (G: 57.5 ± 5 and UG: 40.8 ± 3.1%). In Spring and Summer, the ungrubbed topsoil (10.1 ± 1.7% and 11.5 ± 0.6%, respectively) had higher values of TFB (%MB) than the grubbed soil (4.44 ± 0.70% and 8.69 ± 0.90%, respectively). At a 15–40 cm depth, the percentage of fungal biomass on microbial biomass was 4.12 ± 0.17% in the G soil and 3.37 ± 0.13% in the UG soil (Figure 4).
The soil respiration, metabolic quotient (qCO2), and coefficient of endogenous mineralization (CEM) showed similar trends with significant differences for season, depth, and grazing impact (Table 2; Figure 4). In the upper layer, the respiration and qCO2 of G soils was lower in Spring and Summer and higher in Autumn/Winter than UG soils. Conversely, in the deeper layer, G soils showed lower values in Spring (only for respiration) and Autumn/Winter, and higher values in Summer, compared to UG soils. For CEM, the statistical differences were only highlighted at a 15–40 cm depth. In detail, the grubbed soil showed higher values of CEM in Spring and Summer than the ungrubbed soil; in Autumn/Winter, CEM had higher values in the ungrubbed than the grubbed soil (Figure 4).
SQI showed a significant difference between the grubbed and ungrubbed soils (Table 2, Figure 3), at a depth of 0–15 cm, for the Autumn/Winter samples with a lower quality index for the G soils (0.28 ± 0.14) than for the UG soils (0.53 ± 0.02). On the other hand, at the 15–40 cm depth, statistically significant differences for SQI were reported for the Summer samples only, with a value of 0.60 ± 0.03 in the grubbed soil and of 0.43 ± 0.04 in the ungrubbed soil (Figure 3).

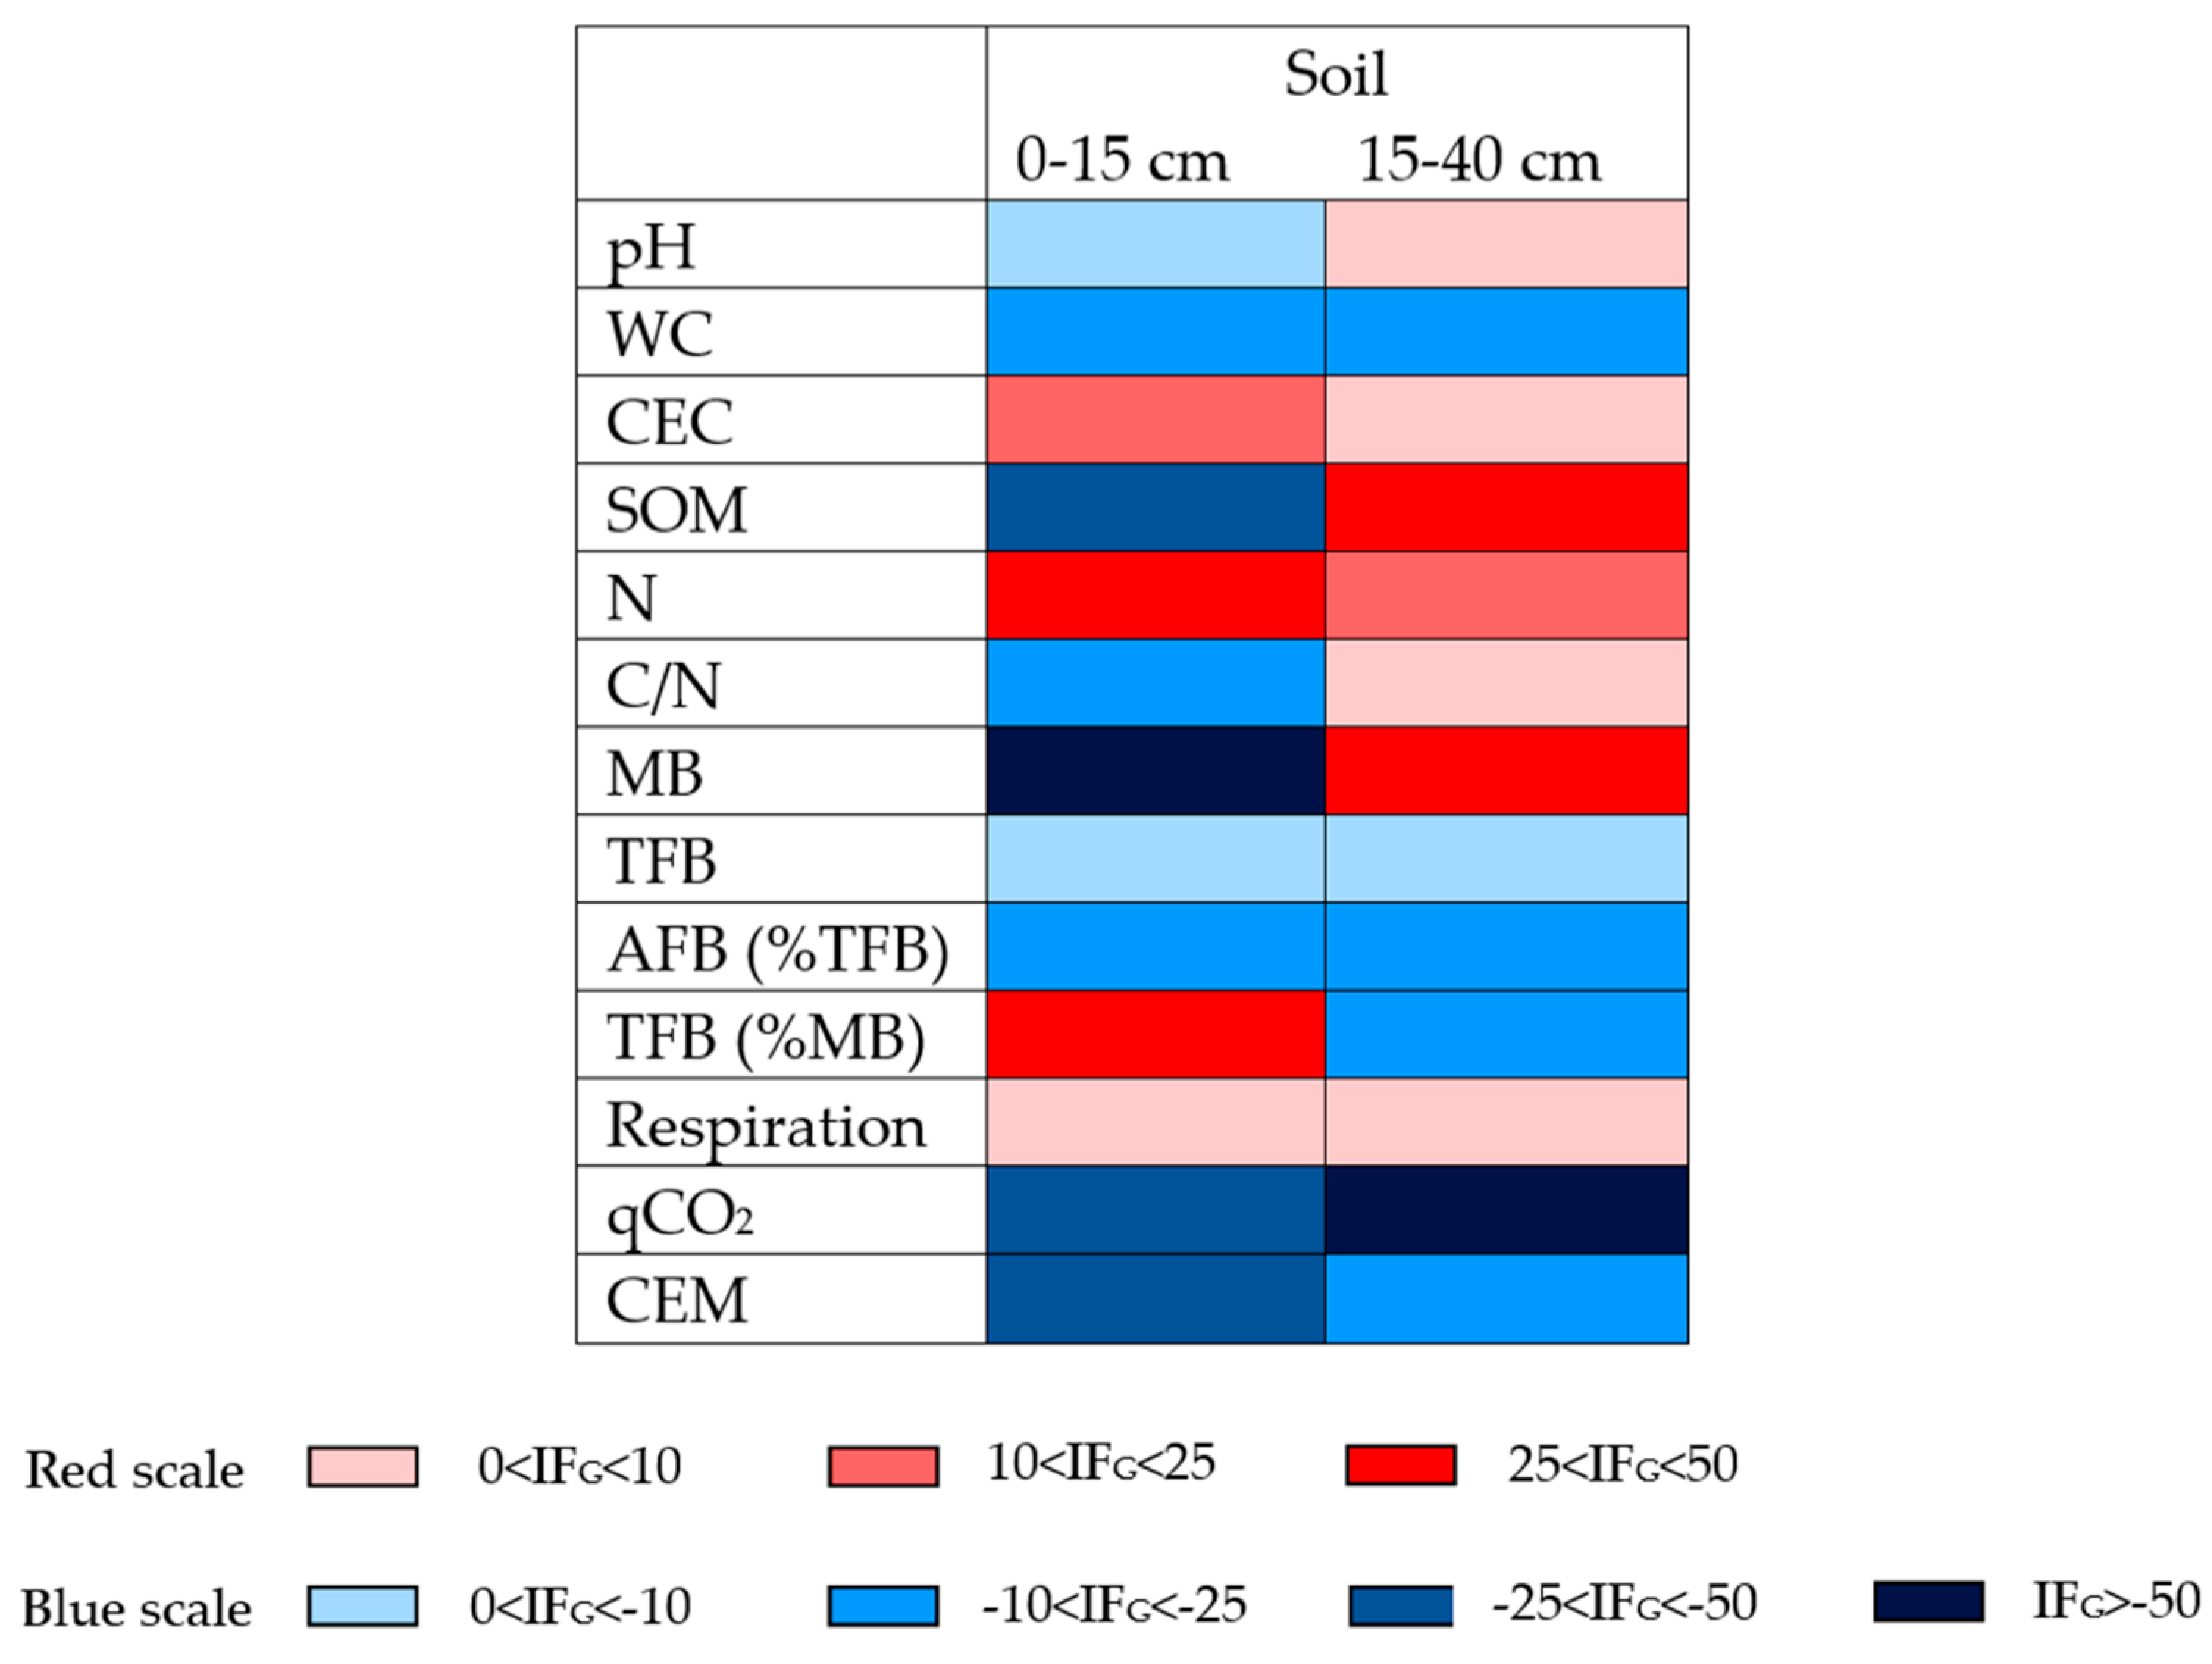
3.3. Grubbing Impact Factor

The grubbing impact factor (IFG) calculated for the soil parameters is reported in Figure 5. The impact of Sus scrofa L. differentially drove the soil parameters at 0–15 and 15–40 cm depths. In fact, in the upper layer, the wild boar activity induced an increase in the pH, SM, SOM, C/N, MB, TFB, AFB (%TFB), qCO2, and CEM values (blue scale) and a decrease in the CEC, N, TFB (%MB), and respiration (red scale) values compared to the ungrubbed soils. In the deeper layer, the SM, TFB, AFB (%TFB), TFB (%MB), qCO2, and CEM increased after grubbing activities, while conversely, the pH, CEC, SOM, N, C/N, MB, and respiration values decreased.
The cluster analysis (Supplementary Material Figure S3) grouped the IFG values according to the UPGMA algorithm to highlight the similarities and differences among the soil parameters affected by wild boar grubbing. At 0–15 cm, three main clusters could be detected in which the microbial biomass alone seemed to be impacted the most by the wild boar grubbing. A second cluster was represented by fungi and the mineralization process (CEM). The total fungal biomass had a similarity with pH, while the active fungal fraction was similar to SM and C/N. The mineralization rate was related to the SOM amount. The third group of clusters was related to the microbial activities (qCO2 and respiration) strictly associated with CEC and N content. At 15–40 cm, the first cluster was represented by qCO2, with a strong impact of the wild boar grubbing on this parameter. The next separation concerned the total and active fungal biomass and CEM related with soil moisture. The third cluster displayed a similar pattern for microbial biomass and SOM, as well as for microbial respiration and pH, CEC, and C/N (Supplementary Material Figure S3).

3.4. Leaf and Fruit Characteristics of Olive Trees

The functional leaf traits, namely, leaf area (LA), relative water content (RWC), nitrogen (N), and C/N, and the fruit features of pulp/stone ratio (P/S), dry matter (DM), and total polyphenols (Tp) of Olea europaea L. plants are reported in Table 3. The comparison between the grubbed and ungrubbed soils did not evidence statistically significant differences in the leaf traits, except for C/N ratio, which showed lower values in G than in UG sites.
The fruit pulp/stone ratio, dry matter, and total polyphenols were statistically lower in G areas (P/S: 4.02 ± 0.25 g f.w., DM: 32.4 ± 0.8%, Tp: 56.6 ± 1.6 mg GAE 100 g f.w.−1) than in UG areas (P/S: 4.40 ± 0.18 g f.w., DM: 36.2 ± 0.9%, Tp: 84.8 ± 2.1 mg GAE 100 g f.w.−1).
At 0–15 cm in the grubbed areas, LA was negatively correlated with soil CEC and SQI, as well as RWC with SOM and soil N content. Leaf N was negatively correlated with pH and soil C/N ratio, and positively correlated with CEC in the superficial layer (Supplementary Material Table S2). Moreover, leaf C/N was positively correlated with soil C/N. At 15–40 cm, LA was negatively correlated with CEC, and leaf N content was negatively correlated with pH and positively correlated with CEC and SOM. On the other hand, at 0–15 cm in the ungrubbed areas, LA was negatively correlated either with SOM or SQI. RWC and leaf N were both negatively correlated with pH and positively correlated with CEC. In addition, RWC was negatively correlated with soil N, whereas leaf N was negatively correlated with soil C/N. At 15–40 cm, RWC and leaf N were both positively correlated with CEC, while N was also negatively correlated with pH (Supplementary Material Table S2).
All of the investigated fruit characteristics (P/S, DM, Tp) showed positive correlations with soil WHC and negative correlations with soil N content at 0–15 cm in both grubbed and ungrubbed areas. Additionally, DM was positively correlated with SOM for both of the investigated sites. Moreover, in ungrubbed areas, P/S, DM, and Tp were all positively correlated with SQI at 0–15 cm. No significant correlation was reported between fruits and soil at 15–40 cm (Supplementary Material Table S2).

4. Discussion

The results obtained show the significant and rapid impact of wild boar grubbing on soil quality, and this effect is evident from the individual edaphic characteristics and soil quality index values. Moreover, the immediate effects, depending on depth and many differences between the grubbed and ungrubbed soils, became particularly evident in individual seasons.

4.1. Overall Assessment of Immediate Grubbing Effect on Olive Groves

In the overall assessment of the immediate grubbing effect on soil, many chemical and physical soil parameters, as well as the number of microorganisms in the edaphic community and the percentage of fungi, respond significantly to the wild boar activities, with different impacts at 0–15 and 15–40 cm soil depths.
The mechanical digging action of the wild boar induces immediate changes in the soil’s structure, aeration, and ability to lose or retain water. In fact, regardless of depth, the significant increase in the soil moisture and ability to retain water are the result of complex processes and balances between infiltration and evaporation. Different responses have been reported for different ecosystems and grazing regimes due to local climate conditions and soil properties [7,47]. The water regime in grubbed soil is also influenced by changes in the amount and quality of organic matter along the profile due to the SOM’s capacity to retain water. Macci et al. [8] highlight that wild boar grubbing causes an input of fresh organic matter by vegetation, and a redistribution of labile and stable organic components with changes in the mineralization and humification rates along the soil profile. In deeper soil layers, the condensation processes of soil organic matter are reduced, consequently leading to the accumulation of less stabilized and more labile organic matter. The contrasting trends of SOM content and C/N ratio along the soil profile of the olive groves confirmed these immediate impacts of wild boar grubbing.
In addition, the stirring of soil layers and the consequent redistribution of organic matter and nutrients affects the soil pH and cation exchange capacity [48]. The pH change is likely also due to wild boar excretions, mainly concerning the topsoil [48]. The slight increase in the pH of the grubbed topsoil and the significant decrease at depth after grubbing strongly influence the soil microclimatic conditions and the habitats of the soil microbial community.
In the topsoil, a combination of factors such as changes in microclimatic conditions, the redistribution of organic compounds along the soil profile, and a variation of organic matter quality seems to have promoted the microbial biomass. At a depth of 0–15 cm, microbial biomass is one of the factors that is most significantly impacted by wild boar grubbing (IFG 94%), confirming this to be a sensitive indicator and early predictor of changing soil organic matter processes and soil functioning [40,48].
In addition, at the topsoil level, the grubbing activity disturbs the composition of the microbial community with a negative impact on the fungal fraction. The decrease in fungal biomass is likely due to the wild boars’ mechanical digging, which breaks the hyphae and severely damages the mycelium [49,50]. The considerable availability of organic substrates and a more alkaline pH can negatively impact the fungal component of the microbial community, while a leading role played by soil moisture is detected, especially for maintaining the activity of the fungal component [51]. The inhibition of fungal growth and the increase in microbial biomass suggest that wild boar activity may stimulate bacterial proliferation. Fungi and bacteria are the most commonly represented populations in the microbial community, and generally, bacteria actively grow and feed on the exposed surfaces of organic matter and/or inorganic particles [49,50]. The variation in pH, SM, and organic compounds also influences the microbial community composition in deeper grubbed soils, considering the increases in fungi and their active fraction on the total biomass.
The data obtained for surface and deep grubbed soils combine the prevalence of bacterial or fungal fractions more with the availability of organic substrates than their complexity, and bacteria seem to take advantage of this by the large quantity of SOM. Other studies highlight that if grubbing results in the enhanced availability and decomposability of resources entering the soil food web, it may promote bacteria over fungi [52,53].
In addition, in soil at a 15–40 cm depth, the microbial community appears to be severely stressed by wild boar activity, as evidenced by the cluster analysis and the IFG value for qCO2. The metabolic quotient (qCO2) has been used as a proxy of ecosystem disturbance and exhibits high values in intensively impacted sites [54]. The stress condition of microorganisms within deep grubbed soils is probably associated with changes in microclimatic conditions and in microbial community growth and composition, at least according to Mohr et al. [20]. Consistent with data from other authors collected in different disturbed ecosystems [55,56,57,58], the important role of organic substrate availability for microbial growth found in our data has also been confirmed. Moreover, the amount of SOM in grubbed soils is affected by both the direct activity of grazing, including grubbing, and rapid mineralization, which leads to significant losses of C [4]. The faster carbon mineralization rate in grubbed than ungrubbed soils is evident at both depths, confirming that stress conditions for microbial communities unbalances the use of resources and accelerates C loss [56,57,58].
The immediate changes induced by wild boar grubbing on soils’ chemical, physical, and biological traits reduce soil quality status. According to the SQI for the investigated olive groves from Cilento Park, the soil quality is not particularly high (the mean SQI values are below the threshold of 0.50), similar to the results of Marzaioli et al. [59] and Santorufo et al. [60] for agricultural soils. Anthropogenic activity and the prolonged and intense disturbances from wild boar, causing changes in the soil aggregation, structure stability, biological properties, and micro-habitat conditions, have affected the quality of the agricultural soils, especially in topsoil [61,62,63].
Animal activities, such as grazing or grubbing, also alter plant resource acquisition and allocation, and species living in frequently disturbed areas exhibit traits that support faster resource acquisition strategies [64,65]. The prolonged stress of plants in the grubbing areas were probably due to the recurring behavior of ungulates that generally have preferential places to gather food, defecate, or dig [48]. Kunstler et al. [64] and Loughnan and Gilbert [66] found that LA and SLA increased in disturbed communities characterized by a fast growth, since high values of these parameters are associated with higher photosynthetic rates and the light-harvesting capability of plants. The apparent increase in LA values in the leaves of grubbed areas compared to those of the ungrubbed areas likely confirm changes in functional strategies for disturbed plants. The significant reduction in the C/N ratio without a real change in leaf N content may suggest a different uptake and C utilization in grubbed areas. A direct relationship between soil responses to wild boar grubbing and leaf characteristics seems to mainly affect LA and RWC, which increases as the soil quality decreases and are specifically related to the resource content of the grubbed soil [67]. In addition, changes in the soil characteristics in grubbed areas reflect the overall fruit quality, highlighting lower values for pulp/stone ratio (P/S), dry matter (DM), and total polyphenols (Tp). The strong relationship between soil quality and fruit characteristics has been emphasized by many authors as being a consequence of different agronomic practices, fertilization, or irrigation management [68,69]. The link between soil and fruit quality is evident in our study regardless of wild boar activity, but grubbing, like anthropogenic soil tilling activities, can worsen fruit responses. For instance, it is generally reported that soil N negatively influences some fruit characteristics, especially P/S and polyphenols, after fertilization [70]. Although, during the study year, the investigated soils did not receive any form of fertilization and a similar N content was measured in the grubbed and ungrubbed soils, the fruit P/S ratio and polyphenol content can be affected by a change in the nitrogen quality in terms of the balance and proportions of ammonia and nitrate. Additionally, water management—and, hence, WHC—tends to affect fruit traits and increase quality, yield, and olive oil features [71]. In our study, the higher moisture found in the grubbed surface and deep soil may be responsible for the reduced polyphenol content of the olives harvested from the grubbed areas. It is noteworthy that the total polyphenol content is affected by irrigation levels [72,73]. Furthermore, it has demonstrated that polyphenol biosynthesis varies with plant development and fruit maturation, but also with stress conditions [74]. The increase in fruit dry matter together with soil organic matter is commonly reported in the literature because carbon resources improve plant biomass production [75].

4.2. Seasonal Variation of Grubbing Effects on Soil Quality

The seasonal variability of the impact of wild boar activity evidenced in the olive groves of Cilento National Park is in disagreement with Mohr et al.’s [20] findings for German semi-natural woodlands, with similar changes in grubbed soil characteristics for Spring and Autumn samples [20]. In the studied olive groves, the incidence of wild boar grubbing remains high in all seasons despite the different environmental and microclimatic conditions. Seasonal differences in the soil responses are the result of a different combination of factors acting together with wild boar activity on soil quality.
The negative impact of grubbing activities on the soil quality index is reported for almost all seasons and soil depths. The only exception is the Summer grubbed soil at a depth of 15–40 cm. An important role in defining the soil quality of the Summer samples may be played by the soil moisture that, in deeper layers, although low, is twice as high in the grubbed areas than in the ungrubbed areas. The soil moisture is the result of a combination of infiltration, transpiration and evaporation processes, and in Summer, evaporation processes are of considerable importance in grubbed soils generally subjected to high solar radiation. Soils carried by wild boar deeper down along the profile retain more water, and are thus less affected by the sunlight [76,77]; as consequence, the moisture drives the activity of organisms that have survived the physical stress of ploughing by the wild boar.
A close relationship between grazing and grubbing effects on the soil microbial components, climatic conditions, and grazers’ body size was shown by the meta-analysis conducted by Andriuzzi and Wall [78]. These authors found that herbivore presence reduced microbial biomass and nitrogen mineralization in arid ecosystems, but the decomposers’ activity was stimulated with increasing soil moisture.
However, the quality of soil organic matter transported by wild boar activity is probably less complex and easier to attack by soil microorganisms that accelerate mineralization and C loss. In the Summer samples of deep grubbed soil, a reduced efficiency of carbon resource utilization and low energy investment for biomass production are a clear sign of stress in the soil microbial community [4].
Conversely, the organic matter superficially distributed by the intense excavation activity of wild boar in Summer has a high C/N ratio compared to the undisturbed soil, and this higher recalcitrance results in reduced microorganism activity [8]. On the other hand, the higher complexity of OM in grubbed topsoil would seem to activate the fungi (the active fungal fraction triples its value in the grubbing topsoil), inducing a reduced C turnover and slower mineralizing activity [49].
In Spring and Summer, the impact of wild boar activity on soils seems to have similar trends, although for several parameters in Spring, the differences between the grubbed and ungrubbed soils are less significant. The divergences in the responses to wild boar activity in the two seasons are found mainly at the 0–15 cm soil depth and, in particular, for N content, which is significantly reduced, and for microbial biomass, which increases in the Spring grubbed soil. It is likely that the more favorable microclimatic conditions induced by both season and soil mixing stimulate microbial growth [50,52]. In addition, in Spring, the vegetative renewal of both olive trees and herbaceous plants can induce a greater demand for nutrients and specifically for N, which was mainly required in the grubbed soil [57].
On the other hand, a stronger negative impact of wild boar grazing is observed in the Autumn/Winter season. Microbial biomass strongly depends on resource availability [8], among them leaves and fruits fallen abundantly on the soil and mixed by the grubbing activity along the profile. The grubbing can affect the amount and quality of resources fueling the soil food web by chemical and/or physical changes in plant litter, due to the physiological responses of plants and/or shifts in herbaceous species composition [53], or fast pools of C and nutrients coming from their excrements [79]. In addition, in grubbed areas, plants may also alter the allocation of C below ground, including root exudates [80,81], which represent, as litter, an important energy source for soil food webs [82]. Thus, wild boar grubbing may alter the allocation of C above ground and below ground as well as the litter amount and quality. Soils’ immediate responses to wild boar activity, evidenced by an overall assessment on annual means, follow the same trends in the Autumn/Winter season where they are particularly intense. In fact, in the Autumn/Winter samples, the active fraction of fungi and microbial activity show opposite responses to grubbing for both soil depths. In these seasons, soil changes related to the physical stress results are more evident at a depth of 0–15 cm, because the wild boar community eats the abundant olive biomass fallen on the topsoil. In addition, the higher stress condition of the microbial community is also indicated by the higher microbial activity measured in these soils.

5. Conclusions

This research focuses on the disturbances caused by the grubbing activity of Sus scrofa L. on soil and plant characteristics in Mediterranean olive orchards. From this one-year study, our results show an intense impact of wild boar activity on the physical and chemical characteristics of soil, as well as on the biological features, e.g., microbial biomass, activity, and composition, acting in both the top and deeper soil layers (0–15 and 15–40 cm) over several seasons (two consecutive Springs, Summer, and Autumn/Winter).
Despite the seasonality, wild boar grubbing activity strongly affects the soil’s physical and chemical characteristics, mainly soil moisture and pH, indicating a stimulation of microbial growth in the topsoil layer. The modifications found in the microbial community are fostered by an inhibition of the fungal biomass and likely more favorable microclimatic conditions for the bacterial community. Conversely, in the deeper grubbed soil, the fungal fraction on the total microbial biomass increases, and more stressful conditions for the edaphic community are evidenced.
The decrease in the soil quality in grubbed areas affects fruit characteristics to a greater extent than leaf traits in olive trees, with an increase in fruit polyphenols.
The immediate effects of wild boar grubbing change significantly over the seasons because of a combination of specific climatic conditions, variations in the plant vegetative cycle, and wild boar feeding behavior. In fact, even if a stronger negative impact of wild boar grubbing is observed in the Autumn/Winter, the Summer dryness and the Spring vegetative recovery with favorable microclimatic conditions influence the soil’s responses to grubbing.
In this framework, the present study provides pivotal information about Mediterranean olive groves and their response to wild boar grubbing. The use of the proposed grazing impact factor turned out to be direct and helpful for the management of these ecosystems. Further studies are needed to enhance the knowledge on the effects of wild boar activities on several soil processes and characteristics, including carbon and nitrogen dynamics and microbial community differentiation. The evaluation of overall plant health status, productivity, and oil quality needs to be expanded.

Supplementary Materials

The following supporting information can be downloaded at: https://www.mdpi.com/article/10.3390/soilsystems7020038/s1. Supplementary Material Figure S1: Soil moisture (SM, % d.w.) and pH in grubbed (G) and ungrubbed (UG) soils at 0–15 and 15–40 cm depths. On the left: annual means; on the right: data for each season (Spring, Summer, and Autumn/Winter). Different lowercase letters indicate significant differences in the superficial layer, whereas uppercase letters indicate significant differences in the deeper layer of at least p < 0.05 (paired t-test for annual means and three-way ANOVA for seasonal means, respectively). Supplementary Material Figure S2: Total fungal biomass (TFB, mg g d.w.−1) in grubbed (G) and ungrubbed (UG) soils at 0–15 and 15–40 cm depths. On the left: annual means; on the right: data for each season (Spring, Summer, and Autumn/Winter). Different lowercase letters indicate significant differences in the superficial layer, whereas uppercase letters indicate significant differences in the deeper layer of at least p < 0.05 (paired t-test for annual means and three-way ANOVA for seasonal means, respectively). Supplementary Material Figure S3. Cluster analyses (UPGMA) summarizing the different impacts of wild boar grubbing (IFG) on soil parameters at 0–15 (A) and 15–40 cm (B). Supplementary Material Table S1: Coefficients of Spearman rank order correlation performed between biological (MB: microbial biomass, AFB (%TFB): percentage of active fungal biomass on total fungal biomass, TFB: total fungal biomass, TFB(%MB): percentage of fungal biomass on total microbial biomass, respiration, qCO2: metabolic quotient, CEM: coefficient of endogenous mineralization) and physical and chemical parameters (pH, SM: soil moisture, SOM: soil organic matter, NS: soil nitrogen, soil C/NS ratio, CEC: cation exchange capability, WHC: water-holding capacity, BD: bulk density) in grubbed (G) and ungrubbed (UG) soils sampled at 0–15 and 15–40 cm depths. The correlations between the biological parameters and WHC and BD are only reported for the superficial layer. In bold, statistically significant coefficients for p < 0.05 (*), p < 0.01 (**) and p < 0.001 (***) are indicated. Supplementary Material Table S2: Coefficients of Spearman rank order correlation performed between soil physical and chemical parameters (pH, CEC: cation exchange capability, SM: soil moisture, WHC: water-holding capacity, BD: bulk density, SOM: soil organic matter, NS: soil nitrogen, soil C/NS ratio) including SQI and plant features (leaf traits: LA: leaf area, RWC: relative water content, NL: leaf nitrogen leaf C/NL ratio and fruit characteristics: P/S: pulp/stone ratio, DM: dry matter and Tp: total polyphenols). Soil, leaves, and fruits were sampled in grubbed (G) and ungrubbed (UG) areas and soils sampled at 0–15 and 15–40 cm depths. The correlations between WHC and BD and plant features are only reported for the superficial layer. In bold, statistically significant coefficients for p < 0.05 (*), p < 0.01 (**) and p < 0.001 (***) are indicated.

Author Contributions

Conceptualization, P.N., A.D.M. and D.F.; validation, P.N., C.B., V.M., D.R., C.A., M.G.V., C.C., D.F. and A.D.M.; formal analysis, C.B., V.M., D.R. and C.A.; data curation, P.N., C.B., C.A. and A.D.M.; writing—original draft preparation, P.N. and A.D.M.; writing—review and editing P.N., C.B., V.M., D.R., C.A., M.G.V., C.C., D.F. and A.D.M.; visualization, P.N. and A.D.M.; supervision, A.D.M., M.G.V., C.C. and D.F.; project administration, A.D.M. and D.F. All authors have read and agreed to the published version of the manuscript.

Funding

This research received no external funding.

Institutional Review Board Statement

Not applicable.

Informed Consent Statement

Not applicable.

Data Availability Statement

Not applicable.

Acknowledgments

Our gratitude goes to the National Park of “Cilento, Vallo di Diano and Alburni” and “Ambito Territoriale di Caccia Aree Contigue” (Salerno) for allowing us to use the field sites and for logistic support. We thank the “Associazione Italiana per la Promozione delle Ricerche su Ambiente e Salute umana” (AIPRAS-ONLUS) for supporting this investigation.

Conflicts of Interest

The authors declare no conflict of interest.

References

  1. Costa, C.; Papatheodorou, E.M.; Monokrousos, N.; Stamou, G.P. Spatial variability of soil organic C, inorganic C and extractable P in a Mediterranean grazed area. Land Degrad. Dev. 2012, 26, 103–109. [Google Scholar] [CrossRef]
  2. Troiano, C.; Buglione, M.; Petrelli, S.; Belardinelli, S.; De Natale, A.; Svenning, J.C.; Fulgione, D. Traditional free-ranging livestock farming as a management strategy for biological and cultural landscape diversity: A case from the southern apennines. Land 2021, 10, 957. [Google Scholar] [CrossRef]
  3. Ferreira, C.S.S.; Seifollahi-Aghmiuni, S.; Destouni, G.; Ghajarnia, N.; Kalantari, Z. Soil degradation in the European Mediterranean region: Processes, status and consequences. Sci. Total Environ. 2022, 805, 150106. [Google Scholar] [CrossRef] [PubMed]
  4. De Marco, A.; Napoletano, P.; Panico, S.C.; Memoli, V.; Santorufo, L.; Ruggiero, A.G.; Colombo, C.; Barile, R.; Maisto, G. Combined effect of black locust invasion and fire on soils of Mediterranean shrublands and pine forests. Catena 2023, 220, 106656. [Google Scholar] [CrossRef]
  5. Carpio, A.J.; Apollonio, M.; Acevedo, P. Wild ungulate overabundance in Europe: Contexts, causes, monitoring and management recommendations. Mamm. Rev. 2021, 51, 95–108. [Google Scholar] [CrossRef]
  6. Toyota, K.; Young, I.M.; Ritz, K. Effects of soil matric potential and bulk density on the growth of Fusarium oxysporum f. sp. raphani. Soil Biol. Biochem. 1996, 28, 1139–1145. [Google Scholar] [CrossRef]
  7. Greenwood, K.L.; McKenzie, B.M. Grazing effects on soil physical properties and the consequences for pastures: A review. Aust. J. Exp. Agric. 2001, 41, 1231–1250. [Google Scholar] [CrossRef]
  8. Macci, C.; Doni, S.; Bondi, G.; Davini, D.; Masciandaro, G.; Pistoia, A. Effects of wild boar (Sus scrofa) grazing on soil properties in Mediterranean environment. Catena 2012, 98, 79–86. [Google Scholar] [CrossRef]
  9. Fulgione, D.; Rippa, D.; Buglione, M.; Trapanese, M.; Petrelli, S.; Maselli, V. Unexpected but welcome. Artificially selected traits may increase fitness in wild boar. Evol. Appl. 2016, 9, 769–776. [Google Scholar] [CrossRef]
  10. Maselli, V.; Rippa, D.; De Luca, A.; Larson, G.; Wilkens, B.; Linderholm, A.; Masseti, M.; Fulgione, D. Southern Italian wild boar population, hotspot of genetic diversity. Hystrix 2016, 27, 137–144. [Google Scholar] [CrossRef]
  11. Fulgione, D.; Buglione, M. The Boar War: Five Hot Factors Unleashing Boar Expansion and Related Emergency. Land 2022, 11, 887. [Google Scholar] [CrossRef]
  12. Fanelli, A.; Perrone, A.; Ferroglio, E. Spatial and temporal dynamics of wild boars Sus scrofa hunted in Alpine environment. Eur. J. Wildl. Res. 2021, 67, 47. [Google Scholar] [CrossRef]
  13. Petrelli, S.; Buglione, M.; Maselli, V.; Troiano, C.; Larson, G.; Frantz, L.; Manin, A.; Ricca, E.; Baccigalupi, L.; Wright, D.; et al. Population genomic, olfactory, dietary, and gut microbiota analyses demonstrate the unique evolutionary trajectory of feral pigs. Mol. Ecol. 2022, 31, 220–237. [Google Scholar] [CrossRef] [PubMed]
  14. Mauri, L.; Sallustio, L.; Tarolli, P. The geomorphologic forcing of wild boars. Earth Surf. Process. Landf. 2019, 44, 2085–2094. [Google Scholar] [CrossRef]
  15. Barrios-Garcia, M.N.; Ballari, S.A. Impact of wild boar (Sus scrofa) in its introduced and native range: A review. Biol. Invasions 2012, 14, 2283–2300. [Google Scholar] [CrossRef]
  16. Singer, F.J.; Swank, W.T.; Clebsch, E.E.C. Effects of Wild Pig Rooting in a Deciduous Forest. J. Wildl. Manag. 1984, 48, 464–473. [Google Scholar] [CrossRef]
  17. Siemann, E.; Carrillo, J.A.; Gabler, C.A.; Zipp, R.; Rogers, W.E. Experimental test of the impacts of feral hogs on forest dynamics and processes in the southeastern US. For. Ecol. Manag. 2009, 258, 546–553. [Google Scholar] [CrossRef]
  18. Tierney, T.A.; Cushman, J.H. Temporal changes in native and exotic vegetation and soil characteristics following disturbances by feral pigs in a California grassland. Biol. Invasions 2006, 8, 1073–1089. [Google Scholar] [CrossRef]
  19. Moody, A.; Jones, J.A. Soil response to canopy position and feral pig disturbance beneath Quercus agrifolia on Santa Cruz Island, California. Appl. Soil Ecol. 2000, 14, 269–281. [Google Scholar] [CrossRef]
  20. Mohr, D.; Cohnstaedt, L.W.; Topp, W. Wild boar and red deer affect soil nutrients and soil biota in steep oak stands of the Eifel. Soil Biol. Biochem. 2005, 37, 693–700. [Google Scholar] [CrossRef]
  21. Wirthner, S.; Frey, B.; Busse, M.D.; Schütz, M.; Risch, A.C. Effects of wild boar (Sus scrofa L.) rooting on the bacterial community structure in mixed-hardwood forest soils in Switzerland. Eur. J. Soil Biol. 2011, 47, 296–302. [Google Scholar] [CrossRef]
  22. Panico, S.C.; Memoli, V.; Esposito, F.; Maisto, G.; De Marco, A. Plant cover and management practices as drivers of soil quality. Appl. Soil Ecol. 2018, 129, 34–42. [Google Scholar] [CrossRef]
  23. Memoli, V.; De Marco, A.; Esposito, F.; Panico, S.C.; Barile, R.; Maisto, G. Seasonality, altitude and human activities control soil quality in a national park surrounded by an urban area. Geoderma 2019, 337, 1–10. [Google Scholar] [CrossRef]
  24. Welander, J. Spatial and temporal dynamics of wild boar (Sus scrofa) rooting in a mosaic landscape. J. Zool. 2000, 252, 263–271. [Google Scholar] [CrossRef]
  25. Schley, L.; Roper, T.J. Diet of wild boar Sus scrofa in Western Europe, with particular reference to consumption of agricultural crops. Mamm. Rev. 2003, 33, 43–56. [Google Scholar] [CrossRef]
  26. Bobek, B.; Furtek, J.; Bobek, J.; Merta, D.; Wojciuch-Ploskonka, M. Spatio-temporal characteristics of crop damage caused by wild boar in north-eastern Poland. Crop Prot. 2017, 93, 106–112. [Google Scholar] [CrossRef]
  27. Prodotti Tipici Della Campania. Available online: http://www.agricoltura.regione.campania.it/tipici/olio-cilento.html (accessed on 9 January 2023).
  28. Scandurra, A.; Magliozzi, L.; Fulgione, D.; Aria, M.; D’Aniello, B. Lepidoptera Papilionoidea communities as a sentinel of biodiversity threat: The case of wild boar rooting in a Mediterranean habitat. J. Insect Conserv. 2016, 20, 353–362. [Google Scholar] [CrossRef]
  29. Maselli, V.; Rippa, D.; Russo, G.; Ligrone, R.; Soppelsa, O.; D’Aniello, B.; Raia, P.; Fulgione, D. Wild boars’ social structure in the Mediterranean habitat. Ital. J. Zool. 2014, 81, 610–617. [Google Scholar] [CrossRef]
  30. Mazzoleni, S.; Manes, F. Blasi Analysis of a pioneer community of Dittrichia viscosa (L.) greuter in a mediter ranean environment in southern italy. G. Bot. Ital. 1990, 124, 321–329. [Google Scholar] [CrossRef]
  31. IUSS. IUSS Working Group WRB: World Reference Base for Soil Resources 2014, Update 2015; World Soil Resources Report No. 106; FAO: Rome, Italy, 2015. [Google Scholar]
  32. Colombo, C.; Miano, T. Metodi di Analisi Chimica del Suolo; Pubblicità & Stampa: Bari, Italy, 2015. [Google Scholar]
  33. Pribyl, D.W. A critical review of the conventional SOC to SOM conversion factor. Geoderma 2010, 156, 75–83. [Google Scholar] [CrossRef]
  34. Degens, B.P.; Schipper, L.A.; Sparling, G.P.; Duncan, L.C. Is the microbial community in a soil with reduced catabolic diversity less resistant to stress or disturbance? Soil Biol. Biochem. 2001, 33, 1143–1153. [Google Scholar] [CrossRef]
  35. De Marco, A.; Fioretto, A.; Giordano, M.; Innangi, M.; Menta, C.; Papa, S.; De Santo, A.V. C stocks in forest floor and mineral soil of two mediterranean beech forests. Forests 2016, 7, 181. [Google Scholar] [CrossRef]
  36. Memoli, V.; Esposito, F.; De Marco, A.; Arena, C.; Vitale, L.; Tedeschi, A.; Magliulo, V.; Maisto, G. Metal compartmentalization in different biomass portions of Helianthus annuus L. and Sorghum bicolor L. grown in an agricultural field inside an urban fabric. Appl. Soil Ecol. 2017, 121, 118–126. [Google Scholar] [CrossRef]
  37. Napoletano, P.; Colombo, C.; Di Iorio, E.; Memoli, V.; Panico, S.C.; Ruggiero, A.G.; Santorufo, L.; Maisto, G.; De Marco, A. Integrated approach for quality assessment of technosols in experimental mesocosms. Sustainability 2021, 13, 9101. [Google Scholar] [CrossRef]
  38. Liebig, M.A.; Varvel, G.; Doran, J. A simple performance-based index for assessing multiple agroecosystem functions. Agron. J. 2001, 93, 313–318. [Google Scholar] [CrossRef]
  39. Fathizad, H.; Ardakani, M.A.H.; Heung, B.; Sodaiezadeh, H.; Rahmani, A.; Fathabadi, A.; Scholten, T.; Taghizadeh-Mehrjardi, R. Spatio-temporal dynamic of soil quality in the central Iranian desert modeled with machine learning and digital soil assessment techniques. Ecol. Indic. 2020, 118, 106736. [Google Scholar] [CrossRef]
  40. Andrews, S.S.; Flora, C.B.; Mitchell, J.P.; Karlen, D.L. Growers’ perceptions and acceptance of soil quality indices. Geoderma 2003, 114, 187–213. [Google Scholar] [CrossRef]
  41. Cornelissen, J.H.C.; Lavorel, S.; Garnier, E.; Díaz, S.; Buchmann, N.; Gurvich, D.E.; Reich, P.B.; Ter Steege, H.; Morgan, H.D.; Van Der Heijden, M.G.A.; et al. A handbook of protocols for standardised and easy measurement of plant functional traits worldwide. Aust. J. Bot. 2003, 51, 335–380. [Google Scholar] [CrossRef]
  42. De Marco, A.; Arena, C.; Giordano, M.; Virzo De Santo, A. Impact of the invasive tree black locust on soil properties of Mediterranean stone pine-holm oak forests. Plant Soil 2013, 372, 473–486. [Google Scholar] [CrossRef]
  43. Nergiz, C.; Engez, Y. Compositional variation of olive fruit during ripening. Food Chem. 2000, 69, 55–59. [Google Scholar] [CrossRef]
  44. Doesouky, I.M.; Haggag, F.L.; Abdel-Migeed, M.M.; El-hady, E.S. Changes in some physical and chemical fruit properties during fruit development stage of some olive oil cultivars. Am. J. Agri. & Environ. Sci. 2010, 7, 12–17. [Google Scholar]
  45. Savarese, M.; De Marco, E.; Sacchi, R. Characterization of phenolic extracts from olives (Olea europaea cv. Pisciottana) by electrospray ionization mass spectrometry. Food Chem. 2007, 105, 761–770. [Google Scholar] [CrossRef]
  46. Hajimahmoodi, M.; Sadeghi, N.; Jannat, B.; Oveisi, M.R.; Madani, S.; Kiayi, M.; Akrami, M.R.; Ranjbar, A.M. Antioxidant activity, reducing power and total phenolic content of Iranian olive cultivar. J. Biol. Sci. 2008, 8, 779–783. [Google Scholar] [CrossRef]
  47. Schrama, M.; Heijning, P.; Bakker, J.P.; van Wijnen, H.J.; Berg, M.P.; Olff, H. Herbivore trampling as an alternative pathway for explaining differences in nitrogen mineralization in moist grasslands. Oecologia 2013, 172, 231–243. [Google Scholar] [CrossRef]
  48. Sitters, J.; Andriuzzi, W.S. Impacts of browsing and grazing ungulates on soil biota and nutrient dynamics. In The Ecology of Browsing and Grazing II. Ecological Studies (Analysis and Synthesis); Gordon, I., Prins, H., Eds.; Springer: Cham, Switzerland, 2019; pp. 215–236. [Google Scholar] [CrossRef]
  49. Six, J.; Frey, S.D.; Thiet, R.K.; Batten, K.M. Bacterial and Fungal Contributions to Carbon Sequestration in Agroecosystems. Soil Sci. Soc. Am. J. 2006, 70, 555–569. [Google Scholar] [CrossRef]
  50. Ventorino, V.; De Marco, A.; Pepe, O.; Virzo De Santo, A.; Moschetti, G. Impact of innovative agriculturalpractices of carbon sequestration on soilmicrobial community. In Carbon Sequestration in Agricultural Soils. A multidisciplinary Approach to Innovative Methods; Piccolo, A., Ed.; Springer: Berlin/Heidelberg, Germany, 2012; pp. 145–177. [Google Scholar]
  51. De Marco, A.; Esposito, F.; Berg, B.; Zarrelli, A.; De Santo, A.V. Litter inhibitory effects on soil microbial biomass, activity, and catabolic diversity in two paired stands of Robinia pseudoacacia L. and Pinus nigra Arn. Forests 2018, 9, 766. [Google Scholar] [CrossRef]
  52. Panico, S.C.; Memoli, V.; Napoletano, P.; Esposito, F.; Colombo, C.; Maisto, G.; De Marco, A. Variation of the chemical and biological properties of a Technosol during seven years after a single application of compost. Appl. Soil Ecol. 2019, 138, 156–159. [Google Scholar] [CrossRef]
  53. Bardgett, R.D.; Jones, A.C.; Jones, D.L.; Kemmitt, S.J.; Cook, R.; Hobbs, P.J. Soil microbial community patterns related to the history and intensity of grazing in sub-montane ecosystems. Soil Biol. Biochem. 2001, 33, 1653–1664. [Google Scholar] [CrossRef]
  54. Fterich, A.; Mahdhi, M.; Mars, M. Impact of grazing on soil microbial communities along a chronosequence of Acacia tortilis subsp. raddiana in arid soils in Tunisia. Eur. J. Soil Biol. 2012, 50, 56–63. [Google Scholar] [CrossRef]
  55. Di Iorio, E.; Napoletano, P.; Circelli, L.; Memoli, V.; Santorufo, L.; De Marco, A.; Colombo, C. Comparison of natural and technogenic soils developed on volcanic ash by Vis-NIR spectroscopy. Catena 2022, 216, 106369. [Google Scholar] [CrossRef]
  56. De Marco, A.; Meola, A.; Esposito, F.; De Santo, A.V. Productivity and modifications of ecosystem processes in gaps of a low Macchia on southern Italy. Web Ecol. 2008, 8, 55–66. [Google Scholar] [CrossRef]
  57. Panico, S.C.; Esposito, F.; Memoli, V.; Vitale, L.; Polimeno, F.; Magliulo, V.; Maisto, G.; De Marco, A. Variations of agricultural soil quality during the growth stages of sorghum and sunflower. Appl. Soil Ecol. 2020, 152, 103569. [Google Scholar] [CrossRef]
  58. Di Iorio, E.; Circelli, L.; Angelico, R.; Torrent, J.; Tan, W.; Colombo, C. Environmental implications of interaction between humic substances and iron oxide nanoparticles: A review. Chemosphere 2022, 303, 135172. [Google Scholar] [CrossRef] [PubMed]
  59. Marzaioli, R.; D’Ascoli, R.; De Pascale, R.A.; Rutigliano, F.A. Soil quality in a Mediterranean area of Southern Italy as related to different land use types. Appl. Soil Ecol. 2010, 44, 205–212. [Google Scholar] [CrossRef]
  60. Santorufo, L.; Memoli, V.; Panico, S.C.; Esposito, F.; Vitale, L.; Di Natale, G.; Trifuoggi, M.; Barile, R.; De Marco, A.; Maisto, G. Impact of anthropic activities on soil quality under different land uses. Int. J. Environ. Res. Public Health 2021, 18, 8423. [Google Scholar] [CrossRef]
  61. Askari, M.S.; Holden, N.M. Quantitative soil quality indexing of temperate arable management systems. Soil Tillage Res. 2015, 150, 57–67. [Google Scholar] [CrossRef]
  62. Raiesi, F.; Kabiri, V. Identification of soil quality indicators for assessing the effect of different tillage practices through a soil quality index in a semi-arid environment. Ecol. Indic. 2016, 71, 198–207. [Google Scholar] [CrossRef]
  63. Napoletano, P.; Guezgouz, N.; Di Iorio, E.; Colombo, C.; Guerriero, G.; De Marco, A. Anthropic impact on soil heavy metal contamination in riparian ecosystems of northern Algeria. Chemosphere 2022, 313, 137522. [Google Scholar] [CrossRef]
  64. Kunstler, G.; Falster, D.; Coomes, D.A.; Hui, F.; Kooyman, R.M.; Laughlin, D.C.; Poorter, L.; Vanderwel, M.; Vieilledent, G.; Wright, S.J.; et al. Plant functional traits have globally consistent effects on competition. Nature 2016, 529, 204–207. [Google Scholar] [CrossRef]
  65. Smith, E.A.; Holden, E.M.; Brown, C.; Cahill, J.F. Disturbance has lasting effects on functional traits and diversity of grassland plant communities. PeerJ 2022, 10, e13179. [Google Scholar] [CrossRef]
  66. Loughnan, D.; Gilbert, B. Trait-mediated community assembly: Distinguishing the signatures of biotic and abiotic filters. Oikos 2017, 126, 1112–1122. [Google Scholar] [CrossRef]
  67. Cramer, M.D.; Hawkins, H.J.; Verboom, G.A. The importance of nutritional regulation of plant water flux. Oecologia 2009, 161, 15–24. [Google Scholar] [CrossRef] [PubMed]
  68. Moodley, R.; Koorbanally, N.; Jonnalagadda, S.B. Elemental composition and fatty acid profile of the edible fruits of Amatungula (Carissa macrocarpa) and impact of soil quality on chemical characteristics. Anal. Chim. Acta 2012, 730, 33–41. [Google Scholar] [CrossRef]
  69. Doğan, B.; Gülser, C. Soil quality assessment for olive groves areas of menderes district, izmir-turkey. Eurasian J. Soil Sci. 2020, 9, 298–305. [Google Scholar] [CrossRef]
  70. Fernández-Escobar, R.; Marin, L.; Sánchez-Zamora, M.A.; García-Novelo, J.M.; Molina-Soria, C.; Parra, M.A. Long-term effects of N fertilization on cropping and growth of olive trees and on N accumulation in soil profile. Eur. J. Agron. 2009, 31, 223–232. [Google Scholar] [CrossRef]
  71. Grattan, S.R.; Berenguer, M.J.; Connell, J.H.; Polito, V.S.; Vossen, P.M. Olive oil production as influenced by different quantities of applied water. Agric. Water Manag. 2006, 85, 133–140. [Google Scholar] [CrossRef]
  72. Jess Tovar, M.; Paz Romero, M.; Girona, J.; Jos Motilva, M. L-phenylalanine ammonia-lyase activity and concentration of phenolics in developing olive (Olea europaea L. cv Arbequina) fruit grown under different irrigation regimes. J. Sci. Food Agric. 2002, 82, 892–898. [Google Scholar] [CrossRef]
  73. Machado, M.; Felizardo, C.; Fernandes-Silva, A.A.; Nunes, F.M.; Barros, A. Polyphenolic compounds, antioxidant activity and l-phenylalanine ammonia-lyase activity during ripening of olive cv. “Cobrançosa” under different irrigation regimes. Food Res. Int. 2013, 51, 412–421. [Google Scholar] [CrossRef]
  74. Tomás-Barberán, F.A.; Espín, J.C. Phenolic compounds and related enzymes as determinants of quality in fruits and vegetables. J. Sci. Food Agric. 2001, 81, 853–876. [Google Scholar] [CrossRef]
  75. Chehab, H.; Tekaya, M.; Ouhibi, M.; Gouiaa, M.; Zakhama, H.; Mahjoub, Z.; Laamari, S.; Sfina, H.; Chihaoui, B.; Boujnah, D.; et al. Effects of compost, olive mill wastewater and legume cover cropson soil characteristics, tree performance and oil quality of olive trees cv. Chemlali grown under organic farming system. Sci. Hortic. 2019, 253, 163–171. [Google Scholar] [CrossRef]
  76. Bremer, D.J.; Auen, L.M.; Ham, J.M.; Owensby, C.E. Evapotranspiration in a prairie ecosystem: Effects of grazing by cattle. Agron. J. 2001, 93, 338–348. [Google Scholar] [CrossRef]
  77. Odriozola, I.; García-Baquero, G.; Laskurain, N.A.; Aldezabal, A. Livestock grazing modifies the effect of environmental factors on soil temperature and water content in a temperate grassland. Geoderma 2014, 235–236, 347–354. [Google Scholar] [CrossRef]
  78. Andriuzzi, W.S.; Wall, D.H. Soil biological responses to, and feedbacks on, trophic rewilding. Philos. Trans. R. Soc. B Biol. Sci. 2018, 373, 3857–3868. [Google Scholar] [CrossRef]
  79. Mikola, J.; Setälä, H.; Virkajärvi, P.; Saarijärvi, K.; Ilmarinen, K.; Voigt, W.; Vestberg, M. Defoliation and patchy nutrient return drive grazing effects on plant and soil properties in a dairy cow pasture. Ecol. Monogr. 2009, 79, 221–244. [Google Scholar] [CrossRef]
  80. Hamilton, E.W.; Frank, D.A.; Hinchey, P.M.; Murray, T.R. Defoliation ind1uces root exudation and triggers positive rhizospheric feedbacks in a temperate grassland. Soil Biol. Biochem. 2008, 40, 2865–2873. [Google Scholar] [CrossRef]
  81. Sun, L.; Ataka, M.; Kominami, Y.; Yoshimura, K. Relationship between fine-root exudation and respiration of two Quercus species in a Japanese temperate forest. Tree Physiol. 2017, 37, 1011–1020. [Google Scholar] [CrossRef] [PubMed]
  82. Pollierer, M.M.; Langel, R.; Körner, C.; Maraun, M.; Scheu, S. The underestimated importance of belowground carbon input for forest soil animal food webs. Ecol. Lett. 2007, 10, 729–736. [Google Scholar] [CrossRef]
Figure 1. Geolocation of the sampling sites (grubbed area: G and ungrubbed area: UG) in the “Cilento e Vallo di Diano” National Park (Campania region, southern Italy).
Soilsystems 07 00038 g001
Figure 2. Annual means of soil organic matter (SOM, % d.w.), nitrogen (N, % d.w.), C/N ratio, microbial biomass (MB, mg Cmic g d.w.−1), percentage of active fungal biomass on total fungal biomass (AFB (%TFB)), percentage of fungal biomass on total microbial biomass (TFB (%MB)), respiration (mg CO2 g d.w. h−1), metabolic quotient (qCO2, mg C-CO2 mg Cmic−1), and coefficient of endogenous mineralization (CEM, mg C-CO2 g Corg−1) in grubbed (G) and ungrubbed (UG) soils at depths of 0–15 and 15–40 cm. Different lowercase letters indicate significant differences in the superficial layer, whereas uppercase letters indicate significant differences in the deeper layer of at least p < 0.05 (paired t-test).
Soilsystems 07 00038 g002
Figure 3. Soil quality index (SQI) in grubbed (G) and ungrubbed (UG) soils at 0–15 and 15–40 cm depths. On the left: annual means; on the right: data for each season (Spring, Summer, and Autumn/Winter). Different lowercase letters indicate significant differences in the superficial layer, whereas uppercase letters indicate significant difference in the deeper layer of at least p < 0.05 (paired t-test for annual means and three-way ANOVA for seasonal means, respectively).
Soilsystems 07 00038 g003
Figure 4. Seasonal means of soil organic matter (SOM, % d.w.), nitrogen (N, % d.w.), C/N ratio, microbial biomass (MB, mg Cmic g d.w.−1), percentage of active fungal biomass on total fungal biomass (AFB (%TFB)), percentage of fungal biomass on total microbial biomass (TFB (%MB)), respiration (mg CO2 g d.w. h−1), metabolic quotient (qCO2, mg C-CO2 mg Cmic−1), and coefficient of endogenous mineralization (CEM, mg C-CO2 g Corg−1) for Spring, Summer, and Autumn/Winter in grubbed (G) and ungrubbed (UG) soils at 0–15 and 15–40 cm depths. Different lowercase letters indicate significant differences in the superficial layer, whereas uppercase letters indicate significant differences in the deeper layer of at least p < 0.05 (three-way ANOVA).
Soilsystems 07 00038 g004
Figure 5. Heatmap displaying the grubbing impact factor (IFG) for soil parameters (pH, SM: soil moisture, CEC: cation exchange capacity, SOM: soil organic matter, N: soil nitrogen, C/N: soil C/N ratio, MB: microbial biomass, TFB: total fungal biomass, AFB (%TFB): percentage of active fungal biomass on total fungal biomass, TFB (%MB): percentage of fungal biomass on total microbial biomass, respiration, qCO2: metabolic quotient, CEM: coefficient of endogenous mineralization). Numerical differences within the data matrix are indicated by different color scales, red and blue, that show decreasing and increasing values, respectively.
Soilsystems 07 00038 g005
Table 1. Physical and chemical characteristics (pH, SM: soil moisture, CEC: cation exchange capability; WHC: water holding capacity, BD: bulk density) of grubbed (G) and ungrubbed (UG) soils sampled at depths of 0–15 and 15–40 cm. Values are means ± standard errors. Different letters indicate statistically significant differences (paired t-test) of at least p < 0.05.
SoilGUGGUG
0–15 cm15–40 cm
pH7.07 ± 0.16 a6.68 ± 0.08 b7.12 ± 0.04 b7.77 ± 0.06 a
SM (% d.w.)15.1 ± 1.6 a12.8 ± 1.7 b16.5 ± 1.7 a14.1 ± 1.8 b
CEC (cmol+ kg−1)9.18 ± 0.01 b11.5 ± 0.02 a8.76 ± 3.429.16 ± 0.01
WHC (% d.w.) #27.6 ± 3.8 a20.3 ± 2.3 b
BD (g cm−3) #1.27 ± 0.04 b1.32 ± 0.02 a
# WHC and BD were only measured at 0–15 cm depth.
Table 2. p-values from three-way ANOVA performed in order to highlight differences in soil characteristics (SQI: soil quality index, pH, SM: soil moisture, SOM: soil organic matter, N, C/N, MB: microbial biomass, TFB: total fungal biomass, AFB (% TFB): percentage of active fungal biomass on total fungal biomass, TFB (% MB): percentage of fungal biomass on total microbial biomass, respiration, qCO2: metabolic quotient, CEM: coefficient of endogenous mineralization) among the soil samples from grubbed and ungrubbed areas at different seasons and depths. In bold, significant p-values are reported for at least < 0.05.
SeasonGrubbingDepthSeason x GrubbingSeason x DepthGrubbing x DepthSeason x Grubbing x Depth
pH<0.001<0.001<0.0010.109<0.001<0.001<0.001
SM<0.0010.0060.0440.4070.0480.7780.995
SOM0.0580.621<0.0010.6220.007<0.001<0.001
N<0.0010.028<0.0010.032<0.0010.415<0.001
C/N<0.0010.4540.007<0.001<0.0010.0050.005
MB<0.0010.6600.0050.0050.087<0.001<0.001
TFB<0.0010.3680.653<0.001<0.0010.7840.110
AFB (% TFB)0.3130.010<0.001<0.0010.0930.811<0.001
TFB (% MB)<0.0010.1860.2280.0070.395<0.0010.004
Respiration<0.0010.244<0.0010.004<0.0010.677<0.001
qCO2<0.0010.033<0.0010.062<0.001<0.001<0.001
CEM<0.001<0.001<0.001<0.0010.0020.734<0.001
SQI0.1540.0380.3220.0500.0560.0650.044
Table 3. Functional leaf traits and fruit characteristics (LA: leaf area, RWC: relative water content, P/S: pulp/stone ratio, DM: dry matter, Tp: total polyphenols) of Olea europaea L. cv. Pisciottana in grubbed (G) and ungrubbed (UG) areas. Values are means ± standard errors. Different letters indicate statistically significant differences (paired t-test) of at least p < 0.01.
LeafGUG
LA (cm2)6.42 ± 0.095.71 ± 0.35
RWC (% d.w.)81.4 ± 2.676.4 ± 3.4
N (% d.w.)1.58 ± 0.061.54 ± 0.04
C/N30.3 ± 0.2 b37.2 ± 0.4 a
Fruit
P/S (g f.w.)4.02 ± 0.25 b4.40 ± 0.18 a
DM (%)32.4 ± 0.8 b36.2 ± 0.9 a
Tp (mg GAE 100 g d.w.−1)56.6 ± 1.6 b84.8 ± 2.1 a
Disclaimer/Publisher’s Note: The statements, opinions and data contained in all publications are solely those of the individual author(s) and contributor(s) and not of MDPI and/or the editor(s). MDPI and/or the editor(s) disclaim responsibility for any injury to people or property resulting from any ideas, methods, instructions or products referred to in the content.

