Article

Urban Soil Pollution by Heavy Metals: Effect of the Lockdown during the Period of COVID-19 on Pollutant Levels over a Five-Year Study

by
Sotiria G. Papadimou
1,
Ourania-Despoina Kantzou
1,2,
Maria-Anna Chartodiplomenou
2 and
Evangelia E. Golia
1,*
1
Laboratory of Soil Science, School of Agriculture, Aristotle University of Thessaloniki, 541 24 Thessaloniki, Greece
2
Laboratory of Soil Science, Department of Agriculture Crop Production and Rural Environment, University of Thessaly, Fytokou Street, Volos, 384 46 Magnesia, Greece
*
Author to whom correspondence should be addressed.
Soil Syst. 2023, 7(1), 28; https://doi.org/10.3390/soilsystems7010028
Submission received: 13 February 2023 / Revised: 13 March 2023 / Accepted: 17 March 2023 / Published: 20 March 2023

Abstract

:
When residents of Volos, a city in central Greece, are trying to recall their daily life after the end of the quarantine due to COVID-19, the soil pollution survey provided valuable insights, which are compared with a 4-year study carried out in that area before the pandemic period. Using appropriate indices, namely contamination factor (CF), pollution load index (PLI), geo-accumulation index (Igeo), ecological risk factor (Er), and potential ecological risk index (RI), and using geostatistical tools, maps were constructed for each metal (Cu, Zn, Pb, Ni, Cd, Co, Cr, Mn). Variations in the values of the contamination indices showed a significant redistribution in pollutant load from areas previously polluted by high vehicle traffic and the activities of the main port to the residential areas, where the habitants have their homes and playgrounds. The study showed that Cu, Zn, Pb, and Co concentrations increased during the pandemic period by 10%, 22.7%, 3.7%, and 23.1%, respectively. Ni’s concentration remained almost constant, while Cd, Cr, and Mn concentrations were decreased by 21.6%, 22.2%, and 9.5%, respectively. Fluctuations in the concentrations and corresponding contamination and ecological indices of the elements can serve as a means for highlighting potential sources of pollution. Therefore, although the pandemic period created anxiety, stress, and economic hardship for citizens, it may prove to be a valuable tool for investigating the sources of pollution in urban soils. The study of these results could potentially lead to optimal ways for managing the environmental crisis and solve persistent problems that pose risks to both the soil environment and human health.

1. Introduction

Soil pollution is one of the most worrying problems affecting the environment that humanity faces today [1,2,3]. Heavy metals, which are also mentioned in the literature as potentially toxic elements (PTEs), in soil are constantly accumulating and dispersing to different parts of the ecosystem, posing in severe degradation of soil environment [4]. Industrial activities, illegal disposal of solid and liquid waste, municipal waste disposal, and inappropriate use of agrochemicals collectively contribute to the uptake and bioaccumulation of heavy and toxic metals in the soil environment [5]. In addition, the leaching of heavy metals and pesticides poses a serious pollution risk to groundwater aquifers [6,7]. Consequently, several methods have been advocated to manage soil pollution from several pollutants, such as stabilization, adsorption, and remediation of soils contaminated with heavy metals [8,9,10].
Furthermore, heavy metals pose a significant threat to human health due to human exposure to them [11,12]. Human toxic exposure to heavy metals has been linked to serious consequences for human health, such as heart and skeletal diseases, infertility, and various neurological disorders [13,14,15]. The excessive accumulation of heavy metals in the human body can cause various effects on different physiological functions, which leads to three pathogeneses: carcinogenesis, teratogenesis, and mutagenesis [16].
Urban soils, especially those in green areas such as parks, schoolyards, flowerbeds along highways, and residential areas, can have a direct impact on public health, as metal accumulation can be easily transferred to the human body [17,18]. Dust ingestion is globally recognized as one of the main routes for human and child exposure to heavy metals and metalloids, which derive from paints and varnishes, petroleum products, and leaded petrol, wheeled vehicles, and local industries located near cities [19,20]. These activities displace heavy metals into the air and the metals are then deposited in urban soil through dust containing the metal. It is well known that there is a close relationship between the levels of heavy metals in soils and those deposited in the dust [21]. The relationship between air and soil is therefore close and bidirectional. Heavy metals in soils can affect air quality because they can create particulate matter and dust [22]. For this reason, soils play a particularly important role in the migration and transformation of heavy metals [18,23]. The footprint of long-term pollution is reflected in the soil [24]. Human activities have a significant impact on the accumulation of heavy metals in soils. It is therefore self-evident that it is very important to consider the ecological risks of heavy metals to the ecosystem and the potential risks they pose to both the environment and living organisms [25].
The high intensity and frequency of human activities in cities leads to the enrichment and accumulation of more heavy metals and other pollutants in the environment [26]. More importantly, the population is generally concentrated in cities, but relatively fewer in suburbs and villages, resulting in greater risks to human health in the urban center [27]. Industrial activities and vehicle emissions are largely responsible for the accumulation of high levels of heavy metals in soils [28,29].
In Greece, human-induced activities have been reduced due to COVID-19 [30]. Amidst quarantine and national blockades, the government announced a blockade from 20 March 2020 to 31 May 2021 during four different periods [31]. Schools, colleges, shopping malls, some public transport, and hotels remained closed during the lockout period, while small and larger industries operated for a shorter number of hours as workers had to return home earlier due to the curfew [32]. Many changes were caused in food establishments, such as taverns, restaurants, and cafes, which were open for a few hours with restrictions until the afternoon, while in the evening they were closed [33]. Furthermore, in addition to travel restrictions, a strict nonessential movement ban was implemented [34]. Many changes have taken place in the daily life of citizens, in Greece and in other countries, forcing people to change their habits and reduce their activities, contributing to a possible reduction in transport-related pollution [35]. Wheeled vehicles moved less, and during the evening hours there was no transportation, as there was a strict prohibition. However, people stayed longer in their homes, using fireplaces for more hours, which were mainly used for heating and cooking [36]. As a result of this condition, there was an increase in the levels of gaseous pollutants, strong odor, and PM 2.5 particles in the air [32,37,38]. The close relationship between air and soil pollution is well known, as the soil becomes a record of long-term environmental pollution [31]. However, the change in pollution in the terrestrial environment has not been captured.
This study aims to capture and record the variability of heavy metal levels in urban soils during the COVID-19 pandemic period. The specific measures to prevent the spread of the pandemic and the curfew adopted by the decision-makers led to spatial variations in the level of heavy metals in the soil environment. For monitoring these variations, appropriate indicators and GIS tools were used.

2. Materials and Methods

2.1. Study Area, Sampling, and Sample Preparation

The study area is the urban context of the city of Volos. It is centrally located in Greece, as it is equally distant from Athens and Thessaloniki. The city is coastal, as the southern part of the city is bordered by the Pagasiticos Gulf, while the northern and eastern part is bordered by Mount Pelion. According to a previous study by Golia et al. [2,3], the western side of the city is developed as an industrial zone, where there are intense industrial activities, at metal processing stages [39]. To the east side, there is a cement manufacturing plant. Additionally, in the city, there is a commercial and passenger port, a railway station, and a station for suburban and intercity buses [31].
The survey started in 2018 and continued for the next 5 years. A total of 310 surface (0–20 cm) soil samples were collected and analyzed, 62 samples per year. The samples were gathered from the area of the port, railway station, and the urban and intercity bus station. Samples were also collected from the urban green areas, parks, and green strips located on both sides of the city’s high traffic roads [40]. Soil samples were collected in June, as it has been found that metal concentrations are also high during periods without rain, so there is a minimum possibility of leaching [4].

2.2. Chemical Analyses

After collection, soil samples were transferred to the Soil Science Laboratory to perform chemical analyses; all soil analysis methods are described in [41]. The mechanical (particle size) composition of the soil samples was determined by the Bougioukos’ method and the soil texture was defined after determining the percentages of sand, silt, and clay. The determination of pH and electrical conductivity (EC) was carried out in an aqueous soil suspension, with a soil to water ratio of 1:2.5, using Crison pH and EC meters [42].
To determine the percentage of organic matter (OM) in the soil samples, the soil samples were first oxidized using K2Cr2O7 solution and then volumetrically measured with FeSO4.7H2O solution, according to the Walkley–Black method. The percentage of CaCO3 was determined by using Bernard’s method [41]. For the determination of the pseudo-total metal concentrations, the method of extraction with a mixture of strong HCl:HNO3 acids in a ratio of 1:3 (aqua regia) was used [43].
The quantification of heavy metals was carried out with a Perkin Elmer and Shimatzou atomic absorption spectrophotometer equipped with a flame and graphite furnace attachment. In some cases, an ICP-OES Analyzer SPECTRO ARCOS spectrophotometer was used. For quality assurance and quality control of the extraction and analytical methods, a certified material (BCR-142R light sandy soil) was used. The recovery of the metals ranged from 97.1 to 102.4%.

2.3. Contamination Indices

According to [39], the following indices were measured for Cu, Zn, Pb, Ni, Cd, Co, Cr, and Mn.

2.3.1. Contamination Factor (CF)

The contamination factor (CF) index is widely used for the determination of soil contamination with single metals, according to the following formula:
CF = CAR/CAR ref
where CAR is aqua regia-extracted metal (mg kg−1). CAR ref is the background metal concentration in mostly uncontaminated areas (mg kg−1, values obtained from [1]). Four classes are distinguished, as follows: Class I: CF < 1, for pristine soils; Class II: 1 < CF < 3, for moderate contaminated soils; Class III, 3 < CF < 6 for considerably contaminated soils; and Class IV: CF > 6, for very high contaminated soils.

2.3.2. Pollution Load Index (PLI)

The pollution load index (PLI) is used for the calculation of soil contamination based on the studied metals, as follows:
PLI = (CF1 × CF2 × … × CFn)1/n
where CF is the contamination factor that is calculated by Equation (1) and n is number of metals. PLI is classified into six classes: Class I: PLI < 0, no pollution; Class II: 0 < PLI < 1, low degree of pollution; Class III: 1 < PLI < 2, moderate degree of pollution; Class IV: 2 < PLI < 4, high degree of pollution; Class V: 4 < PLI < 8, very high degree of pollution; and Class VI: 8 < PLI < 16, extremely high degree of pollution.

2.3.3. Geo–Accumulation Index (Igeo)

The geo-accumulation index (Igeo) is the amount of contamination calculated according to the following formula [44]:
Ιgeo = log2 (CAR/1.5CARref)
where CAR is an aqua regia-extracted metal (mg kg−1). CAR ref is the background metal concentration in mostly uncontaminated areas (mg kg−1, values obtained from [1]). Igeo is categorized into seven classes: Class I: Igeo < 0; Class II: 0 < Igeo < 1; Class III: 1 < Igeo < 2; Class IV: 2 < Igeo < 3; Class V: 3 < Igeo < 4; Class VI: 4 < Igeo < 5; and Class VII: Igeo > 5 [45].

2.3.4. Ecological Risk Factor (Er)

The ecological risk factor (Er) is used in estimating the ecological risk for contaminated soil. This index is based on metal toxicity and environmental response factors. Er is calculated using the following equation:
Er = Tr × CF
where Tr refers to the toxic-response factor values for each different metal. According to Zhang and Liu [46], the toxic-response factor values of heavy metals are as follows: Cu: 5, Zn: 1, Pb: 5, Ni: 5, Cd: 30, Co: no reference, Cr: 2, and Mn: 1. CF refers to the contamination factor, which is calculated by equation [1]. Five classes of Er are distinguished, as follows: Class I: Er < 40, low risk; Class II: 40 ≤ Er < 80, moderate risk; Class III: 80 ≤ Er < 160, considerable risk; Class IV: 160 ≤ Er < 320, high risk; and Class V: Er ≥ 320, very high risk.

2.3.5. Potential Ecological Risk Index (RI)

The potential ecological risk index (RI) is used to assess environmental risks from contaminated soils. According to the study by Hakanson [47], the RI is calculated using the following equation:
RI = ∑ Er
where Er is the ecological risk factor, which is calculated by equation [4]. The RI classification follows: Class I: RI < 150, low risk; Class II: 150 ≤ RI < 300, moderate risk; Class III: 300 ≤ RI < 600, considerable risk; and Class IV: RI ≥ 600, high risk.

2.4. Data Analysis

Data were statistically analyzed using Microsoft Office Excel. To find a statistically significant difference per year between metal concentrations, a pairwise T-test was used for comparison. Q-GIS software (version 3.28.2) was used for geostatistical analysis and interpolation with help from Smart Map (version 1.2). The values of the contamination factors (CFs) were used for the creation and construction of the thematic maps and were calculated as presented in detail in Section 2.3.1. The results of the geostatistical study, after applying the ordinary kriging method, are presented in Table 3, for the pre-COVID years and the pandemic period, respectively. In geostatistics, kriging is an interpolation method based on a Gaussian process governed by prior covariance. Under appropriate prior assumptions, kriging gives the best binary linear impartial prediction (BLUP) [39]. The method is widely used in the field of spatial analysis and computational experiments. The technique is also known as Wiener–Kolmogorov prediction, after Norbert Wiener and Andrey Kolmogorov.
The variance-reduction method has been used to determine the optimal fit of data. The main problem in the geostatistics method is the determination of the best semivariogram model for use in variance estimation. The different semivariogram models, linear to sill, spherical, Gaussian, linear, and exponential, were used and their performances are compared in this study. Cross-validation technique is applied to compute the errors in the semivariograms.

3. Results and Discussion

3.1. Soil Physicochemical Properties

Table 1 provides the values and basic statistics of the physicochemical attributes of the soil samples.
The soil pH values do not seem to change statistically significantly over time. In some cases, a small increase was observed, which is probably due to the addition of materials with high percentages of CaCO3 or Ca (OH)2 [4]. During the last two years in the city of Volos, many technical projects were carried out for the construction of roundabouts in central streets [31]. The building materials used may have contributed both to the increase in the concentrations of some heavy metals, and to the increase in pH and the electrical conductivity of the soil samples [48]. In certain other cases, however, the pH values are reduced and the soil samples tend to enter the acidic range [49]. The reduction in pH may be due to the use of acidifying fertilizers during landscaping, such as in the case of samples s11 and s14, which were collected in the public square in the center of the city. The electrical conductivity values are in all cases relatively low. The values of pH and EC in samples s3, s4, s26, and s40 present a slight increase through time, probably due to the vicinity of the sea, as they are located along the coastal part of the city.
The percentage of organic matter (OM) did not change significantly over the years of the present study. The high OM values found in samples in central and busy squares or in flowerbeds near the main roads are probably due to green upgrading work by the municipality’s services, as they supply them with manure or compost to increase soil fertility and plant flowering [50]. The CaCO3 percentages are fully related to the pH of the soil samples [1]. A slight increase in the alkaline reaction of the soil is in most cases accompanied by an increase in calcium carbonate content [4].

3.2. Variation in Pseudo-Total Concentrations of Heavy Metals

Table 2 present the metal concentrations before and during the COVID-19 pandemic, respectively. Cu, Zn, Pb, and Co concentrations increased during the period of the pandemic by 10%, 22.7%, 3.7%, and 23.1%, respectively. Ni’s concentration remained almost constant, while Cd, Cr, and Mn concentrations decreased by 21.6%, 22.2%, and 9.5%, respectively. The average concentrations of the metals in the study, before and during the pandemic, were below the EU-permitted concentrations [51]. If we confine attention to examining the statistics of metal levels, it is difficult to draw results and conclusions regarding the actual impact of the pandemic on urban soil pollution levels. For this reason, geostatistical analysis tools were used [39].

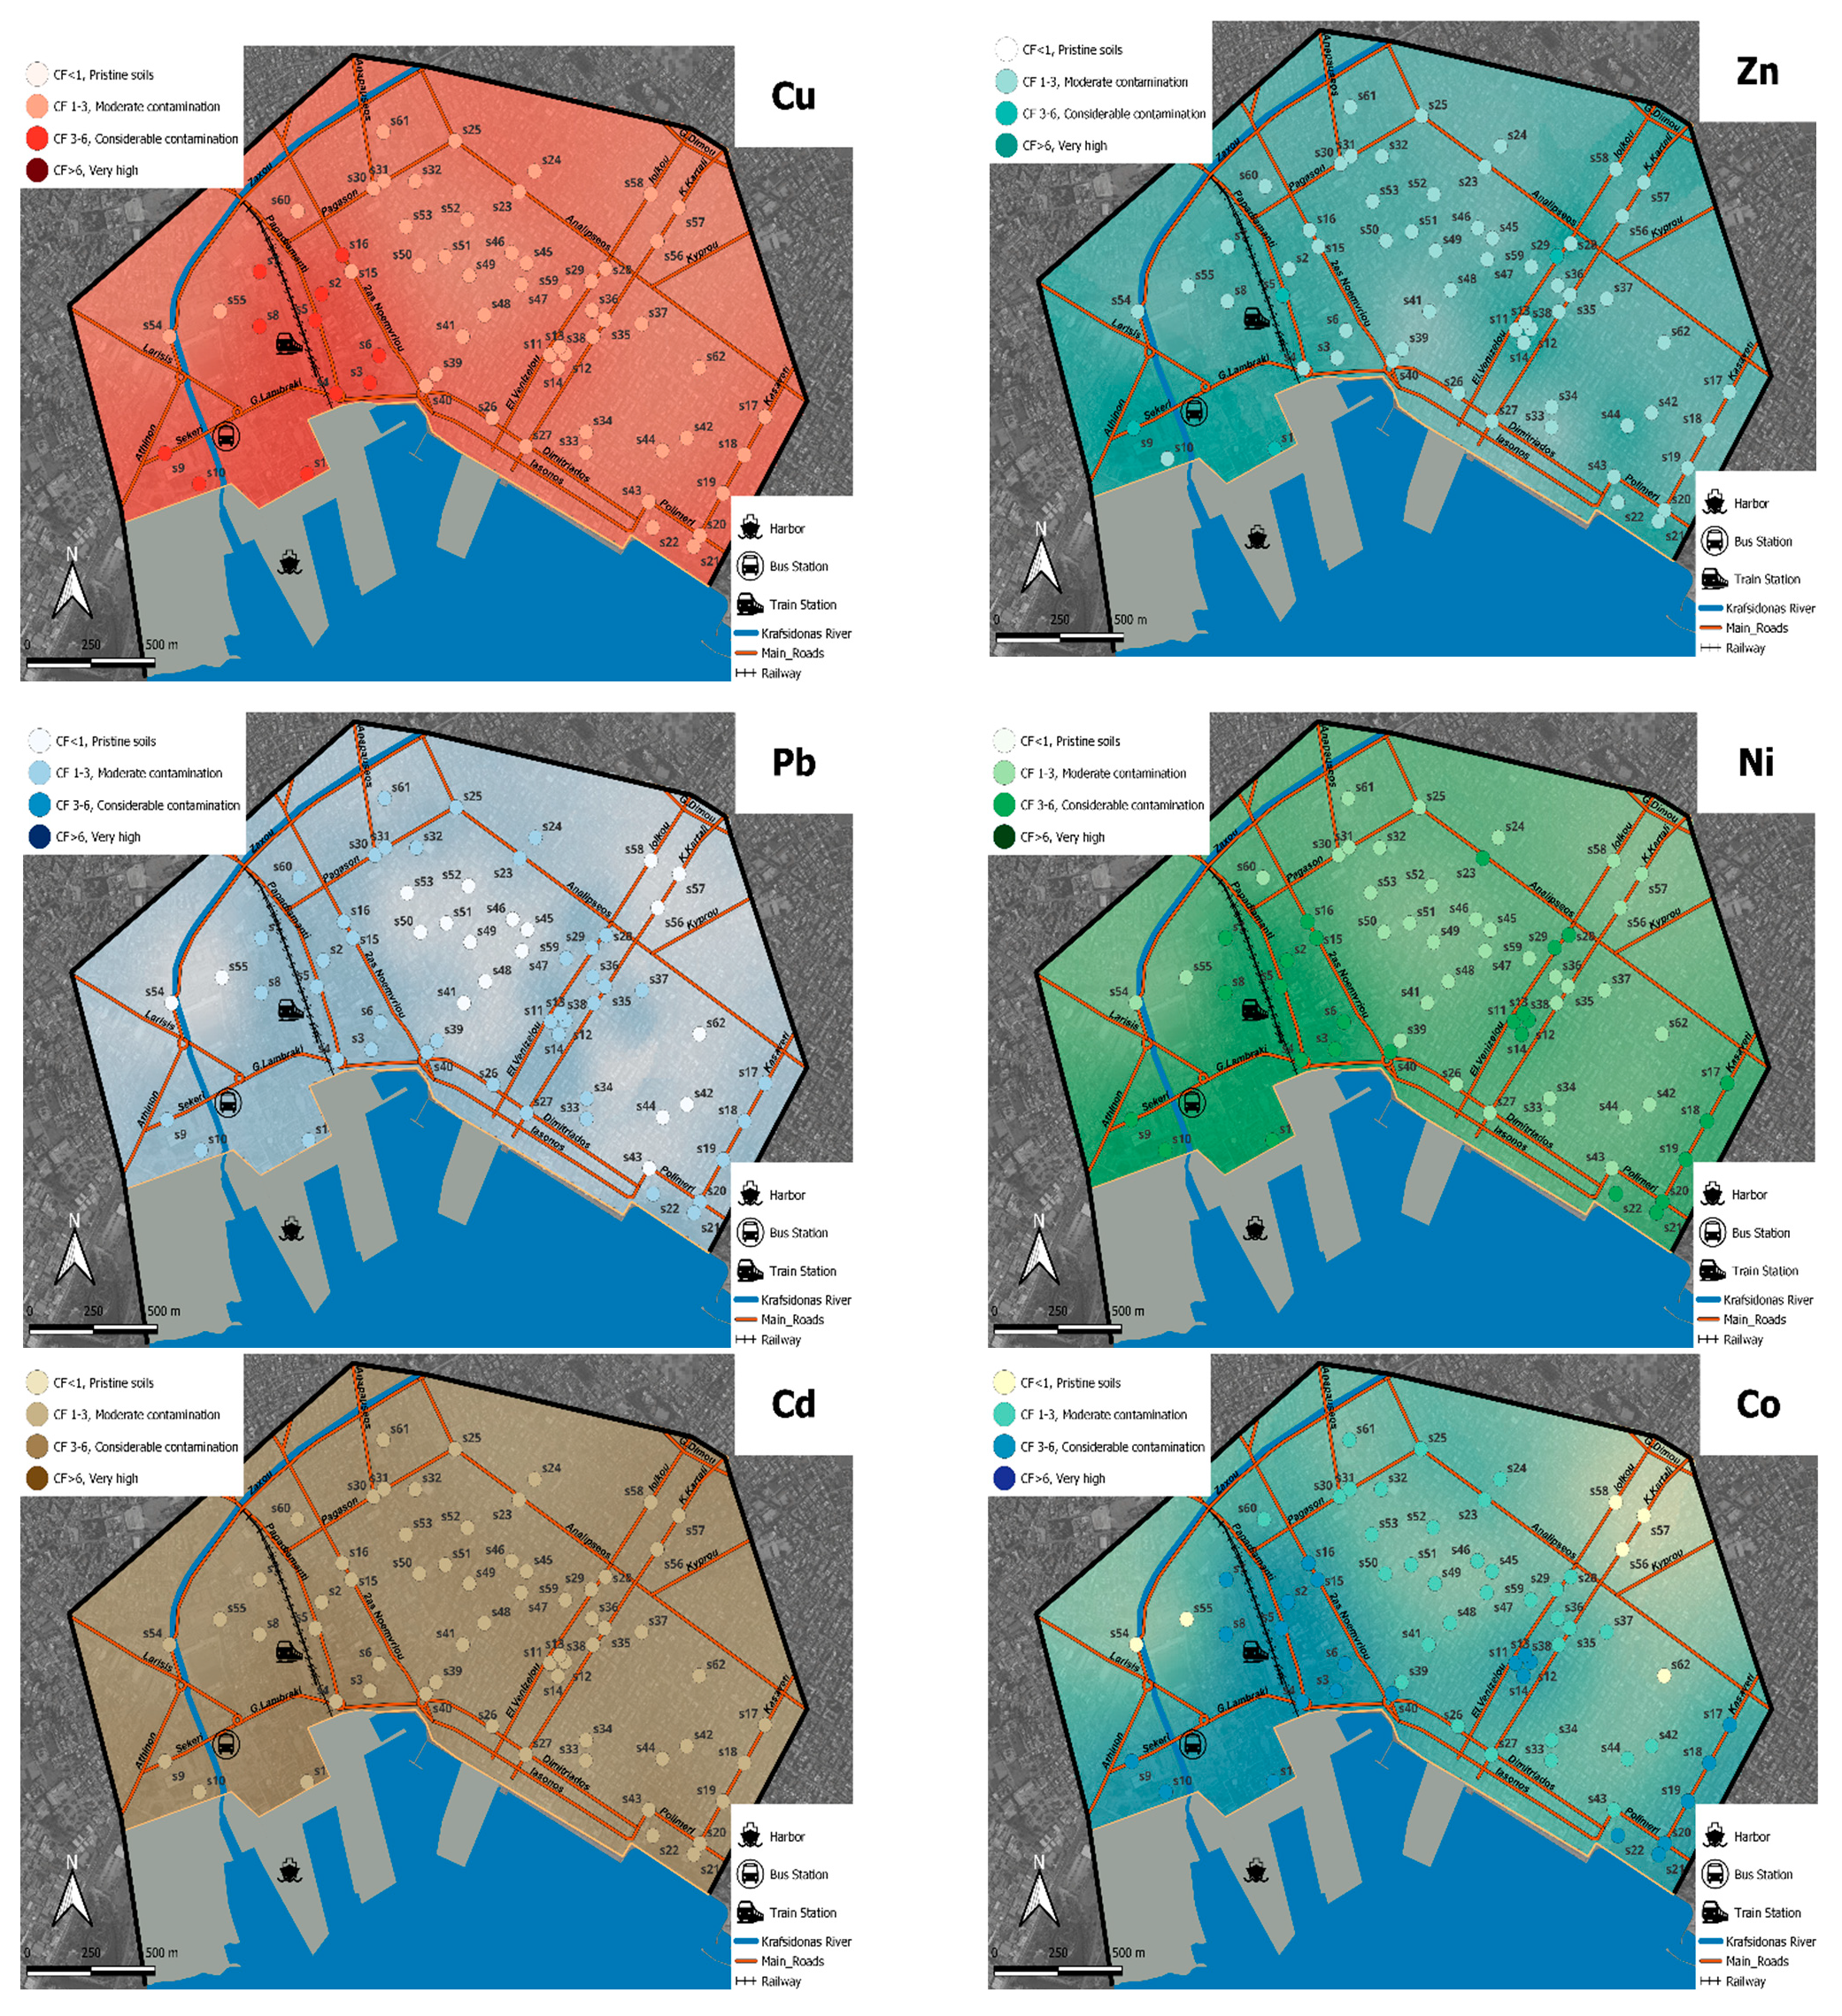
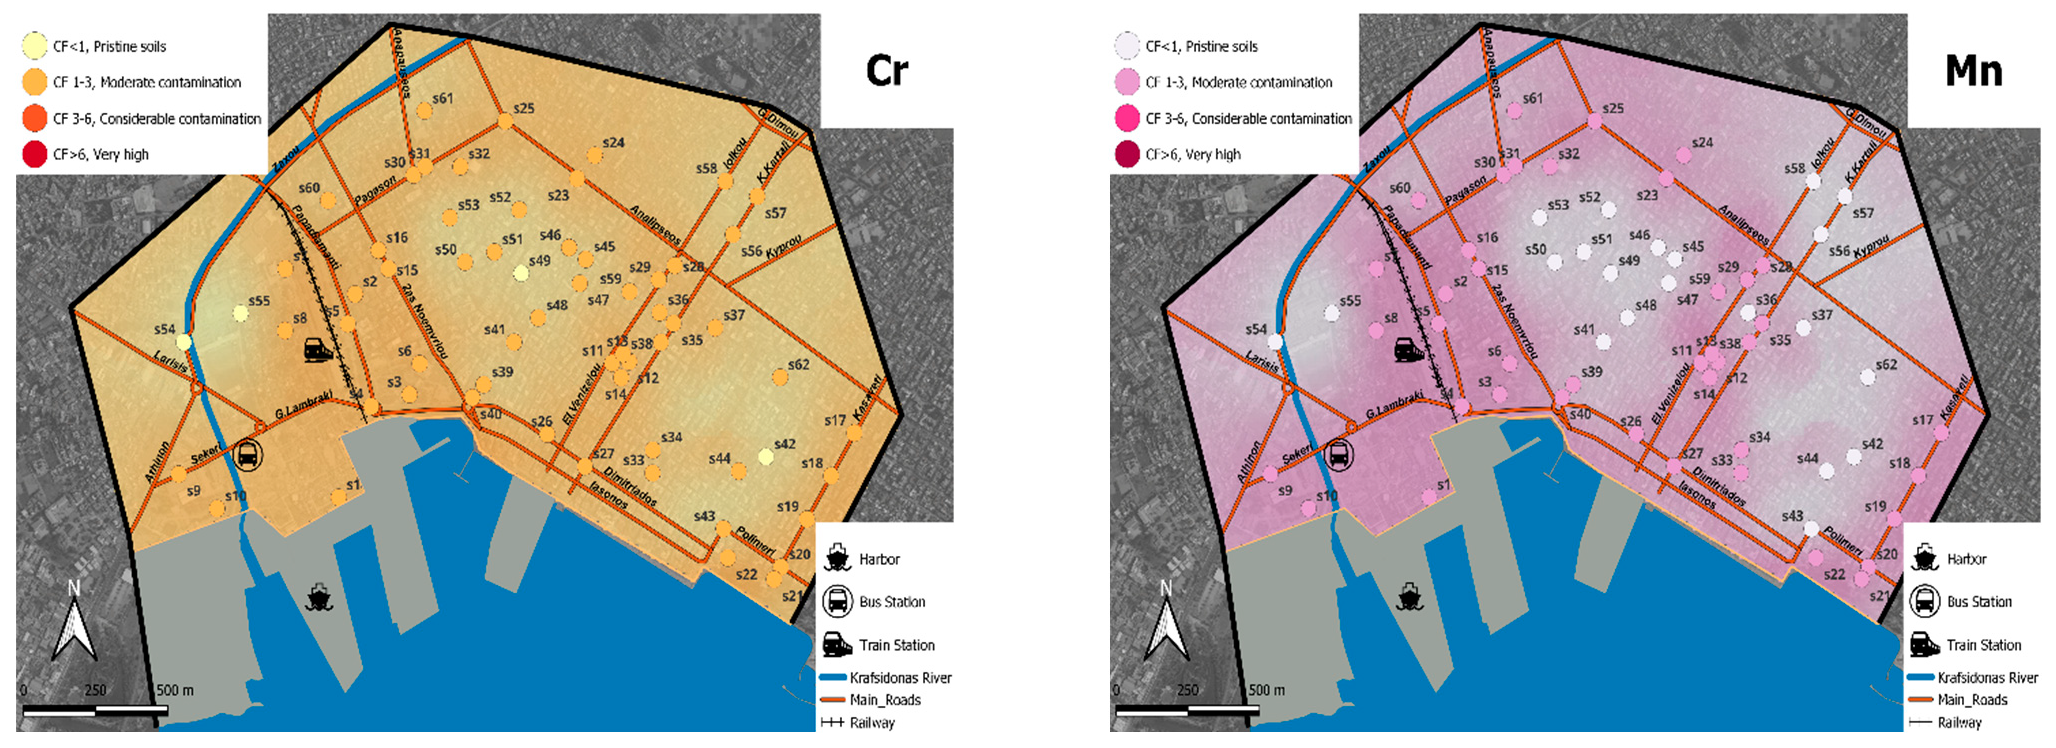
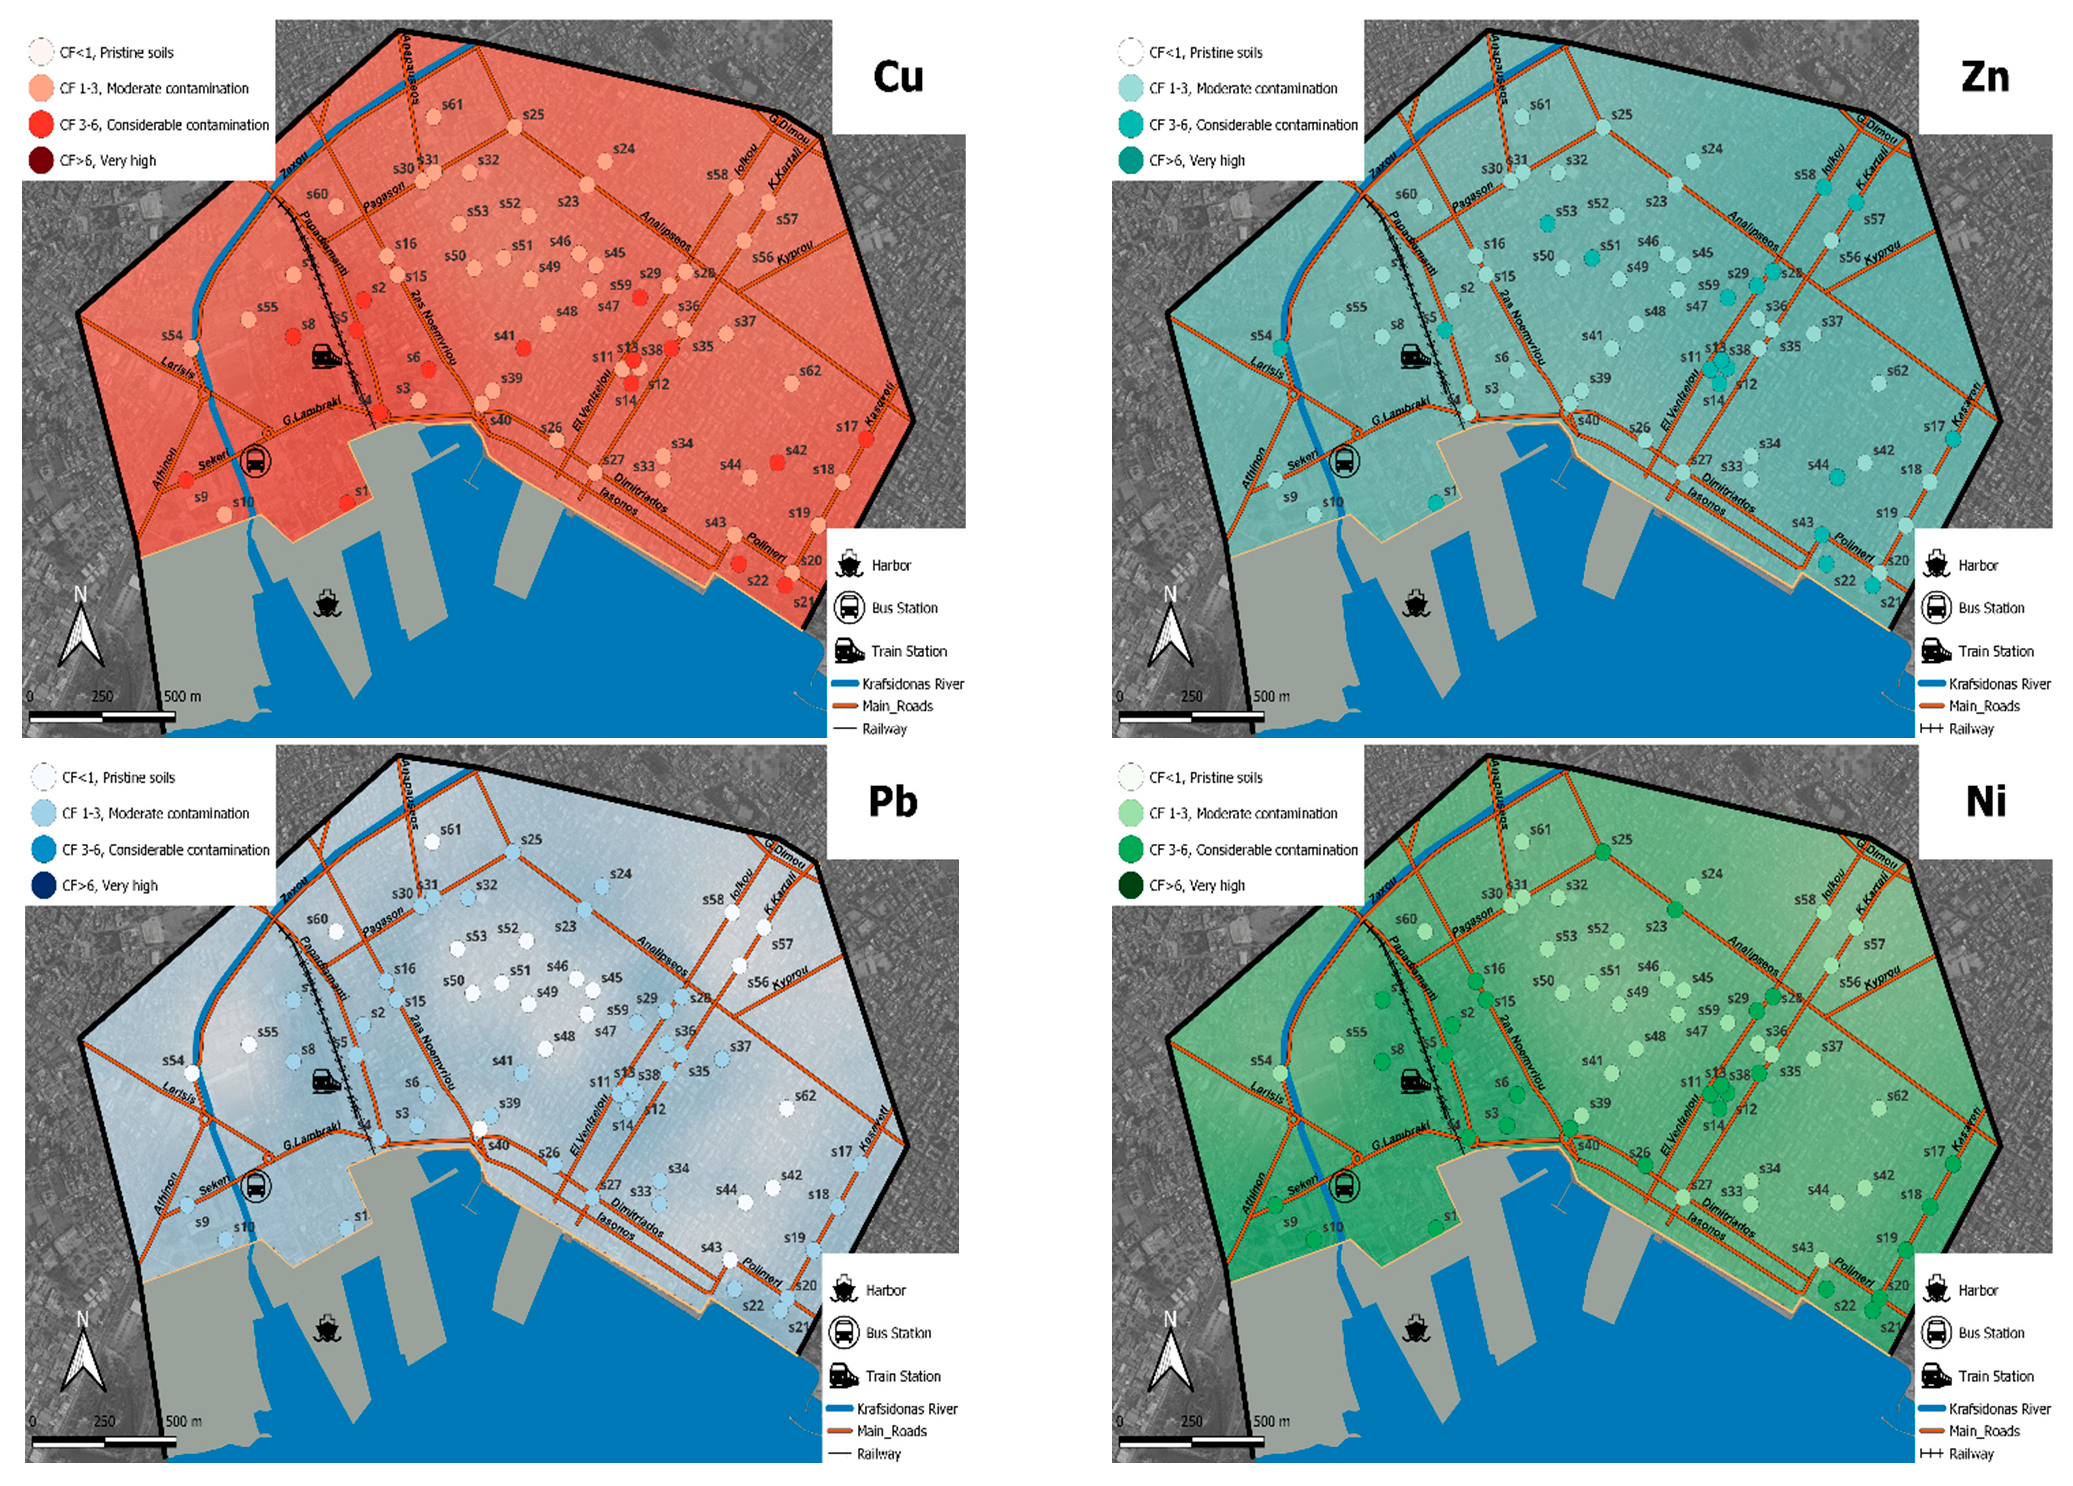
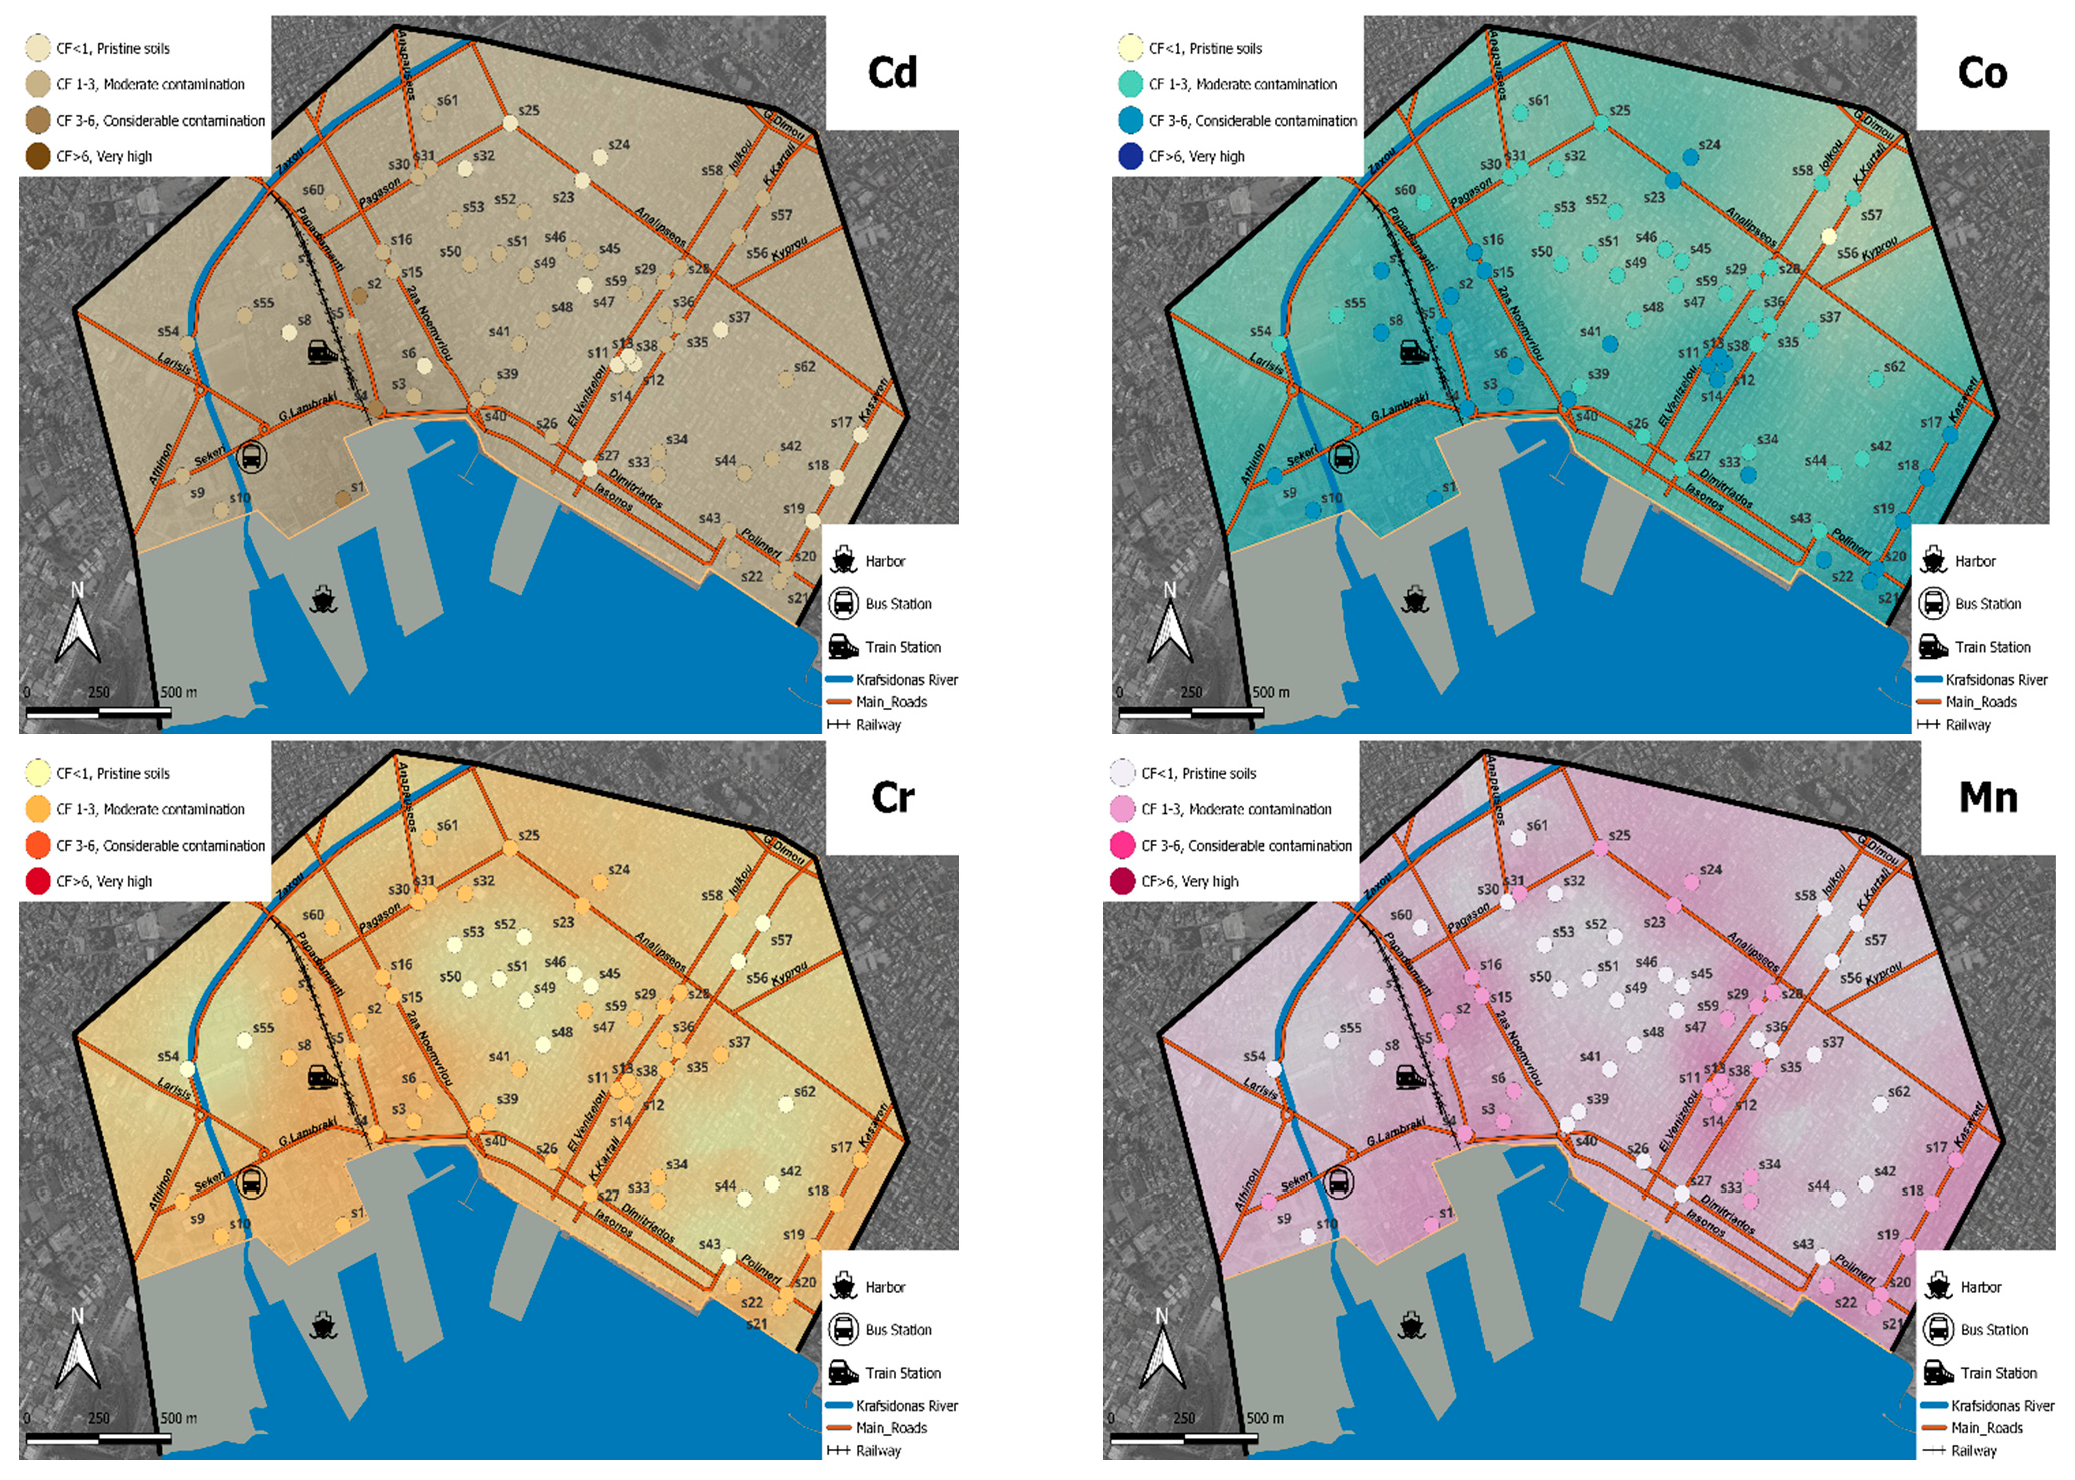
3.3. Thematic Maps of Heavy Metal Contamination Factors (CFs)

Figure 1 and Figure 2 display the thematic maps constructed based on the contamination factor (CF) value for each metal, before and during the pandemic, respectively. Additionally, the descriptive statistics for the contamination factors (CFs) before and during the pandemic, along with the geostatistical parameters used for the creation and validation of the contour maps, are presented in Table 3.
By examining the maps before and during the COVID-19 pandemic, a grouping of metals can be seen as there is a similar trend in the change in metal levels. In the case of Cu, Zn, Pb, and Co, a strong shift in the contaminant load was observed from the triangle surrounded by the port, railway station, and bus station to the residential area [39]. The period of the quarantine left indelible effects on the city of Volos, as it significantly altered metal pollution. In particular, a significant reduction in metal pollutants was observed in the soil samples located on both sides of the high traffic avenues, owing to the ban on vehicle traffic [35]. Probably, for the same reason, the concentration of heavy metals in the area bounded by the urban and intercity bus station, the railway station, and the passenger and commercial port was reduced or at least maintained constant. The short-time traffic of wheeled vehicles, minimal to no traffic of taxi drivers (owing to the ban on intercounty population movement) resulted in a moderation of the values for the respective pollution indicators for all heavy metals, while in the period before the peak, there was a continuously upward trend. High metal values were observed in the densely populated areas of the city, where, owing to the long hours of presence of residents in their homes, heaters or fireplaces were operated in order to warm the occupants, cook, and have hot water for their personal needs [32,37].
In the case of Cd and Mn, an overall decrease in pollution indicators was observed, mainly in areas where there is traffic of wheeled vehicles and means of transport, but also in the residential area. It is well known that metals cannot be degraded because of their long half-life. The fact that there is no increase is an indication that the amount of metals accumulated in previous years remains stable. So, the period of the quarantine, when citizens tried again to restore normality in their daily lives, maintained low rates of travel and activity, limiting in some cases the concentrations of metals in the soil when the source is exhausting gases discharged into the air from wheeled vehicles [38].
The decrease in Cr concentrations on the west side of the city may be due to closure of industries during the lockdown period. However, the possible sources of Cr include household waste, dyes, paints, ceramics, and pottery [52]. Probably for this reason, its concentration near the residences in the eastern area of the city remained almost constant.
The possible sources of Pb in soil are old plumbing, batteries, pipes, and paints at landfill sites. In addition, human and animal excrement can add Pb to the soil; in the case of agricultural soils, contamination occurs with phosphate fertilizers [53]. The results suggest that heavy metal contamination in soil samples is mainly associated with industrial effluents, sewage, sludge, and dumping of municipal wastes. That is, lead levels showed a small increase, lower than the other elements of the study. Although the COVID-19 pandemic has improved soil quality, probably also contributing to this effect was the shutdown of small and large-scale industries during the lockdown period in the west side of the city adjacent to the industrial area, which is located in the suburbs of the city of Volos. As the operation of small workshops, car, bicycle, motorcycle, and moped repair shops was limited during the pandemic period, this resulted in a reduction in the circulation of wheeled vehicles carrying the metal materials used for the repair needs.
Ni maintained its concentration almost unchanged during the years of the study. As we have seen in previous studies, the possible origin of Ni is geochemical [31,39]. The influence of anthropogenic activities on Ni pollution levels during the COVID-19 pandemic is almost negligible.

3.4. Contamination Factor (CF), Geo–Accumulation Index (Igeo), Ecological Risk Factor (Er), Pollution Load Index (PLI), and Potential Ecological Risk Index (RI)

The use of indicators of soil contamination, geochemical accumulation, and ecological balance risk is common in recent years, as they provide an overall view and assessment of the impact of soil metal contaminants in the study area. Table 3 presents, as noted previously, the values of the CF indicators, while Table 4 presents the trends and statistics for all the other indicators before and during the pandemic.
The values for the CF index calculated based on the mean values of the total concentrations for Cu, Zn, Pb, and Co increased during the pandemic by 9.8%, 22.7%, 3.3%, and 23.1%, respectively. The upward or downward trend in the value for Igeo was maintained similar to CF. An impressive decrease occurred in the value of Cd by 204%, Cr by 103%, and Mn by 35%, possibly indicating a common origin [15]. The increase in Igeo for Cu, Zn, and Co was 34%, 50%, and 64.1%, respectively. The smallest increase in the Igeo value was Pb at 23%, which is encouraging, as problems to humans are caused by prolonged exposure to high levels of Pb [22]. The human health risks associated with high levels of heavy metals are well known and therefore monitoring their levels is important [26]. In [29], the researchers refer to the adverse effects on the environment and on human health of proximity to busy roads due to heavy metals.
The values for the ecological risk index (Er) revealed notable results. There was a small increase in Er values for Cu, Zn, and Pb during the pandemic by 9.7%, 22.8%, and 3.8%, respectively. The Er value for Mn decreased by 8.9% and Cd had a smaller decrease compared to the other indicators in the study, as it was only 21.4%. Therefore, this toxic element showed a slight decrease during the pandemic in terms of its ecological footprint.
The PLI and RI indices can be considered to provide an overall view of soil pollution and ecological risk, respectively [5,28]. The PLI was calculated based on equation [2] in Section 2.3.2. Both before and during the pandemic, there was no variation in the maximum value, as the maximum class to assign the soil samples was Class IV, the number of soil samples per class changed. Thus, the pandemic caused a 60% decrease of samples in Class II and a 3.33% and 7.4% increase of samples in Class III and IV, respectively. Therefore, although there was apparently no change in the contamination classes, numerous soil samples were redistributed, as additional soil samples were moved to a higher contamination class.
Before and during the pandemic, the potential ecological risk index (RI) values for the soil samples were all less than 150, indicating that all samples belong to class I. To make the outcome of the study of heavy metals in the environment more comprehensible, class I was divided into three subclasses (0–50, 50–100, 100–150). Soil samples showed a 100% change in subclass Ι, 29.3% in subclass ΙΙ, and 61.9% in subclass ΙΙΙ. Therefore, although there was no change in ecological risk class, a larger number of soil samples during the pandemic increased the ecological footprint risk [19,46].
The increased values of the indices, and the fact that in many cases some areas have changed their risk category, are probably the result of the deposition of gases from burning heating sources in the residential area within the study area [32,38]. The quarantine and the long hours spent by residents in their homes, combined with the tele-education that was imposed, increased the levels of heavy metals in the residential area [33].
The decrease in the concentrations of Cd, Cr, and Mn together with the decrease in the corresponding pollution and geochemical accumulation indices suggest that vehicle traffic and industrial activity are probably the most important sources of pollution [21]. Therefore, taking into account this variation in concentrations, which was highlighted during the pandemic, it is possible, with appropriate regulations, to control heavy metal pollution of soils and, above all, to reduce the risks to human health [15,54].

4. Conclusions

A five-year study (2018–2022) was carried out in the city center of Volos, where an assessment of the levels of urban soil pollution by heavy metals was achieved. The period of the quarantine left indelible effects on the city of Volos, as it significantly altered heavy metal pollution. There were heavy metals that increased their concentrations during the period of the pandemic: Co > Zn > Cu > Pb, the greatest increase was observed in Co. The concentration of Ni remained almost constant, while Cr > Cd > Mn concentrations were decreased. A significant reduction in metal pollutants was observed in the soil samples located on both sides of the high traffic avenues, owing to the ban on vehicle traffic. Probably, for the same reason, the concentration of heavy metals in the area bounded by the urban and intercity bus station, the railway station, and the passenger and commercial port was reduced or at least maintained constant. The short-time traffic of wheeled vehicles and minimal to no traffic of taxi drivers (owing to the ban on intercounty population movement) resulted in a moderation of the values for the respective pollution indicators for all heavy metals, while in the period before the peak, there was a continuously upward trend. High metal values were observed in the densely populated areas of the city, where, owing to the long hours of presence of residents in their homes, heaters or fireplaces were operated in order to warm the occupants, cook, and have hot water for their personal needs. Clearly, the changes in metal concentrations during the lockdown generally showed the sources of pollution in the urban area. Through appropriate management, it is possible for decision-makers to take action to reduce pollution and the risks to human health.
The current research has to be sustained in the coming years in order to lead to a more comprehensive insight into the possible sources and triggers of heavy metal pollution. It would be beneficial if the survey were to be carried out twice a year in order to capture the seasonal variation in concentrations and to investigate whether and how climatic conditions are influencing the pollution in the study area.

Author Contributions

Conceptualization: E.E.G.; methodology: E.E.G.; software: S.G.P.; formal analysis: S.G.P., O.-D.K., M.-A.C. and E.E.G.; investigation: S.G.P., O.-D.K., M.-A.C. and E.E.G.; data curation: E.E.G., O.-D.K., M.-A.C. and S.G.P.; writing—original draft preparation: E.E.G.; writing—review and editing: S.G.P., O.-D.K. and E.E.G.; visualization: E.E.G.; supervision: E.E.G. All authors have read and agreed to the published version of the manuscript.

Funding

This research received no external funding.

Institutional Review Board Statement

Not applicable.

Informed Consent Statement

Not applicable.

Data Availability Statement

Data that support the findings of this study are available from the corresponding author upon reasonable request.

Conflicts of Interest

The authors declare no conflict of interest.

References

  1. Kabata-Pendias, A. Trace Elements in Soils and Plants, 4th ed.; Taylor and Francis Group: Ann Arbor, MI, USA, 2010; ISBN 9781420093704. [Google Scholar]
  2. Golia, E.E.; Dimirkou, A.; Floras, S.A. Spatial Monitoring of Arsenic and Heavy Metals in the Almyros Area, Central Greece. Statistical Approach for Assessing the Sources of Contamination. Environ. Monit. Assess. 2015, 187, 399–412. [Google Scholar] [CrossRef] [PubMed]
  3. Golia, E.E.; Tsiropoulos, G.N.; Füleky, G.; Floras, S.; Vleioras, S. Pollution Assessment of Potentially Toxic Elements in Soils of Different Taxonomy Orders in Central Greece. Environ. Monit. Assess. 2019, 191, 106. [Google Scholar] [CrossRef] [PubMed]
  4. Alloway, B.J. Heavy Metals in Soils: Trace Metals and Metalloids in Soils and Their Bioavailability, 3rd ed.; Blackie Academic and Professional: London, UK, 2013. [Google Scholar]
  5. Long, Z.; Zhu, H.; Bing, H.; Tian, X.; Wang, Z.; Wang, X.; Wu, Y. Contamination, Sources and Health Risk of Heavy Metals in Soil and Dust from Different Functional Areas in an Industrial City of Panzhihua City, Southwest China. J. Hazard. Mater. 2021, 420, 126638. [Google Scholar] [CrossRef] [PubMed]
  6. Karpouzas, D.G.; Pantelelis, I.; Menkissoglu-Spiroudi, U.; Golia, E.; Tsiropoulos, N.G. Leaching of the Organophosphorus Nematicide Fosthiazate. Chemosphere 2007, 68, 1359–1364. [Google Scholar] [CrossRef] [PubMed]
  7. Igwe, O.; Una, C.O.; Abu, E.; Adepehin, E.J. Environmental Risk Assessment of Lead–Zinc Mining: A Case Study of Adudu Metallogenic Province, Middle Benue Trough, Nigeria. Environ. Monit. Assess. 2017, 189, 492. [Google Scholar] [CrossRef]
  8. Dimirkou, A.; Ioannou, Z.; Golia, E.E.; Danalatos, N.; Mitsios, I.K. Sorption of Cadmium and Arsenic by Goethite and Clinoptilolite. Commun. Soil Sci. Plant Anal. 2009, 40, 259–272. [Google Scholar] [CrossRef]
  9. Mahey, S.; Kumar, R.; Sharma, M.; Kumar, V.; Bhardwaj, R. A Critical Review on Toxicity of Cobalt and Its Bioremediation Strategies. SN Appl. Sci. 2020, 2, 1279. [Google Scholar] [CrossRef]
  10. Golia, E.E.; Kantzou, O.-D.; Chartodiplomenou, M.-A.; Papadimou, S.G.; Tsiropoulos, N.G. Study of Potentially Toxic Metal Adsorption in a Polluted Acid and Alkaline Soil: Influence of Soil Properties and Levels of Metal Concentration. Soil Syst. 2023, 7, 16. [Google Scholar] [CrossRef]
  11. Peana, M.; Pelucelli, A.; Chasapis, C.T.; Perlepes, S.P.; Bekiari, V.; Medici, S.; Zoroddu, M.A. Biological Effects of Human Exposure to Environmental Cadmium. Biomolecules 2022, 13, 36. [Google Scholar] [CrossRef]
  12. Wang, Y.; Cao, D.; Qin, J.; Zhao, S.; Lin, J.; Zhang, X.; Wang, J.; Zhu, M. Deterministic and Probabilistic Health Risk Assessment of Toxic Metals in the Daily Diets of Residents in Industrial Regions of Northern Ningxia, China. Biol. Trace Elem. Res. 2023, 1–15. [Google Scholar] [CrossRef]
  13. Briki, M.; Zhu, Y.; Gao, Y.; Shao, M.; Ding, H.; Ji, H. Distribution and Health Risk Assessment to Heavy Metals near Smelting and Mining Areas of Hezhang, China. Environ. Monit. Assess. 2017, 189, 458. [Google Scholar] [CrossRef] [PubMed]
  14. Mawari, G.; Kumar, N.; Sarkar, S.; Daga, M.K.; Singh, M.M.; Joshi, T.K.; Khan, N.A. Heavy Metal Accumulation in Fruits and Vegetables and Human Health Risk Assessment: Findings from Maharashtra, India. Environ. Health Insights 2022, 16, 117863022211191. [Google Scholar] [CrossRef] [PubMed]
  15. Liang, J.; Liu, Z.; Tian, Y.; Shi, H.; Fei, Y.; Qi, J.; Mo, L. Research on Health Risk Assessment of Heavy Metals in Soil Based on Multi-Factor Source Apportionment: A Case Study in Guangdong Province, China. Sci. Total Environ. 2023, 858, 159991. [Google Scholar] [CrossRef] [PubMed]
  16. Dasharathy, S.; Arjunan, S.; Maliyur Basavaraju, A.; Murugasen, V.; Ramachandran, S.; Keshav, R.; Murugan, R. Mutagenic, Carcinogenic, and Teratogenic Effect of Heavy Metals. eCAM 2022, 2022, 8011953. [Google Scholar] [CrossRef]
  17. Boateng, T.K.; Opoku, F.; Akoto, O. Heavy Metal Contamination Assessment of Groundwater Quality: A Case Study of Oti Landfill Site, Kumasi. Appl. Water Sci. 2019, 2, 33. [Google Scholar] [CrossRef] [Green Version]
  18. Li, T.; Liu, Y.; Lin, S.; Liu, Y.; Xie, Y. Soil Pollution Management in China: A Brief Introduction. Sustainability 2019, 11, 556. [Google Scholar] [CrossRef] [Green Version]
  19. Yang, L.; Ye, B.; Han, H.; Li, S.; Yuan, P.; Fu, P.; Yuan, P.; Zhang, S. Monitoring and Exposure Risk Assessment of Lead Pollution in Commercially Cereal and Tuber Products in Henan, 2015–2019. Mod. Prev. Med. 2022, 49, 37–40. [Google Scholar]
  20. Zhao, G.; Ma, Y.; Liu, Y.; Cheng, J.; Wang, X. Source Analysis and Ecological Risk Assessment of Heavy Metals in Farmland Soils around Heavy Metal Industry in Anxin County. Sci. Rep. 2022, 1, 10562. [Google Scholar] [CrossRef]
  21. Doležalová Weissmannová, H.; Mihočová, S.; Chovanec, P.; Pavlovský, J. Potential Ecological Risk and Human Health Risk Assessment of Heavy Metal Pollution in Industrial Affected Soils by Coal Mining and Metallurgy in Ostrava, Czech Republic. Int. J. Environ. Res. Public Health 2019, 16, 4495. [Google Scholar] [CrossRef] [Green Version]
  22. Miranzadeh Mahabadi, H.; Ramroudi, M.; Asgharipour, M.R.; Rahmani, H.R.; Afyuni, M. Evaluation of the Ecological Risk Index (Er) of Heavy Metals (HMs) Pollution in Urban Field Soils. SN Appl. Sci. 2020, 2, 1420. [Google Scholar] [CrossRef]
  23. Li, Y.; Dong, Z.; Feng, D.; Zhang, X.; Jia, Z.; Fan, Q.; Liu, K. Study on the Risk of Soil Heavy Metal Pollution in Typical Developed Cities in Eastern China. Sci. Rep. 2022, 12, 3855. [Google Scholar] [CrossRef] [PubMed]
  24. Chen, Y.; Hu, Z.; Bai, H.; Shen, W. Variation in Road Dust Heavy Metal Concentration, Pollution, and Health Risk with Distance from the Factories in a City–Industry Integration Area, China. Int. J. Environ. Res. Public Health 2022, 19, 14562. [Google Scholar] [CrossRef] [PubMed]
  25. Liu, Y.; Jin, T.; Yu, S.; Chu, H. Pollution Characteristics and Health Risks of Heavy Metals in Road Dust in Ma’anshan, China. Environ. Sci. Pollut. Res. Int. 2023, 1–14. [Google Scholar] [CrossRef]
  26. Al-Swadi, H.A.; Usman, A.R.A.; Al-Farraj, A.S.; Al-Wabel, M.I.; Ahmad, M.; Al-Faraj, A. Sources, Toxicity Potential, and Human Health Risk Assessment of Heavy Metals-Laden Soil and Dust of Urban and Suburban Areas as Affected by Industrial and Mining Activities. Sci. Rep. 2022, 12, 8972. [Google Scholar] [CrossRef] [PubMed]
  27. Binner, H.; Sullivan, T.; Jansen, M.A.K.; McNamara, M.E. Metals in Urban Soils of Europe: A Systematic Review. Sci. Total Environ. 2023, 854, 158734. [Google Scholar] [CrossRef]
  28. Guilland, C.; Maron, P.A.; Damas, O.; Ranjard, L. Biodiversity of Urban Soils for Sustainable Cities. Environ. Chem. Lett. 2018, 16, 1267–1282. [Google Scholar] [CrossRef]
  29. Long, Z.; Huang, Y.; Zhang, W.; Shi, Z.; Yu, D.; Chen, Y.; Liu, C.; Wang, R. Effect of Different Industrial Activities on Soil Heavy Metal Pollution, Ecological Risk, and Health Risk. Environ. Monit. Assess. 2021, 193, 20. [Google Scholar] [CrossRef]
  30. Kuklová, M.; Kukla, J.; Hniličková, H.; Hnilička, F.; Pivková, I. Impact of Car Traffic on Metal Accumulation in Soils and Plants Growing Close to a Motorway (Eastern Slovakia). Toxics 2022, 10, 183. [Google Scholar] [CrossRef]
  31. Vatavali, F.; Gareiou, Z.; Kehagia, F.; Zervas, E. Impact of COVID-19 on Urban Everyday Life in Greece. Perceptions, Experiences and Practices of the Active Population. Sustainability 2020, 12, 9410. [Google Scholar] [CrossRef]
  32. Aslanidis, P.S.C.; Golia, E.E. Urban Sustainability at Risk Due to Soil Pollution by Heavy Metals—Case Study: Volos, Greece. Land 2022, 11, 1016. [Google Scholar] [CrossRef]
  33. Kotsiou, O.S.; Saharidis, G.K.D.; Kalantzis, G.; Fradelos, E.C.; Gourgoulianis, K.I. The Impact of the Lockdown Caused by the Covid-19 Pandemic on the Fine Particulate Matter (Pm2.5) Air Pollution: The Greek Paradigm. Int. J. Environ. Res. Public Health 2021, 18, 6748. [Google Scholar] [CrossRef] [PubMed]
  34. Barman, A.; Das, R.; De, P.K. Impact of COVID-19 in Food Supply Chain: Disruptions and Recovery Strategy. Curr. Res. Behav. Sci. 2021, 2, 100017. [Google Scholar] [CrossRef]
  35. GTP News. Available online: https://News.Gtp.Gr/2020/11/13/Lockdown-in-Greece-Guidelines-for-Tourists/ (accessed on 13 November 2020).
  36. Hampshire, A.; Hellyer, P.J.; Trender, W.; Chamberlain, S.R. Insights into the Impact on Daily Life of the COVID-19 Pandemic and Effective Coping Strategies from Free-Text Analysis of People’s Collective Experiences. Interface Focus 2021, 11, 202110051. [Google Scholar] [CrossRef]
  37. Conticini, E.; Frediani, B.; Caro, D. Can Atmospheric Pollution Be Considered a Co-Factor in Extremely High Level of SARS-CoV-2 Lethality in Northern Italy? Environ. Pollut. 2020, 261, 114465. [Google Scholar] [CrossRef] [PubMed]
  38. Varotsos, C.; Christodoulakis, J.; Kouremadas, G.A.; Fotaki, E.F. The Signature of the Coronavirus Lockdown in Air Pollution in Greece. Water Air Soil Poll. 2021, 232, 119. [Google Scholar] [CrossRef] [PubMed]
  39. Avdoulou, M.M.; Golfinopoulos, A.G.; Kalavrouziotis, I.K. Monitoring Air Pollution in Greek Urban Areas During the Lockdowns, as a Response Measure of SARS-CoV-2 (COVID-19). Water Air Soil Poll. 2023, 234, 13. [Google Scholar] [CrossRef]
  40. Golia, E.E.; Papadimou, S.G.; Cavalaris, C.; Tsiropoulos, N.G. Level of Contamination Assessment of Potentially Toxic Elements in the Urban Soils of Volos City (Central Greece). Sustainability 2021, 13, 2029. [Google Scholar] [CrossRef]
  41. ISO 10381-5; Soil Quality—Sampling—Part 5: Guidance on the Procedure for the Investigation of Urban and Industrial Sites with Regard to Soil Contamination. International Standards Organization: Geneve, Switzerland, 2005.
  42. Page, A.L. Methods of Soil Analysis-Part 2: Chemical and microbiological properties. In American Society Agronomy, 2nd ed.; Phosphurus Inc.: Madison, WI, USA, 1982; Volume 9, pp. 421–422. [Google Scholar]
  43. Wiliams, S. (Ed.) Official Methods of Analysis of the Association of Official Analytical Chemists, 14th ed.; The Association: Arlington, VA, USA, 1984; pp. 59–60. [Google Scholar]
  44. ISO/DIS11466; Environment Soil Quality. By ISO Standards Compendium: Geneva, Switzerland, 1994.
  45. Mueller, G. Schwermetalle in Den Sedimenten des Rheins—Veranderungen Seit 1971. Umsch. Wissensch. Tech. 1979, 79, 778–783. [Google Scholar]
  46. Kasa, E.; Felix-Henningsen, P.; Duering, R.A.; Gjoka, F. The Occurrence of Heavy Metals in Irrigated and Non-Irrigated Arable Soils, NW Albania. Environ. Monit. Assess. 2014, 186, 3595–3603. [Google Scholar] [CrossRef]
  47. Zhang, L.; Liu, J. In Situ Relationships between Spatial-Temporal Variations in Potential Ecological Risk Indexes for Metals and the Short-Term Effects on Periphyton in a Macrophyte-Dominated Lake: A Comparison of Structural and Functional Metrics. Ecotoxicology 2014, 23, 553–566. [Google Scholar] [CrossRef]
  48. Hakanson, L. An ecological risk index for aquatic pollution control. A sedimentological approach. Water Res. 1980, 14, 975–1001. [Google Scholar] [CrossRef]
  49. Haque, F.; Chiang, Y.W.; Santos, R.M. Alkaline Mineral Soil Amendment: A Climate Change Stabilization Wedge? Energies 2019, 12, 2299. [Google Scholar] [CrossRef] [Green Version]
  50. Krasilnikov, P.; Taboada, M.A. Amanullah Fertilizer Use, Soil Health and Agricultural Sustainability. Agriculture 2022, 12, 462. [Google Scholar] [CrossRef]
  51. Du, Y.; Cui, B.; Zhang, Q.; Wang, Z.; Sun, J.; Niu, W. Effects of Manure Fertilizer on Crop Yield and Soil Properties in China: A Meta-Analysis. Catena 2020, 193, 104617. [Google Scholar] [CrossRef]
  52. Council of the European Communities. The Protection of the Environment, and in Particular of the Soil, When Sewage Sludge Is Used in Agriculture. Council Directive of 12 June 1986. Off. J. Eur. Communities 1986, 86, 278.
  53. Sutherland, J.E.; Zhitkovich, A.; Kluz, T.; Costa, M. Rats Retain Chromium in Tissues Following Chronic Ingestion of Drinking Water Containing Hexavalent Chromium. Biol. Trace Elem. Res. 2000, 74, 41–53. [Google Scholar] [CrossRef]
  54. Rajasekaran, R.; Abinaya, M. Heavy Metal Pollution in Ground Water—A Review. Int. J. Chemtech. Res. 2014, 6, 5661–5664. [Google Scholar]
Figure 1. Thematic maps of heavy metals based on contamination factor (CF) values in Volos before the COVID-19 pandemic (mean values for the four years of the study, n = 248).
Soilsystems 07 00028 g001aSoilsystems 07 00028 g001b
Figure 2. Thematic maps of heavy metals based on contamination factor (CF) values in Volos during the COVID-19 pandemic.
Soilsystems 07 00028 g002aSoilsystems 07 00028 g002b
Table 1. Physicochemical properties of the soil samples before and during the lockdown period (mean values of the five years of study, n = 310).
pHEC (μS/cm)OM (%) *CaCO3 (%)Clay (%)
Minimum value6.611125.780.289.692
Maximum value8.906962.574.4920.4355
Mean value7.513239.602.5314.8321
Relative Standard Deviation0.4413.200.881.617.35
Skewness Coefficient0.6980.751−0.1370.247−0.010
Kurtosis Coefficient1.421−0.507−0.681−0.6971.104
* OM: organic matter.
Table 2. (a): Pseudo-total concentrations of heavy metals before the COVID-19 pandemic (mean values for the four years of the study, n = 248). (b): Pseudo-total concentrations of heavy metals elements during the COVID-19 pandemic.
(a)CuZnPbNiCdCoCrMn
mg kg−1
Min Values29.9596.615.8325.430.534.8514.98257.28
10th-perc a35.45117.3113.1933.720.6611.7025.55307.20
50th-perc b53.25137.3141.9763.900.8922.6156.78711.01
Mean Values55.08144.3236.3967.360.8823.3748.42666.78
90th-perc c82.76180.2555.79109.971.1136.4163.52954.09
Max Values89.93227.3958.48118.021.2739.3268.37971.93
EU Limits d140300300753-200-
BG (mg kg−1) e24.5764.3529.6922.920.499,6223.84540.13
(b)CuZnPbNiCdCoCrMn
mg kg−1
Min Values30.0097.708.0026.550.126.0015.33251.00
10th-perc a43.51132.1018.9136.000.3915.0521.67307.10
50th-perc b62.55176.5042.5066.750.6426.0040.33533.00
Mean Values60.59177.1137.7569.510.6928.7637.68603.29
90th-perc c79.00229.1053.9089.970.9742.2748.67898.90
Max Values89.00310.0061.00121.001.8751.0059.00988.00
EU Limits d140300300753-200-
BG (mg kg−1) e24.5764.3529.6922.920.499,6223.84540.13
a 10th percentile, b 50th percentile, c 90th percentile; d for Cr: maximum allowable concentrations [1]. For Cd, Cu, Ni, Pb, and Zn: 86/278/EEC Directive [51]; e average of all reported background reference values in [1].
Table 3. (a) Descriptive statistics for the contamination factor (CF) before the COVID-19 pandemic—heavy metals; geostatistical parameters, for the creation and validation of the contour maps. (b) Descriptive statistics for the contamination factor (CF) during the COVID-19 pandemic—heavy metals; geostatistical parameters, for the creation and validation of the contour maps.
(a) CFCuZnPbNiCdCoCrMn
Descriptive statistics
Mean Value2.242.241.232.941.792.432.031.23
Standard
Deviation
0.730.430.561.160.341.030.670.45
Minimum Value1.221.500.201.111.140.500.630.48
Maximum Value3.663.531.975.112.594.092.871.80
Skewness
Coefficient
0.3731.090−0.4480.3000.243−0.086−0.565−0.334
Kurtosis
Coefficient
−1.1171.394−1.195−0.872−0.272−1.087−1.205−1.375
Geostatistical parameters
ModelLinear to SillSphericalGaussianLinearGaussianLinearGaussianGaussian
Nugget0.2150.00600.3080.0530.33700
Range1364338425991560968396429
Sill0.7400.1150.3431.5520.1221.1930.4720.233
Nugget sill ratio0.0620.0030.0401.2180.0020.5610.0860.051
R20.760.640.580.780.760.790.530.51
(b) CFCuZnPbNiCdCoCrMn
Descriptive statistics
Mean Value2.462.751.272.941.412.991.581.12
Standard
Deviation
0.610.610.501.030.661.170.500.42
Minimum Value1.221.520.271.160.240.620.640.46
Maximum Value3.624.822.055.283.825.302.471.83
Skewness
Coefficient
0.0740.593−0.5040.2001.4260.042−0.0090.123
Kurtosis
Coefficient
−1.3080.933−1.074−0.5182.859−1.258−0.031−1.296
Geostatistical parameters
ModelLinear to SillExponentialGaussianLinearLinear
to Sill
LinearGaussianGaussian
Nugget0.0290.05500.3480.2350.67000
Range136410203839811464935431354
Sill0.4730.3570.2771.1640.2931.450.2690.193
Nugget sill ratio0.0330.0210.0620.8460.0230.8140.0260.031
R20.560.760.520.690.550.700.570.50
Table 4. (a) Geo-accumulation index (Igeo), ecological risk factor (Er), potential ecological risk index (RI), and pollution load index (PLI) for the heavy metals before the COVID-19 pandemic. (b) Geo-accumulation index (Igeo), ecological risk factor (Er), potential ecological risk index (RI), and pollution load index (PLI) for the heavy metals during the COVID-19 pandemic.
(a)CuZnPbNiCdCoCrMn
Contamination IndicesIgeoErIgeoErIgeoErIgeoErIgeoErIgeoIgeoErIgeoErPLIRI
Mean Values0.5011.210.562.24−0.526.130.8514.680.2353.820.530.344.06−0.401.231.9093.37
Median Value0.5310.840.522.14−0.097.070.8913.940.2754.260.650.674.76−0.191.321.9089.07
Minimum
Values
−0.306.090.001.50−2.930.98−0.445.55−0.3934.29−1.57−1.261.26−1.650.480.8457.82
Maximum
Values
1.2918.301.243.530.399.851.7725.530.7977.761.450.945.740.261.802.95140.08
Standard
Deviation
0.473.630.260.430.922.810.625.810.2810.210.770.571.330.630.450.6019.66
(b)CuZnPbNiCdCoCrMn
Contamination IndicesIgeoErIgeoErIgeoErIgeoErIgeoErIgeoIgeoErIgeoErPLIRI
Mean Values0.6712.300.842.75−0.406.360.8714.68−0.2442.300.87−0.013.16−0.541.121.8682.67
Median Value0.7612.730.872.74−0.077.160.9614.56−0.2039.180.850.173.38−0.600.991.8579.06
Minimum
Values
−0.306.110.021.52−2.481.35−0.375.79−2.617.35−1.27−1.221.29−1.690.460.9335.77
Maximum
Values
1.2718.111.684.820.4510.271.8226.401.35114.491.820.724.950.291.832.79166.87
Standard
Deviation
0.373.040.320.610.762.510.555.160.6719.750.650.520.990.590.420.4923.16
Disclaimer/Publisher’s Note: The statements, opinions and data contained in all publications are solely those of the individual author(s) and contributor(s) and not of MDPI and/or the editor(s). MDPI and/or the editor(s) disclaim responsibility for any injury to people or property resulting from any ideas, methods, instructions or products referred to in the content.

