
Selenium Uptake from Livestock Pasture Extremely Enriched in Selenium, Molybdenum and Uranium: A Field and X-ray Absorption Study
 , , ,
, , ,
Abstract
:1. Introduction
2. Methodology
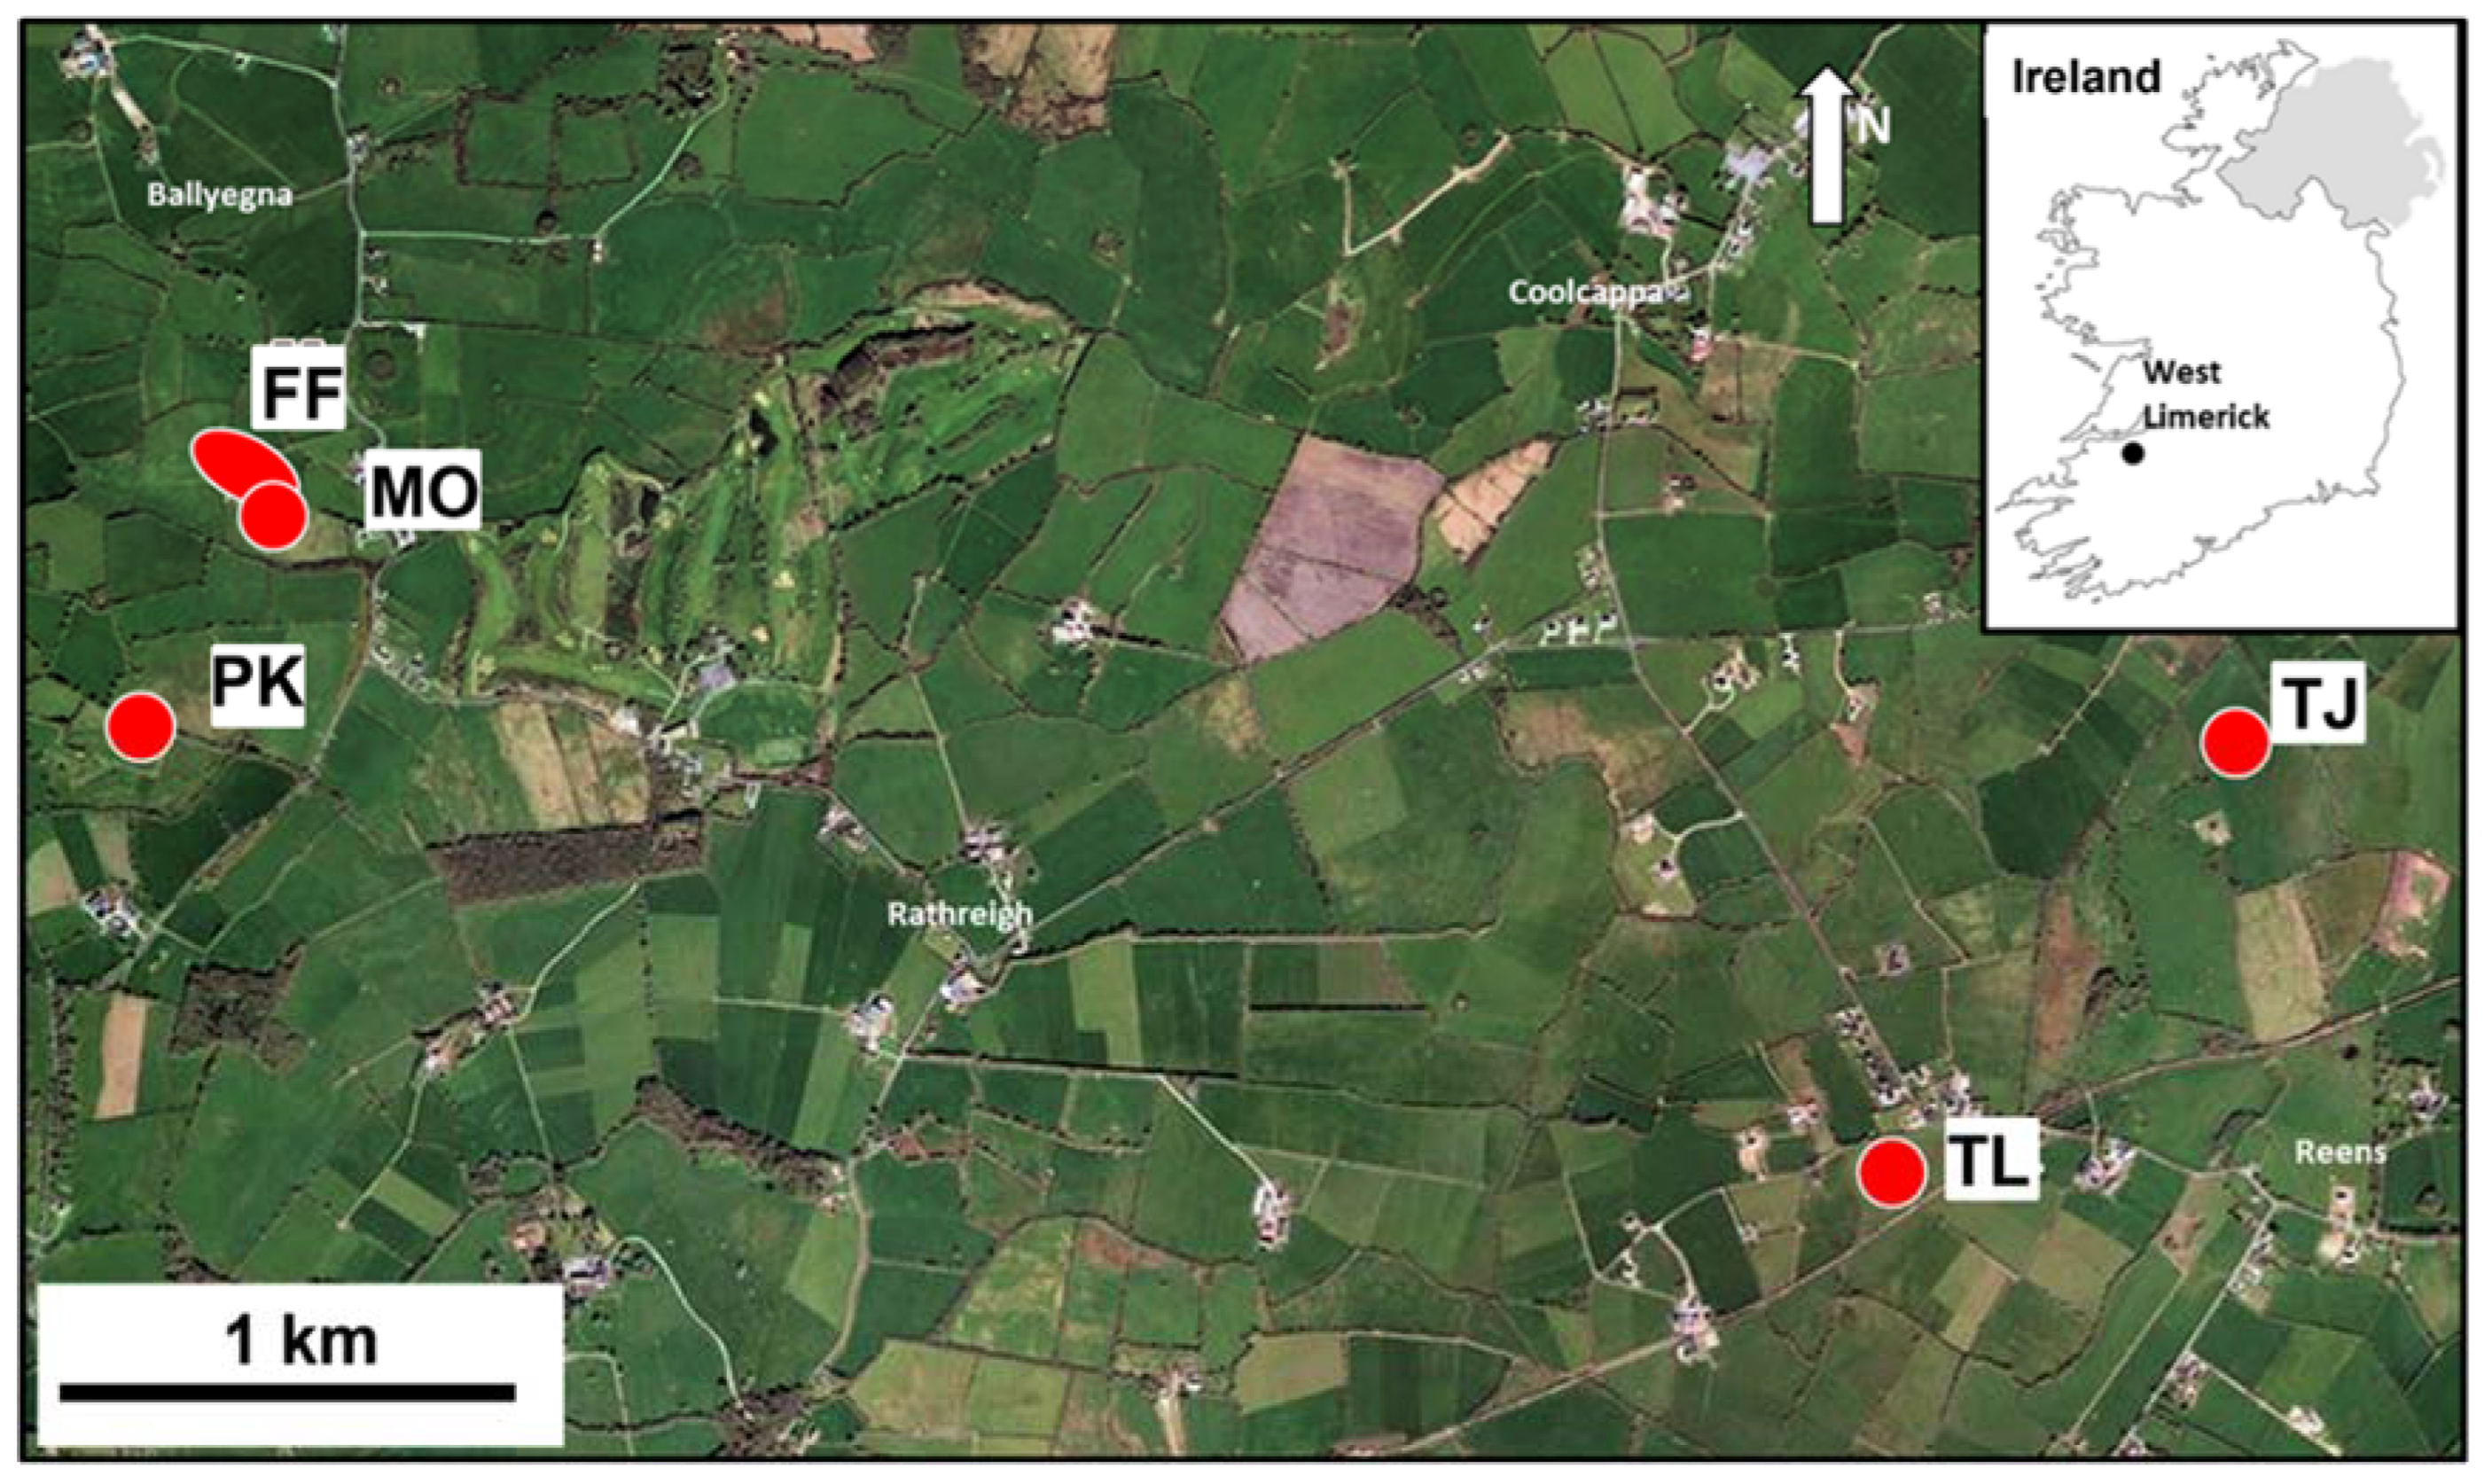
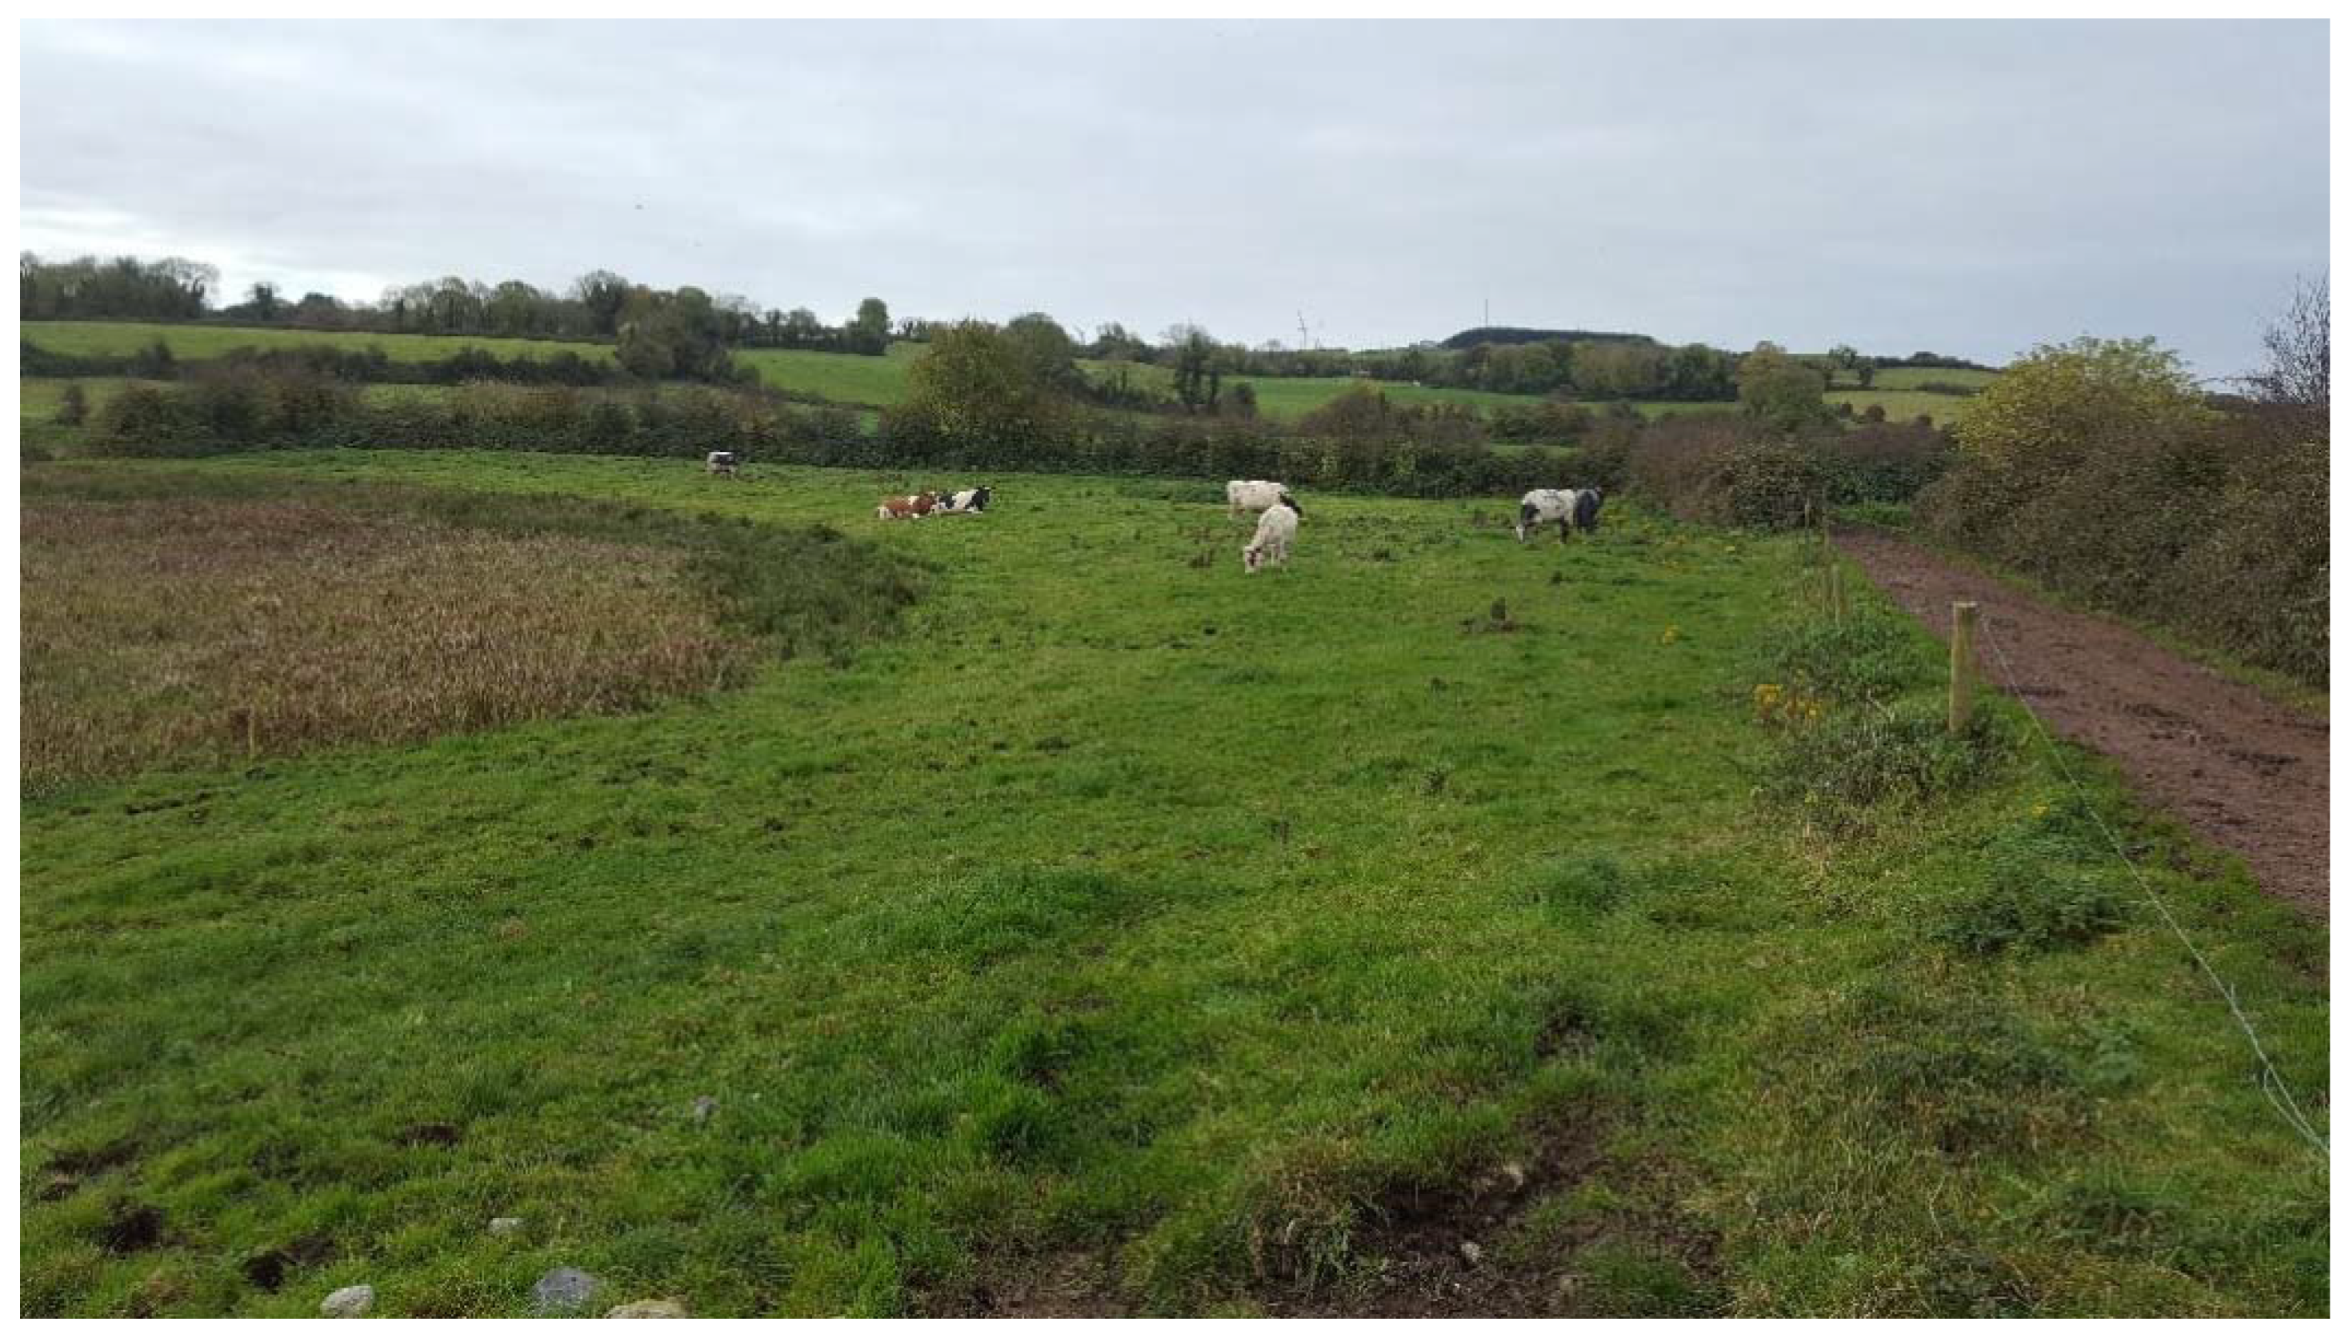
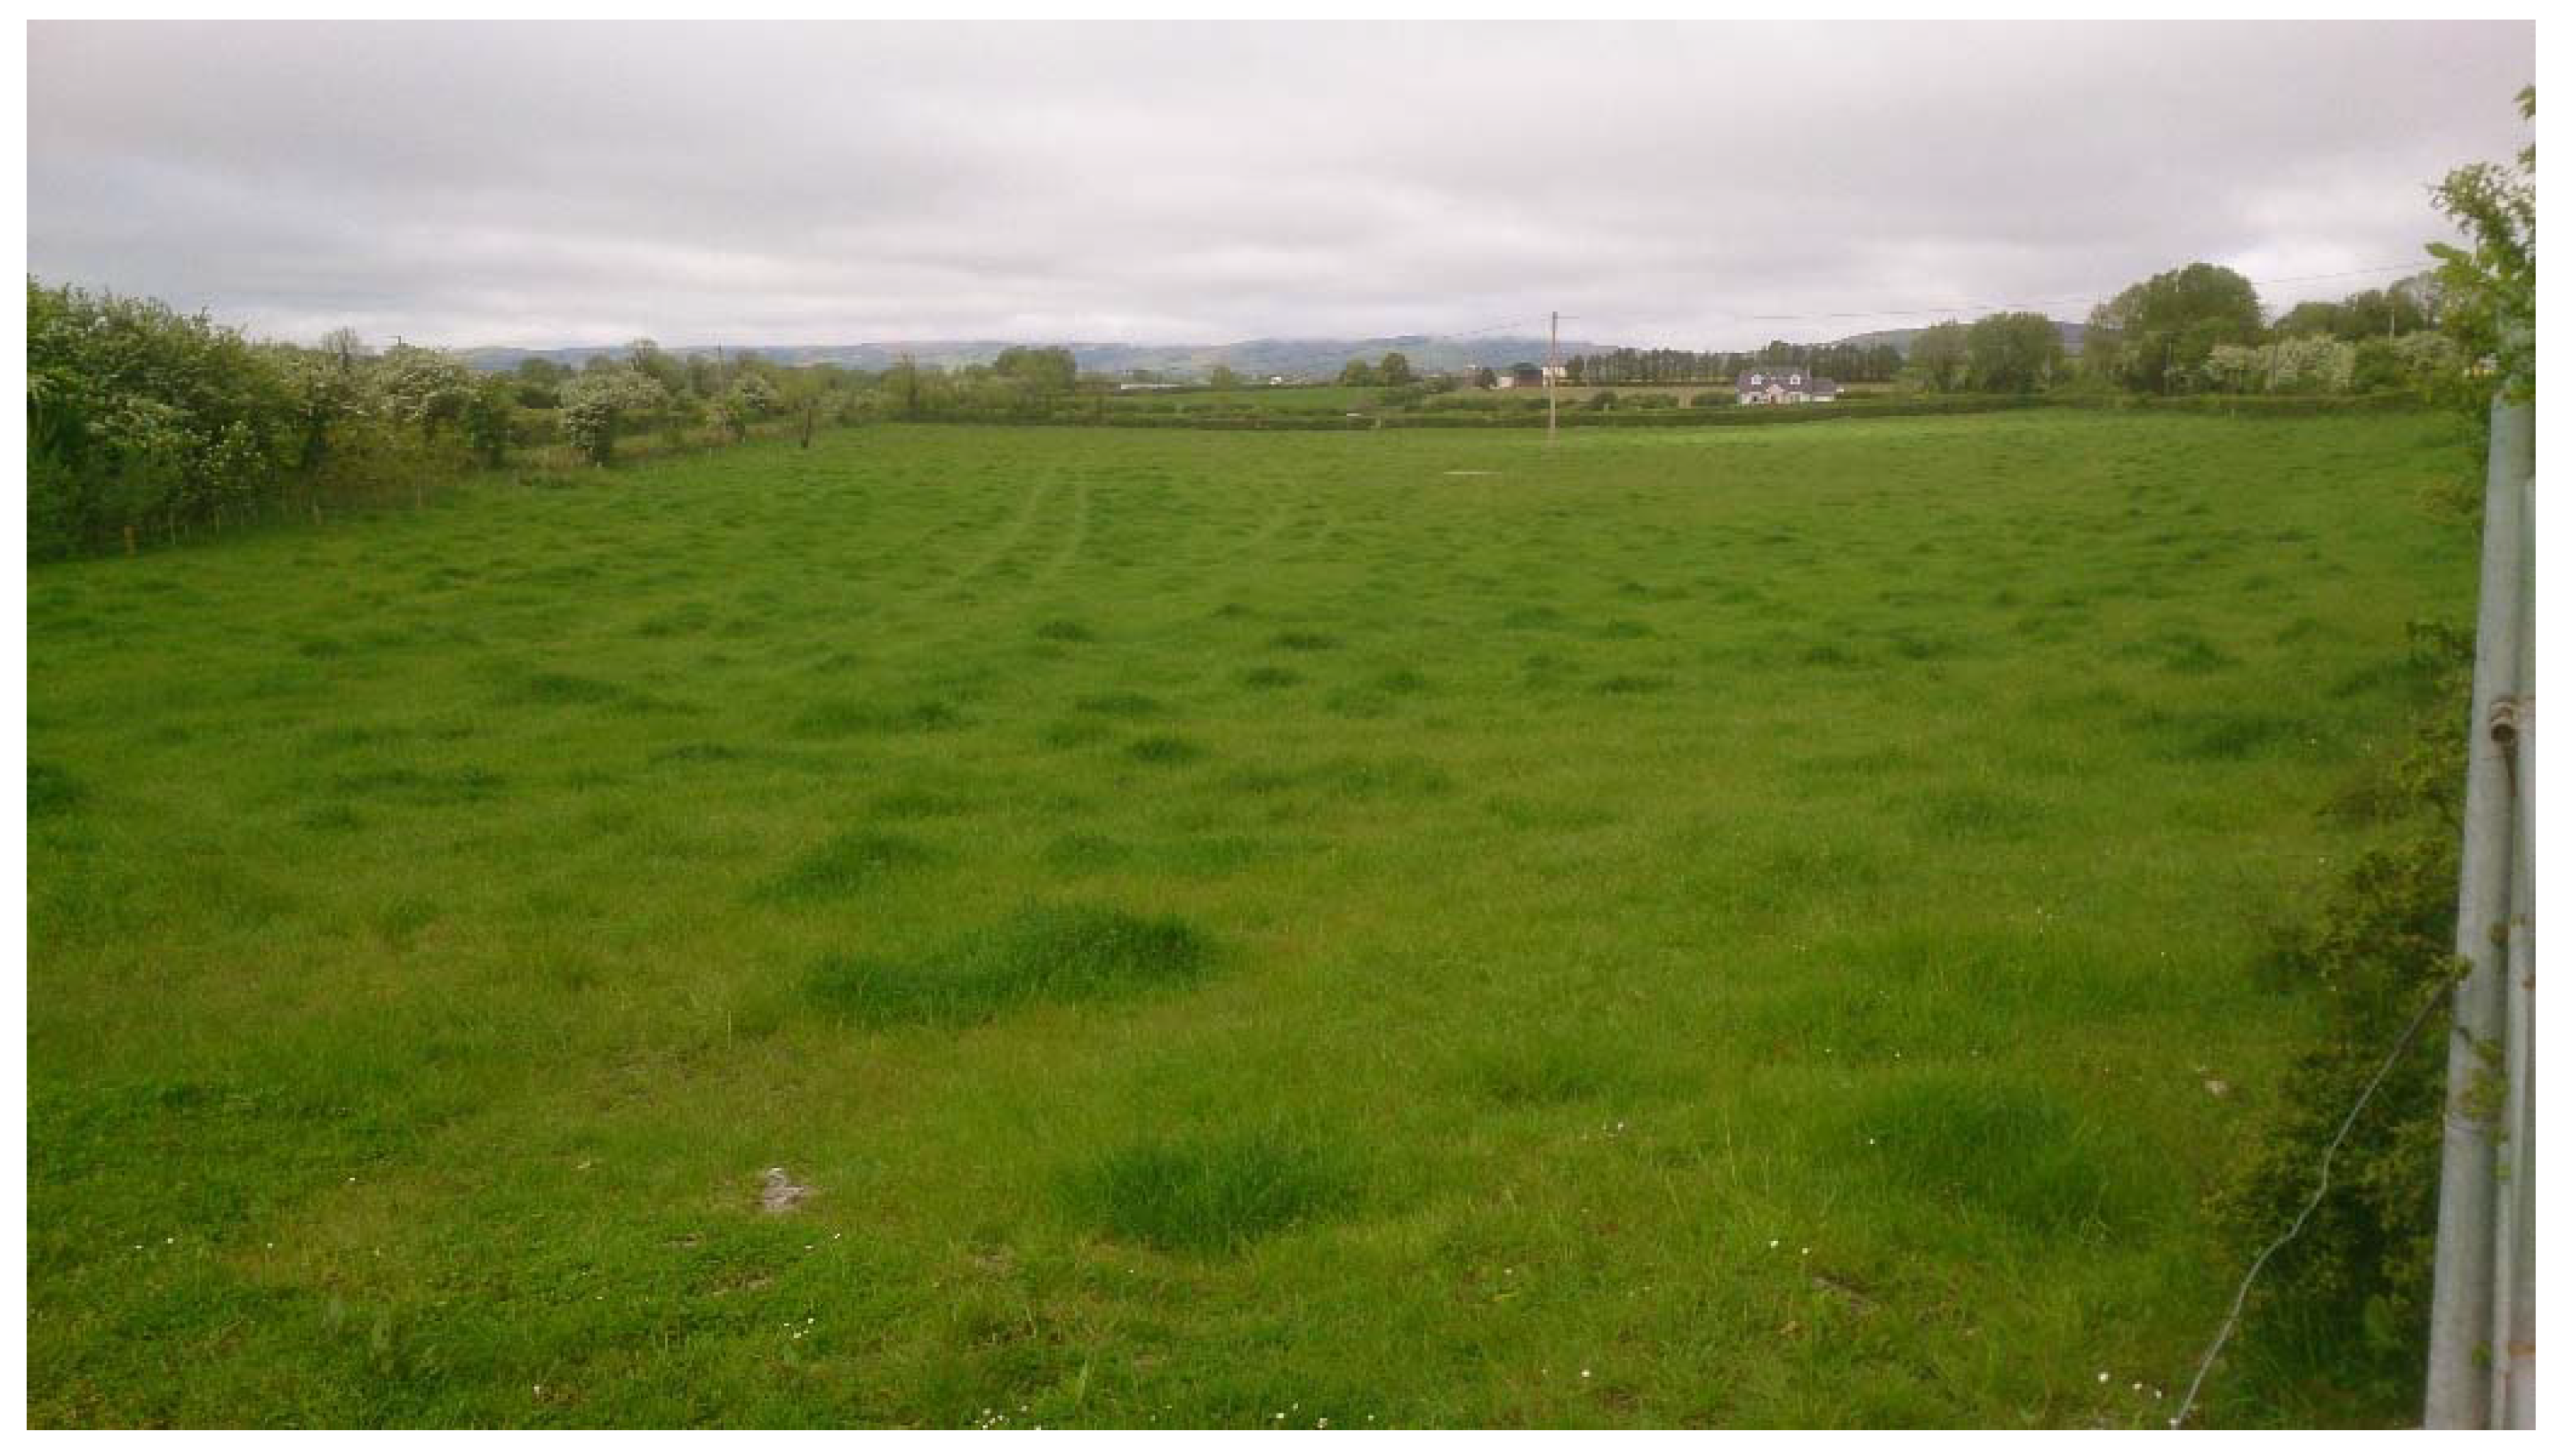
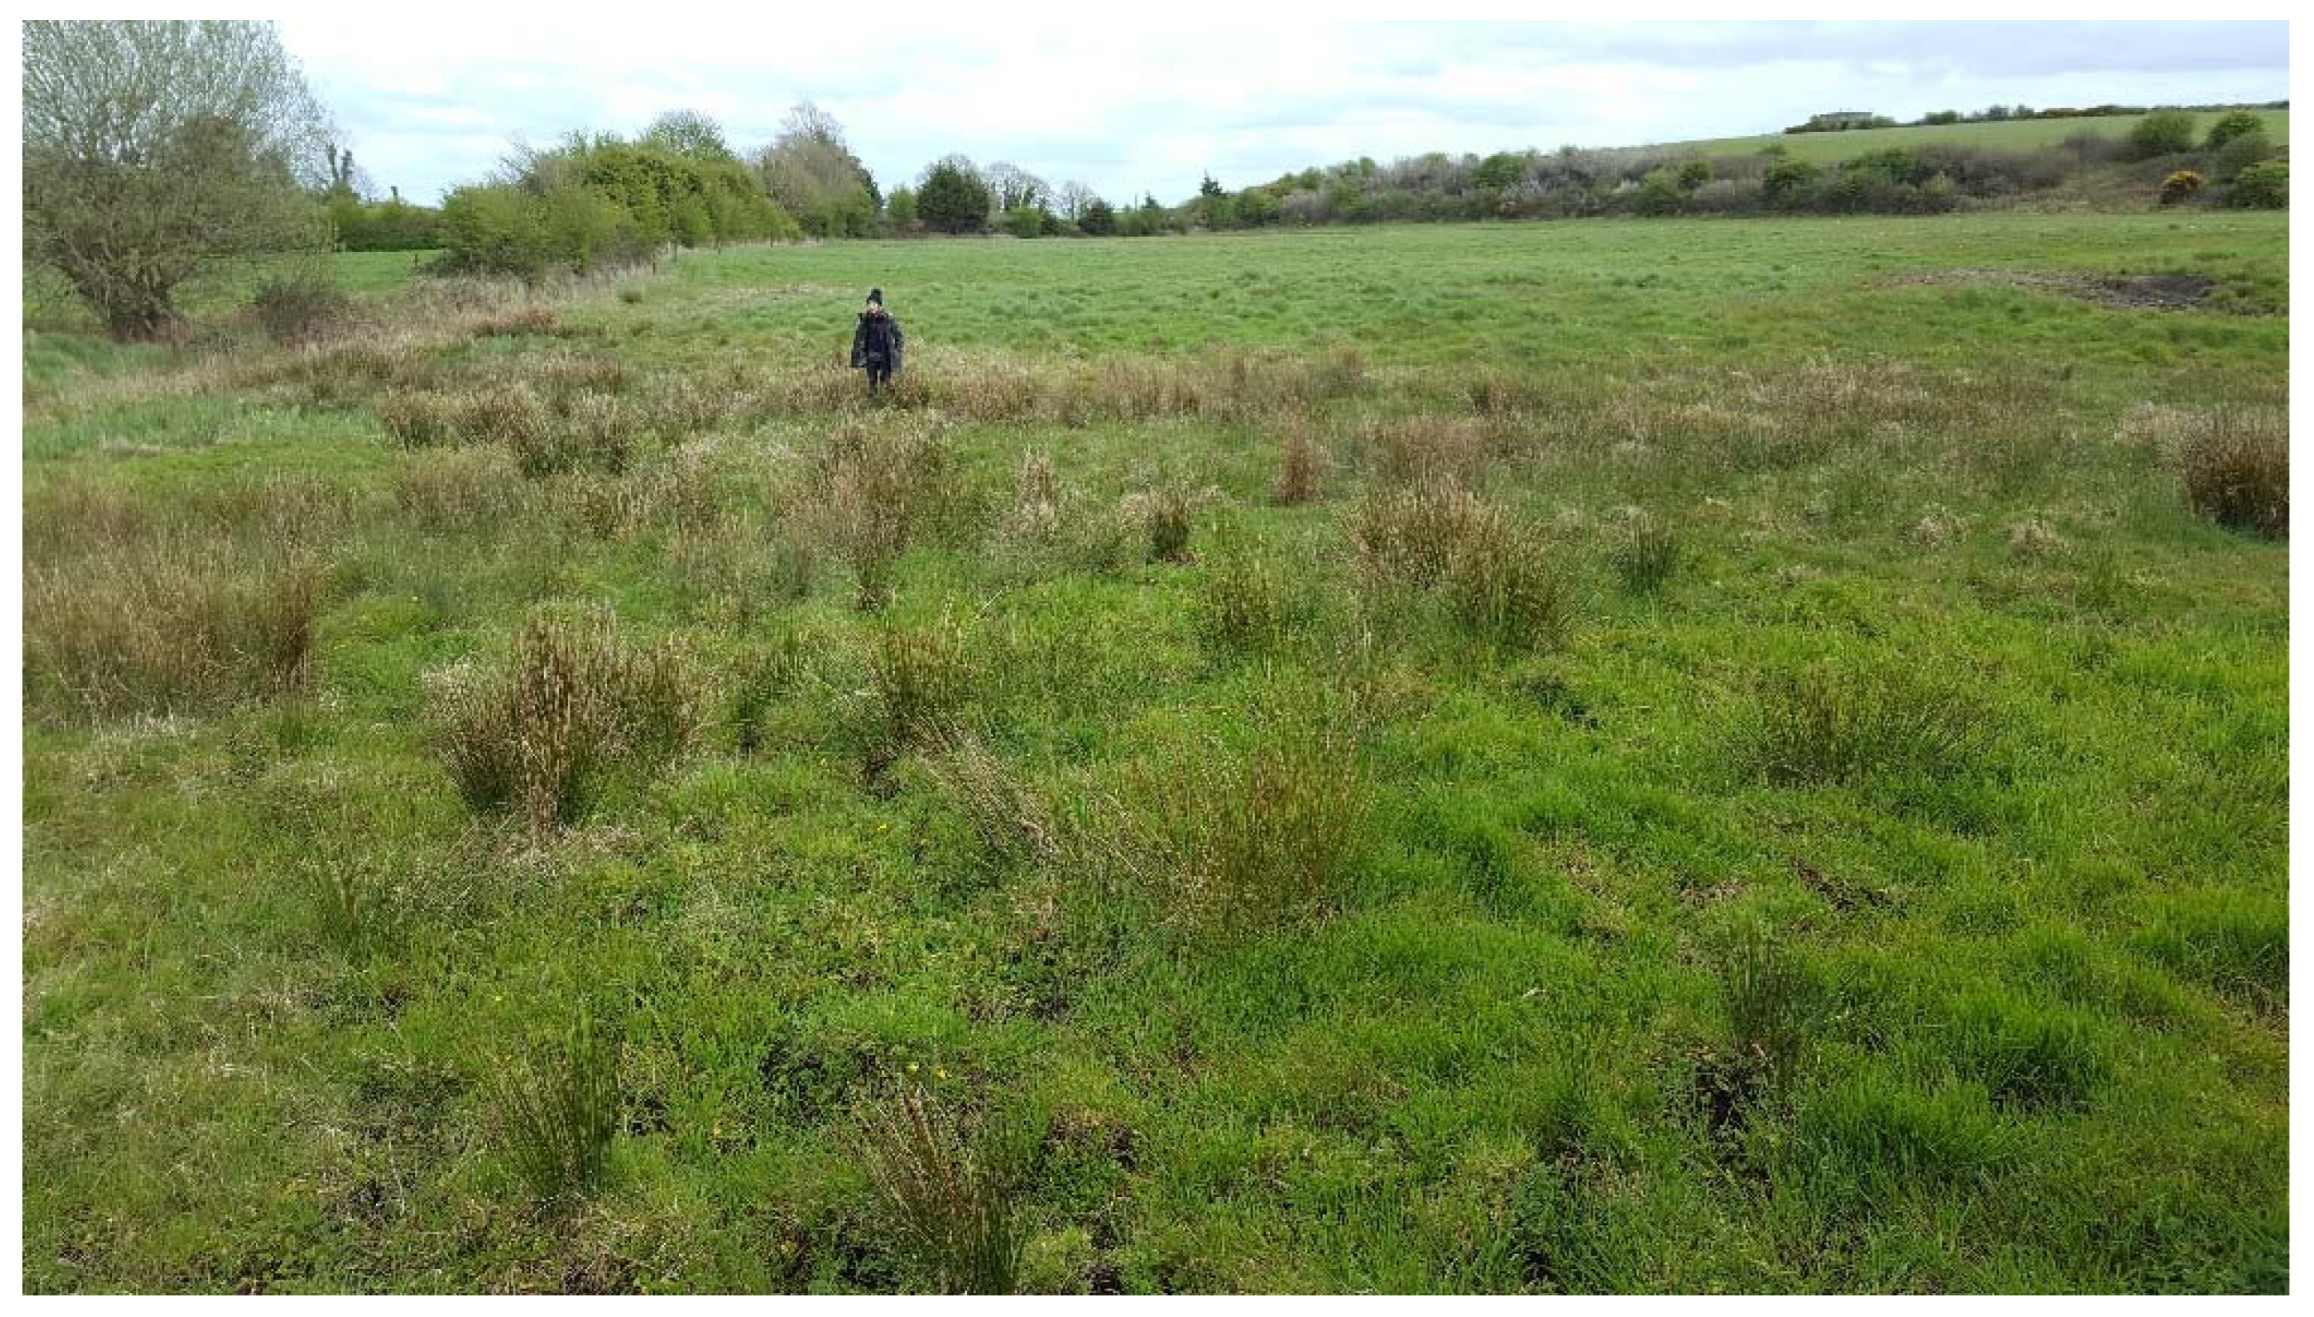
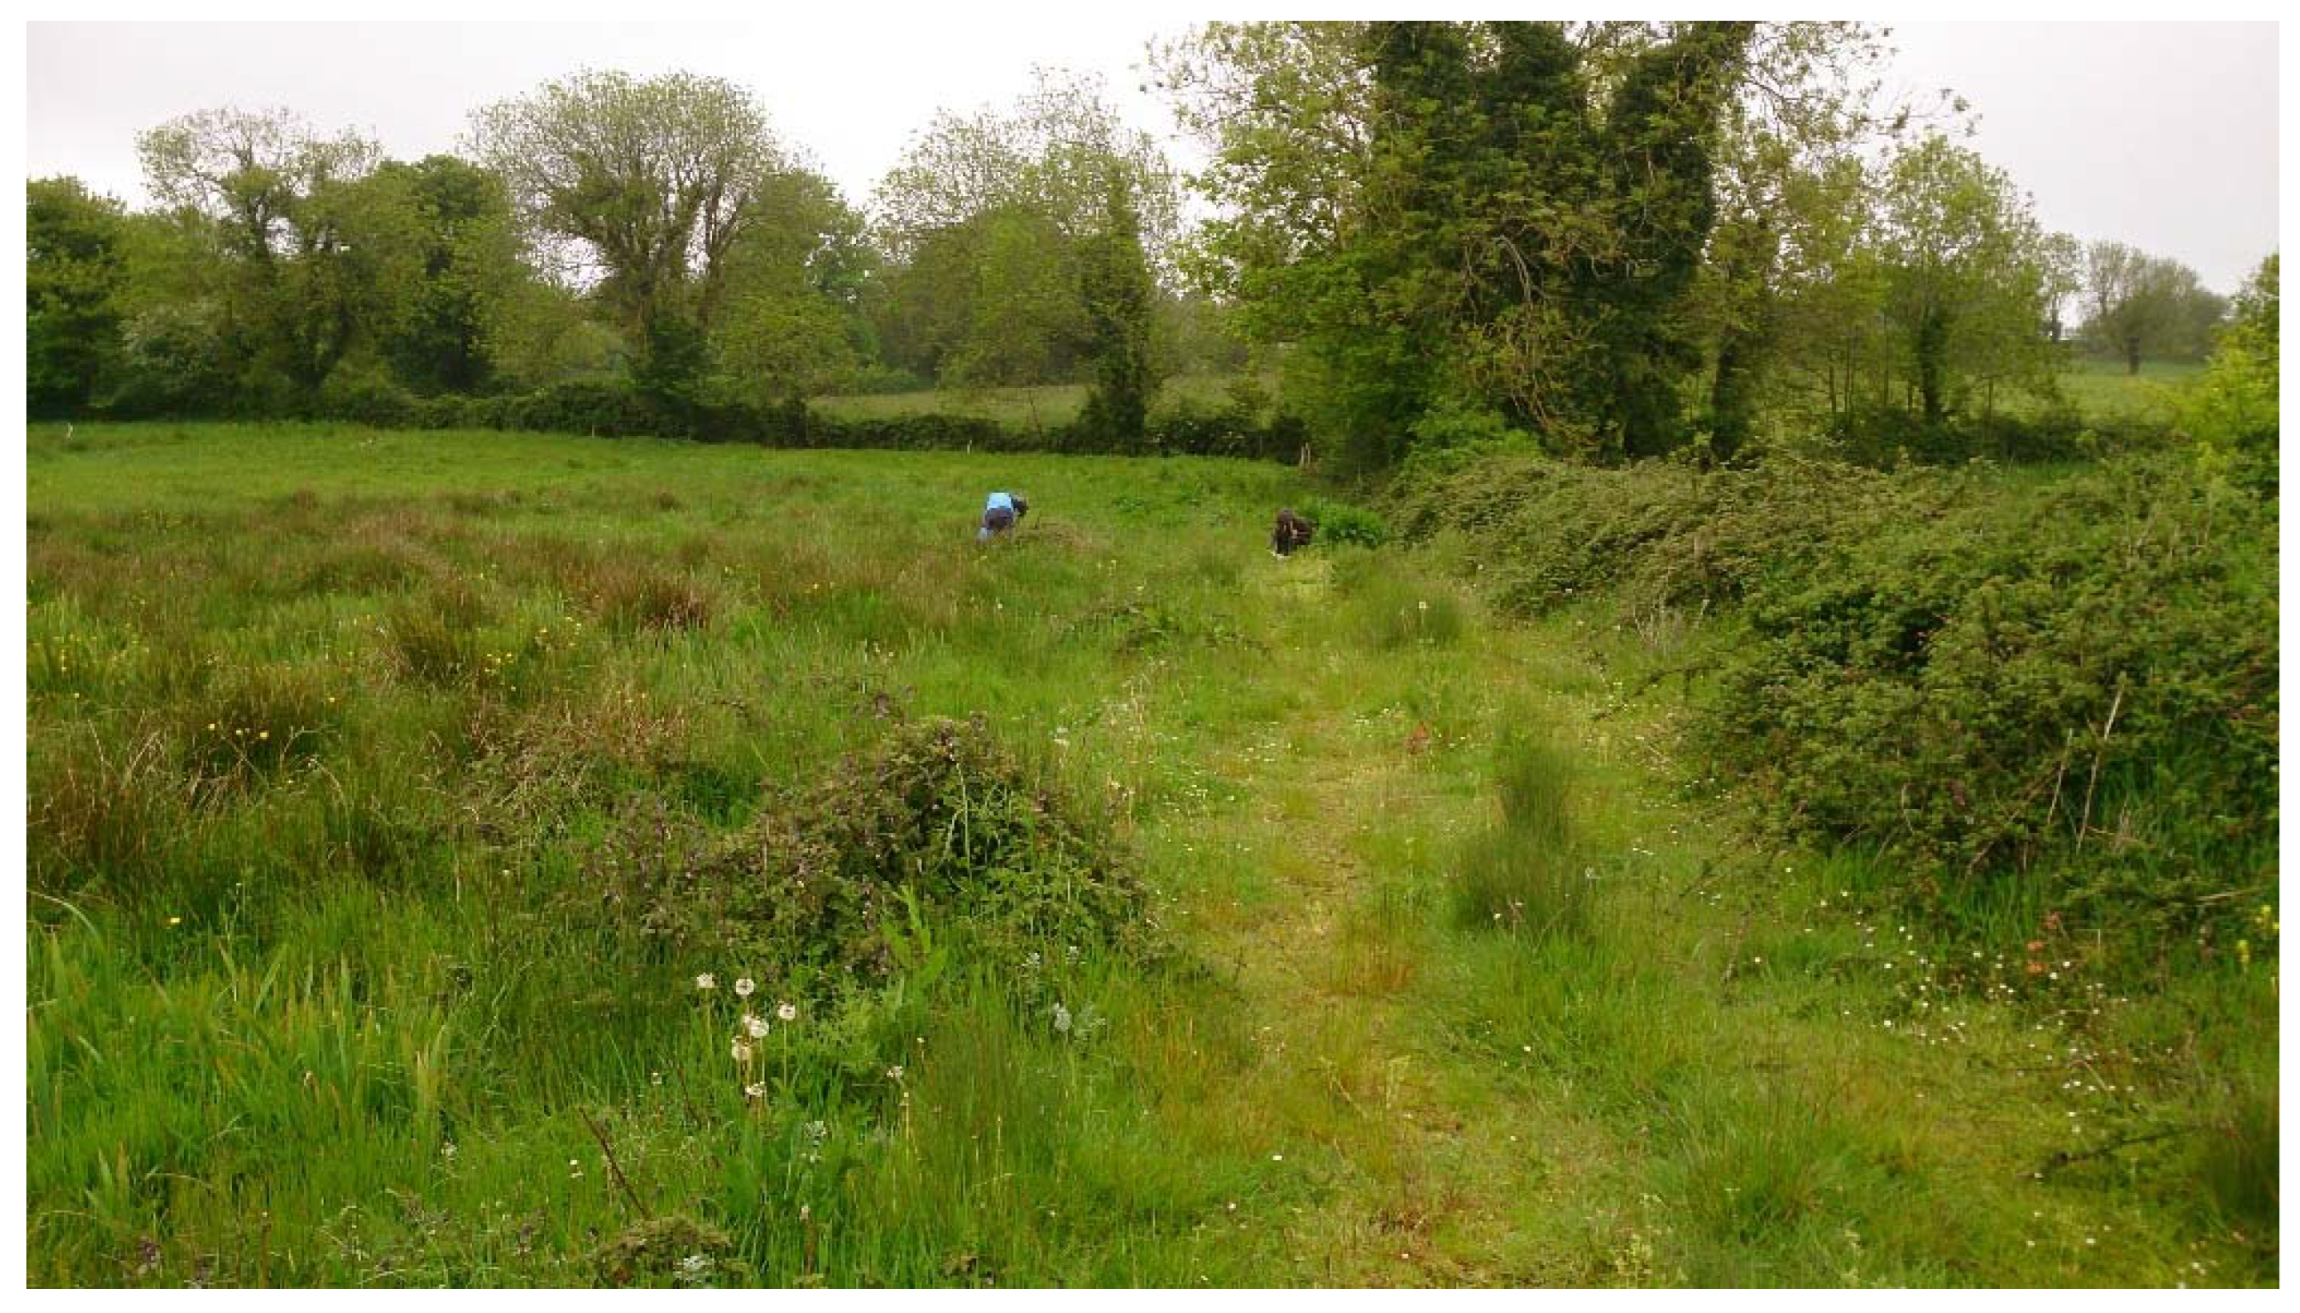
2.1. Field Sampling
2.2. Soil Analysis
2.3. Plant Chemical Analysis
2.4. Synchrotron Analysis
3. Results
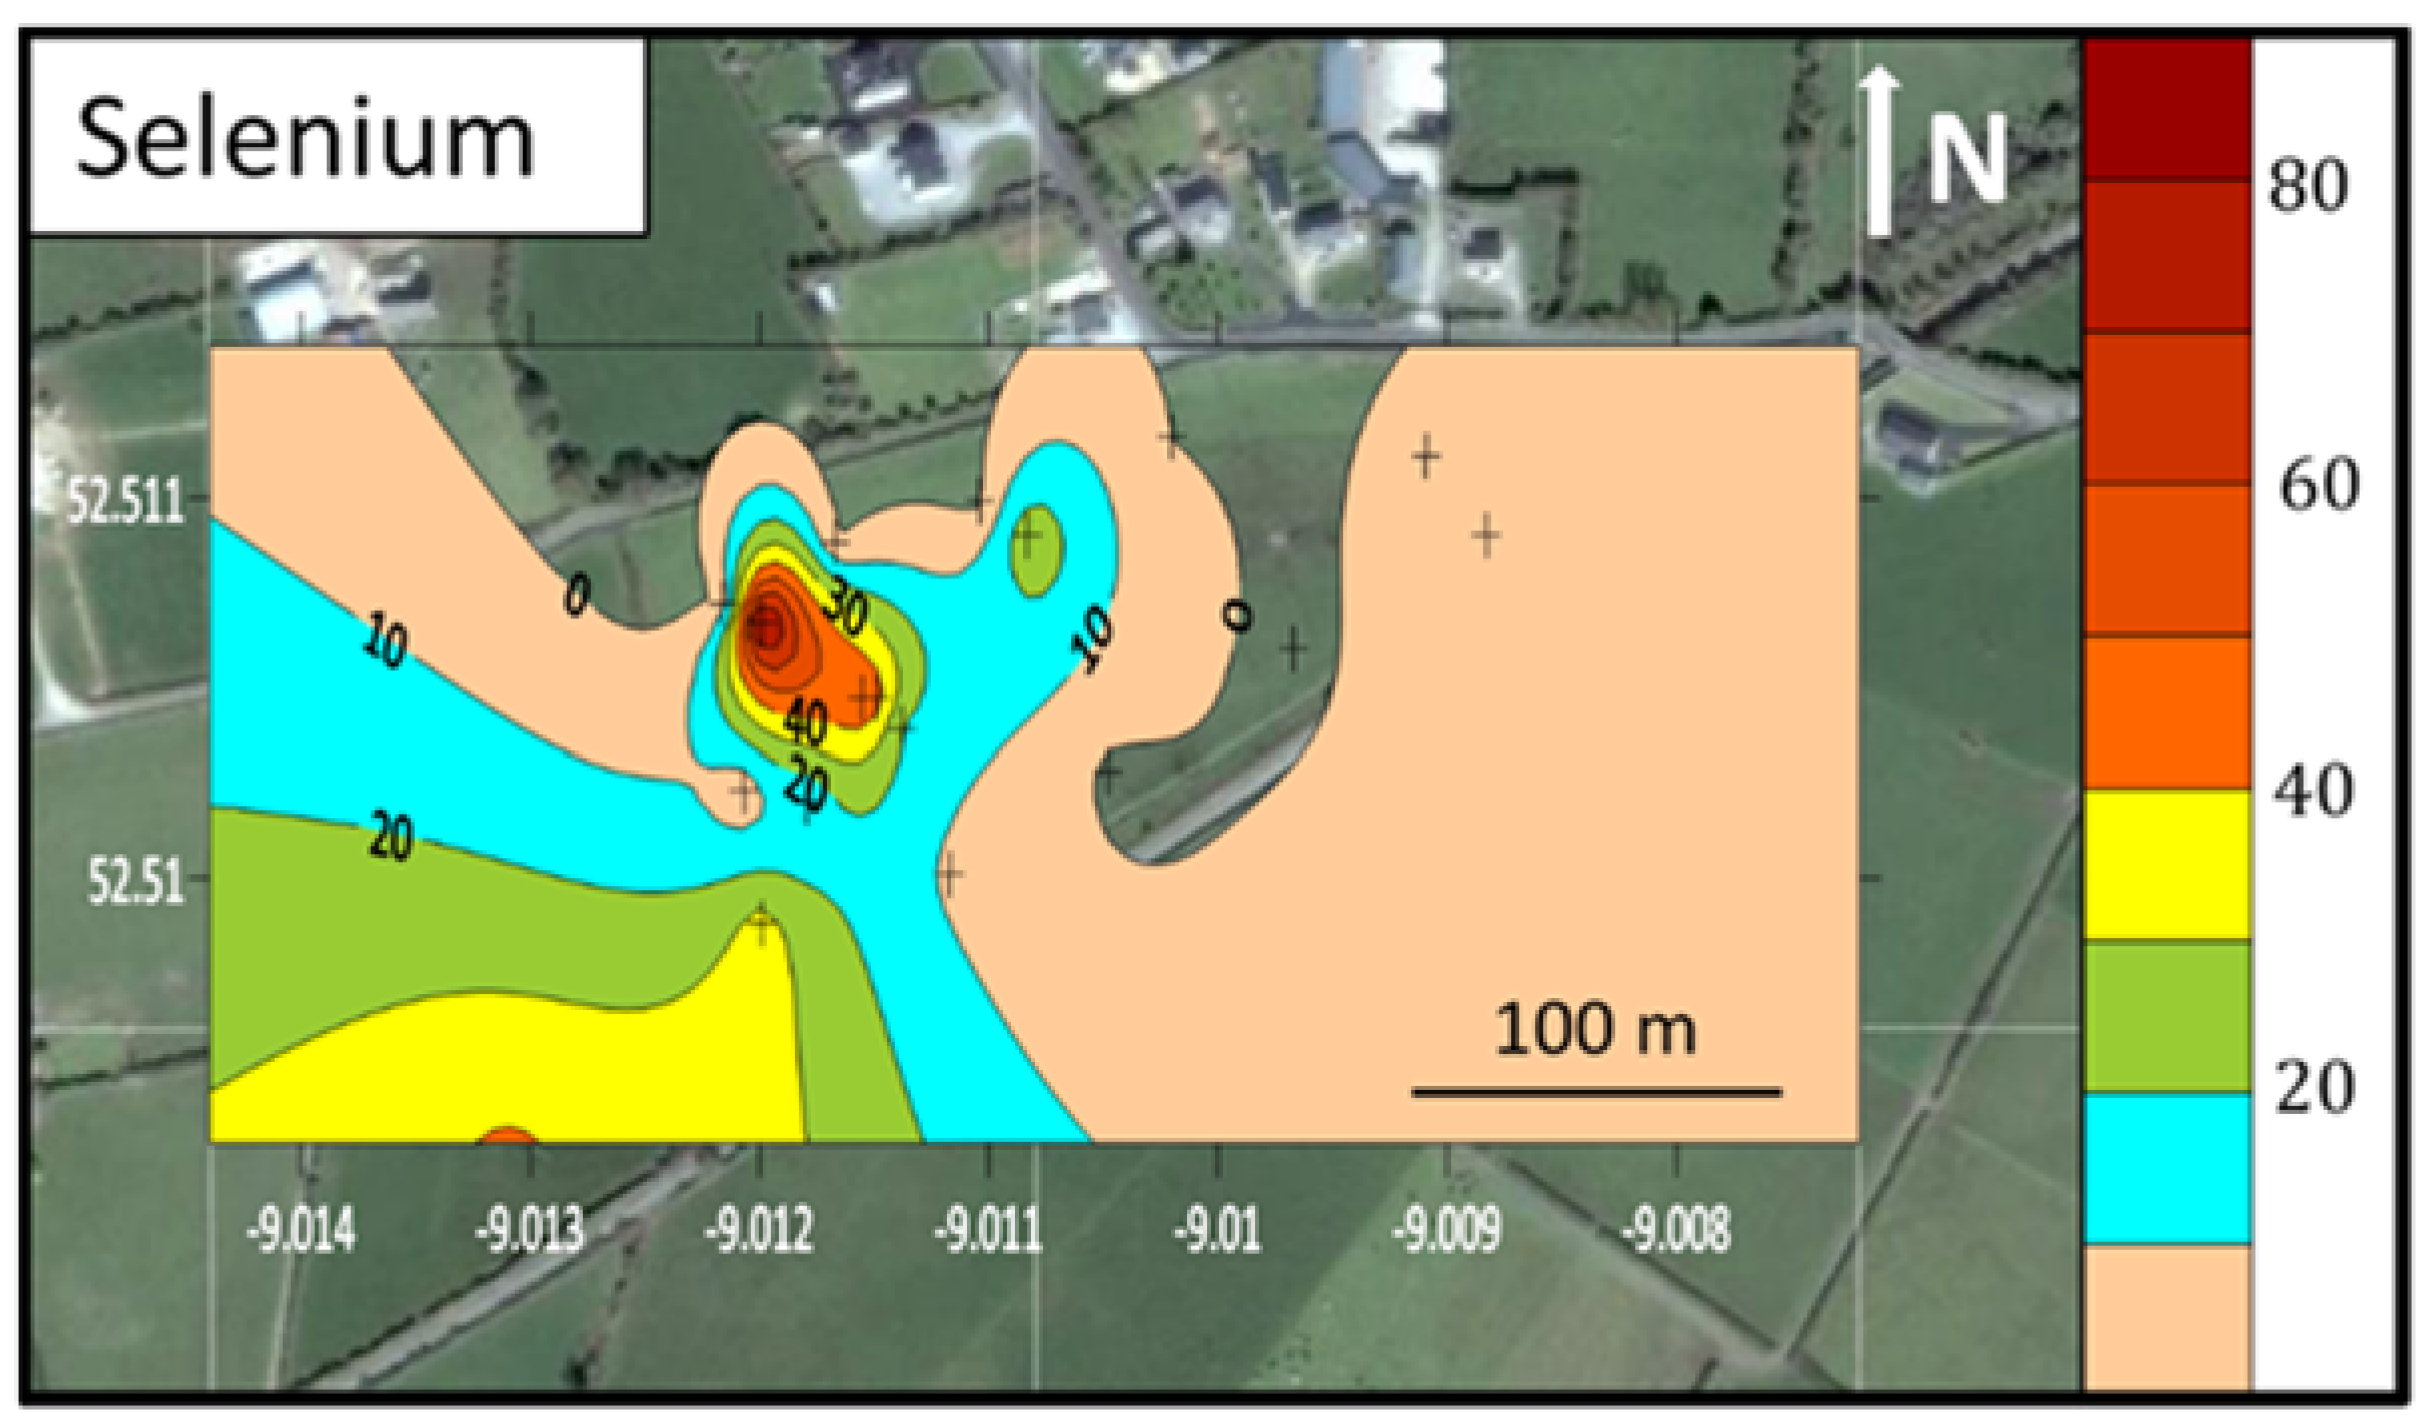
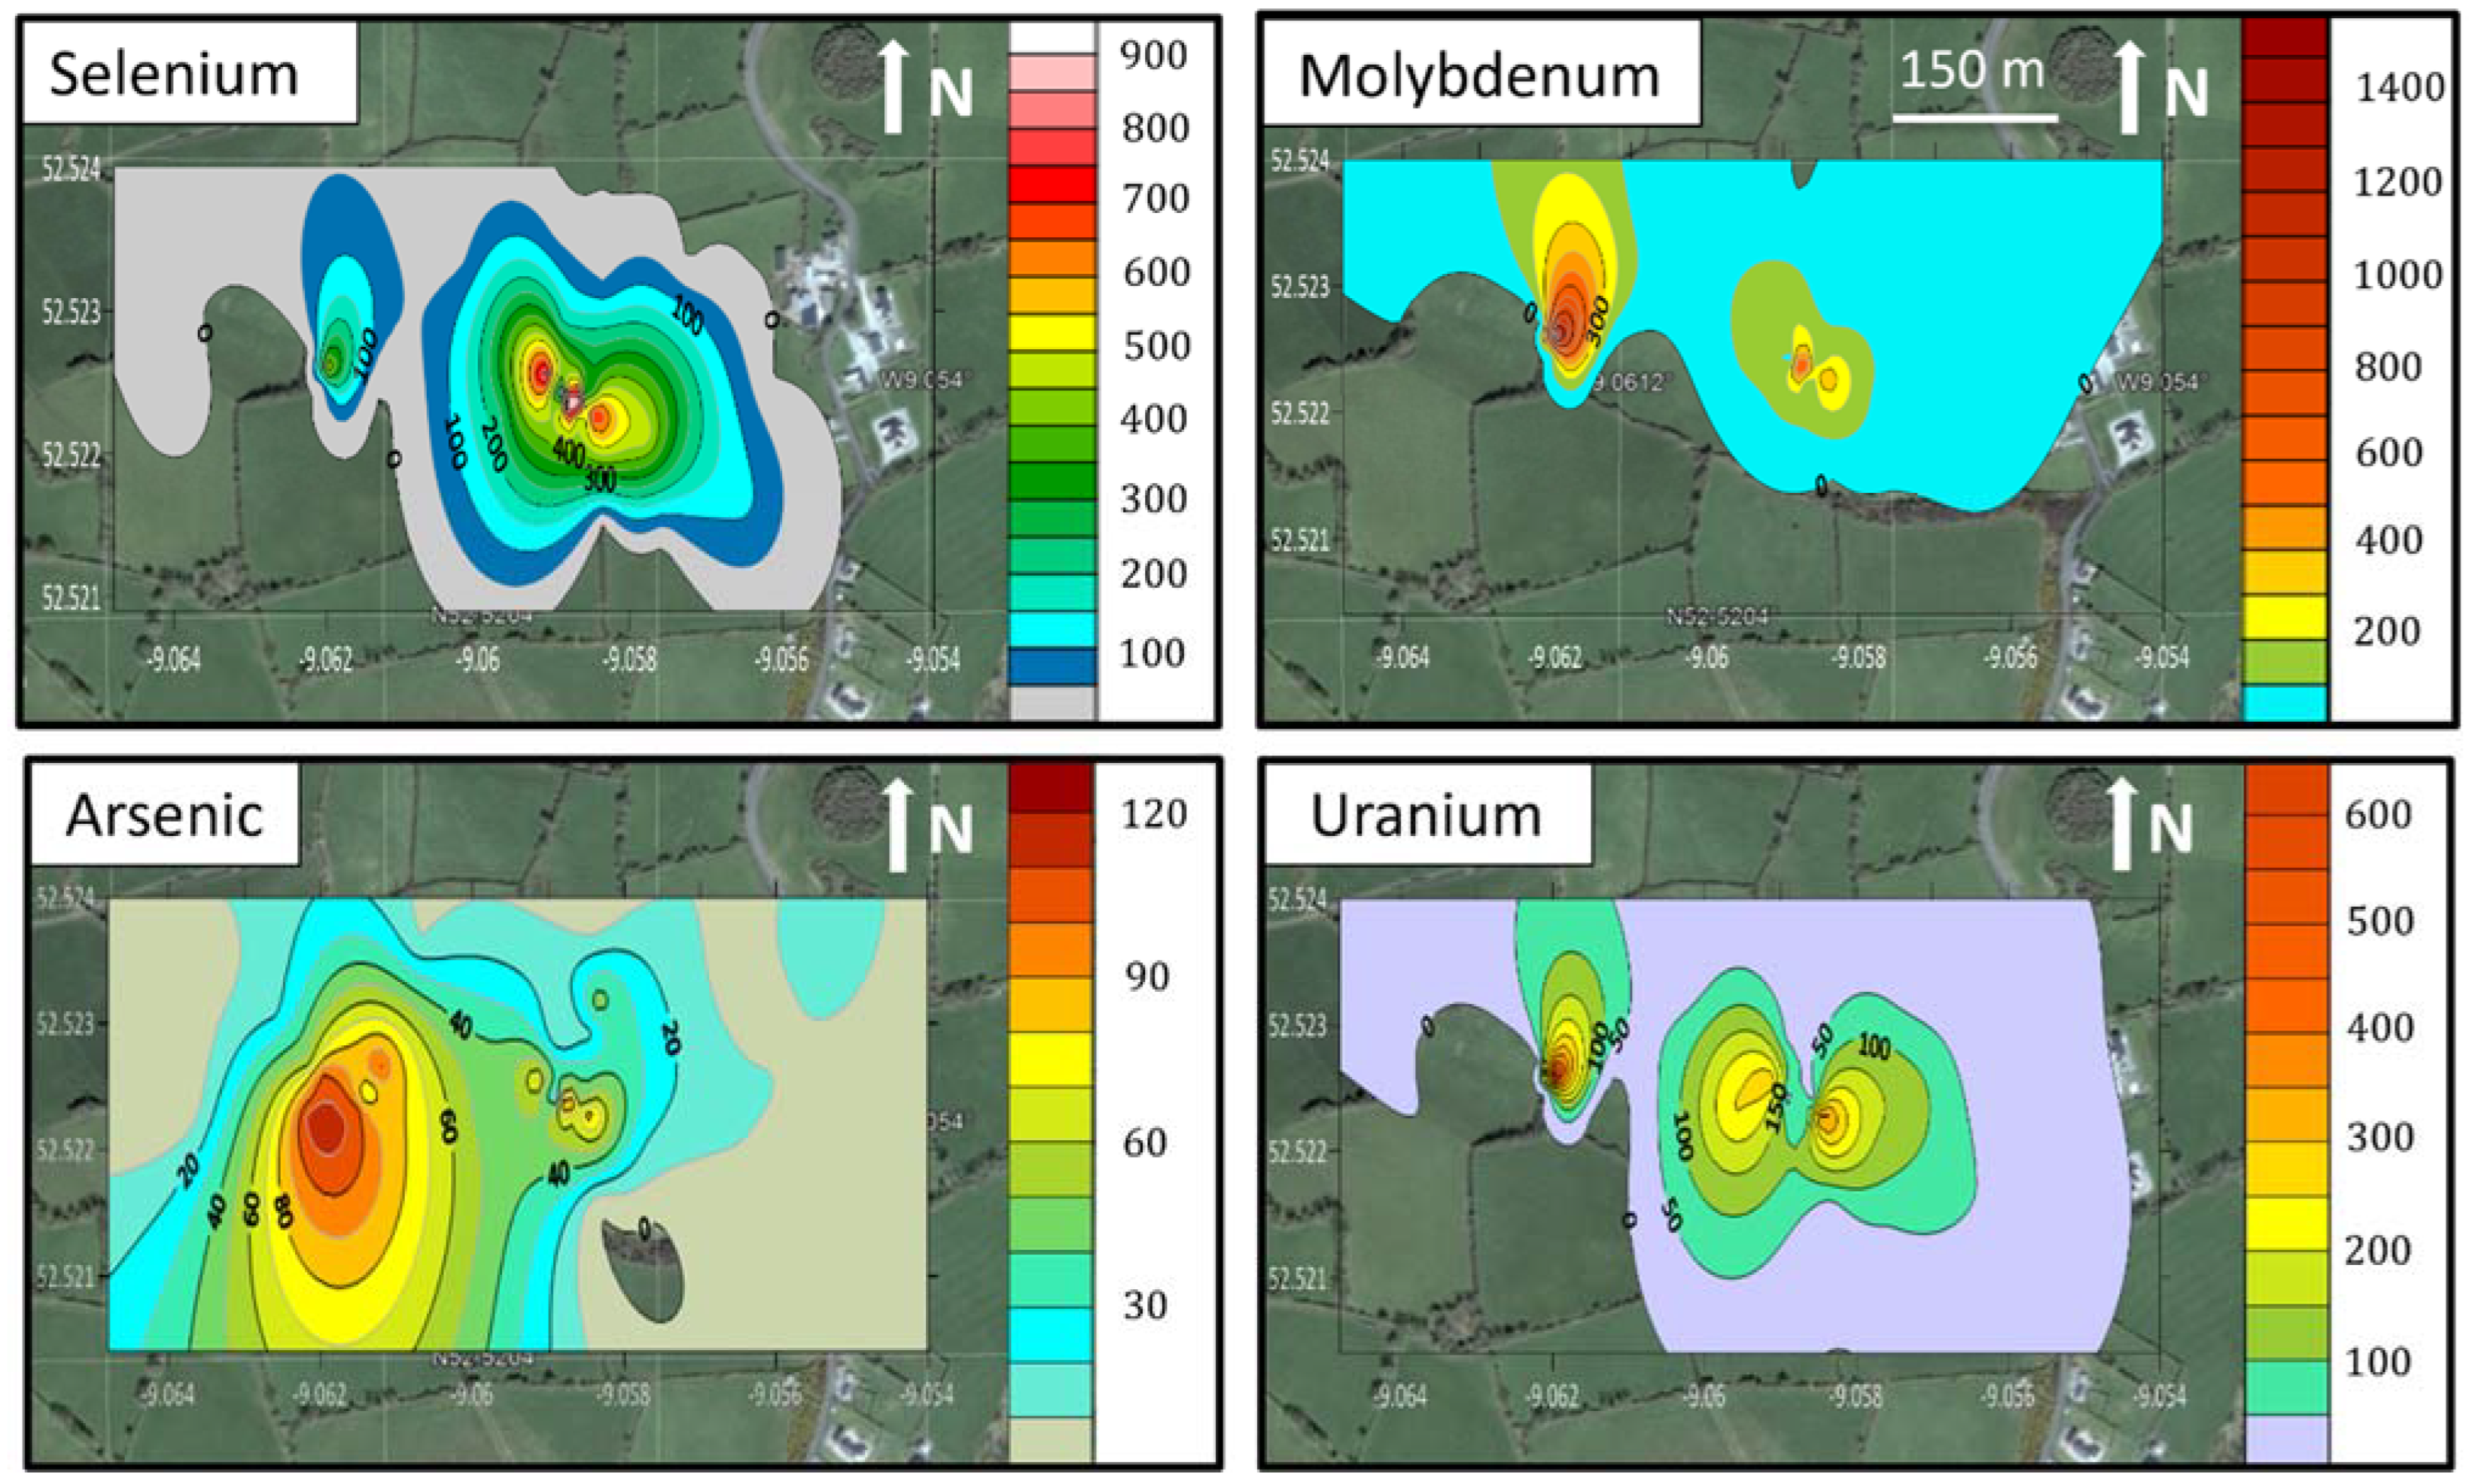
3.1. Soil Characterisation
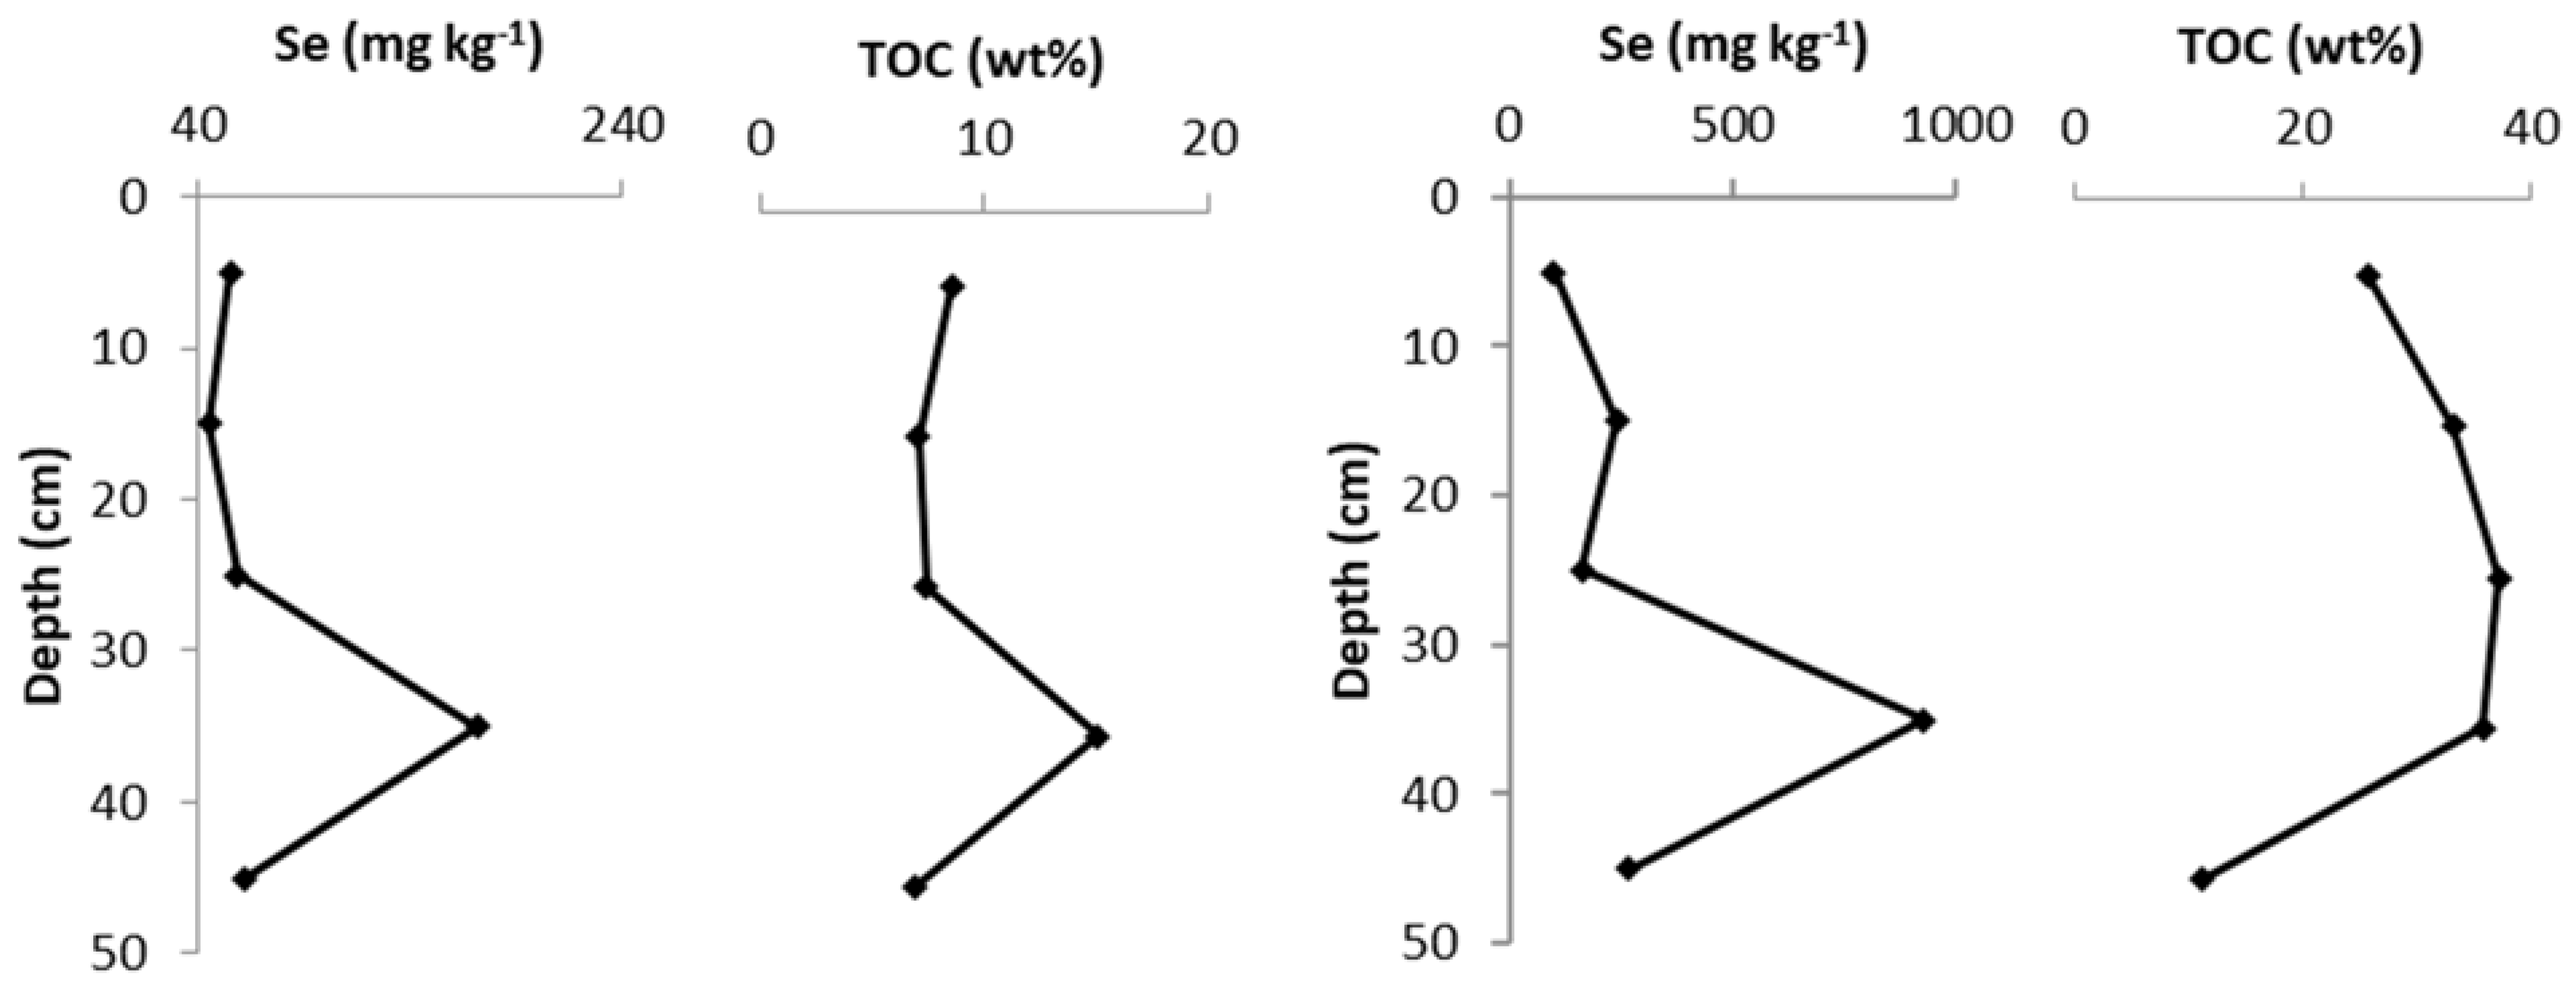
3.2. Soil Core Bulk Analysis
3.3. Se, Mo, As U and V in Grass and White Clover (Non-Accumulators)
3.4. Se, Mo, U, As and V in Brassica (Se-Accumulators)
3.5. μ-XRF and XAS
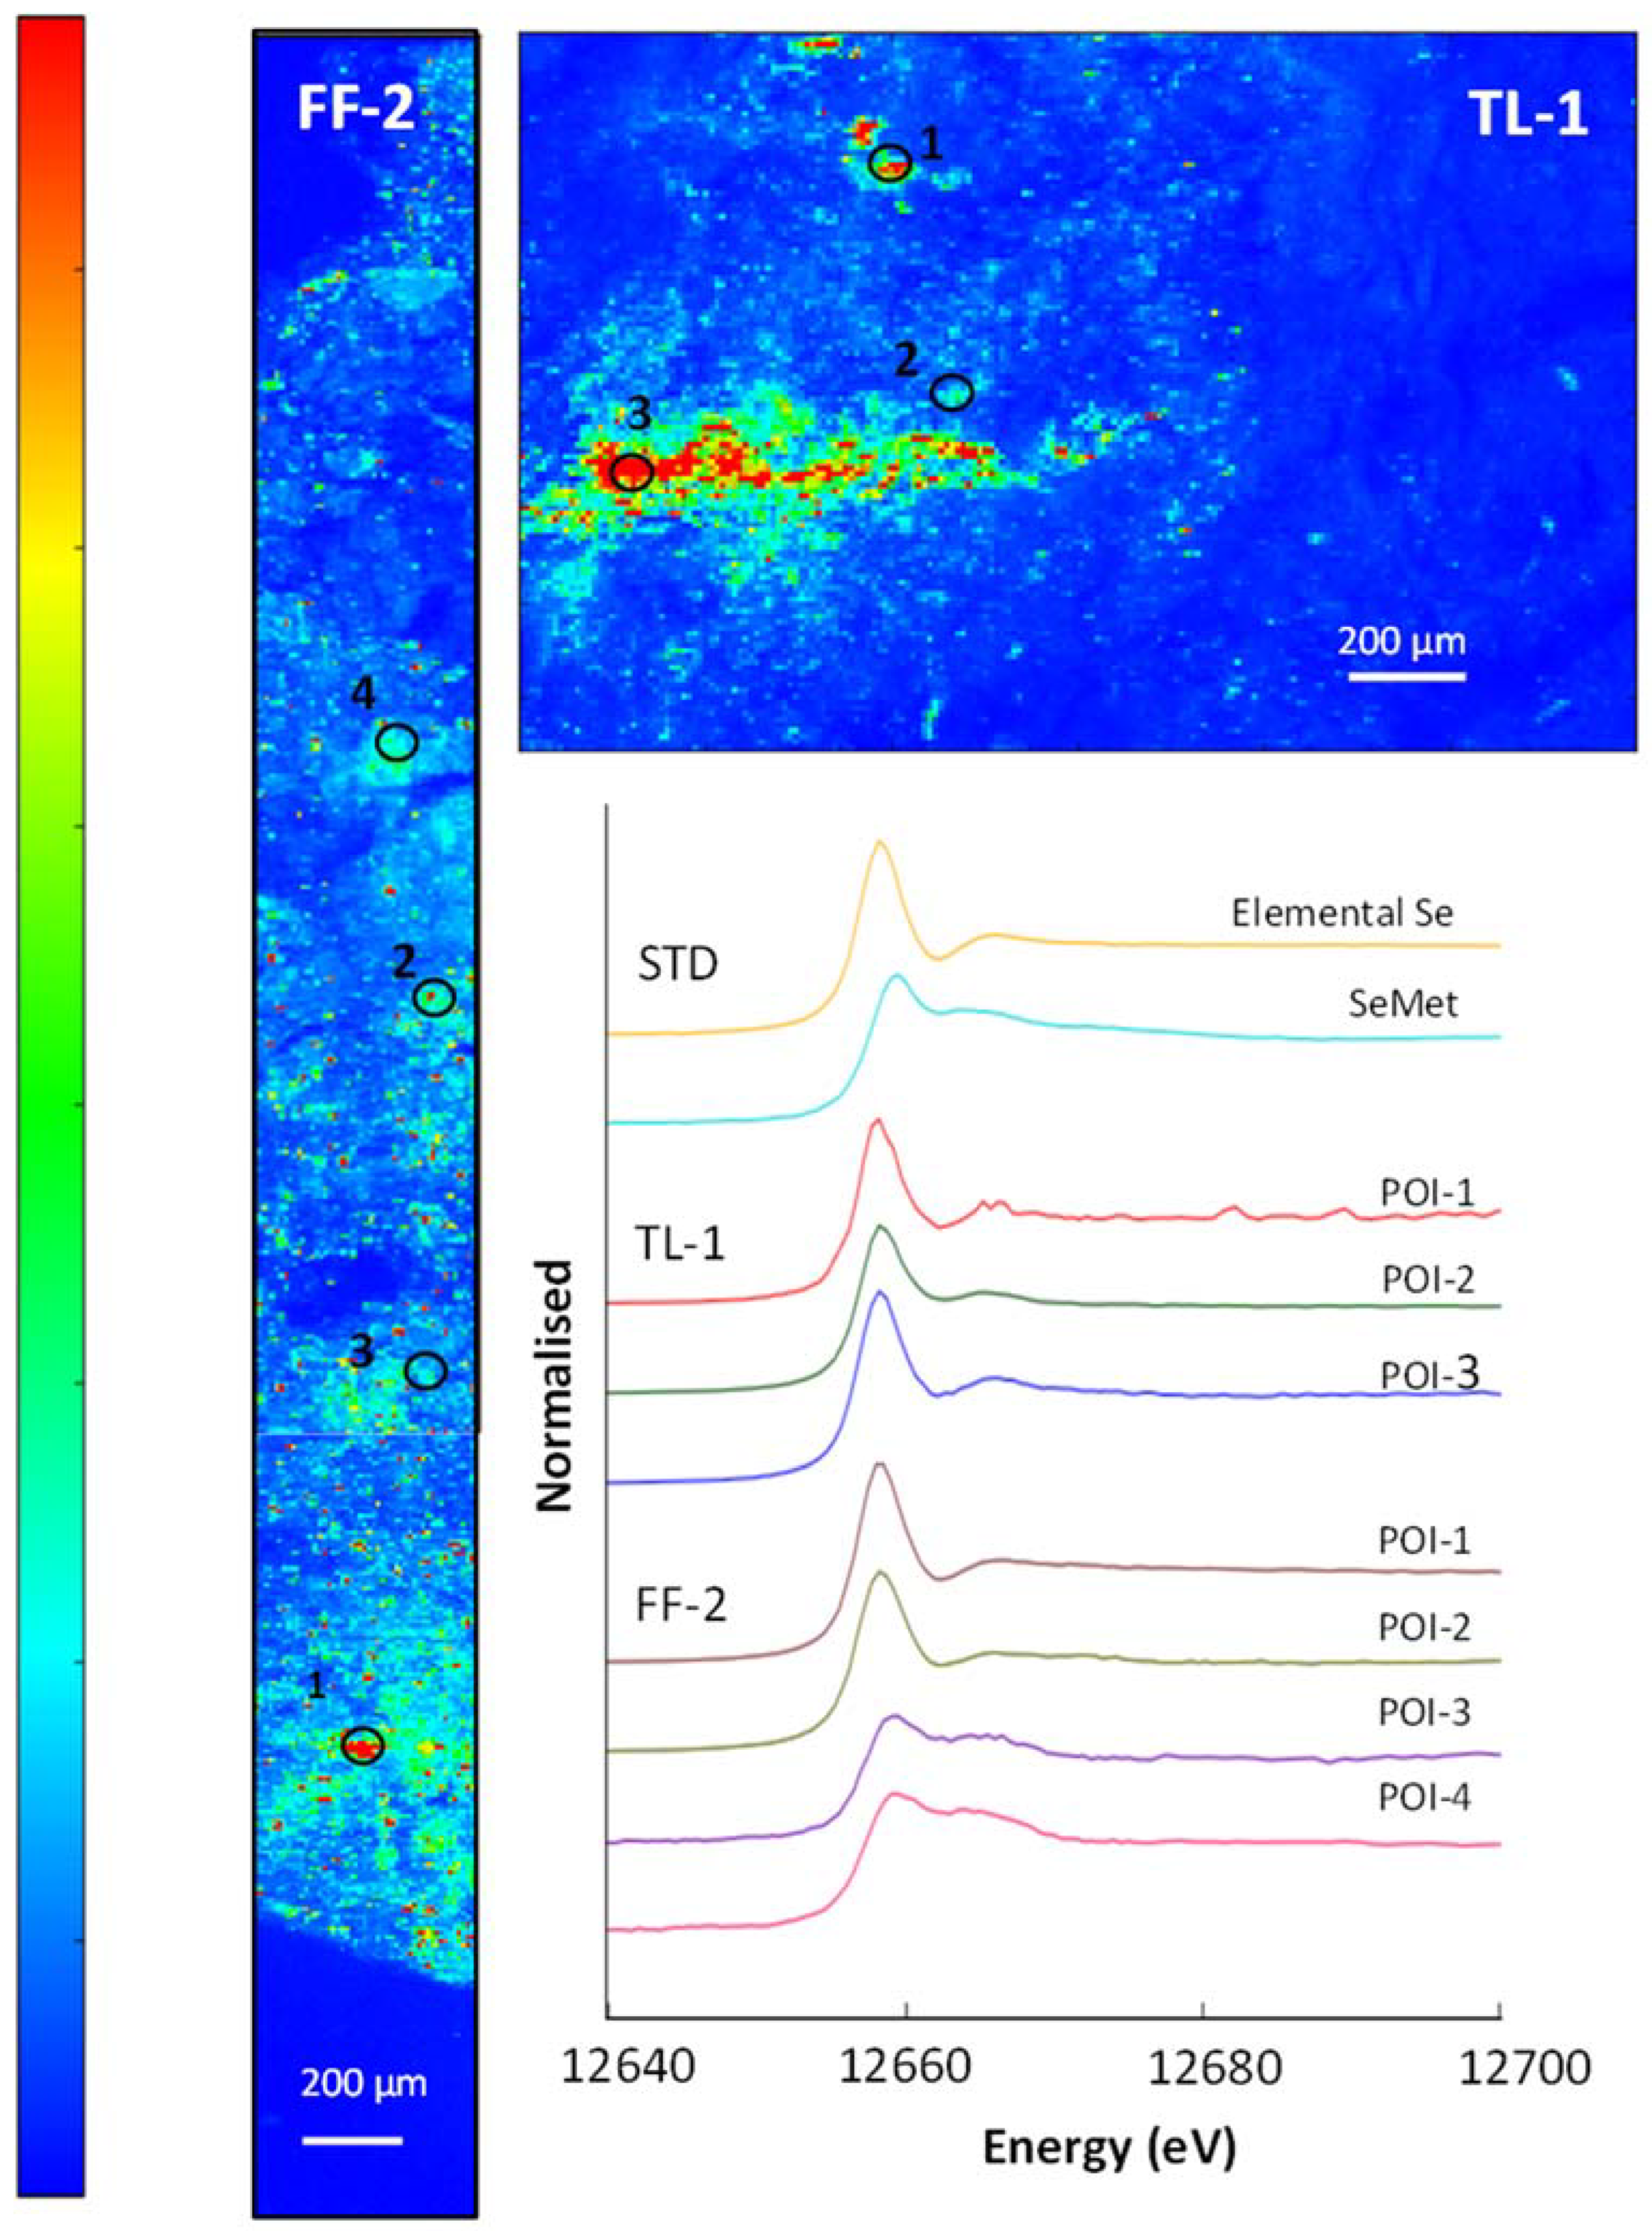
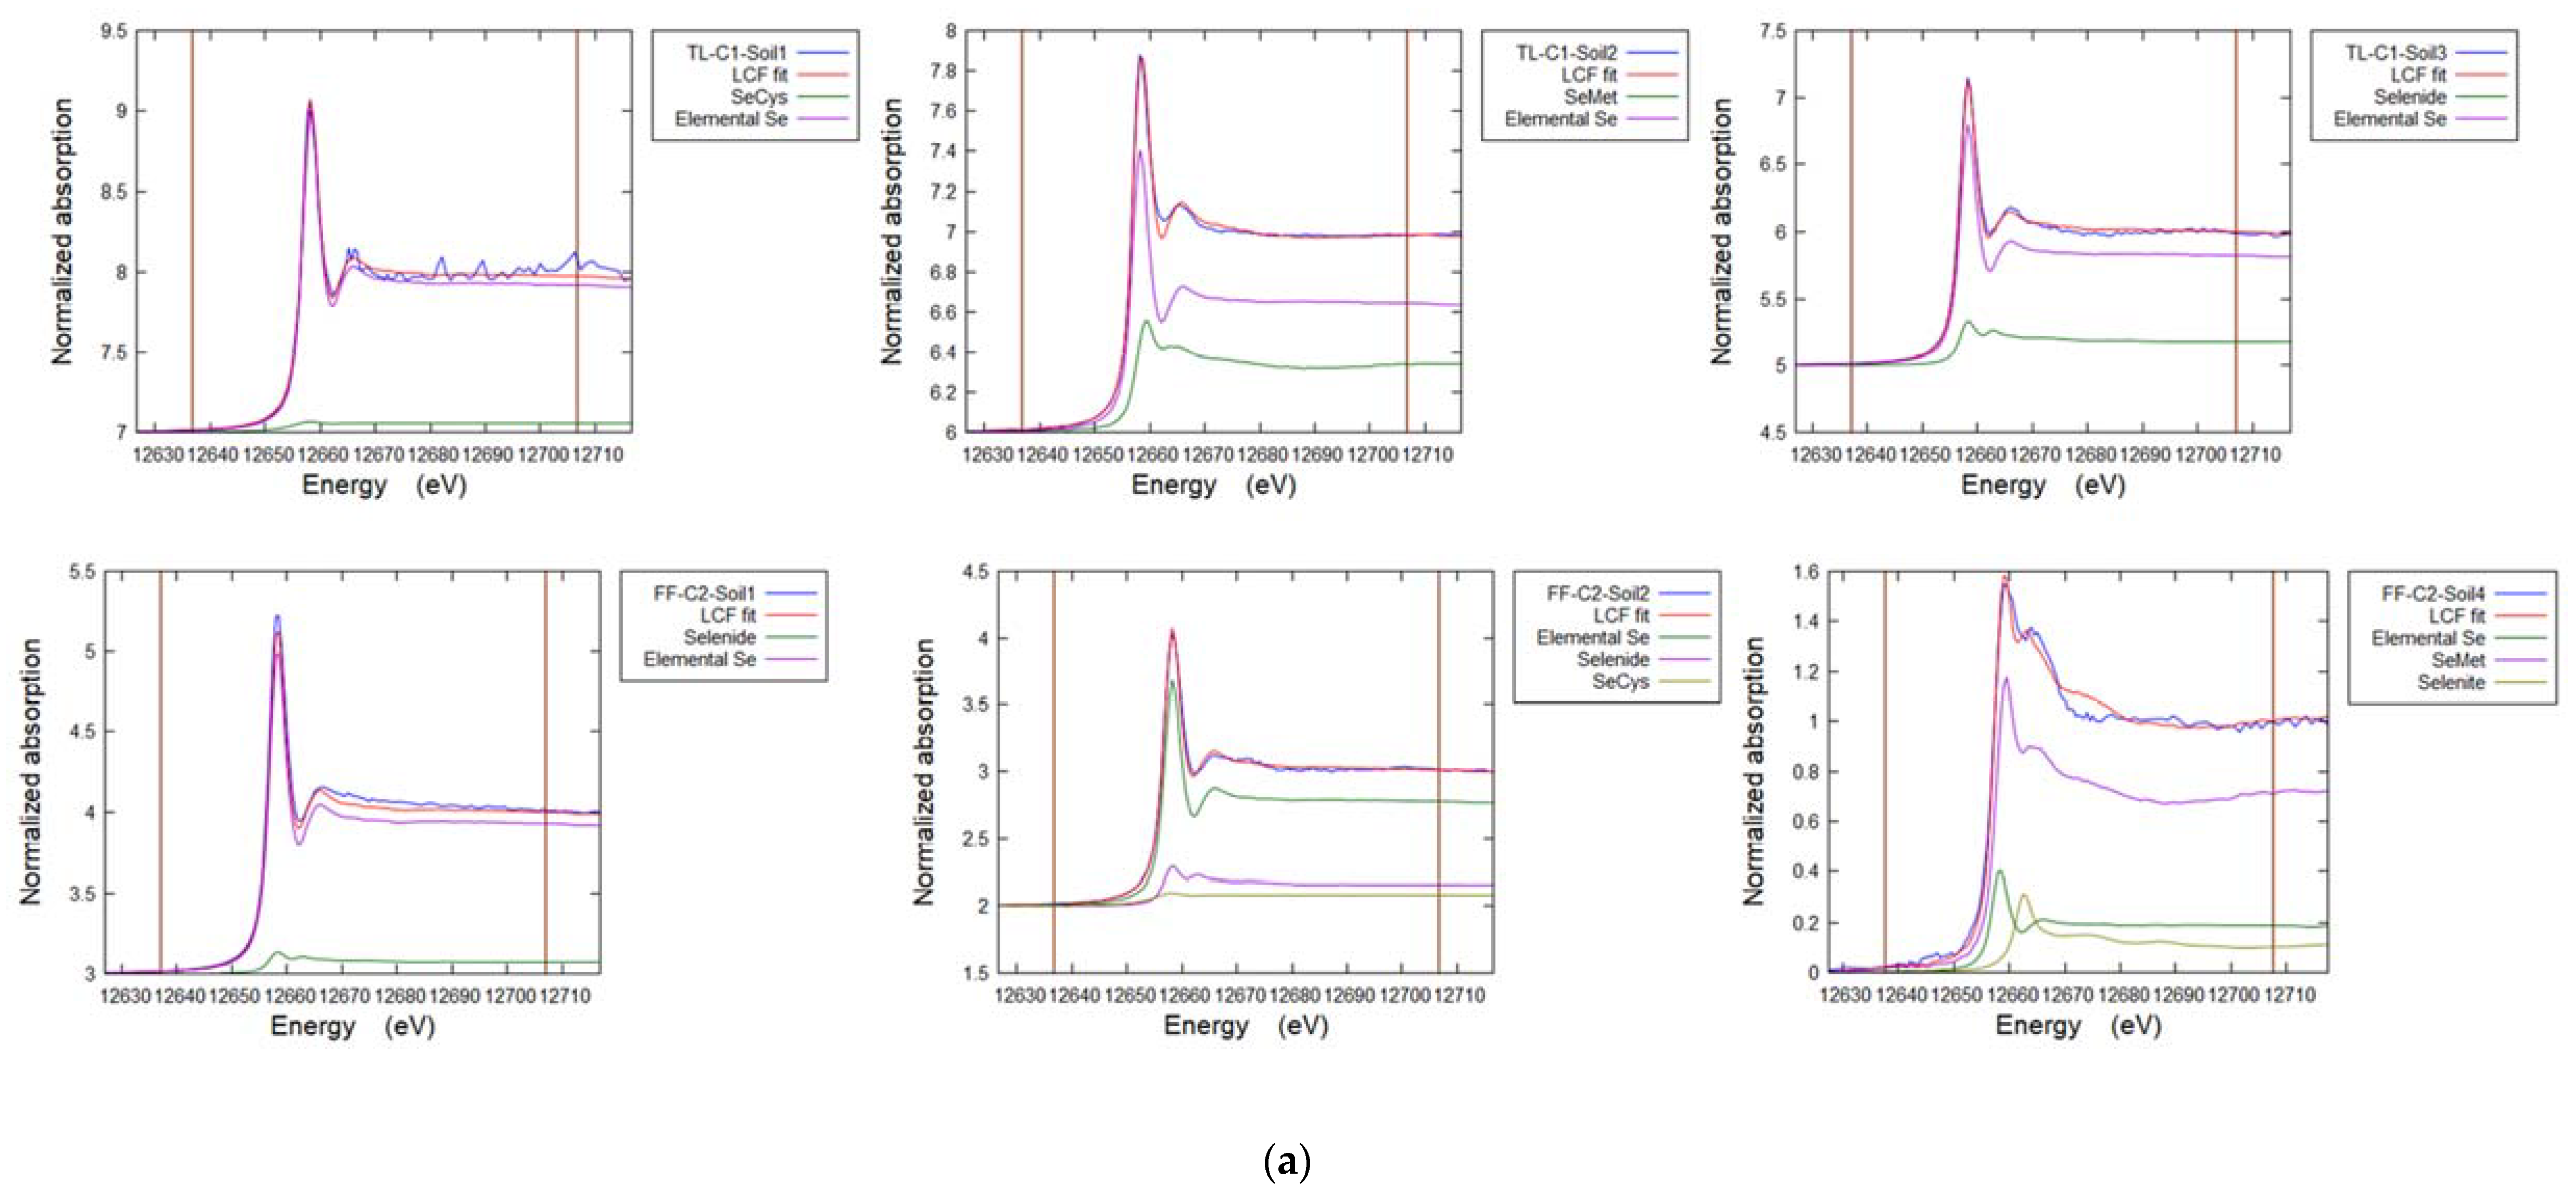
3.6. Soil Selenium Species
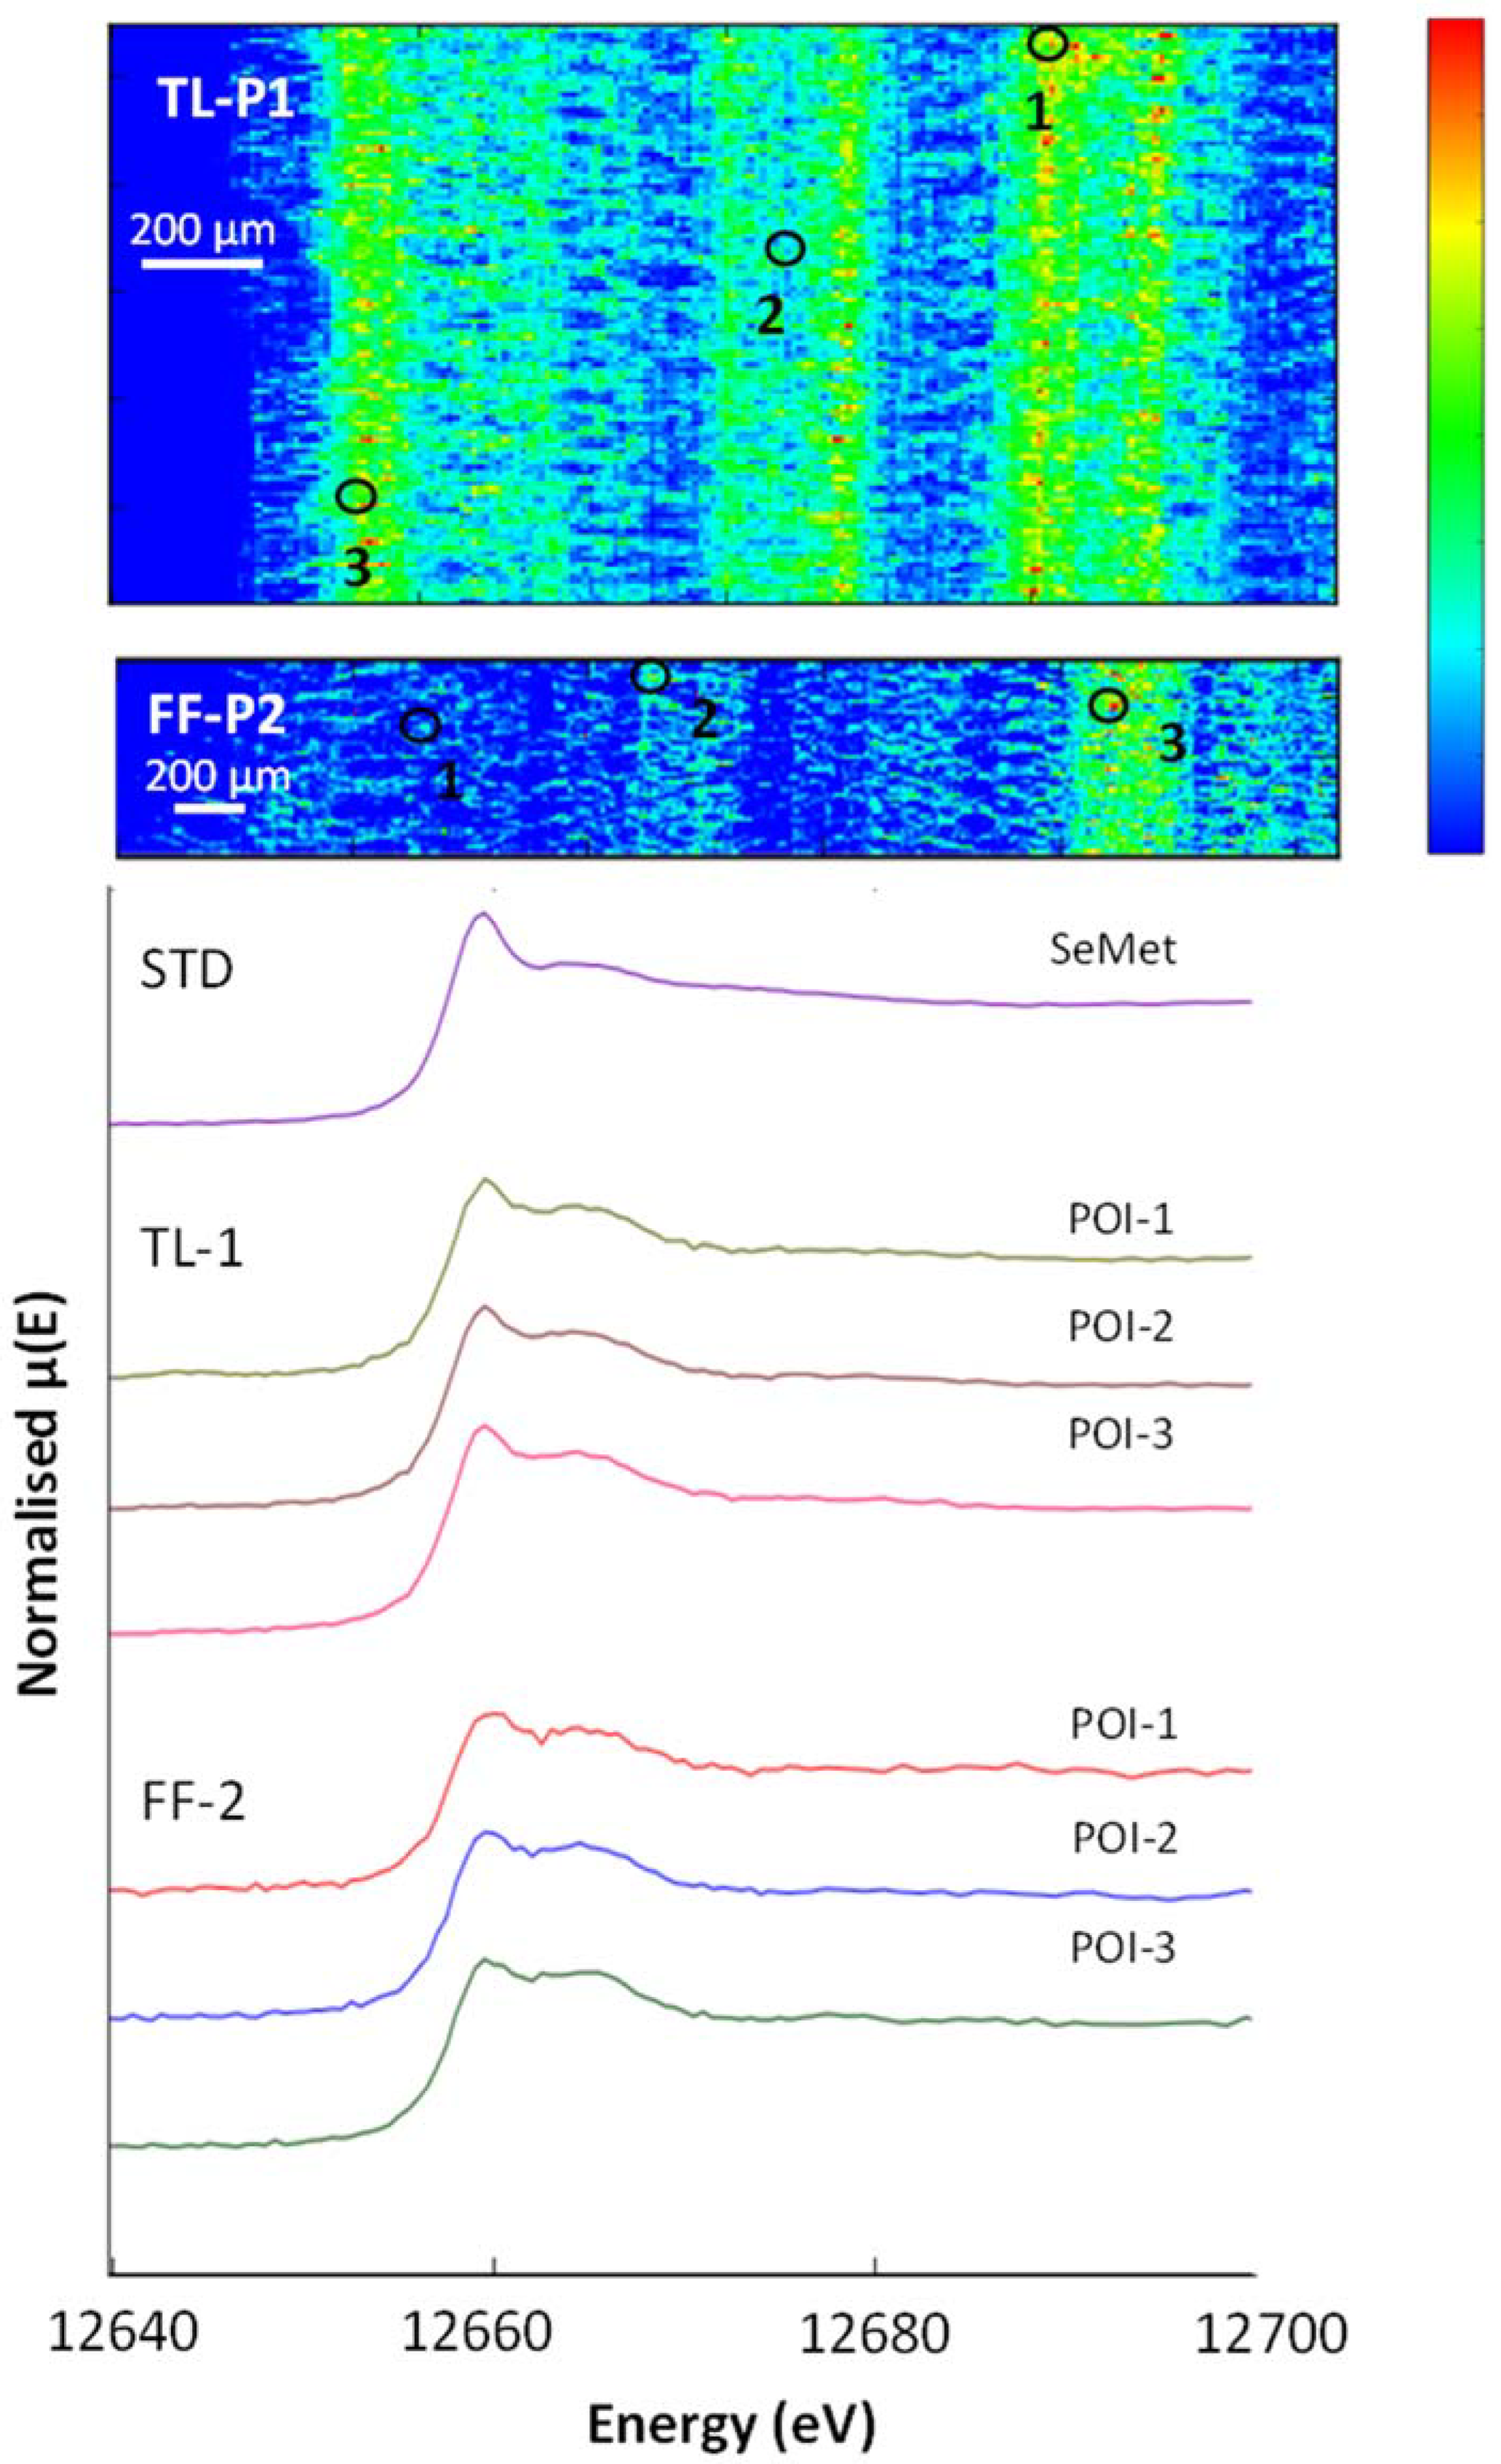
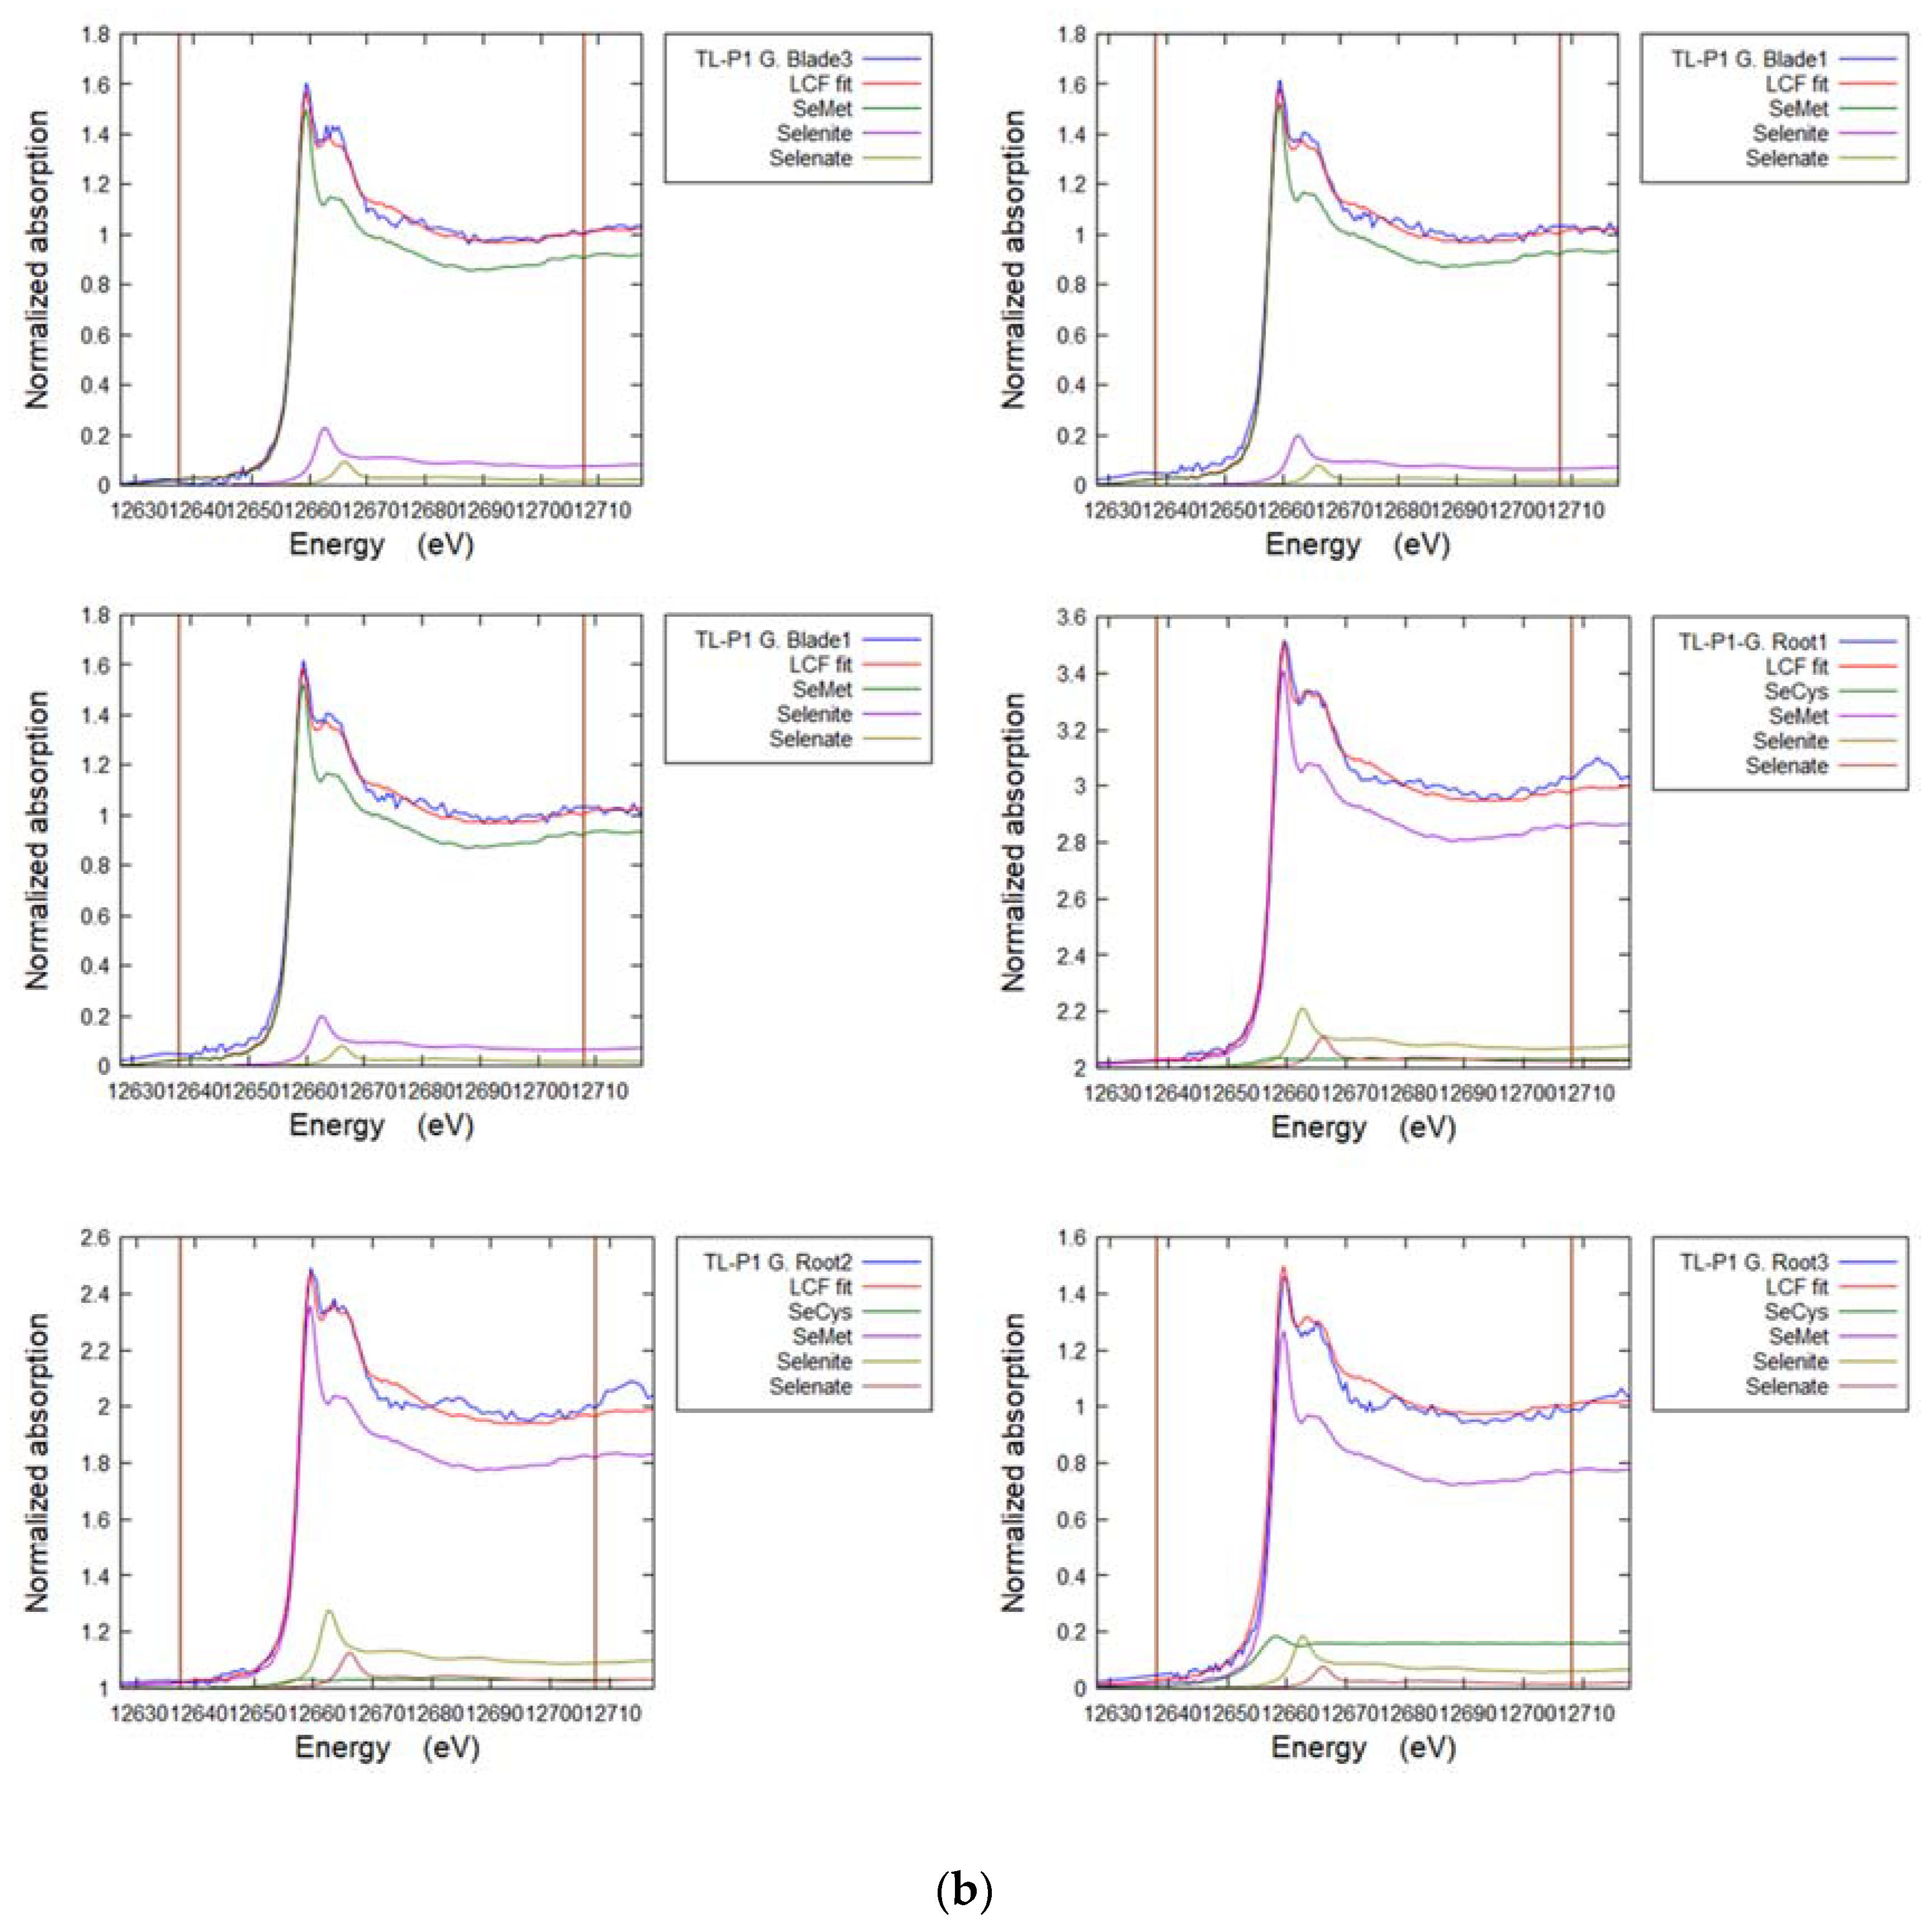
3.7. Selenium in Non-Accumulator Species
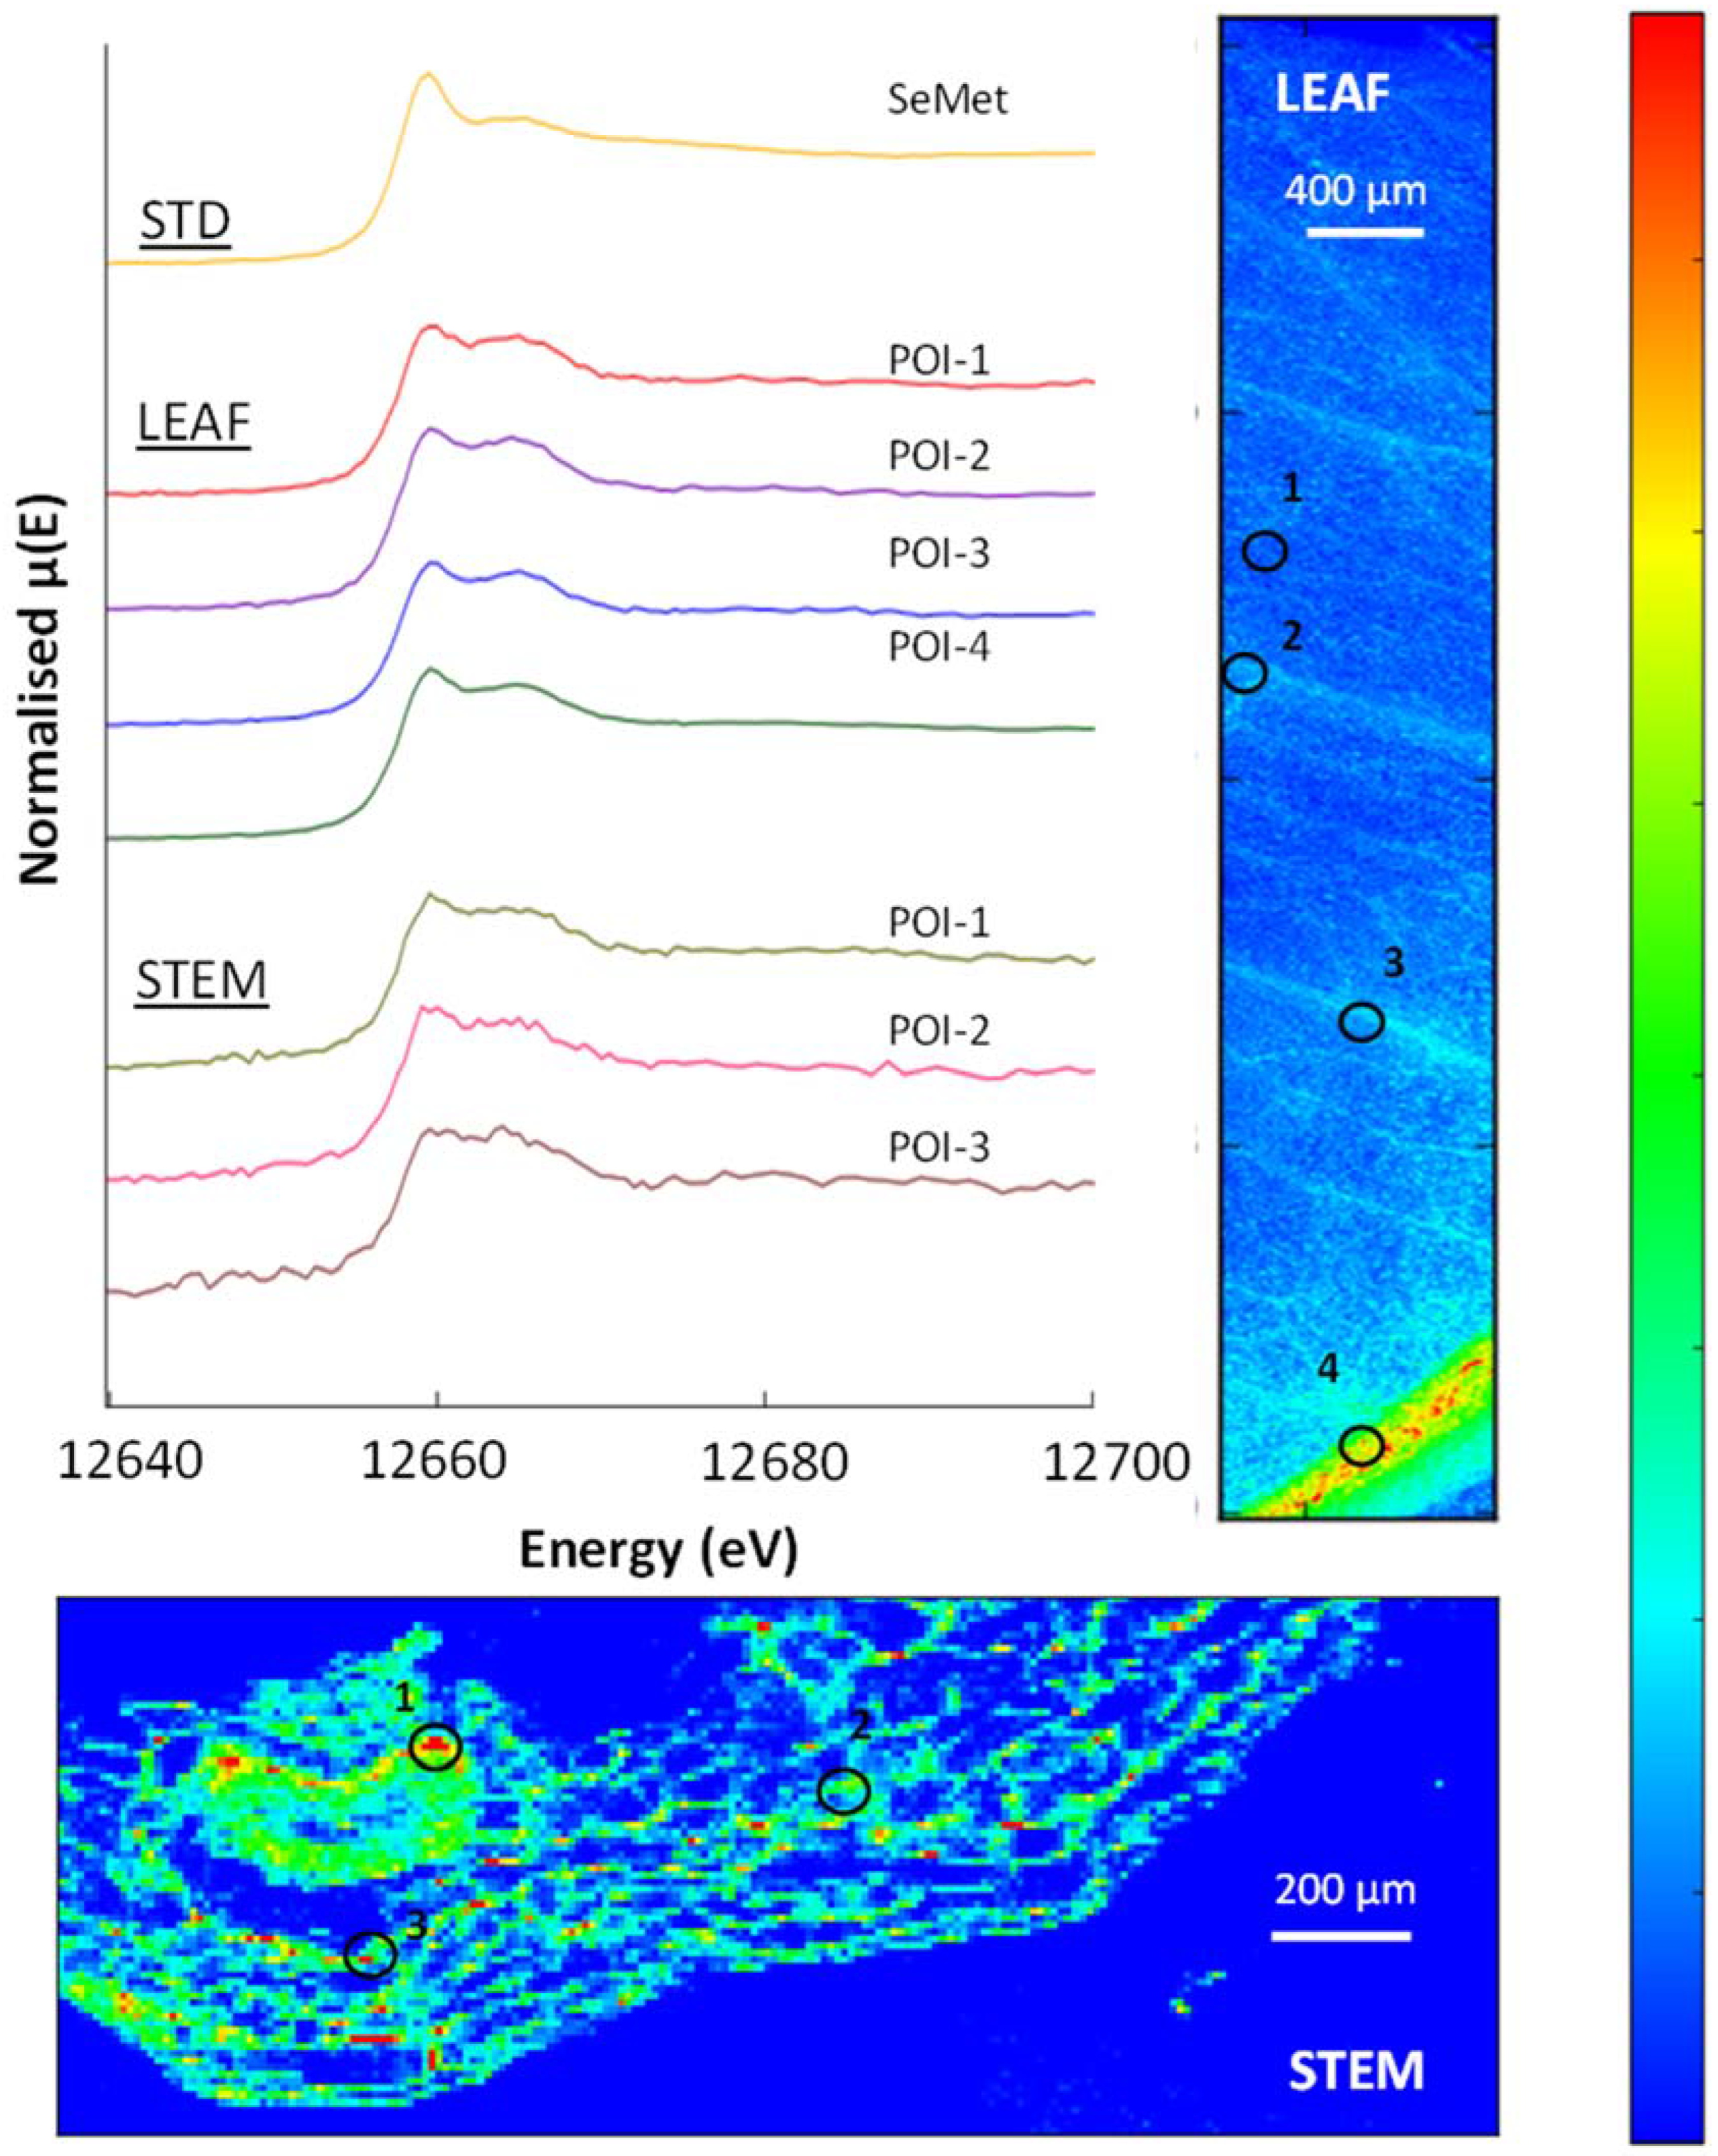
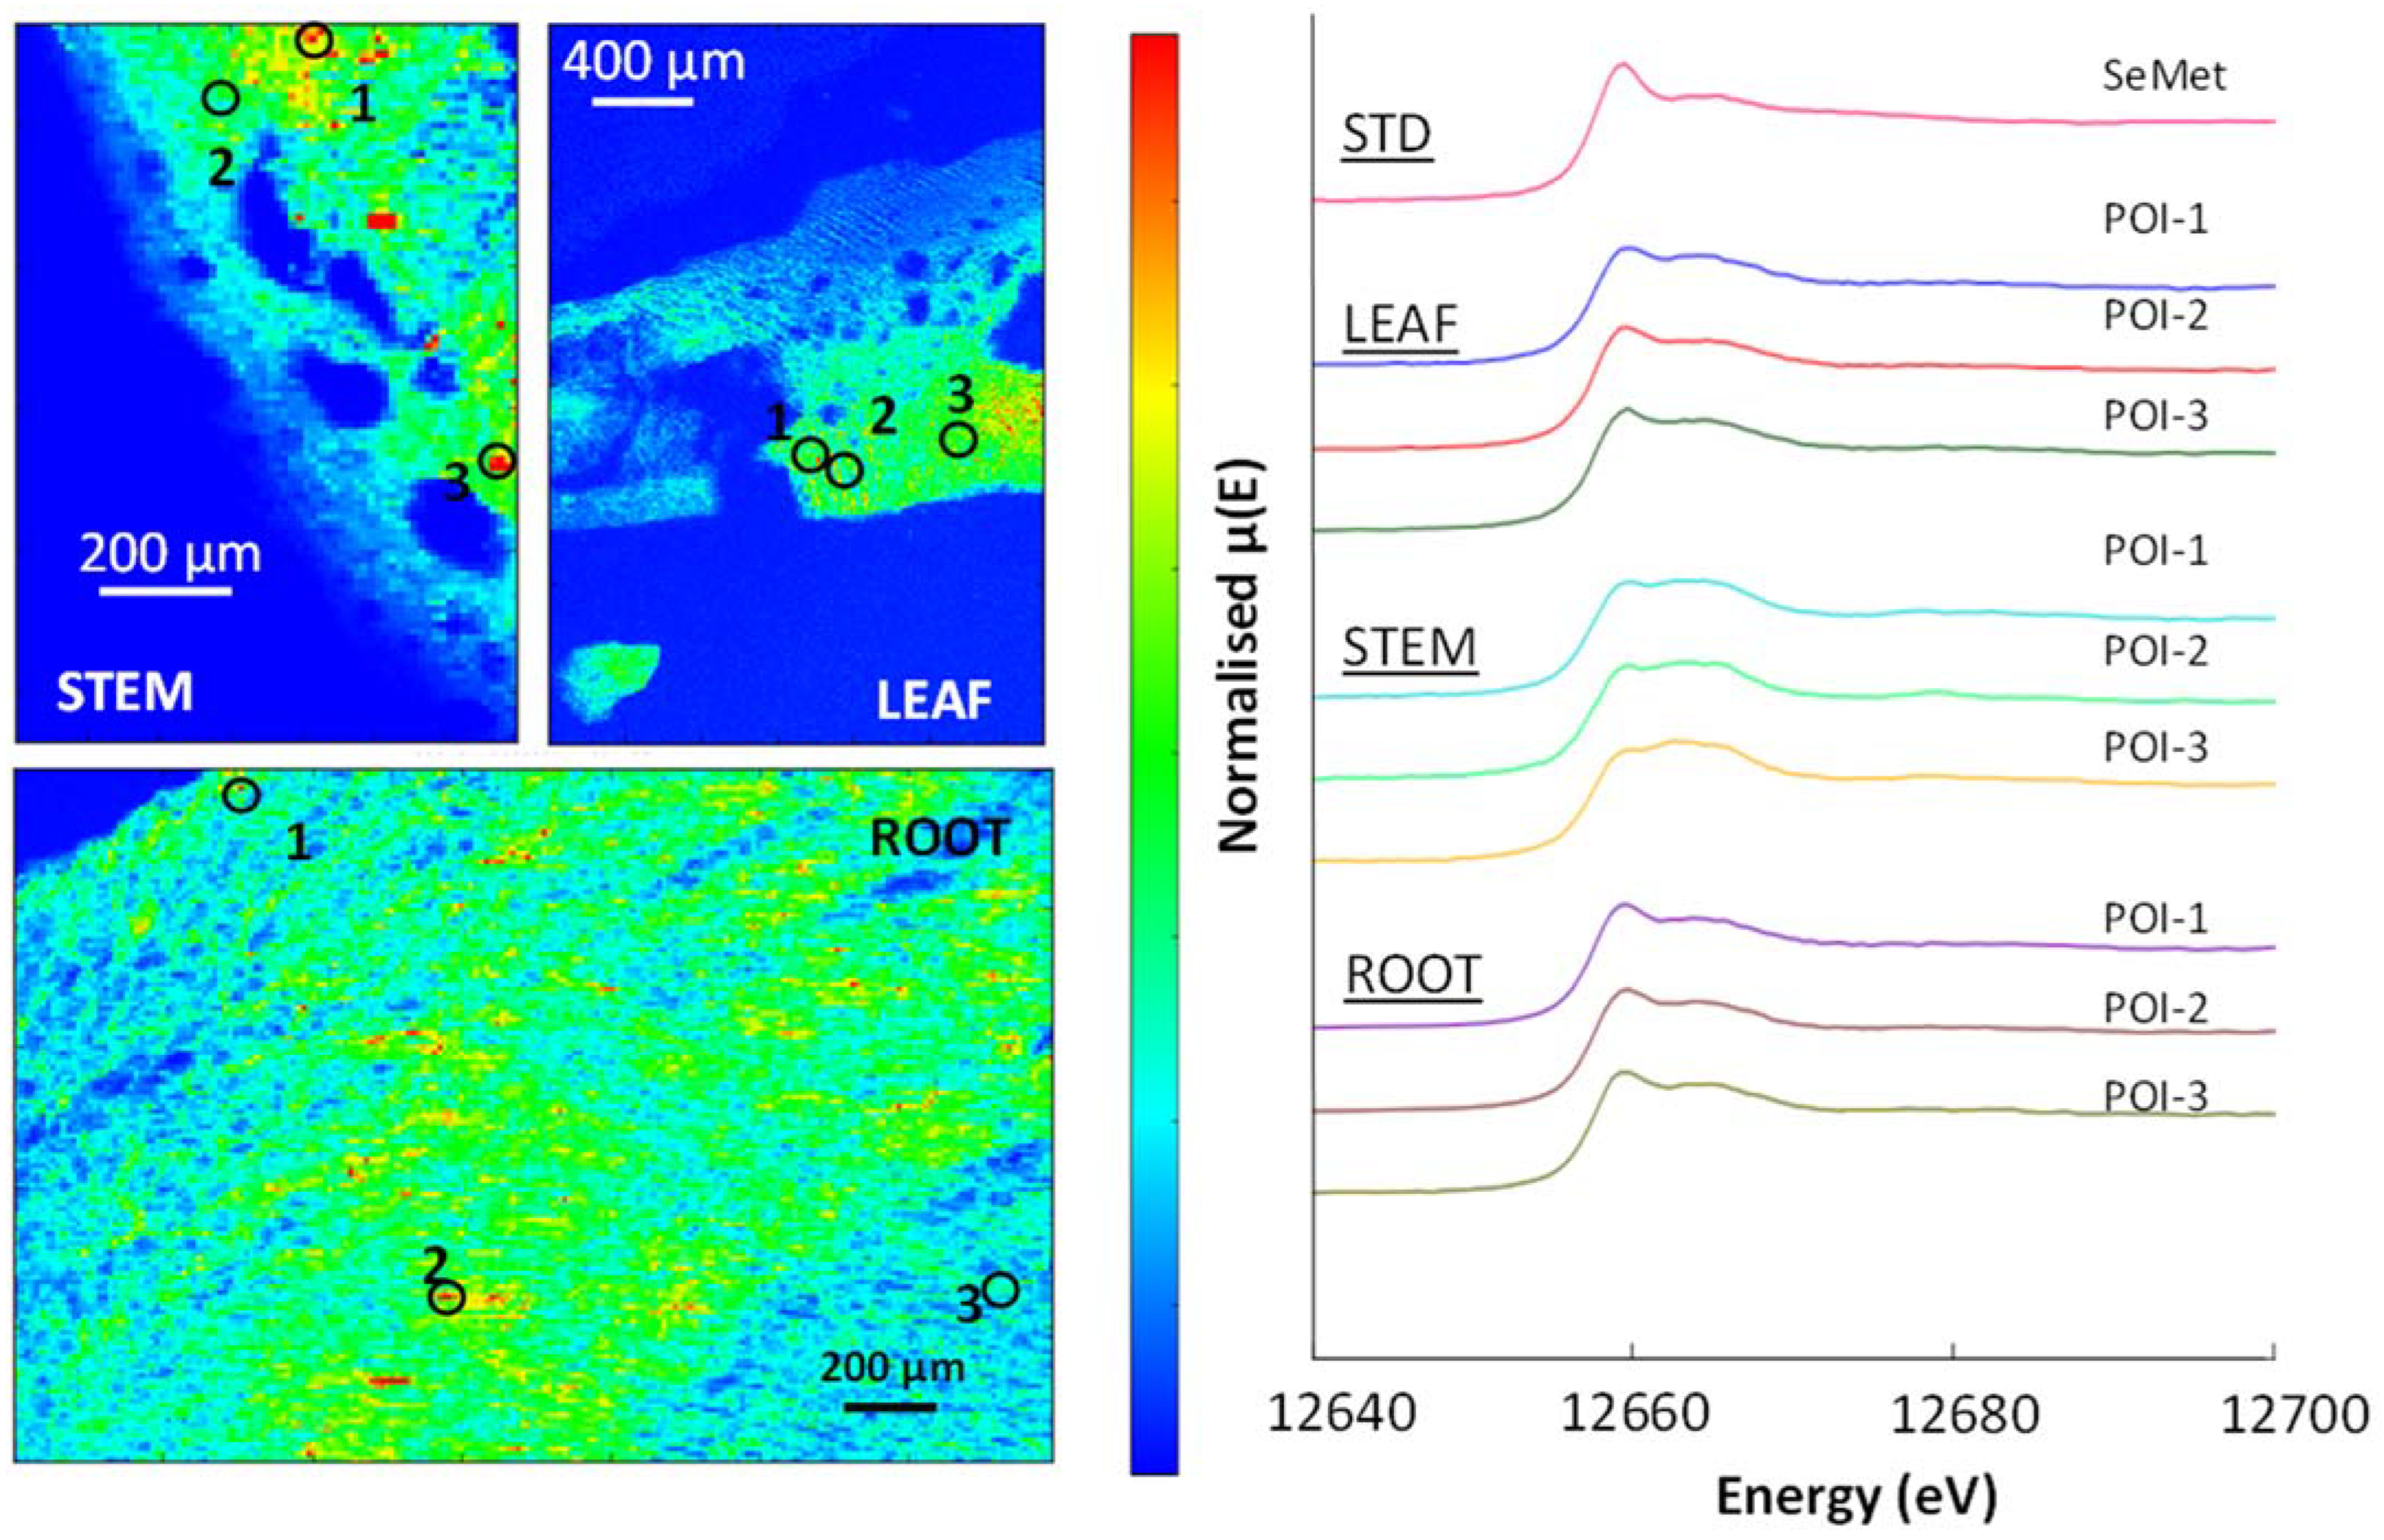
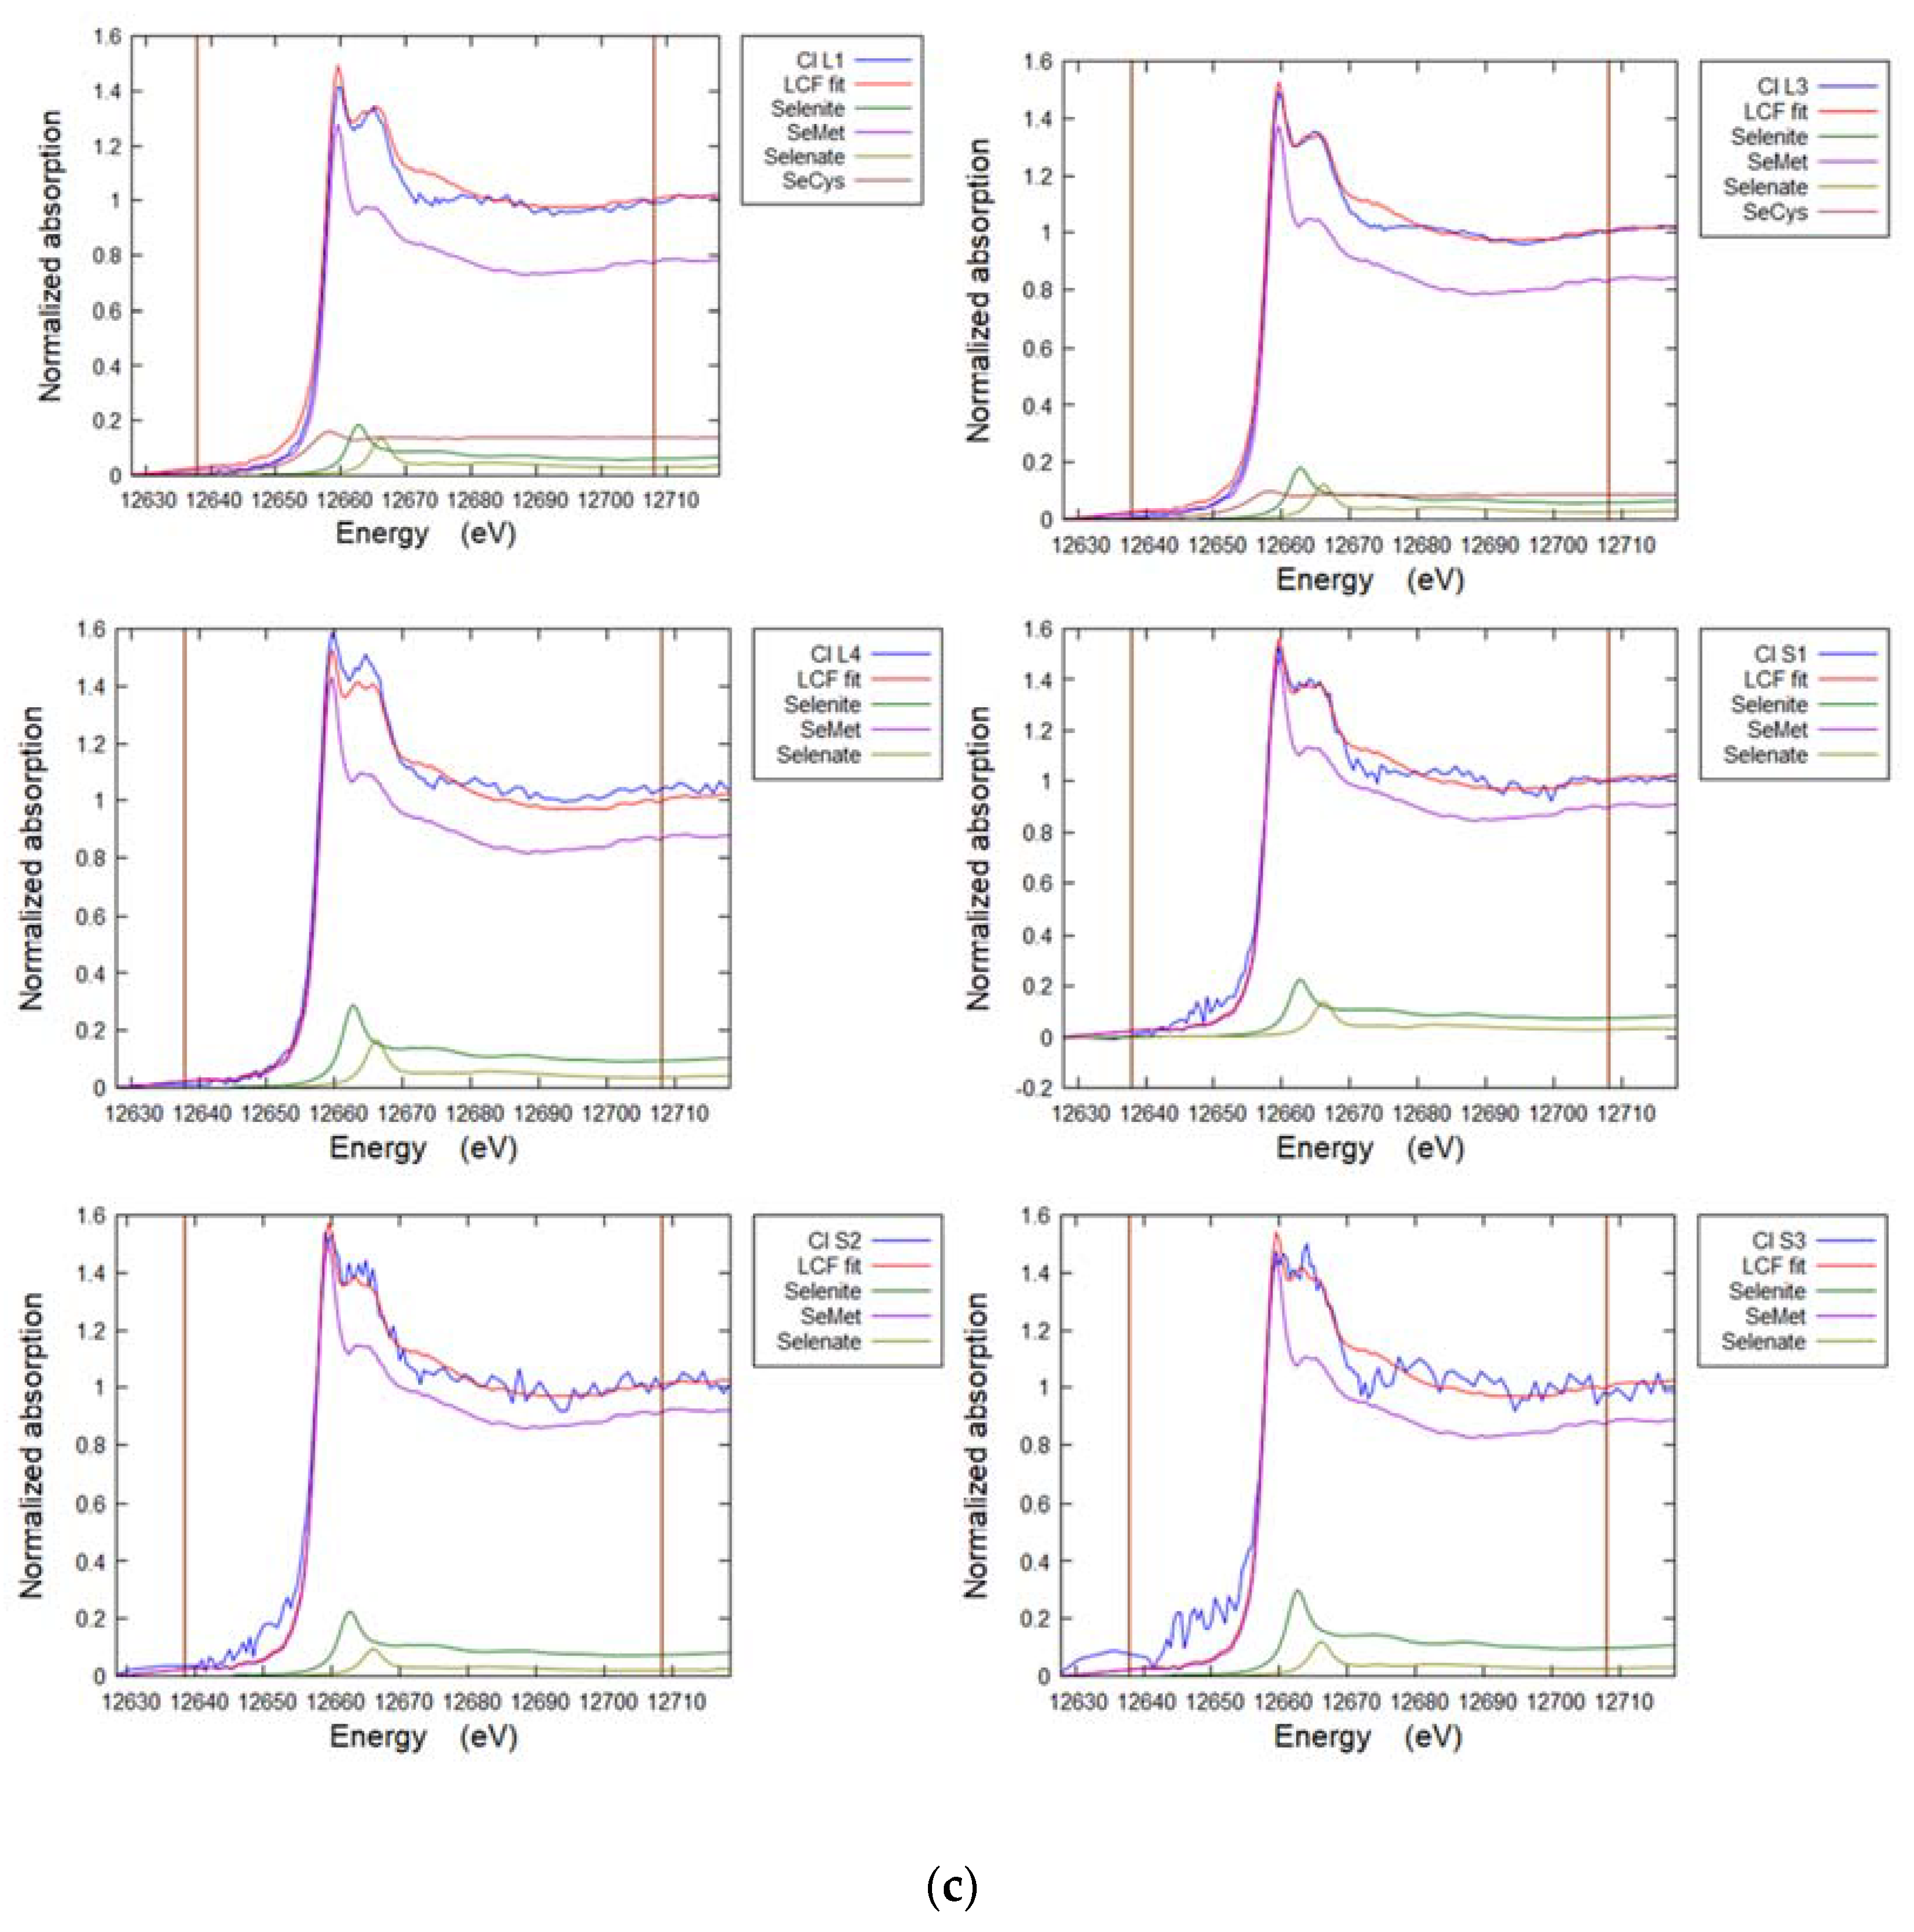
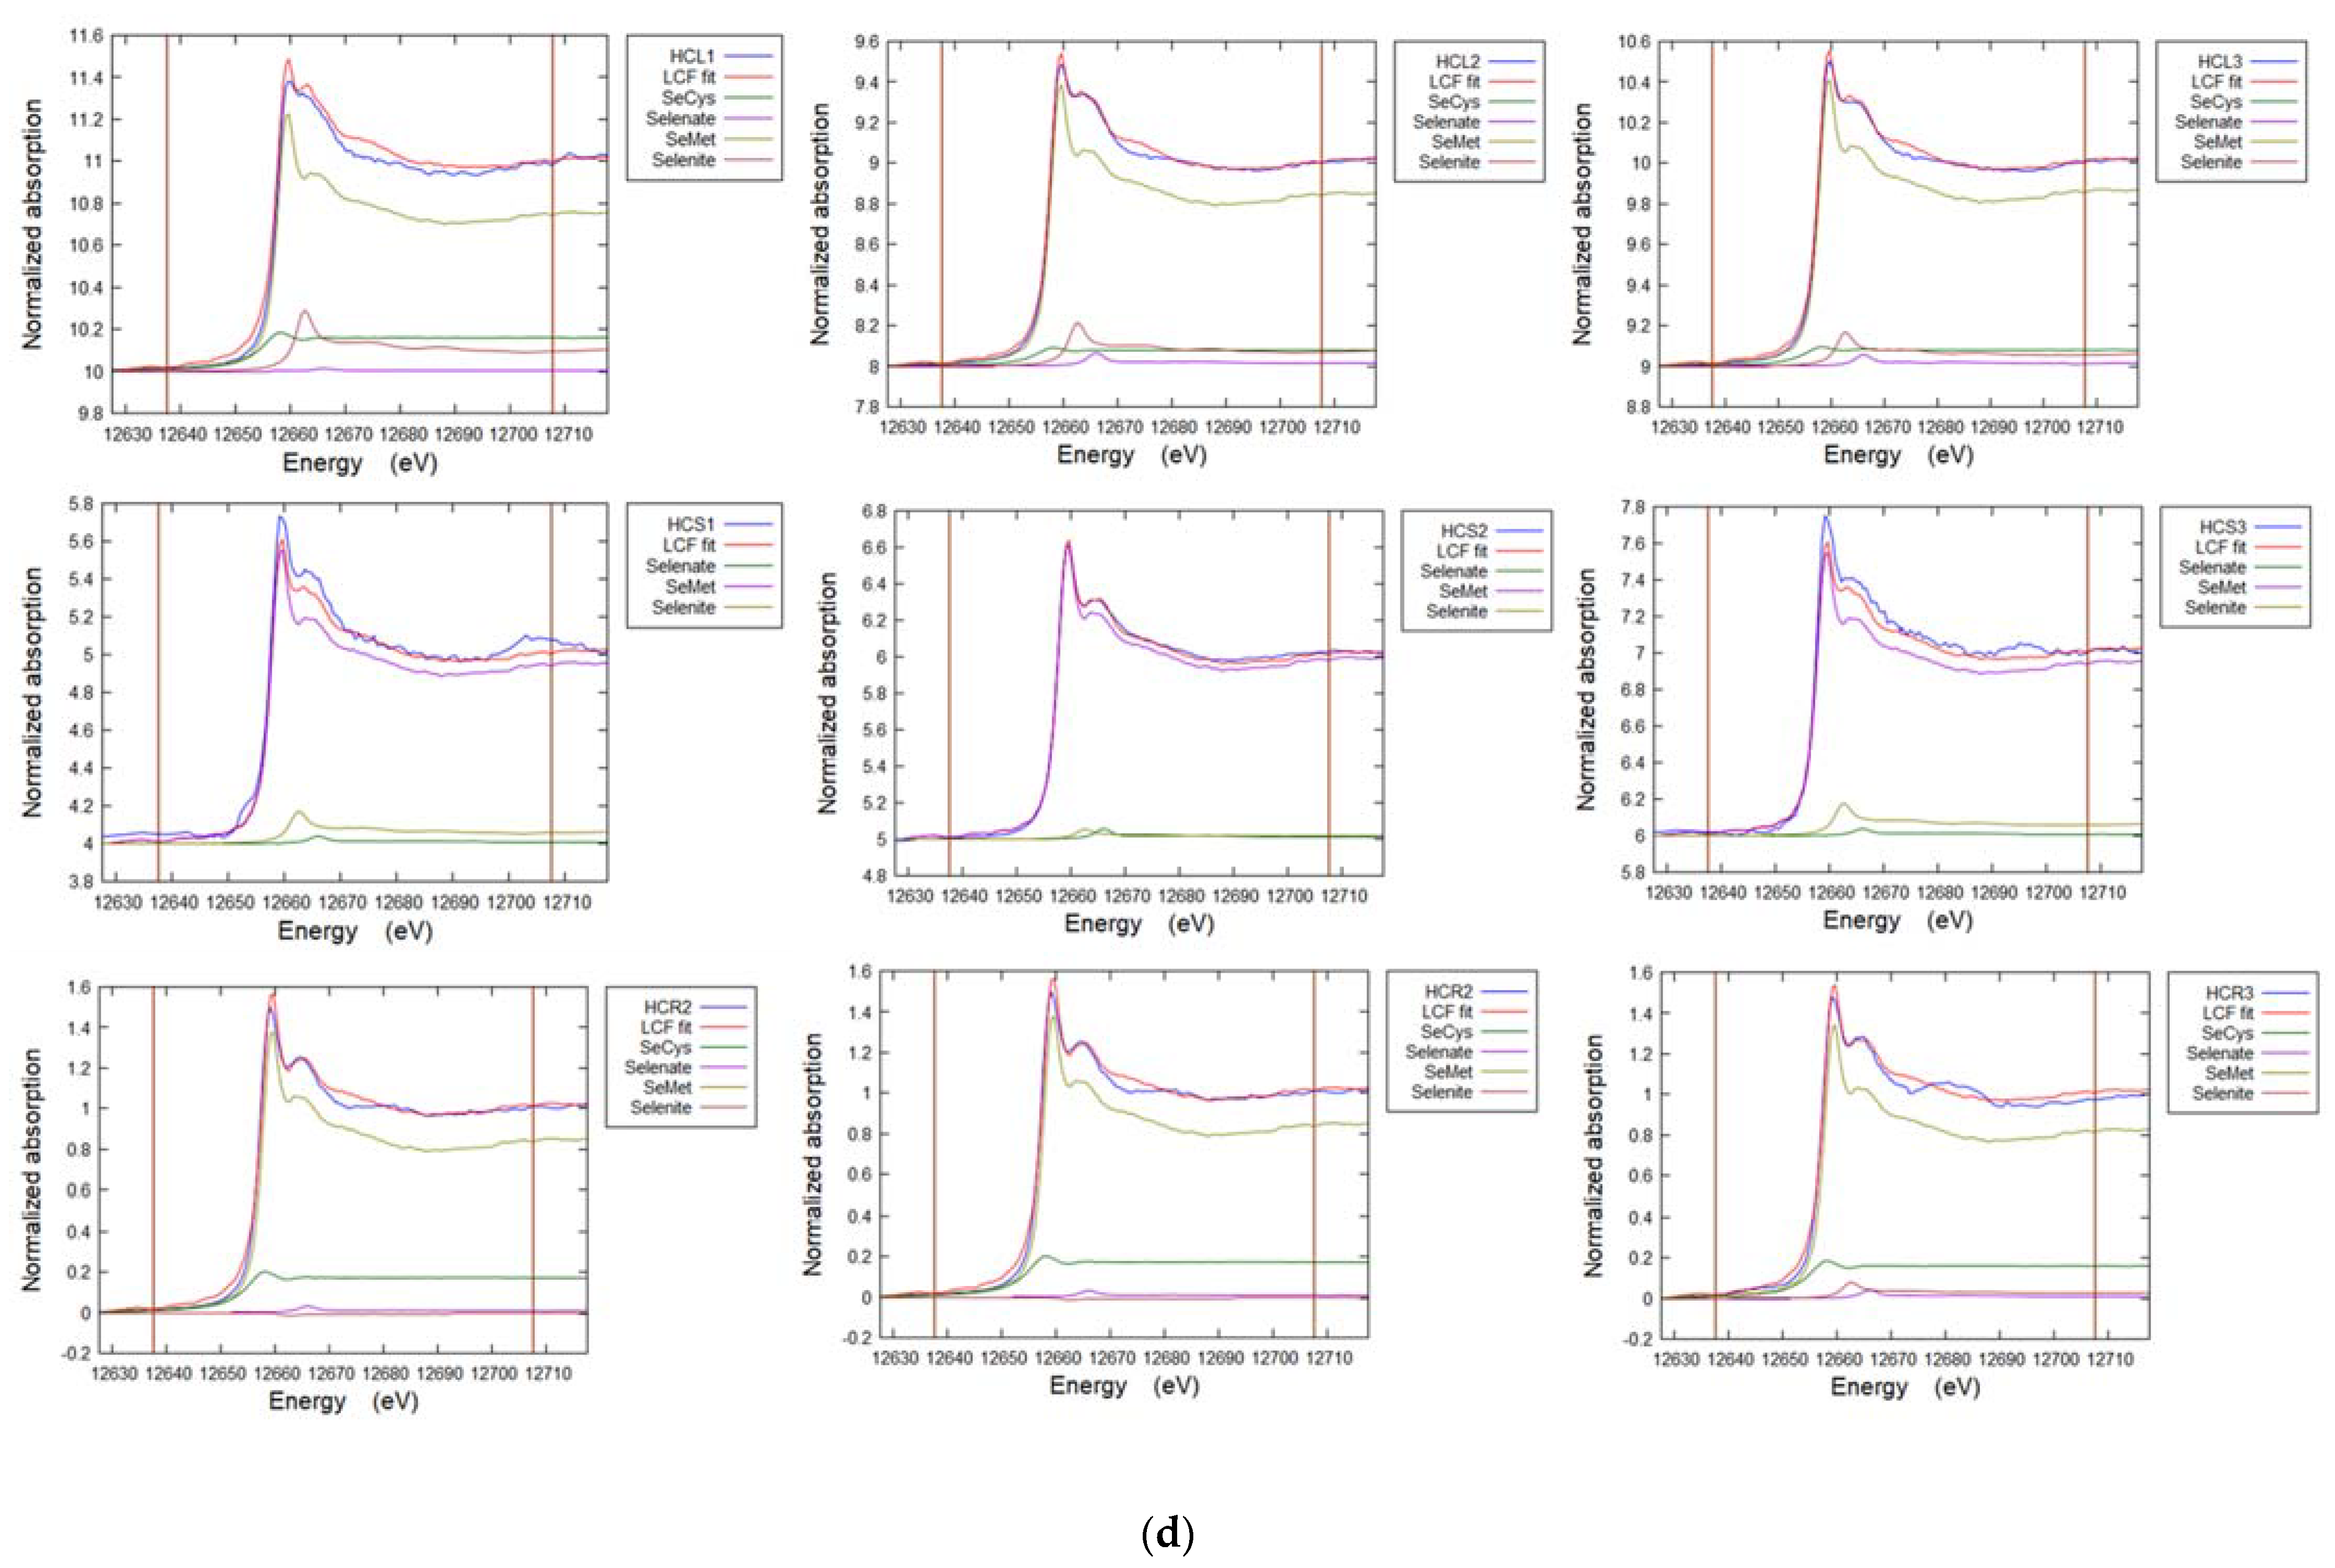
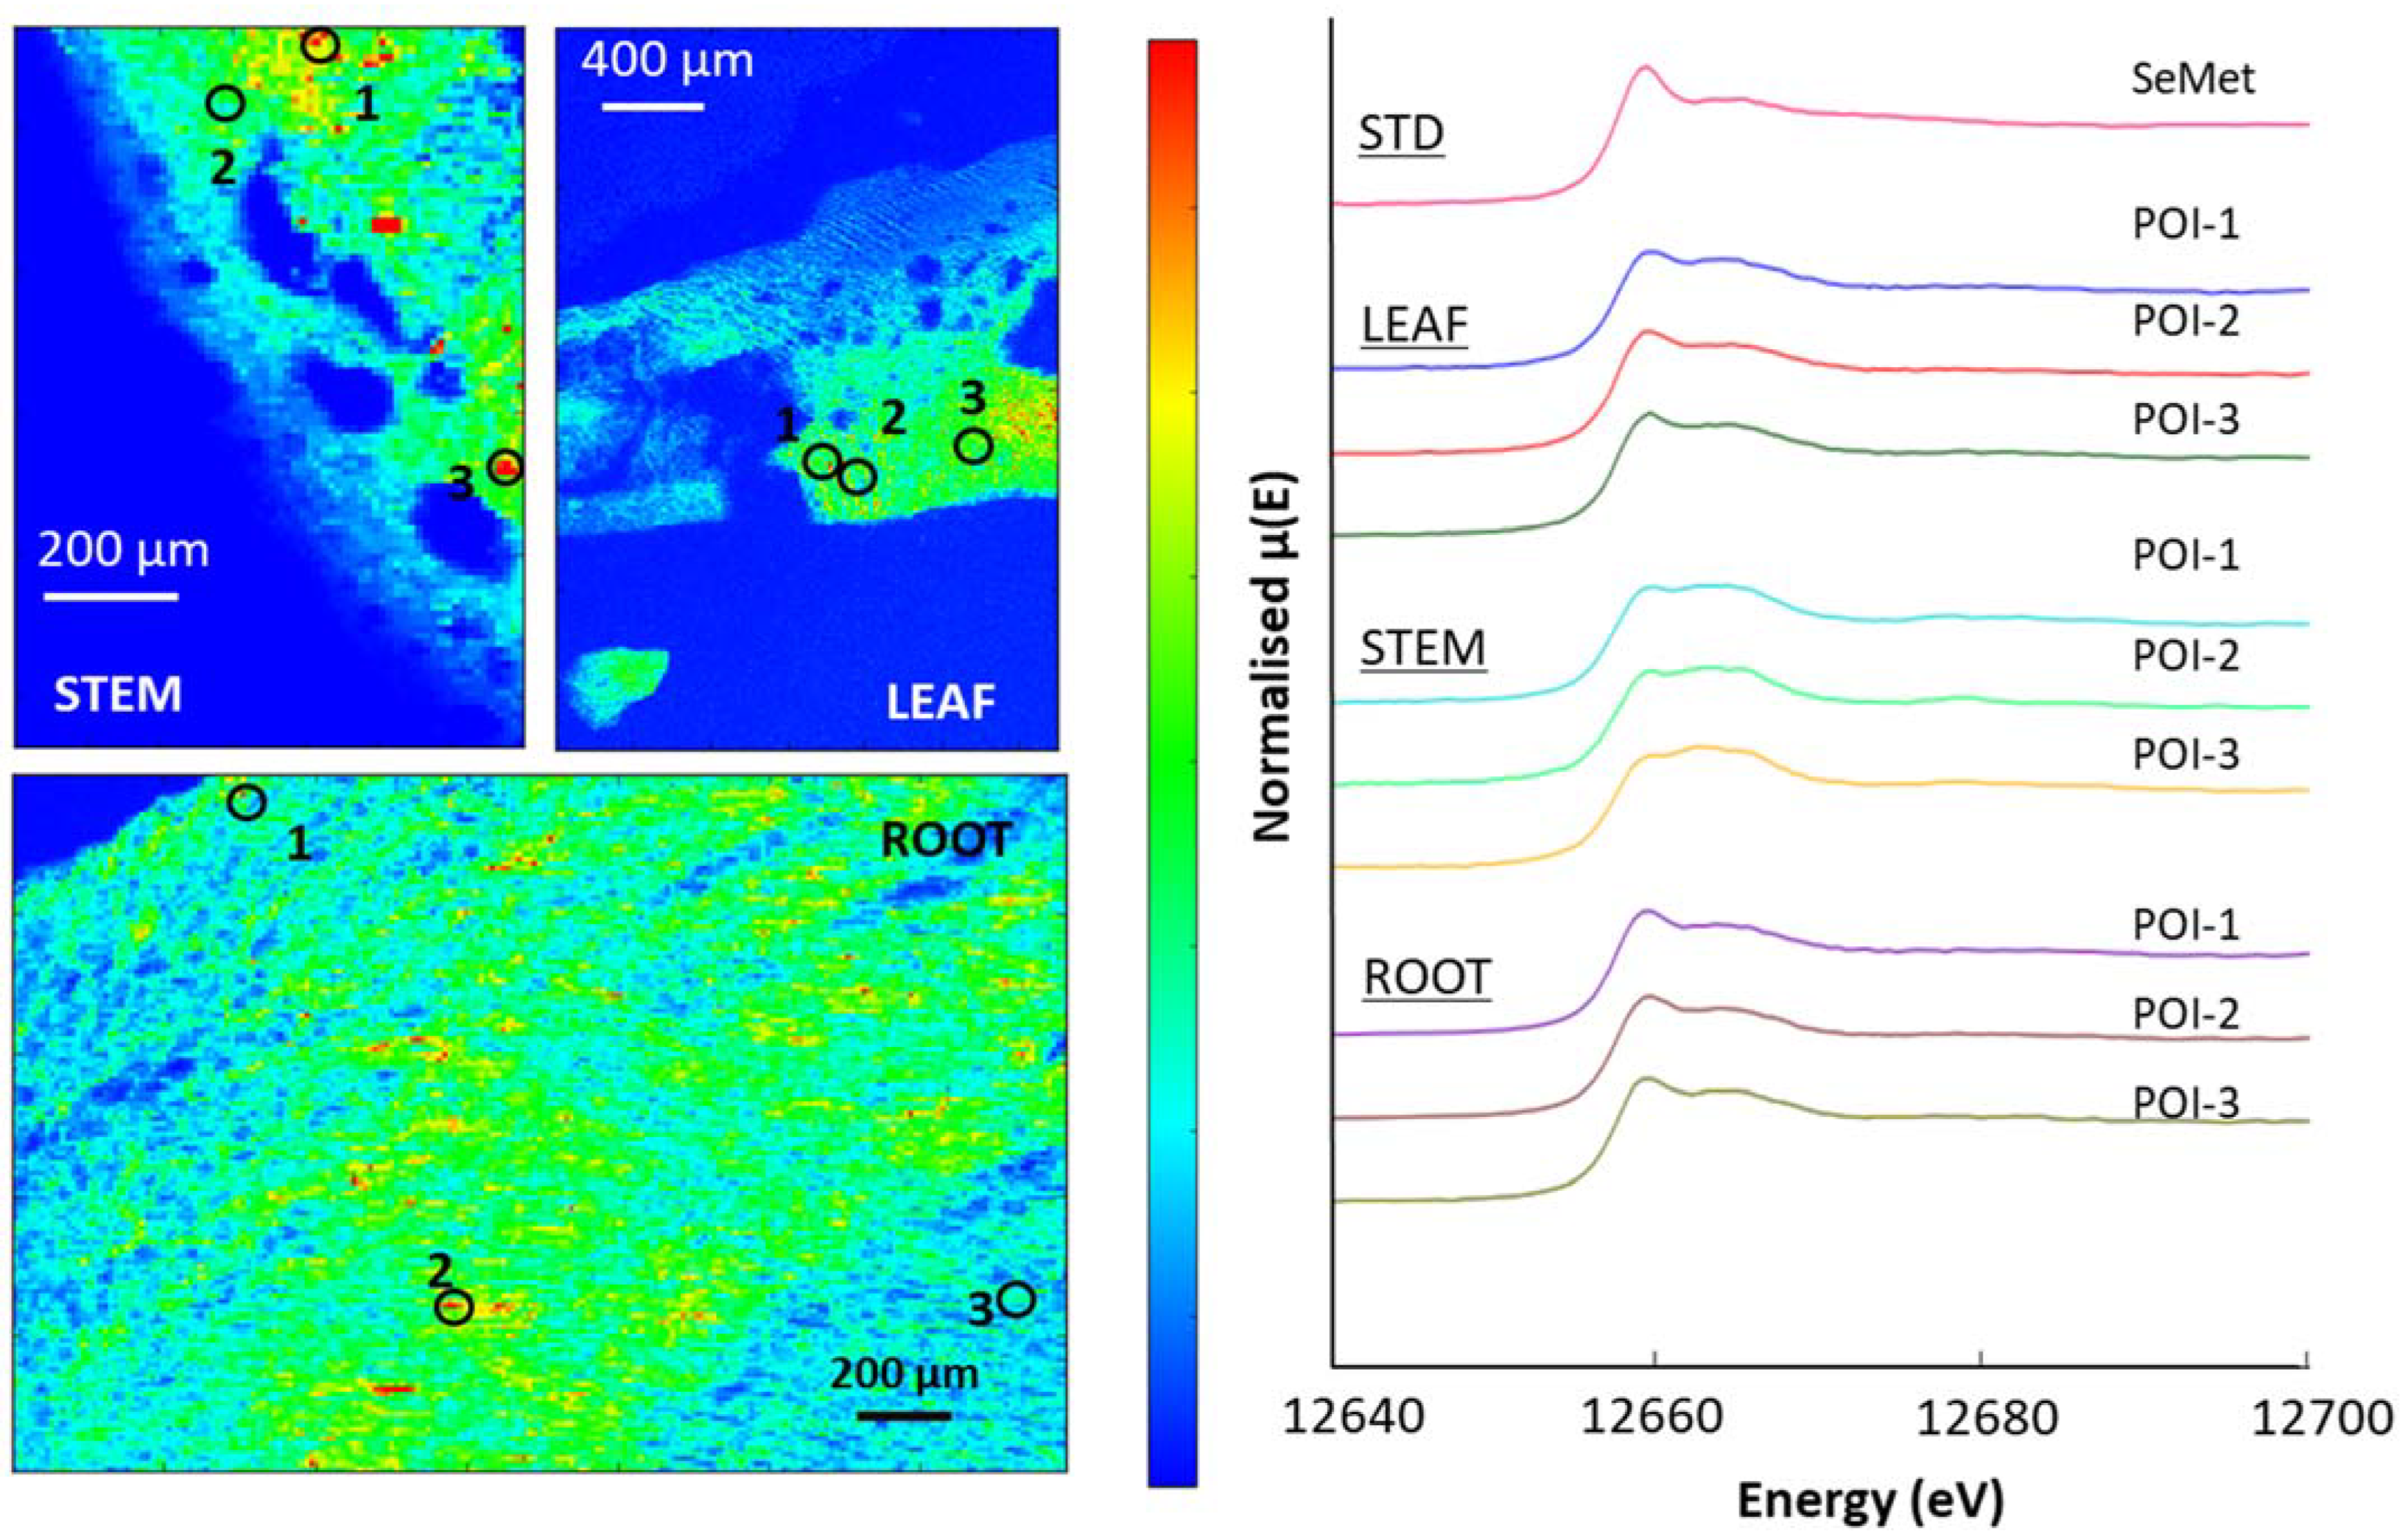
3.8. Selenium in Brassica oleracea
4. Discussion
4.1. Selenium and Molybdenum in the West Limerick Soils
4.2. Selenium in Pasture Plants
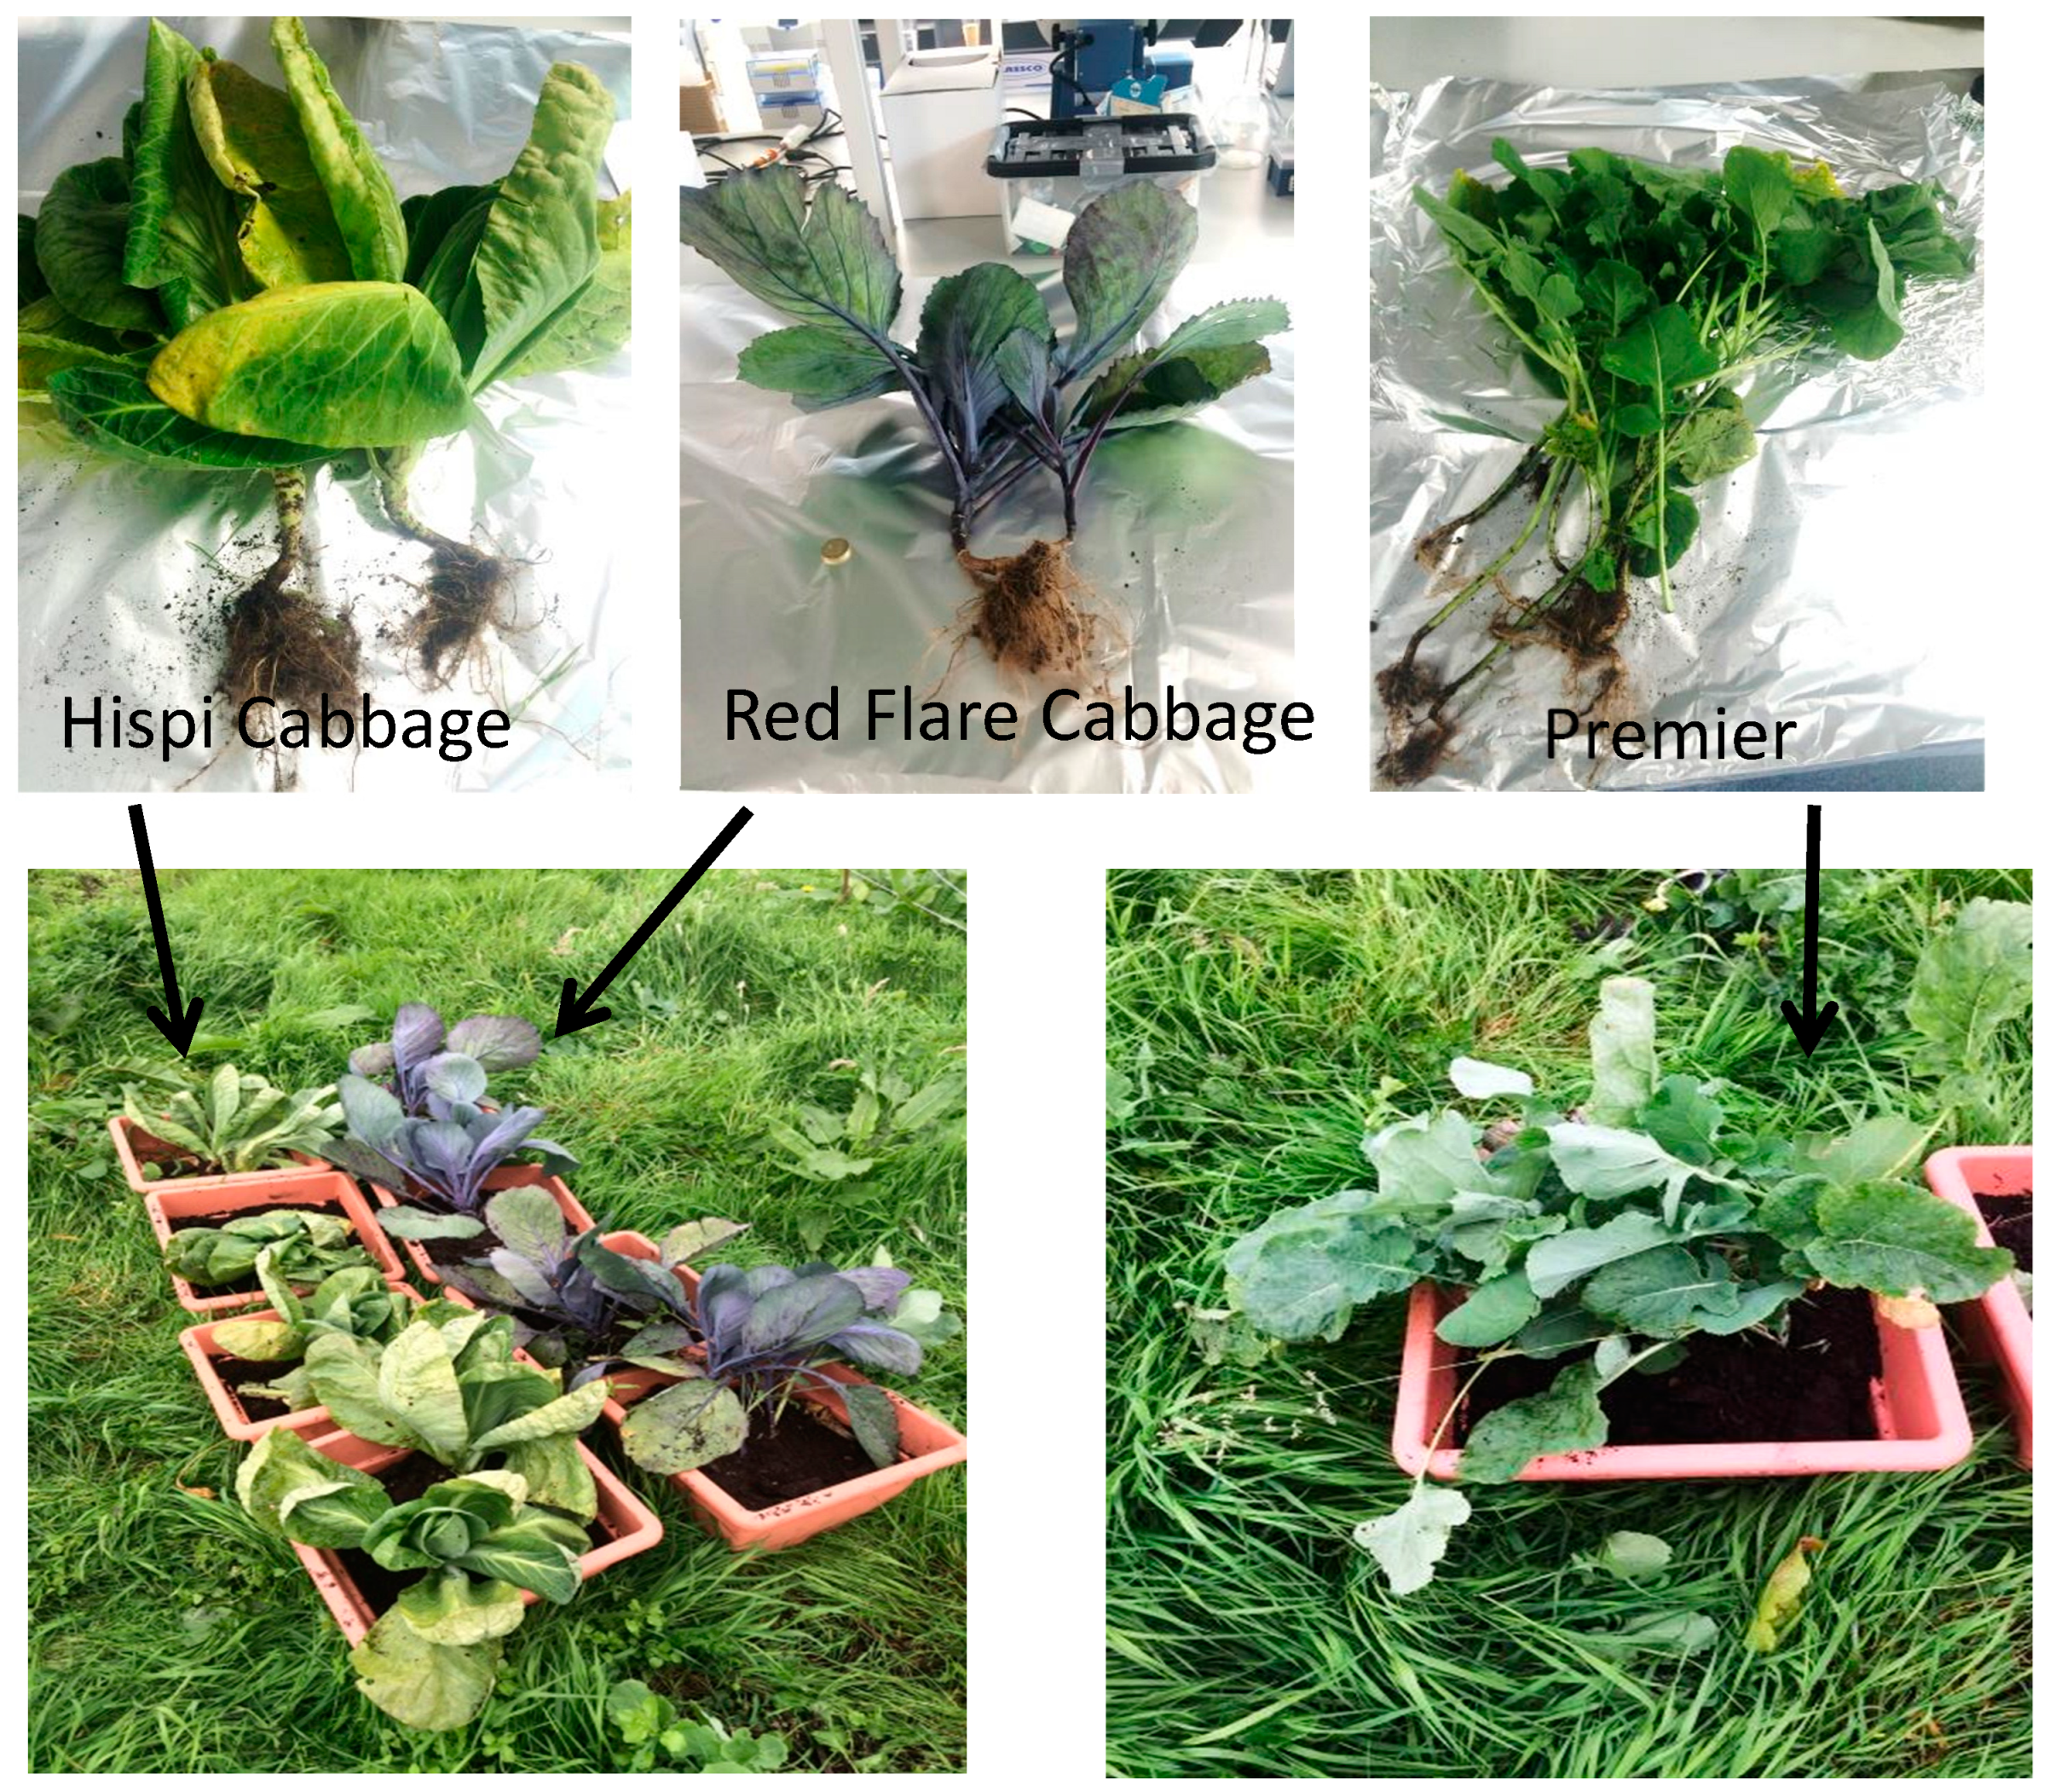
4.3. Selenium and Molybdenum Accumulator Brassica oleracea
5. Conclusions
6. Postscript
Author Contributions
Funding
Institutional Review Board Statement
Informed Consent Statement
Data Availability Statement
Acknowledgments
Conflicts of Interest
Appendix A


| Bulk | Se | Mo | As | U | V | Mn | Cu | CaO | Fe2O3 | SiO2 | Al2O3 | TOC |
|---|---|---|---|---|---|---|---|---|---|---|---|---|
| Sample | mg kg−1 | mg kg−1 | mg kg−1 | mg kg−1 | mg kg−1 | mg kg−1 | mg kg−1 | wt% | wt% | wt% | wt% | wt% |
| MO-1 | 227.2 | 59.3 | 39.4 | 26.0 | 104.6 | 45.4 | 871.8 | 5.4 | 6.1 | 31.5 | 4.9 | 41.7 |
| MO-2 | 763.5 | 431.1 | 89.6 | 407.0 | 77.8 | 236.3 | 111.8 | 4.9 | 12.4 | 21.2 | 3.4 | 48.4 |
| MO-3 | 404.3 | 71.5 | 57.5 | 33.5 | 93.1 | 488.2 | 165.8 | 5.7 | 8.1 | 35.9 | 5.1 | 36.3 |
| MO-4 | 145.9 | 37.6 | 18.6 | 17.0 | 105.7 | 563.5 | 90.0 | 6.5 | 4.8 | 43.7 | 6.4 | 30.3 |
| MO-5 | 840.2 | 193.7 | 72.5 | 295.2 | 94.4 | 152.6 | 144.5 | 5.1 | 9.5 | 10.4 | 1.8 | 61.9 |
| MO-6 | 115.7 | 20.8 | 8.6 | 53.3 | 146.0 | 208.5 | 149.0 | 2.2 | 4.6 | 50.5 | 6.9 | 28.8 |
| MO-7 | 14.7 | 3.2 | 0.0 | 51.8 | 152.8 | 54.4 | 397.9 | 1.4 | 2.3 | 58.2 | 8.3 | 23.5 |
| MO-8 | 1.0 | 6.1 | 0.0 | 17.4 | 195.2 | 210.0 | 924.6 | 1.3 | 3.1 | 62.7 | 9.8 | 17.8 |
| MO-9 | 482.1 | 80.0 | 23.4 | 155.0 | 170.7 | 518.1 | 191.5 | 7.7 | 7.2 | 35.4 | 5.7 | 37.2 |
| MO-10 | 1265.8 | 898.1 | 115.3 | 131.3 | 190.2 | 232.9 | 197.8 | 6.2 | 11.5 | 20.0 | 3.4 | 52.9 |
| PK-1 | 682.0 | 34.9 | 63.1 | 12.4 | 208.6 | 732.2 | 222.8 | 19.1 | 5.7 | 4.5 | 1.1 | 56.5 |
| PK-2 | 5.4 | 1.9 | 0.4 | 10.0 | 184.2 | 78.9 | 51.4 | 1.5 | 1.6 | 65.3 | 8.7 | 15.7 |
| PK-3 | 0.9 | 13.6 | 11.6 | 11.1 | 175.7 | 1101.2 | 28.2 | 0.2 | 3.4 | 72.9 | 9.2 | 8.5 |
| PK-4 | 2.7 | 17.7 | 11.6 | 10.7 | 212.2 | 920.2 | 32.0 | 0.2 | 3.3 | 69.5 | 8.9 | 10.9 |
| Bulk | Se | Mo | As | U | V | Mn | Cu | CaO | Fe2O3 | SiO2 | Al2O3 | TOC |
|---|---|---|---|---|---|---|---|---|---|---|---|---|
| Sample | mg kg−1 | mg kg−1 | mg kg−1 | mg kg−1 | mg kg−1 | mg kg−1 | mg kg−1 | wt% | wt% | wt% | wt% | wt% |
| FF-1 | 489.1 | 1627.5 | 99.8 | 599.5 | 163.6 | 113.7 | 762.8 | 4.4 | 5.1 | 46.2 | 7.3 | 28.2 |
| FF-2 | 276.3 | 90.7 | 40.6 | 253.6 | 82.7 | 430.0 | 236.0 | 7.3 | 4.5 | 26.7 | 5.0 | 48.6 |
| FF-3 | 13.4 | 2.8 | 9.9 | 24.0 | 184.9 | 95.6 | 78.0 | 1.3 | 2.6 | 65.2 | 10.7 | 14.8 |
| FF-4 | 56.4 | 9.6 | 47.1 | 37.2 | 115.3 | 262.9 | 46.1 | 2.5 | 4.0 | 46.5 | 7.7 | 32.5 |
| FF-5 | 178.2 | 24.0 | 17.9 | 53.0 | 156.2 | 595.4 | 56.2 | 4.5 | 4.8 | 29.1 | 4.8 | 47.9 |
| FF-6 | 362.2 | 81.6 | 21.9 | 61.8 | 95.4 | 121.0 | 79.8 | 5.5 | 3.5 | 28.4 | 4.6 | 47.8 |
| FF-7 | 31.5 | 30.1 | 20.2 | 24.6 | 109.1 | 466.3 | 74.2 | 1.0 | 4.6 | 67.2 | 10.7 | 10.3 |
| FF-8 | 1.8 | 10.2 | 13.3 | 9.8 | 54.4 | 367.4 | 28.9 | 0.3 | 4.2 | 72.3 | 12.2 | 5.8 |
| FF-9 | 4.4 | 21.4 | 16.4 | 12.5 | 74.3 | 420.5 | 41.3 | 0.3 | 4.1 | 69.8 | 10.8 | 9.1 |
| FF-10 | 19.1 | 32.1 | 21.0 | 12.8 | 52.4 | 518.7 | 54.3 | 1.9 | 4.8 | 62.1 | 9.4 | 14.6 |
| FF-11 | 8.4 | 8.6 | 9.4 | 19.8 | 48.4 | 113.5 | 45.7 | 2.0 | 3.6 | 64.9 | 9.0 | 13.0 |
| FF-12 | 473.5 | 53.3 | 25.8 | 43.9 | 65.3 | 98.7 | 137.5 | 12.8 | 3.7 | 40.9 | 7.0 | 28.1 |
| FF-13 | 0.0 | 10.5 | 5.3 | 10.2 | 79.7 | 2043.8 | 32.2 | 0.6 | 5.0 | 68.9 | 11.3 | 7.8 |
| FF-14 | 0.0 | 11.9 | 11.9 | 9.2 | 89.1 | 1914.9 | 38.2 | 0.9 | 5.4 | 66.4 | 11.6 | 8.9 |
| FF-15 | 0.0 | 10.0 | 14.0 | 12.9 | 84.8 | 1771.9 | 30.9 | 0.5 | 5.6 | 68.1 | 12.5 | 7.1 |
| FF-16 | 246.0 | 43.2 | 18.4 | 127.9 | 189.7 | 1151.0 | 85.5 | 2.8 | 6.2 | 47.9 | 6.8 | 29.6 |
| FF-17 | 0.0 | 9.4 | 10.3 | 9.1 | 109.7 | 1728.1 | 42.9 | 0.6 | 4.9 | 68.9 | 11.2 | 8.0 |
| FF-18 | 26.3 | 4.6 | 15.2 | 8.8 | 118.4 | 402.4 | 54.8 | 21.8 | 2.8 | 31.1 | 6.2 | 31.5 |
| FF-19 | 0.0 | 3.6 | 0.0 | 14.6 | 93.6 | 381.0 | 17.3 | 1.2 | 3.8 | 67.5 | 11.3 | 10.4 |
| FF-20 | 0.0 | 7.2 | 10.6 | 8.3 | 97.9 | 2051.5 | 40.4 | 0.7 | 5.2 | 67.8 | 12.7 | 7.1 |
| Bulk | Se | Mo | As | U | V | Mn | Cu | CaO | Fe2O3 | SiO2 | Al2O3 | TOC |
|---|---|---|---|---|---|---|---|---|---|---|---|---|
| Sample | mg kg−1 | mg kg−1 | mg kg−1 | mg kg−1 | mg kg−1 | mg kg−1 | mg kg−1 | wt% | wt% | wt% | wt% | wt% |
| TL-1 | 1.9 | 0.9 | 13.9 | 6.4 | 79.3 | 602.2 | 54.7 | 1.9 | 3.7 | 62.3 | 11.0 | 13.5 |
| TL-2 | 0.0 | 0.7 | 7.5 | 7.2 | 72.1 | 320.4 | 44.3 | 8.2 | 2.9 | 53.1 | 10.3 | 17.6 |
| TL-3 | 0.0 | 0.4 | 12.2 | 6.5 | 68.5 | 248.0 | 30.1 | 2.5 | 3.5 | 64.6 | 10.7 | 11.8 |
| TL-4 | 0.0 | 0.5 | 12.5 | 7.2 | 85.9 | 498.4 | 43.4 | 2.6 | 3.9 | 65.0 | 12.5 | 9.6 |
| TL-5 | 1.9 | 0.5 | 11.1 | 6.6 | 60.9 | 257.4 | 42.0 | 5.9 | 3.1 | 57.4 | 9.4 | 17.7 |
| TL-6 | 0.0 | 0.4 | 12.5 | 5.2 | 54.3 | 425.4 | 26.4 | 11.1 | 3.4 | 51.6 | 8.4 | 18.8 |
| TL-7 | 3.3 | 0.2 | 13.0 | 6.7 | 77.7 | 240.5 | 42.3 | 2.6 | 4.5 | 54.3 | 12.1 | 18.2 |
| TL-8 | 8.3 | 0.4 | 14.1 | 7.4 | 75.3 | 293.1 | 48.9 | 2.1 | 3.6 | 55.8 | 12.1 | 18.7 |
| TL-9 | 34.2 | 1.9 | 39.8 | 13.0 | 82.1 | 435.8 | 51.4 | 1.9 | 4.8 | 48.1 | 12.1 | 25.4 |
| TL-10 | 88.2 | 1.3 | 32.6 | 6.6 | 78.6 | 436.9 | 56.5 | 7.2 | 3.3 | 54.2 | 11.9 | 16.0 |
| TL-11 | 28.0 | 0.2 | 11.2 | 6.5 | 76.5 | 318.1 | 53.3 | 5.5 | 3.8 | 58.9 | 10.7 | 14.4 |
| TL-12 | 3.4 | 0.6 | 18.8 | 6.0 | 71.2 | 349.2 | 44.8 | 6.6 | 3.6 | 59.2 | 9.3 | 14.3 |
| TL-13 | 0.0 | 0.4 | 9.4 | 5.4 | 58.4 | 477.3 | 31.2 | 2.0 | 3.5 | 55.0 | 12.7 | 18.4 |
| TJ-1 | 0.0 | 1.0 | 15.7 | 6.8 | 65.6 | 1344.3 | 39.8 | 1.6 | 4.6 | 65.8 | 10.9 | 10.0 |
| TJ-2 | 24.9 | 3.7 | 12.1 | 17.0 | 39.7 | 602.7 | 26.7 | 8.9 | 4.7 | 10.2 | 2.2 | 61.9 |
| TJ-3 | 28.4 | 19.0 | 16.5 | 26.6 | 20.7 | 988.5 | 29.2 | 6.3 | 3.3 | 4.5 | 1.2 | 57.2 |
| TJ-4 | 24.1 | 5.8 | 17.1 | 12.6 | 80.9 | 816.4 | 39.1 | 6.9 | 2.9 | 11.5 | 2.5 | 48.5 |
| TJ-5 | 12.7 | 3.5 | 6.2 | 11.3 | 31.1 | 436.3 | 27.0 | 16.2 | 2.2 | 9.6 | 2.3 | 52.8 |
| Sample | Lat. | Long. | Sample | Lat. | Long. | Sample | Lat. | Long. |
|---|---|---|---|---|---|---|---|---|
| FF-1 | 52.52260 | −9.06199 | MO-1 | 52.52242 | −9.05856 | TL-1 | 52.51072 | −9.01216 |
| FF-2 | 52.52233 | −9.05963 | MO-2 | 52.52228 | −9.05845 | TL-2 | 52.51088 | −9.01167 |
| FF-3 | 52.52366 | −9.06071 | MO-3 | 52.52225 | −9.05867 | TL-3 | 52.51099 | −9.01104 |
| FF-4 | 52.52317 | −9.05835 | MO-4 | 52.52242 | −9.05890 | TL-4 | 52.51116 | −9.01020 |
| FF-5 | 52.52293 | −9.05842 | MO-5 | 52.52255 | −9.05912 | TL-5 | 52.51111 | −9.00909 |
| FF-6 | 52.52271 | −9.06215 | MO-6 | 52.52167 | −9.05648 | TL-6 | 52.51060 | −9.00967 |
| FF-7 | 52.52247 | −9.06204 | MO-7 | 52.52143 | −9.05757 | TL-7 | 52.51028 | −9.01048 |
| FF-8 | 52.52238 | −9.06208 | MO-8 | 52.52153 | −9.05835 | TL-8 | 52.50988 | −9.01199 |
| FF-9 | 52.52229 | −9.06212 | MO-9 | 52.52212 | −9.05778 | TL-9 | 52.51023 | −9.01207 |
| FF-10 | 52.52230 | −9.06152 | MO-10 | 52.52236 | −9.05875 | TL-10 | 52.51067 | −9.01199 |
| FF-11 | 52.52245 | −9.06139 | TL-11 | 52.51090 | −9.01083 | |||
| FF-12 | 52.52265 | −9.06124 | PK-1 | 52.51888 | −9.06054 | TL-12 | 52.51090 | −9.00883 |
| FF-13 | 52.52334 | −9.05645 | PK-2 | 52.51911 | −9.06244 | TL-13 | 52.51090 | −9.00883 |
| FF-14 | 52.52364 | −9.05577 | PK-3 | 52.51934 | −9.06318 | |||
| FF-15 | 52.52334 | −9.05725 | PK-4 | 52.51940 | −9.06367 | TJ-1 | 52.51633 | −9.00081 |
| FF-16 | 52.52244 | −9.05725 | TJ-2 | 52.51663 | −8.99919 | |||
| FF-17 | 52.52254 | −9.05615 | TL-C1 | 52.51047 | −9.01149 | TJ-3 | 52.51786 | −9.00004 |
| FF-18 | 52.52357 | -9.05893 | FF-C2 | 52.52311 | −9.06078 | TJ-4 | 52.51702 | −9.00111 |
| FF-19 | 52.52387 | −9.05840 | TJ-5 | 52.51663 | −8.99919 | |||
| FF-20 | 52.52397 | −9.05722 |


References
- Fordyce, F. Selenium Geochemistry and Health. Ambio A J. Hum. Environ. 2007, 36, 94–97. [Google Scholar] [CrossRef] [Green Version]
- Neal, R.H. Selenium. In Heavy Metals in Soils; Alloway, B.J., Ed.; Blackie Academic and Professional: London, UK, 1995; pp. 260–283. [Google Scholar]
- Zayed, A.; Lytle, C.M.; Terry, N. Accumulation and volatilization of different chemical species of selenium. Planta 1998, 206, 284–292. [Google Scholar] [CrossRef]
- Fordyce, F.M. Selenium Deficiency and Toxicity in the Environment. In Essentials of Medical Geology; Olle, S., Ed.; Springer: Dordrecht, The Netherlands, 2013; pp. 375–416. [Google Scholar]
- Guignardi, Z.; Schiavon, M. Biochemistry of Plant Selenium Uptake and Metabolism. In Selenium in Plants; Pilon-Smits, E.A.H., Winkel, L.H.E., Lin, Z.-Q., Eds.; Springer: New York, NY, USA, 2017; Chapter 2; pp. 21–34. [Google Scholar]
- Pilon-Smits, E.A.H.; Winkel, L.H.E.; Lin, Z.-Q. (Eds.) Selenium in Plants: Molecular, Physiological, Ecological and Evolutionary Aspects; Plant Ecophysiology; Springer International Publishing: New York, NY, USA, 2017; Volume 11, 340p. [Google Scholar]
- Terry, N.; Zayed, A.M.; de Souza, M.P.A.; Tarun, A.S. Selenium in Higher Plants. Annu. Rev. Plant Physiol. Plant Mol. Biol. 2000, 51, 402–432. [Google Scholar] [CrossRef] [Green Version]
- Rogers, P.A.M.; Arora, S.P.; Fleming, G.A.; Crinion, R.A.; Mclaughlin, J.G. Selenium toxicity in farm animals: Treatment and prevention. Ir. Vet. J. 2000, 43, 151–153. [Google Scholar]
- Yang, G.Q.; Wang, S.Z.; Zhou, R.H.; Sun, S.Z. Endemic selenium intoxication of humans in China. Am. J. Clin. Nutr. 1983, 37, 872–881. [Google Scholar] [CrossRef]
- Ohlendorf, H.M. Kesterson Reservoir: 30 Years of Selenium Risk Assessment and Management. Environ. Manag. 2000, 16, 257–268. [Google Scholar] [CrossRef]
- Dhillon, K.S.; Dhillon, S.K. Selenium toxicity in soils, plants and animals in some parts of Punjab, India. Int. J. Environ. Stud. 1991, 37, 15–24. [Google Scholar] [CrossRef]
- Dhillon, K.S.; Dhillon, S.K. Distribution and management of seleniferous soils. Adv. Agron. 2003, 79, 119–184. [Google Scholar]
- Mills, T.J.; Mast, M.A.; Thomas, J.; Keith, G. Controls on selenium distribution and mobilization in an irrigated shallow groundwater system underlain by Mancos Shale, Uncompahgre River Basin, Colorado, USA. Sci. Total Environ. 2016, 566–567, 1621–1631. [Google Scholar] [CrossRef]
- Teagasc. Crops, Soil and Fertility, Selenium. Available online: https://www.teagasc.ie/crops/soil--soil-fertility/trace-elements/grassland/selenium/ (accessed on 23 September 2022).
- Fleming, G.A. Selenium in Irish Soils and Plants. Soil Sci. 1961, 94, 28–35. [Google Scholar] [CrossRef]
- Fleming, G.A.; Walsh, T. Selenium Occurrence in Certain Irish Soils and Its Toxicity Effects on Animals. Proc. R. Ir. Acad. 1958, 58, 151–166. [Google Scholar]
- McGrath, D.; Fleming, G.A. Trace Elements and Heavy Metal in Irish Soils; Teagasc: Wexford, Ireland, 2007; p. 266. [Google Scholar]
- McLoughlin, S.L. Understanding Selenium Toxicity in the Natural Environment. Ph.D. Thesis, University of Manchester, Manchester, UK, 2018; 200p. [Google Scholar]
- Williams, C.; Brown, G. Uranium content of peaty soils rich in molybdenum and selenium from Co. Limerick, Eire. Geoderma 2017, 6, 223–225. [Google Scholar] [CrossRef]
- Winkel, L.H.; Vriens, B.; Jones, G.D.; Schneider, L.S.; Pilon-Smits, E.; Banuelos, G.S. Selenium cycling across soil-plant-atmosphere interfaces: A critical review. Nutrients 2015, 7, 4199–4239. [Google Scholar] [CrossRef] [Green Version]
- Winkel, L.H.E.; Johnson, C.H.; Lenz, M.; Grundl, T.; Leupin, O.X.; Amini, M.; Charlet, L. Environmental Selenium Research: From Microscopic Processes to Global Understanding. Environ. Sci. Technol. 2012, 46, 571–579. [Google Scholar] [CrossRef] [PubMed]
- Wang, Z.; Huang, W.; Pang, F. Selenium in Soil–Plant Microbe: A Review. Bull. Environ. Contam. Toxicol. 2022, 108, 167–181. [Google Scholar] [CrossRef]
- Zhao, C.; Ren, J.; Chengze, X.; Lin, E. Study on the Relationship between Soil Selenium and Plant Selenium Uptake. Plant Soil 2005, 277, 197–208. [Google Scholar] [CrossRef]
- Salt, D.E.; Blaylock, M.; Kumar, N.P.B.A.; Dushenkov, D.; Ensley, B.D.E.; Chet, I.; Raskin, I. Phytoremediation: A Novel Strategy for the Removal of Toxic Metals from the Environment Using Plants. Nat. Biotechnol. 1995, 13, 468. [Google Scholar] [CrossRef]
- Monei, N.L.; Veetil, S.K.P.; Gao, J.; Hatch, M. Selective removal of selenium by phytoremediation from post/mining coal wastes: Practicality and implications. Int. J. Min. Reclam. Environ. 2021, 35, 69–77. [Google Scholar] [CrossRef]
- Sun, W.G.; Selim, H.M. Fate and transport of molybdenum in soils: Kinetic modelling. Adv. Agron. 2020, 164, 51–92. [Google Scholar]
- Brogan, J.C.; Fleming, G.A.; Byrne, J.E. Molybdenum and Copper in Irish Pasture Soils. Ir. J. Agric. Res. 1973, 12, 71–81. [Google Scholar]
- McGrath, S.P.; Micó, C.; Zhao, F.J.; Stroud, J.L.; Zhang, H.; Fozard, S. Predicting molybdenum toxicity to higher plants: Estimation of toxicity threshold values. Environ. Pollut. 2010, 158, 3085–3094. [Google Scholar] [CrossRef]
- Axelson, U.; Söderström, M.; Jonsson, A. Risk assessment of high concentrations of molybdenum in forage. Environ. Geochem. Health 2018, 40, 2685–2694. [Google Scholar] [CrossRef] [PubMed] [Green Version]
- Teagasc Molybdenum. 2017. Available online: https://www.teagasc.ie/crops/soil--soil-fertility/trace-elements/grassland/molybdenum/ (accessed on 31 March 2020).
- Blakley, B.R.; Molybdenum Toxicology in Animals. MDS Manual Veterinary Manual 2022. Available online: https://www.msdvetmanual.com/toxicology/molybdenum-toxicity/molybdenum-toxicity-in-animals (accessed on 15 January 2023).
- Osman, K.T.; Abul Kashem, M. Phytoremediation. In Encyclopaedia of Soil Science, 3rd ed.; Taylor and Francis: Boca Raton, FI, USA, 2017; Volume 1–3, pp. 1717–1724. [Google Scholar]
- Tow, S.W.T.; Eng, Z.X.; Wong, S.P.; Ge, L.; Tan, S.W.; Yong, J.W.H. Axonopus compressus (Sw.) Beauv.: A potential biomonitor for molybdenum in soil pollution. Int. J. Phytoremediation 2018, 20, 1363–1368. [Google Scholar] [CrossRef] [PubMed]
- Sheppard, S.C.; Stephenson, G.L. Ecotoxicity of Aged Uranium in Soil Using Plant, Earthworm and Microarthropod Toxicity Tests. Bull. Environ. Contam. Toxicol. 2012, 88, 43–47. [Google Scholar] [CrossRef]
- Cui, Q.; Zhang, Z.; Beiyuan, J.; Cui, Y.; Chen, L.; Chen, H.; Fang, L. A critical review of uranium in the soil-plant system: Distribution, bioavailability, toxicity, and bioremediation strategies. Crit. Rev. Environ. Sci. Technol. 2023, 53, 340–365. [Google Scholar] [CrossRef]
- Lai, J.; Liu, Z.; Li, C.; Luo, X. Analysis of accumulation and phytotoxicity mechanism of uranium and cadmium in two sweet potato cultivars. J. Hazard. Mater. 2003, 409, 124997. [Google Scholar] [CrossRef]
- Khan, I.; Afzal Awan, S.; Rizwan, M.; Ali, S.; Zhang, X.; Huang, L. Arsenic behavior in soil-plant system and its detoxification mechanisms in plants: A review. Environ. Pollut. 2021, 286, 117389. [Google Scholar] [CrossRef]
- Atkinson, W.J. Regional Geochemical Studies in County Limerick, Ireland, with Particular Reference to Selenium and Molybdenum. Ph.D. Thesis, University of London, London, UK, 1967; p. 327. [Google Scholar]
- National Research Council. Mineral Tolerance of Animals, 2nd ed.; The National Academies Press: Washington, DC, USA, 2005. [Google Scholar] [CrossRef]
- Slekovec, M.; Goessier, W. Accumulation of selenium in natural plants and selenium supplemented vegetable and selenium speciation by HPLC-ICPMS. Chem. Speciat. Bioavailab. 2005, 17, 63–73. [Google Scholar] [CrossRef]
- Nelson, D.W.; Sommers, L.E. Total Carbon, Organic Carbon, and Organic Matter. In Methods for the Determination of Total Organic Carbon (TOC) in Soils and Sediments; Environmental Protection Agency: Washington, DC, USA, 1996; pp. 7–12. [Google Scholar]
- Nirola, R.; Megharaj, M.; Aryal, R.; Naidu, R. Screening of metal uptake by plant colonizers growing on abandoned copper mine in Kapunda, South Australia. Int. J. Phytoremediat. 2016, 18, 399–405. [Google Scholar] [CrossRef]
- Yoon, J.; Cao, X.; Zhou, Q.; Ma, L.Q. Accumulation of Pb, Cu, and Zn in native plants growing on a contaminated Florida site. Sci. Total Environ. 2006, 368, 456–464. [Google Scholar] [CrossRef]
- Vavpetič, P.; Vogel-Mikuš, K.; Jeromel, L.; Ogrinc Potočnik, N.; Pongrac, P.; Drobne, D.; Pipan Tkalec, Z. Elemental distribution and sample integrity comparison of freeze-dried and frozen-hydrated biological tissue samples with nuclear microprobe. Nucl. Instrum. Methods Phys. Res. Sect. B Beam Interact. Mater. At. 2015, 348, 147–151. [Google Scholar] [CrossRef]
- Mosselmans, J.F.W.; Quinn, P.D.; Dent, A.J.; Cavill, S.A.; Moreno, S.D.; Peach, A.; Leicester, P.J.; Keylock, S.J.; Gregory, S.R.; Atkinson, K.D.; et al. IUCr. I18—The microfocus spectroscopy beamline at the Diamond Light Source. J. Synchrotron Radiat. 2009, 16, 818–824. [Google Scholar] [CrossRef] [PubMed]
- Solé, V.A.; Papillon, E.; Cotte, M.; Walter, P.; Susini, J. A multiplatform code for the analysis of energy-dispersive X-ray fluorescence spectra. Spectrochim. Acta Part B At. Spectrosc. 2007, 62, 63–68. [Google Scholar] [CrossRef]
- Ravel, B.; Newville, M. IUCr. ATHENA, ARTEMIS, HEPHAESTUS: Data analysis for X-ray absorption spectroscopy using IFEFFIT. J. Synchrotron Radiat. 2005, 12, 537–541. [Google Scholar] [CrossRef] [Green Version]
- Gustafsson, J.P.; Braun, S.; Tuyishime, J.R.M.; Adediran, G.A.; Warrinnier, R.; Hesterberg, D. A probabilistic approach to phosphorus speciation of soils using P K-Edge XANES spectroscopy with linear combination fitting. Soil Syst. 2020, 4, 26. [Google Scholar] [CrossRef] [Green Version]
- Kabata-Pendias, A. Trace Elements in Soil and Plants, 4th ed.; CRC Press: New York, NY, USA, 2011; p. 548. [Google Scholar]
- Cavanagh, J. What are “Soil Guideline Values” and Which Should I Use? Manaaki Whenua—Landcare Research: Lincoln, New Zealand, 2019; Available online: https://www.landcareresearch.co.nz/publications/soil-horizons/soil-horizons-articles/soil-guideline-values/ (accessed on 17 January 2023).
- Land Management. Sewage Sludge in Agriculture: Code of Practice. Department for Environment Food & Rural Affairs, Environment Agency Sewage Sludge in Agriculture: Code of Practice for England, Wales and Northern Ireland. 2019. Available online: https://www.gov.uk/government/publications/sewage-sludge-in-agriculture-code-of-practice/sewage-sludge-in-agriculture-code-of-practice-for-england-wales-and-northern-ireland#producers-test-sewage-sludge (accessed on 20 January 2023).
- Tolu, J.; Bouchet, S.; Helfenstein, J.; Hausheer, O.; Chékifi, S.; Frossard, E.; Tamburini, F.; Chadwick, O.A.; Winkel, L.H.E. Understanding soil selenium accumulation and bioavailability through size resolved and elemental characterization of soil extracts. Nat. Commun. 2022, 13, 6974. [Google Scholar] [CrossRef]
- Jacobs, L.W. Selenium in Agriculture and the Environment; Soil Science of Society of America Special Publication: Madison, WI, USA, 1989; p. 233. [Google Scholar]
- Fernández-Martínez, A.; Charlet, L. Selenium environmental cycling and bioavailability: A structural chemist point of view. Rev. Environ. Sci. Bio/Technol. 2009, 8, 88–110. [Google Scholar] [CrossRef]
- Fay, D.; Kramers, G.; Zhang, C.; McGrath, D.; Grennan, E. Soil Geochemical Atlas of Ireland; Teagasc and The Environment Protection Agency: Washington, DC, USA, 2007; pp. 88–89. [Google Scholar]
- Wignall, P.B.; Best, J.L. The Western Irish Namurian Basin reassessed. Basin Res. 2000, 12, 59–78. [Google Scholar] [CrossRef] [Green Version]
- Knight, J.; Coxon, P.; McCabe, M.A.; McCarron, S.G. Pleistocene glaciations in Ireland. Dev. Quat. Sci. 2004, 2, 183–191. [Google Scholar]
- Oremland, R.S.; Hollibaugh, J.T.; Maest, A.S.; Presser, T.S.; Miller, L.G.; Culbertson, C.W. Selenate reduction to elemental selenium by anaerobic bacteria in sediments and culture: Biogeochemical significance of a novel, sulfate-independent respiration. Appl. Environ. Microbiol. 1989, 55, 2333–2343. [Google Scholar] [CrossRef] [PubMed] [Green Version]
- Pearce, C.I.; Coker, V.S.; Charnock, J.M.; Pattrick, R.A.D.; Mosselmans, J.F.W.; Law, N.; Beveridge, T.J.; Lloyd, J.R. Microbial manufacture of chalcogenide-based nanoparticles via the reduction of selenite using Veillonella atypica: An in situ EXAFS study. Nanotechnology 2008, 19, 155603. [Google Scholar] [CrossRef]
- Pearce, C.I.; Pattrick, R.A.D.; Law, N.; Charnock, J.M.; Coker, V.S.; Fellowes, J.W.; Oremland, R.S.; Lloyd, J.R. Investigating different mechanisms for biogenic selenite transformations: Geobacter sulfurreducens, Shewanella oneidensis and Veillonella atypica. Environ. Technol. 2009, 30, 1313–1326. [Google Scholar] [CrossRef] [PubMed]
- Fellowes, J.W.; Pattrick, R.A.D.; Boothman, C.; Al Lawati, W.M.M.; van Dongen, B.E.; Charnock, J.M.; Lloyd, J.R.; Pearce, C.I. Microbial selenium transformations in seleniferous soils. Eur. J. Soil Sci. 2013, 64, 629–638. [Google Scholar] [CrossRef]
- Cipriano, P.E.; Fonseca da Silva, R.; Dias de Lima, F.R.; de Oliveira, C.; de Lima, A.B.; Celante, G.; Dos Santos, A.A.; Archilha, M.V.L.R.; Pinatto-Botelho, M.F.; Faquin, V.; et al. Selenium biofortification via soil and its effect on plant metabolism and mineral content of sorghum plants. J. Food Compos. Anal. 2002, 109, 104505. [Google Scholar] [CrossRef]
- Gustafsson, J.P.; Johnsson, L. The association between selenium and humic substances in forested ecosystems—Laboratory evidence. Appl. Organomet. Chem. 1994, 8, 141–147. [Google Scholar] [CrossRef]
- Trippe, R.C., III; Pilon-Smit, E.A.H. Selenium transport and metabolism in plants: Phytoremediation and biofortification implications. J. Hazard. Mater. 2021, 404, 124178. [Google Scholar] [CrossRef]
- Supriatin, S.; Weng, L.; Comans, R.N.J. Selenium-rich dissolved organic matter determines selenium uptake in wheat grown on Low-selenium arable land soils. Plant Soil 2015, 408, 73–94. [Google Scholar] [CrossRef] [Green Version]
- Kikkert, J.; Berkelaar, E. Plant uptake and translocation of inorganic and organic forms of selenium. Arch. Environ. Contam. Toxicol. 2013, 65, 458–465. [Google Scholar] [CrossRef] [PubMed]
- Song, Z.; Shao, H.; Huang, H.; Shen, Y.; Wang, L.; Wu, F.; Han, D.; Song, J.; Jia, H. Overexpression of the phosphate transporter gene OsPT8 improves the Pi and selenium contents in Nicotiana tabacum. Environ. Exp. Bot. 2017, 137, 158–165. [Google Scholar] [CrossRef]
- Ren, H.Z.; Li, X.M.; Guo, L.N.; Wang, L.; Hao, X.Y.; Zeng, J.M. Integrative Transcriptome and Proteome Analysis Reveals the Absorption and Metabolism of Selenium in Tea Plants [Camellia sinensis (L.) O. Kuntze]. Front. Plant Sci. 2022, 13, 848349. [Google Scholar] [CrossRef]
- Van Hoewyk, D.; Garifullina, G.F.; Ackley, A.R.; Abdel-Ghany, S.E.; Marcus, M.A.; Fakra, S.; Ishiyama, K.; Inoue, E.; Pilon, M.; Takahashi, H.; et al. Overexpression of AtCpNifS enhances selenium tolerance and accumulation in Arabidopsis. Plant Physiol. 2005, 139, 1518–1528. [Google Scholar] [CrossRef] [Green Version]
- Zhao, X.Q.; Mitani, N.; Yamaji, N.; Shen, R.F.; Ma, J.F. Involvement of silicon influx transporter OsNIP2; 1 in selenite uptake in rice. Plant Physiol. 2010, 153, 1871–1877. [Google Scholar] [CrossRef] [PubMed] [Green Version]
- Weres, O.; Jaouni, A.-R.; Tsao, L. The distribution, speciation and geochemical cycling of selenium in a sedimentary environment, Kesterson Reservoir, California, U.S.A. Appl. Geochem. 1989, 4, 543–563. [Google Scholar] [CrossRef]
- Presser, T.S.; Swain, W.C. Geochemical evidence for Se mobilization by the weathering of pyritic shale, San Joaquin Valley, California, U.S.A. Appl. Geochem. 1990, 5, 703–717. [Google Scholar] [CrossRef]
- Wu, L.; Van Mantgem, P.J.; Guo, X. Effects of forage plant and field legume species on soil selenium redistribution, leaching, and bioextraction in soils. Arch. Environ. Contam. Toxicol. 1996, 31, 329–338. [Google Scholar] [CrossRef]
- Wu, L. Review of 15 years of research on ecotoxicology and remediation of land contaminated by agricultural drainage sediment rich in selenium. Ecotoxicol. Environ. Saf. 2004, 57, 257–269. [Google Scholar] [CrossRef]
- Zhang, Y.; Moore, J.N. Selenium Fractionation and Speciation in a Wetland System. Environ. Sci. Technol. 1996, 30, 2613–2619. [Google Scholar] [CrossRef]
- Johnsson, L. Trends and annual fluctuations in selenium concentrations in wheat grain. Plant Soil 1991, 138, 67–73. [Google Scholar] [CrossRef]
- Lloyd, J.R. Microbial reduction of metals and radionuclides. FEMS Microbiol. Rev. 2003, 27, 411–425. [Google Scholar] [CrossRef]
- Li, Y.; Wang, W.; Luo, K.; Li, H. Environmental behaviours of selenium in soil of typical selenosis area in China. J. Environ. Sci. 2008, 20, 859–864. [Google Scholar] [CrossRef]
- Davies, E.B.; Watkinson, J.H. Uptake of native and applied selenium by pasture species. N. Z. J. Agric. Res. 1966, 9, 317–327. [Google Scholar] [CrossRef] [Green Version]
- Yuan, L.; Yin, X.; Zhu, Y.; Li, F.; Huang, Y.; Liu, Y.; Lin, Z. Selenium in Plants and Soils, and Selenosis in Enshi, China: Implications for Selenium Biofortification. In Phytoremediation and Biofortification Two sides of One Coin; Sharma, K., Ed.; Springer Briefs in Molecular Science: Green Chemistry for Sustainability; Springer: Berlin/Heidelberg, Germany, 2012; Chapter 2; pp. 7–31. [Google Scholar]
- Zhang, L.; Hu, B.; Li, W.; Che, R.; Deng, K.; Li, H.; Yu, F.; Ling, H.; Li, Y.; Chu, C. OsPT2, a phosphate transporter, is involved in the active uptake of selenite in rice. New Phytol. 2014, 201, 1183–1191. [Google Scholar] [CrossRef] [Green Version]
- Dhillon, K.; Banuelos, G. Overview and Prospects of Selenium Phytoremediation Approaches. In Selenium in Plants; Pilon-Smits, E.A.H., Winkel, L.H.E., Lin, Z.-Q., Eds.; Springer-Link: New York, NY, USA, 2017; pp. 277–322. [Google Scholar]
- Shinmachi, F.; Buchner, P.; Stroud, J.L.; Parmar, S.; Zhao, F.J. Influence of sulfur deficiency on the expression of specific sulfate transporters and the distribution of sulfur, selenium, and molybdenum in wheat. Plant Physiol. 2010, 153, 327–336. [Google Scholar] [CrossRef] [PubMed] [Green Version]
- Favas, P.; Pratas, J.; Mayank, V.; Rohan, D.; Paul, M. Accumulation of uranium by aquatic plants in field conditions: Prospects for phytoremediation. Sci. Total Environ. 2014, 470–471, 993–1002. [Google Scholar] [CrossRef]
- Merkel, B.; Hasche-Berger, A. (Eds.) Uranium in the Environment; Springer: Berlin/Heidelberg, Germany, 2006; p. 897. [Google Scholar]
- Sheppard, S.C.; Evenden, W.G.; Anderson, A.J. Multiple assays of uranium toxicity in soil. Environ. Toxicol. Water Qual. 1992, 7, 275–294. [Google Scholar] [CrossRef]
- Teagasc. Teagasc Dairy Manual. Available online: https://www.teagasc.ie/publications/2016/teagasc-dairy-manual.php (accessed on 1 December 2021).
- Brown, T.A.; Shrift, A. Selenium: Toxicity and Tolerance in Higher Plants. Biol. Rev. 1982, 57, 59–84. [Google Scholar] [CrossRef]
- Sors, T.G.; Ellis, D.R.; Salt, D.E. Selenium uptake, translocation, assimilation and metabolic fate in plants. Photosynth. Res. 2005, 86, 373–389. [Google Scholar] [CrossRef]
- El Mehdawi, A.F.; Pilon-Smits, E.A.H. Ecological aspects of plant selenium hyperaccumulation. Plant Biol. 2011, 14, 1–10. [Google Scholar] [CrossRef]
- Renkema, H.; Koopmans, A.; Kersbergen, L.; Kikkert, J.; Hale, B.; Berkelaar, B. The effect of transpiration on selenium uptake and mobility in durum wheat and spring canola. Plant Soil 2012, 354, 239–250. [Google Scholar] [CrossRef]
- Hale, K.l.; McGrath, S.P.; Lombi, E.; Stack, S.M.; Terry, N.; Pickering, I.J.; George, G.N.; Pilon-Smits, E.A.H. Molybdenum sequestration in Brassica species. A Role for Anthocyanins? Plant Physiol. 2001, 126, 1391–1402. [Google Scholar] [CrossRef] [Green Version]
- Neunhauserer, C.; Berreck, M.; Insam, H. Remediation of soils contaminated with molybdenum using soil amendments and phytoremediation. Water Soil Pollut. 2001, 128, 85–96. [Google Scholar] [CrossRef]
- WHO. Selenium. In Trace Elements in Human Nutrition and Health; World Health Organisation: Geneva, Switzerland, 1996; Chapter 6; pp. 105–120. [Google Scholar]
- O’Flynn, J.; (Farmer of Ballyegny Beg). Personal Communications, 2014–2018.


| Site | Se | Mo | As | U | V | |
|---|---|---|---|---|---|---|
| mg kg−1 | mg kg−1 | mg kg−1 | mg kg−1 | mg kg−1 | ||
| TL | Min | 0.0 | 0.2 | 7.5 | 5.2 | 54.3 |
| Max | 88.2 | 1.9 | 39.8 | 13.0 | 85.9 | |
| TJ | Min | 0.0 | 1.0 | 6.2 | 6.8 | 20.7 |
| Max | 28.4 | 19.0 | 17.1 | 26.6 | 80.9 | |
| FF | Min | 0.0 | 2.8 | 0.0 | 8.3 | 48.4 |
| Max | 489.1 | 1627.5 | 99.8 | 599.5 | 189.7 | |
| MO | Min | 1.0 | 3.2 | 0.0 | 17.0 | 77.8 |
| Max | 1265.8 | 898.1 | 115.3 | 407.0 | 195.2 | |
| PK | Min | 0.9 | 1.9 | 0.4 | 10.0 | 175.7 |
| Max | 682.0 | 34.9 | 63.1 | 12.4 | 212.2 | |
| Sample | Depth | Se | Mo | As | U | V | Mn | Cu | CaO | Fe2O3 | SiO2 | Al2O3 | TOC |
|---|---|---|---|---|---|---|---|---|---|---|---|---|---|
| cm | mg kg−1 | mg kg−1 | mg kg−1 | mg kg−1 | mg kg−1 | mg kg−1 | mg kg−1 | wt% | wt% | wt% | wt% | wt% | |
| TL-C1 | 0–10 | 55.2 | 0.8 | 25.2 | 7.2 | 82.0 | 260.9 | 67.5 | 3.1 | 3.7 | 56.5 | 11.0 | 8.5 |
| 10–20 | 45.1 | 1.0 | 22.5 | 6.9 | 81.1 | 312.8 | 64.9 | 4.0 | 3.8 | 57.1 | 11.2 | 7.1 | |
| 20–30 | 58.2 | 1.0 | 26.0 | 7.5 | 76.8 | 280.2 | 62.1 | 4.2 | 3.8 | 55.5 | 11.4 | 7.4 | |
| 30–40 | 171.7 | 2.4 | 54.6 | 13.0 | 75.8 | 274.6 | 51.3 | 3.7 | 4.3 | 40.4 | 10.6 | 15.1 | |
| 40–50 | 61.9 | 1.0 | 15.9 | 9.2 | 34.5 | 156.6 | 14.0 | 18.8 | 2.1 | 40.5 | 7.0 | 7.0 | |
| R2 | - | 0.97 | 0.90 | 0.93 | 0.01 | 0.01 | 0.01 | 0.03 | 0.19 | 0.45 | 0.00 | 0.96 | |
| FF-C2 | 0–10 | 99.1 | 22.9 | 12.9 | 88.7 | 119.9 | 613.5 | 107.4 | 3.2 | 3.9 | 28.6 | 5.96 | 25.7 |
| 10–20 | 239.9 | 49.2 | 48.0 | 359.3 | 133.2 | 194.8 | 101.8 | 5.1 | 5.1 | 13.4 | 3.1 | 33.3 | |
| 20–30 | 163.8 | 120.2 | 117.4 | 658.8 | 100.4 | 194.1 | 72.5 | 6.7 | 4.8 | 1.2 | 0.5 | 37.3 | |
| 30–40 | 926.8 | 191.9 | 132.3 | 354.9 | 138.0 | 221.8 | 120.0 | 8.0 | 4.3 | 4.8 | 1.3 | 35.9 | |
| 40–50 | 268.6 | 163.3 | 94.2 | 78.7 | 86.9 | 214.4 | 17.4 | 32.7 | 2.3 | 8.3 | 1.4 | 11.2 | |
| R2 | - | 0.52 | 0.41 | 0.01 | 0.27 | 0.12 | 0.14 | 0.00 | 0.00 | 0.19 | 0.17 | 0.09 |
| Material | Se mg kg−1 | Mo mg kg−1 | As mg kg−1 | U mg kg−1 | V mg kg−1 | |
|---|---|---|---|---|---|---|
| TL-P1 (site TL-1) | Clover Leaf | 296.2 ± 4.50 | 15.98 ± 0.25 | 0.27 ± 0.01 | 0.05 ± 0.00 | 0.70 ± 0.02 |
| Clover Stem | 249.6 ± 7.20 | 17.27 ± 0.29 | 0.23 ± 0.00 | 0.03 ± 0.00 | 0.38 ± 0.02 | |
| Clover Root | 150.4 ± 16.19 | 4.89 ± 0.25 | 1.54 ± 0.05 | 0.34 ± 0.01 | 4.63 ± 0.16 | |
| TF = Leaf/Root | 1.97 | 3.27 | 0.18 | 0.14 | 0.15 | |
| TF = Stem/Root | 1.66 | 3.53 | 0.15 | 0.09 | 0.08 | |
| Grass Shoot | 44.9 ± 7.23 | 6.20 ± 0.05 | 0.39 ± 0.02 | 0.05 ± 0.00 | 0.92 ± 0.01 | |
| Grass Root | 67.9 ± 2.57 | 4.59 ± 0.49 | 30.1 ± 0.77 | 1.40 ± 0.04 | 37.69 ± 1.40 | |
| TF = Shoot/Root | 0.66 | 1.35 | 0.01 | 0.04 | 0.02 | |
| TL-P2 (site TL-1) | Grass Shoot | 78.1 ± 7.81 | 3.19 ± 0.49 | 1.24 ± 0.08 | 0.18 ± 0.00 | 4.45 ± 0.13 |
| Grass Root | 112.1 ± 1.72 | 1.80 ± 0.03 | 6.6 ± 0.28 | 0.79 ± 0.03 | 18.58 ± 2.24 | |
| TF = Shoot/Root | 0.70 | 1.77 | 0.19 | 0.23 | 0.24 | |
| TJ-P1 (site TJ-1) | Grass Shoot | 5.8 ± 0.67 | 11.59 ± 0.95 | 0.66 ± 0.06 | 0.47 ± 0.04 | 2.29 ± 0.21 |
| Grass Root | 17.27 ± 0.16 | 6.94 ± 0.05 | 10.46 ± 0.11 | 6.18 ± 0.04 | 30.89 ± 0.19 | |
| TF = Shoot/Root | 0.33 | 1.67 | 0.06 | 0.08 | 0.07 | |
| TJ-P2 (site TJ-2) | Grass Root | 5.1 ± 0.06 | 4.14 ± 0.02 | 19.72 ± 0.15 | 3.97 ± 0.02 | 11.17 ± 0.07 |
| Grass Shoot | 1.19 ± 0.07 | 13.68 ± 0.07 | 0.21 ± 0.00 | 0.12 ± 0.00 | 0.64 ± 0.01 | |
| TF = Shoot/Root | 0.23 | 3.30 | 0.01 | 0.03 | 0.06 | |
| FF-P1 (site FF-1) | Grass Shoot | 4.13 ± 0.24 | 35.83 ± 0.47 | 0.30 ± 0.03 | 0.11 ± 0.00 | 1.40 ± 0.03 |
| Grass Root | 22.3 ± 2.51 | 14.6 ± 1.17 | 179.7 ± 17.18 | 0.76 ± 0.07 | 50.19 ± 4.89 | |
| TF = Shoot/Root | 0.19 | 2.45 | 0.00 | 0.15 | 0.03 | |
| FF-P2 (site FF-2) | Grass Root | 26.29 ± 0.13 | 15.02 ± 0.21 | 4.15 ± 0.06 | 4.10 ± 0.04 | 27.29 ± 0.28 |
| Grass Shoot | 33.8 ± 2.15 | 79.6 ± 1.13 | 0.83 ± 0.01 | 4.41 ± 0.05 | 2.55 ± 0.01 | |
| TF = Shoot/Root | 1.29 | 5.30 | 0.20 | 1.07 | 0.09 | |
| PK-P1 (site PK-1) | Grass Shoot | 3.93 ± 0.21 | 23.24 ± 0.13 | 0.63 ± 0.02 | 0.41 ± 0.00 | 1.84 ± 0.02 |
| Grass Root | 31.10 ± 0.17 | 18.79 ± 0.11 | 26.98 ± 0.12 | 4.02 ± 0.02 | 132.91 ± 0.76 | |
| TF = Shoot/Root | 0.13 | 1.24 | 0.02 | 0.10 | 0.01 | |
| PK-P2 (site PK-2) | Grass Shoot | 1.32 ± 0.12 | 14.76 ± 0.14 | 0.78 ± 0.02 | 0.42 ± 0.01 | 7.34 ± 0.08 |
| Grass Root | 4.28 ± 0.22 | 5.52 ± 0.17 | 3.05 ± 0.12 | 0.95 ± 0.04 | 30.46 ± 1.03 | |
| TF = Shoot/Root | 0.31 | 2.67 | 0.26 | 0.45 | 0.24 | |
| MO-P1 (site MO-1) | Grass Shoot | 48.3 ± 0.63 | 55.69 ± 0.47 | 0.30 ± 0.02 | 1.02 ± 0.04 | 0.84 ± 0.02 |
| Grass Root | 84.3 ± 1.21 | 13.16 ± 0.55 | 1.17 ± 0.11 | 1.11 ± 0.02 | 1.50 ± 0.03 | |
| TF = Shoot/Root | 0.57 | 4.23 | 0.26 | 0.92 | 0.56 |
| Sample | Material | Se mg kg−1 | Mo mg kg−1 | As mg kg−1 | U mg kg−1 | V mg kg−1 |
|---|---|---|---|---|---|---|
| Premier Kale | Kale Leaf | 971.7 ± 18.08 | 1000.4 ± 14.91 | 0.20 ± 0.01 | 0.63 ± 0.04 | 0.37 ± 0.03 |
| Kale Stem | 394.3 ± 2.04 | 181.2 ± 2.78 | 0.16 ± 0.02 | 0.29 ± 0.06 | 0.15 ± 0.03 | |
| Kale Root | 570.6 ± 6.38 | 309.2 ± 3.09 | 0.47 ± 0.01 | 4.74 ± 0.19 | 1.11 ± 0.05 | |
| TF = Leaf/Root | 1.70 | 3.24 | 0.43 | 0.13 | 0.34 | |
| TF = Stem/Root | 0.69 | 0.59 | 0.34 | 0.06 | 0.13 | |
| Hispi Cabbage | Hispi Cabbage Leaf | 826.5 ± 10.72 | 443.2 ± 3.41 | 0.22 ± 0.01 | 0.93 ± 0.05 | 0.39 ± 0.02 |
| Hispi Cabbage Stem | 539.9 ± 2.63 | 260.9 ± 2.53 | 0.36 ± 0.01 | 0.38 ± 0.02 | 0.13 ± 0.00 | |
| Hispi Cabbage Root | 643.0 ± 8.47 | 288.6 ± 1.78 | 0.76 ± 0.01 | 9.38 ± 0.29 | 0.83 ± 0.03 | |
| TF = Leaf/Root | 1.29 | 1.54 | 0.29 | 0.10 | 0.47 | |
| TF = Stem/Root | 0.84 | 0.90 | 0.48 | 0.04 | 0.15 | |
| Red Cabbage | Red Cabbage Leaf | 787.8 ± 42.31 | 271.6 ± 13.45 | 0.03 ± 0.03 | 0.20 ± 0.02 | 0.10 ± 0.01 |
| Red Cabbage Stem | 336.2 ± 8.38 | 162.8 ± 0.39 | 0.26 ± 0.01 | 0.32 ± 0.00 | 0.13 ± 0.00 | |
| Red Cabbage Root | 390.0 ± 6.45 | 187.6 ± 1.98 | 0.53 ± 0.01 | 4.60 ± 0.22 | 0.57 ± 0.04 | |
| TF = Leaf/Root | 2.02 | 1.45 | 0.06 | 0.04 | 0.17 | |
| TF = Stem/Root | 0.86 | 0.87 | 0.50 | 0.07 | 0.23 |
| Sample | POI | SeCys2 | SeMet | Selenide | Elemental Se | Selenite | R-Factor |
|---|---|---|---|---|---|---|---|
| % | % | % | % | % | |||
| TL-C1 Soil (core) | 1 | 7 | - | - | 92 | - | 0.008 |
| 2 | 6 | 34 | - | 65 | - | 0.003 | |
| 3 | - | - | 19 | 81 | - | 0.003 | |
| FF-C2 Soil (core) | 1 | - | - | 7 | 93 | - | 0.008 |
| 2 | 8 | - | 16 | 77 | - | 0.002 | |
| 3 | 24 | 76 | - | - | - | 0.020 | |
| 4 | - | 70 | - | 19 | 11 | 0.005 |
| Sample | POI | SeCys2 | SeMet | Selenite | Selenate | R-Factor |
|---|---|---|---|---|---|---|
| % | % | % | % | |||
| FF-P2 Grass blade | 1 | 16 | 75 | 7 | 2 | 0.019 |
| 2 | 8 | 80 | 9 | 4 | 0.005 | |
| 3 | 7 | 79 | 10 | 4 | 0.006 | |
| TL-P1 Grass blade | 1 | - | 91 | 7 | 2 | 0.004 |
| 2 | - | 90 | 8 | 2 | 0.004 | |
| 3 | - | 89 | 8 | 2 | 0.008 | |
| TL-P1 Grass roots | 1 | 3 | 84 | 8 | 3 | 0.004 |
| 2 | 3 | 81 | 10 | 3 | 0.005 | |
| 3 | 16 | 76 | 7 | 2 | 0.011 | |
| TL-P1 Clover Leaf | 1 | 14 | 76 | 7 | 4 | 0.011 |
| 2 | 7 | 82 | 7 | 3 | 0.005 | |
| 3 | 9 | 82 | 7 | 3 | 0.004 | |
| 4 | 8 | 84 | 11 | 4 | 0.007 | |
| TL-P1 Clover Stem | 1 | - | 88 | 8 | 4 | 0.009 |
| 2 | - | 89 | 8 | 2 | 0.013 | |
| 3 | - | 86 | 11 | 3 | 0.037 |
| Sample | POI | SeCys2 | SeMet | Selenite | Selenate | R-Factor |
|---|---|---|---|---|---|---|
| % | % | % | % | |||
| Premier Kale Leaf | 1 | 12 | 76 | 10 | 3 | 0.005 |
| 2 | 7 | 84 | 7 | 2 | 0.004 | |
| 3 | 9 | 80 | 9 | 3 | 0.004 | |
| Premier Kale Stem | 1 | 11 | 72 | 14 | 4 | 0.006 |
| 2 | 14 | 67 | 15 | 4 | 0.005 | |
| 3 | 11 | 67 | 18 | 4 | 0.005 | |
| Premier Kale Root | 1 | 9 | 83 | 6 | 2 | 0.003 |
| 2 | 10 | 81 | 7 | 2 | 0.006 | |
| 3 | 9 | 82 | 7 | 2 | 0.004 | |
| Hispi Cabbage Leaf | 1 | 16 | 73 | 10 | 1 | 0.015 |
| 2 | 7 | 83 | 8 | 2 | 0.004 | |
| 3 | 8 | 84 | 6 | 2 | 0.003 | |
| Hispi Cabbage Stem | 1 | - | 93 | 6 | 1 | 0.015 |
| 2 | - | 97 | 2 | 1 | 0.001 | |
| 3 | - | 93 | 6 | 1 | 0.014 | |
| Hispi Cabbage Root | 1 | 16 | 80 | 3 | 1 | 0.008 |
| 2 | 17 | 82 | 7 | - | 0.007 | |
| 3 | 16 | 81 | 3 | 1 | 0.006 |
| Site | BAF | Se | Mo | As | U | V |
|---|---|---|---|---|---|---|
| TL-P1 | Grass Shoot/Soil | 0.81 | 7.74 | 0.02 | 0.01 | 0.01 |
| Grass Root/Soil | 1.23 | 5.74 | 1.19 | 0.19 | 0.46 | |
| Clover Leaf | 5.36 | 20.00 | 0.12 | 0.01 | 0.01 | |
| Clover Stem | 4.53 | 21.25 | 0.01 | 0.00 | 0.00 | |
| Clover Root | 2.72 | 6.25 | 0.08 | 0.04 | 0.06 | |
| FF-P2 | Grass Shoot/Soil | 0.34 | 3.48 | 0.06 | 0.05 | 0.02 |
| Grass Root/Soil | 0.27 | 0.66 | 0.32 | 0.05 | 0.23 |
| Element | TAV |
|---|---|
| Se | 5–20 mg/kg−1 |
| Mo | 3–10 mg/kg−1 |
| As | 10–65 mg/kg−1 |
| V | 100–350 mg/kg−1 |
| U | 5–500 mg/kg−1 |
Disclaimer/Publisher’s Note: The statements, opinions and data contained in all publications are solely those of the individual author(s) and contributor(s) and not of MDPI and/or the editor(s). MDPI and/or the editor(s) disclaim responsibility for any injury to people or property resulting from any ideas, methods, instructions or products referred to in the content. |
© 2023 by the authors. Licensee MDPI, Basel, Switzerland. This article is an open access article distributed under the terms and conditions of the Creative Commons Attribution (CC BY) license (https://creativecommons.org/licenses/by/4.0/).
Share and Cite
McLoughlin, S.L.; Pattrick, R.A.D.; Mosselmans, J.F.W.; Kelleher, J.; van Dongen, B.E. Selenium Uptake from Livestock Pasture Extremely Enriched in Selenium, Molybdenum and Uranium: A Field and X-ray Absorption Study. Soil Syst. 2023, 7, 24. https://doi.org/10.3390/soilsystems7010024
McLoughlin SL, Pattrick RAD, Mosselmans JFW, Kelleher J, van Dongen BE. Selenium Uptake from Livestock Pasture Extremely Enriched in Selenium, Molybdenum and Uranium: A Field and X-ray Absorption Study. Soil Systems. 2023; 7(1):24. https://doi.org/10.3390/soilsystems7010024
Chicago/Turabian StyleMcLoughlin, Shauna L., Richard A. D. Pattrick, J. Frederick W. Mosselmans, Joe Kelleher, and Bart E. van Dongen. 2023. "Selenium Uptake from Livestock Pasture Extremely Enriched in Selenium, Molybdenum and Uranium: A Field and X-ray Absorption Study" Soil Systems 7, no. 1: 24. https://doi.org/10.3390/soilsystems7010024