Article

Litter Decomposition Is Not Affected by Perfluorobutane Sulfonate (PFBS) in Experimental Soil Microcosms

1
Institute of Biology, Freie Universität Berlin, Altensteinstraße 6, 14195 Berlin, Germany
2
Berlin-Brandenburg Institute of Advanced Biodiversity Research (BBIB), 14195 Berlin, Germany
*
Author to whom correspondence should be addressed.
Soil Syst. 2023, 7(1), 13; https://doi.org/10.3390/soilsystems7010013
Submission received: 12 December 2022 / Revised: 1 February 2023 / Accepted: 2 February 2023 / Published: 6 February 2023

Abstract

:
Perfluorobutane sulfonate (PFBS) has been found in increasing concentrations in the environment. However, its effect on litter decomposition in soils is still unclear. Therefore, the effect of PFBS on the decomposition of various litter types was tested, as well as on selected aspects of soil quality. Soil samples were treated with different concentrations of PFBS (0, 1, and 10 µg g–1) and five organic litter materials were used with various C:N ratios. A soil microcosm experiment was performed at 20 °C for 6 weeks. Litter decomposition, soil respiration, enzyme activities, soil pH, water-stable aggregates (WSA), and soil total C and N contents were measured. PFBS treatments were observed to have negligible effects on litter decomposition as well as on other soil properties. This means that in the concentration range examined, this substance has no observable effects on the key soil parameters examined. The present result was inconsistent with the findings of a previous study with similar experimental microcosms but different soils. This study suggests that the effects of PFBS may be less pronounced in the tested soil, but it cannot be concluded that PFBS is harmless in soil ecosystems. A wider range of soil types and PFBS levels should be tested in future studies.

1. Introduction

Perfluoroalkyl and polyfluoroalkyl substances (PFAS) are compounds in which all or part of the H atoms in the alkyl chain are substituted by F atoms [1]. The C–F bond is very strong and stable compared to other substituents due to the strong electronegativity of the F atom [2]. PFAS are chemically and thermally stable, and the fluorinated ‘tail’ of PFAS makes them both hydrophobic and lipophilic. Therefore, these chemicals are widely used in industry and daily life, including coating, aqueous film-forming foams, textiles, and food packages [3,4,5]. However, these excellent properties for commercial materials are also producing unexpected consequences in the natural environment. A recent study has demonstrated that environmental PFAS levels have exceeded a new planetary boundary, highlighting their threat to human and ecosystem health [6].
Perfluorooctanoic acid (PFOA) and perfluorooctane sulfonic acid (PFOS) are two common PFAS. PFOA and PFOS are defined as “long chain” PFAS, as they consist of more than six carbon atoms [7]. They are resistant to natural degradation, resulting in the persistence and accumulation in the environment, wildlife, and humans [8]. Previous studies suggested that PFAS can cause a variety of health problems, including damage to the immune system as well as liver and kidney disease [9]. Therefore, PFOS and PFOA have been included in the Stockholm Convention in 2009 and 2019, and since then, they have been gradually banned or restricted by the European Union as well as globally [10]. In turn, however, as an alternative to PFOS, perfluorobutane sulfonate (PFBS) containing 4 C has been frequently detected in the environment [11].
As a consequence of increasing production and application, PFBS accompanied by PFOA and PFOS has also been widely detected in surface water, soil, plants, and animals [12,13], particularly in the sites around fluorochemical industry and military bases [14,15]. In forest soils across Sweden, PFBS was detected with high frequency (70%), and concentrations were as high as 1 ng g –1 [16]; more remarkably, it was reported that PFBS concentration in the soil samples around a fluorochemical industrial park was up to 5550 ng g –1 [16]. Furthermore, the environmental inventory of PFBS has significantly increased globally since 2010, and it constitutes a prevalent PFAS in the environment [12].
The existing evidence has demonstrated the toxicity of PFBS on soil microorganisms and model organisms, such as Caenorhabditis elegans, which play an important role in litter decomposition [17]. Qiao et al. [18] reported that PFBS could change soil bacterial richness and the activity of sucrase and urease. The significant toxicity of PFBS to the reproduction and next generations of C. elegans was often observed at higher concentrations (e.g., ≥0.1 mM) [11,19,20]. Moreover, PFBS seemed to exert a more profound effect on litter decomposition and soil respiration than PFOA and PFOS [21]. Despite these results, more information is warranted in order to better understand the risk of this unregulated PFAS in soil ecosystems.
Litter decomposition is one of the vital processes in the Earth’s carbon and nutrient cycles, a process that not only releases carbon dioxide into the atmosphere but also contributes to soil fertility by producing soil organic matter. Despite the importance of organic matter decomposition, this process is not yet fully understood because it is very complex [22]. With the development of the litter bag technique, it is now possible to calculate mass loss and estimate litter decomposition to understand the nutrients available to the ecosystem [23]. From a microbial perspective, litter decomposition in the soil is a result of the growth and succession of microbial communities [24]. Hundreds of enzymes can be released from these microbial communities, and the decomposition of litter can affect these enzymes through enzyme-substrate interactions and, in turn, differences in enzyme activity can affect litter decomposition [25].
Herein, the effects of PFBS on litter decomposition and associated soil processes were investigated, including soil respiration, pH, soil total C and N, enzyme activities, and water-stable aggregates. Given the fact that a significant effect on litter decomposition was observed in a certain soil previously [21], it was hypothesized that this effect would occur on various litter types in the soil used in the present experiment. Therefore, five types of organic matter (i.e., Medicago lupulina leaves, Plantago lanceolata leaves, hemp stem, wheat straw, and green tea) were selected to cover a broad range of litter quality, and their decomposition in another agricultural soil in response to PFBS treatments was studied.

2. Materials and Methods

2.1. Soil and Perfluorobutane Sulfonate

The tested soil was collected from an agricultural station with a sampling depth of 25 cm in Alt-Madlitz, Germany (52°38′ N, 14°28′ E). The soil texture was determined as sandy loam (0.27% clay, 21.8% silt and 77.9% sand) by a LS13320 Particle Size Analyzer (Beckman Coulter Inc., Brea, CA, USA). The basic properties were as follows: 6.4 g kg–1 total C and 0.53 g kg–1 total N, measured by a Euro EA analyser (HEKAtech GmbH, Wegberg, Germany), 112 mg kg–1 available P and 89.8 mg kg−1 exchangeable K, analyzed by the Mehlich 3 Extractant Technique, and a pH (1:5 of soil: water) of 6.67, as determined with a pH meter (Hanna Instruments, Woonsocket, RI, USA).
As with PFOS (pKa = –3.27), perfluorobutanesulfonic acid is a strong acid with pKa = –3.31, making PFBS readily soluble and dissociable in water as well as in soil solutions [26]. For PFAS with low pKa values and high acidity, the acidic form of PFAS might affect the soil pH and microorganisms when added. Thus, to exclude the potential acidity effect of PFBS on microbially driven processes [27], the potassium salt PFBS (CAS 29420-49-3, Sigma-Aldrich, Saint Louis, MO, USA) was used in this study.

2.2. Organic Materials for Litter Decomposition

Five types of organic material were selected, namely Medicago lupulina leaves, Plantago lanceolata leaves, commercial hemp stem (HS, REAL NATURE, Item no.: 1,259,176, Krefeld, Germany), wheat straw (MultiFit, Item no.: 1,008,159, Krefeld, Germany) and fine green tea (Meßmer Tee GmbH, Seevetal, Germany). The total C and N content, and the corresponding C:N ratio of each material, are shown in Table 1. All organic materials were ground and sieved to 1 mm and placed into a 2.5 cm × 3.5 cm nylon mesh bag (30 μm pore size). The hemp stem and wheat straw have a lower density, making them relatively larger, and therefore, to ensure the same size of the nylon bags, 200 mg of these two materials was added, and 300 mg of others was added, respectively.

2.3. Experimental Setup

The experimental treatments were first divided into six groups, five of which were each amended with one type of organic material, and the remaining group, without organic material, served as the control group. Each group was subsequently treated with different concentrations of PFBS (0, 1, and 10 µg g–1), and ten replicates were used for each treatment. The lower concentration was set with environmental relevance in mind, and the higher concentration aimed to simulate the near-future scenario of PFBS contamination (twice the currently-recorded highest concentration) [16], given its continuous use and persistence in the environment. It should be noted that nominal concentrations of PFBS in soils were added in this study, and the actual concentration was not measured.
The experimental microcosm was set up in line with the previous study, in which the significant effect of PFBS treatments was recorded [21]. The PFBS solution was prepared using sterilized deionized water, and 100 μL of the solution was added to 5 g of sterilized loaded soil, which excluded excessive impacts on the soil communities [28]. Subsequently, another 35 g of soil was added and mixed thoroughly with the loading soil. The well-mixed 40 g soil was then transferred to a 50-mL mini-bioreactor tube (Corning Inc., Corning, NY, USA) with vented lids, in the middle of which a litter bag was placed. Deionized water was added to each tube until reaching a 60% soil water holding capacity (WHC). All tubes were incubated at 20 °C for 6 weeks in a randomized manner and watered every week to maintain soil moisture.

2.4. Measurements

Both during and at the end of the experiment, the following parameters were measured: soil respiration, litter decomposition, enzyme activities, soil pH, water-stable aggregates (WSA), and total C and N contents. After 6 weeks of incubation, the soil and litter bags were removed from the tubes. Litter bags were dried in the oven at 60 °C, and the litter decomposition was obtained by calculating the reduction of litter mass from its initial weight. Soil respiration was measured every 3 weeks using an infrared gas analyzer (LI-6400XT, LI-COR Inc., Bad Homburg, Germany). Soil pH was determined by shaking 5× g of soil with 25 mL of deionized water thoroughly, centrifuging, and then measuring the pH of the supernatant with a pH meter (Hanna Instruments, Smithfield, VA, USA). Enzyme activities of the soil were measured, including β-1,4-N-acetyl-glucosaminidase (NAG), β-D-1,4-cellobiosidase, β-glucosidase, and phosphatase according to a previously established approach with the use of artificial p-nitrophenyl linked substrates [29]. Water-stable aggregates were measured with the use of a wet-sieving machine (Eijkelkamp, Giesbeek, The Netherlands), following the procedures of previous studies [30,31]. Total C and N contents in the soil were determined by a Euro EA analyzer (HEKAtech GmbH, Wegberg, Germany). For detailed protocols, please refer to the previous study [27].

2.5. Data Analysis

Data were analyzed with R (R Core Team, 2022). The data were compared from three perspectives, the first aiming to show the response of each parameter to different PFBS concentrations within the litter type; the second to show the response of each parameter to PFBS concentrations regardless of litter type; and the third to show the differences between litter types regardless of PFBS concentrations. The R package ‘dabestr’ was used to achieve these comparisons by calculating the 95% confidence interval (CI) of unpaired mean differences [32]. This method was able to precisely illustrate the differences between the test group and the control group. To compare the differences between each treatment and the control, a one-way ANOVA with a post-hoc Tukey’s HSD Test (using the R package ‘multcomp’) was performed with the null hypothesis that the results would be no different between the treatment and control group [33]. All t-plots were constructed using the ‘ggplot2′ package in R [34]. Moreover, Spearman correlations between all parameters were calculated with the use of the R package ‘corrplot’ [35], and the plot is presented in Figure S1 (see the Supporting Information).

3. Results and Discussion

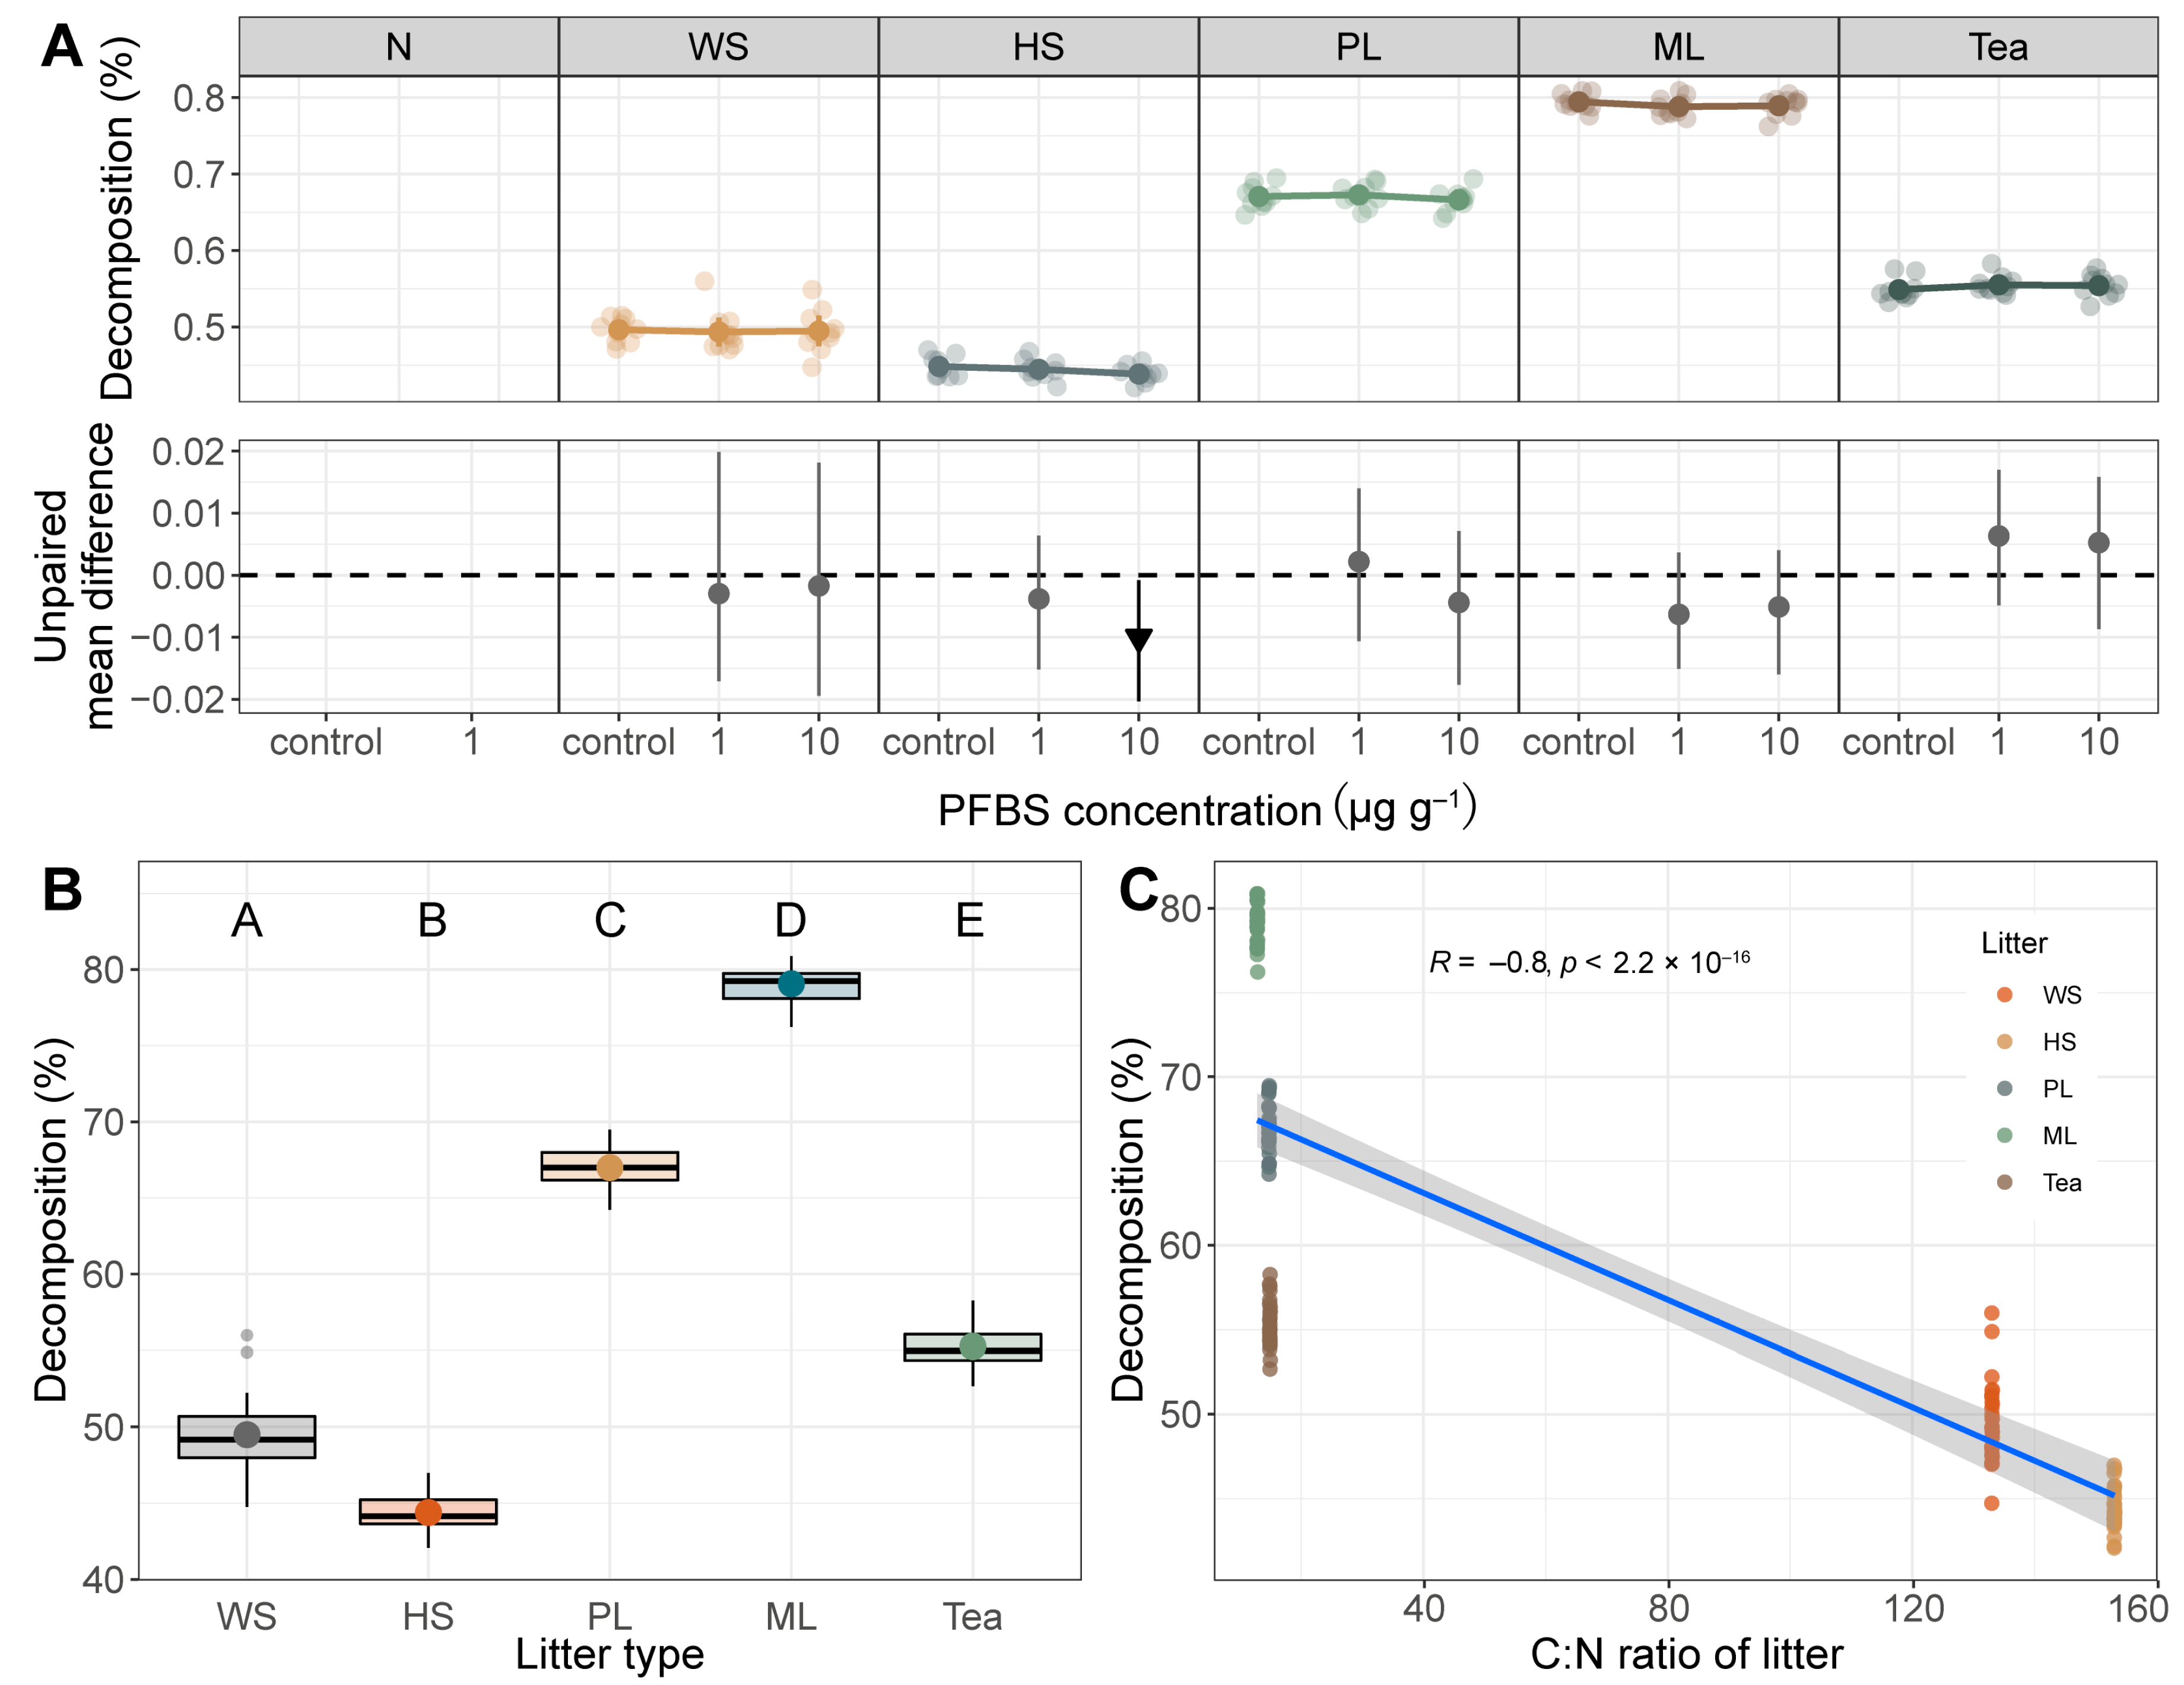
3.1. Litter Decomposition

Figure 1a shows the effect of PFBS and litter type on the litter decomposition. The addition of PFBS had little influence on the litter decomposition, regardless of the litter type. It was only observed that PFBS at 10 µg g−1 negatively affected the litter decomposition of hemp stem with the effect size of −1.0% (95% CI: −2.0% – −0.08%). In a previous study, PFBS significantly increased the litter decomposition with even lower concentrations, and the contrasting results were possibly related to the soil properties, such as the lower soil C content (0.64% vs. 2.04%) [21], which might have shaped the microbial abundance and community [36,37], and thus further altered the response of microbially-driven litter decomposition to PFBS treatments. Even though both perfluorobutanesulfonic acid (pKa = −3.31) and PFOS (pKa = −3.27) are strong acids added in soils, only perfluorobutanesulfonic acid affected litter decomposition, and hence it is assumed that the effect of PFBS might be dependent on soil properties, rather than the acidity of PFBS, as in the previous study [21].
The litter decomposition of different types of organic materials differed, as expected, following the order Medicago lupulina (79.1%) > Plantago lanceolata (67.0%) > green tea (55.3%) > wheat straw (49.5%) > hemp stem (44.4%) (Figure 1b). The litter decomposition was inversely proportional to the C content (R = –0.74, p < 0.001, Figure S2a) and the C:N ratio of organic materials (R = –0.81, p < 0.001, Figure 1c), and positively correlated with the N content of organic materials (R = 0.75, p < 0.001, Figure S2b). Higher N contents indicated higher nutrition supply and thus higher litter decomposition [22], and the low decomposition of WS and HS may be due to the fact that both wheat straw and hemp stems were rich in lignin, as previous studies suggested [38,39].

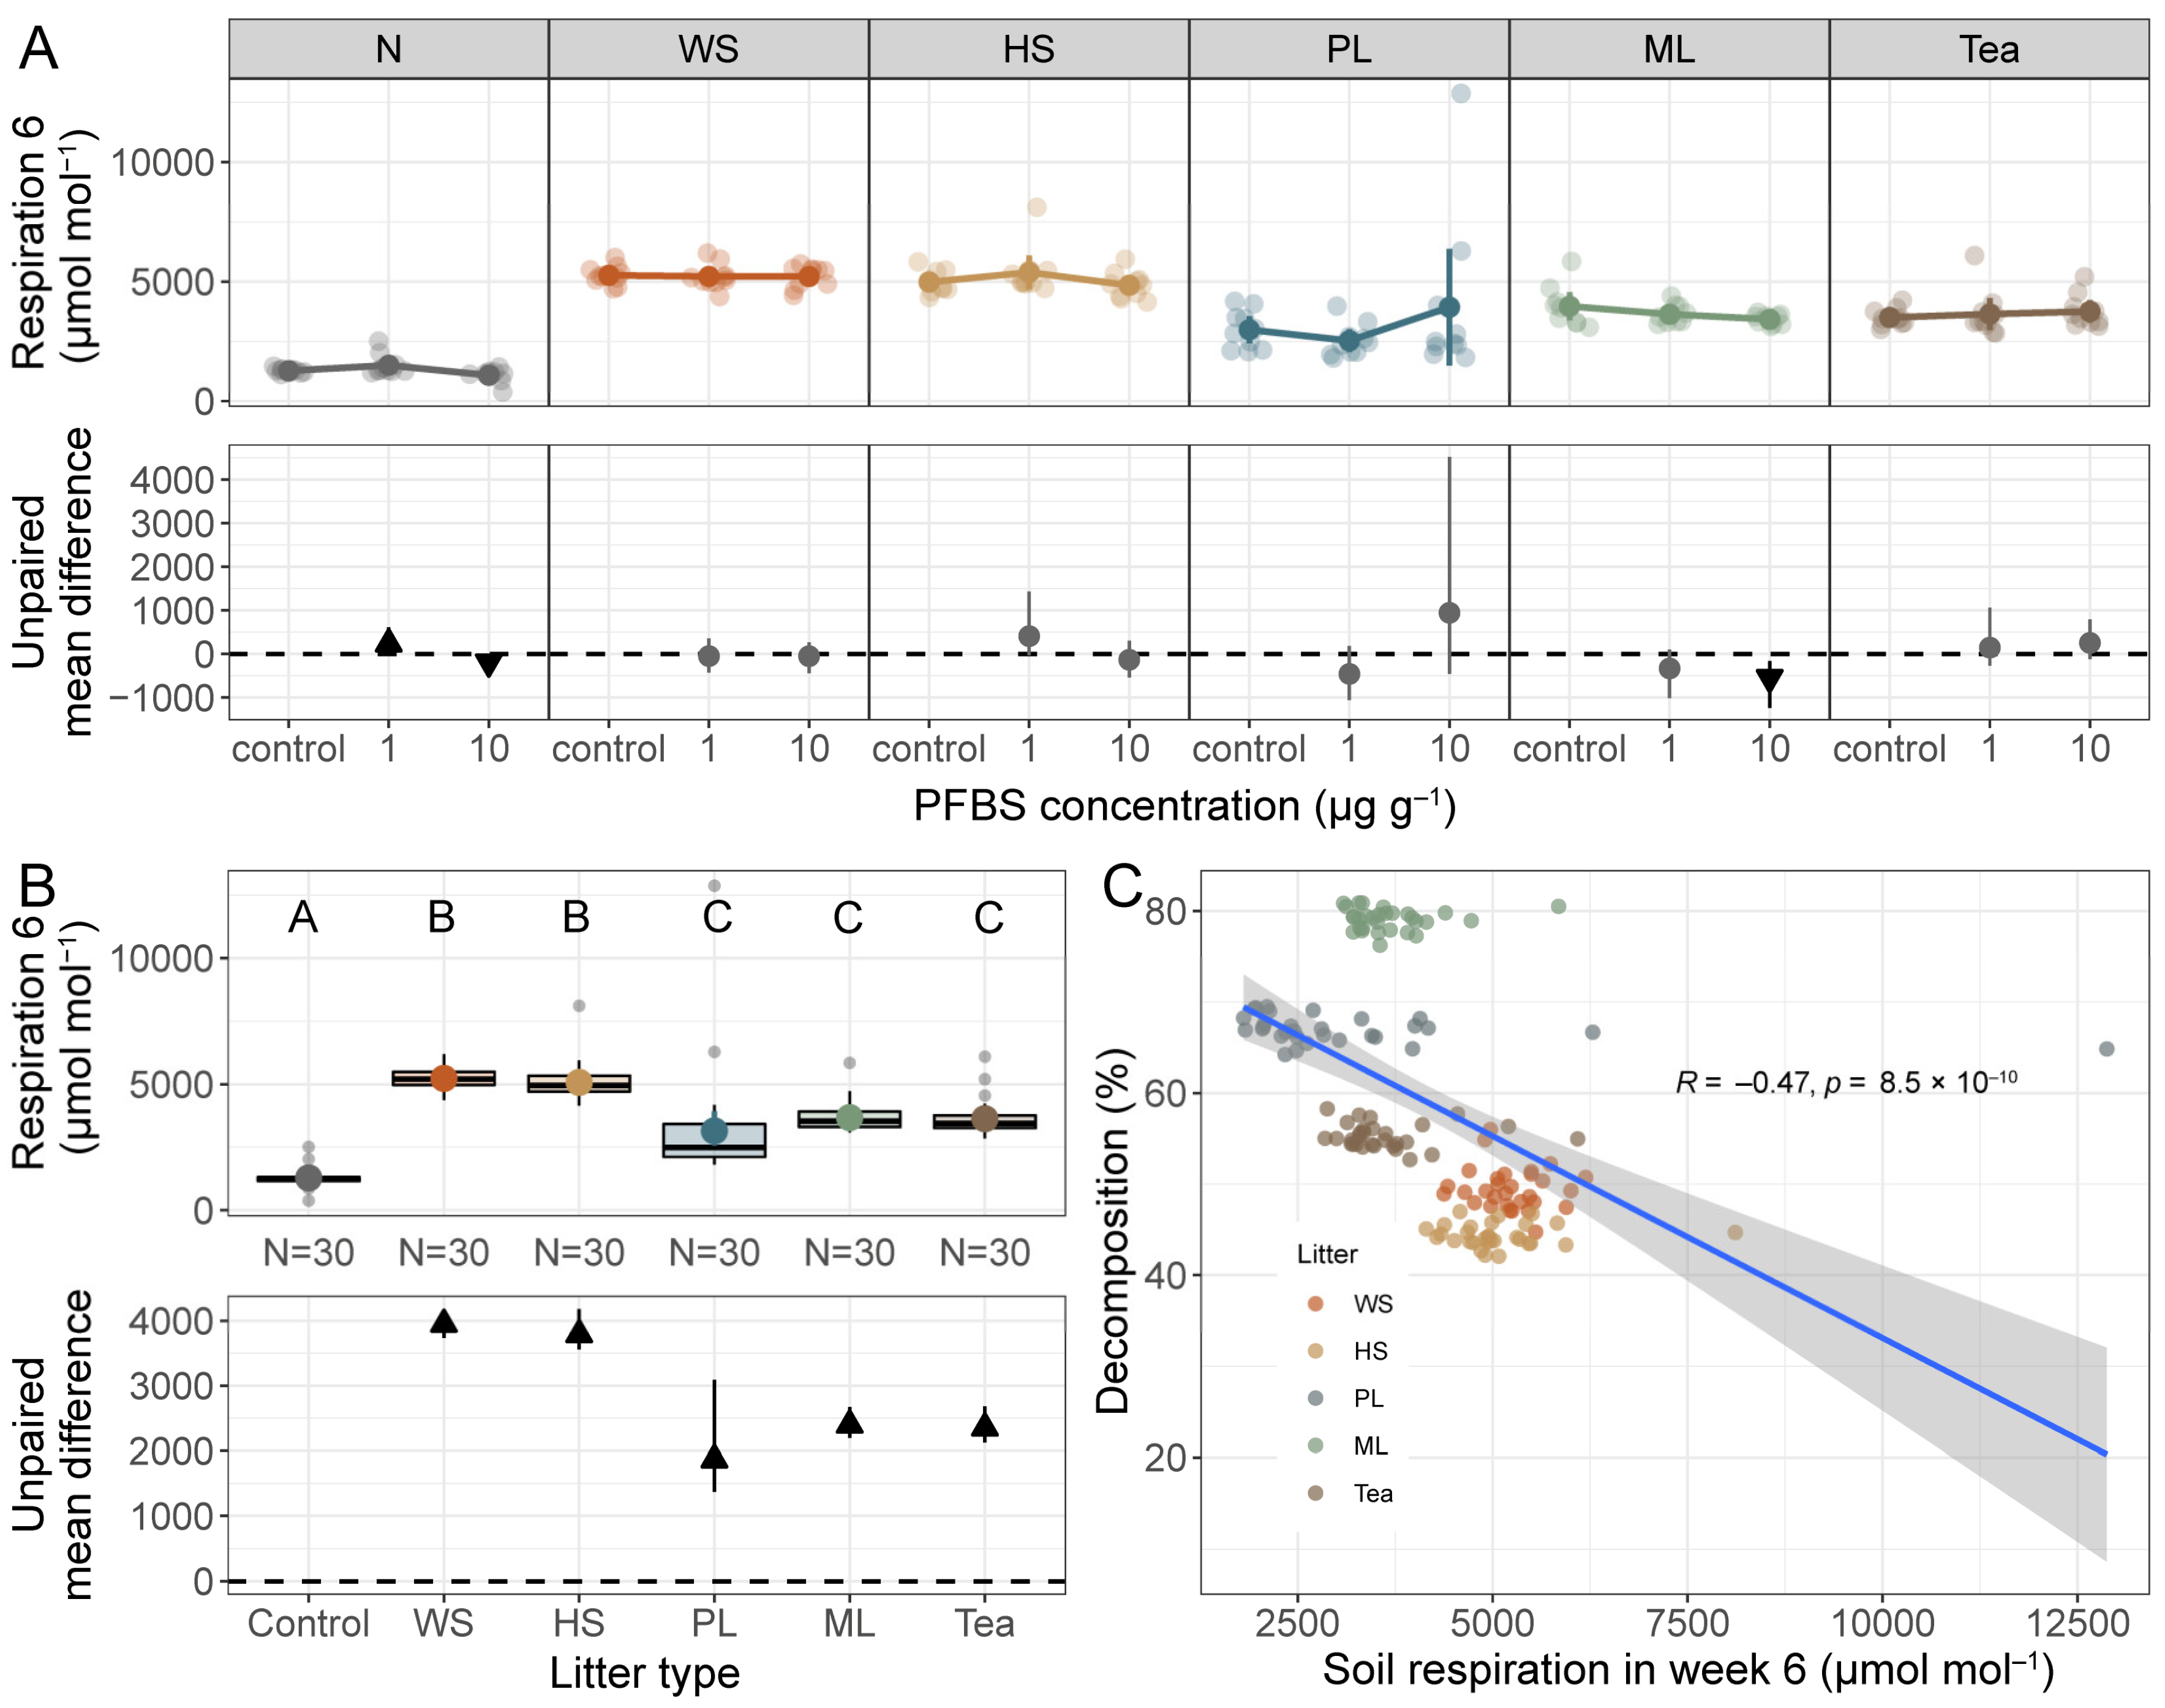
3.2. Soil Respiration

The results of soil respiration at week 3 and week 6 are displayed in Figure S3 and Figure 2, respectively. The results showed that there were no effects of PFBS on soil respiration. The addition of organic materials significantly increased soil respiration, the intensity of which varies with different types of organic litter. Soil samples containing hemp stem had the highest CO2 release in week 3, while soil with added Plantago lanceolata had the lowest CO2 production. In week 6, soils with hemp stem and wheat straw had higher CO2 production compared to soils containing the other three organic materials. Furthermore, the intensity of soil respiration declined from the third week to the last week. Interestingly, it was observed that there was a significantly negative correlation between litter decomposition and soil respiration in both week 3 (R = −0.41, p < 0.001) and week 6 (R = −0.47, p < 0.001), which is in line with the previous study [21].
The litter decomposition lead to two processes, i.e., CO2 release and the leaching of C- and N-containing compounds [40]. Organic materials, as a crucial carbon source in the microcosm, significantly increased soil respiration in terms of CO2 production. Nevertheless, the non-positive correlation between soil respiration and litter decomposition indicated that more C was probably leached out in the form of C-containing organic compounds for three organic materials with lower C:N ratios [40], based on the principle of mass conservation in this soil microcosm. However, the leaching of more C-containing compounds needs confirmation in future research.

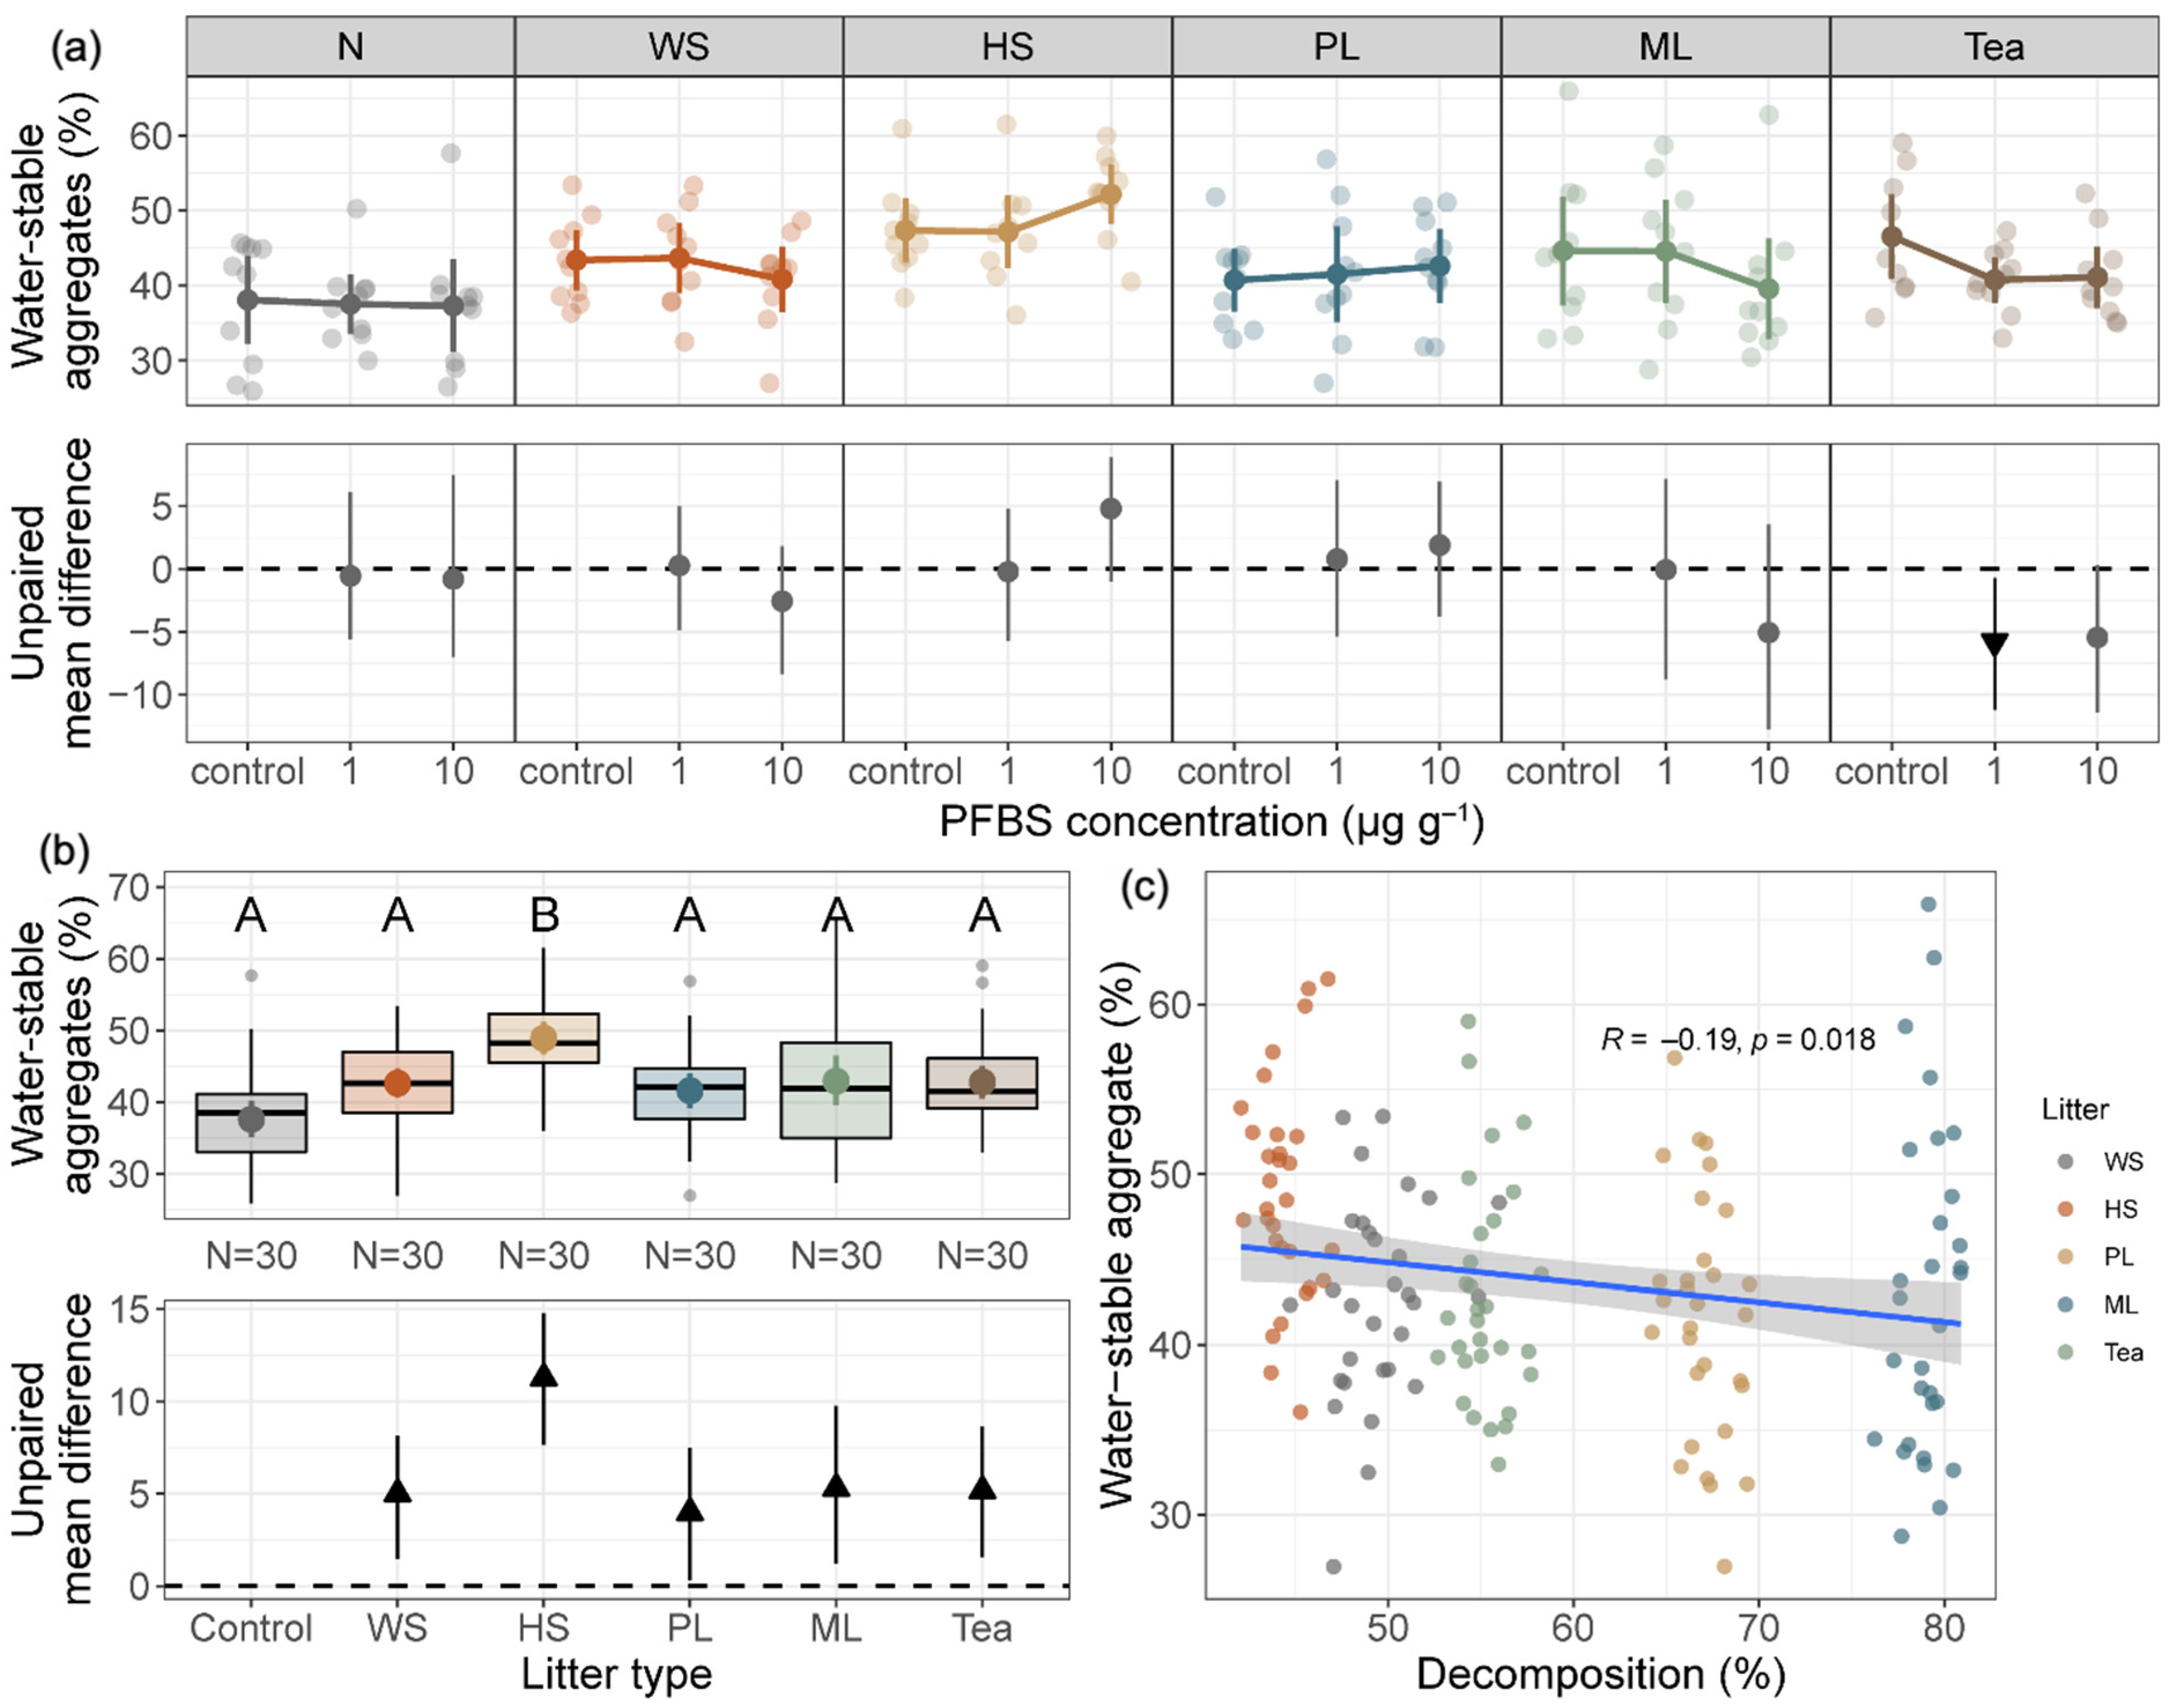
3.3. Soil Water-Stable Aggregates

Regardless of the litter type, the PFBS at the two tested levels seemed not to affect soil water-stable aggregates (Figure 3). The litter bag containing hemp stem significantly increased the proportion of water-stable aggregates in spite of the PFBS concentration (p < 0.05), with an effect size of 11.3% (95% CI: 7.65%–14.8%) (Figure 3b). However, the soil water-stable aggregate was significantly negatively correlated with litter decomposition (R = −0.19, p = 0.018, Figure 3c). As mentioned above, soil microcosms with hemp stem showed the lowest decomposition but had the highest proportion of water-stable aggregates. This means that the increased litter decomposition in soil may not directly enhance the formation of aggregates in the tested microcosms. In fact, only soil total C was measured in this study, and more specific measurements may provide insight into this observation, such as carbohydrate, organic C, and microbial biomass C [41,42,43]. Previous research has suggested that WSA was dependent on organic materials [44], and a lower C:N ratio and a higher level of C input may both lead to less WSA formation [45,46].
Previous research has suggested that WSA was dependent on organic materials [44]. Le Guillou et al. compared the WSA of two litters with different C:N ratios under different N inputs. Their results illustrated that WSA would be higher for litters with higher C:N ratios, especially when the N content of the soil was low [45]. This may be one of the reasons why the soil microcosms with hemp stem were observed to have the highest proportion of WSA. Another study also suggested that the higher the level of C input, the less incorporation of C with aggregates, which eventually led to less WSA formation [46].

3.4. Soil pH

In the form of K ionic salts (potassium perfluorobutane sulfonate), PFBS treatments would not directly change soil pH regardless of litter types (Figure 4a,b). Soil pH, however, was significantly affected by litter decomposition, and the effect was dependent on the litter type (Figure 4c). Specifically, soil pH was increased by 0.36 units (95% CI: 0.31–0.39) by the addition of wheat straw (p < 0.001), by 0.48 units (95% CI: 0.43–0.51) by hemp stem (p < 0.001), and by 0.23 units (95% CI: 0.18–0.27) by Plantago lanceolate (p < 0.001), while it was significantly decreased by 0.17 units (95% CI: 0.13–0.22) by the addition of Medicago lupulina (p < 0.001), and by 0.20 units (95% CI: 0.16–0.26) by green tea (p < 0.001). In addition, soil pH was negatively correlated to litter decomposition in the test microcosm (R = −0.73, p < 0.001, Figure S1).
The return of plant residues has been indicated to change soil pH, and the direction and extent largely depended on both the characteristics of plant materials and the initial soil pH [47]. Previous studies have shown that adding plant materials could increase soil pH to various extents, and the association of organic anions in plant residues and the further release of alkaline cations by ammonification of the residue N were considered to be the main reason for the increase in soil pH [48,49]. The specific composition of tested organic materials was not comprehensively measured, since the aim here was to test the impact of PFBS on various soil processes and properties, but it was supposed that this well-accepted mechanism can be applicable to current test microcosms to explain the increase in soil pH by certain litter types. In the scenario of the decrease in soil pH by adding organic materials, it was reported that when the soil initial pH (6.67 in this study) was higher than the pKa value of the weak acid group (e.g., the mean pKa of 4.5 for carboxyl functional groups), there would be a decrease in soil pH because of the dissociation of H+ from the organic anions [47].

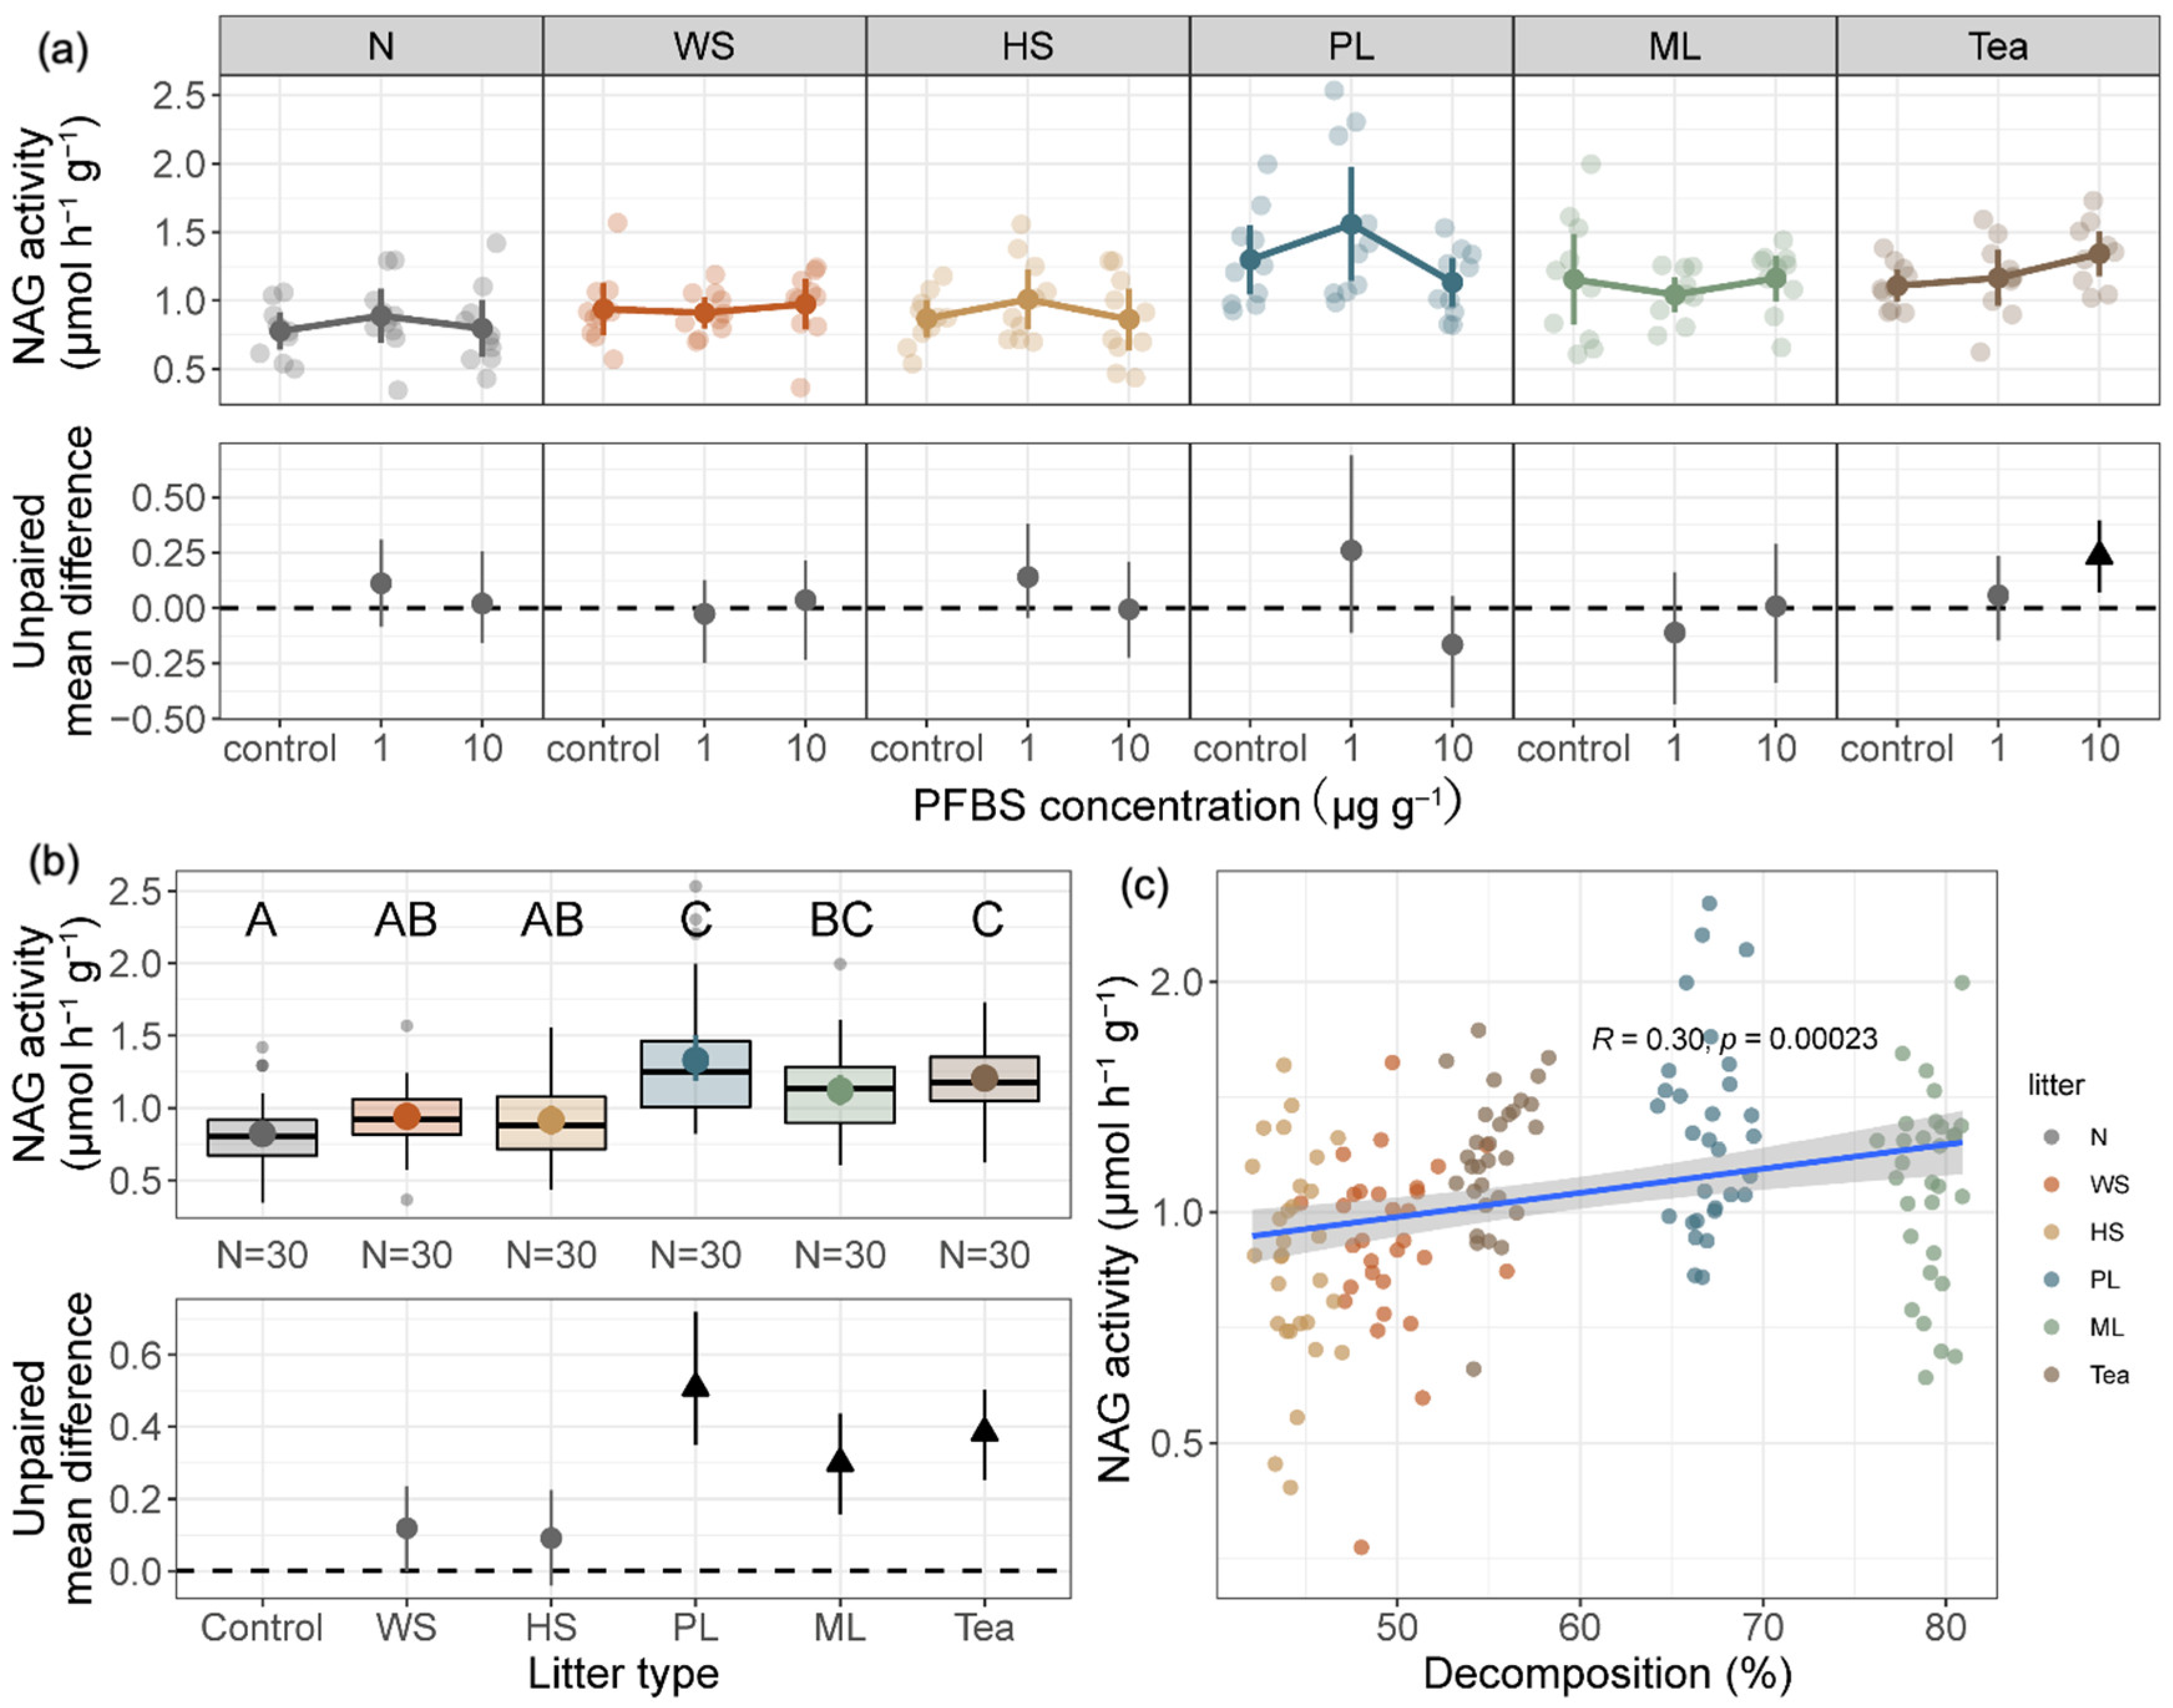
3.5. Enzyme Activities

The activities of NAG, β-D-1,4-cellobiosidase, β-glucosidase, and phosphatase appeared to be minimally influenced by the addition of PFBS and organic materials (Figure 5a and Figure S4–S6). The addition of certain organic materials (i.e., Plantago lanceolate, Medicago lupulina, and green tea) significantly increased NAG activity (p < 0.05), and there was no significant difference in NAG activity among these three litters (Figure 5b). Moreover, there was a significantly positive correlation of NAG activity with the litter decomposition (R = 0.30, p = 0.00023, Figure 5c). Previous studies have also demonstrated that the addition of PFAS with various chain lengths did not influence the activities of these four enzymes [21,27], and the negligible effect of PFBS on soil sucrase activity was also reported by another study [50]. Exogenous organic materials acted as the main N suppliers, and NAG activity can be stimulated by N input [51].

3.6. No Detectable Overall Impact of PFBS on Soil Processes

With the extensive application and further environmental ubiquity of short-chain PFAS as an alternative to restricted long-chain PFAS, the environmental risk of these short-chain PFAS has been largely overlooked within the terrestrial ecosystems [52]. This study reported no detectable effect of PFBS on litter decomposition and associated soil processes and properties in this test system. Some of the explanations, limitations, and future perspectives are discussed below.
Because of the shorter chain and less hydrophobicity, PFBS has a much lower sorption affinity to soil than PFOS [53], and it is also less bioaccumulative in soil organisms [11,54], which might make a difference in their impact on soil ecosystems. A previous study has demonstrated that short-chain PFBS was less toxic than long-chain PFOS to soil microorganisms, and the IC50 (the PFAS concentration that produced the 50% inhibitory of microbial activity) was estimated to be as high as at least 3000 µg g–1, which was much higher than the test level in the present study [55]. Qiao et al. [18] also suggested that long-chain PFAS exerted more remarkable effects on soil bacterial communities and functions than short-chain ones. As for the toxicity to soil microbes, two orders of magnitude higher concentrations of PFBS were needed to achieve comparatively negative effects on the reproduction of the model soil-dwelling organism Caenorhabditis elegans, and the PFBS concentration with significant effects was as high as 1000 µM (equivalent to 300 µg g–1) [20]. Therefore, the relatively low but realistic concentration of PFBS used in this study may have led to the lack of detectable effects in the soil microcosm.
Nevertheless, it cannot be concluded that PFBS is harmless to soil ecosystems based on the findings of this study alone. It should be noted that a significant effect of PFBS in another type of soil, such as its respiration and litter composition, was indeed observed previously, in which the experimental microcosm was very similar to this study [21]. The contrasting result might be attributed to different soil properties. Since the soil pH (neutral) and texture (sandy loam) of both soils were comparable, soil C content (0.64% vs. 2.04%), which regulated soil microbial abundance and community to alter the response of microbial processes (e.g., respiration and litter decomposition), might explain the contrasting response of the two soils to PFBS treatments, as discussed above. However, it can be arbitrary to conclude which soil property would be the main contributor to affect the response to PFBS and other PFAS members in general. Clearly, the effect of short-chain PFBS and other PFAS should be tested within a wider range of soil properties and PFAS levels.

Supplementary Materials

The following supporting information can be downloaded at: https://www.mdpi.com/article/10.3390/soilsystems7010013/s1, Figure S1: Spearman correlations among soil properties and functions. Figure S2 (a) Correlation of litter C content and litter decomposition. (b) Correlation of litter N content and litter decomposition. Figure S3: (a) Response of soil respiration (week 3) to PFBS concentrations within litter type. (b) Response of soil respiration (week 3) to litter type regardless of PFBS concentrations. (c) Correlation of soil respiration (week 3) and litter decomposition. Figure S4: (a) Response of β-glucosidase activity to PFBS concentrations within litter type. (b) Response of β-glucosidase activity to PFBS concentrations regardless of litter type. (c) Response of β-glucosidase activity to litter type regardless of PFBS concentrations. Figure S5: (a) Response of β-D-1,4-cellobiosidase activity to PFBS concentrations within litter type. (b) Response of β-D-1,4-cellobiosidase activity to PFBS concentrations regardless of litter type. (c) Response of β-D-1,4-cellobiosidase activity to litter type regardless of PFBS concentrations. Figure S6: (a) Response of phosphatase activity to PFBS concentrations within litter type. (b) Response of phosphatase activity to PFBS concentrations regardless of litter type. (c) Response of phosphatase activity to litter type regardless of PFBS concentrations.

Author Contributions

All authors contributed to the conception and design. Q.X., M.C.R. and B.X. conducted experiment and analyzed data. Q.X. drafted the manuscript. All authors have read and agreed to the published version of the manuscript.

Funding

This research was funded by the Rising Star Fellowship of Freie Universität Berlin. The publication of this article was funded by Freie Universität Berlin.

Institutional Review Board Statement

Not applicable.

Informed Consent Statement

Not applicable.

Data Availability Statement

All produced data in this study are available at https://doi.org/10.6084/m9.figshare.21708071.v1 (accessed on 11 December 2022).

Acknowledgments

We appreciate Huiying Li and Yanjie Zhu for their help in the lab.

Conflicts of Interest

The authors declare that they have no conflict of interest.

References

  1. Kissa, E. Fluorinated Surfactants and Repellents, 2nd ed.; CRC Press: Boca Raton, FL, USA, 2001; ISBN 978-0-8247-0472-8. [Google Scholar]
  2. Banks, R.E.; Smart, B.E.; Tatlow, J.C. (Eds.) Organofluorine Chemistry; Springer: Boston, MA, USA, 1994; ISBN 978-1-4899-1204-6. [Google Scholar]
  3. Barzen-Hanson, K.A.; Roberts, S.C.; Choyke, S.; Oetjen, K.; McAlees, A.; Riddell, N.; McCrindle, R.; Ferguson, P.L.; Higgins, C.P.; Field, J.A. Discovery of 40 Classes of Per- and Polyfluoroalkyl Substances in Historical Aqueous Film-Forming Foams (AFFFs) and AFFF-Impacted Groundwater. Environ. Sci. Technol. 2017, 51, 2047–2057. [Google Scholar] [CrossRef] [PubMed]
  4. Xia, C.; Diamond, M.L.; Peaslee, G.F.; Peng, H.; Blum, A.; Wang, Z.; Shalin, A.; Whitehead, H.D.; Green, M.; Schwartz-Narbonne, H.; et al. Per- and Polyfluoroalkyl Substances in North American School Uniforms. Environ. Sci. Technol. 2022, 56, 13845–13857. [Google Scholar] [CrossRef] [PubMed]
  5. Schaider, L.A.; Balan, S.A.; Blum, A.; Andrews, D.Q.; Strynar, M.J.; Dickinson, M.E.; Lunderberg, D.M.; Lang, J.R.; Peaslee, G.F. Fluorinated Compounds in U.S. Fast Food Packaging. Environ. Sci. Technol. Lett. 2017, 4, 105–111. [Google Scholar] [CrossRef]
  6. Cousins, I.T.; Johansson, J.H.; Salter, M.E.; Sha, B.; Scheringer, M. Outside the Safe Operating Space of a New Planetary Boundary for Per- and Polyfluoroalkyl Substances (PFAS). Environ. Sci. Technol. 2022, 56, 11172–11179. [Google Scholar] [CrossRef] [PubMed]
  7. US EPA. Long-Chain Perfluorinated Chemicals (PFCs) Action Plan Summary; US EPA: Washington, DC, USA, 2013; p. 24.
  8. Houde, M.; Martin, J.W.; Letcher, R.J.; Solomon, K.R.; Muir, D.C.G. Biological Monitoring of Polyfluoroalkyl Substances: A Review. Environ. Sci. Technol. 2006, 40, 3463–3473. [Google Scholar] [CrossRef] [PubMed]
  9. Fenton, S.E.; Ducatman, A.; Boobis, A.; DeWitt, J.C.; Lau, C.; Ng, C.; Smith, J.S.; Roberts, S.M. Per- and Polyfluoroalkyl Substance Toxicity and Human Health Review: Current State of Knowledge and Strategies for Informing Future Research. Environ. Toxicol. Chem. 2021, 40, 606–630. [Google Scholar] [CrossRef] [PubMed]
  10. UNEP. Stockholm Convention on Persistent Organic Pollutants (POPS)-Texts and Annexes; United Nations Environment Programme (UNEP): Nairobi, Kenya, 2019. [Google Scholar]
  11. Chowdhury, M.I.; Sana, T.; Panneerselvan, L.; Dharmarajan, R.; Megharaj, M. Acute Toxicity and Transgenerational Effects of Perfluorobutane Sulfonate on Caenorhabditis Elegans. Environ. Toxicol. Chem. 2021, 40, 1971–1980. [Google Scholar] [CrossRef] [PubMed]
  12. Podder, A.; Sadmani, A.H.M.A.; Reinhart, D.; Chang, N.-B.; Goel, R. Per and Poly-Fluoroalkyl Substances (PFAS) as a Contaminant of Emerging Concern in Surface Water: A Transboundary Review of Their Occurrences and Toxicity Effects. J. Hazard. Mater. 2021, 419, 126361. [Google Scholar] [CrossRef]
  13. Ahmed, M.B.B.; Johir, M.A.H.A.H.H.; McLaughlan, R.; Nguyen, L.N.; Xu, B.; Nghiem, L.D. Per- and Polyfluoroalkyl Substances in Soil and Sediments: Occurrence, Fate, Remediation and Future Outlook. Sci. Total Environ. 2020, 748, 141251. [Google Scholar] [CrossRef]
  14. Bao, J.; Yu, W.-J.; Liu, Y.; Wang, X.; Jin, Y.-H.; Dong, G.-H. Perfluoroalkyl Substances in Groundwater and Home-Produced Vegetables and Eggs around a Fluorochemical Industrial Park in China. Ecotoxicol. Environ. Saf. 2019, 171, 199–205. [Google Scholar] [CrossRef]
  15. Cui, D.; Li, X.; Quinete, N. Occurrence, Fate, Sources and Toxicity of PFAS: What We Know So Far in Florida and Major Gaps. TrAC Trends Anal. Chem. 2020, 130, 115976. [Google Scholar] [CrossRef]
  16. Brusseau, M.L.; Anderson, R.H.; Guo, B. PFAS Concentrations in Soils: Background Levels versus Contaminated Sites. Sci. Total Environ. 2020, 740, 140017. [Google Scholar] [CrossRef] [PubMed]
  17. Yeates, G.W.; Coleman, D.C. Role of Nematodes in Decomposition. In Role of Nematodes in Decomposition; University of Texas Press: Austin, TX, USA, 2021; pp. 55–80. ISBN 978-1-4773-0195-1. [Google Scholar]
  18. Qiao, W.; Xie, Z.; Zhang, Y.; Liu, X.; Xie, S.; Huang, J.; Yu, L. Perfluoroalkyl Substances (PFASs) Influence the Structure and Function of Soil Bacterial Community: Greenhouse Experiment. Sci. Total Environ. 2018, 642, 1118–1126. [Google Scholar] [CrossRef] [PubMed]
  19. Chen, F.; Wei, C.; Chen, Q.; Zhang, J.; Wang, L.; Zhou, Z.; Chen, M.; Liang, Y. Internal Concentrations of Perfluorobutane Sulfonate (PFBS) Comparable to Those of Perfluorooctane Sulfonate (PFOS) Induce Reproductive Toxicity in Caenorhabditis Elegans. Ecotoxicol. Environ. Saf. 2018, 158, 223–229. [Google Scholar] [CrossRef] [PubMed]
  20. Yue, Y.; Li, S.; Qian, Z.; Pereira, R.F.; Lee, J.; Doherty, J.J.; Zhang, Z.; Peng, Y.; Clark, J.M.; Timme-Laragy, A.R.; et al. Perfluorooctanesulfonic Acid (PFOS) and Perfluorobutanesulfonic Acid (PFBS) Impaired Reproduction and Altered Offspring Physiological Functions in Caenorhabditis Elegans. Food Chem. Toxicol. 2020, 145, 111695. [Google Scholar] [CrossRef]
  21. Xu, B.; Yang, G.; Lehmann, A.; Riedel, S.; Rillig, M.C. Effects of Perfluoroalkyl and Polyfluoroalkyl Substances (PFAS) on Soil Structure and Function. Soil Ecol. Lett. 2022, 5, 108–117. [Google Scholar] [CrossRef]
  22. Berg, B.; McClaugherty, C. Plant Litter: Decomposition, Humus Formation, Carbon Sequestration; Springer International Publishing: Cham, Switzerland, 2020; ISBN 978-3-030-59630-9 978-3-030-59631-6. [Google Scholar]
  23. Prescott, C.E. Litter Decomposition: What Controls It and How Can We Alter It to Sequester More Carbon in Forest Soils? Biogeochemistry 2010, 101, 133–149. [Google Scholar] [CrossRef]
  24. Paul, E.A.; Clark, F.E. Soil Microbiology and Biochemistry; Academic Press: Cambridge, MA, USA, 1989; ISBN 978-0-12-546805-3. [Google Scholar]
  25. Sinsabaugh, R.L.; Antibus, R.K.; Linkins, A.E. An Enzymic Approach to the Analysis of Microbial Activity during Plant Litter Decomposition. Agric. Ecosyst. Environ. 1991, 34, 43–54. [Google Scholar] [CrossRef]
  26. Williams, M.A. Perfluorobutane Sulfonate (PFBS). In Understanding Risk to Wildlife from Exposures to Per-and Polyfluorinated Alkyl Substances (PFAS); CRC Press: Boca Raton, FL, USA, 2021; pp. 111–124. ISBN 1-00-316247-9. [Google Scholar]
  27. Xu, B.; Alizray, R.; Lammel, D.R.; Riedel, S.; Rillig, M.C. Concentration-Dependent Response of Soil Parameters and Functions to Trifluoroacetic Acid. Eur. J. Soil Sci. 2022, 73, e13266. [Google Scholar] [CrossRef]
  28. Rillig, M.C.; Ryo, M.; Lehmann, A.; Aguilar-Trigueros, C.A.; Buchert, S.; Wulf, A.; Iwasaki, A.; Roy, J.; Yang, G. The Role of Multiple Global Change Factors in Driving Soil Functions and Microbial Biodiversity. Science 2019, 366, 886–890. [Google Scholar] [CrossRef]
  29. Jackson, C.R.; Tyler, H.L.; Millar, J.J. Determination of Microbial Extracellular Enzyme Activity in Waters, Soils, and Sediments using High Throughput Microplate Assays. JoVE 2013, 80, e50399. [Google Scholar] [CrossRef]
  30. Kemper, W.D.; Rosenau, R.C. Aggregate Stability and Size Distribution. Methods Soil Anal. Part 1 Phys. Mineral. Methods 2018, 5, 425–442. [Google Scholar] [CrossRef]
  31. Liang, Y.; Lehmann, A.; Ballhausen, M.-B.B.; Muller, L.; Rillig, M.C. Increasing Temperature and Microplastic Fibers Jointly Influence Soil Aggregation by Saprobic Fungi. Front. Microbiol. 2019, 10, 2018. [Google Scholar] [CrossRef] [PubMed]
  32. Ho, J.; Tumkaya, T.; Aryal, S.; Choi, H.; Claridge-Chang, A. Moving beyond P Values: Data Analysis with Estimation Graphics. Nat. Methods 2019, 16, 565–566. [Google Scholar] [CrossRef]
  33. Hothorn, T.; Bretz, F.; Westfall, P. Simultaneous Inference in General Parametric Models. Biom. J. 2008, 50, 346–363. [Google Scholar] [CrossRef]
  34. Wickham, H.; Chang, W. An Implementation of the Grammar of Graphics. Available online: https://github.com/hadley/ggplot2 (accessed on 16 November 2022).
  35. Wei, T.; Simko, V.; Levy, M.; Xie, Y.; Jin, Y.; Zemla, J. Visualization of a Correlation Matrix. Available online: https://github.com/taiyun/corrplot (accessed on 16 November 2022).
  36. Hu, Y.; Xiang, D.; Veresoglou, S.D.; Chen, F.; Chen, Y.; Hao, Z.; Zhang, X.; Chen, B. Soil Organic Carbon and Soil Structure Are Driving Microbial Abundance and Community Composition across the Arid and Semi-Arid Grasslands in Northern China. Soil Biol. Biochem. 2014, 77, 51–57. [Google Scholar] [CrossRef]
  37. Xu, Z.; Zhang, T.; Wang, S.; Wang, Z. Soil PH and C/N Ratio Determines Spatial Variations in Soil Microbial Communities and Enzymatic Activities of the Agricultural Ecosystems in Northeast China: Jilin Province Case. Appl. Soil Ecol. 2020, 155, 103629. [Google Scholar] [CrossRef]
  38. Jung, H.J.G.; Himmelsbach, D.S. Isolation and Characterization of Wheat Straw Lignin. J. Agric. Food Chem. 1989, 37, 81–87. [Google Scholar] [CrossRef]
  39. Crônier, D.; Monties, B.; Chabbert, B. Structure and Chemical Composition of Bast Fibers Isolated from Developing Hemp Stem. J. Agric. Food Chem. 2005, 53, 8279–8289. [Google Scholar] [CrossRef]
  40. Berg, B.; McClaugherty, C.; Berg, B.; McClaugherty, C. Decomposition as a Process—Some Main Features. Plant Litter Decompos. Humus Form. Carbon Sequestration 2020, 13–43. [Google Scholar]
  41. Martins, M.d.R.; Angers, D.A.; Corá, J.E. Carbohydrate Composition and Water-Stable Aggregation of an Oxisol as Affected by Crop Sequence under No-Till. Soil Sci. Soc. Am. J. 2012, 76, 475–484. [Google Scholar] [CrossRef]
  42. Ndzelu, B.S.; Dou, S.; Zhang, X. Corn Straw Return Can Increase Labile Soil Organic Carbon Fractions and Improve Water-Stable Aggregates in Haplic Cambisol. J. Arid Land 2020, 12, 1018–1030. [Google Scholar] [CrossRef]
  43. Kushwaha, C.P.; Tripathi, S.K.; Singh, K.P. Soil Organic Matter and Water-Stable Aggregates under Different Tillage and Residue Conditions in a Tropical Dryland Agroecosystem. Appl. Soil Ecol. 2001, 16, 229–241. [Google Scholar] [CrossRef]
  44. Tisdall, J.M.; Oades, J.M. Organic Matter and Water-Stable Aggregates in Soils. J. Soil Sci. 1982, 33, 141–163. [Google Scholar] [CrossRef]
  45. Le Guillou, C.; Angers, D.A.; Leterme, P.; Menasseri-Aubry, S. Differential and Successive Effects of Residue Quality and Soil Mineral N on Water-Stable Aggregation during Crop Residue Decomposition. Soil Biol. Biochem. 2011, 43, 1955–1960. [Google Scholar] [CrossRef]
  46. Shahbaz, M.; Kuzyakov, Y.; Heitkamp, F. Decrease of Soil Organic Matter Stabilization with Increasing Inputs: Mechanisms and Controls. Geoderma 2017, 304, 76–82. [Google Scholar] [CrossRef]
  47. Tang, C.; Yu, Q. Impact of Chemical Composition of Legume Residues and Initial Soil PH on PH Change of a Soil after Residue Incorporation. Plant Soil 1999, 215, 29–38. [Google Scholar] [CrossRef]
  48. Paul, K.I.; Black, A.S.; Conyers, M.K. Effect of Plant Residue Return on the Development of Surface Soil PH Gradients. Biol. Fertil. Soils 2001, 33, 75–82. [Google Scholar] [CrossRef]
  49. Xu, J.M.; Tang, C.; Chen, Z.L. The Role of Plant Residues in PH Change of Acid Soils Differing in Initial PH. Soil Biol. Biochem. 2006, 38, 709–719. [Google Scholar] [CrossRef]
  50. Lv, M.; Xie, Y.; Yu, H.; Sun, T.; Song, L.; Wang, F. Effects of Perfluoroalkyl Substances on Soil Respiration and Enzymatic Activity: Differences in Carbon Chain-Length Dependence. J. Environ. Sci. Health Part B 2022, 57, 284–296. [Google Scholar] [CrossRef]
  51. Saiya-Cork, K.R.; Sinsabaugh, R.L.; Zak, D.R. The Effects of Long Term Nitrogen Deposition on Extracellular Enzyme Activity in an Acer Saccharum Forest Soil. Soil Biol. Biochem. 2002, 34, 1309–1315. [Google Scholar] [CrossRef]
  52. Ateia, M.; Maroli, A.; Tharayil, N.; Karanfil, T. The Overlooked Short- and Ultrashort-Chain Poly- and Perfluorinated Substances: A Review. Chemosphere 2019, 220, 866–882. [Google Scholar] [CrossRef] [PubMed]
  53. Milinovic, J.; Lacorte, S.; Vidal, M.; Rigol, A. Sorption Behaviour of Perfluoroalkyl Substances in Soils. Sci. Total Environ. 2015, 511, 63–71. [Google Scholar] [CrossRef] [PubMed]
  54. Olsen, G.W.; Chang, S.-C.; Noker, P.E.; Gorman, G.S.; Ehresman, D.J.; Lieder, P.H.; Butenhoff, J.L. A Comparison of the Pharmacokinetics of Perfluorobutanesulfonate (PFBS) in Rats, Monkeys, and Humans. Toxicology 2009, 256, 65–74. [Google Scholar] [CrossRef] [PubMed]
  55. Cai, Y.; Chen, H.; Yuan, R.; Wang, F.; Chen, Z.; Zhou, B. Toxicity of Perfluorinated Compounds to Soil Microbial Activity: Effect of Carbon Chain Length, Functional Group and Soil Properties. Sci. Total Environ. 2019, 690, 1162–1169. [Google Scholar] [CrossRef]
Figure 1. (A) Response of litter decomposition to PFBS concentrations within litter type; (B) Response of litter decomposition to litter type regardless of PFBS concentrations; (C) Correlations of litter decomposition with the C:N ratio of litter. The second row of the panel (A) showed the comparison of the unpaired mean difference between the treated and control group within a 95% confidence interval (CI). The grey spots indicated the neutral effects while the black arrows pointing downwards represented negative effects. Different letters above the boxes in panel (B) indicated statistically significant differences among treatments at p < 0.05. N, no litter; WS, wheat straw; HS, hemp stem; PL, Plantago lanceolate; ML, Medicago lupulina.
Soilsystems 07 00013 g001
Figure 2. (A) Response of soil respiration (week 6) to PFBS treatments within litter type; (B) Response of soil respiration (week 6) to litter type regardless of PFBS concentrations; (C) Correlation of soil respiration (week 6) with litter decomposition. The second row of the panel (A) showed the comparison of the unpaired mean difference between the treated and control group within a 95% confidence interval (CI). The grey spots indicated the neutral effects while the black arrows pointing upwards and downwards represented positive and negative effects, respectively. Different letters above the boxes in panel (B) indicated statistically significant differences among treatments at p < 0.05. N, no litter; WS, wheat straw; HS, hemp stem; PL, Plantago lanceolate; ML, Medicago lupulina.
Soilsystems 07 00013 g002
Figure 3. (a) Response of water-stable aggregates to PFBS treatments within litter type; (b) Response of water-stable aggregates to litter type regardless of PFBS concentrations; (c) Correlation of water-stable aggregates with litter decomposition. The second row of the panel (a) showed the comparison of the unpaired mean difference between the treated and control group within a 95% confidence interval (CI). The grey spots indicated the neutral effects, while the black arrows pointing downwards represented negative effects. Different letters above boxes in panel (b) indicated statistically significant differences among treatments at p < 0.05. N, no litter; WS, wheat straw; HS, hemp stem; PL, Plantago lanceolate; ML, Medicago lupulina.
Soilsystems 07 00013 g003
Figure 4. (A) Response of soil pH to PFBS treatments within litter type; (B) Response of soil pH to PFBS concentrations regardless of litter type; (C) Response of soil pH to litter type regardless of PFBS concentrations. The second row of the panel (A) showed the comparison of the unpaired mean difference between the treated and the control group within a 95% confidence interval (CI), and the grey spots indicated the neutral effects. Different letters above the boxes in panel (C) indicated statistically significant differences among treatments at p < 0.05. N, no litter; WS, wheat straw; HS, hemp stem; PL, Plantago lanceolate; ML, Medicago lupulina.
Soilsystems 07 00013 g004
Figure 5. (a) Response of β-1,4-N-acetyl-glucosaminidase (NAG) activity to PFBS treatments within litter type; (b) Response of NAG activity to litter type regardless of PFBS concentrations; (c) Correlation of NAG activity with litter decomposition. The second row of the panel (a) showed the comparison of the unpaired mean difference between the treated and control group within a 95% confidence interval (CI). The grey spots indicated the neutral effects, while the black arrows pointing upwards represented positive effects. Different letters above the boxes in panel (b) indicated statistically significant differences among treatments at p < 0.05. N, no litter; WS, wheat straw; HS, hemp stem; PL, Plantago lanceolate; ML, Medicago lupulina.
Soilsystems 07 00013 g005
Table 1. The C and N content, and C:N ratios of organic materials.
Litter TypeC:N RatioC (%)N (%)
Medicago lupulina (ML)12.8540.693.16
Plantago lanceolata (PL)14.7636.162.45
Fine green tea (Tea)14.9148.773.29
Wheat straw (WS)133.0345.200.34
Hemp stem (HS)153.0448.970.32
Disclaimer/Publisher’s Note: The statements, opinions and data contained in all publications are solely those of the individual author(s) and contributor(s) and not of MDPI and/or the editor(s). MDPI and/or the editor(s) disclaim responsibility for any injury to people or property resulting from any ideas, methods, instructions or products referred to in the content.

