All articles published by MDPI are made immediately available worldwide under an open access license. No special
permission is required to reuse all or part of the article published by MDPI, including figures and tables. For
articles published under an open access Creative Common CC BY license, any part of the article may be reused without
permission provided that the original article is clearly cited. For more information, please refer to
https://www.mdpi.com/openaccess.
Feature papers represent the most advanced research with significant potential for high impact in the field. A Feature
Paper should be a substantial original Article that involves several techniques or approaches, provides an outlook for
future research directions and describes possible research applications.
Feature papers are submitted upon individual invitation or recommendation by the scientific editors and must receive
positive feedback from the reviewers.
Editor’s Choice articles are based on recommendations by the scientific editors of MDPI journals from around the world.
Editors select a small number of articles recently published in the journal that they believe will be particularly
interesting to readers, or important in the respective research area. The aim is to provide a snapshot of some of the
most exciting work published in the various research areas of the journal.
The study of the high-density equation of state (EOS) and the search for a possible phase transition in dense baryonic matter is the main goal of beam energy scan programs with relativistic heavy ions at energies = 2–5 GeV. The most stringent constraints currently available on the high-density EOS of symmetric nuclear matter come from the present measurements of directed () and elliptic flow () signals of protons in Au + Au collisions. In this energy range, the anisotropic flow is strongly affected by the presence of cold spectators due to the sizable passage time. The system size dependence of anisotropic flow may help to study the participant–spectator contribution and improve our knowledge of the EOS of symmetric nuclear matter. In this work, we discuss the layout of the upgraded BM@N experiment and the anticipated performance for differential anisotropic flow measurements of identified hadrons at Nuclotron energies: = 2.3–3.5 GeV.
In relativistic heavy-ion collisions at center-of-mass energies per pair of colliding nucleons = 2–5 GeV, strongly interacting QCD matter is produced with a net-baryon density 2–5 times larger than the nuclear saturation density and temperatures between 50 and 120 MeV [1,2]. Matter under such conditions is being studied by several beam energy scan experiments: the FXT BES-II program of the STAR experiment at RHIC ( = 3–5.2 GeV) [3], NA61/SHINE at SPS ( = 5.1–17.3 GeV) [4], the BM@N experiment at Nuclotron ( = 2.4–3.5 GeV) [5] and the HADES experiment at SIS-18 ( = 2.4–2.55 GeV) [6]. In the near future, heavy-ion experiments at new accelerator complexes MPD (NICA) at JINR ( = 4–11 GeV) [7], CBM (FAIR) at GSI (2.7–4.9 GeV SIS100) [8], and HIAF at IMP ( = 2–4 GeV) [2] will further explore the phase diagram at the high baryon density region with high statistics data. The main goal is to extract more accurate information on the high-density equation of state (EOS) and search for a possible phase transition in dense baryonic matter. Comparing the observables available from heavy ion collision experiments with theoretical predictions, one can put constraints on the possible EOS of the dense baryonic matter [2]. Experimental studies under these conditions are very important for understanding the properties of the neutron stars and the evolution of the neutron star mergers [9]. The most stringent constraints currently available on the symmetric nuclear matter EOS come from the present measurements of anisotropic flow of protons in Au + Au collisions. The anisotropic flow can be quantified by Fourier coefficients [10,11] in the expansion of the particle azimuthal distribution relative to the reaction plane given by the angle :
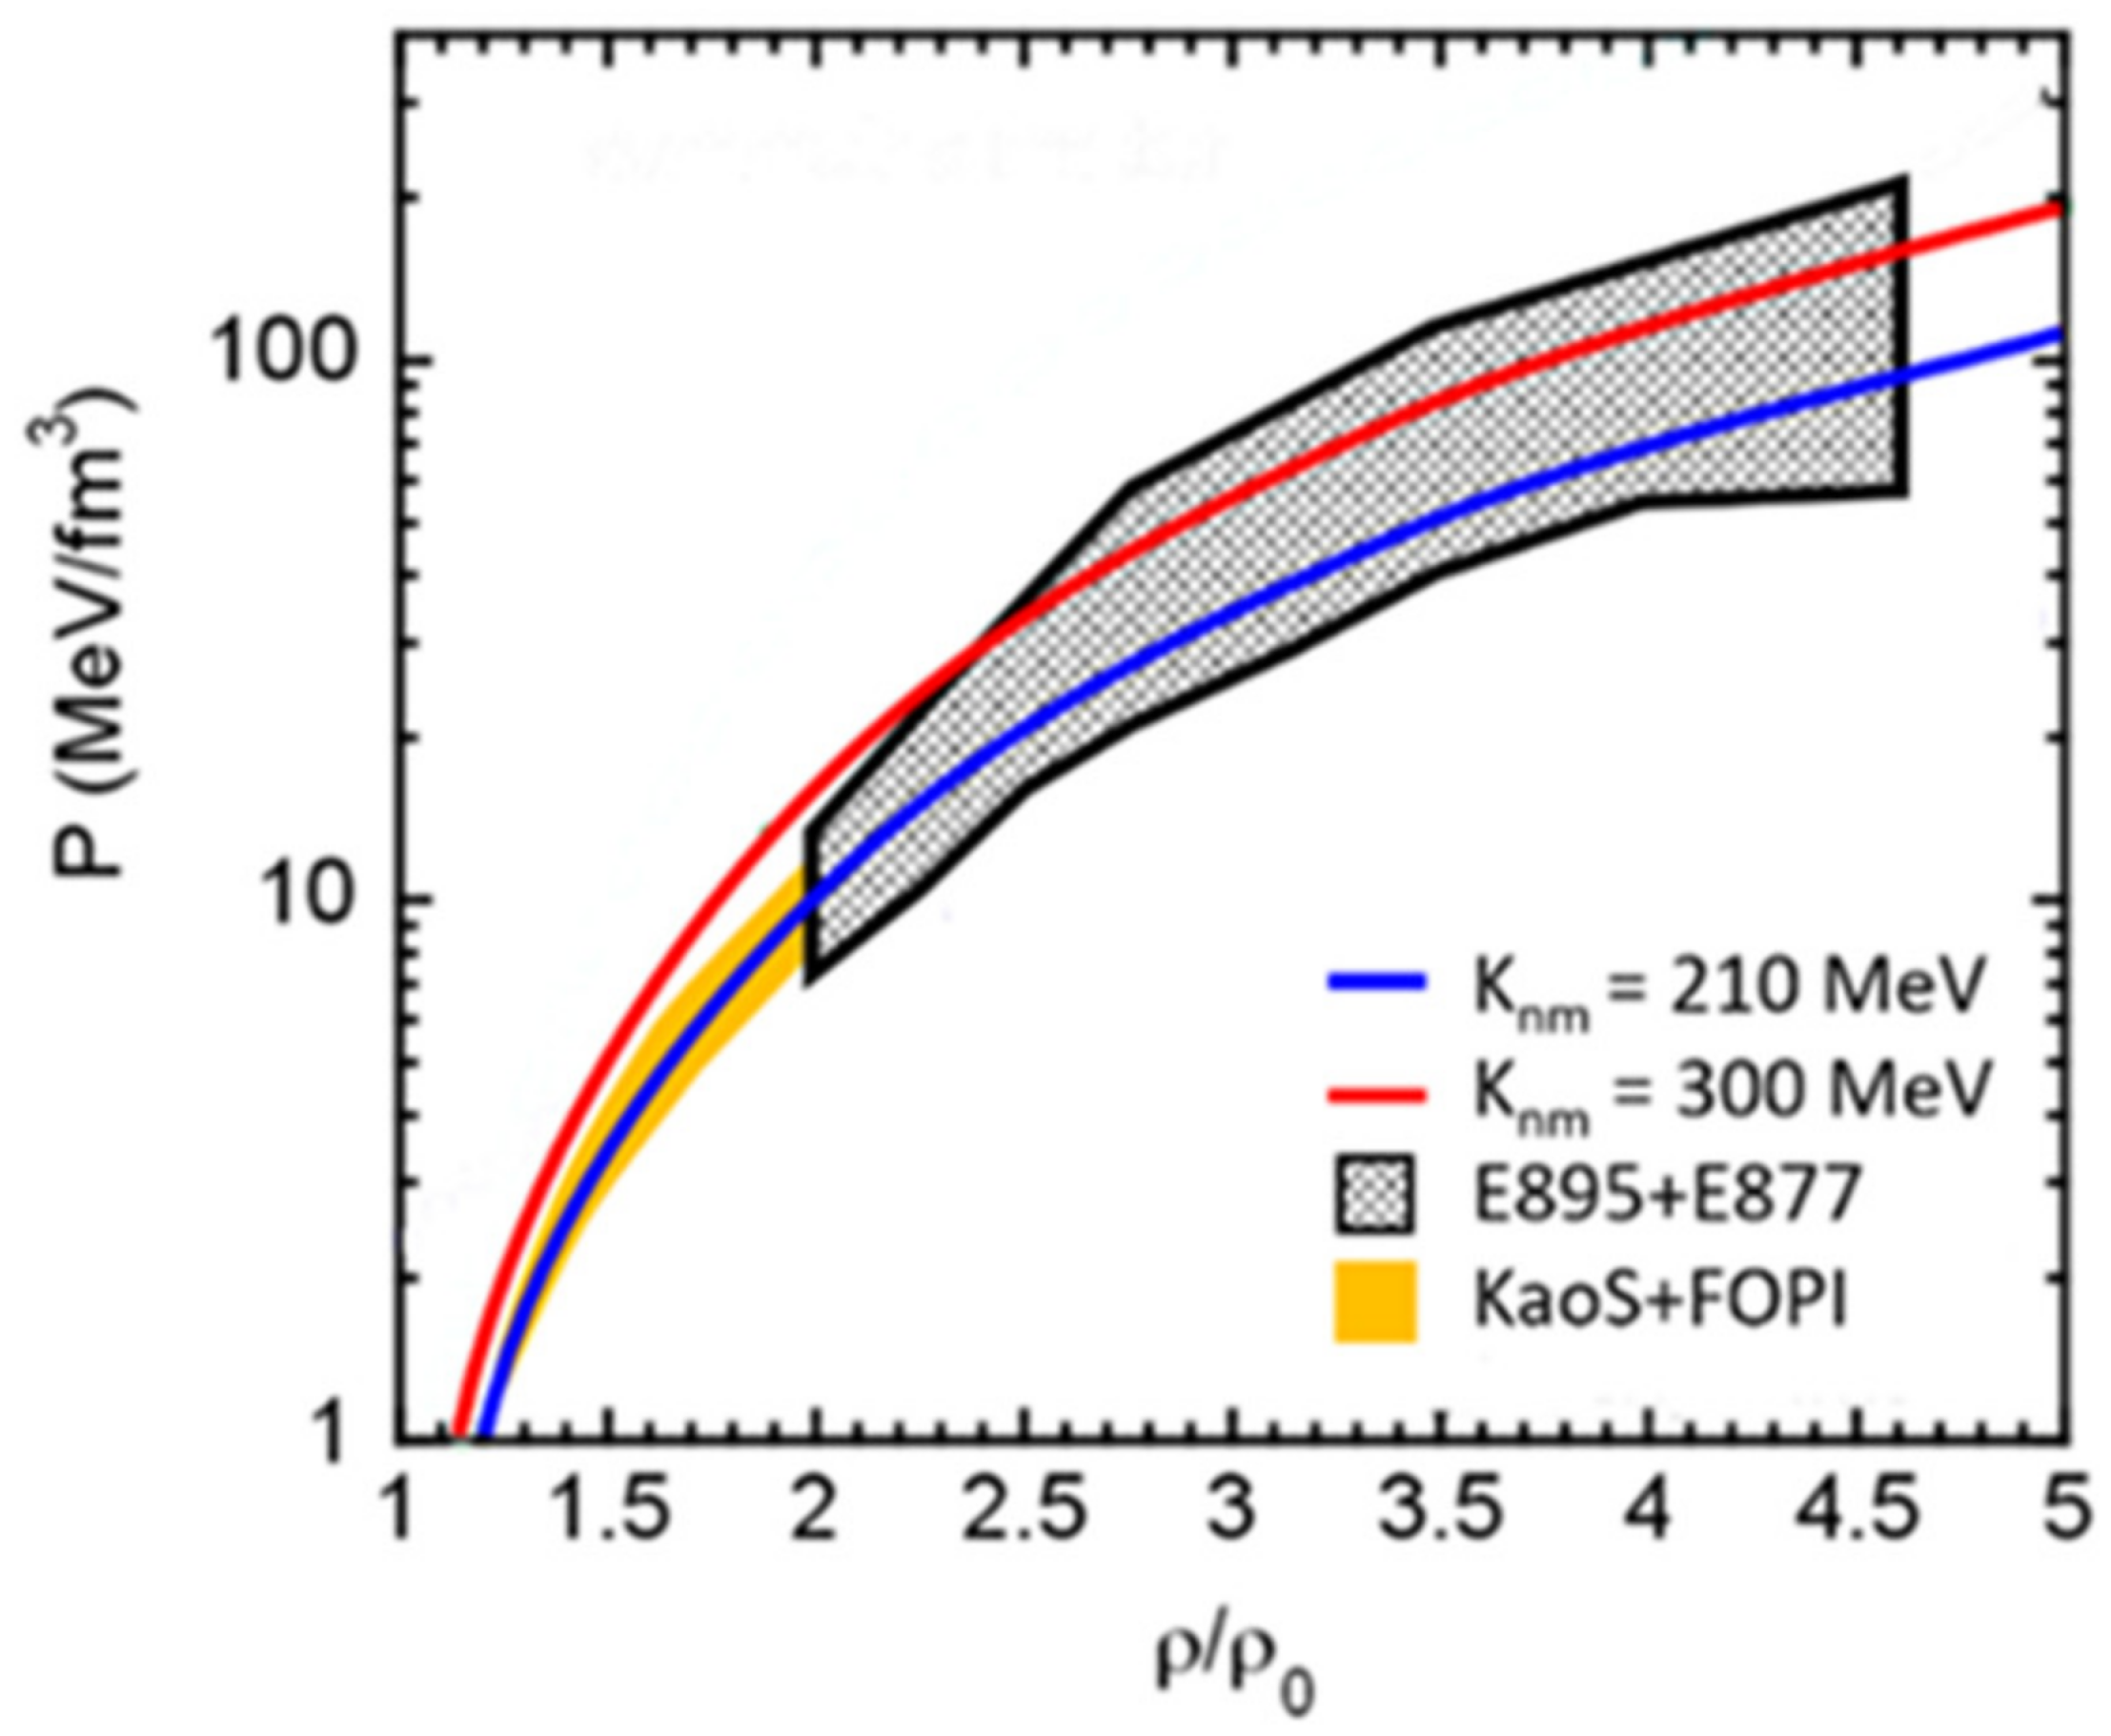
where n is the order of the harmonic and is the azimuthal angle of a particle of the given type. The flow coefficients can be calculated as , where the brackets denote the average over the particles and events. The directed () and elliptic () flows are the dominant and most studied signals in the energy range of 2 < < 5 GeV [10,11,12,13,14,15,16,17,18]. The comparison of existing measurements of and of protons and light fragments in Au + Au collisions at = 2.07–4.72 GeV (corresponding to beam energies = 0.4–10 AGeV) with results from hadronic transport simulations provides the most stringent currently available constraints on the high-density EOS of symmetric nuclear matter [19,20,21]; see Figure 1. At densities between 1 and 2 times the saturation density , the data for protons, deuterons and tritons in Au + Au collisions measured at = 0.4–1.49 AGeV ( = 2.07–2.51 GeV) by the FOPI experiment at GSI [22] have been used together with IQMD model transport calculations to constrain the nuclear incompressibility [23]. The model that takes into account momentum-dependent interactions can explain the data with a fairly soft EOS ( = 190 ± 30 MeV) [19,20]; see the solid yellow region in Figure 1.
At densities ∼2–5 , the comparison of the existing and measurements of protons in Au + Au at = 2–8 AGeV (2.5 < < 4.5 GeV) by the E895 experiment at AGS [12,13,14] with results of microscopic transport models leads to the values of nuclear incompressibility = 200–380 MeV [15], depicted by the grey hatched region in Figure 1. The description of resulting from the E895 experiment requires a soft EOS with the incompressibility = 200 MeV, while reproducing the data required larger values of = 380 MeV (and therefore a harder EOS). A recent study [24] shows that such a large spread of values may come from a substantial disagreement between values from the E895 [12,13,14] and STAR [16,17] experiments. One reason for the difference could be that the standard event plane method for measuring anisotropic flow that was in use 15–20 years ago did not take into account the influence of non-flow effects on measurements [12,13,14]. Therefore, high-precision measurements of anisotropic flow at 2 < < 5 GeV with modern methods of analysis are required in order to further constrain the EOS of symmetric matter from model comparisons [19,20,21].
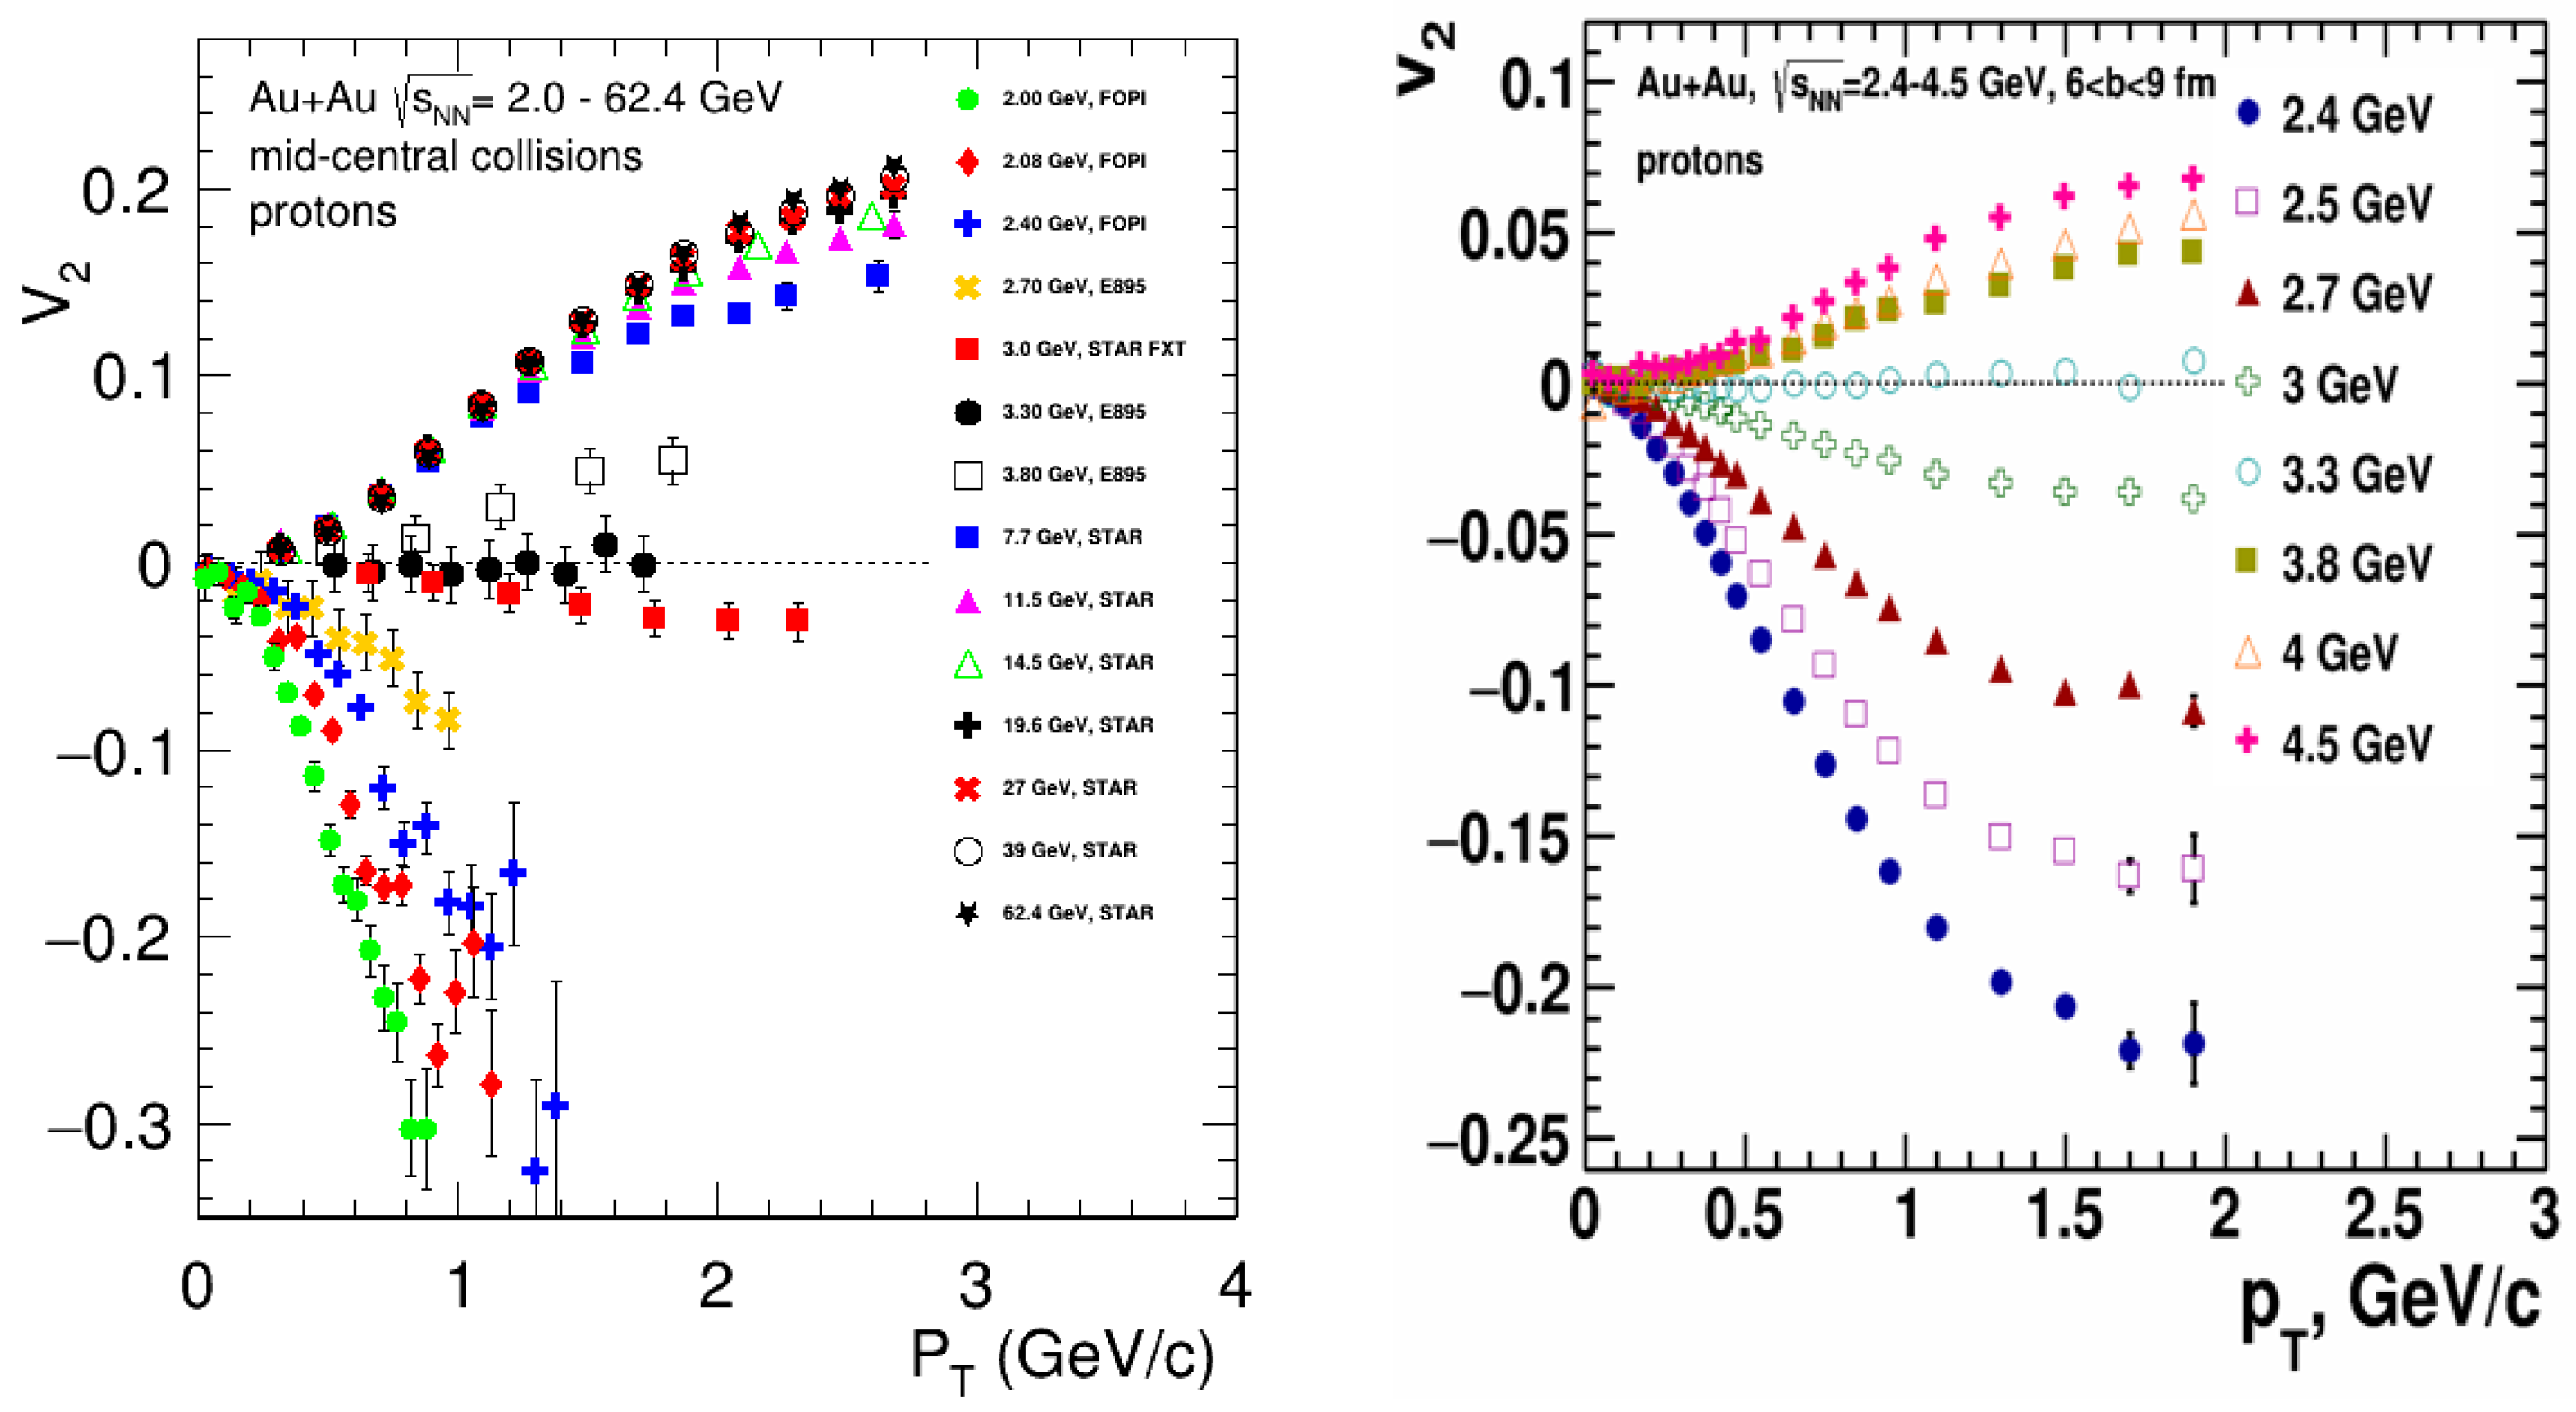
The important characteristic of this energy range is that the compressed overlap zone expands at the time comparable to the passage time at which the accelerated nuclei interpenetrate each other. The expansion time is governed by a fundamental property, the speed of sound , which connects to the EOS [14,15]. The passage time can be estimated as , where R is the radius of the nucleus and is the beam rapidity [10,11,12,13,14,15]. For Au + Au collisions at 2 < < 5 GeV, the decreases from 30 fm/c to 5 fm/c. If the passage time is long compared to the expansion time, spectator nucleons serve to block the path of produced hadrons emitted towards the reaction plane. Such rather complex collision geometries result in a strong change in the resulting flow patterns. For example, for Au + Au collisions at < 3.3–3.5 GeV, the nuclear matter is “squeezed-out” perpendicular to the reaction plane, giving rise to negative elliptic flow ( < 0), and the squeeze-out contribution should then reflect the ratio [12,14,15]; see the left part of Figure 2.
The passage time depends on the size of the colliding system and beam energy. Therefore, the study of the system size dependence of anisotropic flow may help to estimate the participant–spectator contribution and improve our knowledge of the EOS of symmetric nuclear matter.
The Baryonic Matter at the Nuclotron (BM@N) experiment [5] is a fixed target experiment at JINR (Dubna), which has been upgraded recently to perform differential measurements of the anisotropic flow of identified particles. In December 2022, the accelerator complex of the Booster and Nuclotron started to accelerate and deliver the extracted heavy-ion (Xe) beam. In February 2023, the first physics run of the BMN experiment was completed with recorded Xe + Cs(I) collision events at = 3 AGeV and 3.8 AGeV. In this work, we discuss the layout of the upgraded BM@N experiment and the anticipated performance for differential anisotropic flow measurements of identified hadrons at Nuclotron energies = 2.3–3.5 GeV. As the main event generator, we have used the JAM (RQMD.RMF) model with a momentum-dependent mean field [26], which qualitatively describes the existing measurements of the directed and elliptic flow of protons at this energy range; see the right part of Figure 2.
The paper is organized as follows. Section 2 briefly describes the used transport model JAM (RQMD.RMF) and the predictions for directed and elliptic flow. Section 3 introduces the experimental setup and the particle reconstruction methods of the upgrated BM@N spectrometer at Nuclotron, while Section 4 discusses the anticipated performance of the BM@N spectrometer for flow measurements of identified hadrons. Finally, a summary is given in Section 5.
2. A Brief Description of the Transport Model
In the present work, we use the Jet AA Microscopic transport model (JAM) [26,27,28] as the main event generator to simulate high-energy heavy-ion collisions. Particle productions are modeled by the excitation of hadronic resonances at low energies and by string formation at higher energies. The nuclear mean field is simulated based on the relativistic version of the QMD model (RQMD.RMF) [26]. We have used the version JAM 1.94 [26], which includes five different EOS implementations—soft momentum-independent NS2 ( = 210 MeV), hard momentum-independent NS1 ( = 380 MeV), soft momentum-dependent MD4 ( = 210 MeV) and hard momentum-dependent MD2 and MD3 ( = 380 MeV)—with different values of the optical potential; see Table I from [26] for the detailed description of the EOS implementations. The JAM approach with the (RQMD.RMF) model has been found to reproduce the directed and integral elliptic flow data at 2.3 < < 8 GeV simultaneously with the parameter set MD2 [26]. The comparison of the JAM (RQMD.RMF) model with the published differential measurements of of protons from Au + Au collisions at = 2.4 GeV ( = 1.23 AGeV) from the HADES experiment [18] and at = 3.0 GeV ( = 3.85 AGeV) from the STAR experiment [16] came to the same conclusion; see [29] for the details.
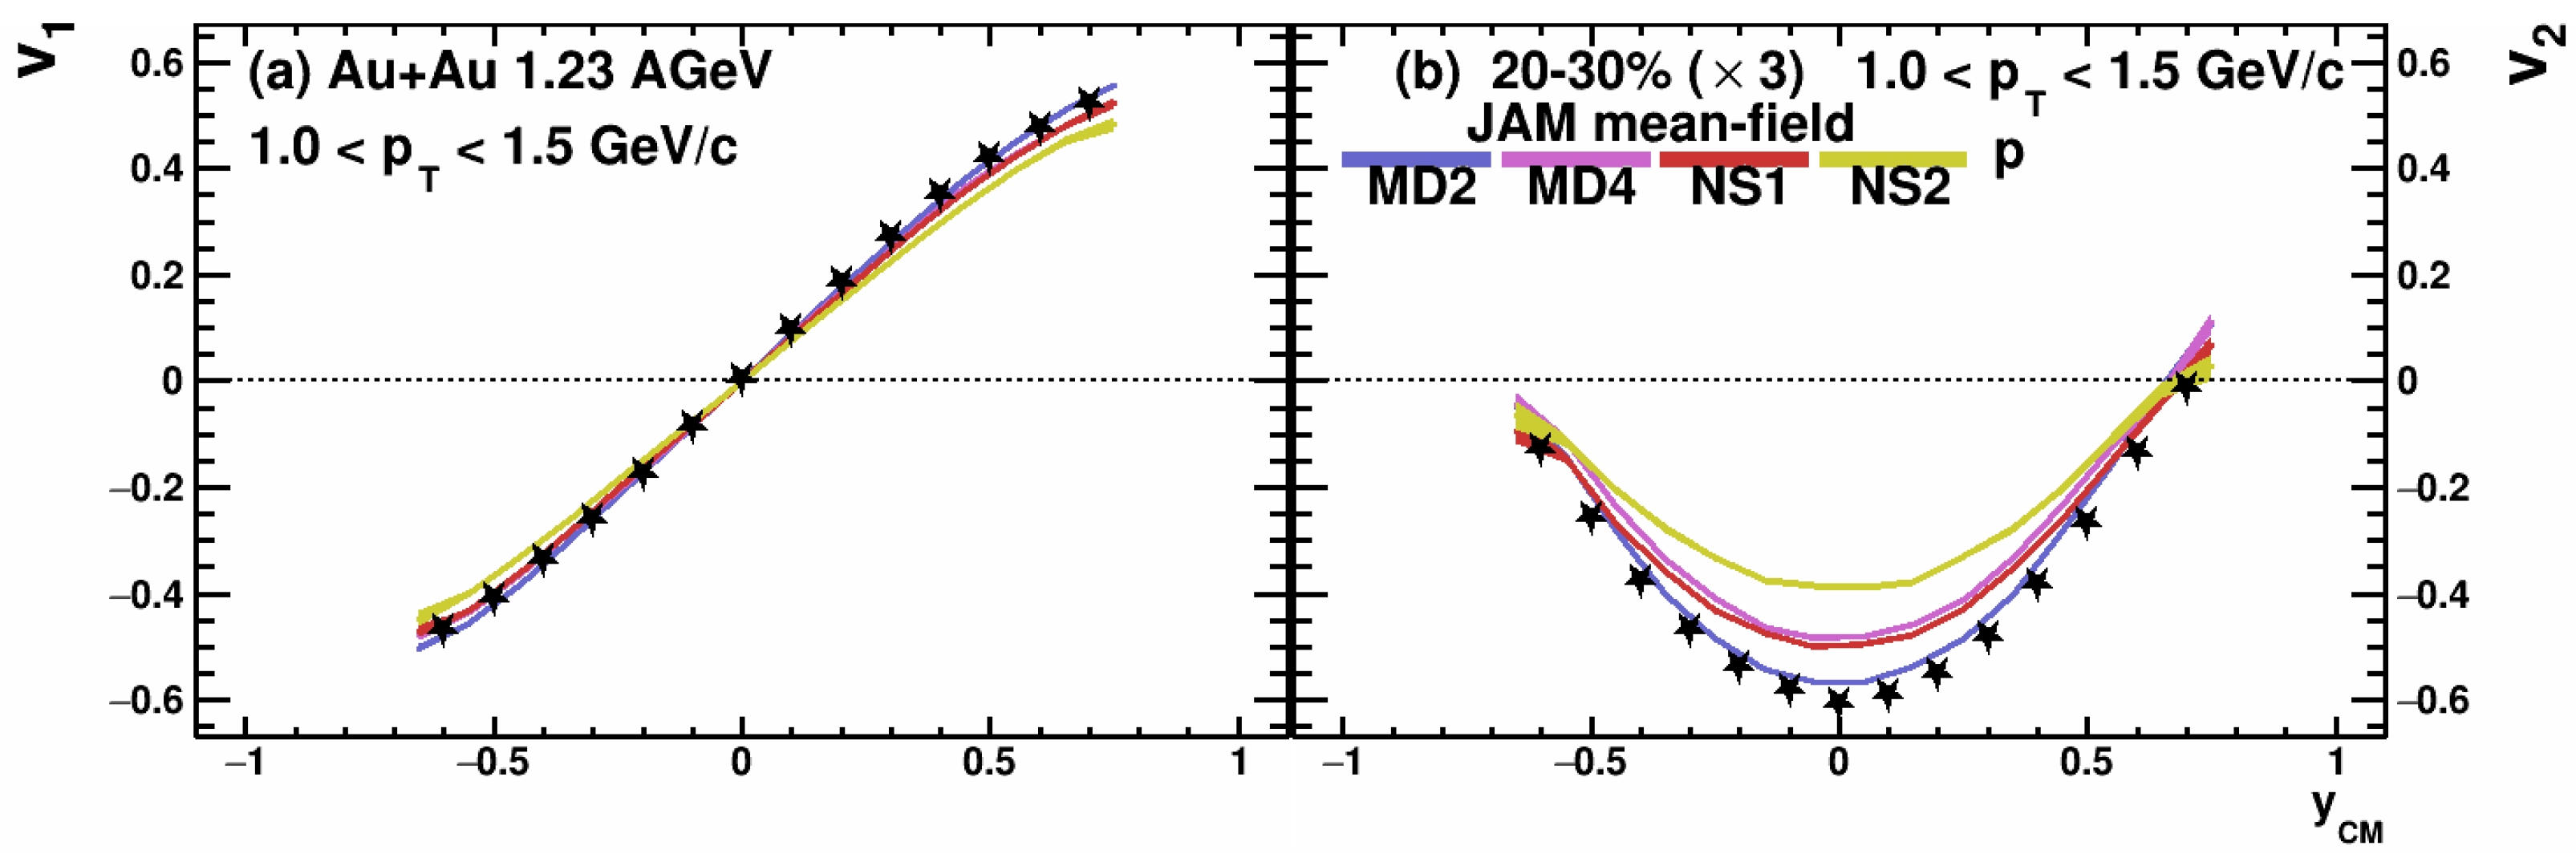
As an example, Figure 3 shows the center-of-mass rapidity () dependence of the anisotropic flow coefficients (left) and (right) of protons with Gev/c in the 20–30% central Au + Au collisions at GeV. The black closed star symbols represent the published data from the HADES experiment [18]. The JAM (RQMD.RMF) model with a hard momentum-dependent EOS set MD2 provides the overall good reproduction of the HADES published data for and of protons [29]; see the blue band in Figure 3.
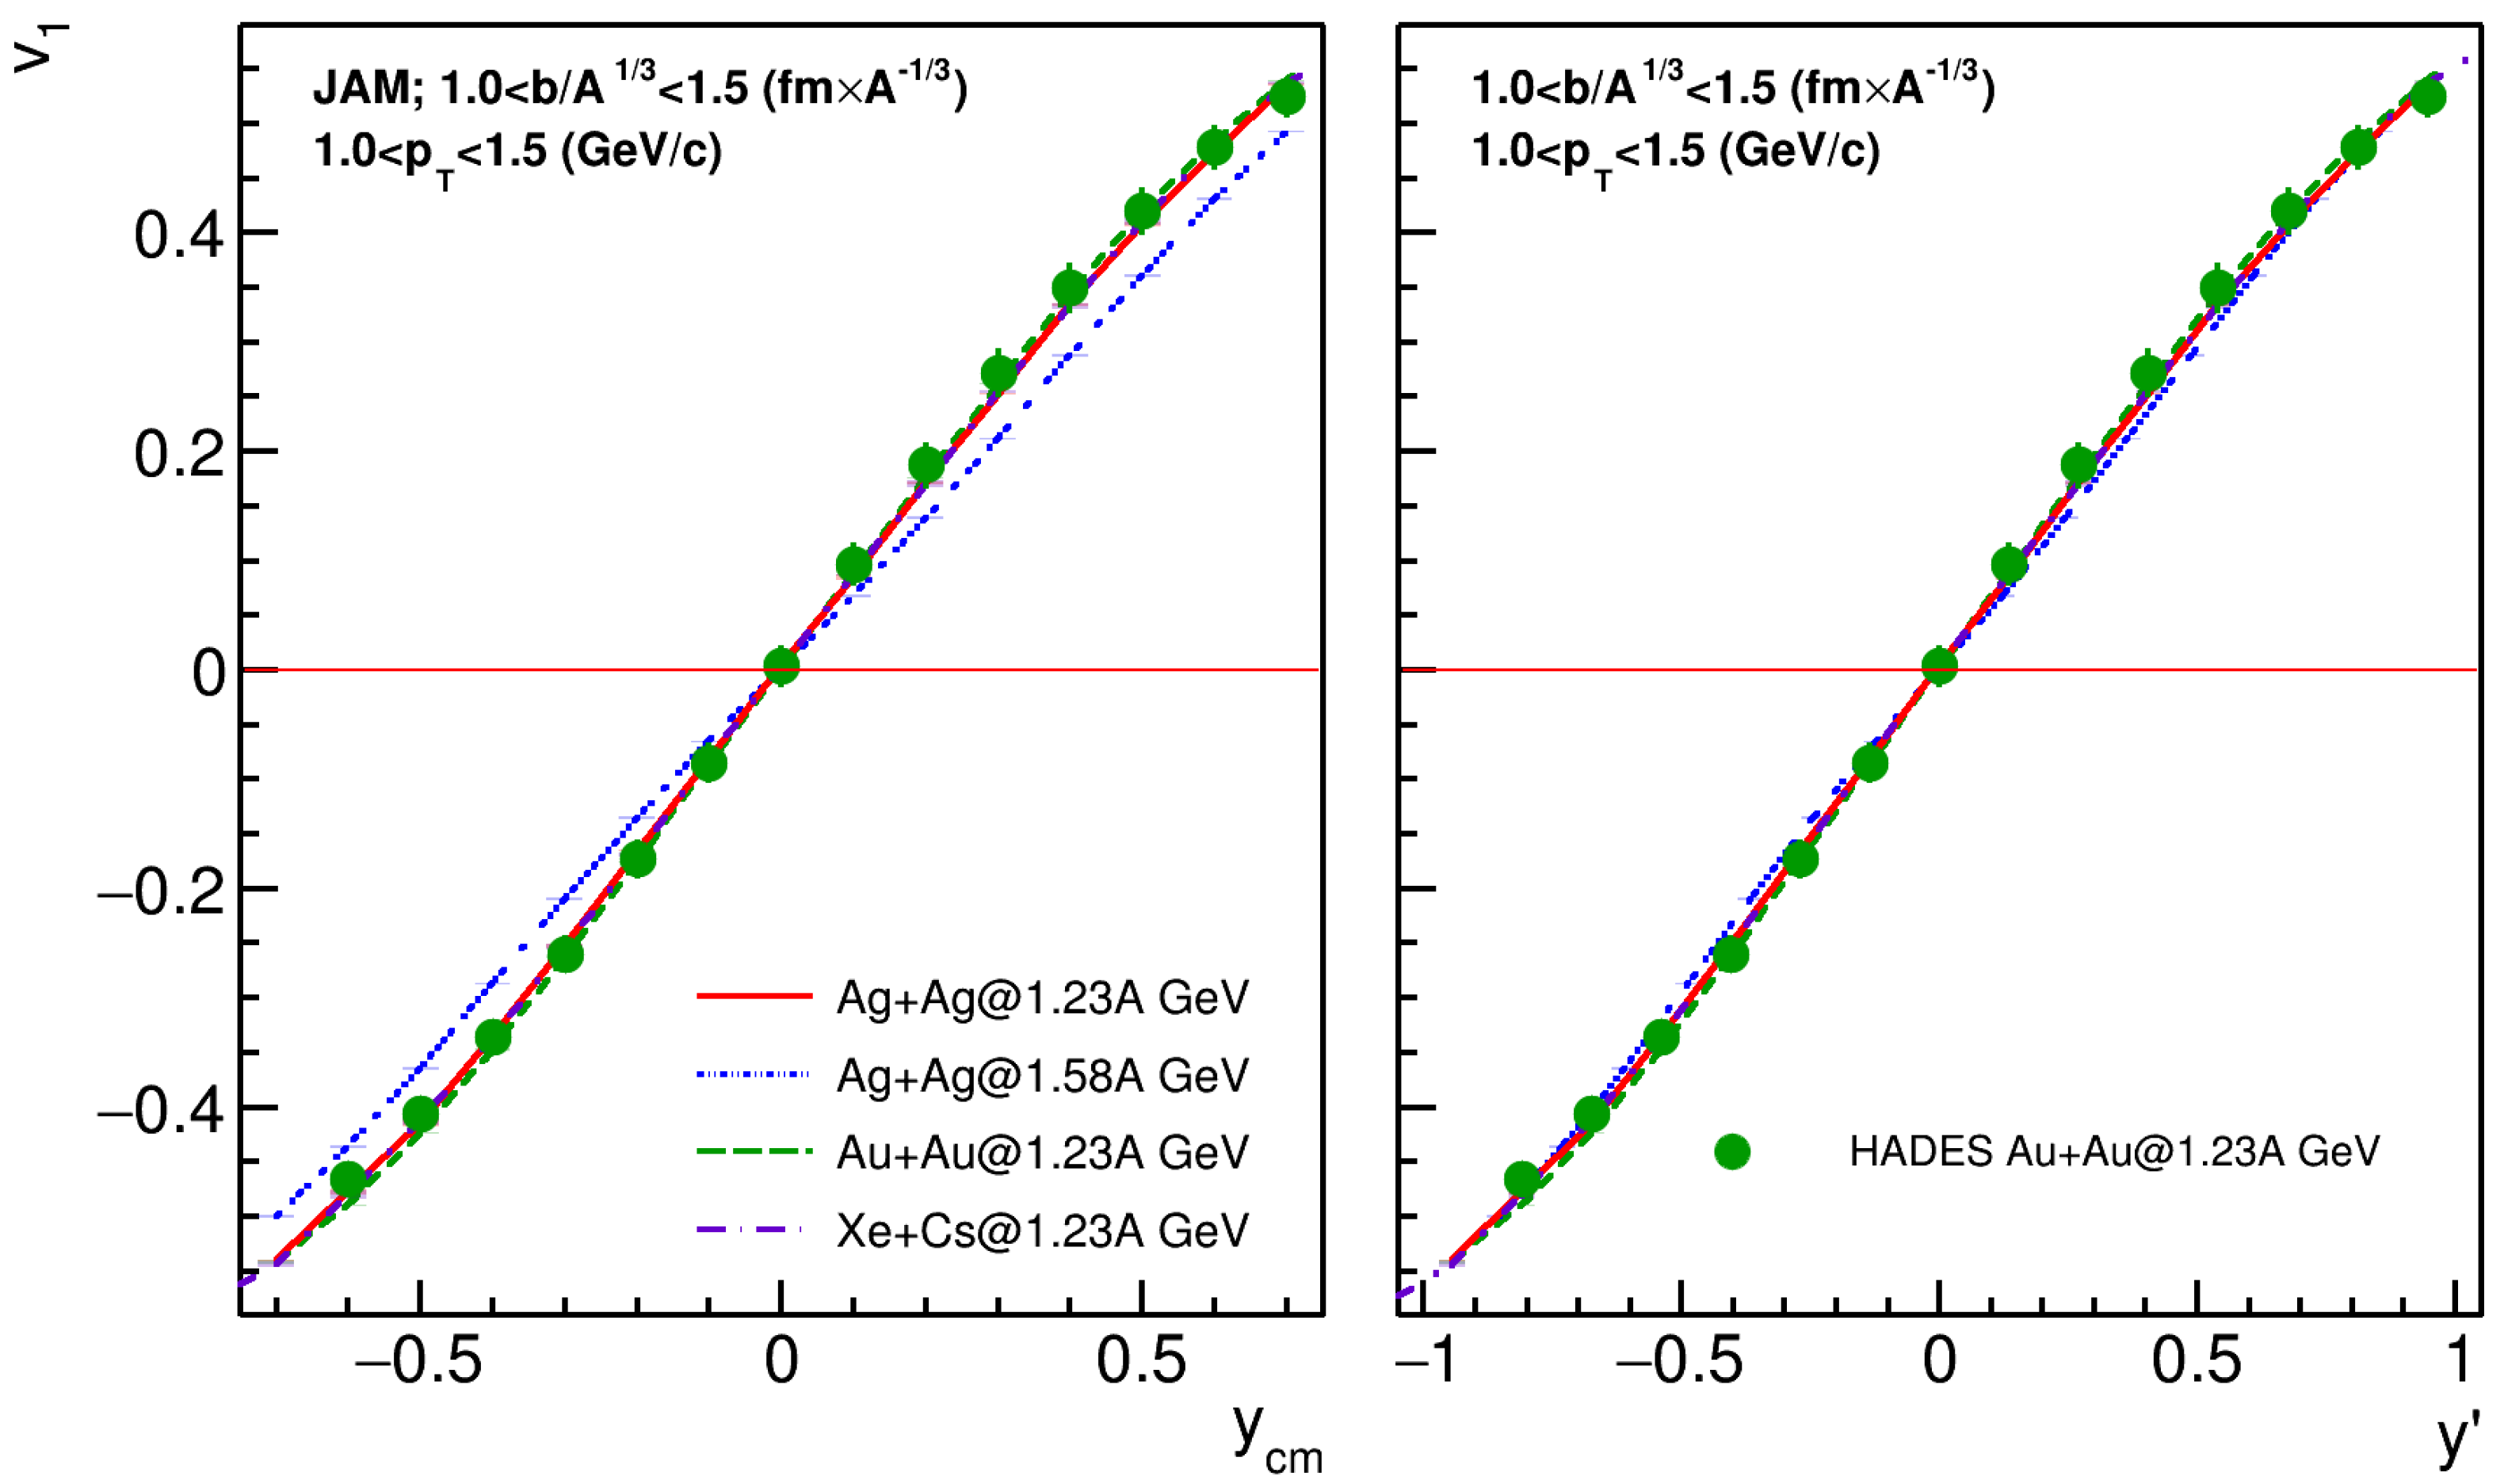
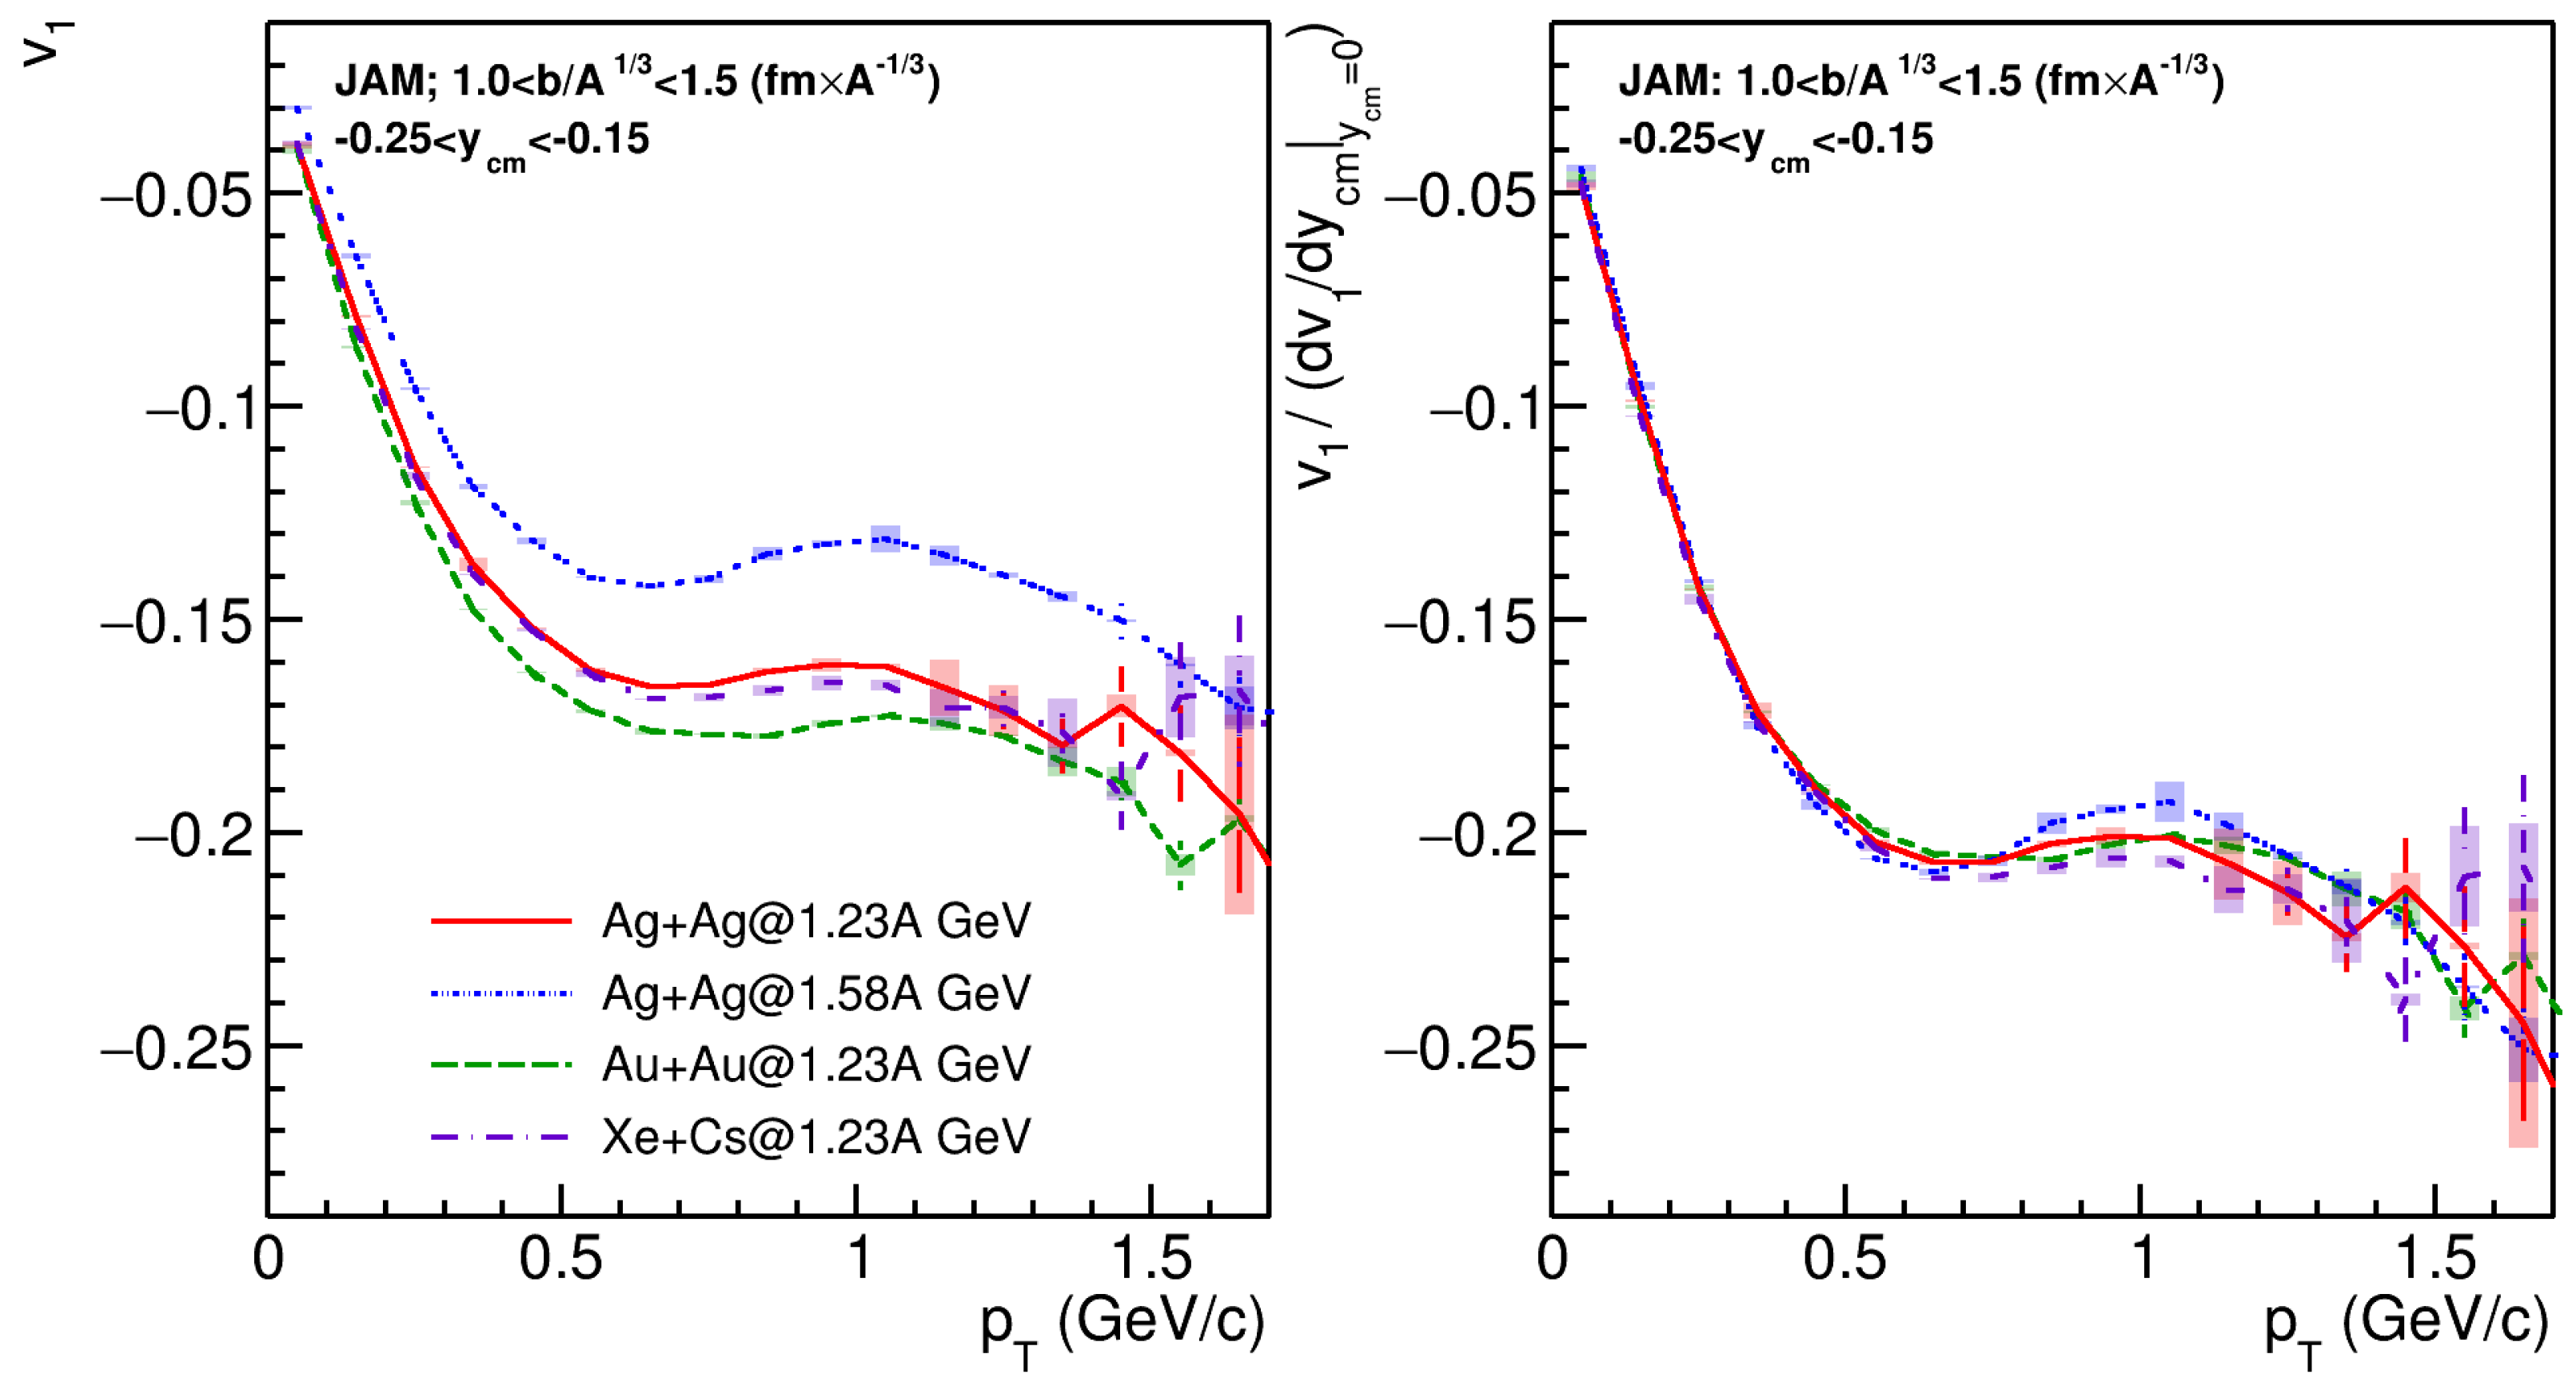
The left panel of Figure 4 shows the prediction of the JAM (RQMD.RMF) model with a hard momentum-dependent EOS set MD2 for the center-of-mass rapidity dependence of the directed flow of protons in Au + Au collisions at the beam energy of 1.23A GeV (green dotted line), Xe + Cs(I) collisions at 1.23A GeV (purple dashed line), Ag + Ag collisions at 1.23A GeV (red solid line) and Ag + Ag collisions at 1.23A GeV (blue dash-dotted line). The selected energies for Ag + Ag collisions are motivated by the recent data from the HADES experiment at SIS [30]. In order to compare flow results for different colliding systems, it was suggested to use the scaled impact parameter as a measure of centrality, defined by = , taking = 1.15( + ) fm [22]. Since we study the symmetric colliding systems (), we use the mean impact parameter normalized to a cubic root of colliding ion mass number . The JAM results are presented for mid-central collisions. The values of of protons are very close to each other for Au + Au, Xe + Cs(I) and Ag + Ag collisions at a beam energy of 1.23A GeV. In contrast, the magnitude of proton-directed flow produced in Ag + Ag collisions at a higher beam energy of 1.58A GeV is distinguishably lower.
In this energy range, the anisotropic flow is strongly affected by the presence of cold spectators due to the sizable passage time , where R is the radius of the nucleus and is the beam rapidity. The observed change in the slope can be attributed to the reduction of the shadowing effects by the spectator matter due to the decrease in the [12,14,15]. The rapidity dependence of of protons becomes less complicated if one uses the scaled rapidity , since for the colliding beams, one then always has 1 in the center-of-mass frame; see the right panel of Figure 4. The scaled rapidity () dependence of may reflect the partial scaling of with in this energy range [22].
Similar trends are visible in the prediction of the JAM (RQMD.RMF) model for the dependence of signal of protons (with ) for the same systems and beam energies; see the left panel of Figure 5. The -dependence of the of protons divided by the value of the slope is presented in the right panel of Figure 5. It shows that the shape of is very similar for Au + Au, Xe + Cs(I) and Ag + Ag collisions.
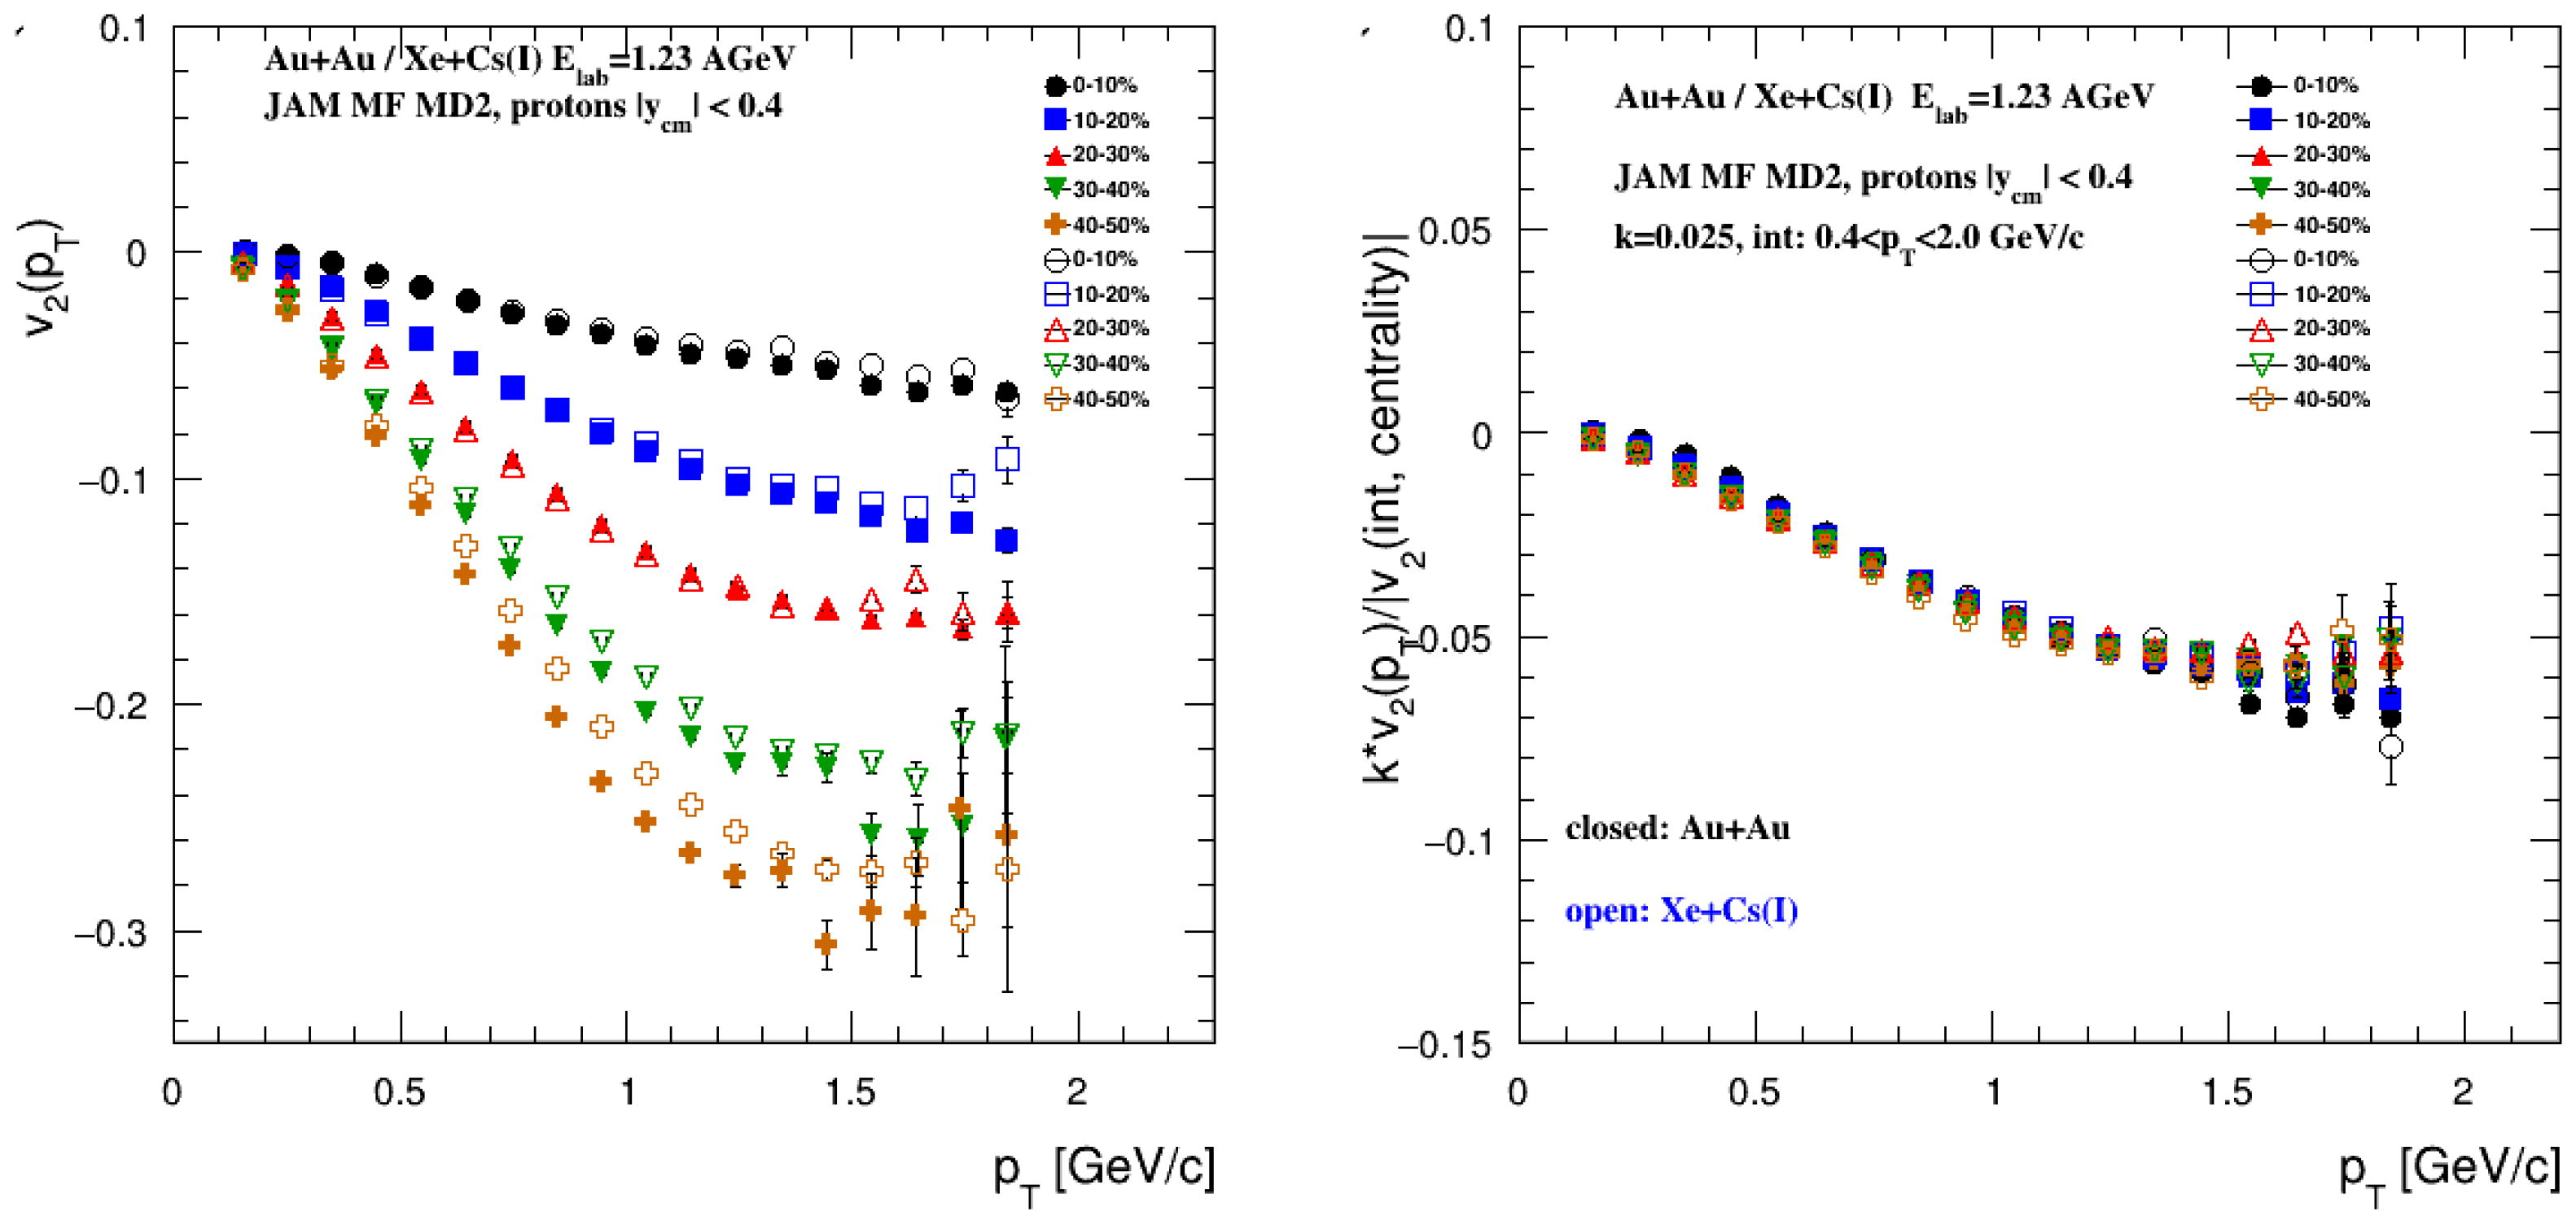
The left panel of Figure 6 shows the prediction of the JAM (RQMD.RMF) model for the differential of protons in Au + Au (solid symbols) and Xe + Cs(I) (open symbols) collisions at the beam energy of 1.23 AGeV for different bins in collision centrality, as indicated. A produced particle moving with transverse velocity will interact with the spectator matter during the passage time . The simple geometrical estimate then leads to the condition [31] , where R is the radius of the nucleus and b is the impact parameter. This explains why the results exhibit a familiar increase as collisions become more peripheral and the increases. The (centrality, ) data have been tested for the “integral flow scaling” by dividing the differential values (centrality, ) shown in the left panel Figure 6 by the of protons integrated over the range 0.4–2.0 GeV/c for each of the indicated centrality selections (|(int, centrality)|) [29]. The right panel of Figure 6 shows that the “integral flow scaling” holds for Au + Au and Xe + Cs(I) collisions [29]. These predictions for the scaling relations of can be tested by the new data coming from the HADES experiments at SIS and the BM@N experiment at Nuclotron.
3. The BM@N Experiment Performance Study for the Xe + Cs(I) Run
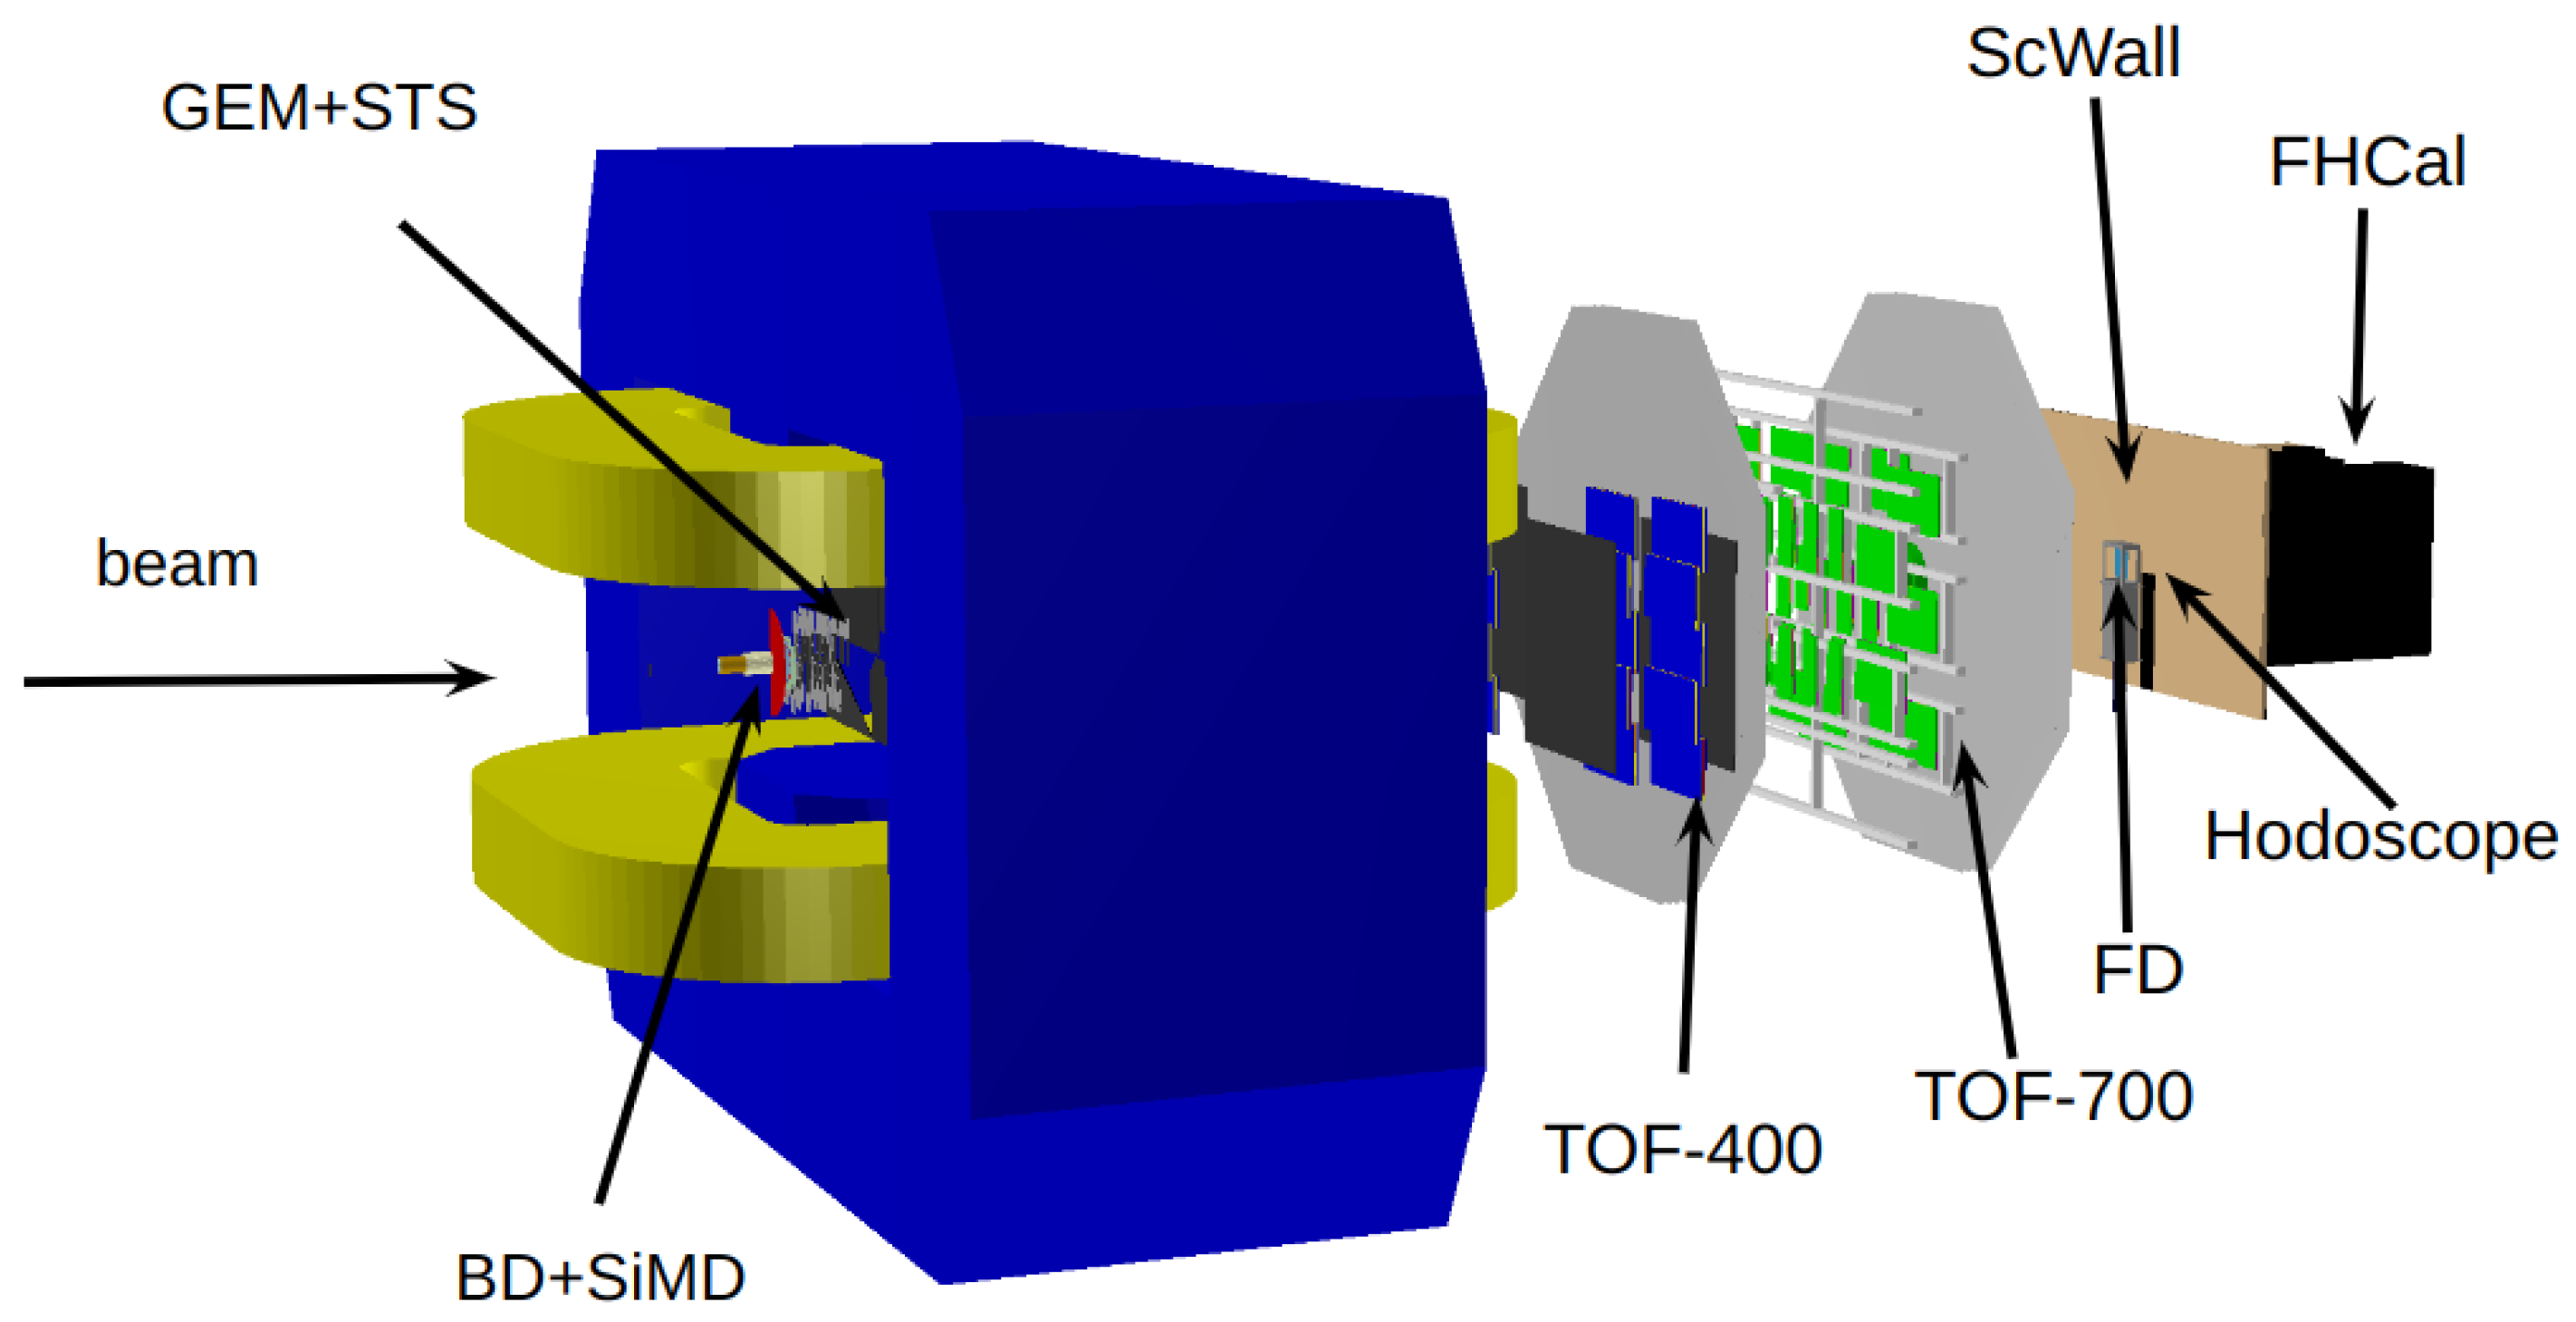
The Baryonic Matter at Nuclotron (BM@N) experiment is a fixed target experiment and is the first scientific pillar of the accelerator complex Nuclotron-NICA in JINR, Dubna, Russia [5,32]. In December 2022, the accelerator complex of the Booster and Nuclotron started to accelerate and deliver the extracted heavy-ion (Xe) beam to the BM@N fixed target zone. In this section, we discuss the layout of the BM@N experiment for Xe + Cs(I) run in 2022–2023 and the anticipated performance for centrality determination and particle identification. The layout of the current version of the BM@N experiment for the Xe + Cs(I) run 2022–2023 is shown in Figure 7.
The main subsystems of the BM@N are the tracking system for charged hadron tracking, the Time Of Flight (TOF) system for charged particle identification and the set of forward detectors for centrality and reaction plane estimations. The tracking system is comprised of four stations of double-sided silicon micro-strip sensors (STS) and seven stations of Gaseous Electron Multipliers (GEM) chambers mounted downstream of the silicon sensors; see left part of Figure 7. Both the silicon tracking system (STS) and the GEM stations will be operated in the magnetic field (at maximum value of 1.2 T) of a large aperture dipole magnet and allow the reconstruction of the momentum p of charged particles. The z axis of the BM@N coordinate system is directed along the beam line, while the magnetic field is directed along the y axis. The STS + GEM system also provides the measurements of the multiplicity of the produced charged particles , which can be used as an additional estimator of the collision centrality.
Outer drift chambers (DCH), a cathode strip chamber (CSC) and a TOF system are located downstream of the dipole magnet. The TOF-system consists of three planes of multi-gap Resistive Plate Chambers (mRPC) placed at and cm (TOF-400 and TOF-700, respectively) from the target [33]; see the central part of Figure 7. The three forward detectors—Forward Hadronic Calorimeter (FHCal), quartz hodoscope (Hodo) and Scintillator Wall (ScWall)—provide the information about the spectator fragments; see the right part of the Figure 7. FHCal provides the information about the energy of spectator fragments and consists of 54 modules of two types (34 modules with transverse size of 15 × 15 cm and 20 larger modules with size of 20 × 20 cm) [34]. The modules have a sampling structure and consist of a set of lead and scintillator plates compressed together by a steel band. FHCal has a 15 × 15 cm square beam hole in the center. The beam hole leads to the leakage of the fragments with small transverse momenta. As a result, the deposited energy in the FHCal is comparable for the central and peripheral events. This creates an ambiguity in the dependence of energy deposition on the collision centrality. A new forward quartz hodoscope (Hodo) has been developed to be placed in the beam hole to measure the energy of spectator fragments. This helps to compensate the effect due to the leakage of the heavy fragments, mostly in the peripheral collisions [35]. ScWall has a wider acceptance than FHCal and provides information about the charge of spectator fragments.
In this work, we have used the JAM (RQMD.RMF) [26] and DCM-QGSM-SMM [36] transport models to simulate about 2–5 M minimum bias Xe + Cs(I) collision events at beam energies of 2, 3 and 4 AGeV. The DCM-QGSM-SMM model includes coalescence, the fragmentation of nuclei recoil and hypernuclei production. In particular, the modeling of fragmentation is very important for the realistic modeling of spectator fragments, which is crucial for the simulation of the forward detectors of the BM@N. On the other hand, the DCM-QGSM-SMM model poorly describes the directed and elliptic flow of particles at energies of the BM@N [29]. Here, the version of the JAM model with a momentum-dependent mean field can capture the overall magnitude and trend of the measured signals [29]; see Section 2. In the next step, a sample of model events was made as an input for the full chain of realistic simulations of the BM@N detector subsystems based on the GEANT4 platform and reconstruction algorithms built in the BMNROOT framework. The simulation chain provides a realistic response for the detector systems, including hadronic shower propagation in the FHCaL calorimeter and electron avalanche in gaseous detectors (STS, GEM, TOF, etc). The efficiencies of the STS, GEM, FHCaL and ToF detectors were adjusted in accordance with the measured detector efficiencies obtained during the technical runs of BM@N [37]. The “cellular automaton” approach has been used for track reconstruction in STS + GEM [38]. It is based on a constrained combinatorial search of track candidates with their subsequent fitting by a Kalman filter to determine the track parameters. Tracks reconstructed based on the hits from less than four stations in total (in STS + GEM) were excluded from the analysis [37]. These tracks are used to estimate primary and secondary vertices. The distance from a track to the primary vertex in the X–Y plane is required to be less than 1 cm. The fully reconstructed events were used to generate the distributions of the multiplicity of the produced charged particles detected by the STS + GEM system.
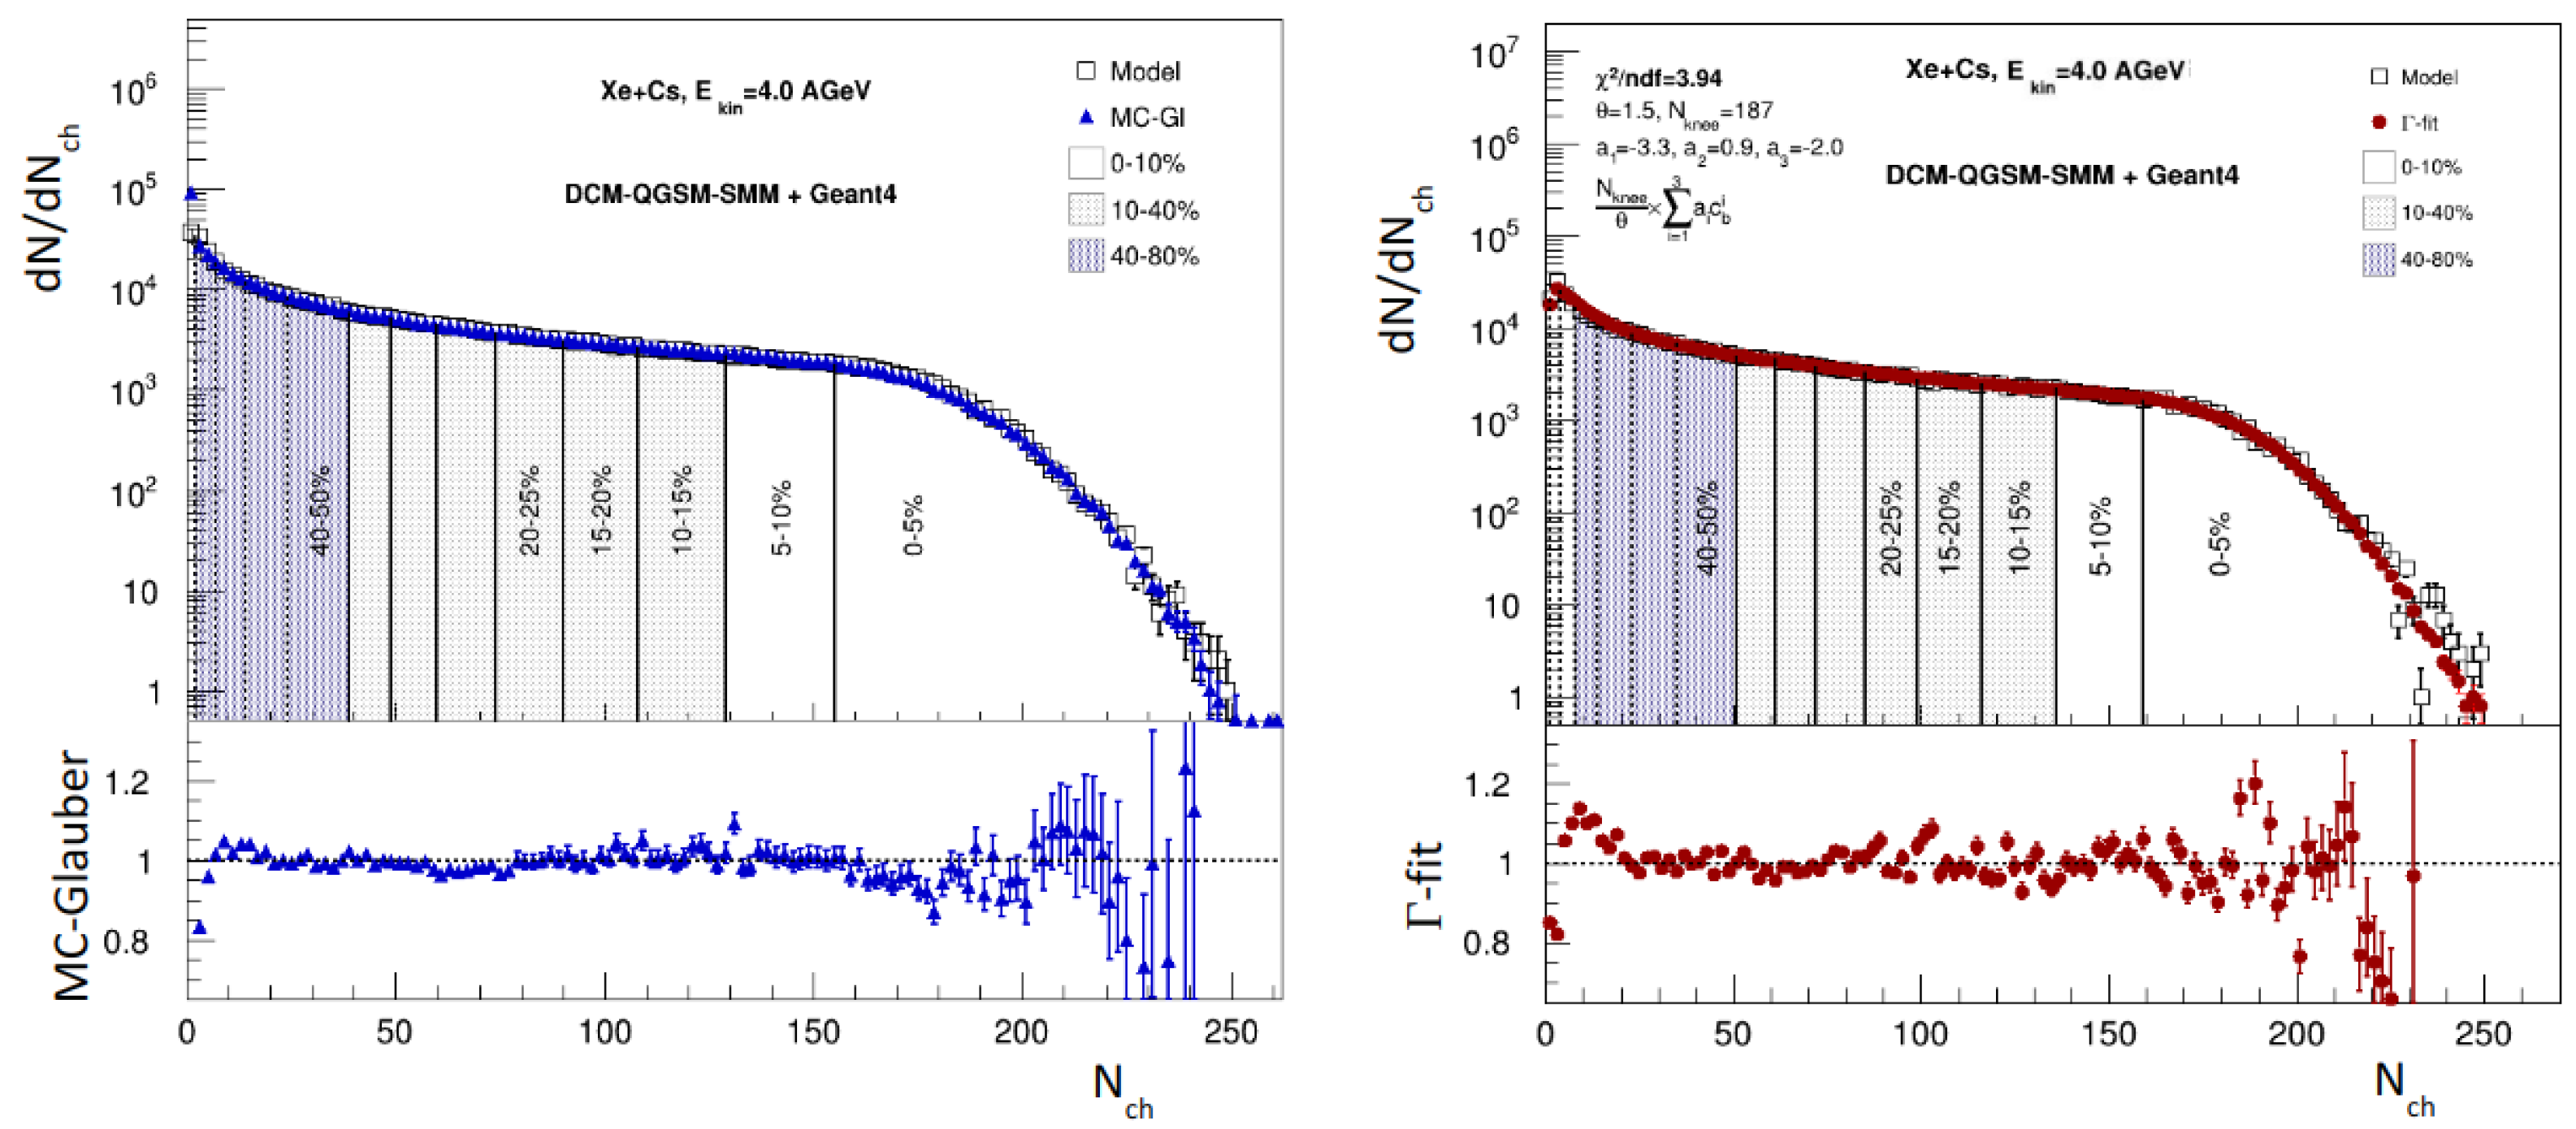
In order to reconstruct the impact parameter distribution from the multiplicity of the produced charged particles detected by the STS + GEM system, the MC-Glauber approach and -fit method have been employed [39]. As an example, Figure 8 shows the charged particle multiplicity distribution (open squares) for the fully reconstructed Xe + Cs(I) collisions at 4 AGeV. The left part of the figure shows the results of the MC-Glauber fit (blue solid triangles), and the right part shows the result of the application of the -fit method (red solid circles). The figure shows that both fit methods can describe the multiplicity distribution very well. With the final set of the fit parameters, the mean value of the impact parameter can be extracted for the centrality classes defined by the sharp cuts in the multiplicity distribution; see the dotted vertical lines in the Figure 8.
The STS + GEM system allows us to reconstruct the momentum p of the particle with a momentum resolution of 1.7–2.5% for the kinetic energy 4 AGeV (magnetic field 0.8 T). For the experiment at a lower kinetic energy of 2 AGeV, one needs to use the reduced magnetic field 0.4 T. This leads to a deterioration in the momentum resolution; see the left part of Figure 9. Charged-hadron identification is based on the time-of-flight measured with TOF-400 and TOF-700. The time resolutions of the ToF-400 and ToF-700 systems are 80 ps and 115 ps, respectively. Particle velocity is obtained from the measured flight time and flight path. Combining this information with the particle momenta p allows us to identify charged hadrons with high significance. As an example, the right part of Figure 9 shows the population of all charged particles in the plane spanned by their and momenta divided by charge (rigidity) for the TOF-400.
4. BM@N Performance for the Measurements of Anisotropic Flow
In this section, we discuss the anticipated performance of the BM@N spectrometer for the measurements of directed () and elliptic () flow of identified hadrons. We start from the brief description of the general framework for the flow measurements in the fixed target experiment. The observables for coefficients can be written in terms of flow and unit vectors [40,41,42]. For each particle k in the event, the unit vector in the transverse plane can be defined as
where is the azimuthal angle of the particle’s momentum. A two-dimensional flow vector -vector is defined as a sum of unit -vectors over a group of particles in the event:
where M is the multiplicity of the particles included in the given flow vector, and the components of the -vector are denoted as and . The estimation of the reaction plane angle is given by the —symmetry plane angle.
The flow coefficients are measured by projecting the particle’s vector on a flow vector of the event (Scalar Product method):
where is the resolution correction factor and the brackets denote the average over the particles and events.
If the magnitude of higher-order -vectors is small, flow coefficients can be obtained by correlating particles’ -vectors with several lower-order -vectors. For example, the observable for with respect to the first-order symmetry plane can be calculated as follows:
where indices “a” and “b” denote groups of particles (sub-events) in which the -vector is calculated separately as well as the resolution correction factors for these symmetry planes.
In the present analysis, we calculate using the method of three sub-events given by the equation
An unbiased result for the resolution correction can be achieved by introducing the substantial phase space separation between the groups of particles in which -vectors are calculated. In the present analysis, we utilize the rapidity separation between the sub-events used for -evaluation. If the pairwise separation between “a”, “b” and “c” sub-events is impossible to achieve, one can introduce additional sub-event “d” and require separation only between “a” and “d” and pairwise “d”, and “b” and “c”. This technique is called the four-sub-event method, and the formula for is written as
Since the reaction plane orientation is random and uniform, in the case of the ideal detector acceptance, the correlation of vectors can be substituted with the correlation of their components (for more details, see [40]):
or similarly for the three-particles correlation:
Based on this, one can use only correlations of components of and vectors to calculate flow coefficients. For instance, Equation (4) for can be rewritten as follows:
where and are y-components of and vectors, respectively, and is the resolution correction factor for (see (6)):
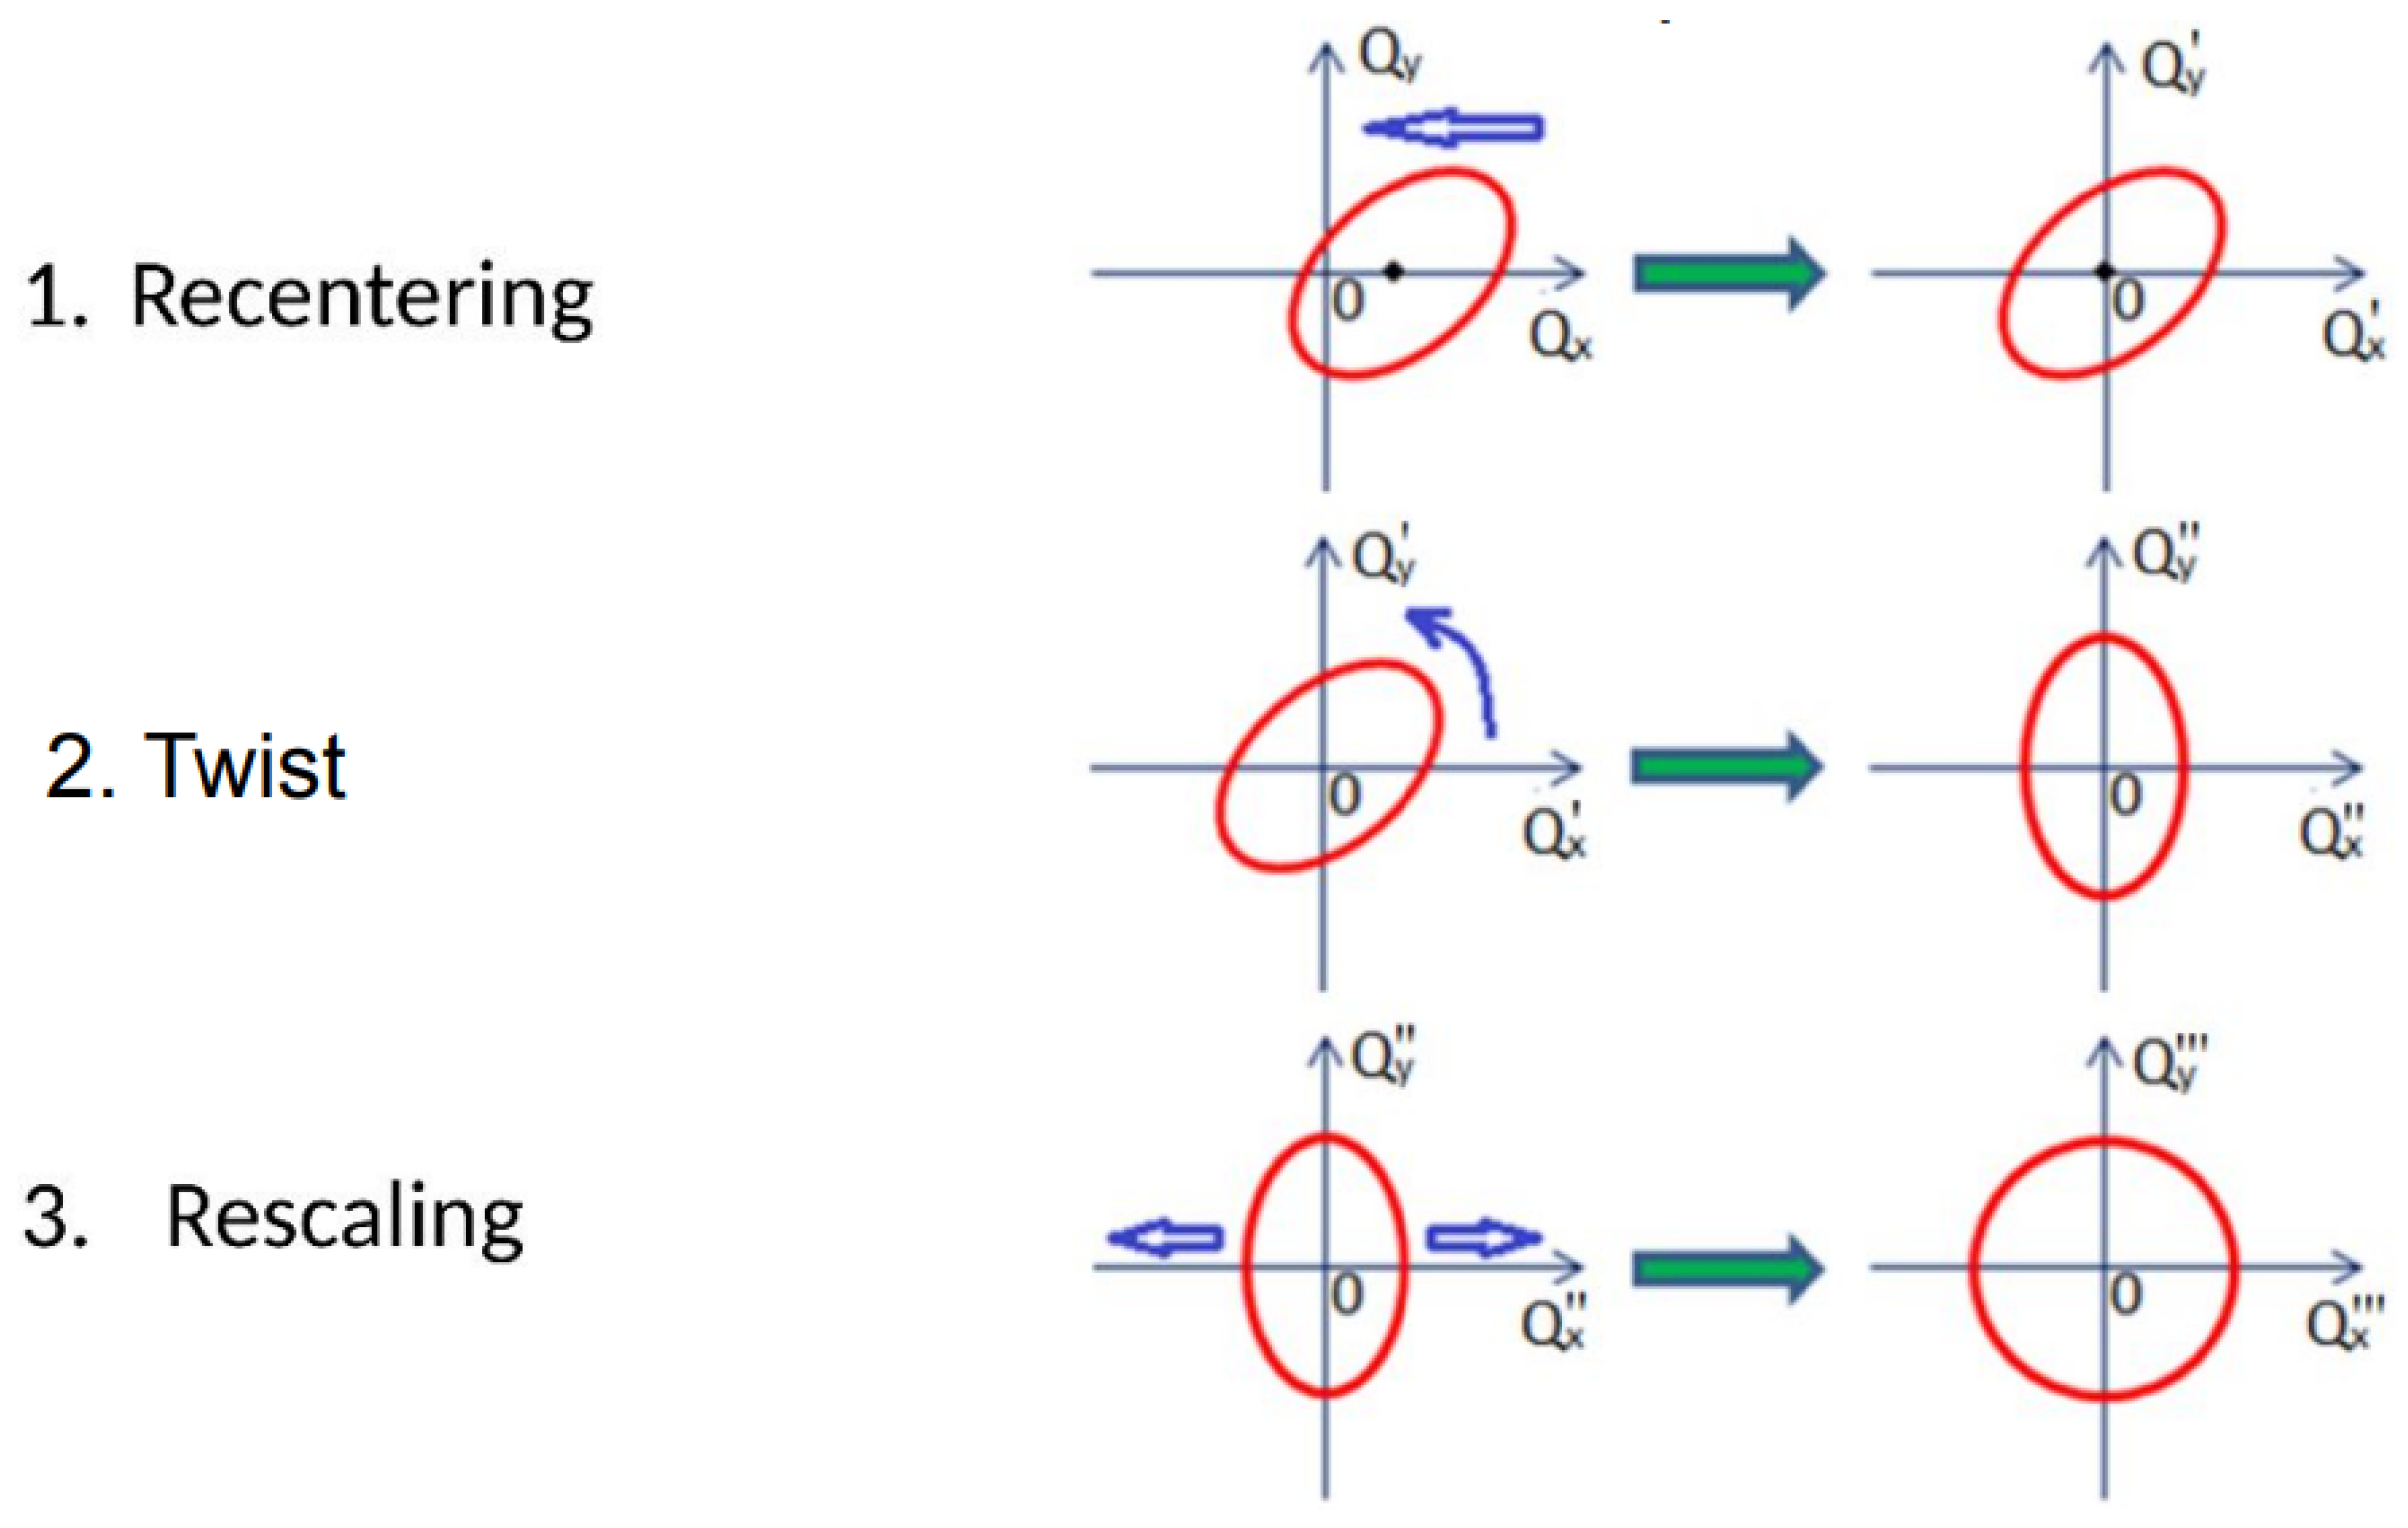
In case of an ideal detector, the Q-vector relation to the symmetry plane is limited only by the multiplicity of the particles within the acceptance. In reality, the detector non-uniformity in and effects from the magnetic field, additional material etc., can bias the flow measurements. This leads to Equations (8) and (9) no longer being valid. Data-driven corrections to the Q-vector for those effects were suggested in [40]:
Recentering the Q-distribution by subtracting the corresponding average values.
Twisting the Q-vector distribution by the rotation of the Q-vector distribution.
Rescaling the Q-vector distribution along x and y directions.
These have been implemented in the QnTools framework [43]. Schematic representations of these corrections are shown in Figure 10.
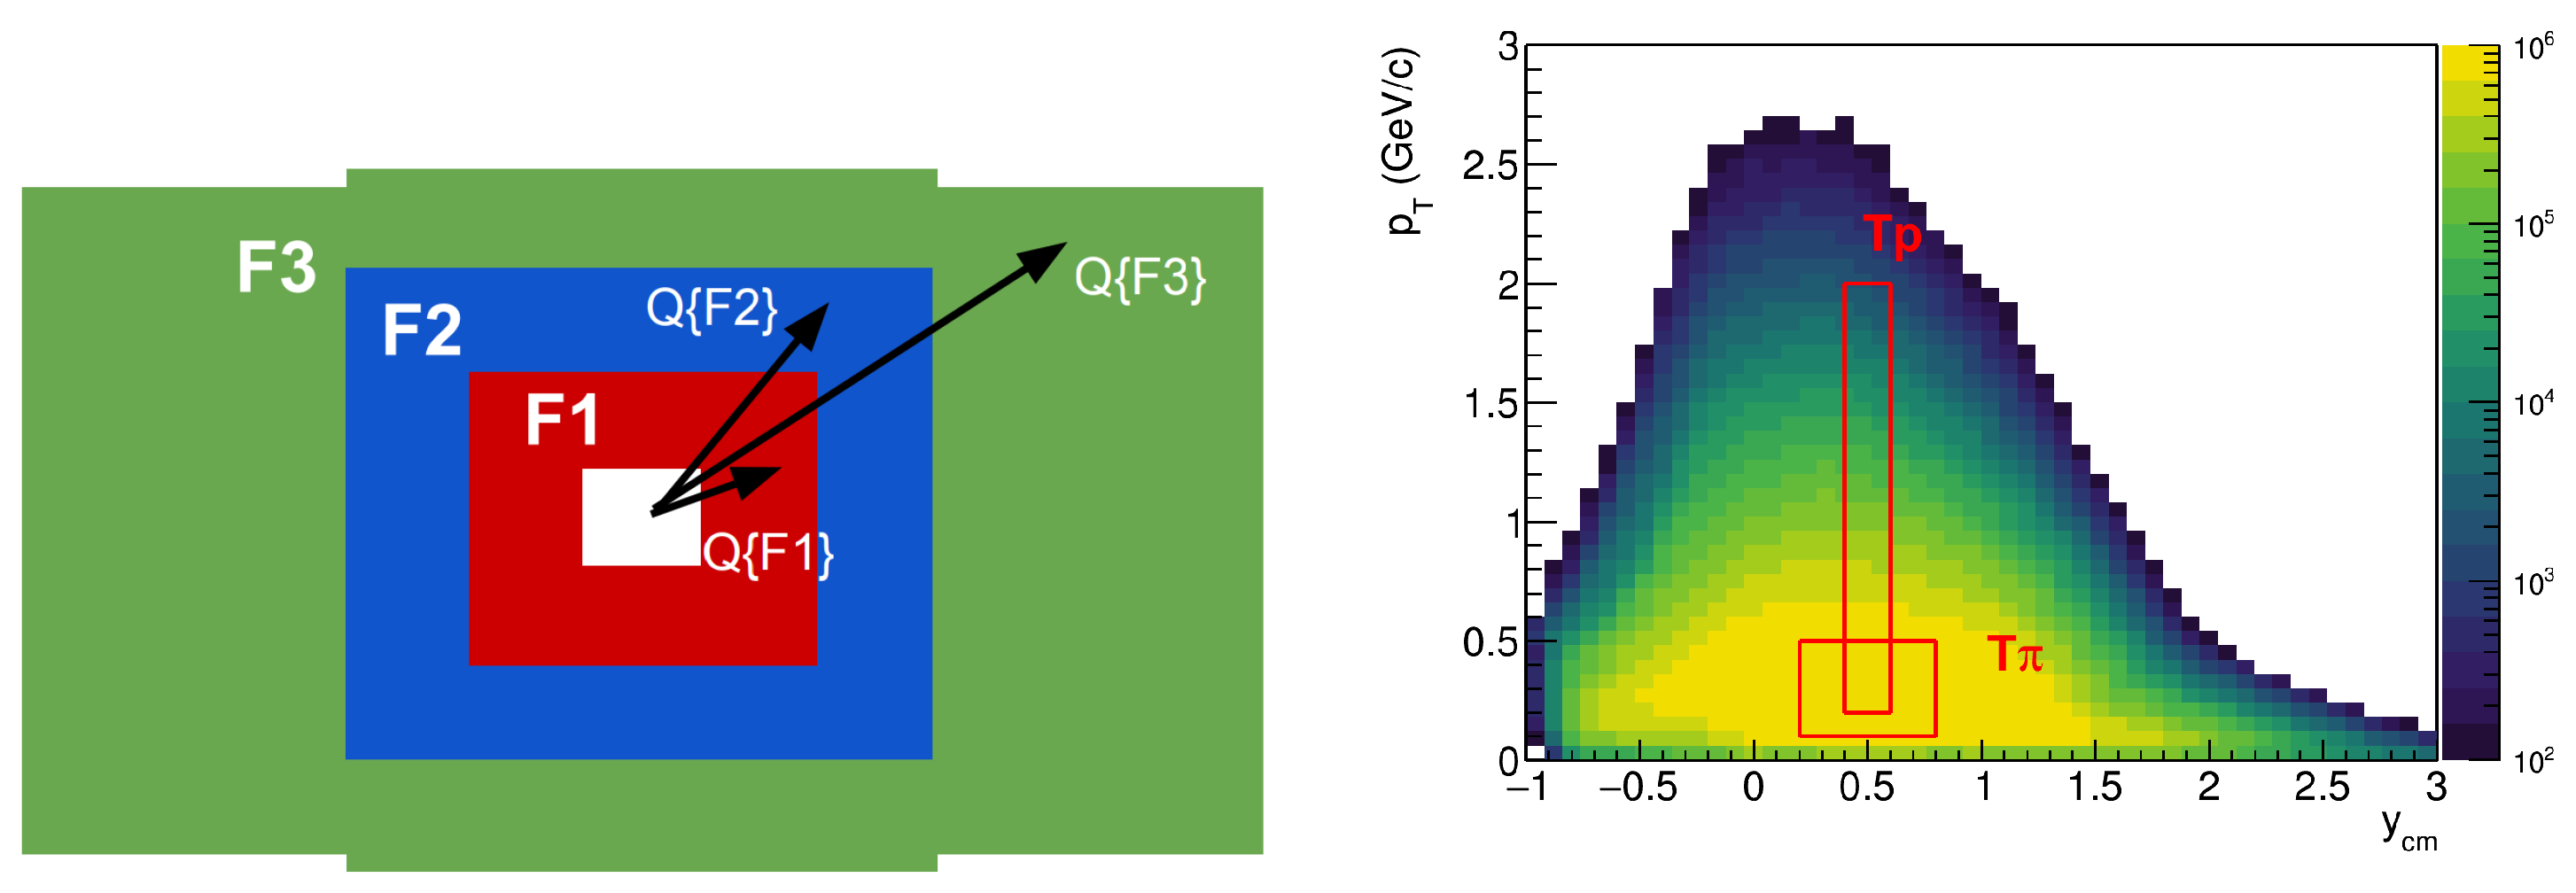
As for the u-vector calculation in the BM@N, the information from charged particle trajectories was used. The symmetry planes were obtained from a set of three groups of FHCal modules. They were divided according to the ranges of pseudorapidity in the laboratory frame : (F1) ; (F2) ; and (F3) , see the left part of Figure 11. The vectors for the FHCal have been obtained as follows:
where is the azimuthal angle of the k-th FHCaL module, and is the signal amplitude seen by the FHCaL module, which is proportional to the energy of spectator. N denotes the total number of modules with a non-zero signal in the given sub-event.
Two additional sub-events were introduced from the tracks of the produced particles. For the first group, we used the protons () in the kinematic window of and and the negative charged pions () for the second group with and . The vectors defined from the tracks ( and ) are calculated according to Equation (3); see the right panel of Figure 11.
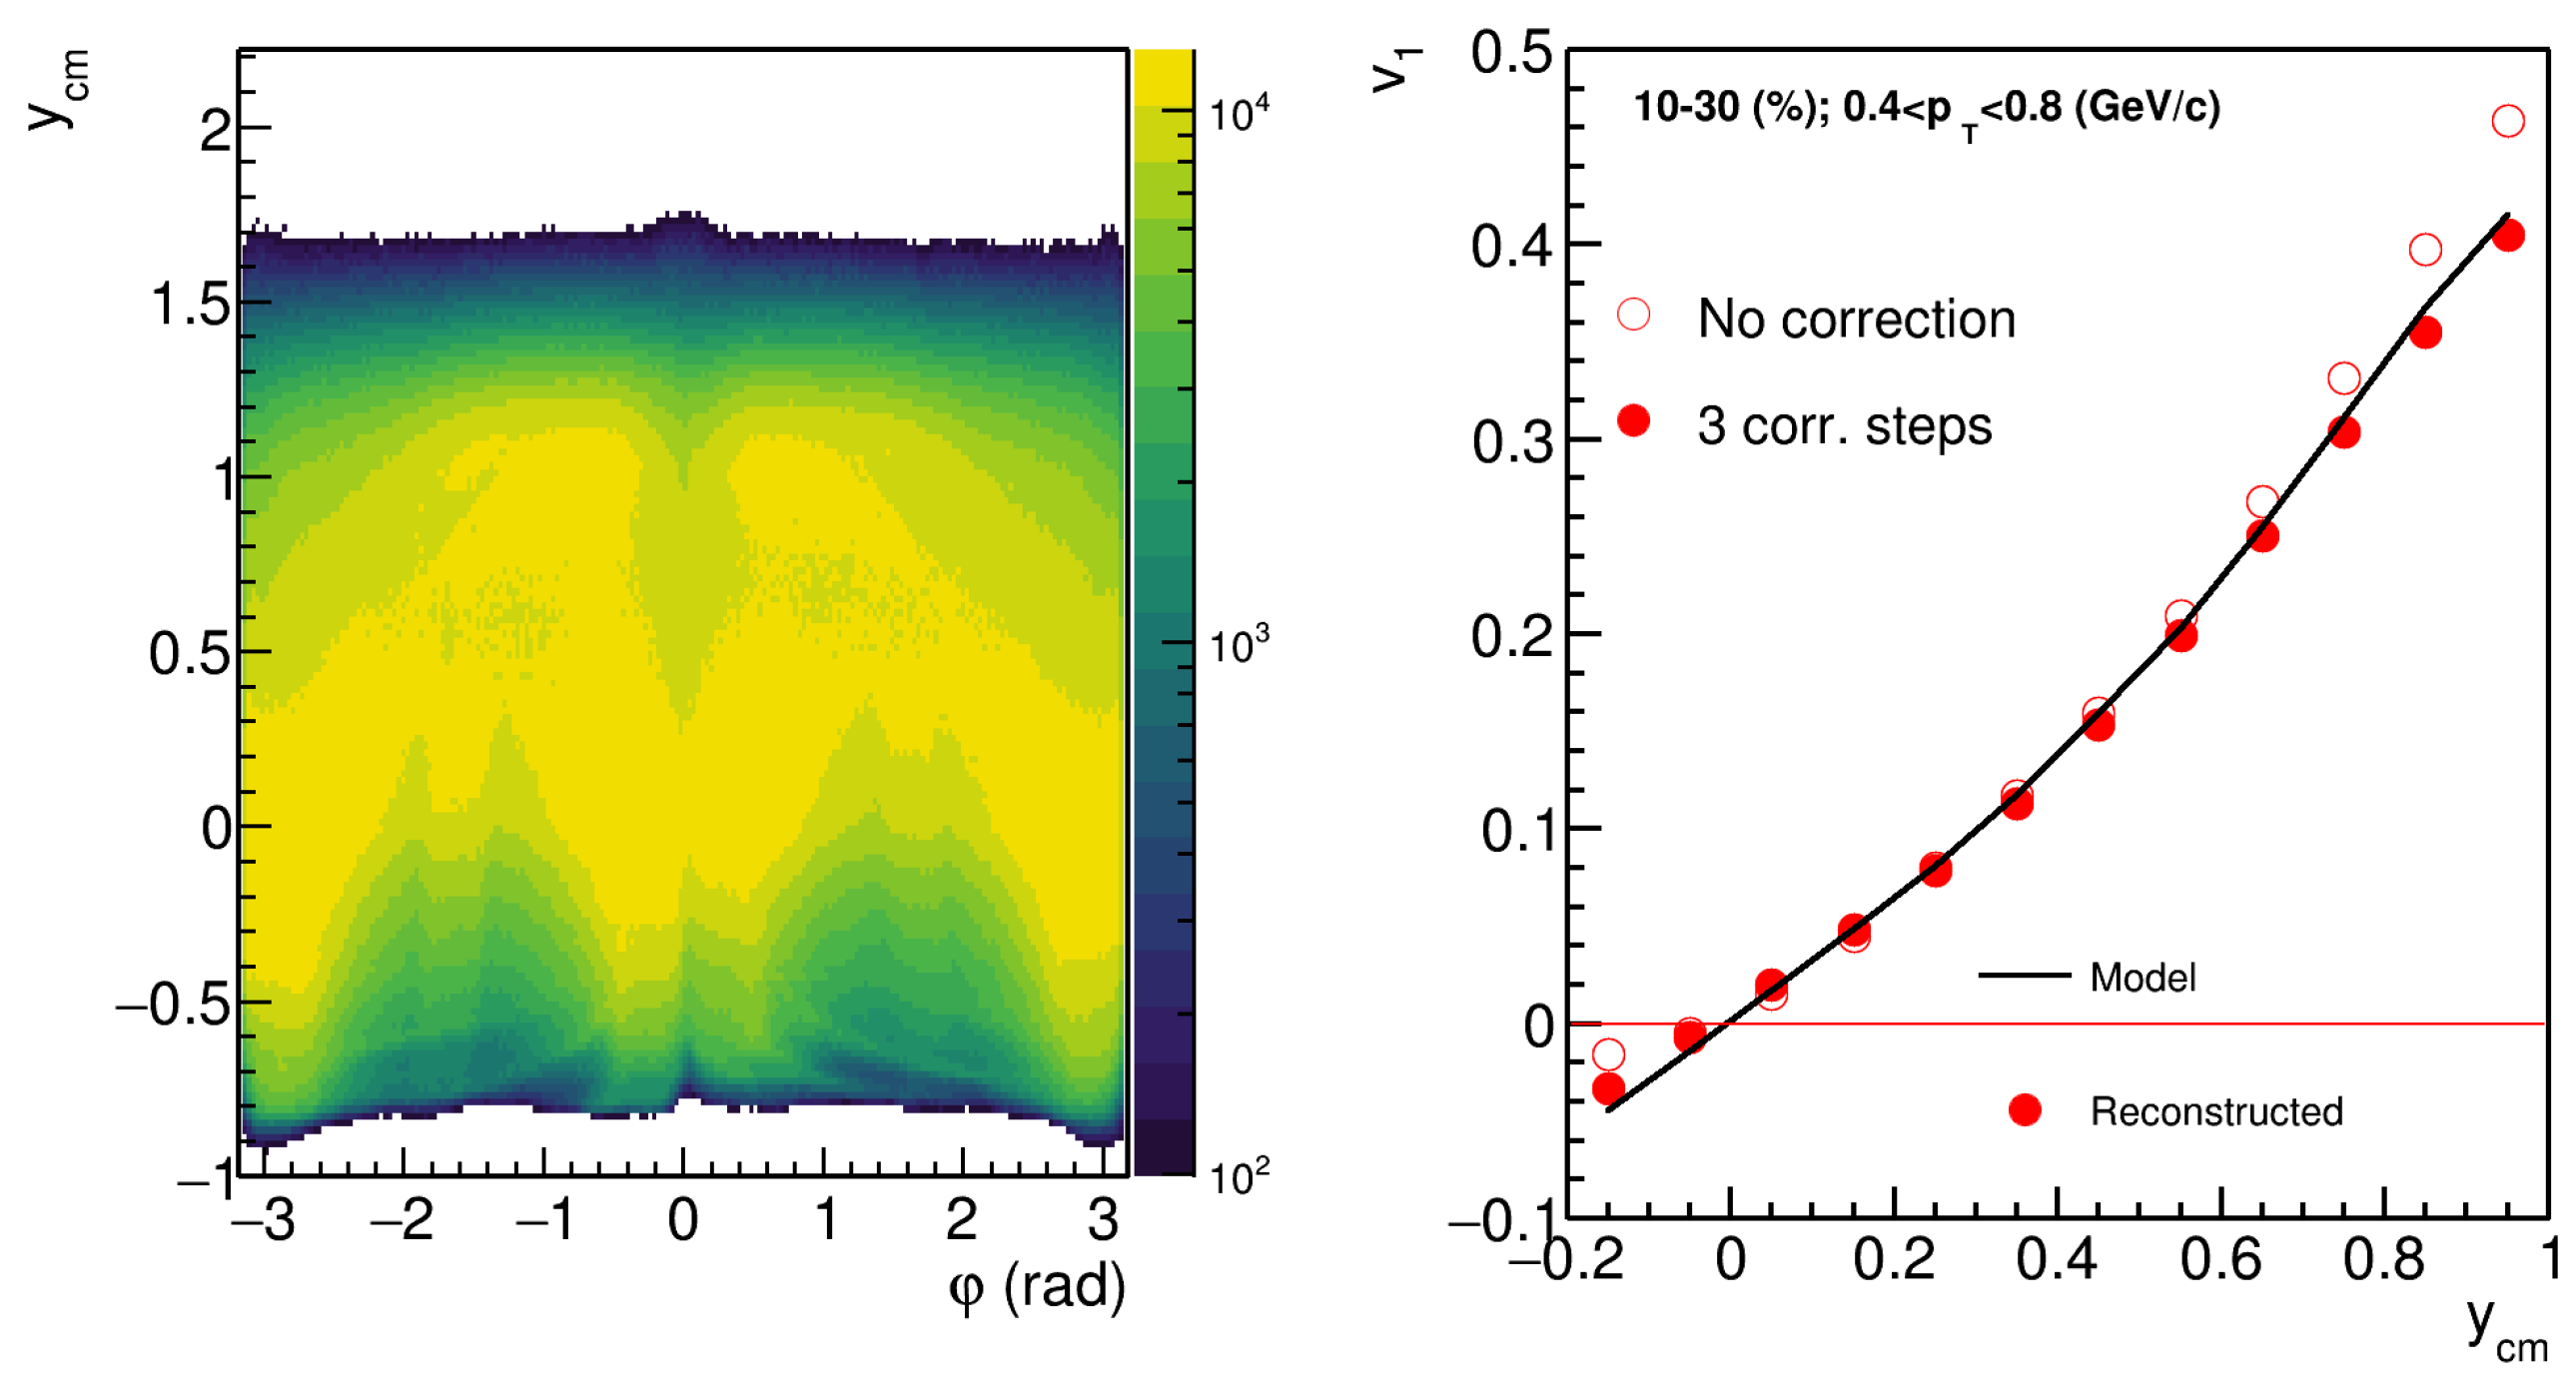
The left part of Figure 12 shows the acceptance for selected protons: azimuthal angle vs center-of-mass rapidity . The azimuthal coverage of the tracking system in the BM@N is strongly non-uniform. The QnTools framework [43] with recentering, twisting and rescaling has been applied for both u and vectors. The comparison of the directed flow of protons before (open symbols) and after corrections (closed symbols) for the non-uniform acceptance is shown in the right part of Figure 12. The application of correction yields a better agreement between the reconstructed (closed symbols) and the model (line) signals in the full range of rapidity. The agreement between reconstructed and model values of is better for the results obtained using the correlation of vectors. The magnetic field of BM@N is directed along the y axis, and it deflects the produced charged particles in the x direction. This may introduce an additional correlation between the X components of the vectors and increase the difference between the reconstructed calculated from the correlation of X components and model values.
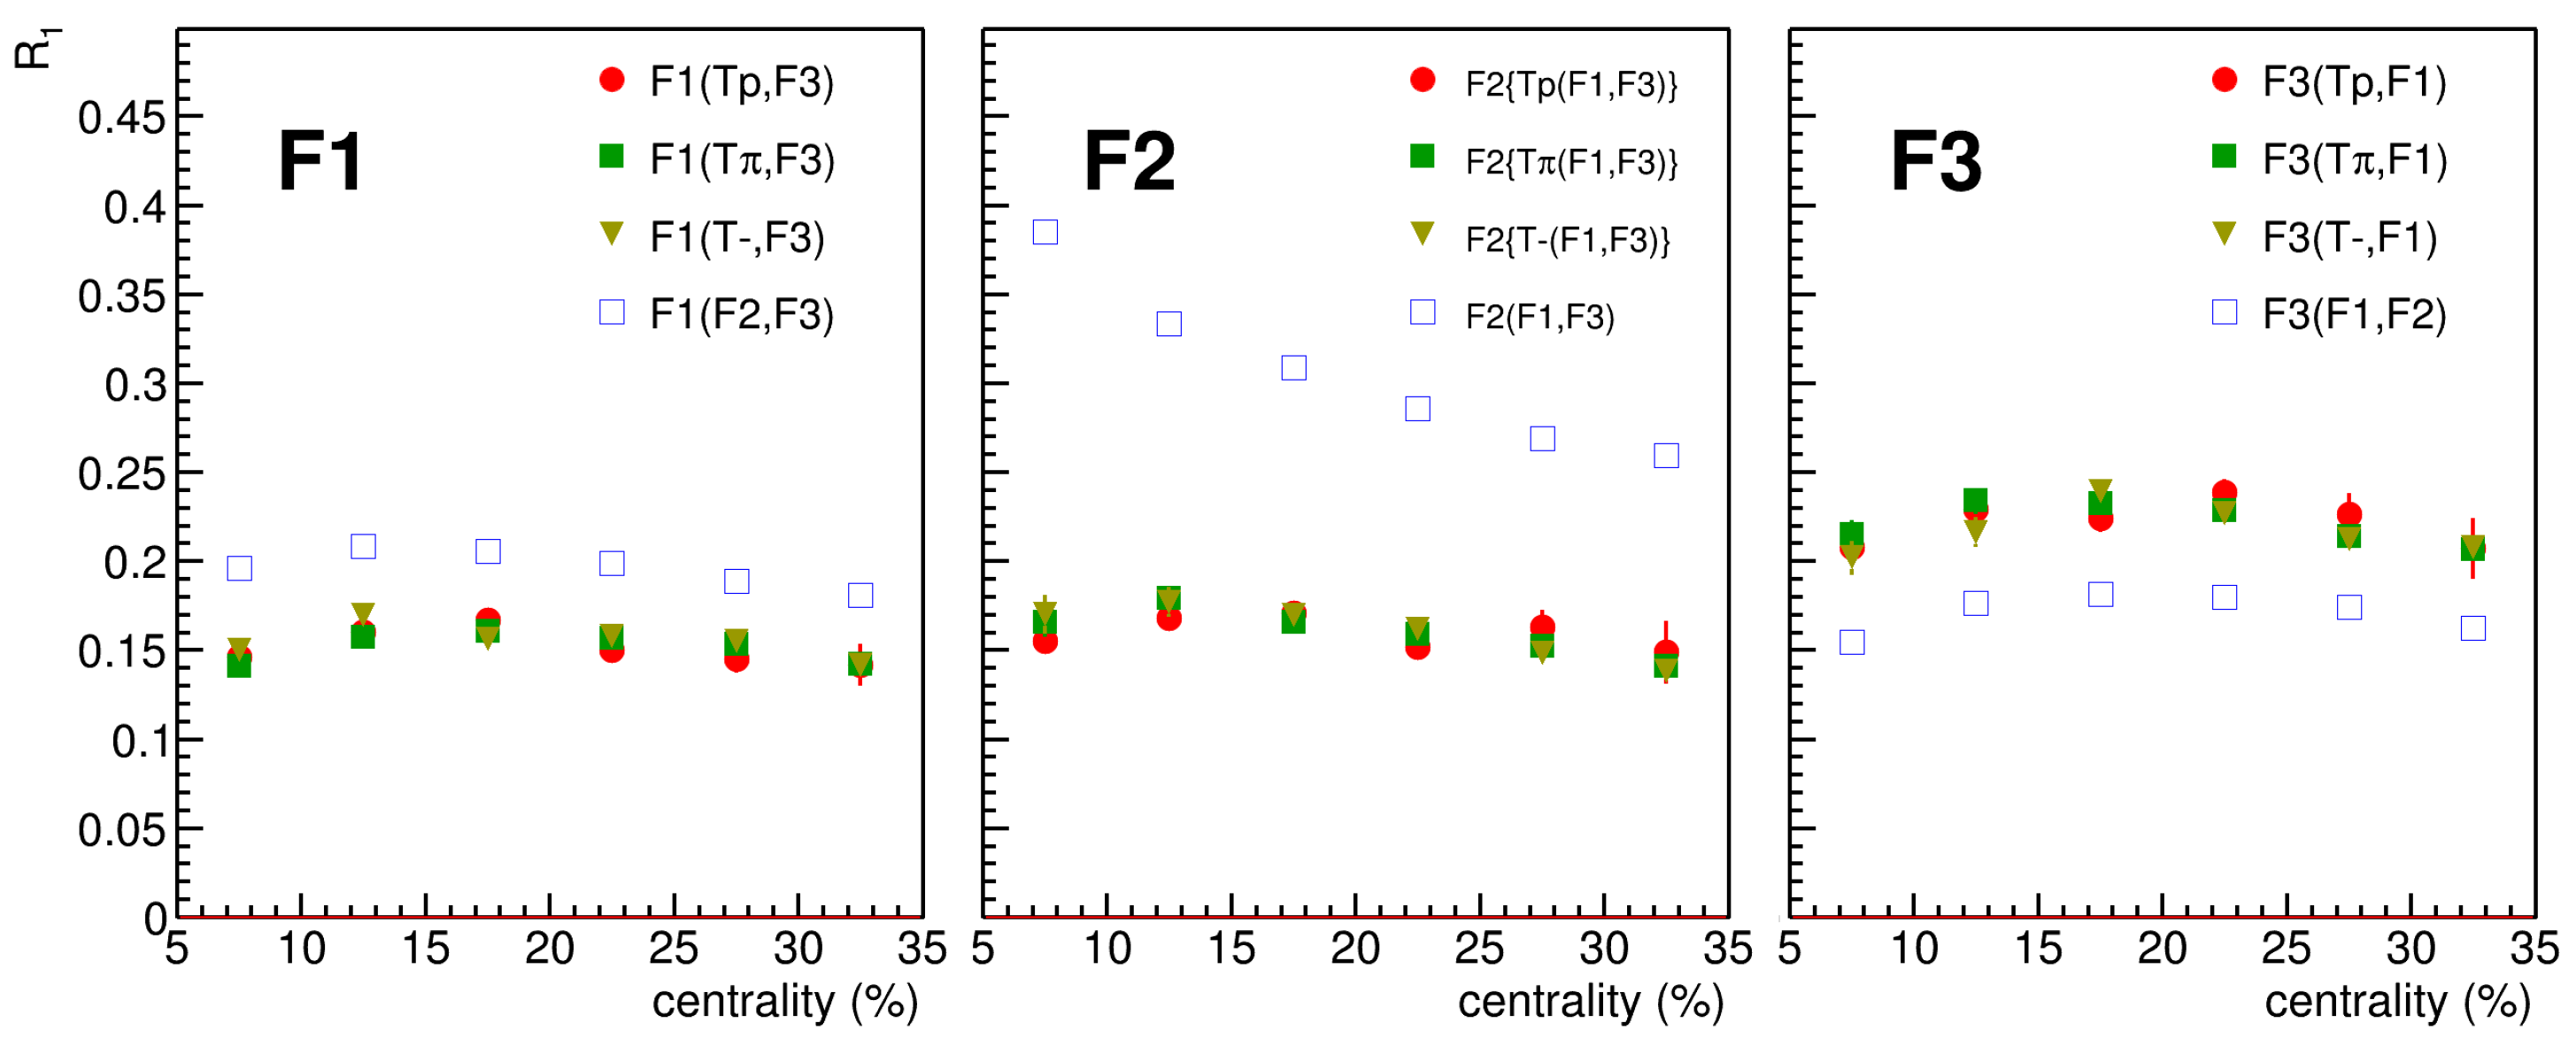
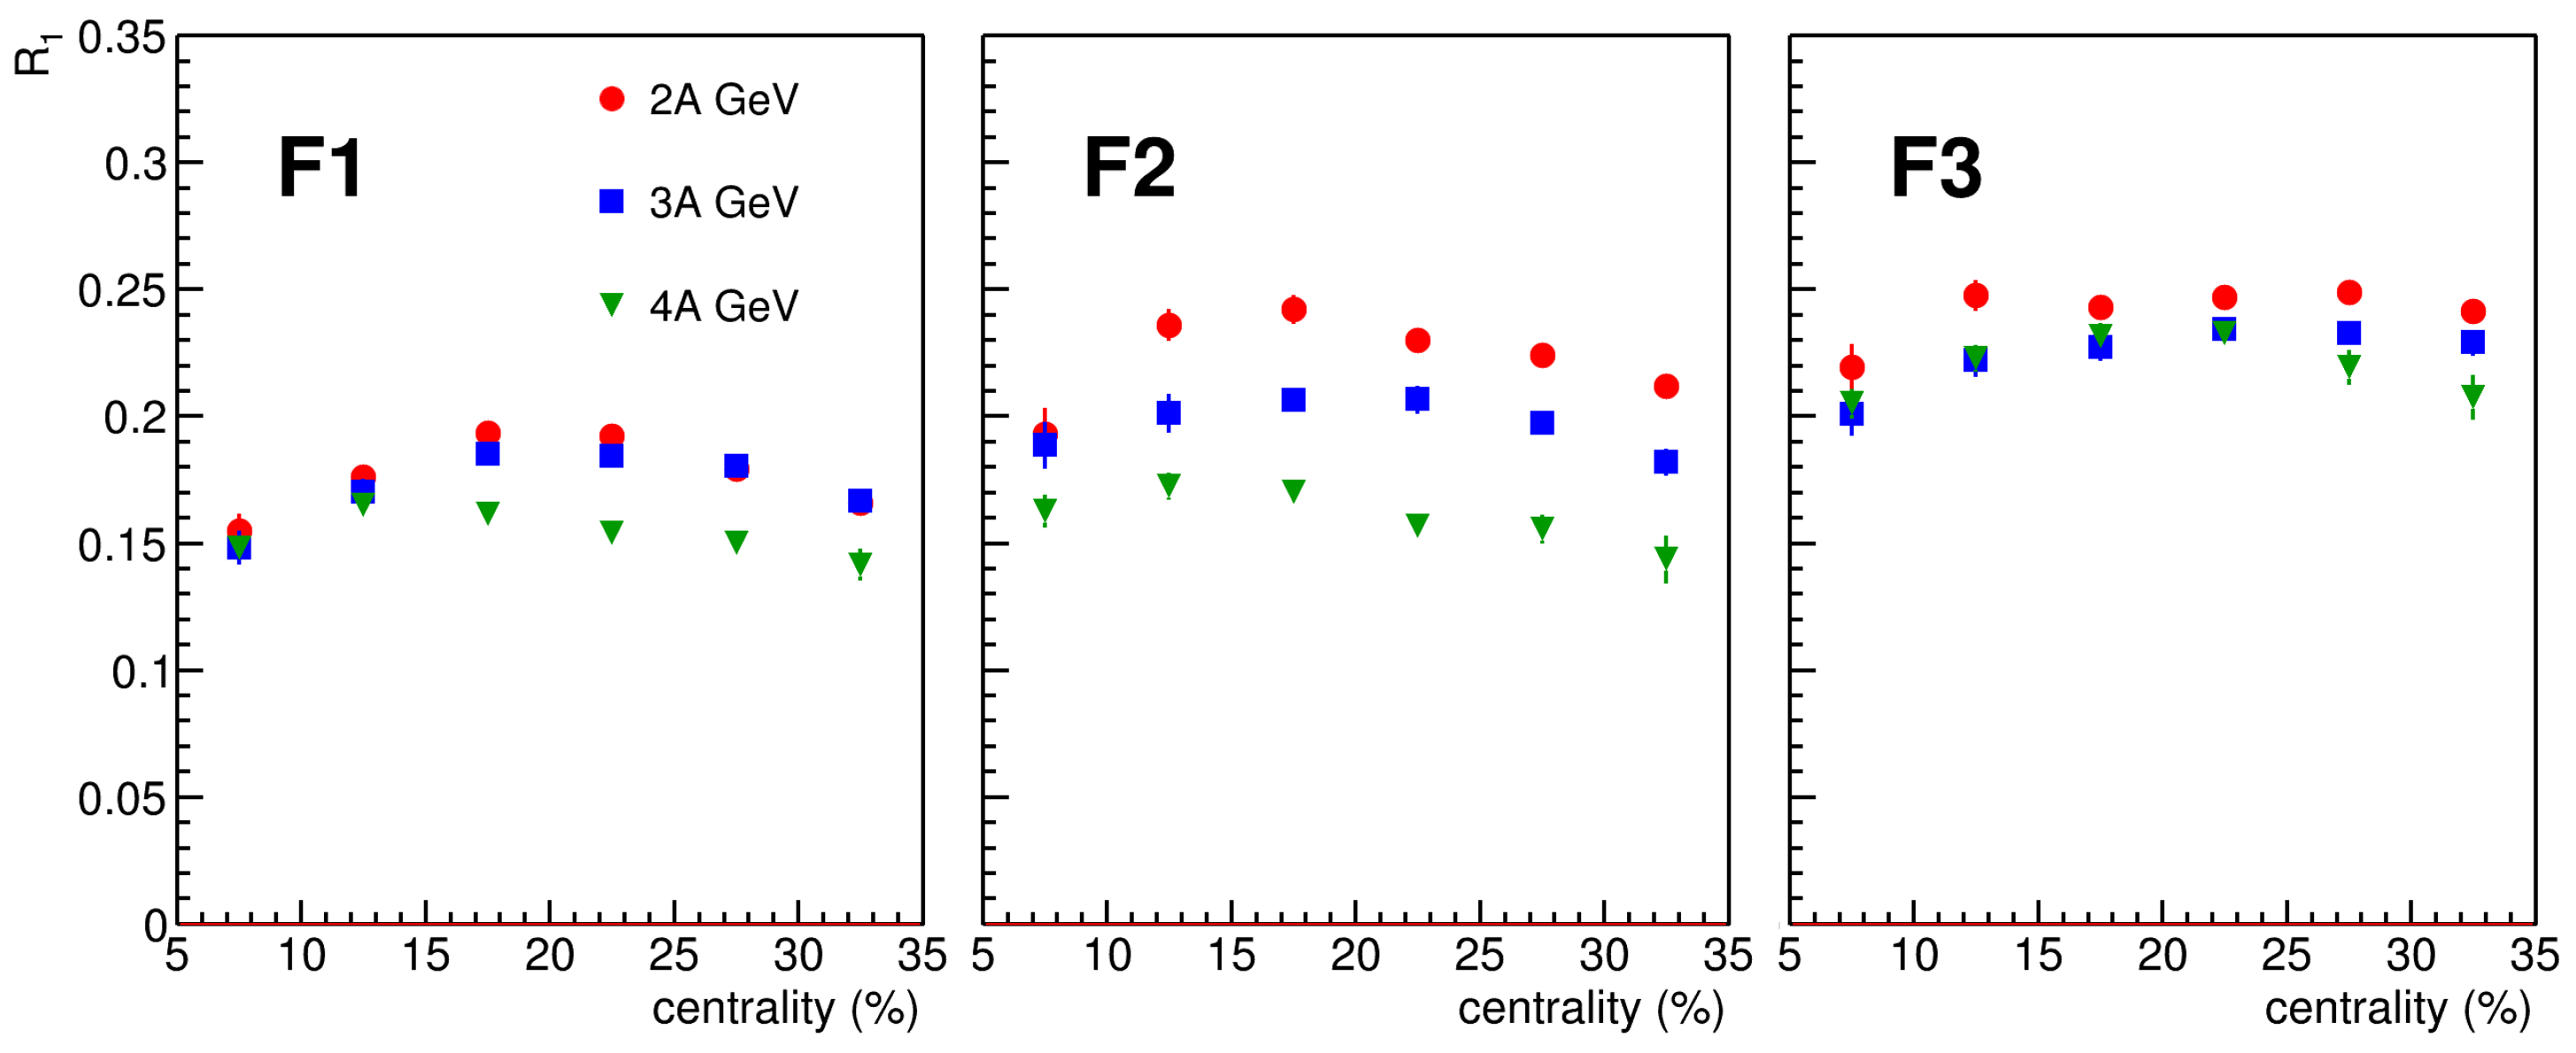
Figure 13 shows the centrality dependence of resolution correction factor for different combinations of -vectors in the three and four-subevent methods for F1, F2 and F3 symmetry planes from left to right. Due to the propagation of a hadronic shower between the FHCal modules in the transverse direction, the estimations for the resolution factor for the combinations of neighboring sub-events such as F1 and F2 or F2 and F3 will be strongly biased (blue markers). In contrast, the values calculated using the combinations with significant rapidity separation (red, green and yellow markers) are found to be in agreement within the statistical errors. Based on this observation, we propose to use the combinations with significant rapidity separation between the -vectors for calculation. Figure 14 shows the centrality dependence of the resolution correction factor for the spectator symmetry plane for different beam energies: 2 AGeV (left), 3 AGeV (middle) and 4 AGeV (right). For all symmetry planes F1, F2 and F3, we observe a decrease of the resolution correction factor with increasing energy. The shortening of the passage time of colliding nuclei at higher energies leaves less time for the interaction between the matter produced within the overlap region and spectators, which leads to smaller values of the spectators’ directed flow and a smaller magnitude of -vectors. As a consequence, one can expect smaller values for the resolution correction factor .
Figure 15 shows the directed (left part) and elliptic flow (right part) signals of protons from the analysis of JAM model events for Xe + Cs(I) collisions at 2 AGeV (circles), 3 AGeV (boxes) and 4 AGeV (triangles). Markers represent the results from the analysis of the fully reconstructed JAM model data, and lines show the results obtained directly from the model (output model particles without reconstruction were correlated with the RP). Only statistical uncertainties are shown. A good agreement is observed between these two sets of results.
5. Summary
In summary, we discuss the prediction of the JAM (RQMD.RMF) model with a hard momentum-dependent EOS set MD2 for the directed () and elliptic () flow of protons from Au + Au, Xe + Cs(I) and Ag + Ag collisions at 1.23 AGeV ( = 2.4 GeV) and Ag + Ag collisions at 1.58 AGeV ( = 2.55 GeV). The use of the scaled rapidity and centrality may simplify the comparison of results for different colliding systems and collision energies in heavy-ion collisions at this beam energy range.
In the second part of the work, we have presented the layout of the upgraded BM@N experiment at the Nuclotron (JINR, Dubna) and results of feasibility studies for Xe + Cs(I) collisions at beam energies of 2 AGeV, 3 AGeV and 4A GeV. The validity of the developed approaches for centrality determination, particle identification and anisotropic flow measurements has been assessed using the generated and fully reconstructed events from the transport models. They have been implemented in the software framework of the BM@N experiment and can be used for real data analysis. The feasibility studies presented here show that the system size dependence of anisotropic flow can be addressed by the upcoming system size scan of the BM@N experiment at the Nuclotron.
Author Contributions
Methodology, M.M.; Software, M.M.; Formal analysis, M.M.; Data curation, M.M.; Writing—original draft, M.M.; Writing—review and editing, A.T.; Supervision, A.T.; Project administration, A.T.; Funding acquisition, A.T. All authors have read and agreed to the published version of the manuscript.
Funding
This work was funded by the MEPhI program Priority 2030 and by the Ministry of Science and Higher Education of the Russian Federation, Project “New Phenomena in Particle Physics and the Early Universe” No FSWU-2023-0073. Part of this research by M. Mamaev was done in INR RAS and is supported by the RSF grant No. 22-12-00132.
Data Availability Statement
Not Applicable.
Acknowledgments
We thank Andrey Moshkin from the MPD collaboration (NICA) for the help with the production of the reconstructed data used in the analysis. Computations were held on the basis of the HybriLIT heterogeneous computing platform (MLIT, JINR).
Conflicts of Interest
The authors declare no conflict of interest. The funders had no role in the design of the study; in the collection, analyses, or interpretation of data; in the writing of the manuscript, or in the decision to publish the results.
References
Bzdak, A.; Esumi, S.; Koch, V.; Liao, J.; Stephanov, M.; Xu, N. Mapping the phases of quantum chromodynamics with beam energy scan. Phys. Rep.2020, 853, 1–87. [Google Scholar] [CrossRef] [Green Version]
Chen, L.W.; Luo, X.; Wang, Q.; Xu, N.; Zhuang, P. Nuclear Matter at High Density and Equation of State; Springer: Singapore, 2022. [Google Scholar]
Esumi, S.; STAR Collaboration. Results from beam energy scan program at RHIC-STAR. In Proceedings of the International conference on Critical Point and Onset of Deconfinement, Baku, Azerbaijan, 24–28 October 2022; p. 1. [Google Scholar]
Kowalski, S.; Na61/Shine Collaboration. Highlights from NA61/SHINE. In Proceedings of the International conference on Critical Point and Onset of Deconfinement, Baku, Azerbaijan, 24–28 October 2022; p. 2. [Google Scholar]
Senger, P. The heavy-ion program at the upgraded BM@N Experiment at NICA. In Proceedings of the International Conference on Critical Point and Onset of Deconfinement, Berlin, Germany, 15–19 March 2021; p. 33. [Google Scholar]
Abgaryan, V.; Acevedo Kado, R.; Afanasyev, S.V.; Agakishiev, G.N.; Alpatov, E.; Altsybeev, G.; Alvarado Hernandez, M.; Andreeva, S.V.; Andreeva, T.V.; Andronov, E.V.; et al. Status and initial physics performance studies of the MPD experiment at NICA. Eur. Phys. J. A2022, 58, 140. [Google Scholar] [CrossRef]
Ablyazimov, T.; Abuhoza, A.; Adak, R.P.; Adamczyk, M.; Agarwal, K.; Aggarwal, M.M.; Ahammed, Z.; Ahmad, F.; Ahmad, N.; Ahmad, S.; et al. Challenges in QCD matter physics-The scientific programme of the Compressed Baryonic Matter experiment at FAIR. Eur. Phys. J. A2017, 53, 60. [Google Scholar] [CrossRef] [Green Version]
Senger, P. Astrophysics with heavy-ion beams. Phys. Scripta2021, 96, 054002. [Google Scholar] [CrossRef]
Voloshin, S.A.; Poskanzer, A.M.; Snellings, R. Collective phenomena in non-central nuclear collisions. Landolt Bornstein2010, 23, 293. [Google Scholar]
Lacey, R.A. The Role of elliptic flow correlations in the discovery of the sQGP at RHIC. Nucl. Phys. A2006, 774, 199–214. [Google Scholar] [CrossRef] [Green Version]
Pinkenburg, C.; Ajitanand, N.N.; Alexander, J.M.; Anderson, M.; Best, D.; Brady, F.P.; Case, T.; Caskey, W.; Cebra, D.; Chance, J.L.; et al. Elliptic flow: Transition from out-of-plane to in-plane emission in Au + Au collisions. Phys. Rev. Lett.1999, 83, 1295–1298. [Google Scholar] [CrossRef] [Green Version]
Liu, H.; Ajitanand, N.N.; Alexander, J.M.; Anderson, M.; Best, D.; Brady, F.P.; Case, T.; Caskey, W.; Cebra, D.; Chance, J.; et al. Sideward flow in Au + Au collisions between 2-A-GeV and 8-A-GeV. Phys. Rev. Lett.2000, 84, 5488–5492. [Google Scholar] [CrossRef]
Chung, P. Differential elliptic flow in 2-A-GeV-6-A-GeV Au + Au collisions: A New constraint for the nuclear equation of state. Phys. Rev. C2002, 66, 021901. [Google Scholar]
Danielewicz, P.; Lacey, R.; Lynch, W.G. Determination of the equation of state of dense matter. Science2002, 298, 1592–1596. [Google Scholar] [CrossRef] [Green Version]
Abdallah, M.S.; Aboona, B.E.; Adam, J.; Adamczyk, L.; Adams, J.R.; Adkins, J.K.; Aggarwal, M.M.; Aggarwal, I.; Ahammed, Z.; Agakishiev, G.; et al. Disappearance of partonic collectivity in = 3 GeV Au + Au collisions at RHIC. Phys. Lett. B2022, 827, 137003. [Google Scholar] [CrossRef]
Adam, J.; Abdallah, M.S.; Adam, J.; Adamczyk, L.; Adams, J.R.; Adkins, J.K.; Agakishiev, G.; Aggarwal, I.; Aggarwal, M.M.; Ahammed, Z. Flow and interferometry results from Au + Au collisions at =4.5 GeV. Phys. Rev. C2021, 103, 034908. [Google Scholar]
Adamczewski-Musch, J.; Arnold, O.; Behnke, C.; Belounnas, A.; Belyaev, A.; Berger-Chen, J.C.; Blanco, A.; Blume, C.; Böhmer, M.; Bordalo, P.; et al. Directed, Elliptic, and Higher Order Flow Harmonics of Protons, Deuterons, and Tritons in Au+Au Collisions at =2.4 GeV. Phys. Rev. Lett.2020, 125, 262301. [Google Scholar] [CrossRef]
Senger, P. Heavy-Ion Collisions at FAIR-NICA Energies. Particles2021, 4, 20. [Google Scholar] [CrossRef]
Sorensen, A.; Agarwal, K.; Brown, K.W.; Chajecki, Z.; Danielewicz, P.; Drischler, C.; Kaminski, M.; Ko, C.M. Dense Nuclear Matter Equation of State from Heavy-Ion Collisions. arXiv2023, arXiv:2301.13253. [Google Scholar]
Reisdorf, W.; Leifels, Y.; Andronic, A.; Averbeck, R.; Barret, V.; Basrak, Z.; Bastid, N.; Benabderrahmane, M.L.; Čaplar, R.; Crochet, P.; et al. Systematics of azimuthal asymmetries in heavy ion collisions in the 1 A GeV regime. Nucl. Phys. A2012, 876, 1–60. [Google Scholar] [CrossRef]
Le Fèvre, A.; Leifels, Y.Y.; Reisdorf, W.; Aichelin, J.; Hartnack, C. Constraining the nuclear matter equation of state around twice saturation density. Nucl. Phys. A2016, 945, 112–133. [Google Scholar] [CrossRef] [Green Version]
Oliinychenko, D.; Sorensen, A.; Koch, V.; McLerran, L. Sensitivity of Au + Au collisions to the symmetric nuclear matter equation of state at 2–5 nuclear saturation densities. arXiv2022, arXiv:2208.11996. [Google Scholar]
Brandenburg, D.; Butterworth, J.; Eppley, G.; Geurts, F.; Roberts, J.B.; Xin, K.; Yepes, P.; STAR Collaboration. Centrality dependence of identified particle elliptic flow in relativistic heavy ion collisions at =7.7–62.4 GeV. Phys. Rev. C2016, 93, 014907. [Google Scholar]
Nara, Y.; Maruyama, T.; Stoecker, H. Momentum-dependent potential and collective flows within the relativistic quantum molecular dynamics approach based on relativistic mean-field theory. Phys. Rev. C2020, 102, 024913. [Google Scholar] [CrossRef]
Nara, Y. JAM: An event generator for high energy nuclear collisions. EPJ Web Conf.2019, 208, 11004. [Google Scholar] [CrossRef] [Green Version]
Nara, Y.; Stoecker, H. Sensitivity of the excitation functions of collective flow to relativistic scalar and vector meson interactions in the relativistic quantum molecular dynamics model RQMD.RMF. Phys. Rev. C2019, 100, 054902. [Google Scholar] [CrossRef] [Green Version]
Parfenov, P. Model Study of the Energy Dependence of Anisotropic Flow in Heavy-Ion Collisions at = 2–4.5 GeV. Particles2022, 5, 40. [Google Scholar] [CrossRef]
Mamaev, M.; Selyuzhenkov, I.; Golosov,, O. Proton Directed Flow Relative to the Spectator Plane in Ag + Ag Collisions at 1.23A and 1.58A GeV with HADES, 3rd Workshop on “Physics Performance Studies at FAIR and NICA” (FANI-2021). Available online: https://indico.oris.mephi.ru/event/221/session/2/contribution/11/material/slides/0.pdf (accessed on 1 February 2023).
Larionov, A.B.; Cassing, W.W.; Greiner, C.; Mosel, U. Squeezeout of nuclear matter in peripheral heavy ion collisions and momentum dependent effective interactions. Phys. Rev. C2000, 62, 064611. [Google Scholar] [CrossRef] [Green Version]
BM@N Experiment at Nuclotron (JINR). Available online: https://bmn.jinr.ru/about/ (accessed on 1 February 2023).
Babkin, V.; Basilev, S.; Buryakov, M.; Golovatyuk, V.; Lobastov, S.; Petrov, V.; Rumyantsev, M.; Schipunov, A.; Shutov, A.; Slepnev, I.; et al. Triple-stack multigap resistive plate chamber with strip readout. Nucl. Instrum. Meth. A2016, 824, 490–492. [Google Scholar] [CrossRef]
Izvestnyy, A.; Golubeva, M.M.; Guber, F.; Ivashkin, A.; Karpushkin, N.; Morozov, S. Commissioning of new FHCal at BM@N experiment. J. Phys. Conf. Ser.2022, 2374, 012023. [Google Scholar] [CrossRef]
Guber, F.; Finogeev, D.; Golubeva, M.; Ivashkin, A.; Izvestnyy, A.; Kapishin, M.; Karpushkin, N.; Morozov, S.; Petukhov, O. New forward hadron calorimeter and hodoscope for the BM@N heavy ions experiment. JINST2020, 15, C05020. [Google Scholar] [CrossRef]
Baznat, M.; Botvina, A.; Musulmanbekov, G.; Toneev, V.; Zhezher, V. Monte-Carlo Generator of Heavy Ion Collisions DCM-SMM. Phys. Part. Nucl. Lett.2020, 17, 303–324. [Google Scholar] [CrossRef]
Afanasiev, S.; Agakishiev, G.; Aleksandrov, E.; Aleksandrov, I.; Alekseev, P.; Alishina, K.; Atkin, E.; Aushev, T.; Babkin, V.; Balashov, N.; et al. Production of π+ and K+ mesons in argon-nucleus interactions at 3.2 AGeV. arXiv2023, arXiv:2303.16243. [Google Scholar]
Akishina, V.; Kisel, I. Time-based Cellular Automaton track finder for the CBM experiment. J. Phys. Conf. Ser2015, 599, 012024. [Google Scholar] [CrossRef] [Green Version]
Parfenov, P.; Idrisov, D.; Luong, V.B.; Taranenko, A. Relating Charged Particle Multiplicity to Impact Parameter in Heavy-Ion Collisions at NICA Energies. Particles2021, 4, 24. [Google Scholar] [CrossRef]
Selyuzhenkov, I.; Voloshin, S. Effects of non-uniform acceptance in anisotropic flow measurement. Phys. Rev. C2008, 77, 034904. [Google Scholar] [CrossRef] [Green Version]
Mamaev, M.; Golosov, O.; Selyuzhenkov, I.; HADES Collaboration. Directed flow of protons with the event plane and scalar product methods in the HADES experiment at SIS18. J. Phys. Conf. Ser.2020, 1690, 012122. [Google Scholar] [CrossRef]
Mamaev, M.; Golosov, O.; Selyuzhenkov, I. Estimating Non-Flow Effects in Measurements of Anisotropic Flow of Protons with the HADES Experiment at GSI. Phys. Part. Nucl.2022, 53, 277–281. [Google Scholar] [CrossRef]
Figure 1.
Pressure as a function of baryon density for symmetric nuclear matter. Selected constraints on the symmetric EOS obtained from comparisons of experimental data to hadronic transport simulations. The solid yellow region shows the constraint from the elliptic flow of protons and fragments (FOPI, GSI) and the measurement of subthreshold kaon production (KAOS, GSI). The grey hatched region shows the constraint provided by directed and elliptic flow of protons measured by E895 and E877 experiments at AGS. Red and blue solid lines denote the hard and soft EOS, respectively. The figure is taken from [19].
Figure 2.
(left) Excitation function of of protons from mid-central Au + Au collisions at energies from = 2 to 62.4 GeV. Data points are taken from the following references: FOPI [22], E895 [12,13,14] and STAR [16,25]. (right) Excitation function of of protons from mid-central Au + Au collisions at energies from = 2.4 to 4.5 GeV. The results for the JAM (RQMD.RMF) model [26] with a hard momentum-dependent mean-field MD2 ( = 380 MeV) EOS have been obtained in the present work.
Figure 3.
Rapidity () dependence of anisotropic flow coefficients (a) and (b) of protons with Gev/c in the 20–30% central Au + Au collisions at GeV. The black closed star symbols represent the published data from the HADES experiment [18]. The blue (MD2), purple (MD4), red (NS1) and yellow (NS2) bands represent the results from the mean-field mode of the JAM model with different EOS, as indicated. The figure is taken from [29].
Figure 4.
The prediction of the mean-field mode of the JAM model with hard momentum-dependent mean-field MD2 EOS for rapidity (left) and scaled () rapidity (right) dependence of directed () flow of protons with Gev/c. The lines with different types and colors represent the JAM model results for Au + Au, Xe + Cs(I), Ag + Ag at 1.23 AGeV and Ag + Ag at 1.58 AGeV, as indicated. The solid green circles show the published data from the HADES experiment for Au + Au at 1.23 AGeV [18].
Figure 5.
(Left panel): The predictions of the mean-field mode of the JAM model with hard momentum-dependent mean-field MD2 EOS for dependence of signal of protons with −0.25 15 from mid-central heavy-ion collisions. The lines with different types and colors represent the JAM model results for Au + Au, Xe + Cs(I) and Ag + Ag at 1.23 AGeV and Ag + Ag at 1.58 AGeV, as indicated. (Right panel): divided by the corresponding value of the slope of signal at mid-rapidity () for the same centrality selection.
Figure 6.
(Left panel): of protons from Au + Au (closed symbols) and Xe + Cs(I) (open symbols) collisions at 1.23 AGeV for different bins in collision centrality. (Right panel): (centrality, ) divided by k = 0.25 times the integrated value |(int, centrality)| for an each bin in centrality. The results for the JAM model with hard momentum-dependent mean-field MD2 EOS.
Figure 7.
The layout of the BM@N experiment for the Xe + Cs(I) run 2022–2023 [32].
Figure 7.
The layout of the BM@N experiment for the Xe + Cs(I) run 2022–2023 [32].
Figure 8.
Charged particle multiplicity distribution from the fully reconstructed DCM-QGSM-SMM model events (open squares) for Xe + Cs(I) collisions at 4 AGeV compared to the fitted distribution using the MC-Glauber approach (left) and -fit method (right). The resulting 10% centrality classes are indicated with black dotted vertical lines.
Figure 9.
(Left): Relative momentum resolution as a function of the momentum p for fully reconstructed charged tracks from Xe + Cs(I) collisions generated using the JAM model at different kinetic energies: 4 AGeV (triangles), 3 AGeV (boxes) and 2 AGeV (circles). (Right): Population of the reconstructed charged particles in the velocity vs. laboratory momentum over charge () plane for the TOF-400.
Figure 10.
Schematic illustration of recentering, twisting and rescaling correction steps for the Q-vector introduced in [40].
Figure 10.
Schematic illustration of recentering, twisting and rescaling correction steps for the Q-vector introduced in [40].
Figure 11.
(Left part): Schematic representation of modules of the Forwar Hadron Calorimeter divided into three groups. The corresponding sub-events are represented with different colors. Arrows denote the Q-vectors of each sub-event. (Right part): Schematic representation of kinematic windows for charged particles -vectors.
Figure 12.
(Left) Raw yield of protons as a function of azimuthal angle and center-of-mass rapidity . (Right) Comparison of the directed flow signal of protons before (open symbols) and after (closed symbols) corrections on the azimuthal non-uniformity; see text for the details.
Figure 12.
(Left) Raw yield of protons as a function of azimuthal angle and center-of-mass rapidity . (Right) Comparison of the directed flow signal of protons before (open symbols) and after (closed symbols) corrections on the azimuthal non-uniformity; see text for the details.
Figure 13.
The centrality dependence of resolution correction factor for different combinations of -vectors in the three and four-subevent methods for F1, F2 and F3 symmetry planes from (left) to (right).
Figure 13.
The centrality dependence of resolution correction factor for different combinations of -vectors in the three and four-subevent methods for F1, F2 and F3 symmetry planes from (left) to (right).
Figure 14.
The centrality dependence of the resolution correction factor for spectator plane. The results are presented for sub-events F1, F2 and F3: panels from (left) to (right). Different symbols correspond to the results for different beam energies: 2, 3 and 4 AGeV.
Figure 14.
The centrality dependence of the resolution correction factor for spectator plane. The results are presented for sub-events F1, F2 and F3: panels from (left) to (right). Different symbols correspond to the results for different beam energies: 2, 3 and 4 AGeV.
Figure 15.
(Left): Directed flow of protons as a function of center-of-mass rapidity for Xe + Cs(I) collisions at 2 AGeV (circles), 3 AGeV (boxes) and 4 AGeV (triangles). (Right): Elliptic flow of protons as a function of transverse momentum . Markers represent the results of the analysis of the fully reconstructed JAM model data, and lines show the results obtained directly from the model.
Disclaimer/Publisher’s Note: The statements, opinions and data contained in all publications are solely those of the individual author(s) and contributor(s) and not of MDPI and/or the editor(s). MDPI and/or the editor(s) disclaim responsibility for any injury to people or property resulting from any ideas, methods, instructions or products referred to in the content.
Mamaev, M.; Taranenko, A.
Toward the System Size Dependence of Anisotropic Flow in Heavy-Ion Collisions at = 2–5 GeV. Particles2023, 6, 622-637.
https://doi.org/10.3390/particles6020036
AMA Style
Mamaev M, Taranenko A.
Toward the System Size Dependence of Anisotropic Flow in Heavy-Ion Collisions at = 2–5 GeV. Particles. 2023; 6(2):622-637.
https://doi.org/10.3390/particles6020036
Chicago/Turabian Style
Mamaev, Mikhail, and Arkadiy Taranenko.
2023. "Toward the System Size Dependence of Anisotropic Flow in Heavy-Ion Collisions at = 2–5 GeV" Particles 6, no. 2: 622-637.
https://doi.org/10.3390/particles6020036
Article Metrics
No
No
Article Access Statistics
For more information on the journal statistics, click here.
Multiple requests from the same IP address are counted as one view.
Mamaev, M.; Taranenko, A.
Toward the System Size Dependence of Anisotropic Flow in Heavy-Ion Collisions at = 2–5 GeV. Particles2023, 6, 622-637.
https://doi.org/10.3390/particles6020036
AMA Style
Mamaev M, Taranenko A.
Toward the System Size Dependence of Anisotropic Flow in Heavy-Ion Collisions at = 2–5 GeV. Particles. 2023; 6(2):622-637.
https://doi.org/10.3390/particles6020036
Chicago/Turabian Style
Mamaev, Mikhail, and Arkadiy Taranenko.
2023. "Toward the System Size Dependence of Anisotropic Flow in Heavy-Ion Collisions at = 2–5 GeV" Particles 6, no. 2: 622-637.
https://doi.org/10.3390/particles6020036


