
A Monte Carlo Study of Hyperon Production with the MPD and BM@N Experiments at NICA

 , ,
, ,
Abstract
:1. Introduction
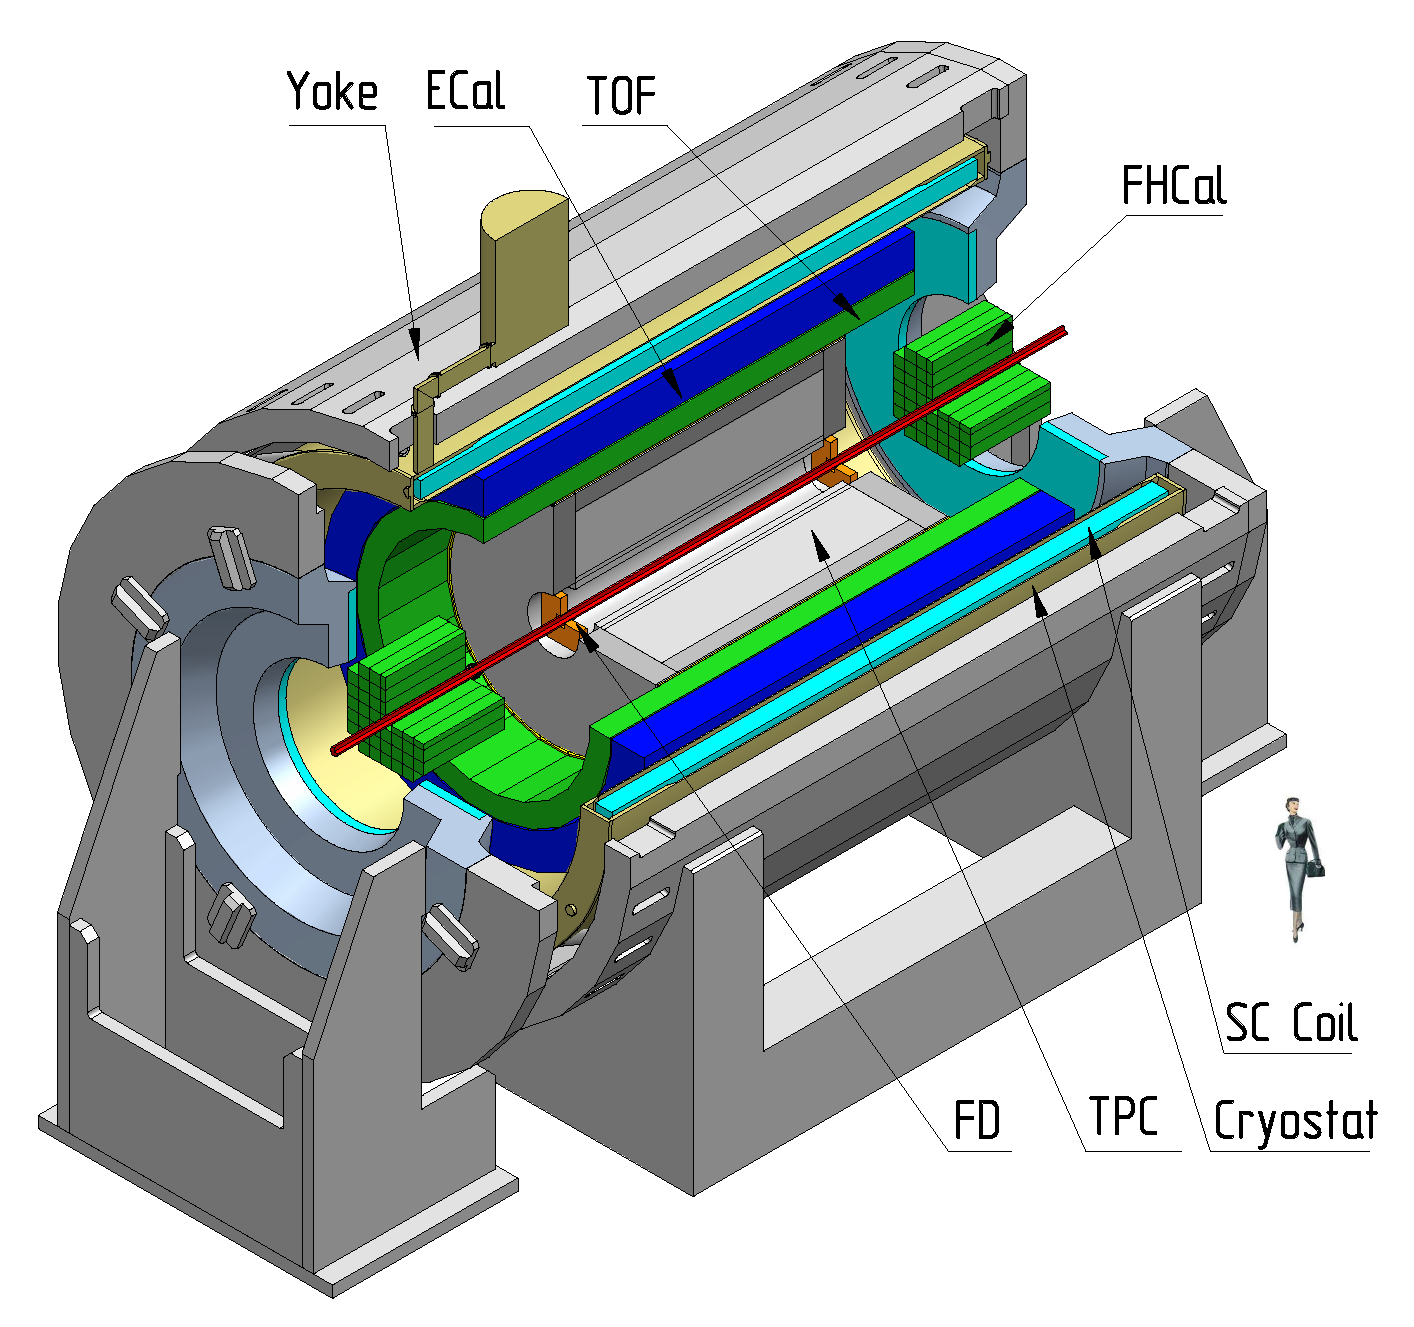
2. MPD and BM@N Detectors
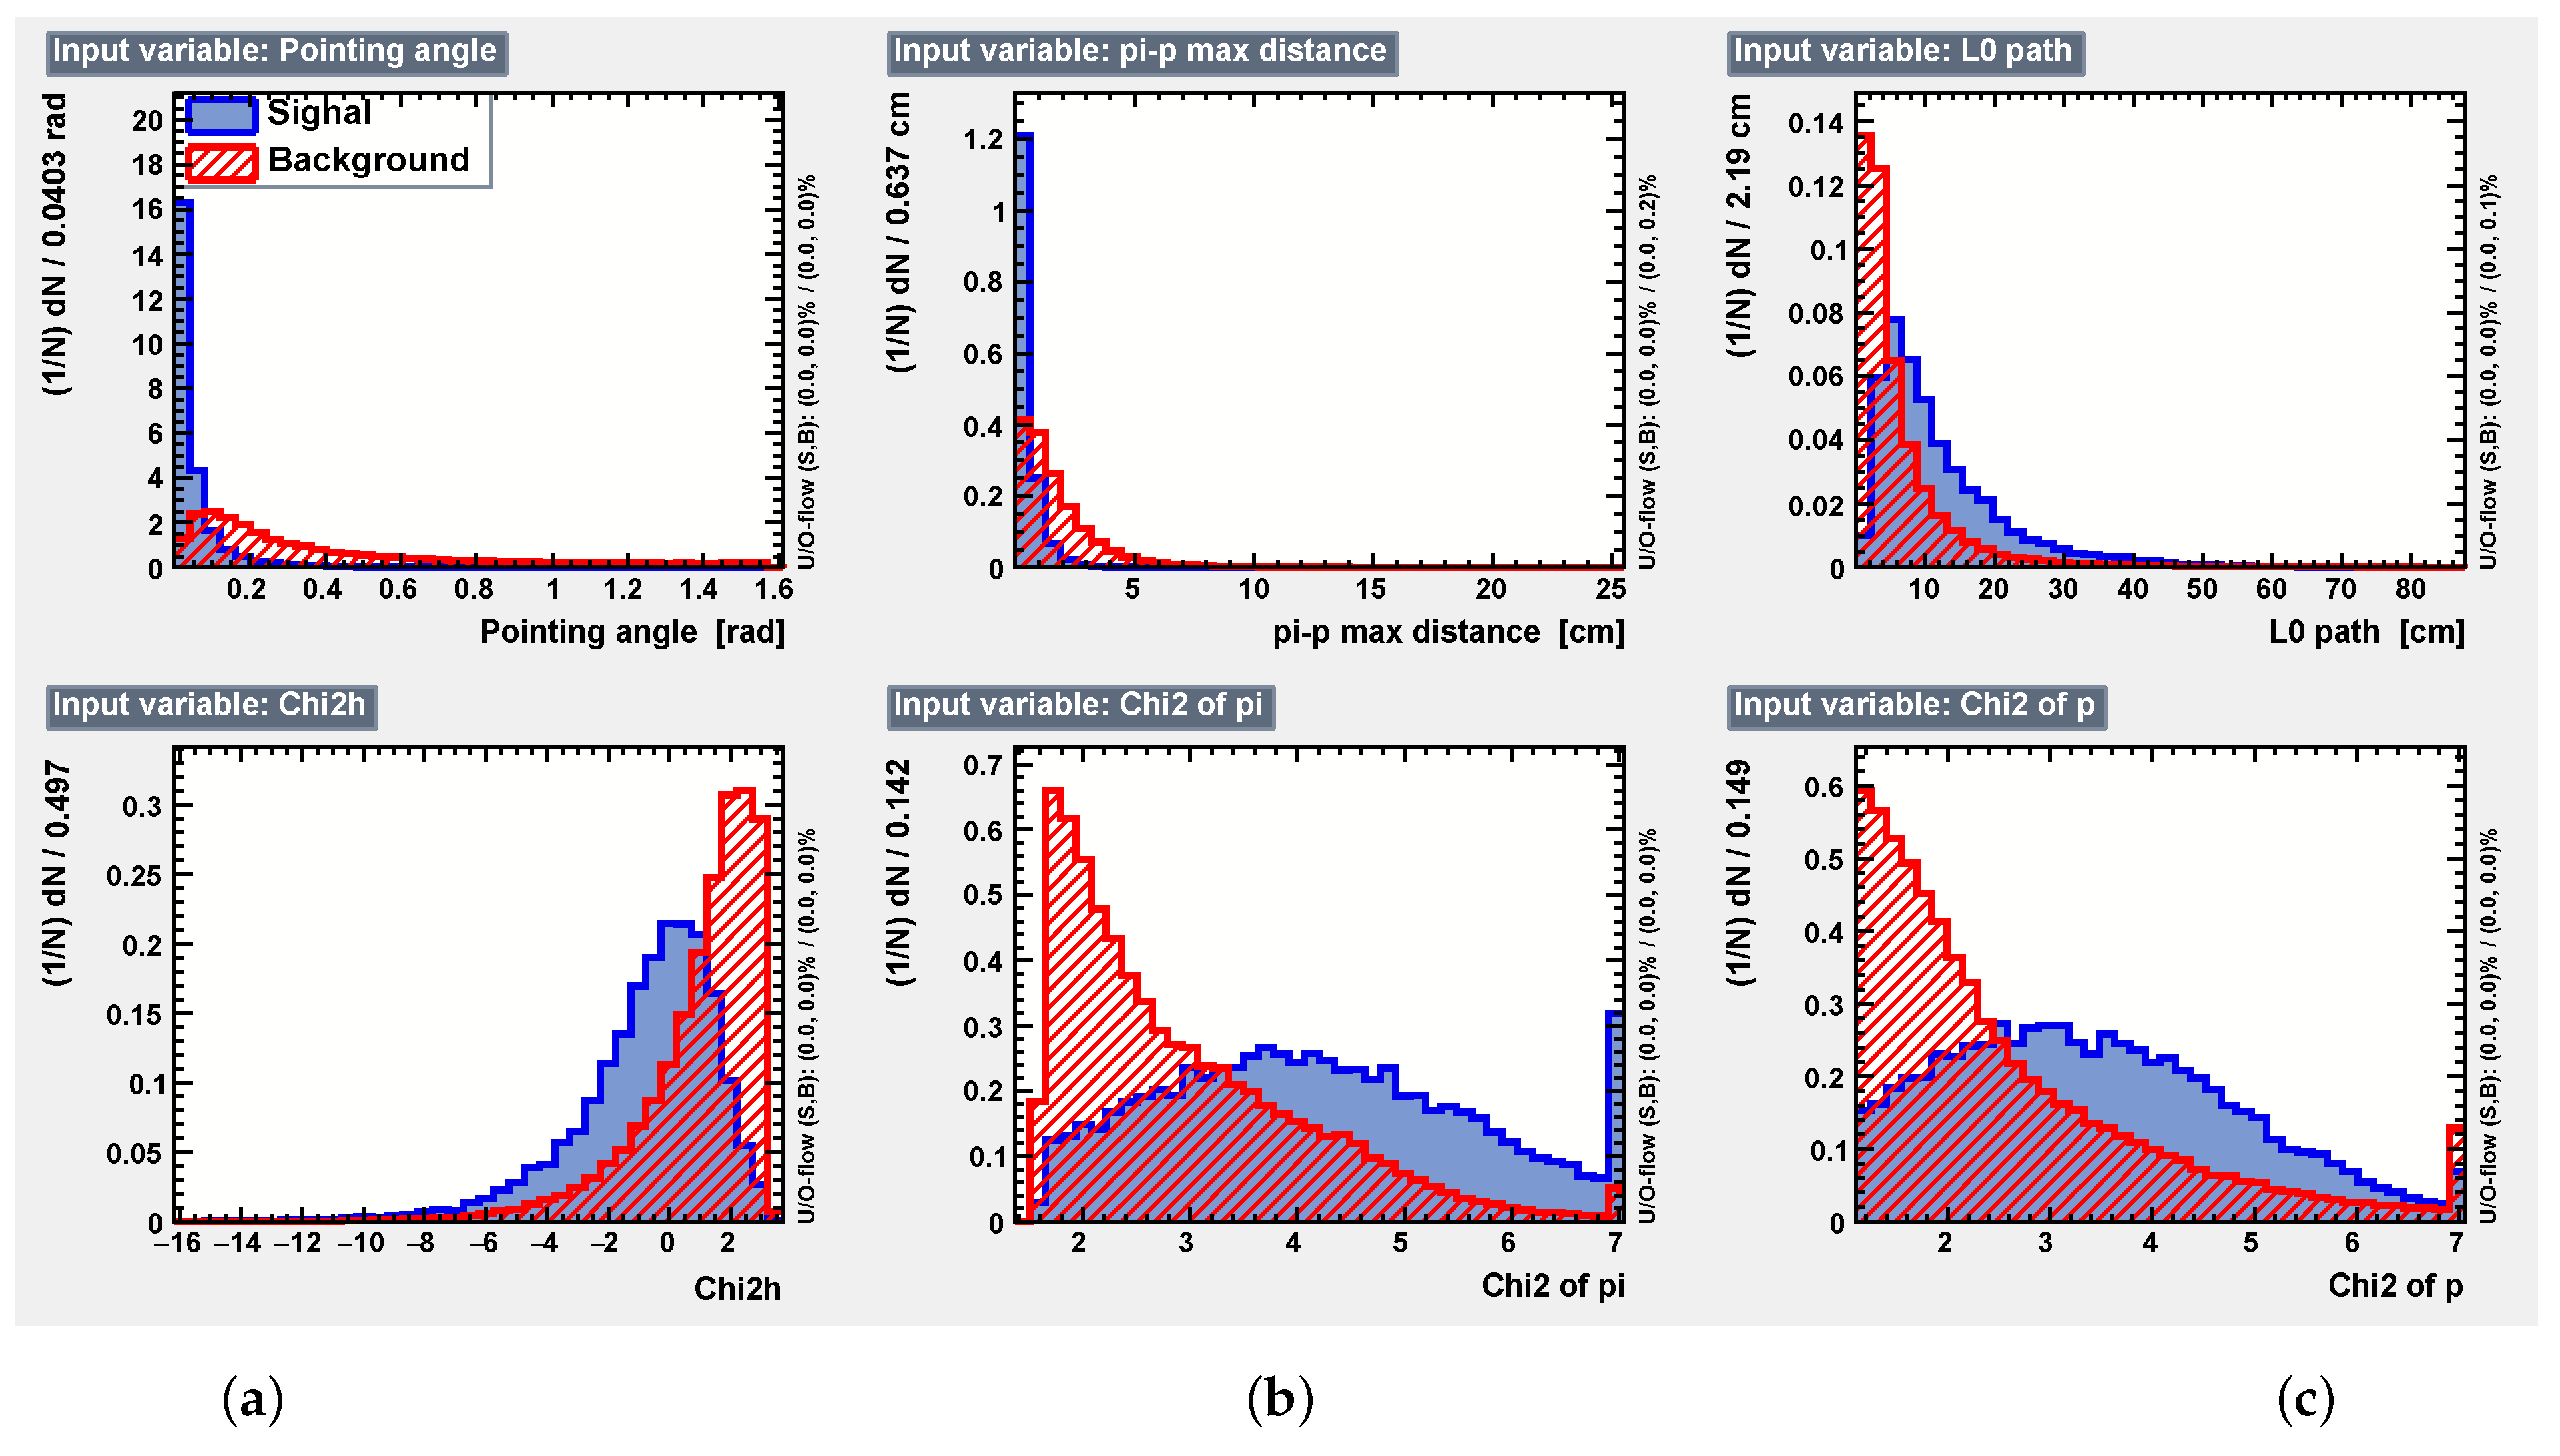
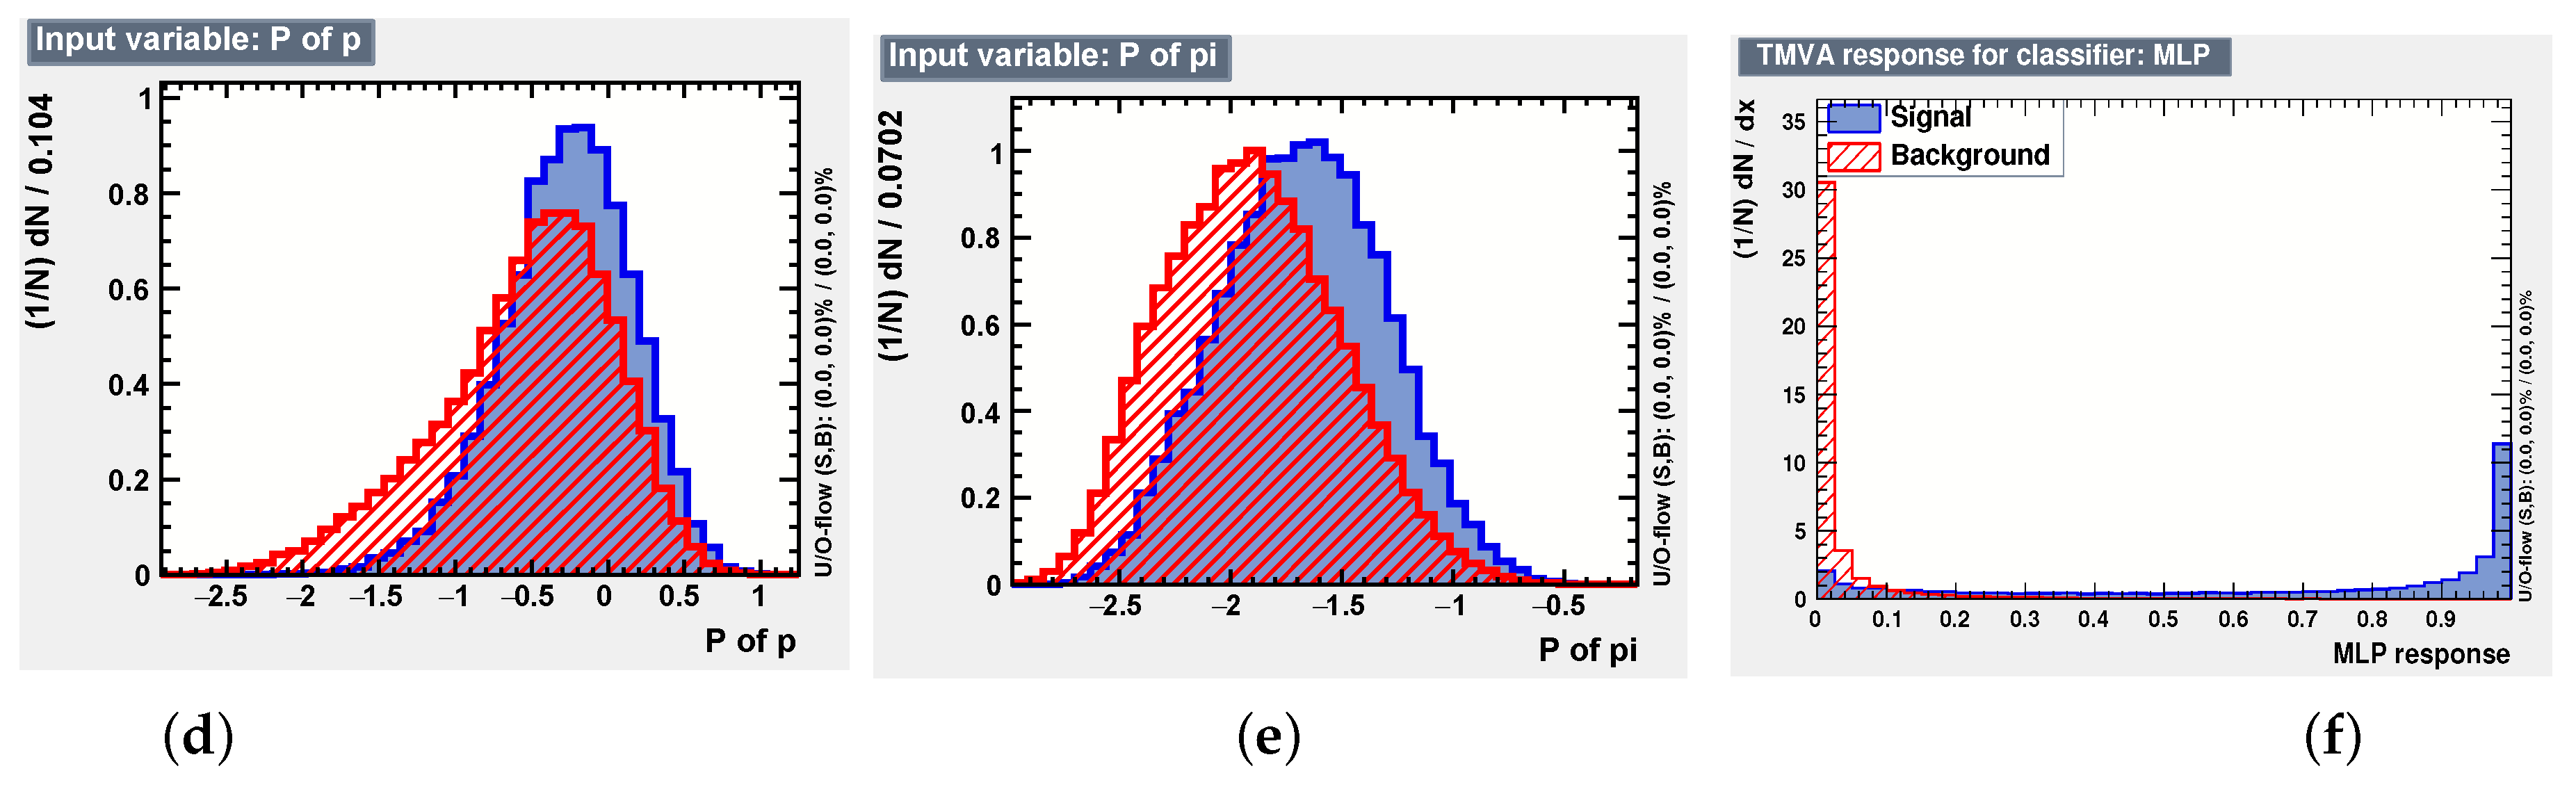
3. Hyperon Reconstruction
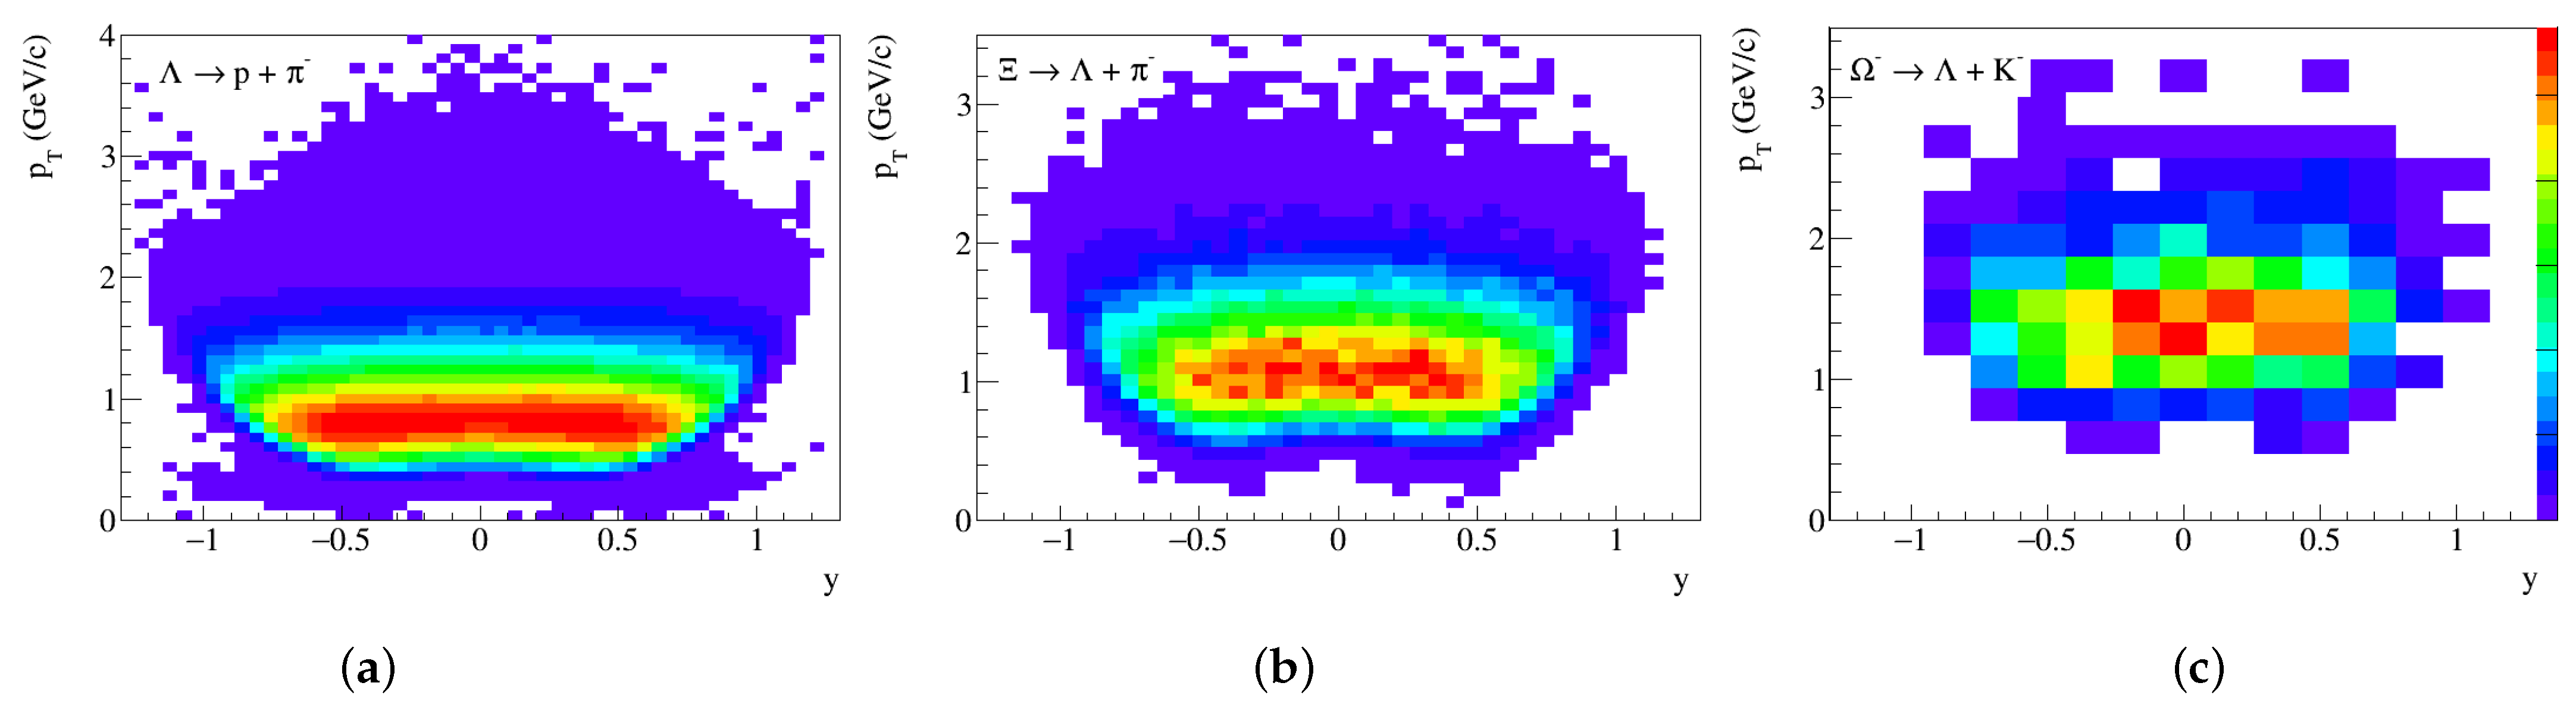
4. Results
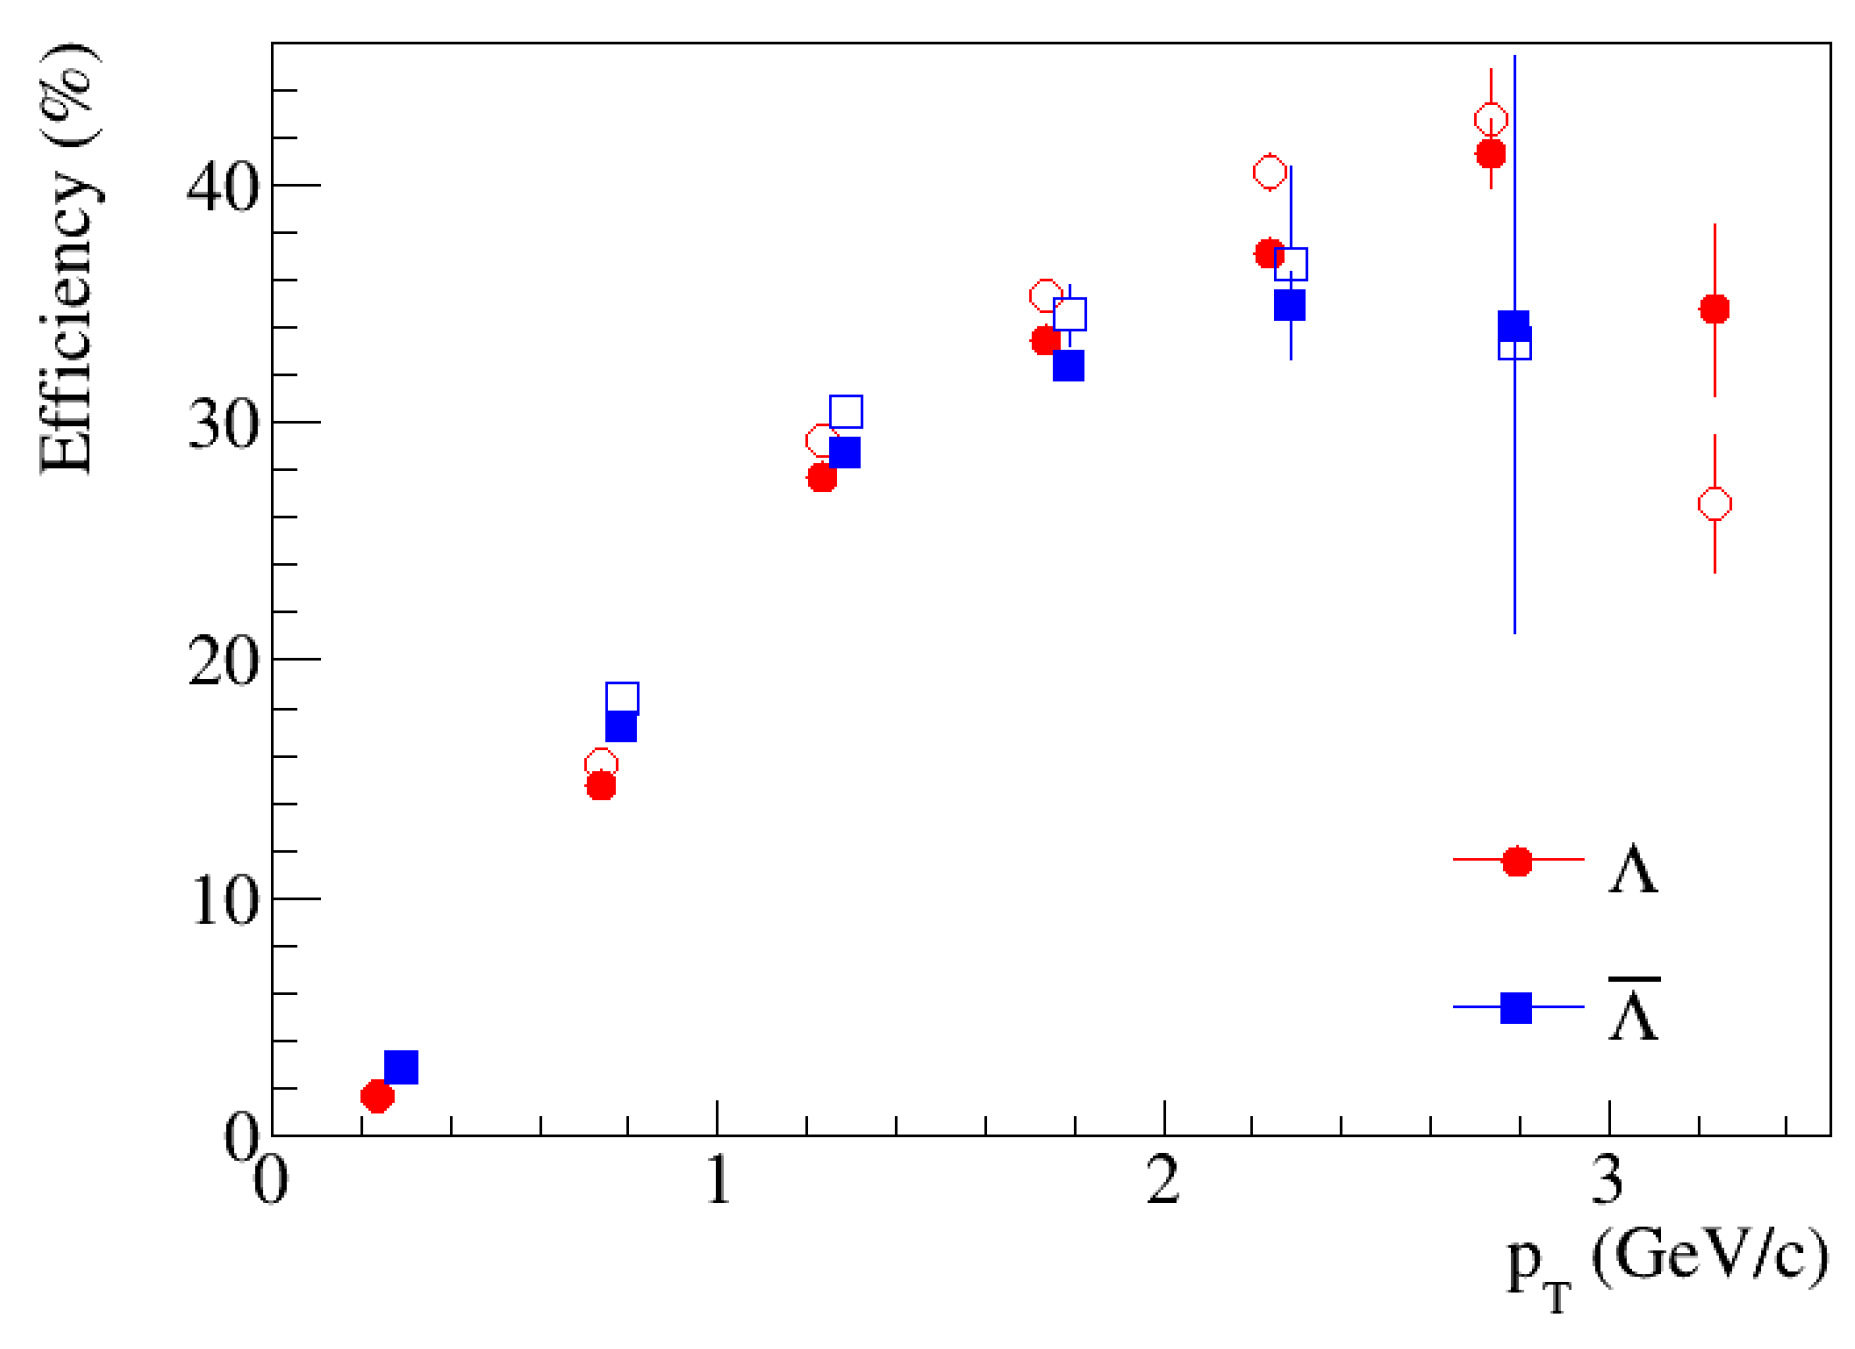
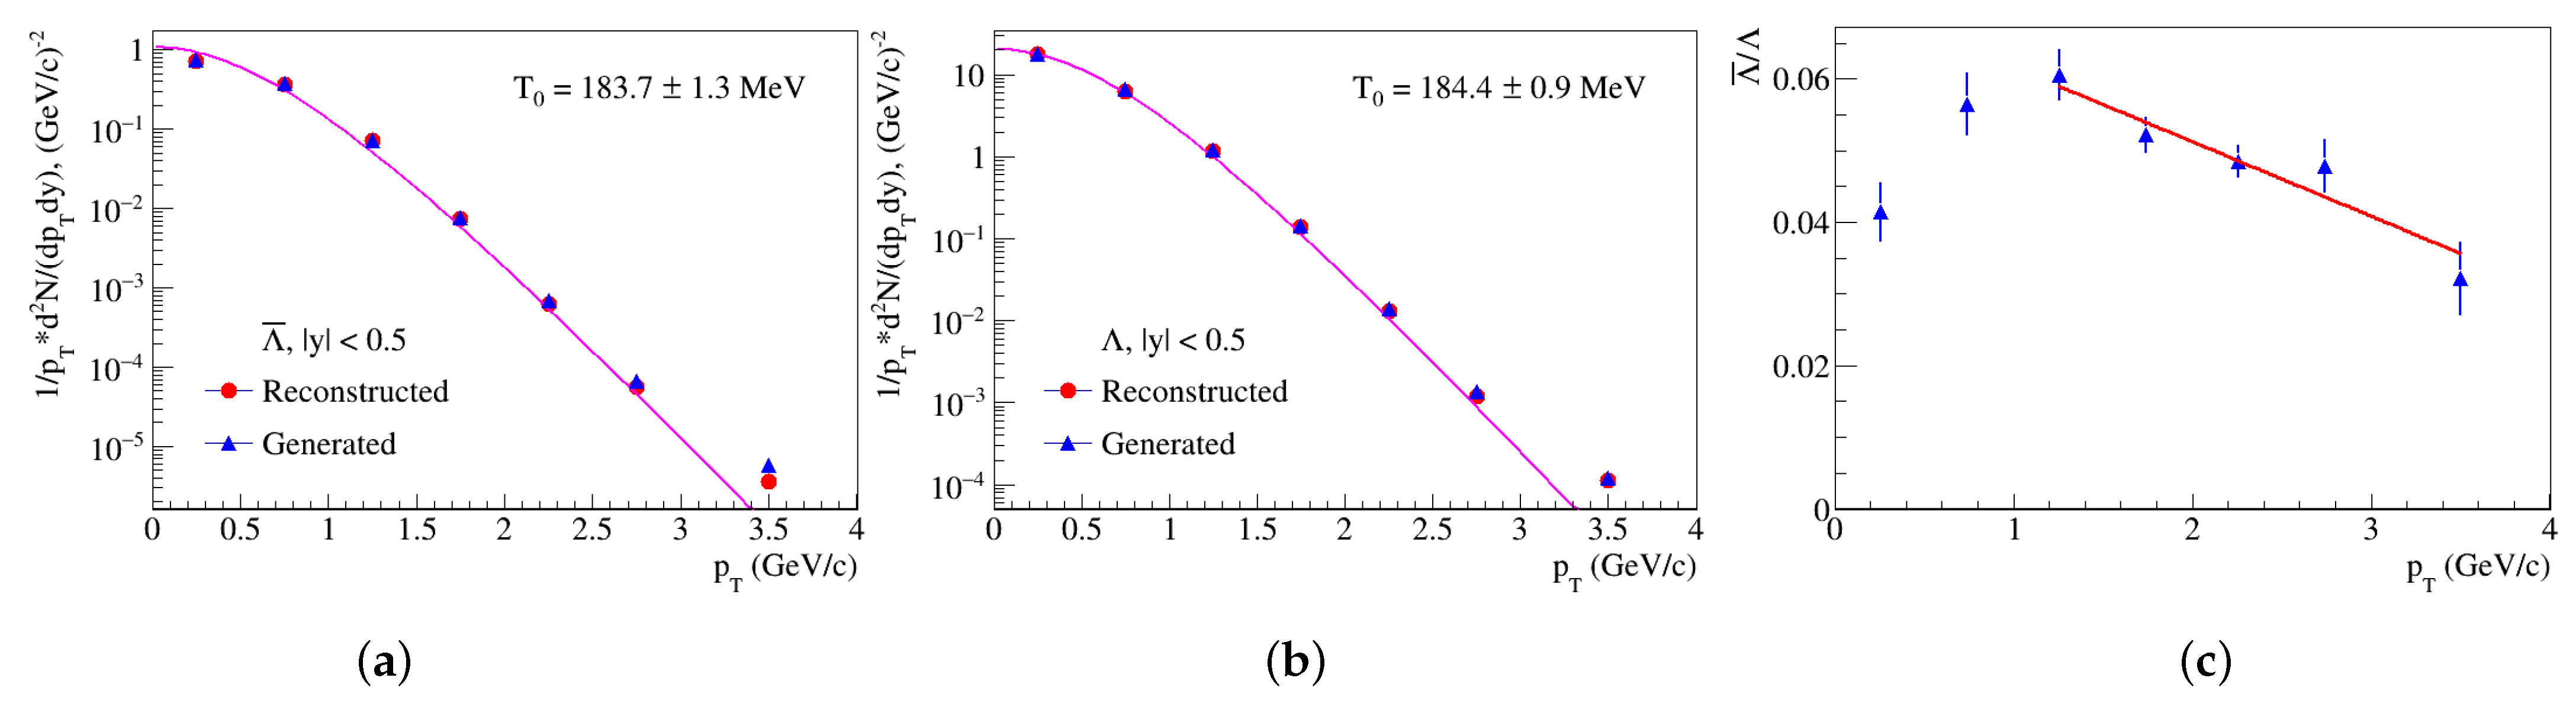
4.1. MPD Setup
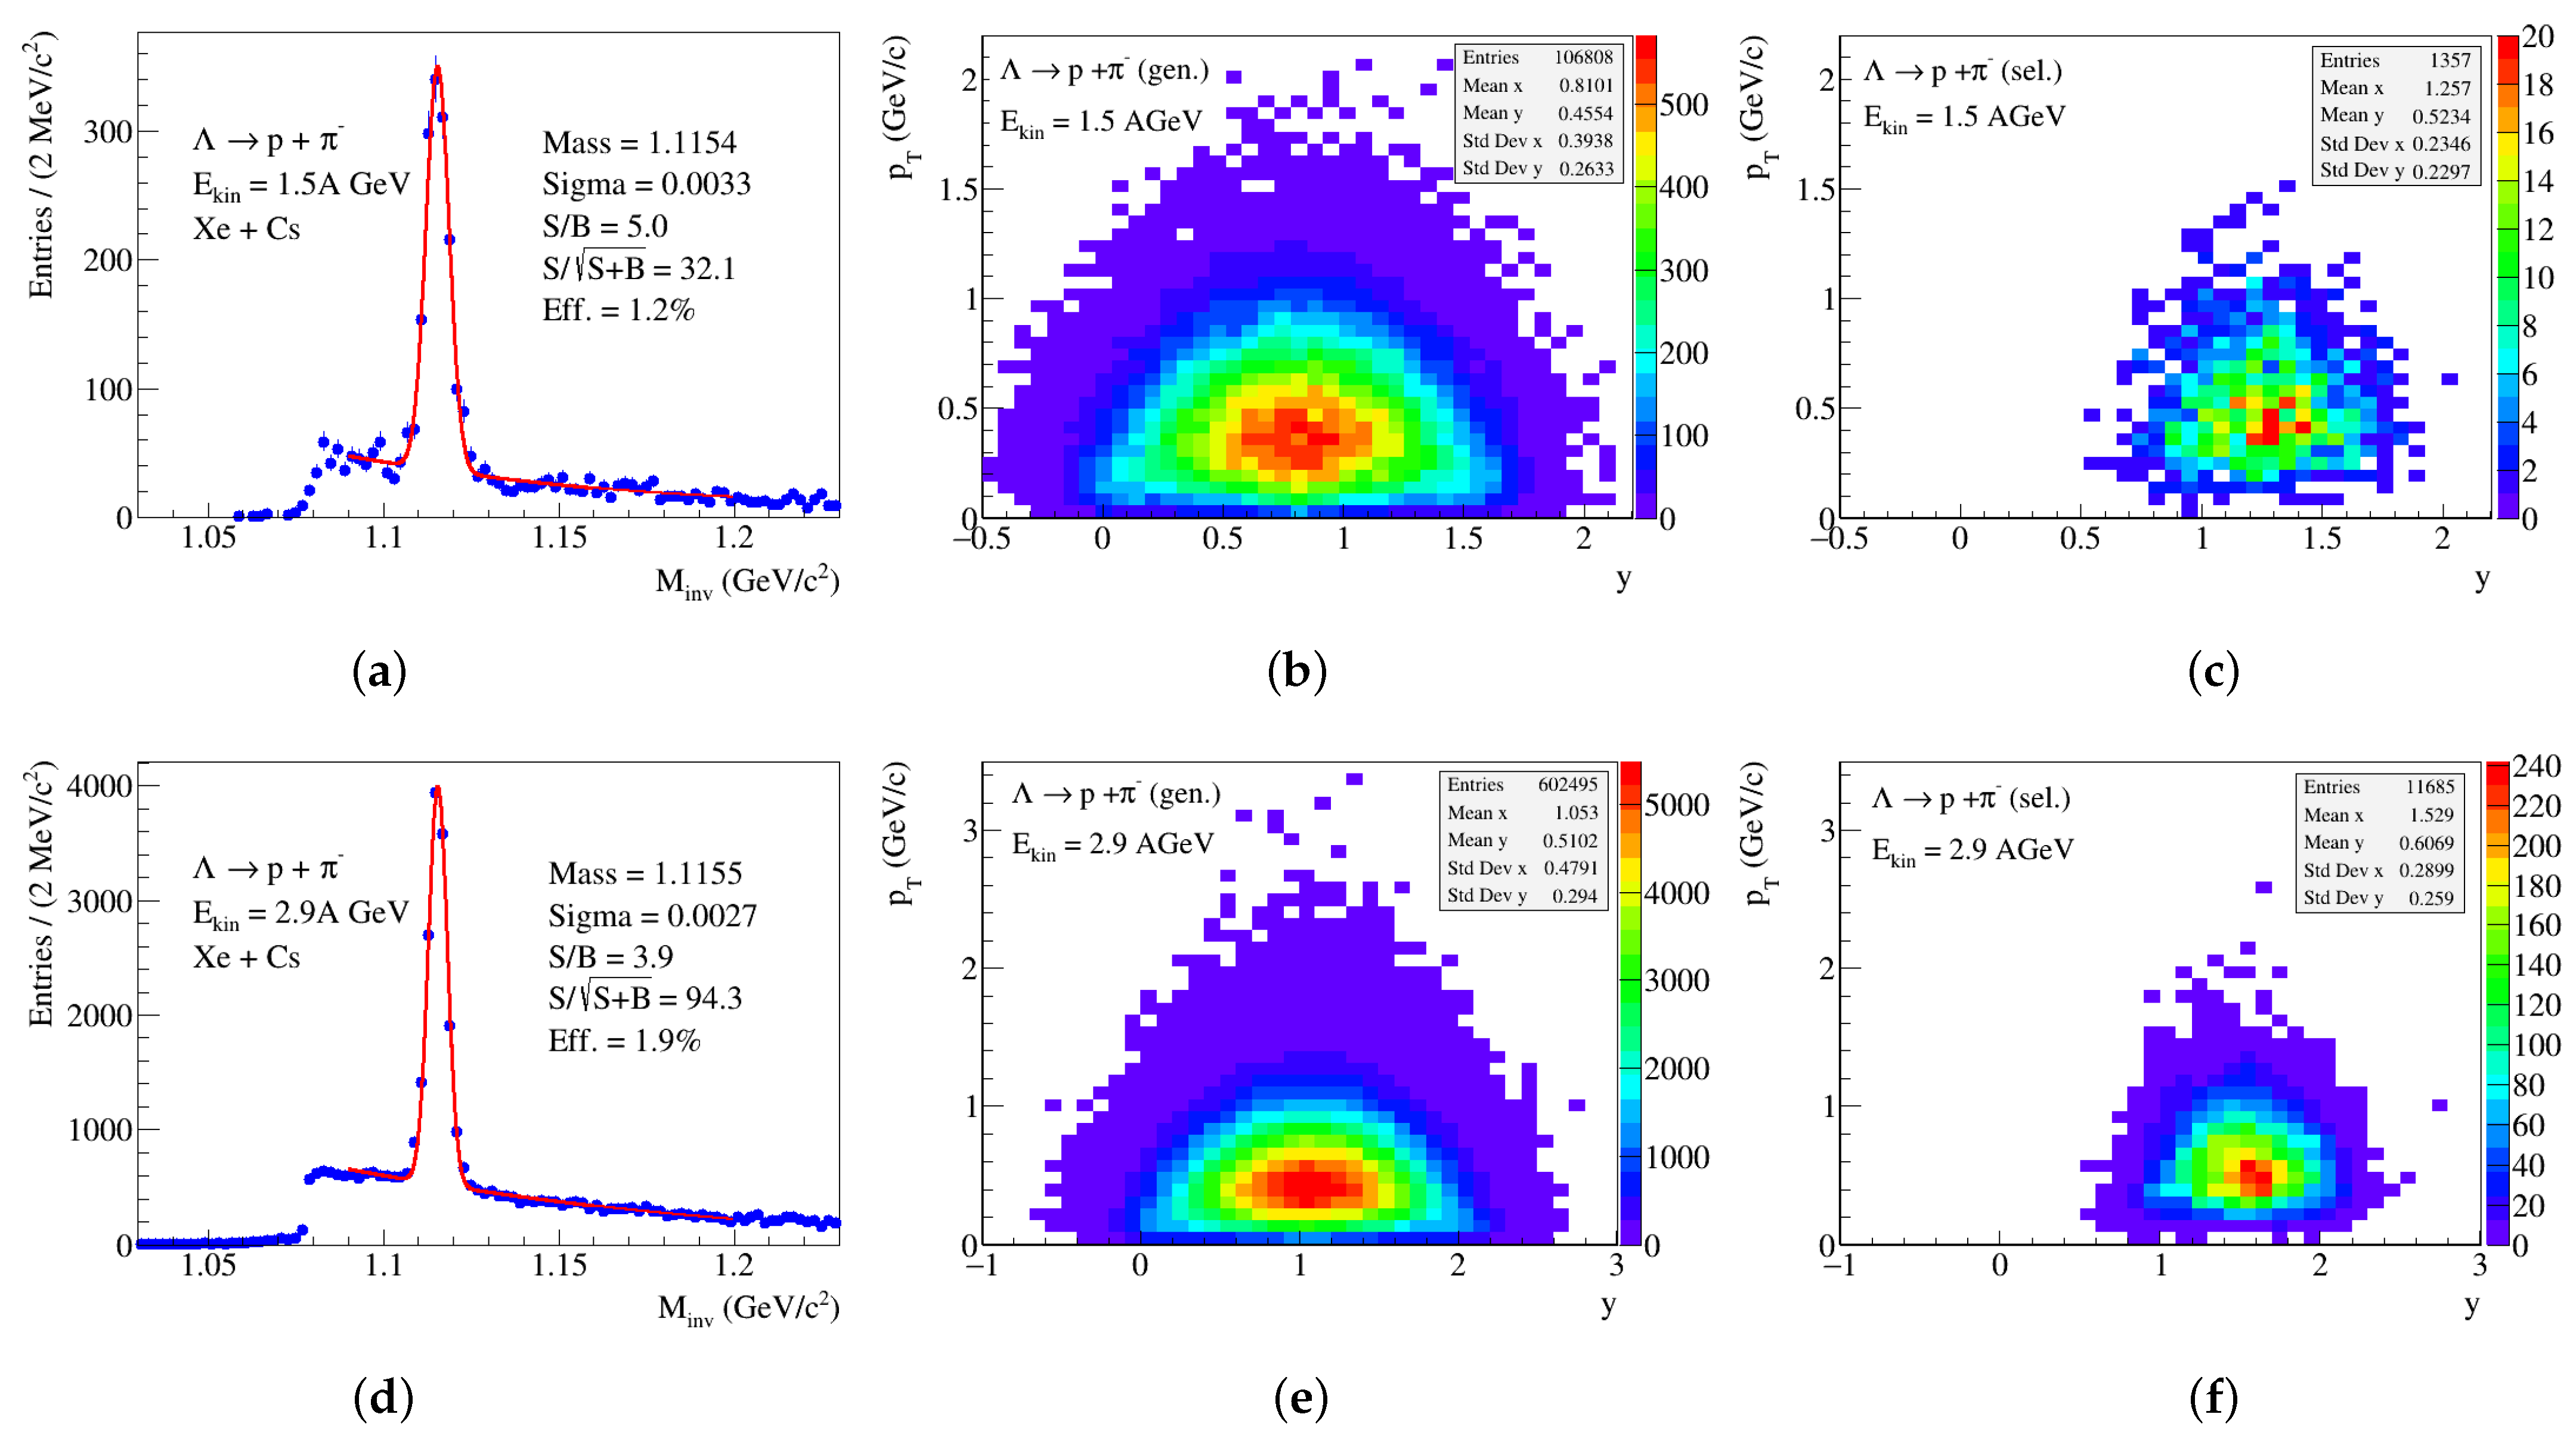
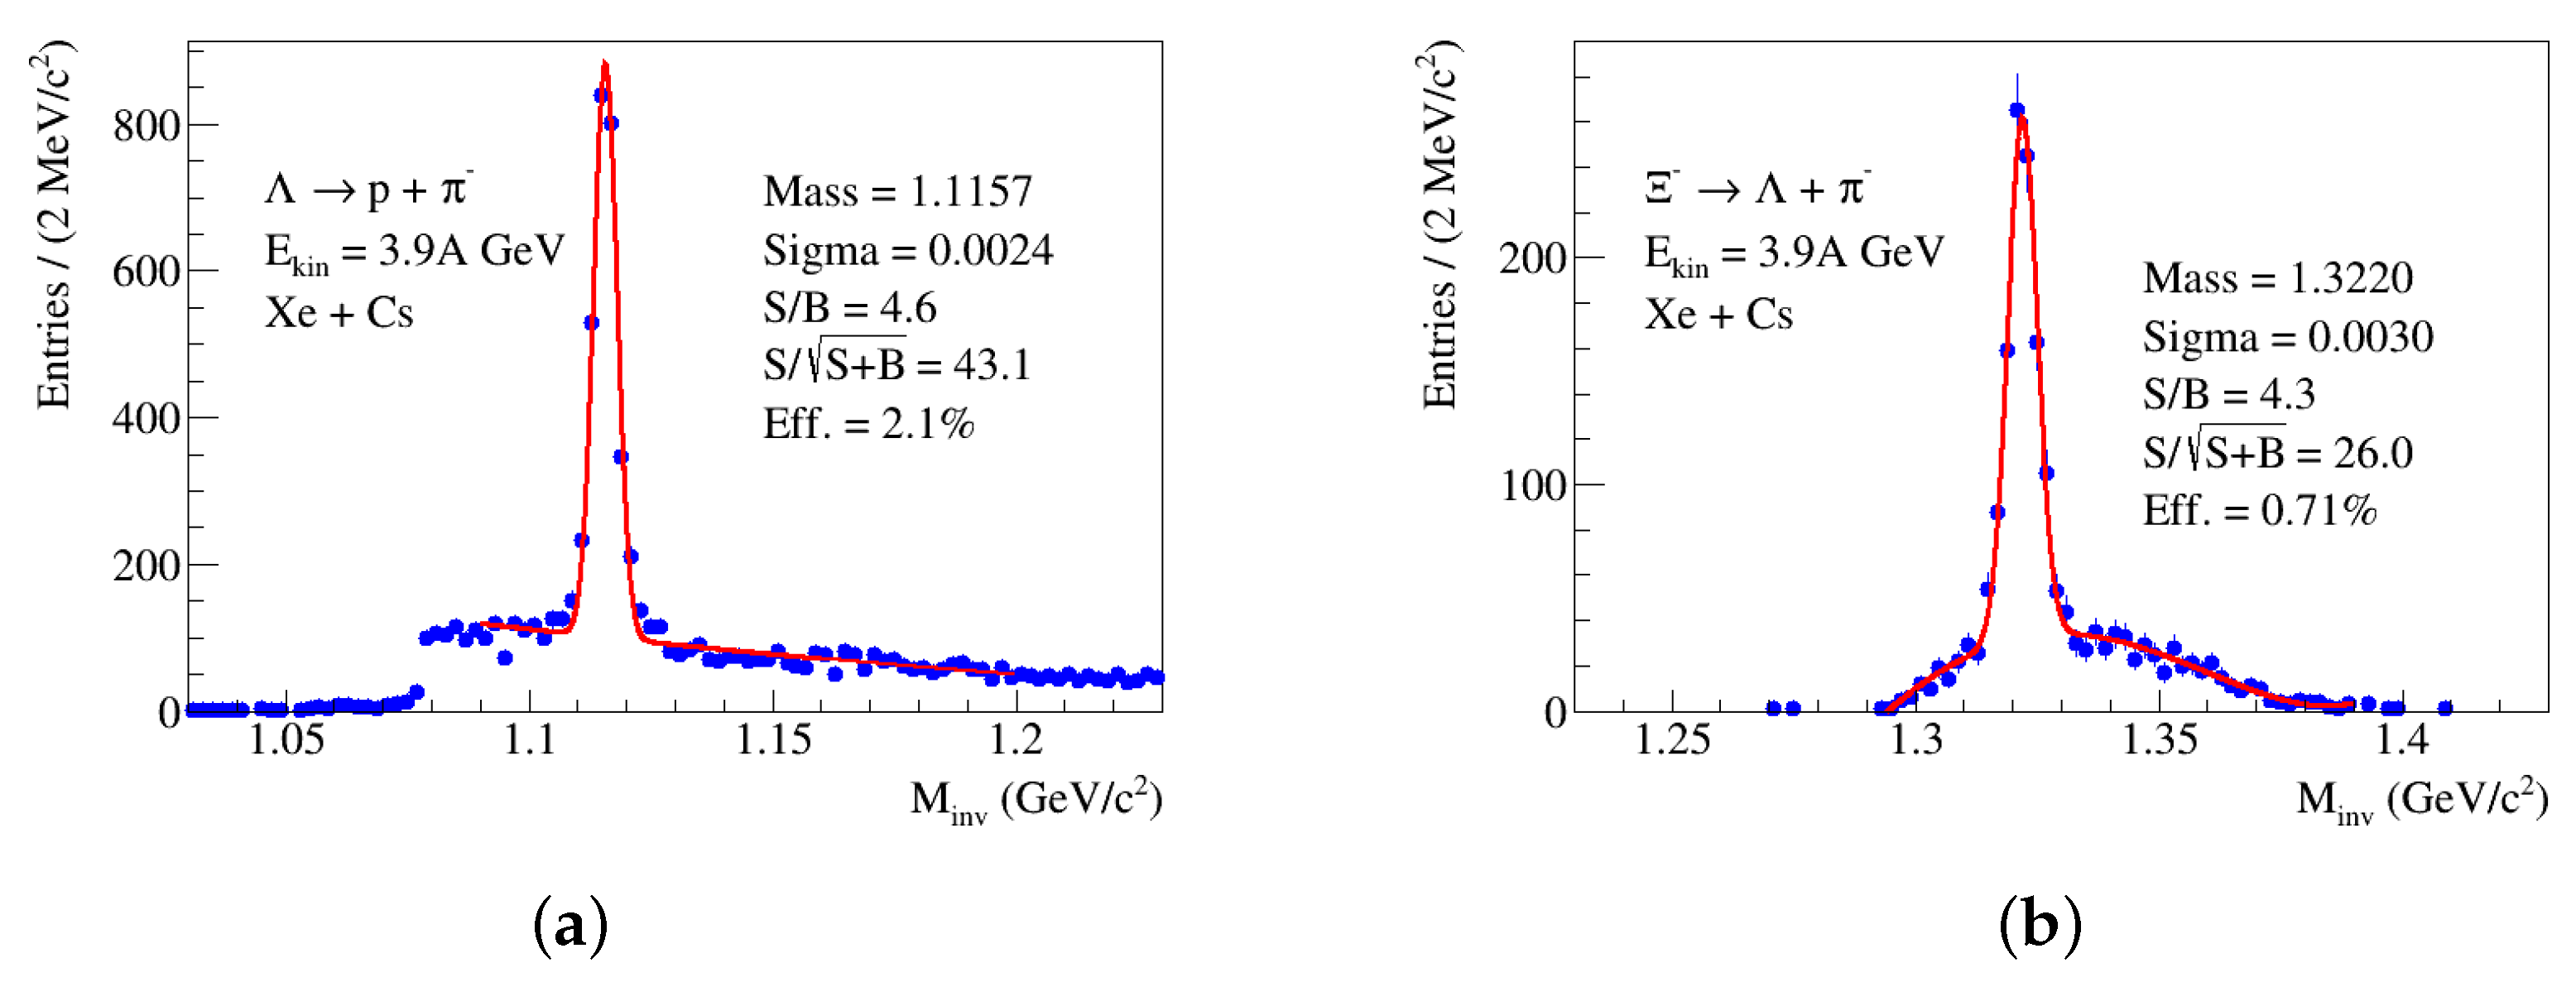
4.2. BM@N Setup
5. Conclusions
Author Contributions
Funding
Institutional Review Board Statement
Informed Consent Statement
Data Availability Statement
Conflicts of Interest
References
- Kekelidze, V.D.; Lednicky, R.; Matveev, V.A.; Meshkov, I.N.; Sorin, A.S.; Trubnikov, V.G. Three stages of the NICA accelerator complex. Eur. Phys. J. A 2016, 52, 211. [Google Scholar] [CrossRef]
- Golovatyuk, V.; Kekelidze, V.; Kolesnikov, V.; Rogachevsky, O.; Sorin, A. The multi-purpose detector (MPD) of the collider experiment. Eur. Phys. J. A 2016, 52, 212. [Google Scholar] [CrossRef]
- Kapishin, M. Studies of baryonic matter at the BM@N experiment (JINR). Nucl. Phys. A 2019, 982, 967. [Google Scholar] [CrossRef]
- Cleymans, J. NICA: Theoretical Overview. Phys. Part. Nucl. 2021, 52, 497. [Google Scholar] [CrossRef]
- Senger, P. Exploring terra incognita in the phase diagram of strongly interacting matter–experiments at FAIR and NICA. Phys. Scripta 2022, 97, 064003. [Google Scholar] [CrossRef]
- Antinori, F.; Bacon, P.A.; Badala, A.; Barbera, R.; Belogianni, A.; Bloodworth, I.J.; Bombara, M.; Bruno, G.E.; Bull, S.A.; NA57 Collaboration; et al. Strangeness enhancements at central rapidity in 40 A GeV/c Pb–Pb collisions. J. Phys. G 2010, 37, 045105. [Google Scholar]
- Abelev, B.I.; Aggarwal, M.M.; Ahammed, Z.; Anderson, B.D.; Arkhipkin, D.; Averichev, G.S.; Klein, S.R.; Abelev, B.I.; Balewski, J.; STAR Collaboration; et al. Enhanced strange baryon production in Au+Au collisions compared to p + p at = 200 GeV. Phys. Rev. C 2008, 77, 044908. [Google Scholar] [CrossRef]
- Rafelski, J.; Muller, B. Strangeness production in the quark–gluon plasma. Phys. Rev. Lett. 1982, 48, 1066. [Google Scholar] [CrossRef]
- Becattini, F.; Manninen, J. Centrality dependence of strangeness production in heavy-ion collisions as a geometrical effect of core-corona superposition. Phys. Lett. B 2009, 673, 19. [Google Scholar] [CrossRef]
- Becattini, F.; Cleymans, J.; Keranen, A.; Suhonen, E.; Redlich, K. Features of particle multiplicities and strangeness production in central heavy ion collisions between 1.7A-GeV/c and 158A-GeV/c. Phys. Rev. C 2001, 64, 024901. [Google Scholar] [CrossRef]
- Braun-Munzinger, P.; Cleymans, J.; Oeschler, H.; Redlich, K. Maximum relative strangeness content in heavy ion collisions around 30-GeV/A. Nucl. Phys. A 2002, 697, 902. [Google Scholar] [CrossRef]
- Redlich, K.; Tounsi, A. Strangeness enhancement and energy dependence in heavy ion collisions. Eur. Phys. J. C 2002, 24, 589. [Google Scholar] [CrossRef]
- Andronic, A.; Braun-Munzinger, P.; Stachel, J. Hadron production in central nucleus-nucleus collisions at chemical freeze-out. Nucl. Phys. A 2006, 772, 167. [Google Scholar] [CrossRef]
- Aichelin, J.; Bratkovskaya, E.; Le Fèvre, A.; Kireyeu, V.; Kolesnikov, V.; Leifels, Y.; Voronyuk, V.; Coci, G. Parton-hadron-quantum-molecular dynamics: A novel microscopic n-body transport approach for heavy-ion collisions, dynamical cluster formation, and hypernuclei production. Phys. Rev. C 2020, 101, 044905. [Google Scholar] [CrossRef]
- Abraamyan, K.U.; Afanasiev, S.V.; Alfeev, V.S.; Anfimov, N.; Arkhipkin, D.; Aslanyan, P.Z.; Bazylev, S.N.; Zulkarneeva, Y.R.; Boguslavski, I.V.; MPD Collaboration; et al. The MPD detector at the NICA heavy-ion collider at JINR. Nucl. Instrum. Methods A 2011, 628, 99. [Google Scholar] [CrossRef]
- Kolesnikov, V.; Mudrokh, A.; Vasendina, V.; Zinchenko, A. Towards a Realistic Monte Carlo Simulation of the MPD Detector at NICA. Phys. Part. Nucl. Lett. 2019, 16, 6–15. [Google Scholar] [CrossRef]
- Anderson, M.; Berkovitz, J.; Betts, W.; Bossingham, R.; Bieser, F.; Brown, R.; Burks, M.; Calderón de la Barca Sánchez, M.; Cebra, D.; Zhang, W.; et al. The STAR time projection chamber: A unique tool for studying high multiplicity events at RHIC. Nucl. Instrum. Meth. A 2003, 499, 659. [Google Scholar] [CrossRef]
- Li, Y.; Han, D.; Durum, A.; Wang, Y.; Shen, C.; Wang, F.; Golovatyuk, V.; Tyapkin, I.; Britvich, G.; Zhou, Z.; et al. Electromagnetic calorimeter system for NICA-MPD. JINST 2020, 15, C11007. [Google Scholar] [CrossRef]
- Abgaryan, V.; Acevedo Kado, R.; Afanasyev, S.V.; Agakishiev, G.N.; Alpatov, E.; Altsybeev, G.; Alvarado Hernández, M.; Andreeva, S.V.; Jaworska, E.; Andronov, E.V.; et al. Status and initial physics performance studies of the MPD experiment at NICA. Eur. Phys. J. A 2022, 58, 140. [Google Scholar] [CrossRef]
- BM@N Experiment. Available online: http://bmn.jinr.ru/about (accessed on 12 April 2023).
- Baranov, D.; Kapishin, M.; Kulish, E.; Maksymchuk, A.; Mamontova, T.; Pokatashkin, G.; Rufanov, I.; Vasendina, V.; Zinchenko, A. First results from BM@N technical run with deuteron beam. Phys. Part. Nucl. Lett. 2018, 15, 148. [Google Scholar] [CrossRef]
- Gornaya, J.; Kapishin, M.; Plotnikov, V.; Pokatashkin, G.; Rufanov, I.; Vasendina, V.; Zinchenko, A. Hyperons at the BM@N experiment: First results. EPJ Web Conf. 2019, 204, 01006. [Google Scholar] [CrossRef]
- Kapishin, M.; Alishina, K.; Batyuk, P.; Baranov, D.; Gabdrakhmanov, I.; Kovachev, L.; Plotnikov, V.; Maksymchuk, A.; Rufanov, I.; Zavertiaev, M.; et al. Production of hyperons, strange mesons and search for hypernuclei in interactions of carbon, argon and krypton beams in the BM@N experiment. Phys. Part. Nucl. 2021, 52, 710. [Google Scholar] [CrossRef]
- Zinchenko, A. Techniques for Reconstruction of Strange Objects at MPD. Particles 2021, 4, 178–185. [Google Scholar] [CrossRef]
- Zinchenko, A.; Drnoyan, J.; Kolesnikov, V.; Mudrokh, A.; Rufanov, I.; Vasendina, V.; Zinchenko, D. Event Reconstruction and Physics Signal Selection in the MPD Experiment at NICA. Phys. Part. Nucl. 2021, 52, 691. [Google Scholar] [CrossRef]
- Gorbunov, S.; Kisel, I. Reconstruction of Decayed Particles Based on the Kalman Filter. CBM-SOFT-note-2007-003. 7 May 2007. Available online: https://www.star.bnl.gov/~bouchet/KFParticle/DOC-2007-May-14-1.pdf (accessed on 12 April 2023).
- Gertsenberger, K.; Merts, S.; Rogachevsky, O.; Zinchenko, A. Simulation and analysis software for the NICA experiments. Eur. Phys. J. A 2016, 52, 214. [Google Scholar] [CrossRef]
- Batyuk, P.; Gertsenberger, K.; Merts, S.; Rogachevsky, O. The BmnRoot framework for experimental data processing in the BM@N experiment at NICA. EPJ Web. Conf. 2019, 214, 05027. [Google Scholar] [CrossRef]
- Adam, J.; Adamczyk, L.; Adams, J.R.; Adkins, J.K.; Agakishiev, G.; Aggarwal, M.M.; Ahammed, Z.; Alekseev, I.; Anderson, D.M.; STAR Collaboration; et al. Strange hadron production in Au + Au collisions at = 7.7, 11.5, 19.6, 27, and 39 GeV. Phys. Rev. C 2020, 102, 034909. [Google Scholar] [CrossRef]
- Kondratyev, V.P.; Maltsev, N.A.; Murin, Y.A. Identification Capability of the Inner Tracking System for Detecting D Mesons at the NICA-MPD Facility. Bull. Russ. Acad. Sci. Phys. 2022, 86, 1005. [Google Scholar] [CrossRef]
- Hoecker, A.; Speckmayer, P.; Stelzer, J.; Therhaag, J.; von Toerne, E.; Voss, H. TMVA: Toolkit for Multivariate Data Analysis. arXiv 2007, arXiv:physics/0703039. [Google Scholar]
- Cassing, W.; Bratkovskaya, E.L. Parton-hadron-string dynamics: An off-shell transport approach for relativistic energies. Nucl. Phys. A 2009, 831, 215. [Google Scholar] [CrossRef]
- Asakawa, M.; Bass, S.A.; Muller, B.; Nonaka, C. Transverse velocity dependence of the proton-anti-proton ratio as a signature of the QCD critical point. Phys. Rev. Lett. 2008, 101, 122302. [Google Scholar] [CrossRef]
- Gläßel, S.; Kireyeu, V.; Voronyuk, V.; Aichelin, J.; Blume, C.; Bratkovskaya, E.; Coci, G.; Kolesnikov, V.; Winn, M. Cluster and hypercluster production in relativistic heavy-ion collisions within the parton-hadron-quantum-molecular-dynamics approach. Phys. Rev. C 2022, 105, 014908. [Google Scholar] [CrossRef]
- Baranov, D.; Kapishin, M.; Schmidt, H.R.; Senger, P.; Vasendina, V.; Zinchenko, A.; Zinchenko, D. Feasibility studies of strangeness production in heavy-ion interactions at the BM@N experiment using Monte Carlo simulation. Phys. Scr. 2022, 97, 084003. [Google Scholar] [CrossRef]
- Baznat, M.; Botvina, A.; Musulmanbekov, G.; Toneev, V.; Zhezher, V. Monte-Carlo Generator of Heavy Ion Collisions DCM-SMM. Phys. Part. Nucl. Lett. 2020, 17, 303. [Google Scholar] [CrossRef]
- Suvarieva, D.; Gudima, K.; Zinchenko, A. A Monte Carlo Study of Lambda Hyperon Polarization at BM@N. Phys. Part. Nucl. Lett. 2018, 15, 182. [Google Scholar] [CrossRef]
- Karpenko, I.; Becattini, F. Lambda polarization in heavy ion collisions: From RHIC BES to LHC energies. Nucl. Phys. A 2019, 982, 519. [Google Scholar] [CrossRef]
- Ayala, A.; Ayala Torres, M.A.; Cuautle, E.; Domínguez, I.; Fontaine Sanchez, M.A.; Maldonado, I.; Moreno-Barbosa, E.; Nieto-Marín, P.A.; Rodríguez-Cahuantzi, M.; Salinas, J.; et al. Core meets corona: A two-component source to explain Λ and global polarization in semi-central heavy-ion collisions. Phys. Lett. B 2020, 810, 135818. [Google Scholar] [CrossRef]


| Cut | ||
|---|---|---|
| DCA of daughters to primary vertex | , | |
| DCA between daughters | <3.0 | <2.8 |
| Decay length, cm | >2.5 | >2.5 |
| Mother pointing angle, rad | <0.08 | <0.14 |
| Cut | ||
|---|---|---|
| DCA of daughters to primary vertex | , | |
| DCA between daughters | <2.5 | <1.5 |
| Decay length, cm | >2.0 | >1.5 |
| Mother pointing angle, rad | <0.08 | <0.10 |
| DCA of daughters to primary vertex | , | |
| DCA between daughters | <3.5 | <2.8 |
| decay length, cm | >3.5 | >3.0 |
| pointing angle, rad | <0.20 | <0.22 |
| Cut | 1.5A GeV | 1.9 A GeV | 3.9 A GeV |
|---|---|---|---|
| DCA of daughters to primary vertex | , | ||
| DCA between daughters | <4.3 | <5.0 | <3.5 |
| Decay length, cm | >5.0 | >4.0 | >4.0 |
| Mother pointing angle, rad | <0.01 | <0.01 | <0.01 |
| Particle | , GeV | M, Event | Yield / Events | |
|---|---|---|---|---|
| 1.6 | 1.06 | 2.0 | 1 | |
| 3.7 | 0.012 | 0.7 | 4 |
Disclaimer/Publisher’s Note: The statements, opinions and data contained in all publications are solely those of the individual author(s) and contributor(s) and not of MDPI and/or the editor(s). MDPI and/or the editor(s) disclaim responsibility for any injury to people or property resulting from any ideas, methods, instructions or products referred to in the content. |
© 2023 by the authors. Licensee MDPI, Basel, Switzerland. This article is an open access article distributed under the terms and conditions of the Creative Commons Attribution (CC BY) license (https://creativecommons.org/licenses/by/4.0/).
Share and Cite
Zinchenko, A.; Kapishin, M.; Kireyeu, V.; Kolesnikov, V.; Mudrokh, A.; Suvarieva, D.; Vasendina, V.; Zinchenko, D. A Monte Carlo Study of Hyperon Production with the MPD and BM@N Experiments at NICA. Particles 2023, 6, 485-496. https://doi.org/10.3390/particles6020027
Zinchenko A, Kapishin M, Kireyeu V, Kolesnikov V, Mudrokh A, Suvarieva D, Vasendina V, Zinchenko D. A Monte Carlo Study of Hyperon Production with the MPD and BM@N Experiments at NICA. Particles. 2023; 6(2):485-496. https://doi.org/10.3390/particles6020027
Chicago/Turabian StyleZinchenko, Alexander, Mikhail Kapishin, Viktar Kireyeu, Vadim Kolesnikov, Alexander Mudrokh, Dilyana Suvarieva, Veronika Vasendina, and Dmitry Zinchenko. 2023. "A Monte Carlo Study of Hyperon Production with the MPD and BM@N Experiments at NICA" Particles 6, no. 2: 485-496. https://doi.org/10.3390/particles6020027