
Q1VA, a Synthetic Chalcone, Induces Apoptosis and Decreases Invasion on Primary Culture of Human Glioblastoma

 , and
, and 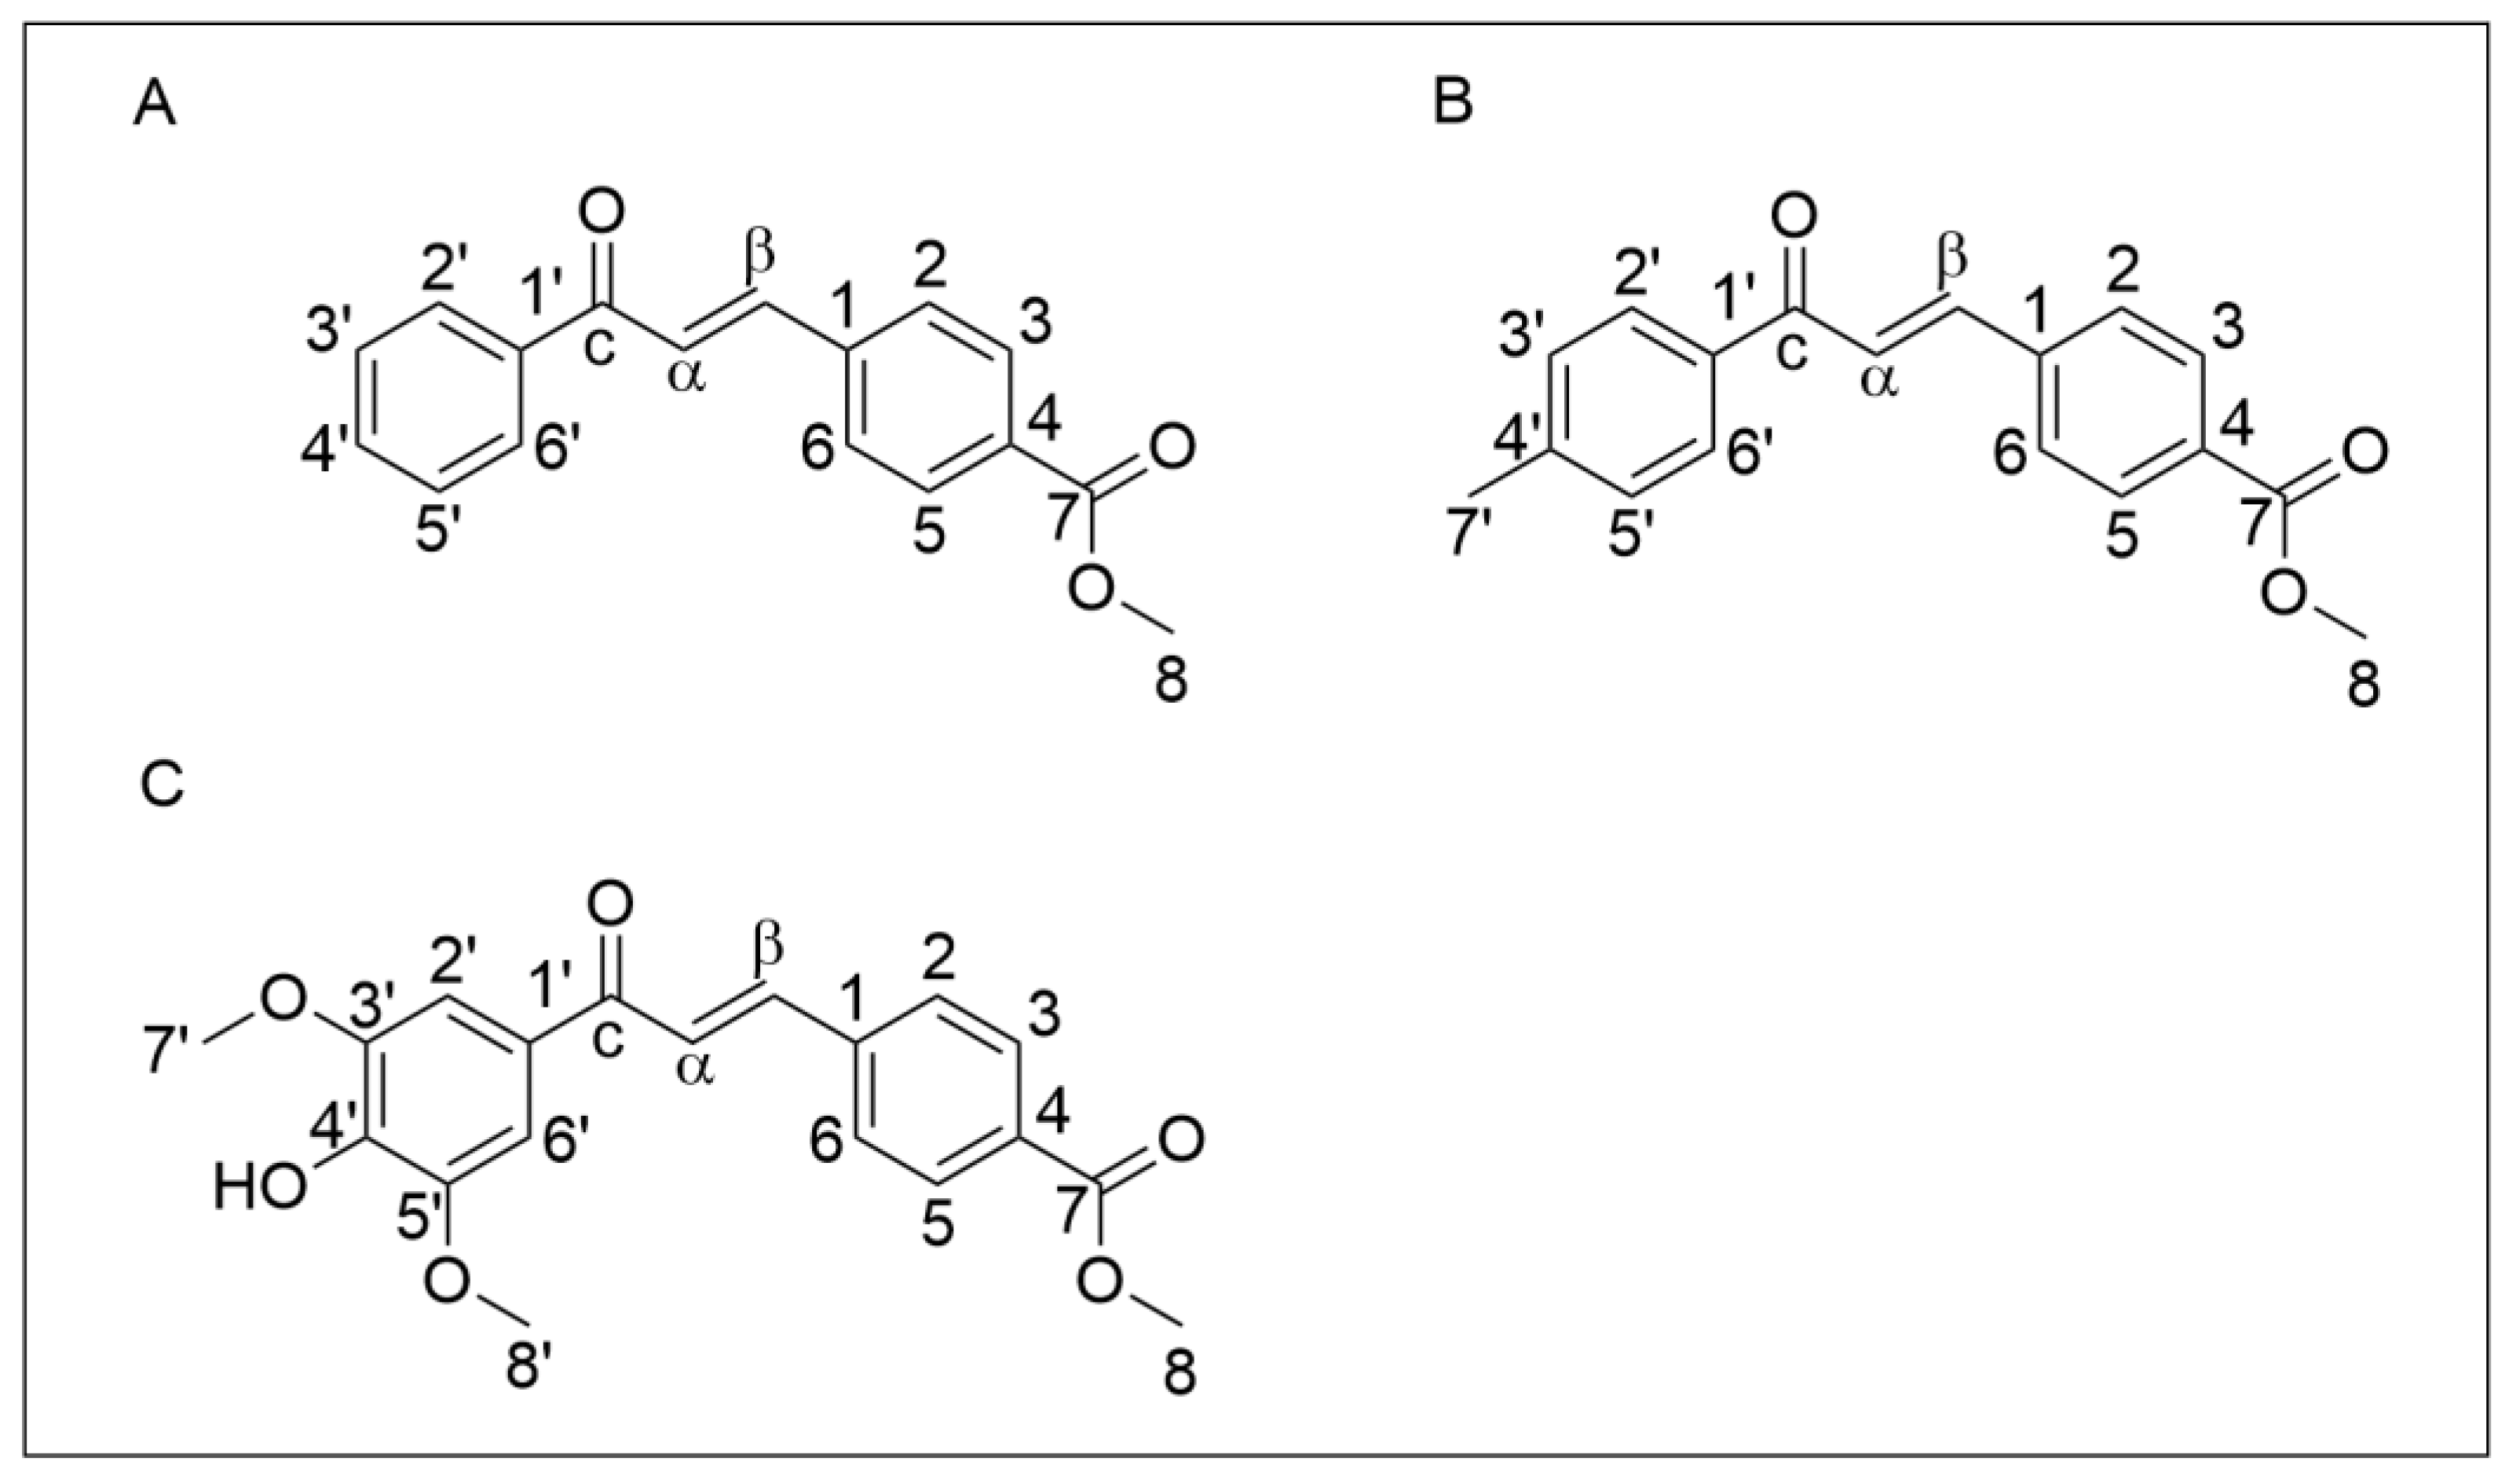
Abstract
:1. Introduction
2. Materials and Methods
2.1. Synthesis and Characterization of Chalcones
2.2. Primary GBM Cell Culture
2.3. Cell Treatment
2.4. Cell Viability Assay
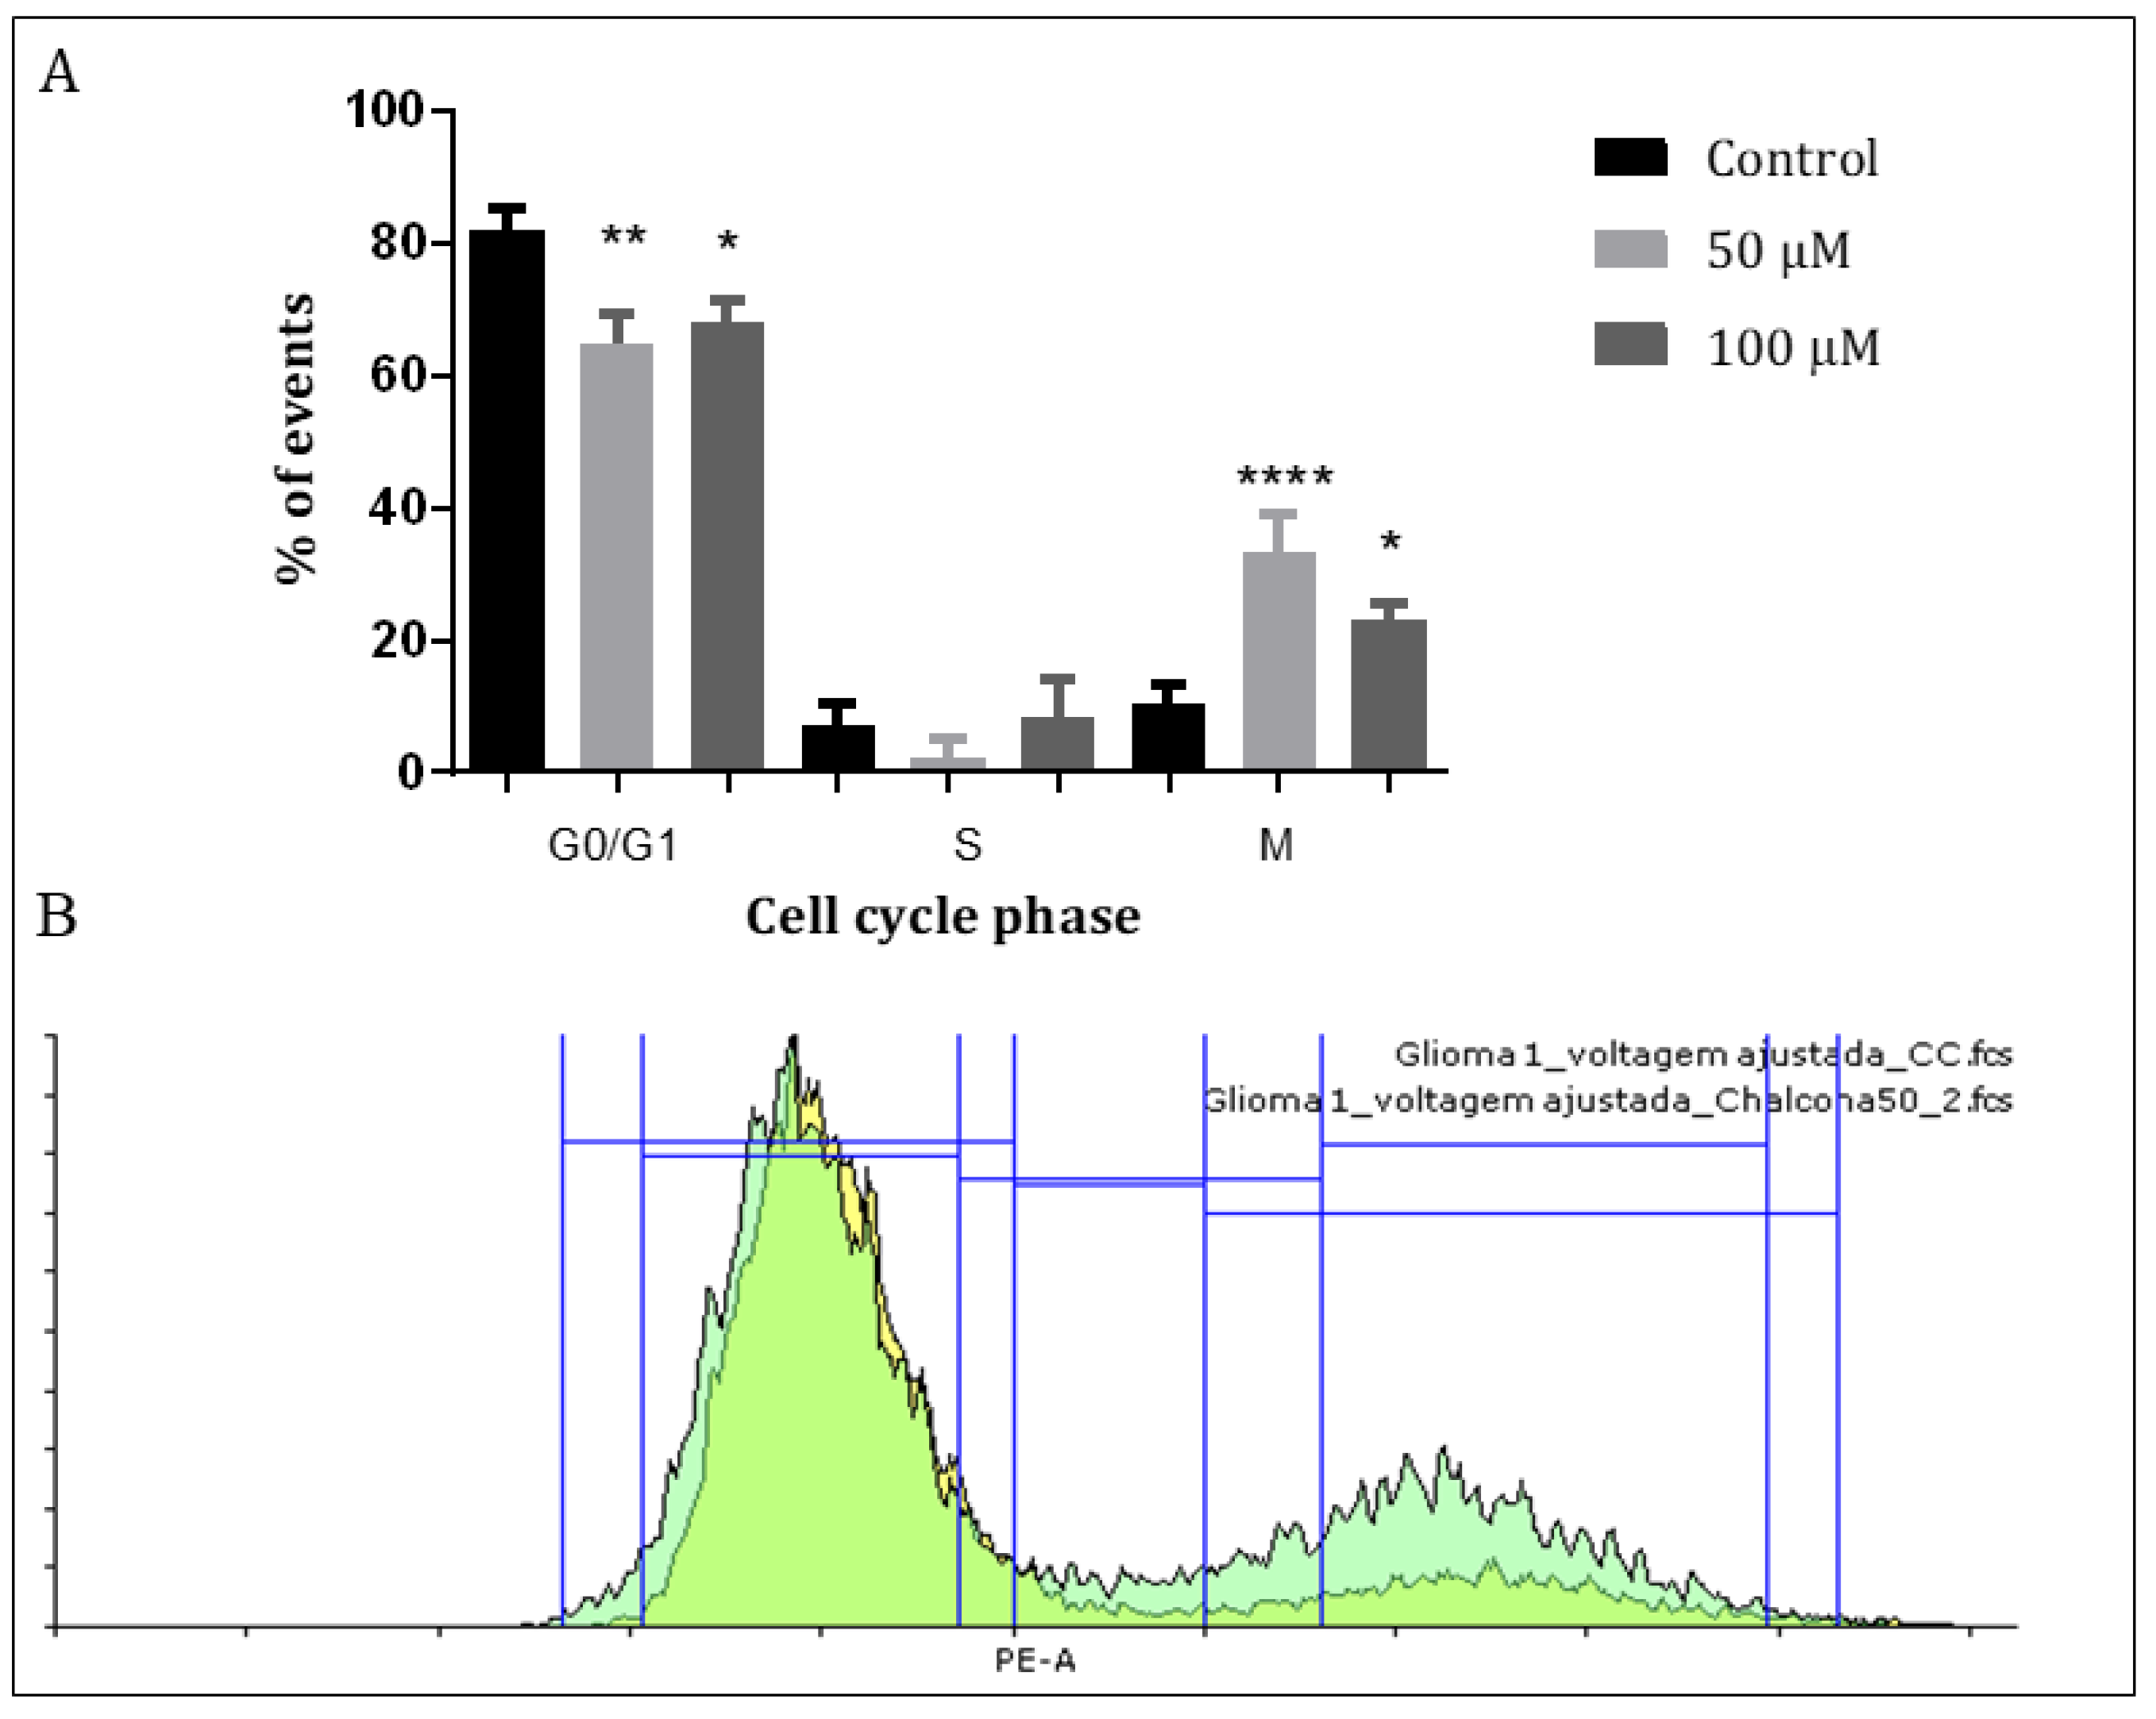
2.5. Cell Cycle
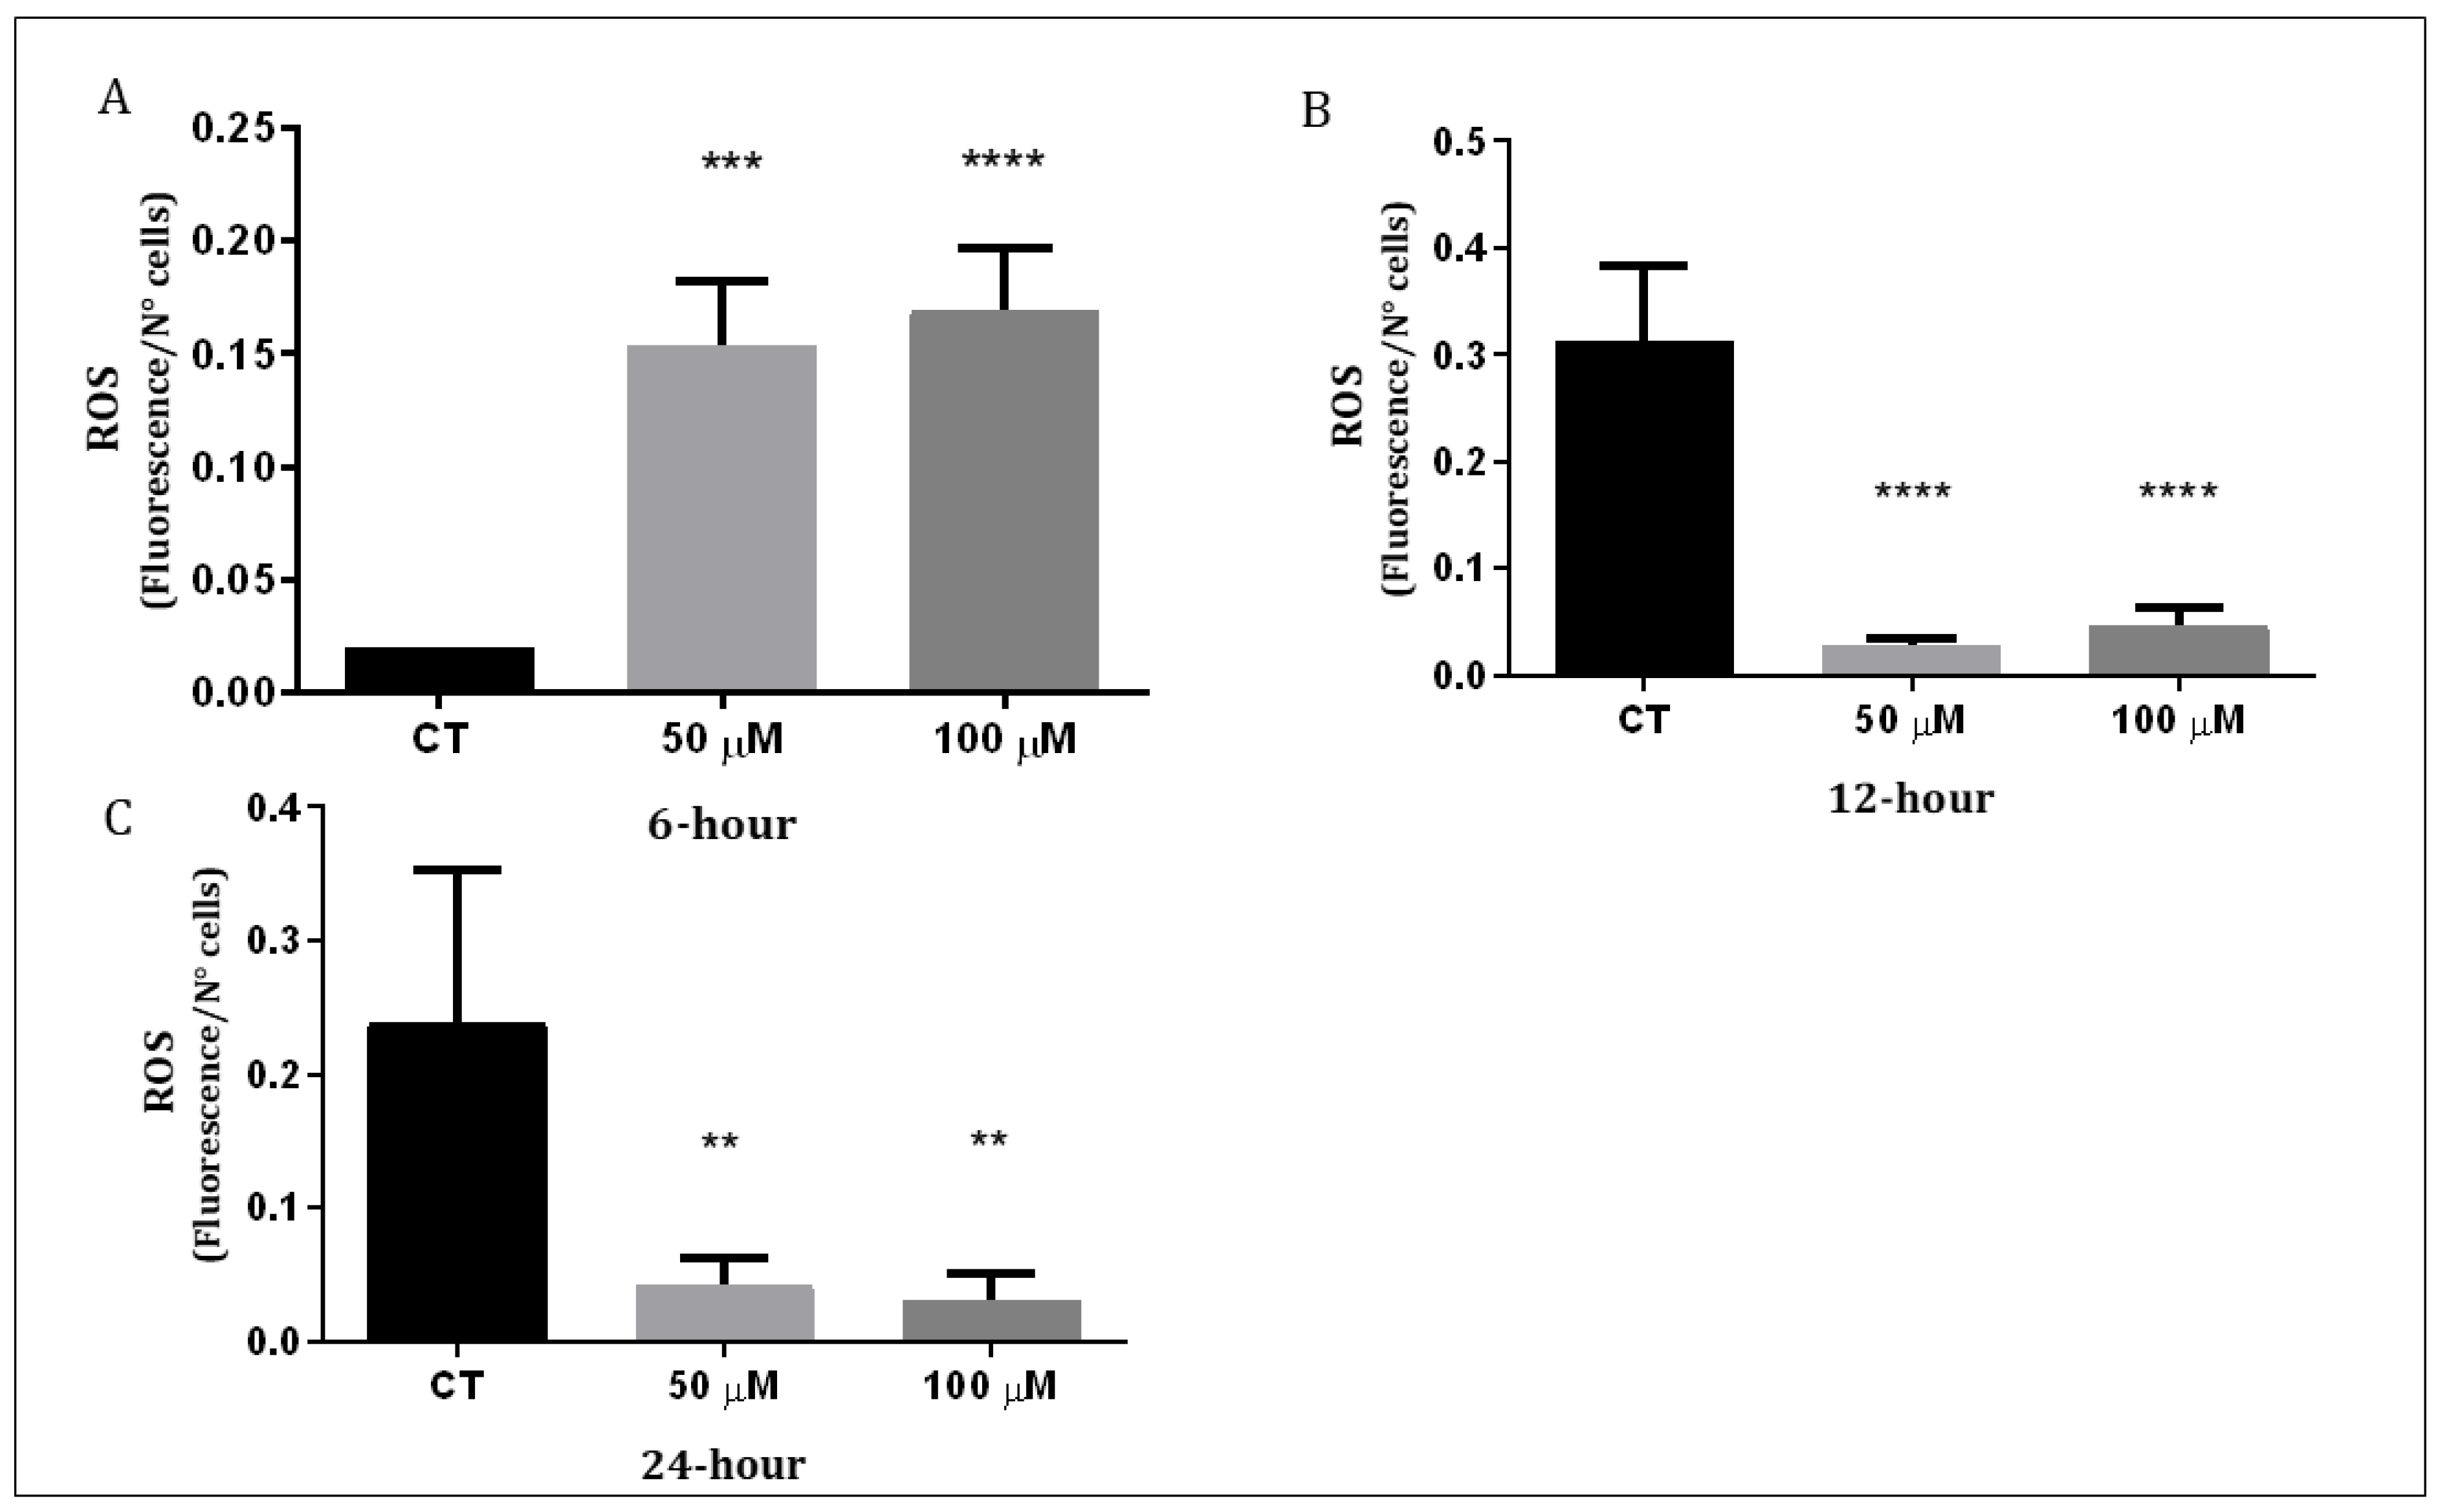
2.6. Measurement of ROS Production
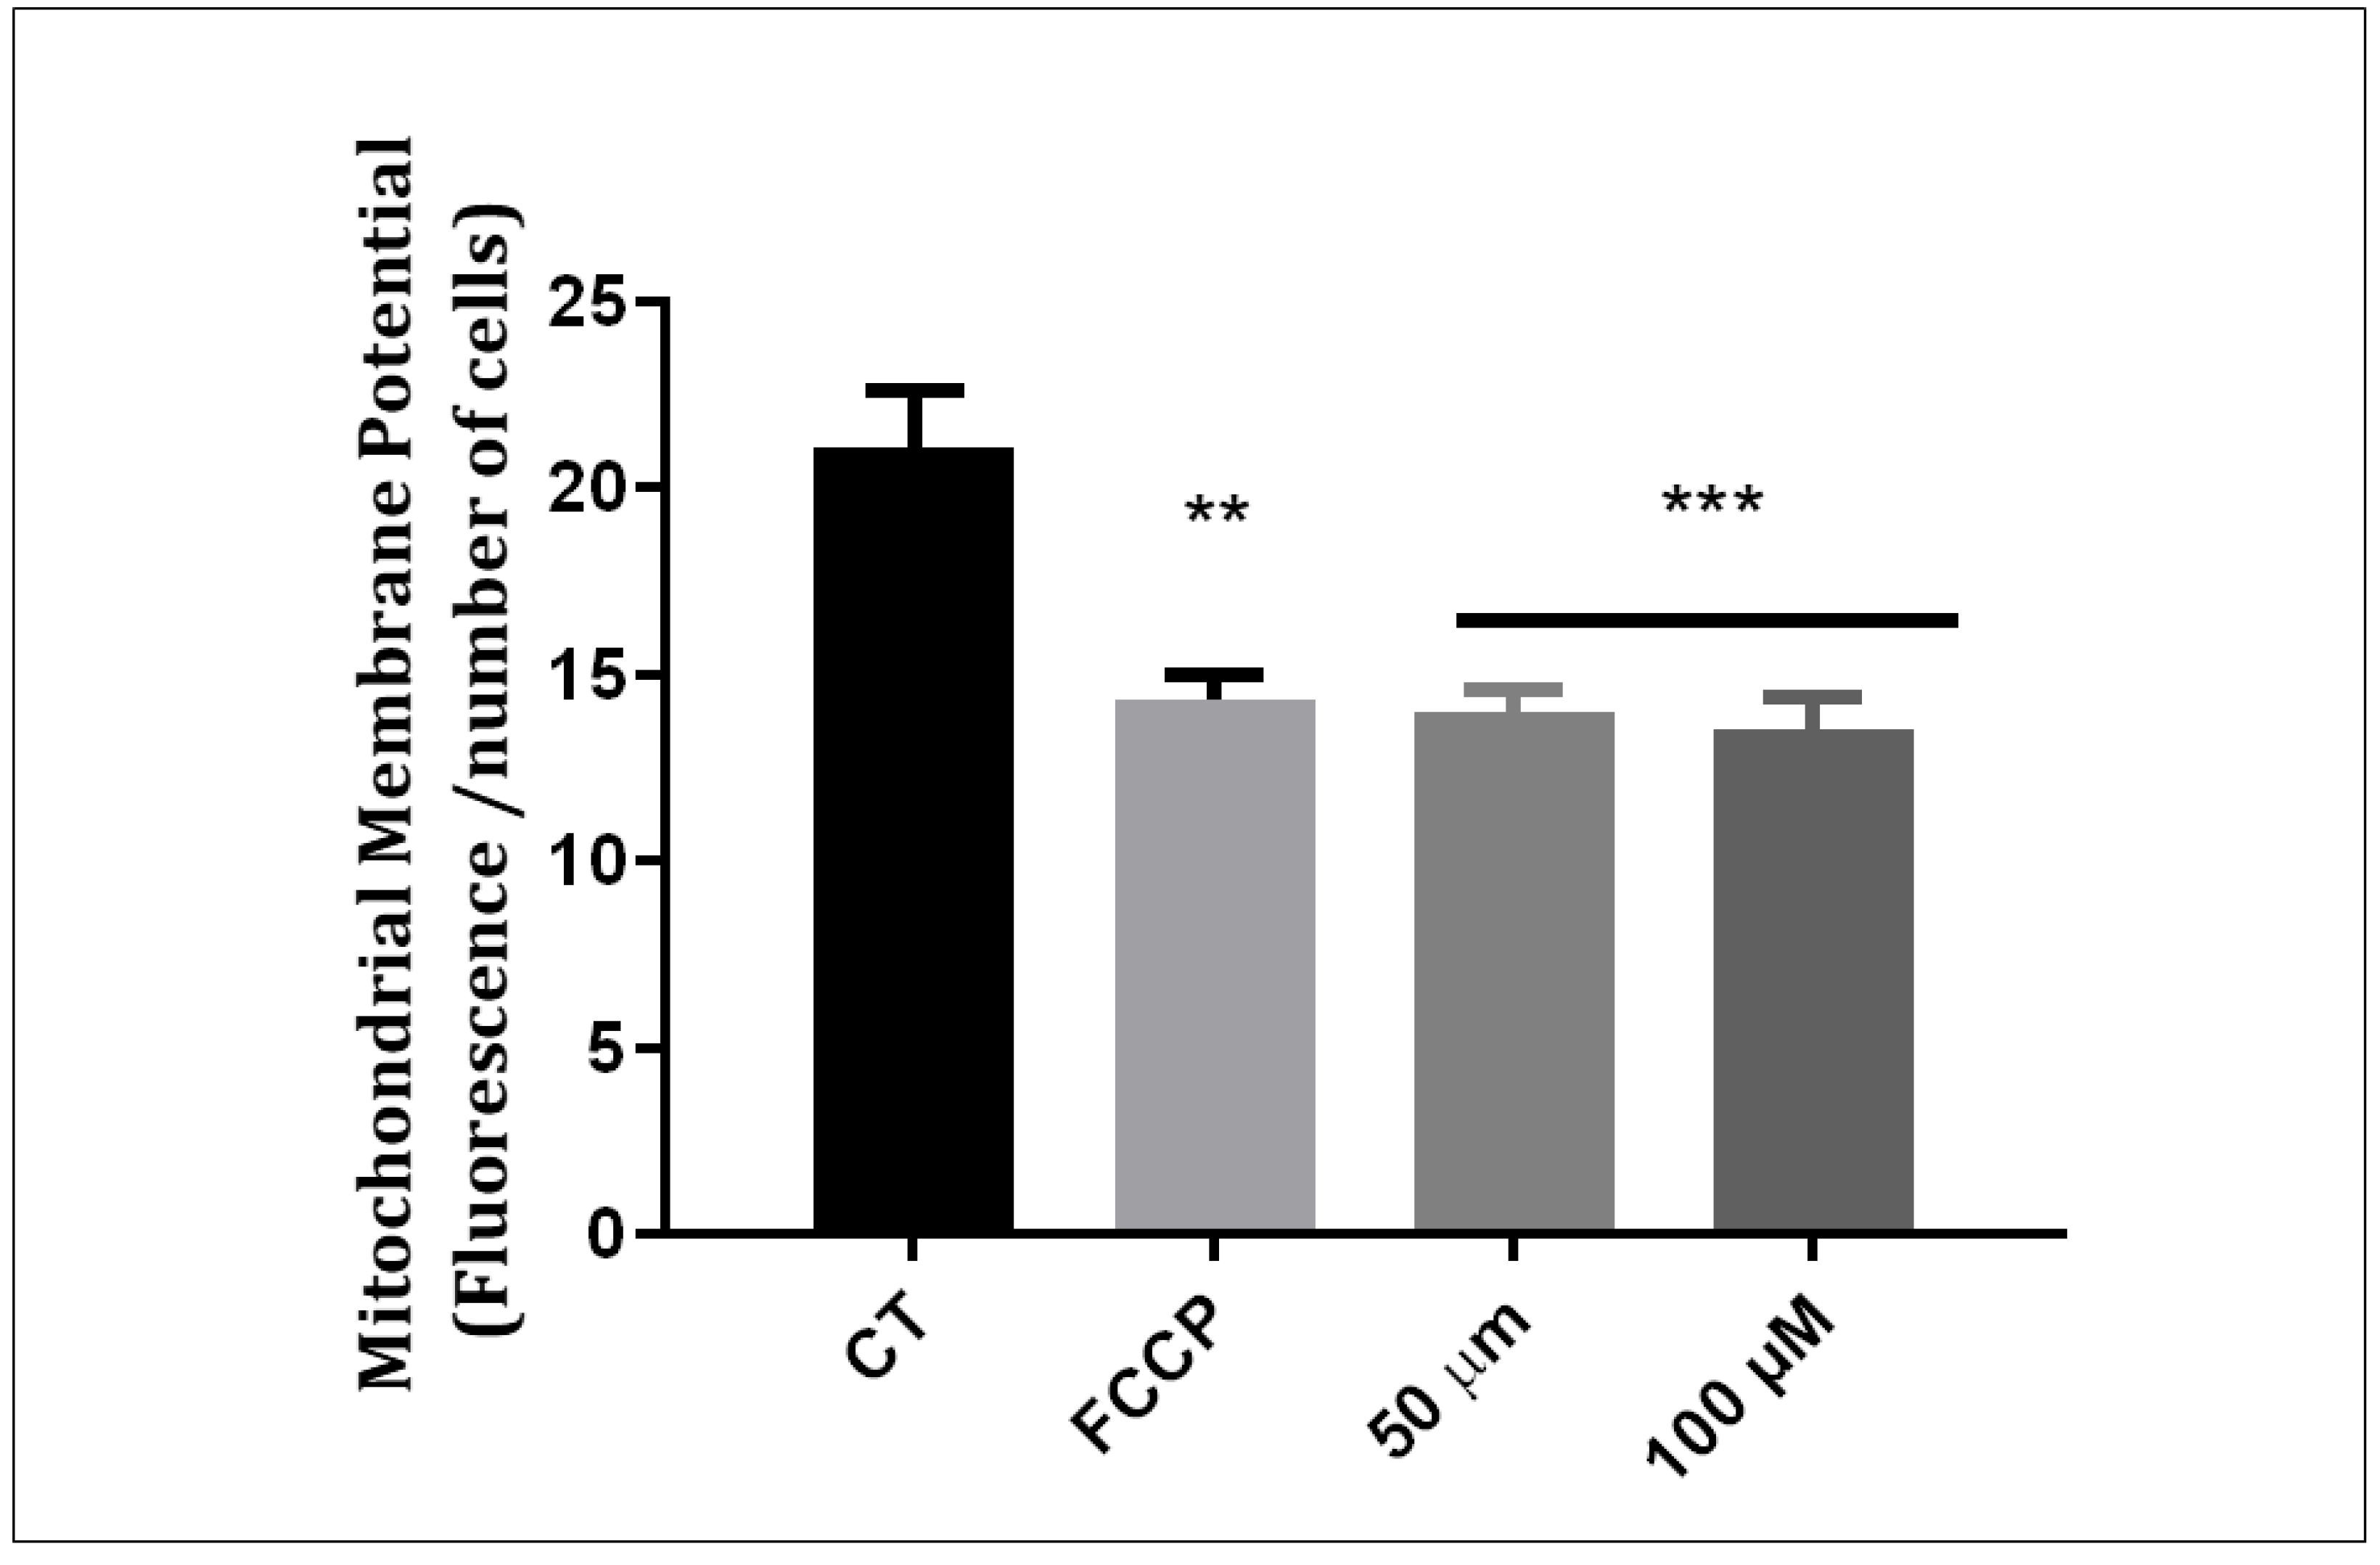
2.7. Measurement of Mitochondrial Membrane Potential
2.8. Apoptosis and Necrosis Detection
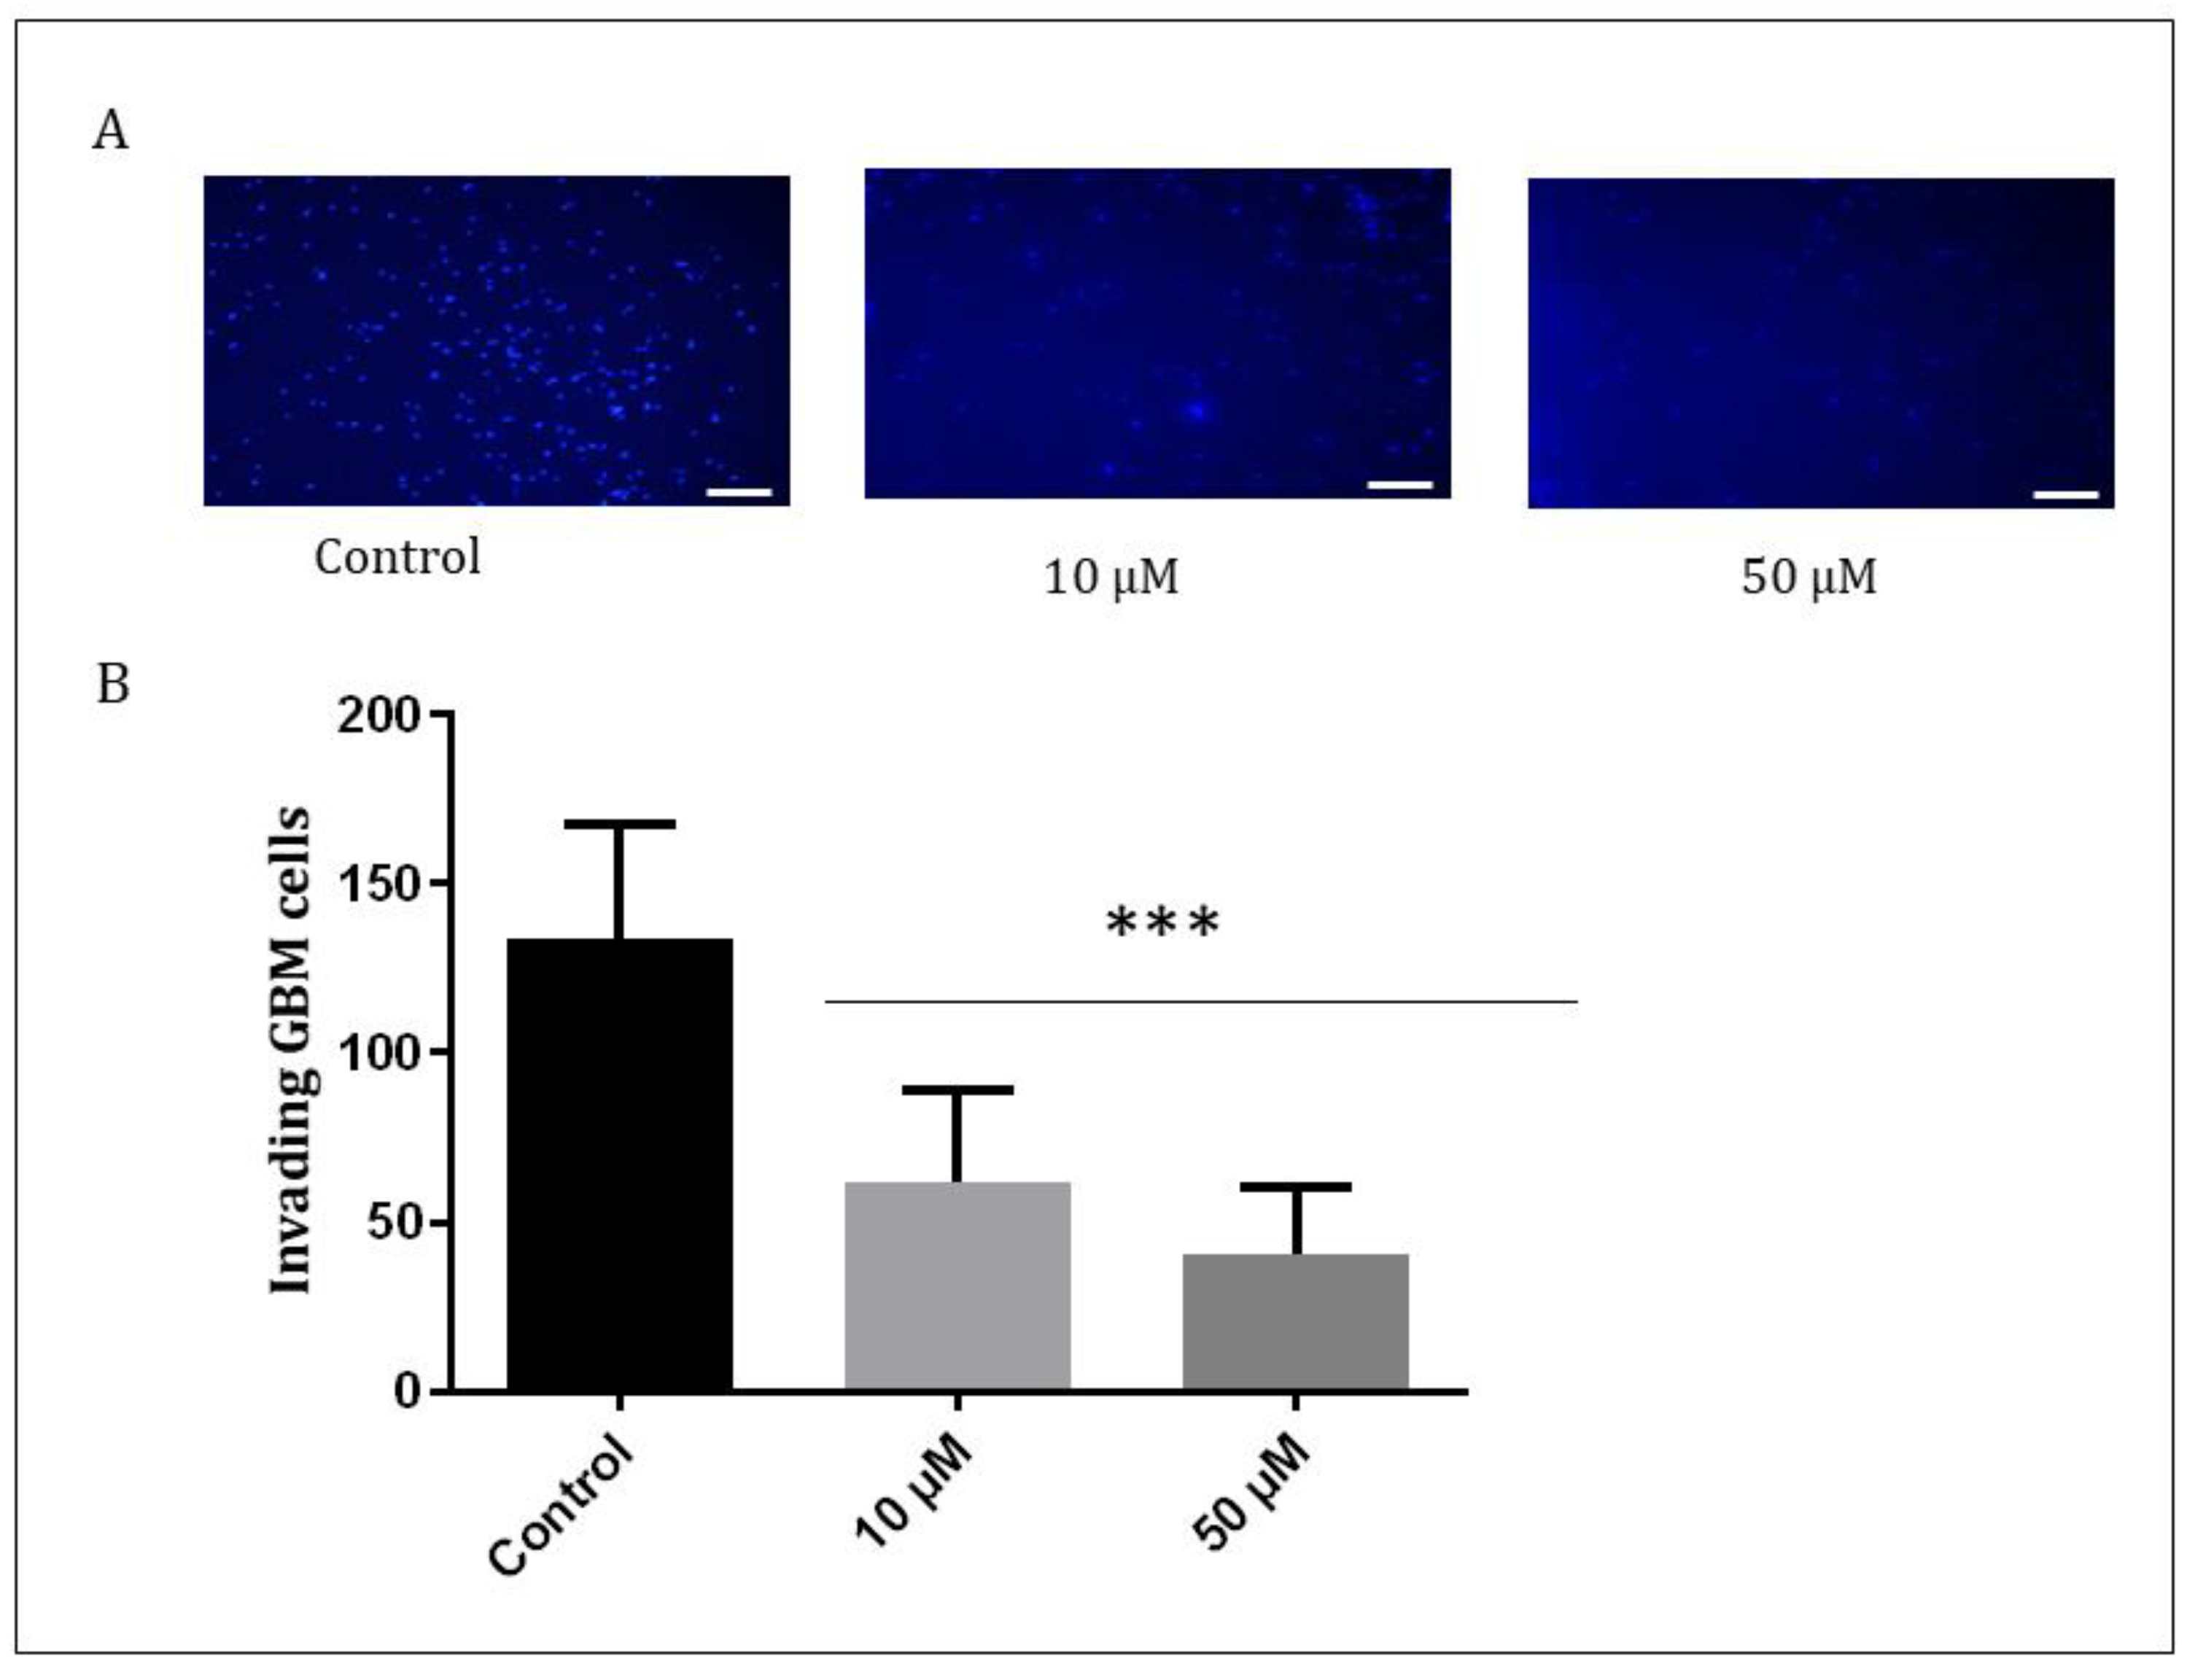
2.9. In Vitro Invasion Assay
2.10. Statistical Analysis
3. Results
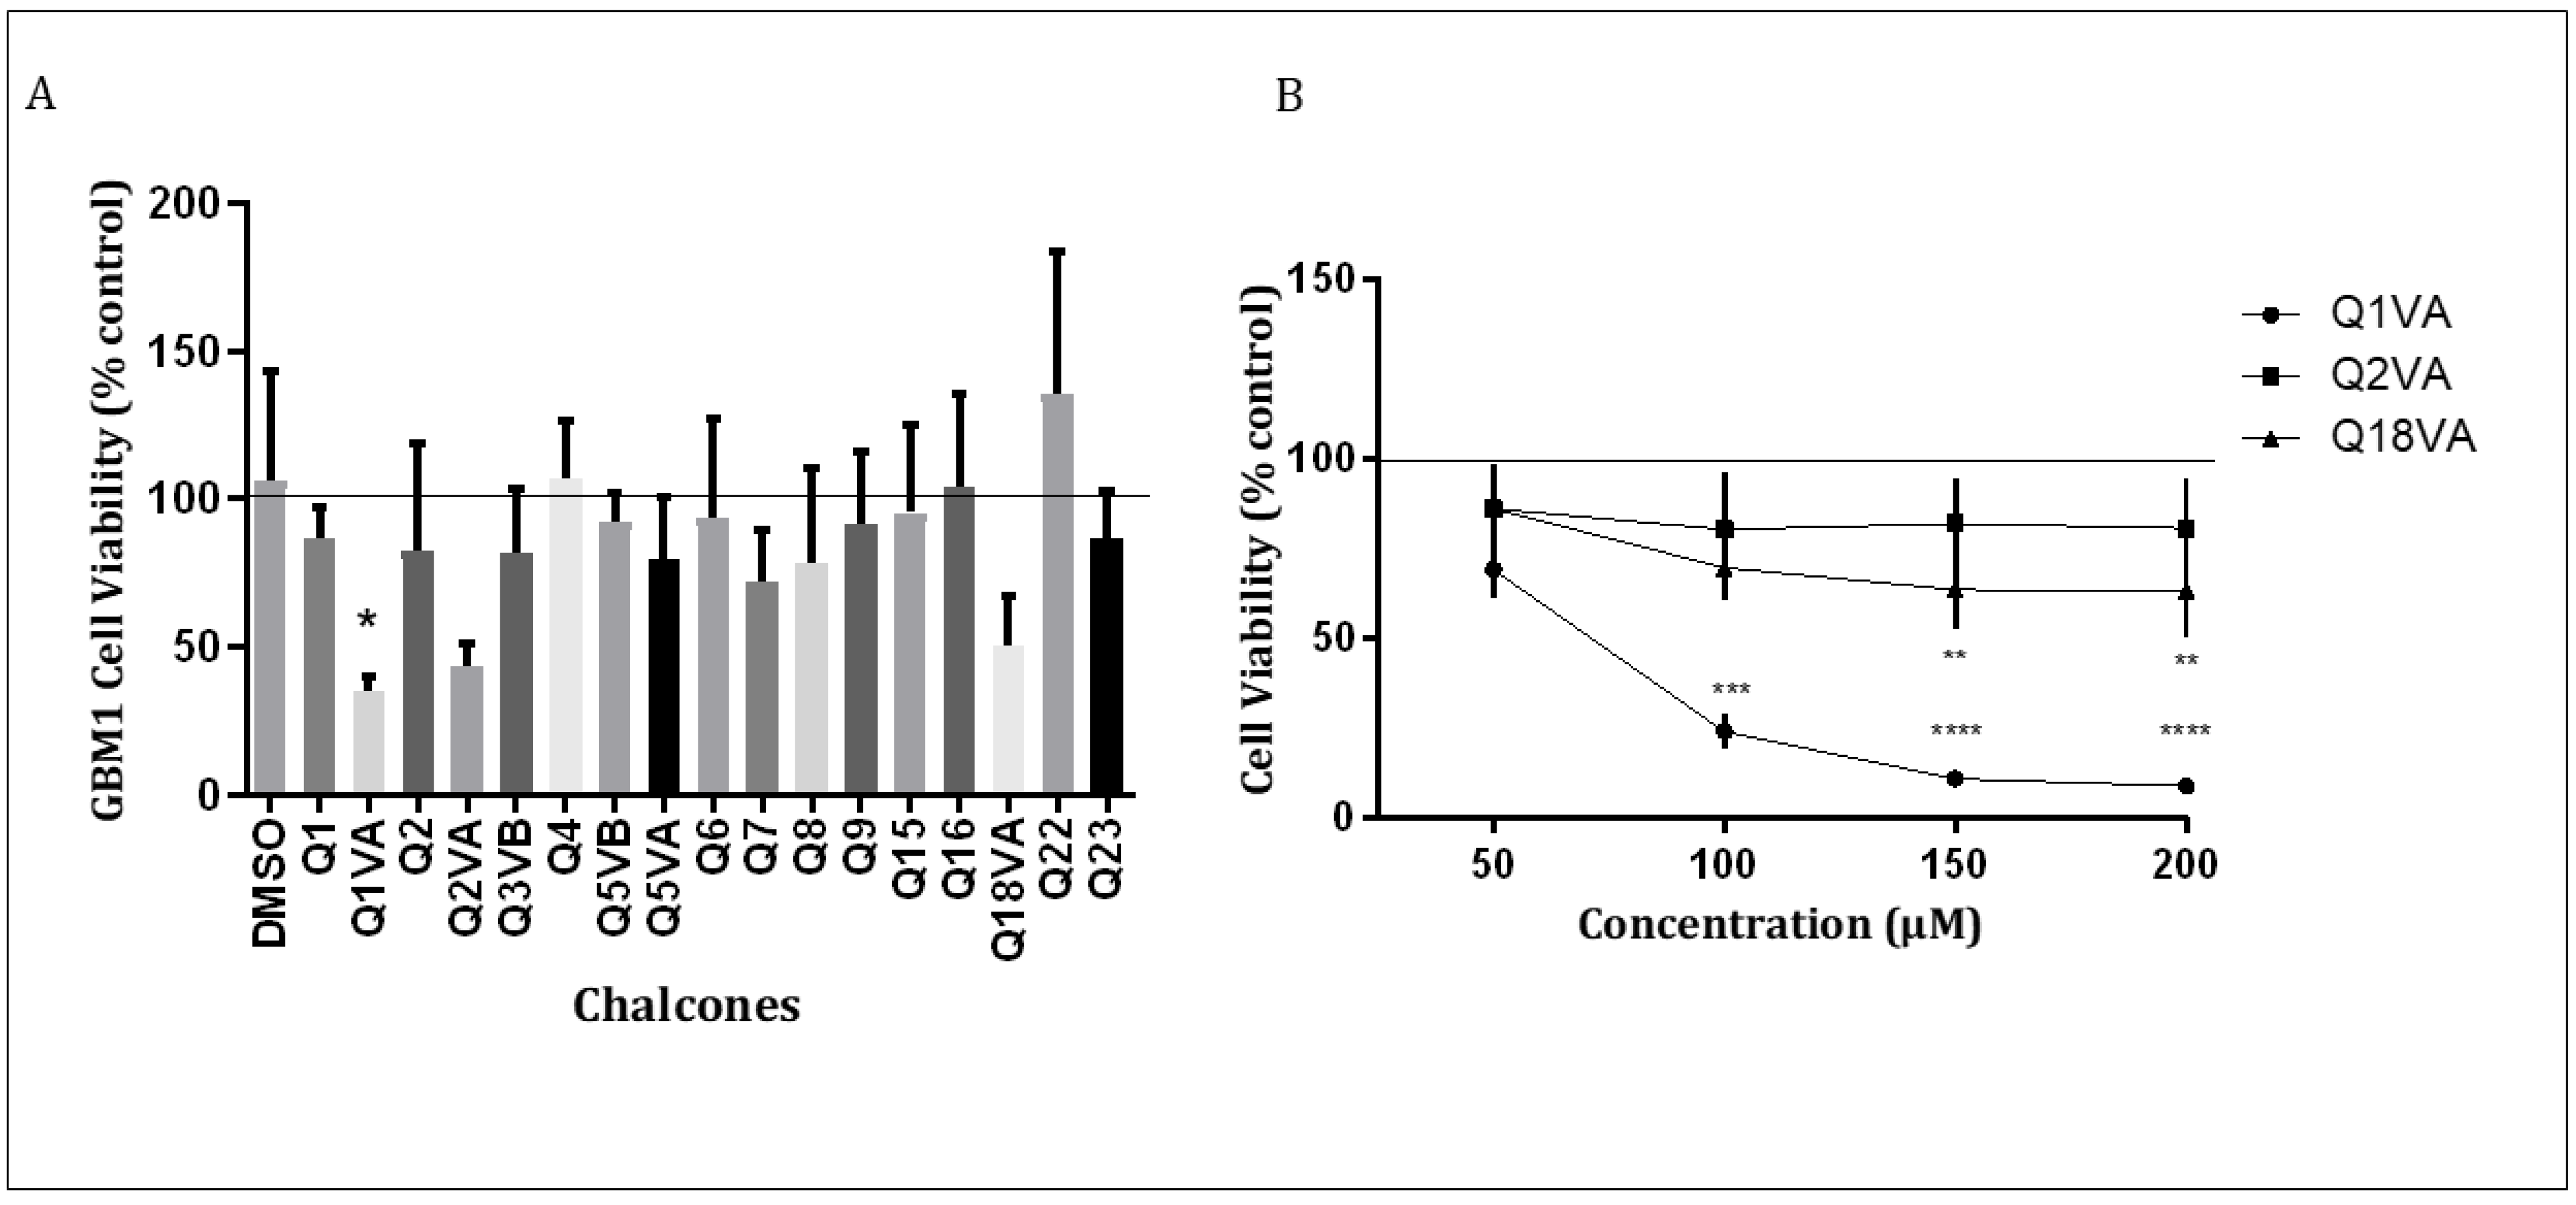
3.1. Effects of Chalcone on Cell Viability
3.1.1. Reaction to Obtain the Chalcones
3.1.2. Initial Screening of Synthetic Chalcones
3.2. Q1VA Interferes with the Cell Cycle
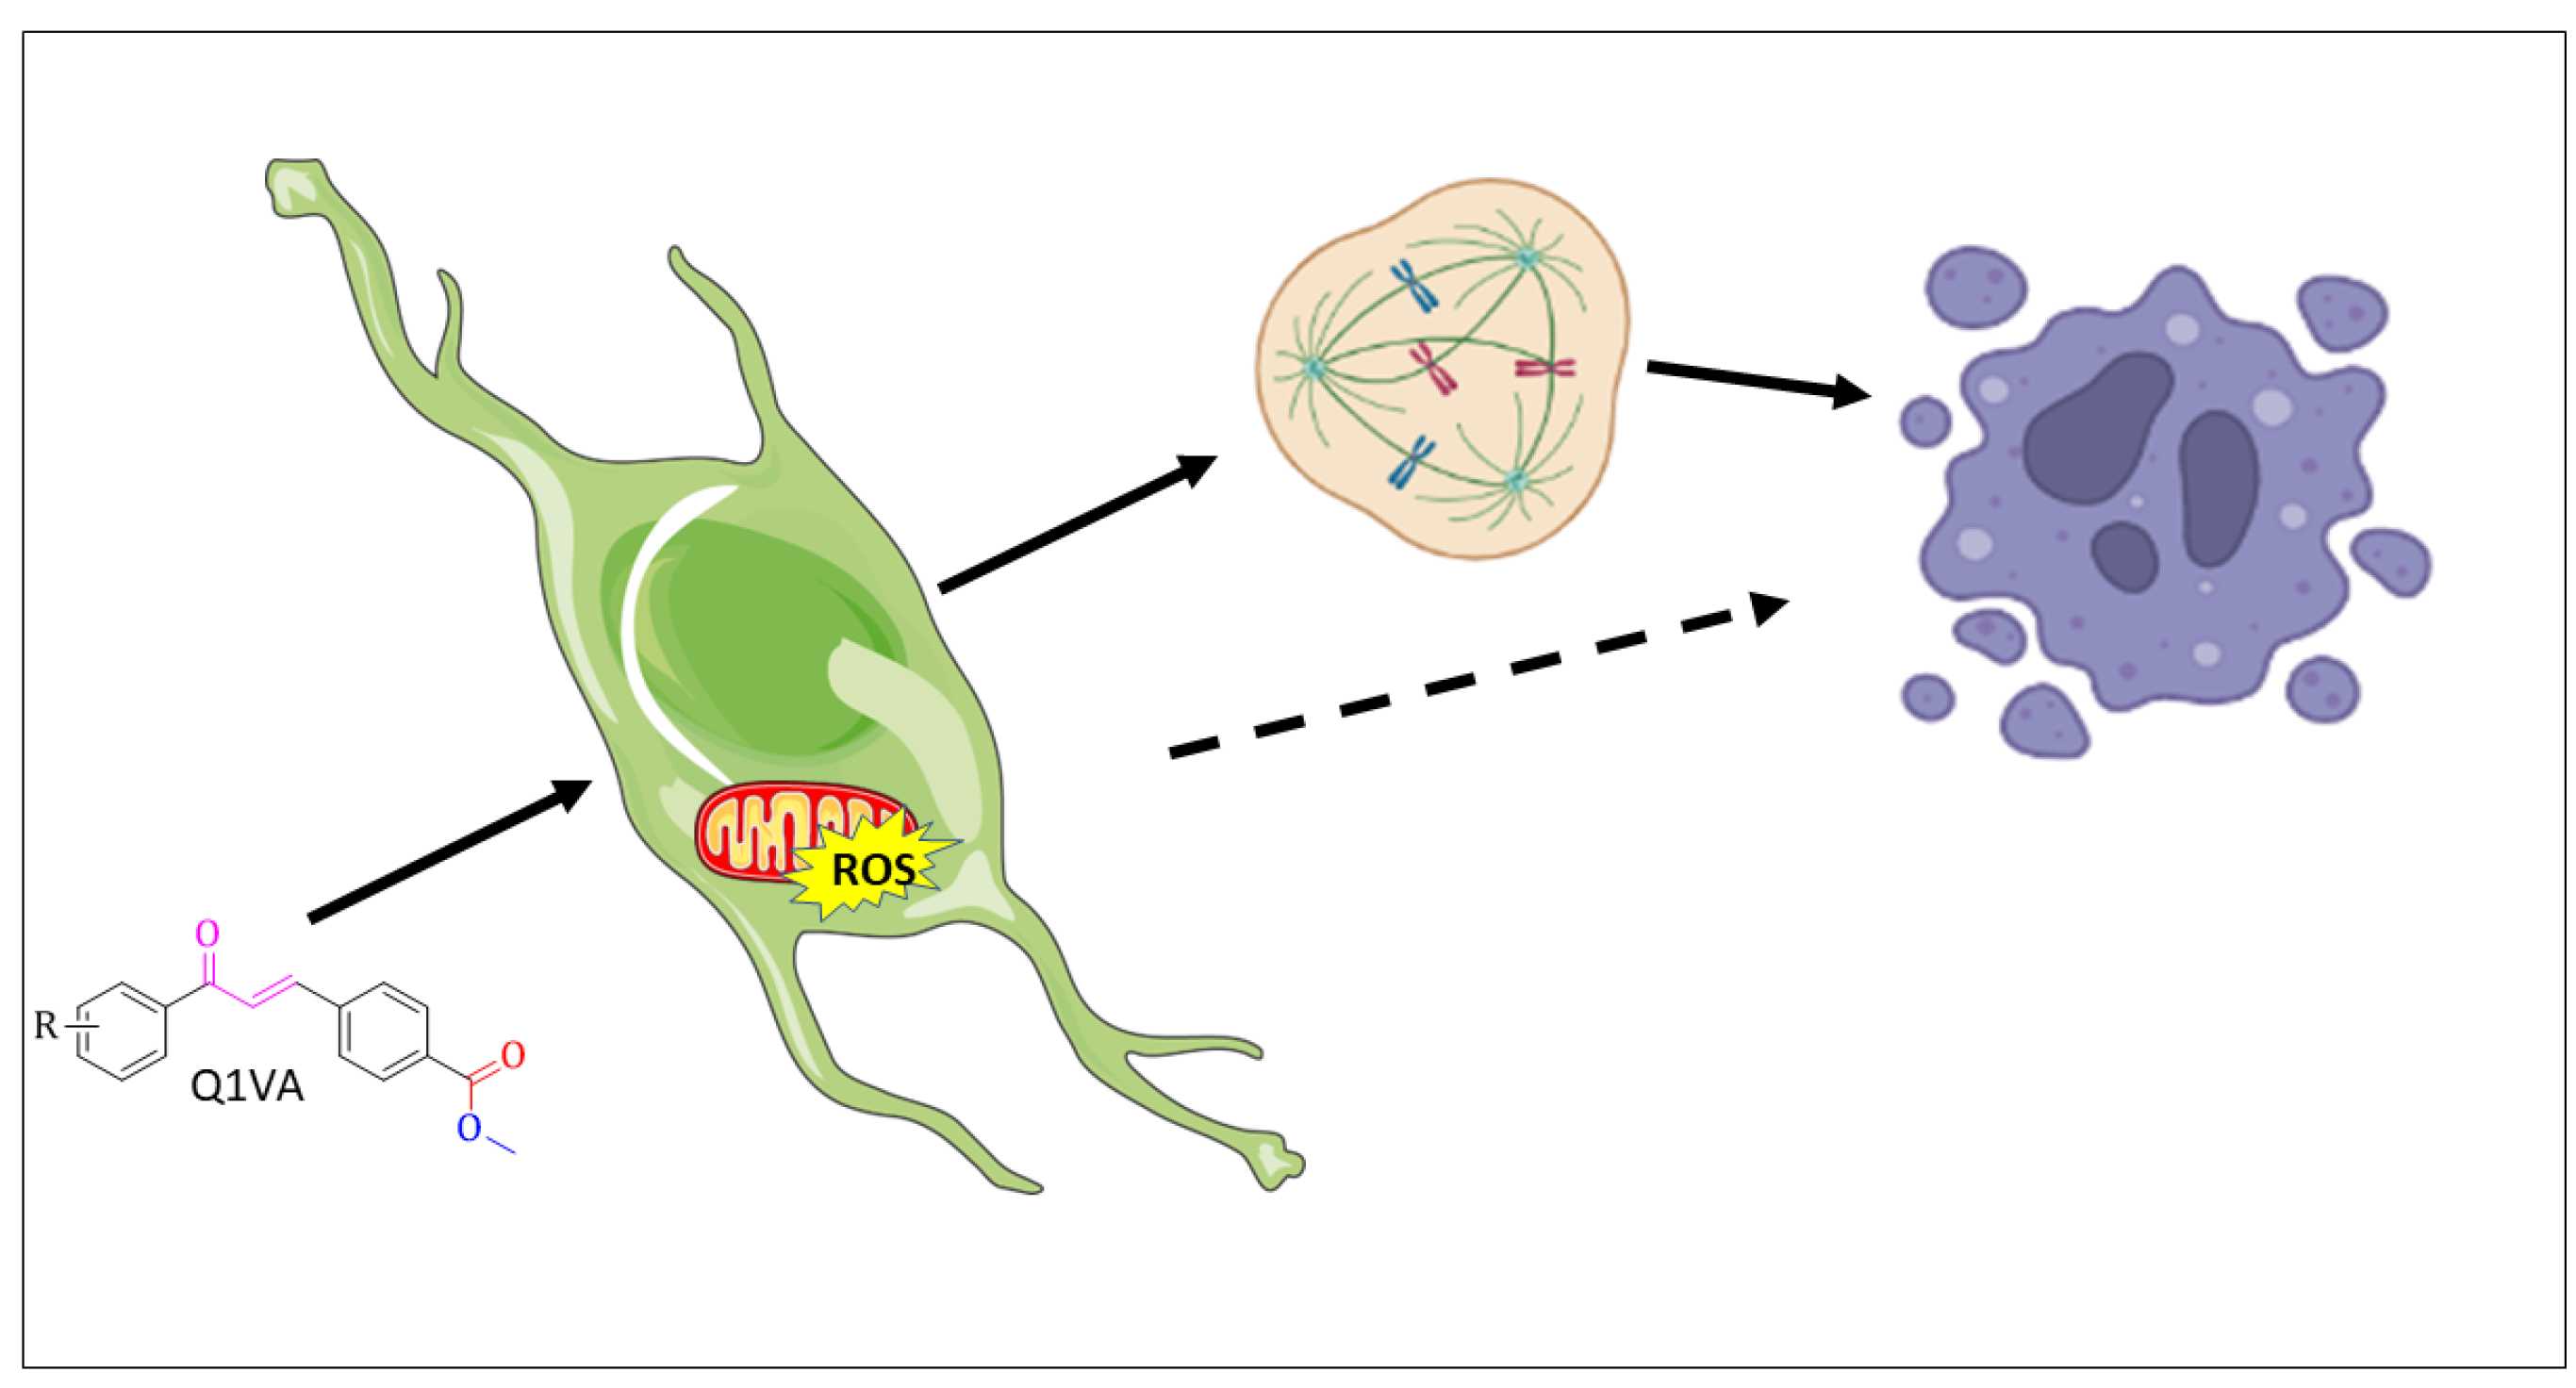
3.3. Q1VA Triggers ROS Production and Mitochondria Depolarization
3.4. Identification of Cell Death
3.5. Suppression of the Invasive Potential of GBM Cells with Q1VA
4. Discussion
5. Conclusions
Author Contributions
Funding
Institutional Review Board Statement
Informed Consent Statement
Data Availability Statement
Conflicts of Interest
References
- Serafim, R.B.; da Silva, P.; Cardoso, C.; Di Cristofaro, L.F.M.; Netto, R.P.; de Almeida, R.; Navegante, G.; Storti, C.B.; de Sousa, J.F.; de Souza, F.C.; et al. Expression Profiling of Glioblastoma Cell Lines Reveals Novel Extracellular Matrix-Receptor Genes Correlated With the Responsiveness of Glioma Patients to Ionizing Radiation. Front. Oncol. 2021, 11, 668090. [Google Scholar] [CrossRef]
- Llaguno, S.R.A.; Wang, Z.; Sun, D.; Chen, J.; Xu, J.; Kim, E.; Hatanpaa, K.J.; Raisanen, J.M.; Burns, D.K.; Johnson, J.E.; et al. Adult Lineage-Restricted CNS Progenitors Specify Distinct Glioblastoma Subtypes. Cancer Cell 2015, 28, 429–440. [Google Scholar] [CrossRef]
- Deleyrolle, L.P.; Harding, A.; Cato, K.; Siebzehnrubl, F.A.; Rahman, M.; Azari, H.; Olson, S.; Gabrielli, B.; Osborne, G.; Vescovi, A.; et al. Evidence for label-retaining tumour-initiating cells in human glioblastoma. Brain 2011, 134, 1331–1343. [Google Scholar] [CrossRef] [PubMed]
- Gimple, R.C.; Bhargava, S.; Dixit, D.; Rich, J.N. Glioblastoma stem cells: Lessons from the tumor hierarchy in a lethal cancer. Genes Dev. 2019, 33, 591–609. [Google Scholar] [CrossRef] [PubMed]
- Najafi, M.; Mortezaee, K.; Majidpoor, J. Cancer stem cell (CSC) resistance drivers. Life Sci. 2019, 234, 116781. [Google Scholar] [CrossRef] [PubMed]
- Alves, A.L.V.; Gomes, I.N.F.; Carloni, A.C.; Rosa, M.N.; da Silva, L.S.; Evangelista, A.F.; Reis, R.M.; Silva, V.A.O. Role of glioblastoma stem cells in cancer therapeutic resistance: A perspective on antineoplastic agents from natural sources and chemical derivatives. Stem Cell Res. Ther. 2021, 12, 1–22. [Google Scholar] [CrossRef]
- Wang, J.Q.; Wu, Z.X.; Yang, Y.; Teng, Q.X.; Li, Y.D.; Lei, Z.N.; Jani, K.A.; Kaushal, N.; Chen, Z.S. ATP-binding cassette (ABC) transporters in cancer: A review of recent updates. J. Evid.-Based Med. 2021, 14, 232–256. [Google Scholar] [CrossRef]
- Chen, G.; Di Zhou, D.; Li, X.-Z.; Jiang, Z.; Tan, C.; Wei, X.-Y.; Ling, J.; Jing, J.; Liu, F.; Li, N. A natural chalcone induces apoptosis in lung cancer cells: 3D-QSAR, docking and an in vivo/vitro assay. Sci. Rep. 2017, 7, 10729. [Google Scholar] [CrossRef]
- Louis, D.N.; Perry, A.; Reifenberger, G.; Von Deimling, A.; Figarella-Branger, D.; Cavenee, W.K.; Ohgaki, H.; Wiestler, O.D.; Kleihues, P.; Ellison, D.W. The 2016 World Health Organization Classification of Tumors of the Central Nervous System: A summary. Acta Neuropathol. 2016, 131, 803–820. [Google Scholar] [CrossRef]
- Leon-Gonzalez, A.; Acero, N.; Munoz-Mingarro, D.; Navarro, I.; Martín-Cordero, C. Chalcones as Promising Lead Compounds on Cancer Therapy. Curr. Med. Chem. 2015, 22, 3407–3425. [Google Scholar] [CrossRef]
- Morandi, L.; Franceschi, E.; de Biase, D.; Marucci, G.; Tosoni, A.; Ermani, M.; Pession, A.; Tallini, G.; Brandes, A. Promoter methylation analysis of O6-methylguanine-DNA methyltransferase in glioblastoma: Detection by locked nucleic acid based quantitative PCR using an imprinted gene (SNURF) as a reference. BMC Cancer 2010, 10, 48. [Google Scholar] [CrossRef] [PubMed]
- Mu, L.; Long, Y.; Yang, C.; Jin, L.; Tao, H.; Ge, H.; Chang, Y.E.; Karachi, A.; Kubilis, P.S.; De Leon, G.; et al. The IDH1 Mutation-Induced Oncometabolite, 2-Hydroxyglutarate, May Affect DNA Methylation and Expression of PD-L1 in Gliomas. Front. Mol. Neurosci. 2018, 11, 82. [Google Scholar] [CrossRef] [PubMed]
- Turkowski, K.; Brandenburg, S.; Mueller, A.; Kremenetskaia, I.; Bungert, A.D.; Blank, A.; Felsenstein, M.; Vajkoczy, P. VEGF as a modulator of the innate immune response in glioblastoma. Glia 2017, 66, 161–174. [Google Scholar] [CrossRef] [PubMed]
- Doolittle, N.D.; Muldoon, L.L.; Culp, A.Y.; Neuwelt, E.A. Delivery of Chemotherapeutics Across the Blood–Brain Barrier. Adv. Pharmacol. 2014, 71, 203–243. [Google Scholar] [CrossRef]
- WalyEldeen, A.A.; Sabet, S.; El-Shorbagy, H.M.; Abdelhamid, I.A.; Ibrahim, S.A. Chalcones: Promising therapeutic agents targeting key players and signaling pathways regulating the hallmarks of cancer. Chem.-Biol. Interact. 2022, 369, 110297. [Google Scholar] [CrossRef]
- Zhuang, C.; Zhang, W.; Sheng, C.; Zhang, W.; Xing, C.; Miao, Z. Chalcone: A Privileged Structure in Medicinal Chemistry. Chem. Rev. 2017, 117, 7762–7810. [Google Scholar] [CrossRef]
- Ducki, S. The development of chalcones as promising anticancer agents. IDrugs Investig. Drugs J. 2007, 10, 42. [Google Scholar]
- Rammohan, A.; Reddy, J.S.; Sravya, G.; Rao, C.N.; Zyryanov, G.V. Chalcone synthesis, properties and medicinal applications: A review. Environ. Chem. Lett. 2020, 18, 433–458. [Google Scholar] [CrossRef]
- Sinha, S.; Medhi, B.; Radotra, B.D.; Batovska, D.I.; Markova, N.; Bhalla, A.; Sehgal, R. Antimalarial and immunomodulatory potential of chalcone derivatives in experimental model of malaria. BMC Complement. Med. Ther. 2022, 22, 1–14. [Google Scholar] [CrossRef]
- Pereira, D.; Durães, F.; Szemerédi, N.; Freitas-Da-Silva, J.; Pinto, E.; Martins-Da-Costa, P.; Pinto, M.; Correia-Da-Silva, M.; Spengler, G.; Sousa, E.; et al. New Chalcone–Triazole Hybrids with Promising Antimicrobial Activity in Multidrug Resistance Strains. Int. J. Mol. Sci. 2022, 23, 14291. [Google Scholar] [CrossRef]
- Pereira, R.; Silva, A.M.; Ribeiro, D.; Silva, V.L.; Fernandes, E. Bis-chalcones: A review of synthetic methodologies and anti-inflammatory effects. Eur. J. Med. Chem. 2023, 252, 115280. [Google Scholar] [CrossRef] [PubMed]
- Champelovier, P.; Chauchet, X.; Puch, F.; Vergnaud, S.; Garrel, C.; Laporte, F.; Boutonnat, J.; Boumendjel, A. Cellular and molecular mechanisms activating the cell death processes by chalcones: Critical structural effects. Toxicol. Vitr. 2013, 27, 2305–2315. [Google Scholar] [CrossRef]
- Mantzanidou, M.; Hadjipavlou-Litina, D. Chalcones and their Potential Role in Inflammation. Mini-Rev. Med. Chem. 2008, 8, 1224–1242. [Google Scholar] [CrossRef]
- Daraei, B.; Karimi, G.; Makhdoumi, P.; Zarghi, A. Evaluation of Cytotoxicity Effects of Chalcone Epoxide Analogues as a Selective COX-II Inhibitor in the Human Liver Carcinoma Cell Line. J. Pharmacopunct. 2017, 20, 207–212. [Google Scholar] [CrossRef]
- Nowakowska, Z. A review of anti-infective and anti-inflammatory chalcones. Eur. J. Med. Chem. 2007, 42, 125–137. [Google Scholar] [CrossRef] [PubMed]
- Boumendjel, A.; McLeer-Florin, A.; Champelovier, P.; Allegro, D.; Muhammad, D.; Souard, F.; Derouazi, M.; Peyrot, V.; Toussaint, B.; Boutonnat, J. A novel chalcone derivative which acts as a microtubule depolymerising agent and an inhibitor of P-gp and BCRP in in-vitro and in-vivoglioblastoma models. BMC Cancer 2009, 9, 242. [Google Scholar] [CrossRef]
- Bunning, A.R.; Gupta, M.L., Jr. The importance of microtubule-dependent tension in accurate chromosome segregation. Front. Cell Dev. Biol. 2023, 11, 1096333. [Google Scholar] [CrossRef]
- Ryu, J.; Pyo, J.; Lee, C.-W.; Kim, J.-E. An Aurora kinase inhibitor, AMG900, inhibits glioblastoma cell proliferation by disrupting mitotic progression. Cancer Med. 2018, 7, 5589–5603. [Google Scholar] [CrossRef]
- Metselaar, D.S.; du Chatinier, A.; Meel, M.H.; ter Huizen, G.; Waranecki, P.; Goulding, J.R.; Bugiani, M.; Koster, J.; Kaspers, G.J.; Hulleman, E. AURKA and PLK1 inhibition selectively and synergistically block cell cycle progression in diffuse midline glioma. iScience 2022, 25, 104398. [Google Scholar] [CrossRef]
- Mesic, A.; Rogar, M.; Hudler, P.; Bilalovic, N.; Eminovic, I.; Komel, R. Genetic variations in AURORA cell cycle kinases are associated with glioblastoma multiforme. Sci. Rep. 2021, 11, 1–9. [Google Scholar] [CrossRef]
- Bittencourt, L.F.F.; de Oliveira, K.A.; Cardoso, C.B.; Lopes, F.G.; Dal-Cim, T.; Chiaradia-Delatorre, L.D.; Mascarello, A.; Maluf, S.W.; Yunes, R.A.; Garcez, R.C.; et al. Novel synthetic chalcones induces apoptosis in human glioblastoma cells. Chem. Interact. 2016, 252, 74–81. [Google Scholar] [CrossRef]
- Septianingtyas, D.; Zafira, N.; Zulhipri; Kurniadewi, F.; Dianhar, H. Green synthesis of chalcones derivatives. In AIP Conference Proceedings; AIP Publishing LLC: Melville, NY, USA, 2021; Volume 2331, p. 040020. [Google Scholar] [CrossRef]
- Perrin, C.L.; Chang, K.-L. The Complete Mechanism of an Aldol Condensation. J. Org. Chem. 2016, 81, 5631–5635. [Google Scholar] [CrossRef] [PubMed]
- De Souza, A.C.; Mori, M.; Sens, L.; Rocha, R.F.; Tizziani, T.; de Souza, L.F.; Chiaradia-Delatorre, L.D.; Botta, M.; Nunes, R.J.; Terenzi, H.; et al. A chalcone derivative binds a putative allosteric site of YopH: Inhibition of a virulence factor of Yersinia. Bioorganic Med. Chem. Lett. 2020, 30, 127350. [Google Scholar] [CrossRef] [PubMed]
- Mosmann, T. Rapid colorimetric assay for cellular growth and survival: Application to proliferation and cytotoxicity assays. J. Immunol. Methods 1983, 65, 55–63. [Google Scholar] [CrossRef] [PubMed]
- Zorov, D.B.; Juhaszova, M.; Sollott, S.J. Mitochondrial ROS-induced ROS release: An update and review. Biochim. Biophys. Acta (BBA)—Bioenerg. 2006, 1757, 509–517. [Google Scholar] [CrossRef] [PubMed]
- Aslan, M.; Hsu, E.-C.; Liu, S.; Stoyanova, T. Quantifying the invasion and migration ability of cancer cells with a 3D Matrigel drop invasion assay. Biol. Methods Protoc. 2021, 6, bpab014. [Google Scholar] [CrossRef]
- Koh, I.; Cha, J.; Park, J.; Choi, J.; Kang, S.-G.; Kim, P. The mode and dynamics of glioblastoma cell invasion into a decellularized tissue-derived extracellular matrix-based three-dimensional tumor model. Sci. Rep. 2018, 8, 4608. [Google Scholar] [CrossRef]
- Kalluri, R.; Weinberg, R.A. The basics of epithelial-mesenchymal transition. J. Clin. Investig. 2009, 119, 1420–1428. [Google Scholar] [CrossRef]
- Ghasemi, M.; Turnbull, T.; Sebastian, S.; Kempson, I. The MTT Assay: Utility, Limitations, Pitfalls, and Interpretation in Bulk and Single-Cell Analysis. Int. J. Mol. Sci. 2021, 22, 12827. [Google Scholar] [CrossRef]
- So, J.-S.; Kim, H.; Han, K.-S. Mechanisms of Invasion in Glioblastoma: Extracellular Matrix, Ca2+ Signaling, and Glutamate. Front. Cell. Neurosci. 2021, 15, 663092. [Google Scholar] [CrossRef]
- Lopes, F.G.; Oliveira, K.A.; Lopes, R.G.; Poluceno, G.G.; Simioni, C.; Gabriel, D.S.P.; Bauer, C.M.; Maraschin, M.; Derner, R.B.; Garcez, R.C.; et al. Anti-cancer Effects of Fucoxanthin on Human Glioblastoma Cell Line. Anticancer Res. 2020, 40, 6799–6815. [Google Scholar] [CrossRef] [PubMed]
- Cheng, X.; Geng, F.; Pan, M.; Wu, X.; Zhong, Y.; Wang, C.; Tian, Z.; Cheng, C.; Zhang, R.; Puduvalli, V.; et al. Targeting DGAT1 Ameliorates Glioblastoma by Increasing Fat Catabolism and Oxidative Stress. Cell Metab. 2020, 32, 229–242. [Google Scholar] [CrossRef] [PubMed]
- Nishimura, R.; Tabata, K.; Arakawa, M.; Ito, Y.; Kimura, Y.; Akihisa, T.; Nagai, H.; Sakuma, A.; Kohno, H.; Suzuki, T. Isobavachalcone, a Chalcone Constituent of Angelica keiskei, Induces Apoptosis in Neuroblastoma. Biol. Pharm. Bull. 2007, 30, 1878–1883. [Google Scholar] [CrossRef] [PubMed]
- Ramos, S. Cancer chemoprevention and chemotherapy: Dietary polyphenols and signalling pathways. Mol. Nutr. Food Res. 2008, 52, 507–526. [Google Scholar] [CrossRef] [PubMed]
- Zhang, B.-B.; Wang, D.-G.; Guo, F.-F.; Xuan, C. Mitochondrial membrane potential and reactive oxygen species in cancer stem cells. Fam. Cancer 2015, 14, 19–23. [Google Scholar] [CrossRef] [PubMed]
- Aggarwal, B.; Prasad, S.; Yadav, V.; Park, B.; Kim, J.; Gupta, S.; Yoon, S.; Lavasanifar, A.; Sung, B. Targeting inflammatory pathways by dietary agents for prevention and therapy of cancer. J. Food Drug Anal. 2012, 20, 57. [Google Scholar] [CrossRef]
- Ismail, S.; Haris, K.; Ghani, A.R.I.A.; Abdullah, J.M.; Johan, M.F.; Yusoff, A.A.M. Enhanced induction of cell cycle arrest and apoptosis via the mitochondrial membrane potential disruption in human U87 malignant glioma cells by aloe emodin. J. Asian Nat. Prod. Res. 2013, 15, 1003–1012. [Google Scholar] [CrossRef]
- Aldape, K.; Zadeh, G.; Mansouri, S.; Reifenberger, G.; von Deimling, A. Glioblastoma: Pathology, molecular mechanisms and markers. Acta Neuropathol. 2015, 129, 829–848. [Google Scholar] [CrossRef]
- Yee, P.P.; Wei, Y.; Kim, S.-Y.; Lu, T.; Chih, S.Y.; Lawson, C.; Tang, M.; Liu, Z.; Anderson, B.; Thamburaj, K.; et al. Neutrophil-induced ferroptosis promotes tumor necrosis in glioblastoma progression. Nat. Commun. 2020, 11, 1–22. [Google Scholar] [CrossRef]
- Chang, C.-T.; Hseu, Y.-C.; Thiyagarajan, V.; Lin, K.-Y.; Way, T.-D.; Korivi, M.; Liao, J.-W.; Yang, H.-L. Chalcone flavokawain B induces autophagic-cell death via reactive oxygen species-mediated signaling pathways in human gastric carcinoma and suppresses tumor growth in nude mice. Arch. Toxicol. 2017, 91, 3341–3364. [Google Scholar] [CrossRef]
- Masoudi, M.S.; Mehrabian, E.; Mirzaei, H. MiR-21: A key player in glioblastoma pathogenesis. J. Cell. Biochem. 2017, 119, 1285–1290. [Google Scholar] [CrossRef] [PubMed]
- Kim, H.-K.; Lee, H.-Y.; Alam Riaz, T.; Bhattarai, K.R.; Chaudhary, M.; Ahn, J.H.; Jeong, J.; Kim, H.-R.; Chae, H.-J. Chalcone suppresses tumor growth through NOX4-IRE1α sulfonation-RIDD-miR-23b axis. Redox Biol. 2021, 40, 101853. [Google Scholar] [CrossRef] [PubMed]
- Ouyang, Y.; Li, J.; Chen, X.; Fu, X.; Sun, S.; Wu, Q. Chalcone Derivatives: Role in Anticancer Therapy. Biomolecules 2021, 11, 894. [Google Scholar] [CrossRef] [PubMed]


Disclaimer/Publisher’s Note: The statements, opinions and data contained in all publications are solely those of the individual author(s) and contributor(s) and not of MDPI and/or the editor(s). MDPI and/or the editor(s) disclaim responsibility for any injury to people or property resulting from any ideas, methods, instructions or products referred to in the content. |
© 2023 by the authors. Licensee MDPI, Basel, Switzerland. This article is an open access article distributed under the terms and conditions of the Creative Commons Attribution (CC BY) license (https://creativecommons.org/licenses/by/4.0/).
Share and Cite
Togni, A.; Piermartiri, T.; de Souza, L.F.S.; Chiaradia Delatorre, L.D.; Nunes, R.J.; Tasca, C.I.; Nedel, C.B. Q1VA, a Synthetic Chalcone, Induces Apoptosis and Decreases Invasion on Primary Culture of Human Glioblastoma. Neuroglia 2023, 4, 102-118. https://doi.org/10.3390/neuroglia4020008
Togni A, Piermartiri T, de Souza LFS, Chiaradia Delatorre LD, Nunes RJ, Tasca CI, Nedel CB. Q1VA, a Synthetic Chalcone, Induces Apoptosis and Decreases Invasion on Primary Culture of Human Glioblastoma. Neuroglia. 2023; 4(2):102-118. https://doi.org/10.3390/neuroglia4020008
Chicago/Turabian StyleTogni, Anderson, Tetsade Piermartiri, Luiz Felipe Schmitz de Souza, Louise Domeneghi Chiaradia Delatorre, Ricardo José Nunes, Carla Inês Tasca, and Cláudia Beatriz Nedel. 2023. "Q1VA, a Synthetic Chalcone, Induces Apoptosis and Decreases Invasion on Primary Culture of Human Glioblastoma" Neuroglia 4, no. 2: 102-118. https://doi.org/10.3390/neuroglia4020008