Article

Temporal Profile of Reactive Astrocytes after Ischemic Stroke in Rats

1
College of Medicine, Central Michigan University, Mount Pleasant, MI 48859, USA
2
Program in Neuroscience, Central Michigan University, Mount Pleasant, MI 48859, USA
3
Field Neurosciences Institute Laboratory for Restorative Neurology, Central Michigan University, Mount Pleasant, MI 48859, USA
4
Department of Anatomy and Cell Biology, The George Washington University, Washington, DC 20052, USA
5
Department of Psychology, Central Michigan University, Mount Pleasant, MI 48859, USA
6
Field Neurosciences Institute, St. Mary’s of Michigan, Saginaw, MI 48604, USA
*
Author to whom correspondence should be addressed.
Neuroglia 2022, 3(3), 99-111; https://doi.org/10.3390/neuroglia3030007
Submission received: 24 August 2022 / Revised: 9 September 2022 / Accepted: 12 September 2022 / Published: 16 September 2022

Abstract

:
Ischemic stroke is a debilitating neurological disease most commonly resulting from an occlusion within the cerebral vasculature. Ischemia/reperfusion injury is oftentimes a consequence of stroke, characterized by oxidative stress, neuroinflammation, and the activation of surrounding glial cells following restoration of blood supply. Astrocytes are regarded as the most prominent glial cell in the brain and, under pathologic conditions, display, among other pathologies, activated (GFAP) relatively proportional to the degree of reactivity. The primary objective of the study was to determine the temporal profile of astrocyte reactivity following ischemic stroke. Thirty-four Sprague-Dawley rats were assigned to surgery consisting of either 90-min middle cerebral artery occlusion (MCAo) or sham surgery. Animals were sub-grouped by postoperative euthanization day; 2 days (n = 10), 4 days (n = 11), and 7 days (n = 13). Fluorescence microscopy and densitometry were utilized to quantify GFAP immunoreactivity, which indicated a non-linear relationship following ischemia/reperfusion. Results demonstrated substantially higher GFAP levels in MCAo groups than in sham, with peak GFAP reactivity being shown in the brains of rats euthanized on day 4. These findings are applicable to future research, especially in the investigation of interventions that target reactive astrocytes following ischemic injury.

1. Introduction

Stroke is defined as a neurological deficit resulting from an acute focal injury to the central nervous system (CNS) by a vascular cause [1]. Approximately 85% of all strokes are ischemic in nature and occur when cerebral tissue fails to receive an adequate supply of oxygen [2,3]. According to the 2021 report from the American Heart Association, stroke was the leading cause of long-term disability and the second leading cause of death worldwide [4]. The 2016 Global Burden of Disease data indicate that one-in-four people will have a stroke in their lifetime, with the expectation that stroke prevalence will continue to increase in the absence of preventative measures [5,6]. Despite the prevalence of ischemic stroke in causing death and disability, therapeutic interventions are relatively limited [6,7]. Currently, the only clinically approved method for treatment is the restoration of cerebral blood flow via intravenous administration of recombinant tissue-type plasminogen activator (rtPA) [8,9]. Unfortunately, rtPA has a narrow therapeutic time-window for administration and is associated with secondary cell death during the reperfusion period [10]. Thus, the development of a novel treatment is still necessary.
Ischemia/reperfusion (I/R) injury is relatively common in stroke and occurs when the blood supply is reestablished after an ischemic event. Although reperfusion is necessary and often unavoidable, the subsequent restoration of blood flow triggers a pathologic cascade of molecular events involving oxidative stress, neuroinflammation, blood-brain barrier (BBB) disruption, excitotoxicity, and apoptosis [11]. During early phases of I/R, the extent of cerebral damage is largely dependent on the extent of inflammation [12]. The cycle of oxidative stress and neuroinflammation further increases the activation of deleterious signaling pathways implicated in the production of numerous pro-inflammatory cytokines that contribute to neuronal damage [13,14]. Following ischemic stroke, an irreversibly damaged core of tissue is surrounded by a salvageable penumbra, which is particularly vulnerable to neuronal death [10]. In the hours and days following ischemia, the core territory expands in a process commonly referred to as the ischemic cascade [15]. Focal ischemia induces a strong inflammatory response that begins within a few hours of inception and involves the activation of surrounding glial cells, such as microglia and astrocytes [11]. At the time of peak inflammation, astrocytes typically undergo an “activation” process, wherein they begin to influence various physiological and behavioral responses [16].
Astrocytes are the most prominent type of glial cell in the human brain and serve a critical role in several CNS functions, such as regulation of cerebral blood flow, formation of the BBB, neuronal metabolism, and defense against oxidative stress [9]. Given that astrocytes are essential for numerous functions of the CNS and considering that their dysfunction is associated with many neurological diseases, astrocytes may be a promising target for stroke therapy. In the ischemic brain, among other pathologies, activated astrocytes undergo a process called astrogliosis, a defensive mechanism by which various molecular, functional, and morphologic changes occur [17]. Astrogliosis is a unique cytological state that presents as protective glial scarring and results from a confluence of factors including, but not limited to, gene expression, cytokine effects, and neuronal communication [18]. This ensuing glial scar causes astrocytes to proliferate, become hypertrophied, and upregulate expression of the intermediate filament glial fibrillary acidic protein (GFAP) [3], which is expressed proportionally to the degree of reactivity [17]. Hence, to understand the complex interplay between neuroprotection and deleterious inflammation, astrocytes must be understood as a central mediator within the post-stroke state.
The role of astrocytes in ischemic stroke is extremely complex and controversial. Accordingly, as peak astrocyte reactivity coincides with the peak inflammatory response [19], understanding the time course of reactivity following ischemic stroke may provide an opportunity to target glial cells at times of peak inflammation. During ischemic conditions, the consequences of astrocytes’ activity can be either harmful or beneficial to surrounding neurons, depending at least in part on the time point post-stroke [20]. This biphasic nature of post-ischemic astrocyte activity has been recently described as either protective or destructive based on two distinct phenotypes, which are denoted as A1 (harmful) or A2 (protective) [21]. In the acute phase of stroke, reactive astrocytes display neuroprotective effects; however, in the post-acute and chronic phases, they may be detrimental to cerebral tissue [3]. For example, microglia have been demonstrated to encourage the proliferation of the A1 astrocyte phenotype following stroke, which, through immunological mechanisms (such as the upregulation of complement cascade genes), ultimately lead to neurotoxic effects and neuronal cell death [21].
Since reactive astrocytes appear to be harmful at later stages following ischemic stroke, their migration toward the affected brain region in the acute stages could prove to be a time-sensitive opportunity for various therapeutic interventions that target astrocytes. The lack of stroke treatment and prevention options illustrates the necessity to investigate novel interventions. Although previous studies have investigated the time course of reactive astrocytes following stroke, to our knowledge, this is the first study to examine the relationship between GFAP immunoreactivity at multiple timepoints after I/R using a 90-min middle cerebral artery occlusion (MCAo) stroke model. Therefore, the aim of the present study was to determine the temporal profile of astrocyte activation following a 90-min ischemic stroke in rats. These findings may offer a useful background for designing future studies to elucidate the optimal timepoint for therapeutic intervention of reactive astrocytes, allowing for further discourse regarding the potential therapies and cellular modalities surrounding this ubiquitous pathology.

2. Materials and Methods

2.1. Animals

Thirty-four male and female Sprague Dawley rats (250–300 g; Charles River, MA, USA) were used in the current study. Animals were housed in a 12-h light cycle with food and water ad libitum. Rats were randomly assigned to a stroke group (n = 22) or control group (n = 12). Animals in the stroke group underwent a 90-min MCAo surgery, whereas animals from the control group received a sham surgery in which the external carotid artery was cauterized. Following surgery, both stroke and control animals were grouped based on when euthanasia was performed following ischemic stroke, which was used to determine the temporal profile of astrocyte activation.
Sub-groups included day 2 (n = 10), day 4 (n = 11), and day 7 (n = 13) post-surgery. Thus, there were 6 groups in total, as summarized in Table 1. Inclusion criteria for MCAo animals were determined after confirmation of a successful ischemic stroke following hematoxylin and eosin (H&E) analysis. One animal failed to meet the criteria for an infarct volume of >20%, and three other animals died during the surgery and were therefore excluded. All procedures in this study were approved by the Institutional Animal Care and Use Committee (IACUC) at Central Michigan University under the IACUC protocol #2021-735.

2.2. Surgical Procedures

A 90-min ischemic stroke was induced using the MCAo intraluminal suture model following previously described methods [22]. In brief, animals were anesthetized using an intraperitoneal injection of ketamine (100 mg/mL: 80 mg/kg; Henry Schein Animal Health, Dublin, OH, USA) and xylazine (20 mg/mL; 10 mg/kg; Henry Schein Animal Health, Dublin, OH, USA). Laser Doppler (Moor Instruments, Wilmington, DE, USA) was used to continuously measure blood flow to the right MCA territory. Rats were initially placed into a stereotaxic frame, and the laser Doppler wire was anchored to the cranium approximately 1.0 mm posterior and 5.0 mm lateral to bregma. The rat was removed from the stereotaxic frame once a baseline reading was obtained and placed supine onto a heating pad for surgery.
For the MCAo surgical procedure, a small incision was made in the neck to expose the right common carotid artery. Next, the external carotid artery was cauterized and cut, leaving a stump of the vessel. For the control (sham) group, the incision was subsequently sutured, and the animals were placed into recovery. For the stroke animals, microvascular clips were positioned on the common carotid and internal carotid arteries, and a small incision was made in the remaining stump of the external carotid artery to insert a 4–0 nylon suture (filament tip diameter: 0.39 mm; filament length: 2–3 mm). The clip from the internal carotid artery was removed and the suture was slowly advanced through the vessel intracranially until a reduction of blood flow (>40%) to the right MCA region was confirmed by the laser Doppler, indicating that the filament was blocking the origin of the MCA. After removing the clip from the common carotid artery, laser Doppler blood flow was checked again to verify the occlusion of the MCA. Following 90 min of ischemia, the filament was removed, and the external carotid artery was cauterized. Next, the incision in the neck was sutured close, and the animals were placed into recovery. Following surgery, lidocaine was applied to the head and neck of the animal to reduce discomfort, and the rats were subsequently monitored during the next five days.

2.3. Tissue Processing

Animals were euthanized at either 2 days (n = 10), 4 days (n = 11), or 7 days (n = 13) following surgery by an overdose (120 mg/kg) of sodium pentobarbital (Fatal Plus, Vortech Pharmaceuticals, Dearborn, MI, USA). Rats were transcardially perfused with 0.1 M phosphate-buffered saline (PBS, pH 7.4) and then 4% paraformaldehyde (PFA; diluted in 0.1 M PBS, pH 7.4). Extracted brains were immersed in 4% PFA for 48 h and then dehydrated successively in 10%, 20%, and 30% sucrose solutions for 72 h at 4 °C. Brains were then flash-frozen using 2-methylbutane on dry ice (Sigma Aldrich; St. Louis, MO) and stored at –80 °C until sectioning. Coronal brain sections at 30 µm were obtained using a cryostat (Cryocut 1800, Leica, Vibratome, St. Louis, MO, USA).

2.4. Infarct Volume Calculation

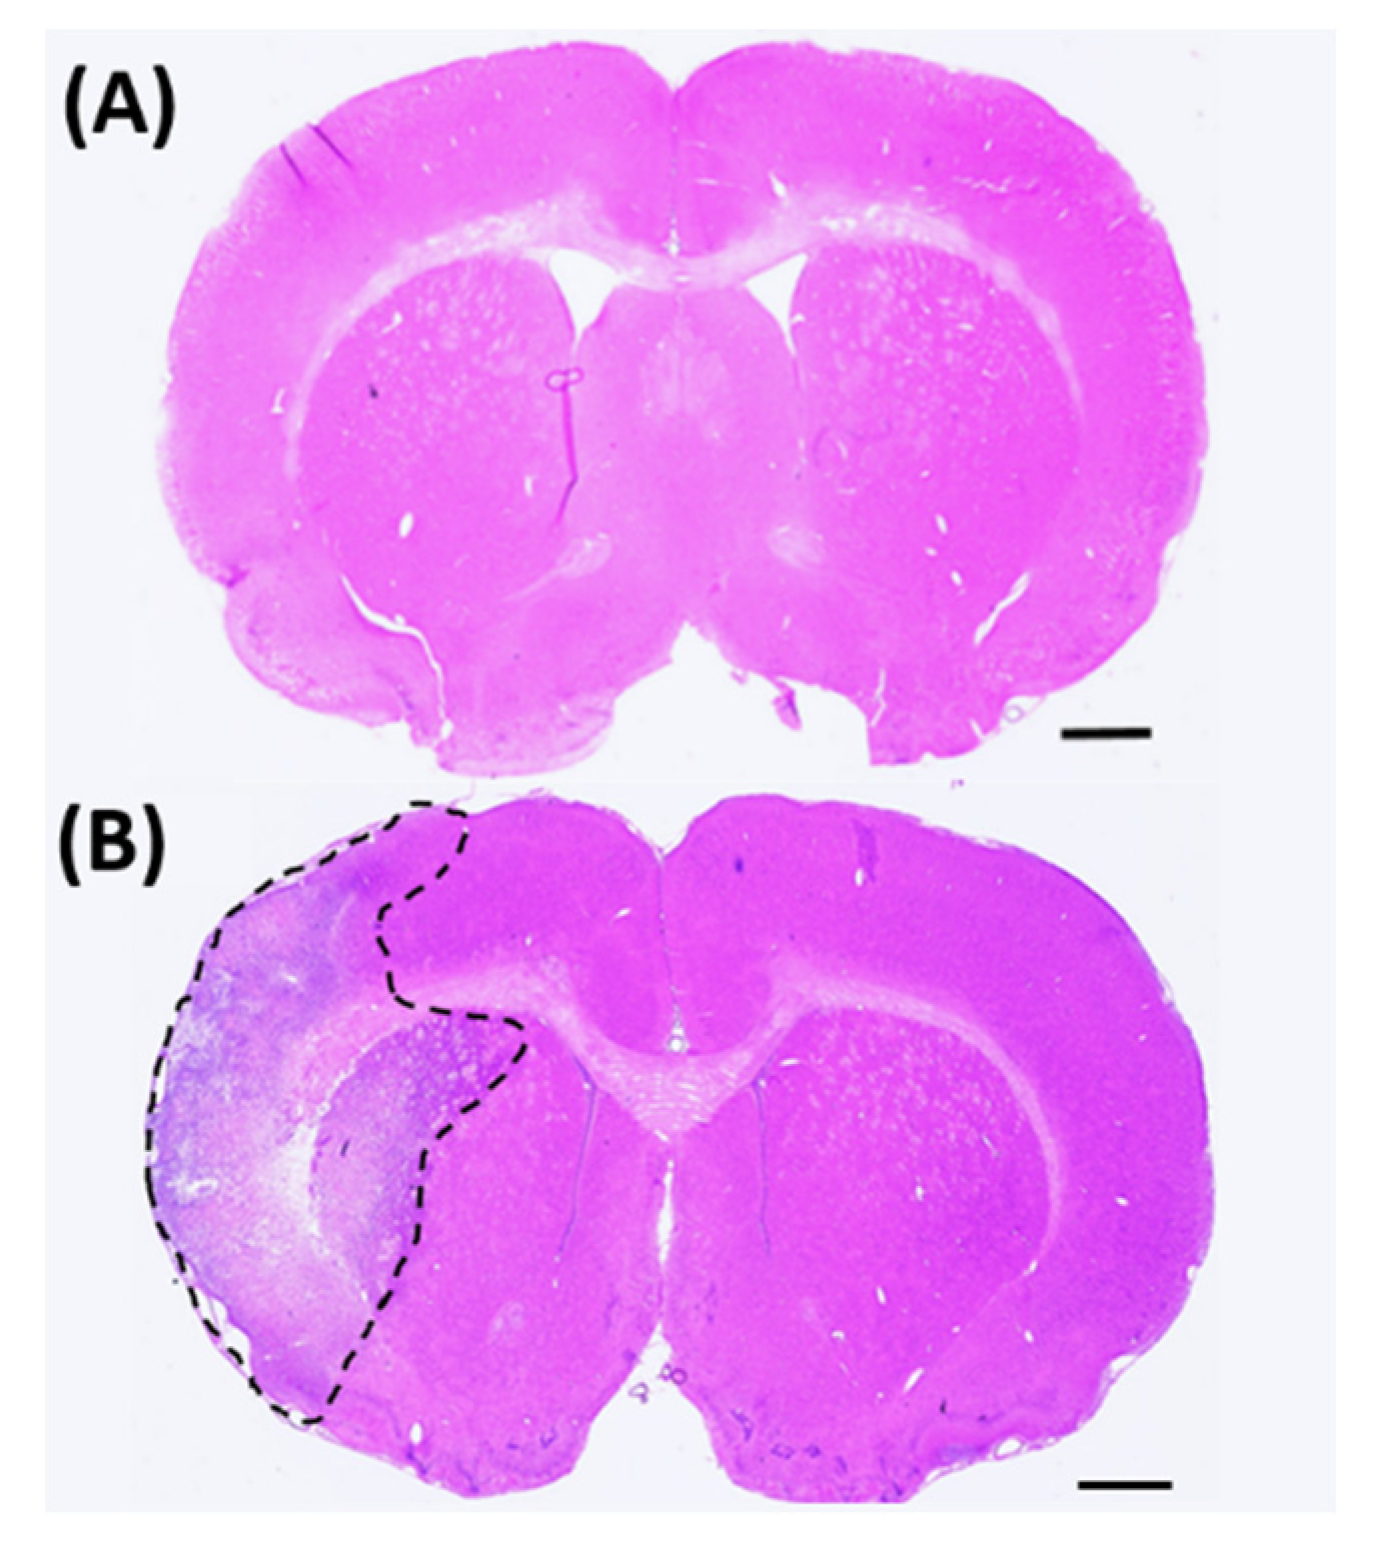
To assess tissue damage, 16 coronal brain sections for each animal were stained with H&E (Figure 1) and scanned using a Nikon Coolscan IV scanner (Nikon, Melville, NY, USA). The infarct volume of each section was determined using ImageJ software (NIH, Rockville, MD, USA) and calculated using Swanson’s indirect method [23]. Brain infarct volume was calculated as:
I n f a r c t   V o l u m e   ( % ) = [ A C A N I A C ] × 100
where AC = contralateral hemisphere; ANI = non-infarcted ipsilateral hemisphere.

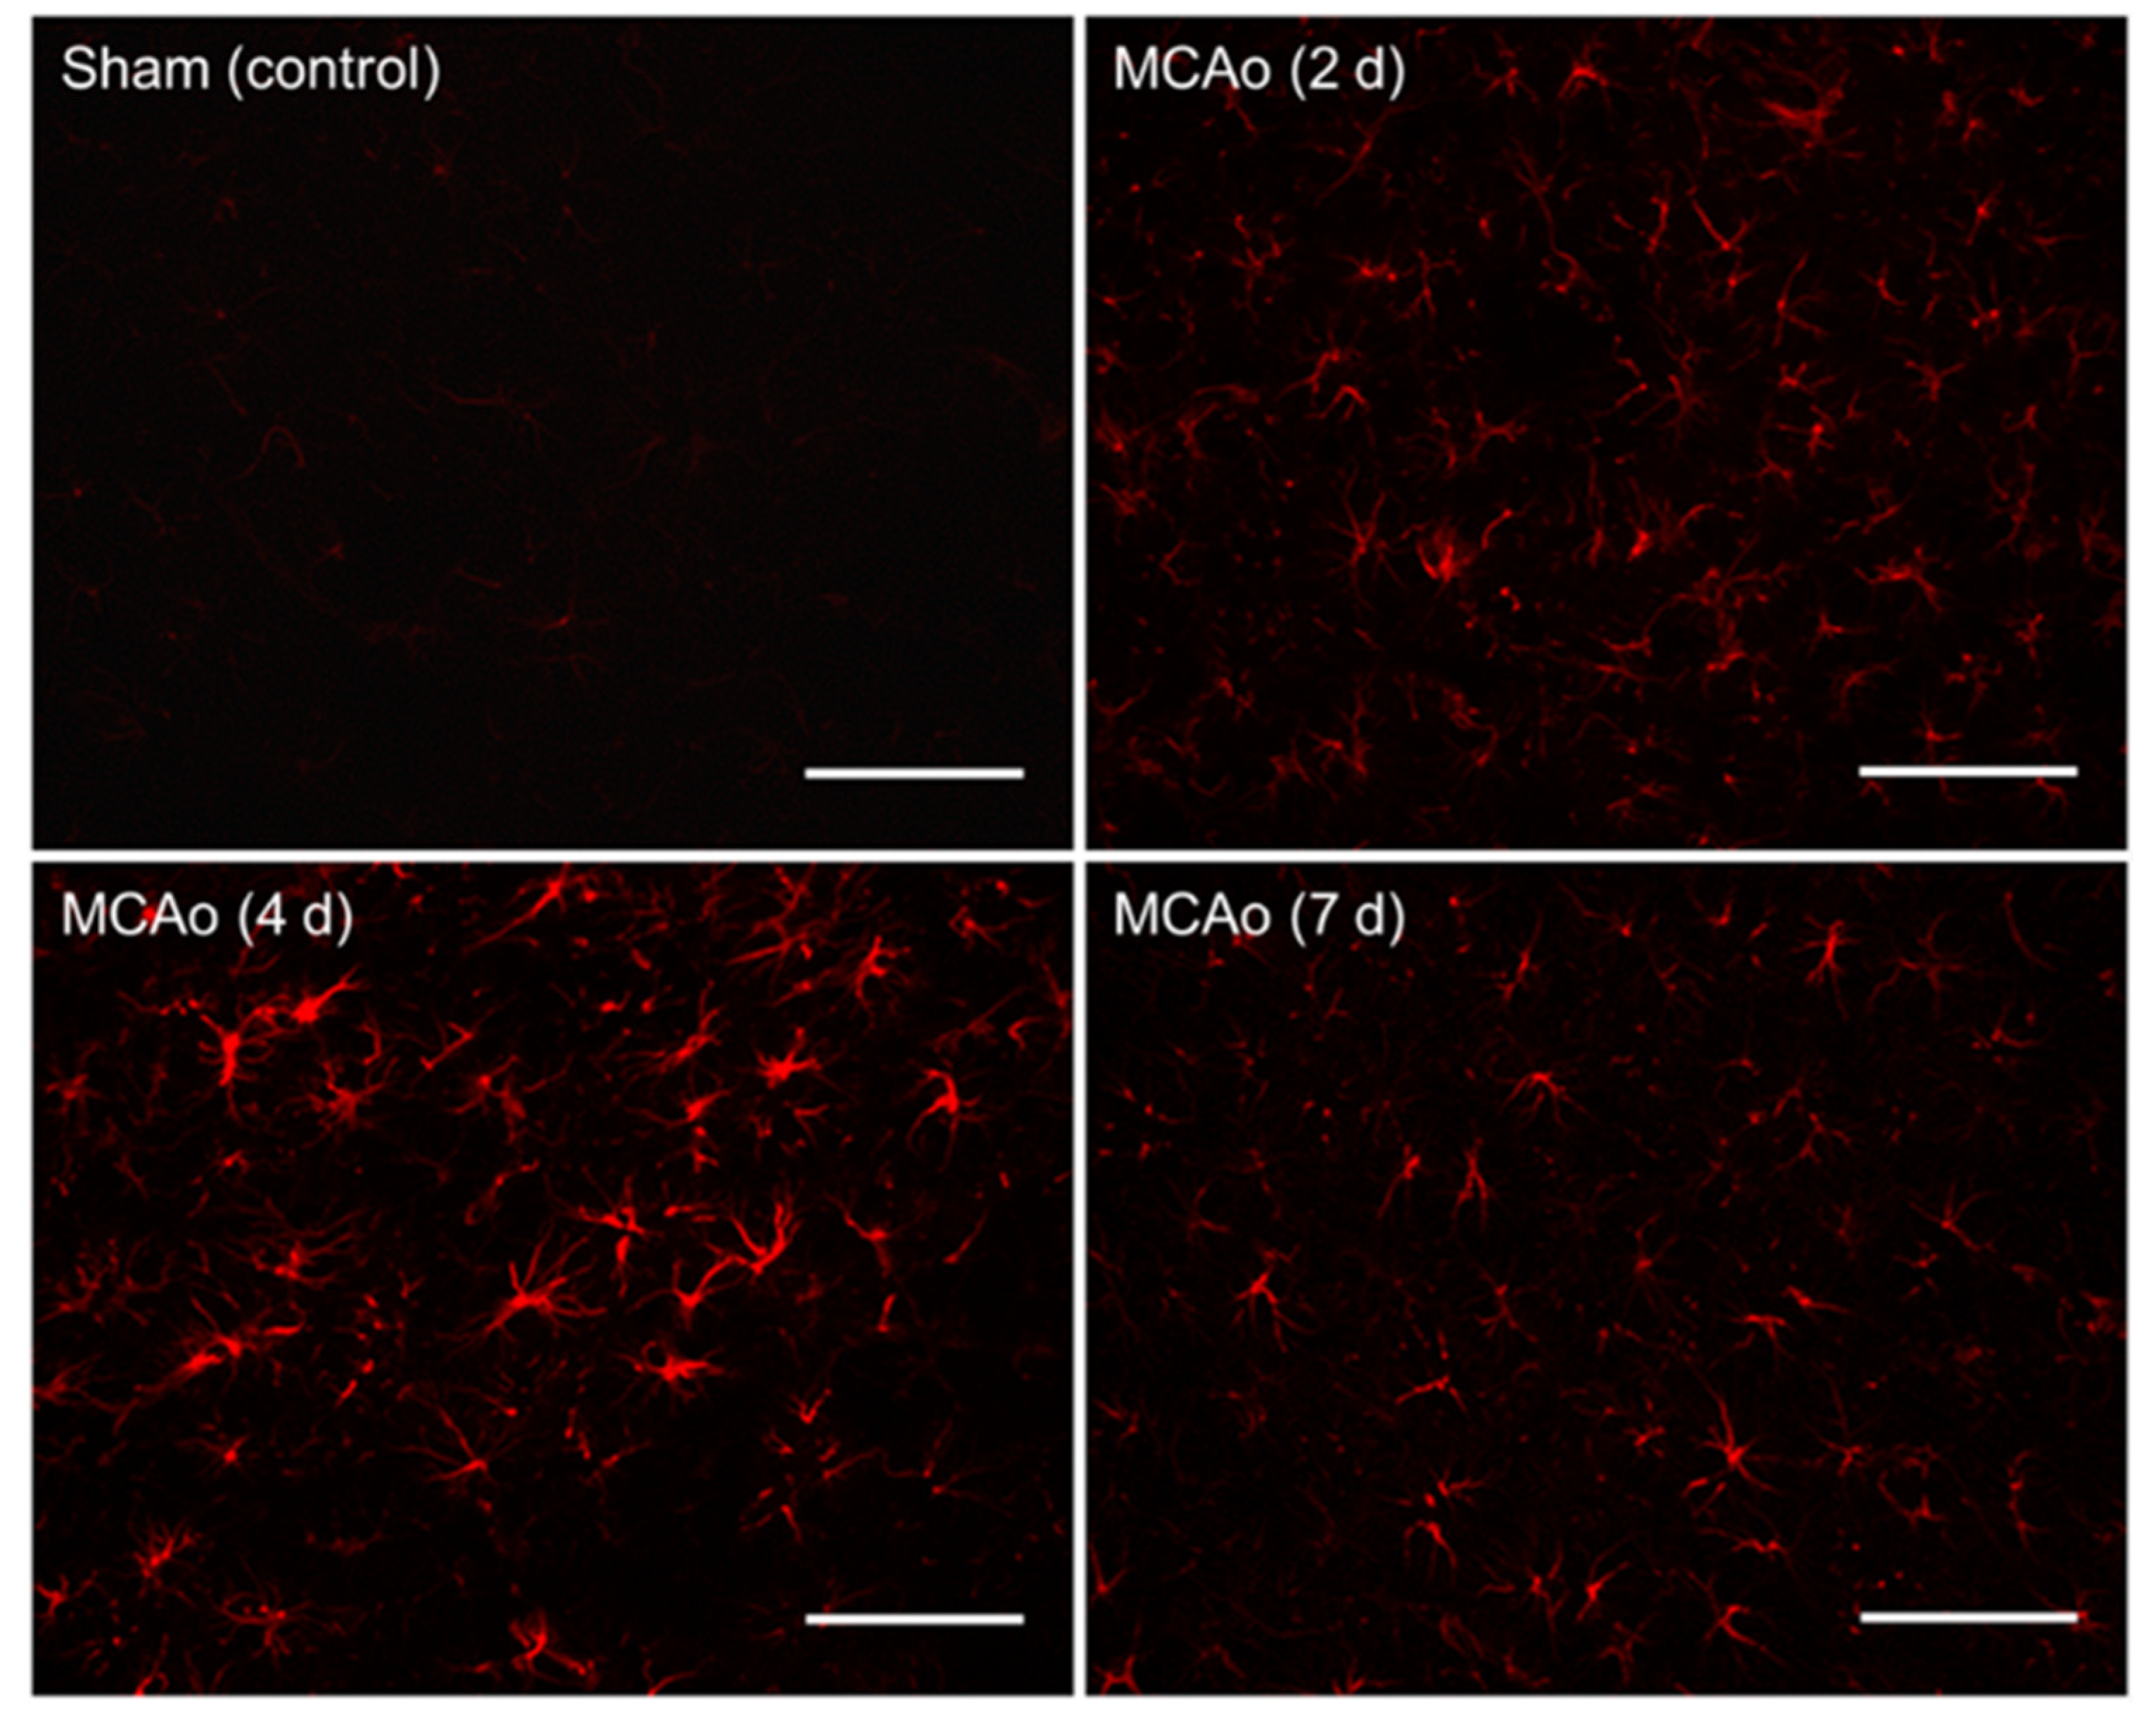
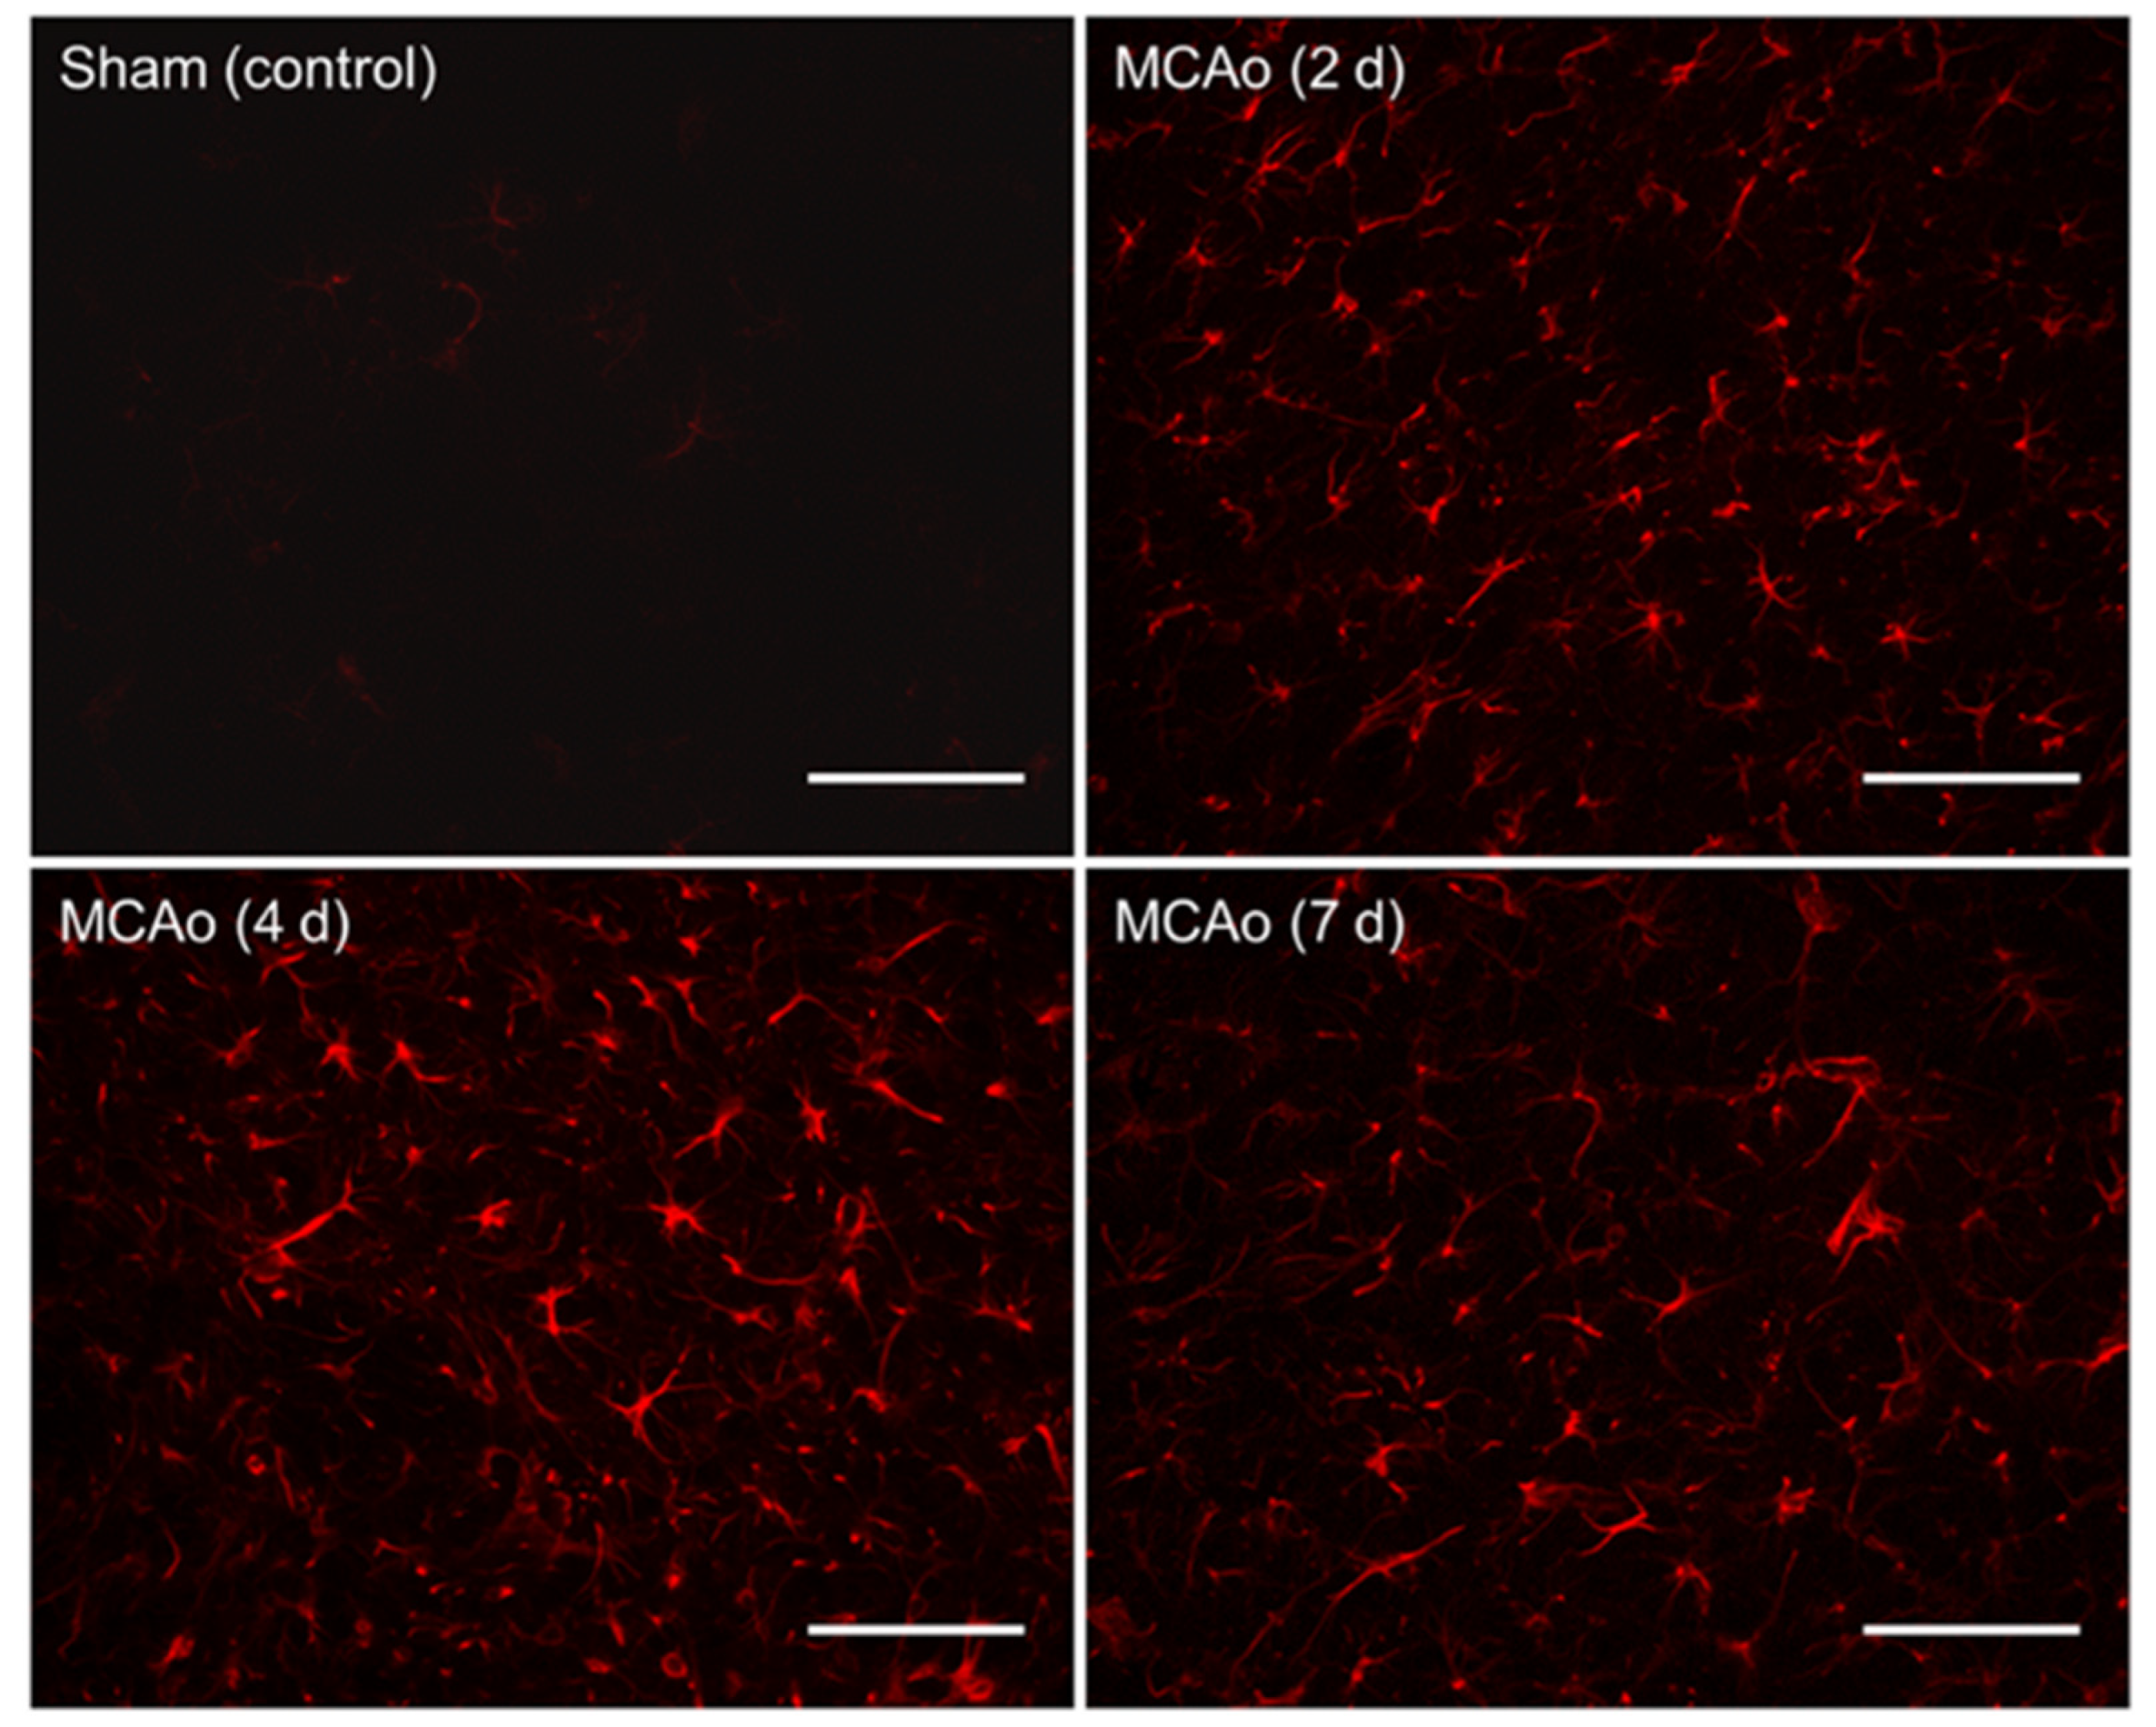
2.5. Immunohistochemistry

To identify reactive astrocytes, free-floating brain sections were blocked with 10% normal goat serum (diluted in 0.3% PBS-T) for 1 h, followed by a 20-h incubation period with a GFAP primary antibody (rabbit anti-GFAP, 1:3000, Abcam, Cambridge, UK; diluted in 0.3% PBS-T). Sections were then incubated for 1 h with a secondary antibody (goat anti-rabbit, Alexa Fluor 594, 1:300 diluted in 0.3% PBS-T). Sections were washed three times between incubations with 0.1 M PBS for 15 min. All reactions took place at room temperature. Slices were mounted to SuperfrostTM Plus microscope slides and cover-slipped with premium cover glass (Fisher Scientific, Hampton, NH, USA) using fluoromount aqueous mounting medium (Sigma-Aldrich, St. Louis, MO, USA).

2.6. Tissue Imaging and GFAP Quantification

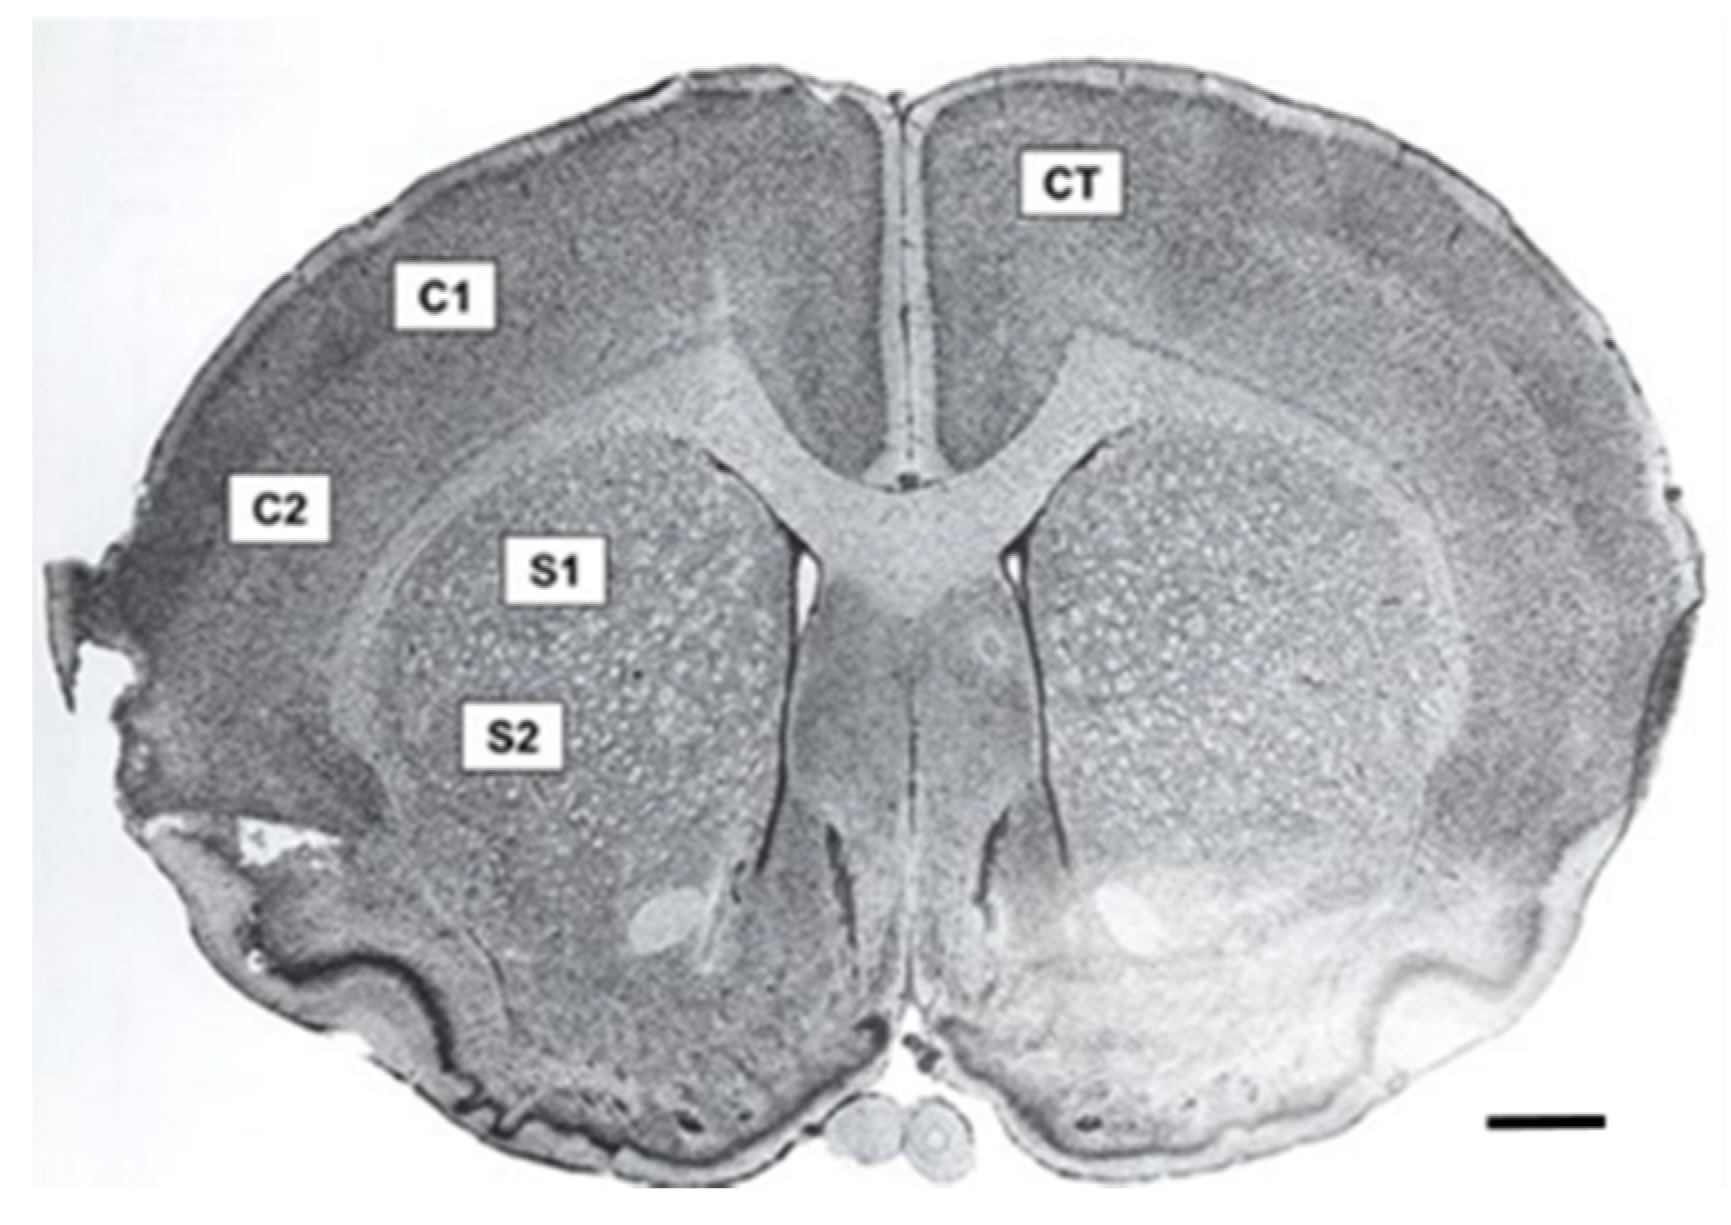
Fluorescence microscopy was performed using a Zeiss Axio Imager M2 (Gottingen, Germany). Z-stack photomicrographs (25 µm at 2.5 µm intervals, 40× objective) were obtained at an exposure time of 100 m/s and 100% light intensity. Photomicrographs were later compressed into a 2-D image. Five equally spaced tissue sections (intervals of 0.24 mm) were analyzed from each brain. To ensure consistency between animals, the section located at +0.2 mm bregma was considered the middle slice for each subject. Two successive slices located directly anterior, and two directly posterior, at intervals of 0.24 mm, were then obtained. Five images were taken for each tissue section in specific regions of interest. These included two images in the penumbral region of the cortex in the ipsilateral (affected) hemisphere, two images in the penumbra of the striatum in the ipsilateral (affected) hemisphere, and one image in the cortex of the contralateral (unaffected) hemisphere, which served as a control (Figure 2). Thus, a total of 25 images were obtained and analyzed for each animal. Similar regions were analyzed in the sham surgery brain.
Quantification of reactive astrocytes was performed using densitometry. Z-stack photomicrographs were compressed into a 2-D image, which then underwent background correction and despeckle function. GFAP reactivity was analyzed with ImageJ software and quantified using a previously described automated thresholding algorithm [24]. For densitometry analysis, ImageJ was used to compute the optical density of GFAP in each area. Relative density was calculated using the following equation as described by Fifield and Vanderluit [7]:
R e l a t i v e   D e n s i t y = [ A r e a   o f   i n t e r e s t   d e n s i t y b a c k g r o u n d   d e n s i t y B a c k g r o u n d   d e n s i t y ]

2.7. Statistical Analysis

Statistical analyses were conducted via IBM SPSS Statistics for Windows, version 28 (IBM Corp., Armonk, NY, USA), which consisted of one-way and two-way ANOVAs with interactions of interest being further analyzed by Pearson’s correlation testing. If Levene’s test for equality of variances showed heterogeneity, Welch’s ANOVA was used. Post-hoc analyses were conducted using either Tukey honestly significant difference (HSD) in cases of homogeneity of variance or Games–Howell test when heterogeneity was shown. p < 0.05 was considered significant for all univariate analyses, with a Bonferroni-adjusted p-value of 0.025 being used as warranted in multivariate analyses.

3. Results

3.1. Population Demographics

Group demographics are reported in Table 1. Independent samples t-tests were conducted to assess differences in weight, infarct volume, and GFAP intensities between males and females. As no significant differences in any of these variables were shown, further analyses were conducted with males and females combined. Prior to all statistical analyses, boxplot analyses were performed, which revealed no outliers for any variables. For each group, mean infarct volume and GFAP staining results are shown in Table 2. GFAP was reported as three separate values, including levels in the cortex, the striatum, and the overall combined values of both.

3.2. Infarct Volume (H&E) for MCAo Groups

A one-way ANOVA was utilized to determine whether infarct volume differed between the groups (Table 3). There were no outliers according to the boxplot analysis, data were determined to be normally distributed for each group by Shapiro–Wilk (p > 0.05), and Levene’s test for equality of variances showed heterogeneity (p = 0.045). Because heterogeneity of variances was evident, Welch’s ANOVA was used, and post hoc analysis was interpreted using the Games–Howell test. Infarct volume was shown to be statistically significantly different between time-of-euthanasia groups (Welch’s F (2, 9.616) = 5.410, p = 0.027, partial η2 = 0.378). Post-hoc testing demonstrated that, while not statistically significant, infarct volume was marginally larger in rats of Group 2 than those of Group 1 (mean difference 0.017, 95% CI from −0.083 to 0.117, p = 0.861); however, the infarct volume was significantly larger in Group 2 compared to Group 3 (mean difference 0.080, 95% CI from 0.014 to 0.147, p = 0.020). The infarct volume between Group 3 and Group 1 was the largest (mean difference 0.097, 95% CI from −0.008 to 0.203) but not significant (p = 0.071).

3.3. Comparison of Overall GFAP between MCAo and Sham Groups

Through bivariate analyses, a statistically significant effect on GFAP levels based on surgery allocation and euthanasia day was observed (F (2, 28) = 4.497, p = 0.020, partial η2 = 0.243). Therefore, an analysis of simple main effects for euthanasia day was performed, with p < 0.025 being considered statistically significant following Bonferroni correction. A statistically significant difference was shown in GFAP between MCAo and sham surgery groups for each euthanasia interval (Day 2, F (1, 28) = 27.812, p < 0.001, partial η2 = 0.498; Day 4, F (1, 28) = 71.900, p < 0.001, partial η2 = 0.720; and Day 7, F (1, 28) = 21.679, p < 0.001, partial η2 = 0.436). For each euthanasia day post-surgery, the MCAo group showed significantly greater levels of GFAP compared to the sham group (Table 4; Figure 3).

3.4. Comparison of Overall GFAP between MCAo Groups

A one-way ANOVA was used to illuminate differences between the combined levels of GFAP from the cortex and striatum for the MCAo groups (Table 5). GFAP was significantly different between euthanasia days (F (2, 19) = 9.091, p = 0.002, partial η2 = 0.489). Post hoc analysis demonstrated that GFAP was greater for rats in Group 2 compared to Group 1 (mean difference 5.96, 95% CI from 0.983 to 10.24) and lower for those in Group 3 than those in Group 2 (mean difference −7.32, 95% CI from −11.83 to −2.81). Overall, GFAP was also lower for those in Group 3 compared to Group 1 (mean difference −1.35, 95% CI from −6.07 to 3.36). Post-hoc analysis by Tukey HSD test demonstrated that the difference in infarct volume between Group 2 and Group 1 was statistically significant (p = 0.018), as well as that of Group 2 and Group 3 (p = 0.002); however, no significant difference between Group 3 and Group 1 was found (Figure 3).
A one-way ANOVA was used to evaluate the differences in cortical levels of GFAP between the MCAo groups (Figure 4). Results of the Tukey HSD post hoc analyses are shown in Table 6. According to the ANOVA, cortical GFAP was not significantly different between euthanasia days (F (2, 19) = 1.754, p = 0.200, partial η2 = 0.156).

3.5. Comparison of GFAP in Striatum between MCAo Groups

A one-way ANOVA was used to elucidate differences in GFAP in the striatum between the MCAo groups (Figure 5). Results of the post hoc testing are shown in Table 7. Striatal levels of GFAP were found to be significantly different between euthanasia days (F (2, 19) = 21.294, p < 0.001, partial η2 = 0.691). Post hoc analysis demonstrated that GFAP was greater in rats in Group 2 compared to those of Group 1 (mean difference 8.98, 95% CI from 4.10 to 13.85) and lower for those in Group 3 than those in Group 2 (mean difference −10.95, 95% CI from −15.36 to −6.53). GFAP was also marginally lower for those in Group 3 compared to Group 1 (mean difference −1.97, 95% CI from −6.59 to 2.65) but not statistically significant. Post-hoc analysis using the Tukey HSD test demonstrated a significant difference in infarct volume between Group 2 and Group 1 (p < 0.001), as well as between Group 3 and Group 2 (p < 0.001); however, the difference between Group 3 and Group 1 was not significant.

3.6. Correlation between Infarct Volume (H&E) and GFAP

To estimate the strength of association between infarct volume and overall levels of GFAP, Pearson’s correlation tests were conducted for Groups 1, 2, and 3. As shown in Figure 6, a strong positive correlation was found between infarct volume and overall levels of GFAP for Group 1 (r = 0.911, p = 0.012), Group 2 (r = 0.759, p = 0.048), and Group 3 (r = 0.678, p = 0.045).

4. Discussion

Astrocytes are the most prominent glial cell in the CNS and represent a major mediator of acute neurological diseases [25]. Neuroinflammation and other conditions, such as ischemic stroke, present with astrocyte activation, which typically correlates with the peak inflammatory response [19]. Astrocytes usually become reactive in the initial 2–7 days post-stroke and subsequently lead to the formation of a glial scar roughly 2 weeks following the original insult [26]. During this period, astrocytes proliferate and show increased expression of the structural protein GFAP [18,20]. In the acute phase of neuroinflammation, astrocytes remain neuroprotective, but in the post-acute and chronic phases, astrocytes can both positively or negatively affect neuronal regrowth and plasticity [3]. Despite their secretion of various neurotrophic factors and their maintenance of proper ionic regulation and homeostasis, activated astrocytes eventually initiate inflammatory responses that lead to adverse effects, such as neuronal cell death [27,28]. As astrocyte activation continues, positive feedback of increased inflammation leads to a further rise in neuroinflammation, either through astrocyte action on other immune cells or the inherent inflammatory potential of astrocytes [17]. Collectively, these result in the variety of conditions seen in the neuroinflammatory state, where factors promoting survival compete with the detrimental products of astrocyte activation, cell death, and the introduction of immunological cells.
To aid in their supportive role, astrocytes may be assisted pharmacologically to promote neuroprotection and mitigate potentially damaging cascades. The literature has established that induced MCAo ischemic cores typically affect the striatal region of the brain first, followed by the destruction of adjacent structures such as the cortex [29,30]. The impact of the 90-min MCAo utilized in the present study supports this notion, as significant differences in GFAP immunoreactivity in the striatal region were seen between euthanization groups, whereas in the cortical region, there were not. Therefore, the timing of such events must be known, wherein by determining the temporal profile of peak astrocyte activation, one can better understand this cascade and focus on interventions to achieve optimal recovery. Although previous research has investigated the temporal profile of reactive astrocytes, to our knowledge, this is the first study to explore the relationship of GFAP immunoreactivity at various timepoints following ischemic stroke utilizing a 90-min MCAo model. Using the photothrombotic stroke method, Nowicka and colleagues (2008) found that extensive astrogliosis transpired as early as 4 h after insult and that GFAP expression was most pronounced at days 4 and 7 [30]. Another study using the MCAo model found that GFAP-positive astrocytes accumulated in the penumbra 3–6 h after insult and reached a peak level at 1 h–3 days after reperfusion [31]. These results contrast with our findings, which demonstrated that peak levels of GFAP occurred at 4 days after the MCAo surgery. However, it should be noted that our study used a 90-min ischemic stroke model, whereas the previous study used a 60-min MCAo. Nevertheless, we found that GFAP immunoreactivity was significantly higher at 4 days post-stroke compared to the other timepoints used, which included 2 days and 7 days after ischemia and subsequent reperfusion.
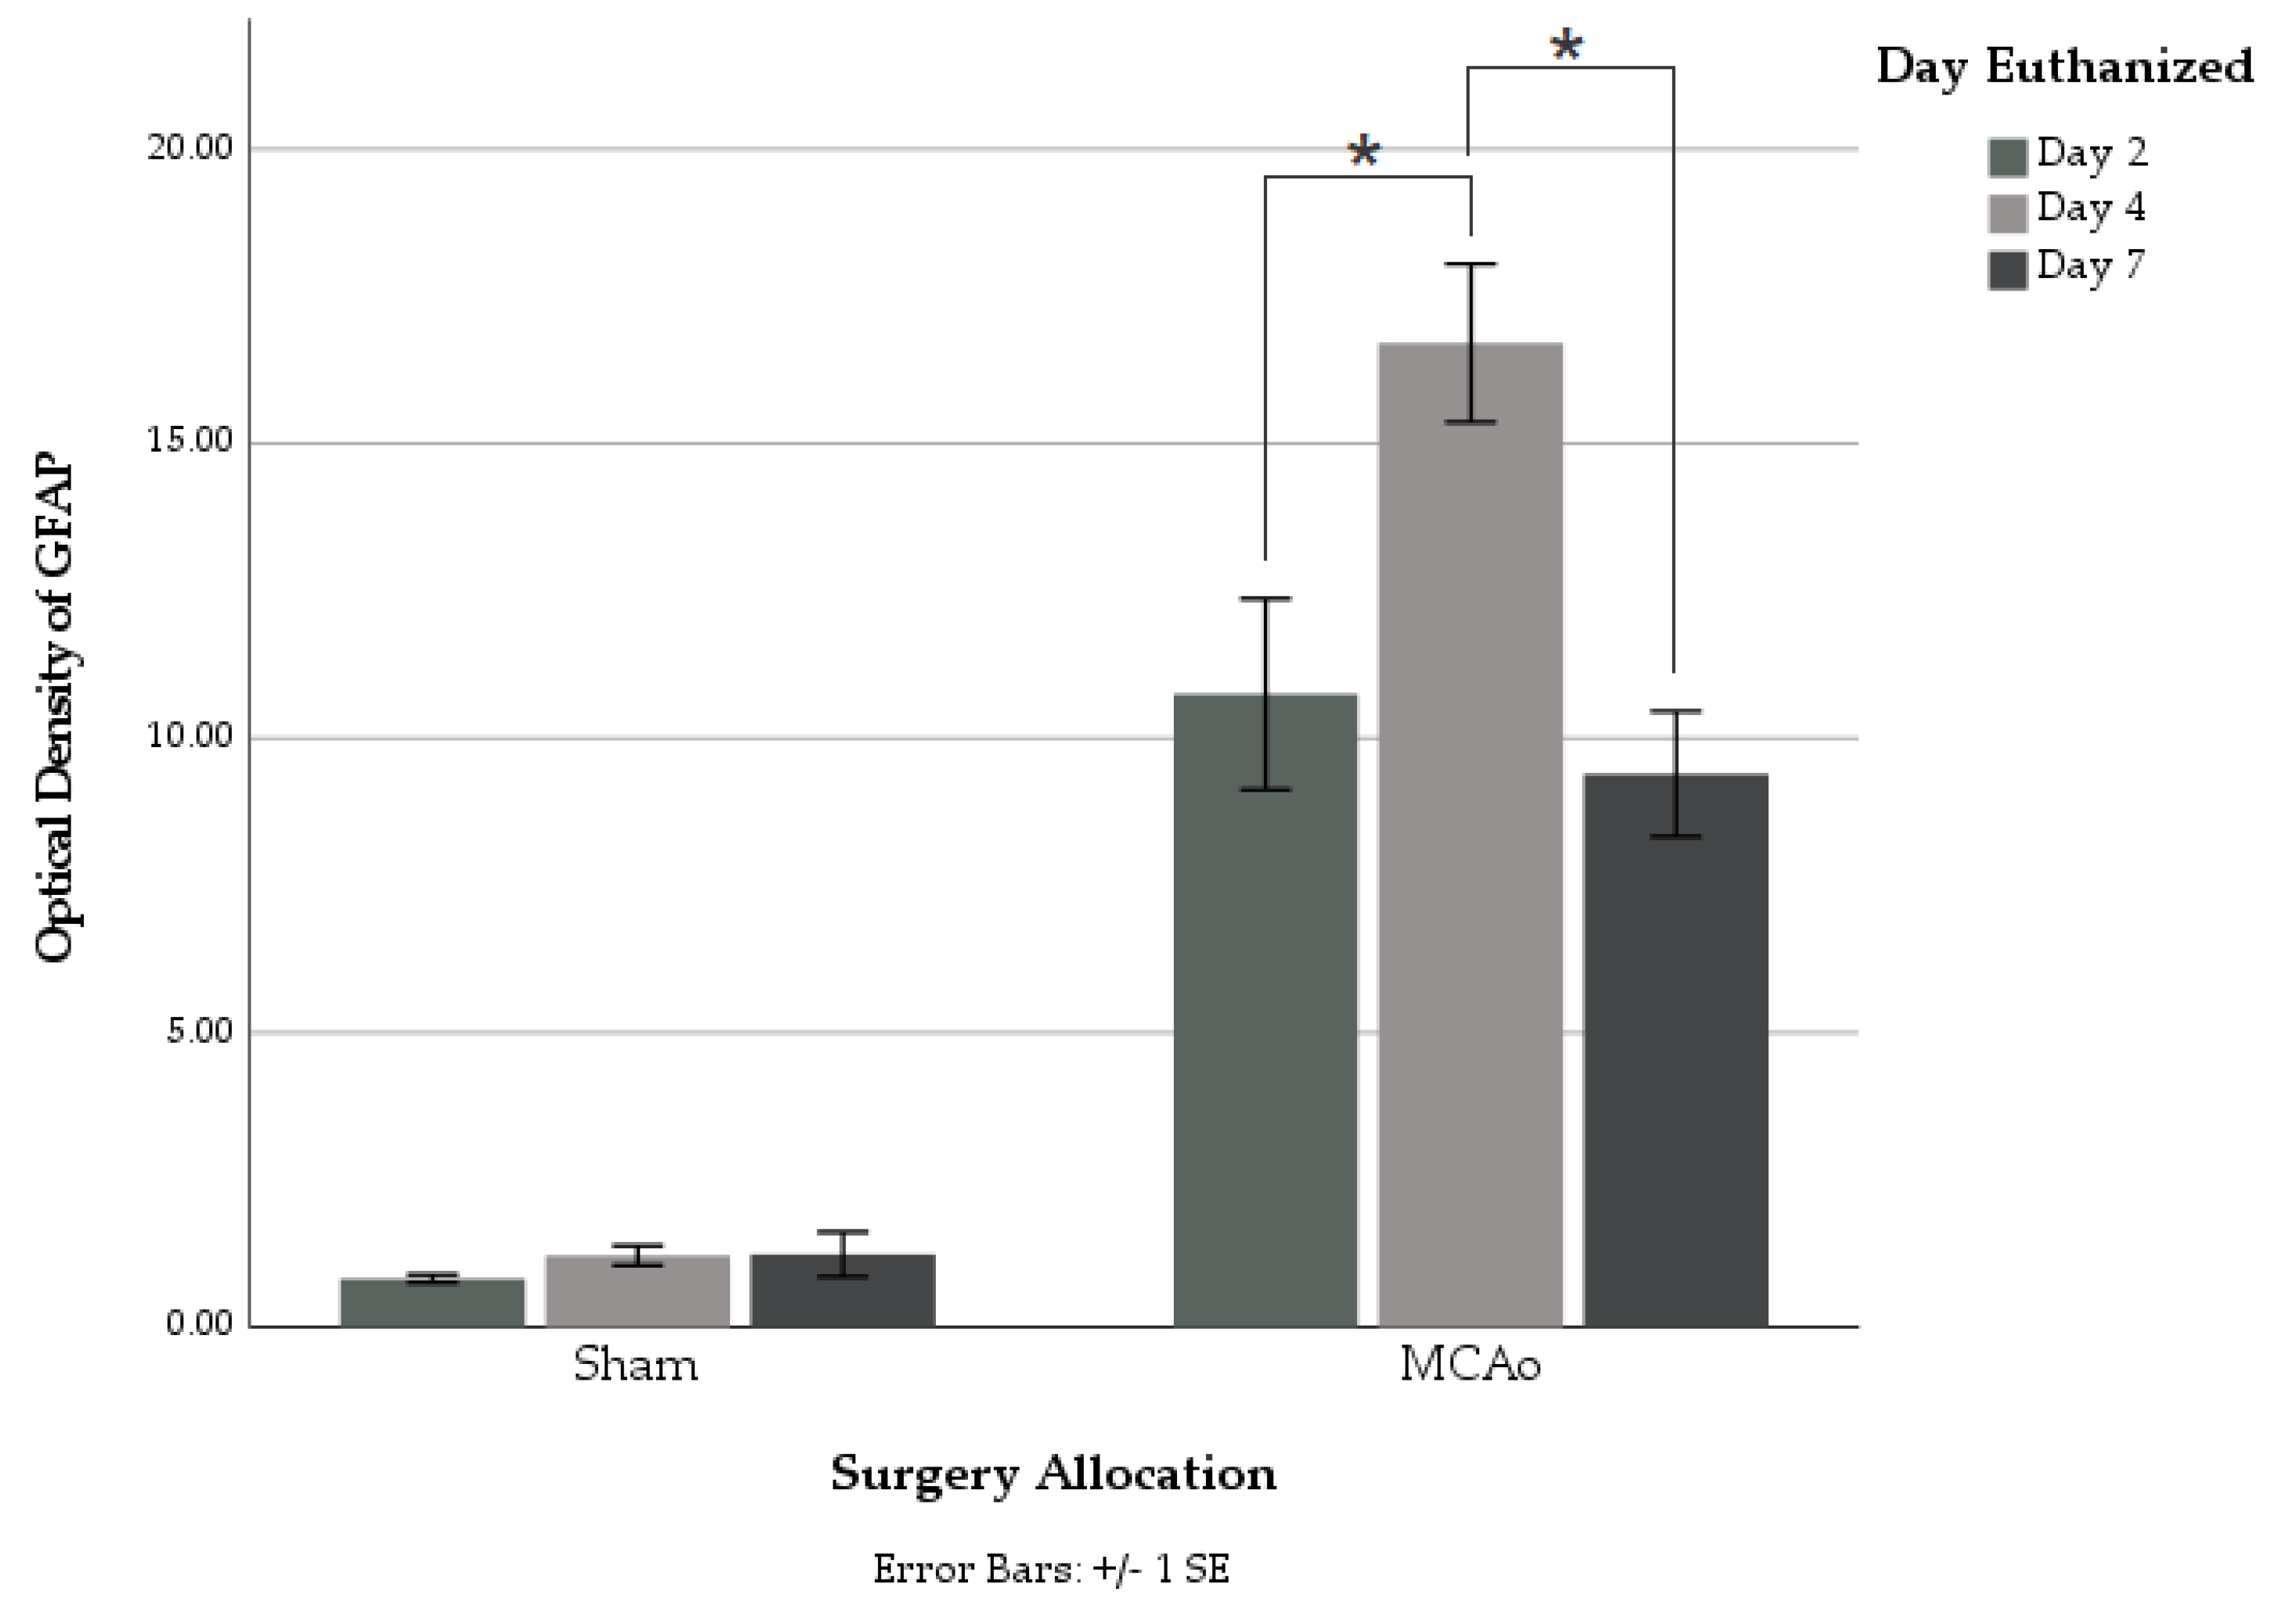
Utilizing GFAP immunohistochemical staining, we showed a non-linear relationship between GFAP reactivity and the euthanasia timepoint, which was found to peak at 4 days following surgery. Sham animals displayed no significant difference in GFAP staining between different euthanasia day groups. Within the MCAo groups, significantly greater amounts of overall GFAP immunoreactivity were found in those euthanized on day 4 as compared to those on both days 2 and 7 post-stroke (
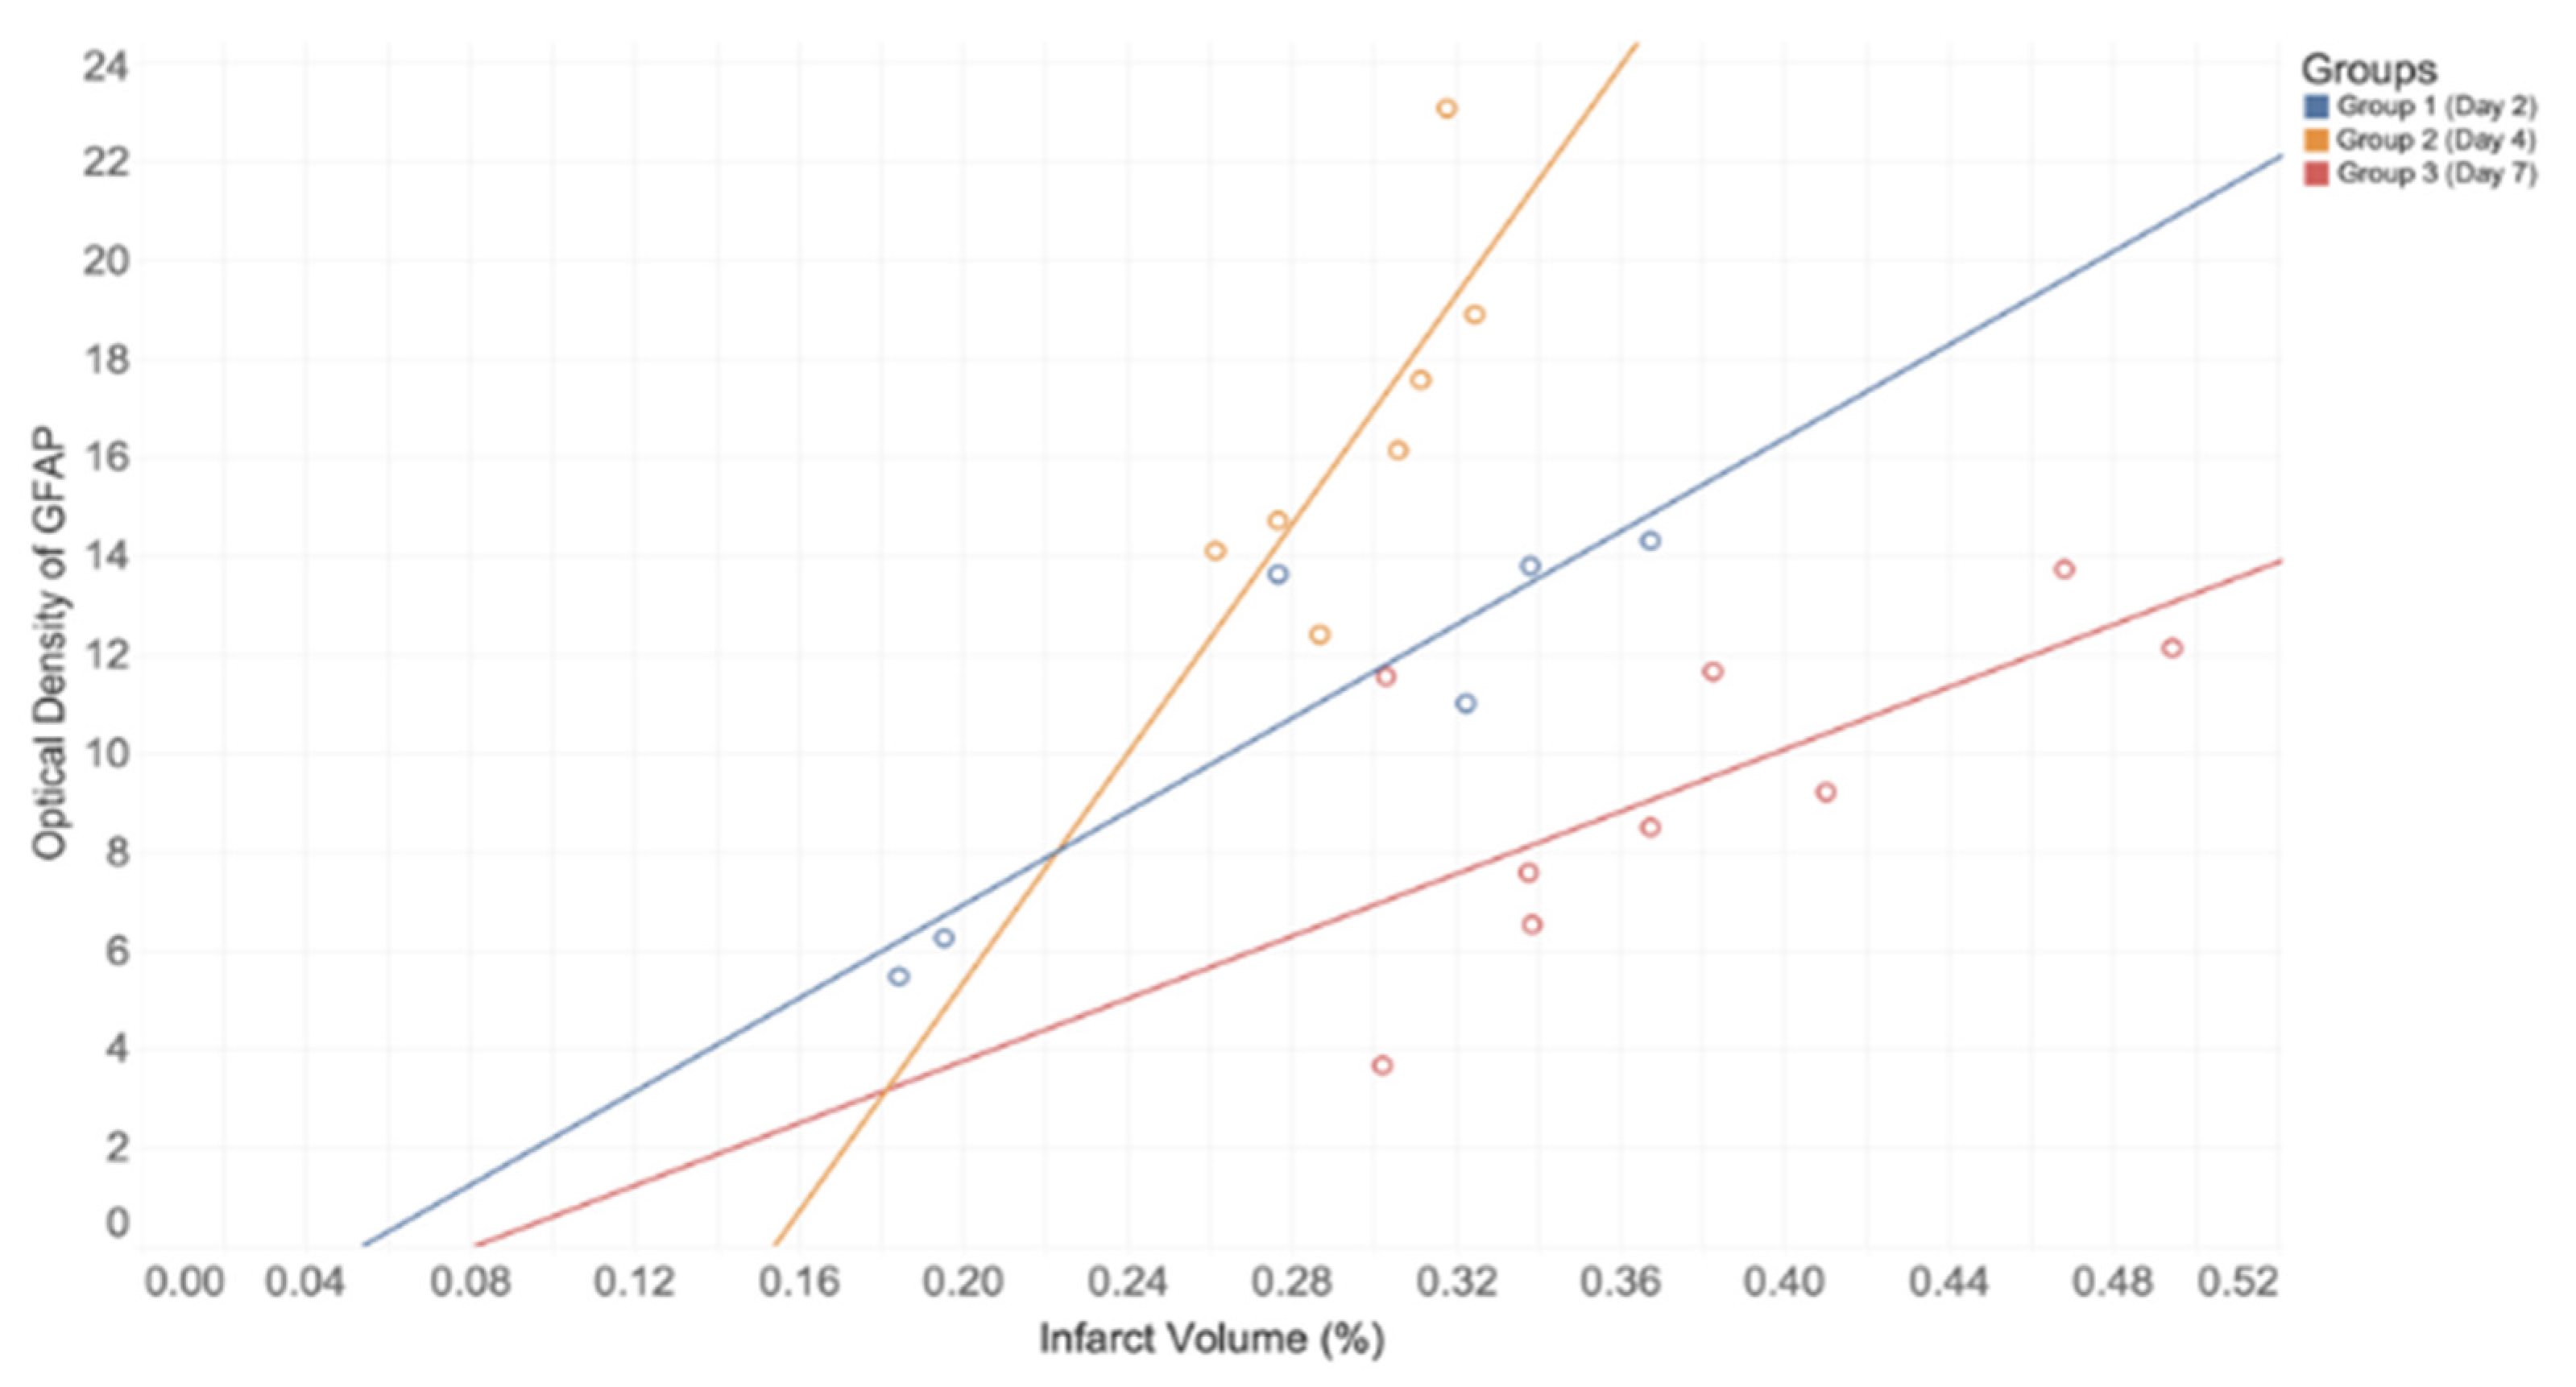
Figure 3). This suggests a timeline of events within astrocyte activation following ischemic injury. In addition, a strong positive correlation was found between infarct volume and GFAP immunoreactivity on each postoperative day of euthanization. This directly supports conclusions made from a recent review, which describes this correlation to be seen in both animal and human studies [32]. Moreover, infarct volume was greater for those groups euthanized at later time points, with the greatest difference being shown between Group 2 and Group 3 (Table 3). We postulate that this increased tissue loss can be attributed to normal chronological effects of post-stroke complications in the absence of any therapeutic intervention. These findings have numerous implications, as they not only demonstrate the potential peak in astrocyte immunoreactivity but they also suggest that this peak has relevance for the pathology and treatment of acute neuroinflammatory conditions.
This insight is directly related to the penetrance of pharmacological substances within the post-stroke brain. Through the relationship between astrocyte activation and systemic factors, such as the potential increase in permeability of the BBB and its connection to rising inflammation, one could mitigate the damage caused within inflamed tissue while potentially maximizing supportive effects [33]. Within the BBB, the production of astrocytic prostaglandin E2 and pro-inflammatory cytokines leads to increased permeability, a condition known as “leakiness” [34]. The increased potential for a variety of therapeutics to enter the brain under “leaky” conditions has shown utility for treating acute neurological insults and psychiatric conditions [35,36]. This leakiness offers a window of enhanced drug delivery, where conventional molecules, such as adenosine, coupled with modern therapeutics, such as nano-platforms, are being investigated as interventions for treating such conditions [37]. By increasing BBB permeability, pharmaceutical interventions that would not be delivered under normal homeostatic conditions can now be offered as relevant therapeutics. Further relationships, such as that between peak GFAP presence and peak permeability, can serve to highlight this potential. Therefore, by determining the temporality of neuroinflammation through monitoring GFAP, we believe that further research can aim to refine the window for effective novel therapeutics in the treatment of acute neurologic conditions.

5. Conclusions

In this study, we demonstrated the temporal profile of GFAP immunoreactivity following a 90-min MCAo ischemic stroke in rats, which indicated a non-linear relationship between immunoreactivity and the timepoint following I/R. Our results revealed that GFAP levels were significantly higher in animals sacrificed on day 4 compared to those euthanized on day 2 and day 7. Furthermore, GFAP reactivity was found to be similar between animals sacrificed on day 2 and day 7. The findings from the present study suggest that reactive astrocyte activity may be peak 4 days post-stroke; investigations of potential therapeutic interventions during this time window are warranted.

Author Contributions

Conceptualization, J.S., H.S., G.L.D. and J.R.; methodology, J.S., H.S., D.D. and L.G.; validation, M.R.S., R.B.P., B.S., G.L.D. and J.R.; formal analysis, J.S., H.S., D.D. and L.G.; investigation, J.S., H.S., D.D. and L.G.; resources, G.L.D. and J.R.; data curation, J.S., D.D., H.S. and L.G.; writing—original draft preparation, J.S., D.D., and L.G.; writing—review and editing, H.S., M.R.S., B.S., R.B.P., G.L.D. and J.R.; visualization, J.S., D.D., L.G. and B.S.; supervision, G.L.D. and J.R.; project administration, G.L.D., B.S. and J.R.; funding acquisition, G.L.D. and J.R. All authors have read and agreed to the published version of the manuscript.

Funding

This research study was supported by the American Heart Association (grant #18AIREA 33990094), the E. Malcom Field and Gary Leo Dunbar Endowed Chair in Neuroscience, the program in Neuroscience, the College of Medicine, and the John G. Kulhavi Professorship in Neuroscience at Central Michigan University.

Institutional Review Board Statement

The animal study protocol was approved by the Institutional Animal Care and Use Committee (IACUC) of Central Michigan University (protocol #2021-735 on 5/20/21).

Informed Consent Statement

Not applicable.

Data Availability Statement

The data collected for this study are available upon request from the corresponding author.

Conflicts of Interest

The authors declare that the research was conducted in the absence of any commercial or financial relationships that could be construed as a potential conflict of interest.

Abbreviations

BBB, Blood–Brain Barrier; CNS, Central Nervous System; GFAP, Glial Fibrillary Acidic Protein; H&E, Hematoxylin and Eosin; IACUC, Institutional Animal Care and Use Committee; I/R, Ischemia/Reperfusion; MCAo, Middle Cerebral Artery Occlusion; PBS, Phosphate-Buffered Saline; PFA, Paraformaldehyde; rtPA, Recombinant Tissue Plasminogen Activator.

References

  1. Sacco, R.L.; Kasner, S.E.; Broderick, J.P.; Caplan, L.R.; Connors, J.J.B.; Culebras, A.; Elkind, M.S.V.; George, M.G.; Hamdan, A.D.; Higashida, R.T.; et al. An Updated Definition of Stroke for the 21st Century: A Statement for Healthcare Professionals from the American Heart Association/American Stroke Association. Stroke 2013, 44, 2064–2089. [Google Scholar] [CrossRef] [PubMed]
  2. Allan, S.; Hreday, N. Essential Neuroscience, 4th ed.; Lippincott Williams and Wilkins: Philadelphia, PA, USA, 2018; ISBN 978-1-4963-8240-5. [Google Scholar]
  3. Pekny, M.; Wilhelmsson, U.; Tatlisumak, T.; Pekna, M. Astrocyte Activation and Reactive Gliosis-A New Target in Stroke? Neurosci. Lett. 2019, 689, 45–55. [Google Scholar] [CrossRef] [PubMed]
  4. Virani, S.S.; Alonso, A.; Aparicio, H.J.; Benjamin, E.J.; Bittencourt, M.S.; Callaway, C.W.; Carson, A.P.; Chamberlain, A.M.; Cheng, S.; Delling, F.N.; et al. Heart Disease and Stroke Statistics-2021 Update: A Report From the American Heart Association. Circulation 2021, 143, e254–e743. [Google Scholar] [CrossRef]
  5. Campbell, B.C.V.; Khatri, P. Stroke. The Lancet 2020, 396, 129–142. [Google Scholar] [CrossRef]
  6. GBD 2016 Stroke Collaborators Global, Regional, and National Burden of Stroke, 1990-2016: A Systematic Analysis for the Global Burden of Disease Study 2016. Lancet Neurol. 2019, 18, 439–458. [CrossRef]
  7. Fifield, K.E.; Vanderluit, J.L. Rapid Degeneration of Neurons in the Penumbra Region Following a Small, Focal Ischemic Stroke. Eur. J. Neurosci. 2020, 52, 3196–3214. [Google Scholar] [CrossRef]
  8. Altinay, S.; Cabalar, M.; Isler, C.; Yildirim, F.; Celik, D.S.; Zengi, O.; Tas, A.; Gulcubuk, A. Is Chronic Curcumin Supplementation Neuroprotective Against Ischemia for Antioxidant Activity, Neurological Deficit, or Neuronal Apoptosis in an Experimental Stroke Model? Turk. Neurosurg. 2017, 27, 537–545. [Google Scholar] [CrossRef] [PubMed]
  9. Liu, Z.; Chopp, M. Astrocytes, Therapeutic Targets for Neuroprotection and Neurorestoration in Ischemic Stroke. Prog. Neurobiol. 2016, 144, 103–120. [Google Scholar] [CrossRef]
  10. González-Nieto, D.; Fernández-Serra, R.; Pérez-Rigueiro, J.; Panetsos, F.; Martinez-Murillo, R.; Guinea, G.V. Biomaterials to Neuroprotect the Stroke Brain: A Large Opportunity for Narrow Time Windows. Cells 2020, 9, 1074. [Google Scholar] [CrossRef]
  11. Moskowitz, M.A.; Lo, E.H.; Iadecola, C. The Science of Stroke: Mechanisms in Search of Treatments. Neuron 2010, 67, 181–198. [Google Scholar] [CrossRef] [Green Version]
  12. Bavarsad, K.; Riahi, M.M.; Saadat, S.; Barreto, G.; Atkin, S.L.; Sahebkar, A. Protective Effects of Curcumin against Ischemia-Reperfusion Injury in the Liver. Pharmacol. Res. 2019, 141, 53–62. [Google Scholar] [CrossRef] [PubMed]
  13. Aggarwal, B.B.; Harikumar, K.B. Potential Therapeutic Effects of Curcumin, the Anti-Inflammatory Agent, against Neurodegenerative, Cardiovascular, Pulmonary, Metabolic, Autoimmune and Neoplastic Diseases. Int. J. Biochem. Cell Biol. 2009, 41, 40–59. [Google Scholar] [CrossRef] [PubMed]
  14. Del Prado-Audelo, M.L.; Caballero-Florán, I.H.; Meza-Toledo, J.A.; Mendoza-Muñoz, N.; González-Torres, M.; Florán, B.; Cortés, H.; Leyva-Gómez, G. Formulations of Curcumin Nanoparticles for Brain Diseases. Biomolecules 2019, 9, 56. [Google Scholar] [CrossRef] [PubMed]
  15. Schaller, B.; Graf, R. Cerebral Ischemia and Reperfusion: The Pathophysiologic Concept as a Basis for Clinical Therapy. J. Cereb. Blood Flow Metab. Off. J. Int. Soc. Cereb. Blood Flow Metab. 2004, 24, 351–371. [Google Scholar] [CrossRef] [PubMed]
  16. Becerra-Calixto, A.; Cardona-Gómez, G.P. The Role of Astrocytes in Neuroprotection after Brain Stroke: Potential in Cell Therapy. Front. Mol. Neurosci. 2017, 10, 88. [Google Scholar] [CrossRef]
  17. Sofroniew, M.V. Astrogliosis. Cold Spring Harb. Perspect. Biol. 2014, 7, a020420. [Google Scholar] [CrossRef]
  18. Magaki, S.D.; Williams, C.K.; Vinters, H.V. Glial Function (and Dysfunction) in the Normal & Ischemic Brain. Neuropharmacology 2018, 134, 218–225. [Google Scholar] [CrossRef]
  19. Cekanaviciute, E.; Buckwalter, M.S. Astrocytes: Integrative Regulators of Neuroinflammation in Stroke and Other Neurological Diseases. Neurother. J. Am. Soc. Exp. Neurother. 2016, 13, 685–701. [Google Scholar] [CrossRef]
  20. Pekny, M.; Nilsson, M. Astrocyte Activation and Reactive Gliosis. Glia 2005, 50, 427–434. [Google Scholar] [CrossRef]
  21. Liddelow, S.A.; Guttenplan, K.A.; Clarke, L.E.; Bennett, F.C.; Bohlen, C.J.; Schirmer, L.; Bennett, M.L.; Münch, A.E.; Chung, W.-S.; Peterson, T.C.; et al. Neurotoxic Reactive Astrocytes Are Induced by Activated Microglia. Nature 2017, 541, 481–487. [Google Scholar] [CrossRef] [Green Version]
  22. Longa, E.Z.; Weinstein, P.R.; Carlson, S.; Cummins, R. Reversible Middle Cerebral Artery Occlusion without Craniectomy in Rats. Stroke 1989, 20, 84–91. [Google Scholar] [CrossRef] [PubMed]
  23. Swanson, R.A.; Morton, M.T.; Tsao-Wu, G.; Savalos, R.A.; Davidson, C.; Sharp, F.R. A Semiautomated Method for Measuring Brain Infarct Volume. J. Cereb. Blood Flow Metab. 1990, 10, 290–293. [Google Scholar] [CrossRef] [PubMed]
  24. Healy, S.; McMahon, J.; Owens, P.; Dockery, P.; FitzGerald, U. Threshold-Based Segmentation of Fluorescent and Chromogenic Images of Microglia, Astrocytes and Oligodendrocytes in FIJI. J. Neurosci. Methods 2018, 295, 87–103. [Google Scholar] [CrossRef] [PubMed]
  25. Verkhratsky, A.; Zorec, R.; Parpura, V. Stratification of Astrocytes in Healthy and Diseased Brain. Brain Pathol. 2017, 27, 629–644. [Google Scholar] [CrossRef]
  26. Bao, Y.; Qin, L.; Kim, E.; Bhosle, S.; Guo, H.; Febbraio, M.; Haskew-Layton, R.E.; Ratan, R.; Cho, S. CD36 Is Involved in Astrocyte Activation and Astroglial Scar Formation. J. Cereb. Blood Flow Metab. 2012, 32, 1567–1577. [Google Scholar] [CrossRef]
  27. Daverey, A.; Agrawal, S.K. Curcumin Alleviates Oxidative Stress and Mitochondrial Dysfunction in Astrocytes. Neuroscience 2016, 333, 92–103. [Google Scholar] [CrossRef]
  28. Ben Haim, L.; Carrillo-de Sauvage, M.-A.; Ceyzériat, K.; Escartin, C. Elusive Roles for Reactive Astrocytes in Neurodegenerative Diseases. Front. Cell. Neurosci. 2015, 9, 278. [Google Scholar] [CrossRef]
  29. Lindner, M.D.; Gribkoff, V.K.; Donlan, N.A.; Jones, T.A. Long-Lasting Functional Disabilities in Middle-Aged Rats with Small Cerebral Infarcts. J. Neurosci. Off. J. Soc. Neurosci. 2003, 23, 10913–10922. [Google Scholar] [CrossRef]
  30. Nowicka, D.; Rogozinska, K.; Aleksy, M.; Witte, O.W.; Skangiel-Kramska, J. Spatiotemporal Dynamics of Astroglial and Microglial Responses after Photothrombotic Stroke in the Rat Brain. Acta Neurobiol. Exp. (Warsz.) 2008, 68, 155–168. [Google Scholar]
  31. Jing, L.; He, Q.; Zhang, J.-Z.; Li, P.A. Temporal Profile of Astrocytes and Changes of Oligodendrocyte-Based Myelin Following Middle Cerebral Artery Occlusion in Diabetic and Non-Diabetic Rats. Int. J. Biol. Sci. 2013, 9, 190–199. [Google Scholar] [CrossRef]
  32. Akhoundzadeh, K.; Shafia, S. Association between GFAP-Positive Astrocytes with Clinically Important Parameters Including Neurological Deficits and/or Infarct Volume in Stroke-Induced Animals. Brain Res. 2021, 1769, 147566. [Google Scholar] [CrossRef] [PubMed]
  33. Kim, S.Y.; Buckwalter, M.; Soreq, H.; Vezzani, A.; Kaufer, D. Blood-Brain Barrier Dysfunction-Induced Inflammatory Signaling in Brain Pathology and Epileptogenesis. Epilepsia 2012, 53 (Suppl. 6), 37–44. [Google Scholar] [CrossRef] [PubMed]
  34. Morris, G.; Fernandes, B.S.; Puri, B.K.; Walker, A.J.; Carvalho, A.F.; Berk, M. Leaky Brain in Neurological and Psychiatric Disorders: Drivers and Consequences. Aust. N. Z. J. Psychiatry 2018, 52, 924–948. [Google Scholar] [CrossRef]
  35. Comer, A.L.; Carrier, M.; Tremblay, M.-È.; Cruz-Martín, A. The Inflamed Brain in Schizophrenia: The Convergence of Genetic and Environmental Risk Factors That Lead to Uncontrolled Neuroinflammation. Front. Cell. Neurosci. 2020, 14, 274. [Google Scholar] [CrossRef] [PubMed]
  36. Dong, X.; Gao, J.; Su, Y.; Wang, Z. Nanomedicine for Ischemic Stroke. Int. J. Mol. Sci. 2020, 21, 7600. [Google Scholar] [CrossRef]
  37. Gaudin, A.; Yemisci, M.; Eroglu, H.; Lepetre-Mouelhi, S.; Turkoglu, O.F.; Dönmez-Demir, B.; Caban, S.; Sargon, M.F.; Garcia-Argote, S.; Pieters, G.; et al. Squalenoyl Adenosine Nanoparticles Provide Neuroprotection after Stroke and Spinal Cord Injury. Nat. Nanotechnol. 2014, 9, 1054–1062. [Google Scholar] [CrossRef]
Figure 1. Hematoxylin & eosin (H&E) stained coronal brain sections from (A) sham and (B) 90-min MCAo animals to assess infarct volume. Scale bar = 1 mm.
Neuroglia 03 00007 g001
Figure 2. Coronal brain section showing the regions used for GFAP analysis. Five images were taken for each tissue section: Two images of the ipsilateral (stroke) cortex, two images of the ipsilateral (stroke) striatum, and one image of the contralateral (non-stroke) cortex to serve as a control. Similar regions were imaged in the sham brain. Five separate tissue sections were imaged for each brain, for a total of 25 images. c, cortex; s, striatum; ct, control. Scale bar = 1 mm.
Neuroglia 03 00007 g002
Figure 3. Combined levels of cortical and striatal GFAP immunoreactivity for MCAo (stroke) and sham (control) groups. As illustrated, significantly greater GFAP densities were found in rats euthanized on day 4 compared to those on both days 2 and 7 in the MCAo group. * p-value < 0.025. p-value < 0.025 was considered significant after Bonferroni correction.
Neuroglia 03 00007 g003
Figure 4. GFAP immunoreactivity in coronal tissue sections of the cortex illustrating the differences in astrocyte reactivity by group. GFAP images from the sham (control) animals were similar irrespective of the day of euthanasia. Note the higher GFAP immunoreactivity seen within the cortex of the MCAo brains from rats euthanized on day 4 (bottom left) as compared to those on both day 2 (top right) and day 7 (bottom right). Images were taken at 40× magnification with a scale bar of 20 µm.
Neuroglia 03 00007 g004
Figure 5. GFAP immunoreactivity in coronal tissue sections of the striatum illustrating the differences in astrocyte reactivity by group. GFAP images from the sham (control) animals were similar irrespective of the day of euthanasia. Note the higher GFAP immunoreactivity seen within the striatum of the MCAo brains from rats euthanized on day 4 (bottom left) as compared to those on both day 2 (top right) and day 7 (bottom right). Images were taken at 40× magnification with a scale bar of 20 µm.
Neuroglia 03 00007 g005
Figure 6. Correlation between infarct volume and overall levels of GFAP for the MCAo groups. Color indicates day of euthanasia: blue (day 2, group 1), orange (day 4, group 2), and red (day 7, group 3). For each group, a strong positive correlation was demonstrated between infarct volume and GFAP optical density.
Neuroglia 03 00007 g006
Table 1. Group demographics.
N = 34AllocationDay EuthanizedWeight (g)MaleFemale
Group 1 (n = 6)MCAoDay 2269.0 ± 8.333
Group 2 (n = 7)MCAoDay 4280.0 ± 16.343
Group 3 (n = 9)MCAoDay 7273.9 ± 14.354
Group 4 (n = 4)ShamDay 2281.5 ± 10.622
Group 5 (n = 4)ShamDay 4283.3 ± 6.222
Group 6 (n = 4)ShamDay 7278.0 ± 15.022
MCAo, middle cerebral artery occlusion. Continuous data presented as mean ± SD.
Table 2. Mean infarct volume (H&E) and GFAP.
N = 34AllocationH&E (%)GFAP (c)GFAP (s)GFAP (o)
Group 1 (n = 6)MCAo28.1 ± 7.69.99 ± 4.8811.52 ± 3.1610.75 ± 3.97
Group 2 (n = 7)MCAo29.8 ± 2.312.93 ± 3.6620.49 ± 3.9716.71 ± 3.55
Group 3 (n = 9)MCAo37.8 ± 6.89.25 ± 3.679.55 ± 3.209.40 ± 3.19
Group 4 (n = 4)Sham---0.67 ± 0.220.98 ± 0.080.83 ± 0.14
Group 5 (n = 4)Sham---1.01 ± 0.291.43 ± 0.441.22 ± 0.33
Group 6 (n = 4)Sham---1.13 ± 0.751.35 ± 0.781.24 ± 0.76
MCAo, middle cerebral artery occlusion; c, cortex; s, striatum; o, cortex + striatum combined. Continuous data presented as mean ± SD.
Table 3. Mean differences of infarct volume (H&E).
N = 22Δ Mean95% CIp
Group 2–Group 10.017−0.083–0.1170.861
Group 3–Group 20.0800.014–0.1470.020 *
Group 3–Group 10.097−0.008–0.2030.071
* p-value < 0.05.
Table 4. Mean Differences of Overall GFAP by Euthanasia Day.
N = 34MCAo (n = 22)Sham (n = 12)Δ Mean (MCAo–Sham)95% CIp-Value
Day 210.75 ± 3.970.83 ± 0.149.926.07–13.78<0.001 *
Day 416.71 ± 3.551.22 ± 0.3315.4911.75–19.23<0.001 *
Day 79.40 ± 3.191.24 ± 0.768.164.57–11.74<0.001 *
p-value < 0.025. Data presented as mean ± SD. p-value < 0.025 was considered significant after Bonferroni adjustment.
Table 5. Mean differences of overall GFAP between MCAo groups.
N = 22Δ Mean95% CIp-Value
Group 2–Group 15.960.983–10.940.018 *
Group 3–Group 2−7.32−11.83–−2.810.002 **
Group 3–Group 1−1.35−6.07–3.360.749
* p-value < 0.05; ** p-value < 0.01. Data presented as mean ± SD.3.5. Comparison of GFAP in Cortex between MCAo Groups.
Table 6. Mean differences of GFAP in cortex between MCAo groups.
N = 22Δ Mean95% CIp-Value
Group 2–Group 12.94−2.74–8.630.404
Group 3–Group 2−3.68−8.83–1.460.191
Group 3–Group 1−0.74−6.12–4.640.935
Data presented as mean SD. Data presented as mean ± SD.
Table 7. Mean differences of GFAP in striatum between MCAo groups.
N = 22Δ Mean95% CIp-Value
Group 2–Group 18.984.10–13.85<0.001 *
Group 3–Group 2−10.95−15.36–−6.53<0.001 *
Group 3–Group 1−1.97−6.59–2.650.536
* p-value < 0.01. Data presented as mean ± SD.
Publisher’s Note: MDPI stays neutral with regard to jurisdictional claims in published maps and institutional affiliations.

