Article

Basic Study on Mechanical Vibration Suppression System Using 2-Degree-of-Freedom Vibration Analysis

1
Department of Mechanical Engineering, Hokkaido University of Science, Sapporo 006-8585, Japan
2
Yamabiko Corporation, Tokyo 198-0025, Japan
3
Course of Mechanical Engineering, Tokai University, Hiratsuka 259-1292, Japan
4
Course of Science and Technology, Tokai University, Hiratsuka 259-1292, Japan
5
Research Institute of Science and Technology, Tokai University, Hiratsuka 259-1292, Japan
6
Department of Electronic Robot Engineering, Aichi University of Technology, Gamagori 443-0047, Japan
7
Department of Electrical Engineering, Fukuoka Institute of Technology, Fukuoka 811-0295, Japan
8
Department of Mechanical Engineering, Tokyo University of Technology, Tokyo 192-0982, Japan
9
OMRON Corporation, Kyoto 600-8530, Japan
10
Faculty of Mechanical and Automotive Engineering Technology, University Malaysia Pahang, Paken 26600, Malaysia
11
Department of Mechanical Systems Engineering, Tokai University, Hiratsuka 259-1292, Japan
*
Author to whom correspondence should be addressed.
Vibration 2023, 6(2), 407-420; https://doi.org/10.3390/vibration6020025
Submission received: 30 January 2023 / Revised: 3 April 2023 / Accepted: 28 April 2023 / Published: 1 May 2023

Abstract

:
Mechanical vibrations adversely affect mechanical components, and in the worst case, lead to serious accidents by breaking themselves. To suppress vibrations, various studies have been conducted on vibration isolation, suppression, and resistance. In addition, technologies to actively suppress vibration have been rapidly developed in recent years, and it has been reported that vibrations can be suppressed with higher performance. However, these studies have been conducted mostly for low-order systems, and few studies have employed control models that consider the complex vibration characteristics of multi-degree-of-freedom (DOF) systems. This study is a basic study that establishes a control model for complex control systems, and the vibration characteristics of a 2-DOF system are calculated using the vibration analysis of a multi-DOF system. Furthermore, the vibration suppression performance of the 2-DOF system is investigated by performing vibration experiments.

1. Introduction

Mechanical vibration adversely affects the mechanical components, and in the worst cases, it causes serious accidents by breaking itself. Various studies have been conducted. Vibration analysis by material properties used for vibration isolation has been performed [1,2,3,4,5,6]. Furthermore, various dynamic vibration absorbers, such as damper-based dynamic absorbers and active dynamic absorbers, have been studied [7,8,9]. These considerations improve not only safety but also durability and marketable quality. Therefore, vibration suppression is an important factor when designing products. The causes of vibration during machine operation are the vibration characteristics of the machine itself or the transfer of vibrations from other sources with resonance. The most effective solution is to block the vibration from the source to reduce vibration transfer to the object. However, if the vibration source cannot be blocked, resonance can be prevented by changing the vibration characteristics of the objective part of the machine. To use this method, it is necessary to determine the vibration characteristics of the entire machine.
In addition, in recent years, there have been rapid advances in the development of technologies that actively suppress vibrations, and it has been reported that vibrations can be suppressed with higher performance [10,11]. However, these studies have been conducted mostly for low-order systems, and few studies have been conducted using control models that consider the complex vibration characteristics of multi-degree-of-freedom (DOF) systems. Therefore, we aim to establish a control model for a complex system that is expressed as a multi-DOF system considering the vibration characteristics of the system.
Recently, many methods have been used to obtain the vibration characteristics of structures, such as obtaining the eigenmodes of structures or resonance points using direct numerical integration [12,13,14,15,16,17,18,19,20,21]. However, it is very difficult to obtain the mode in the case of the forced vibration response when the object undergoes real vibrations such as vibrations during the operation of the machine or control output. In addition, because the resonance point of a machine is often in a frequency band that should not be used for steady-state operations, the machine is typically operated while avoiding this resonance point. Therefore, if the purpose of the mechanical design is not to increase the vibration, it is sufficient to obtain the resonance point of the structure under forced vibration. However, from the perspective of durability and quality improvement, it is desirable to operate the machine under conditions where the vibration amplitude is smaller than the excitation amplitude.
A structure composed of many elements, such as a machine, can be regarded as a multi-DOF system. The system always has multiple resonance points, and there is an anti-resonance point showing a local minimum between them. Because the amplitude in the range around this anti-resonance point is smaller than the amplitude of the excitation, it can be said that it is a suitable condition for operating the machine in this range. However, although there are many studies that discuss resonance points and eigenmodes, few have discussed anti-resonance points. In addition, the position of the anti-resonance point differs according to the results of the frequency analysis of the free vibration obtained from the eigenmode and the results of the frequency response analysis of the forced vibration [11].
Therefore, a method to obtain the frequency response analysis of forced vibrations using a mathematical formula is required. Previously, a 2-DOF system was actively studied for the design of a dynamic vibration absorber. Nishihara et al. obtained an exact solution to optimize a dynamic vibration absorber in a 2-DOF system model that does not have a damping factor in the main system [22,23,24]. However, in the most general case, many machines are mounted using viscoelastic materials, such as rubber vibration insulators, and there is no realistic situation in which the main system does not have damping. Furthermore, the dynamic characteristics of the viscoelastic body are different from those of a damping element, such as a damper, and few studies have considered the characteristics of the viscoelastic body. Furthermore, by clarifying the vibration characteristics of viscoelastic materials without damping elements in multiple degrees of freedom, it is possible to suppress vibration at a low cost.
In this study, as a basic study for establishing a control model for complex control systems, we focused on the vibration characteristics of a 2-DOF system consisting of viscoelastic bodies using the vibration analysis of a multi-DOF system. Furthermore, vibration experiments were performed to examine the vibration suppression performance of a 2-DOF system with viscoelastic elements.

2. Vibration Analysis of 2-DOF System

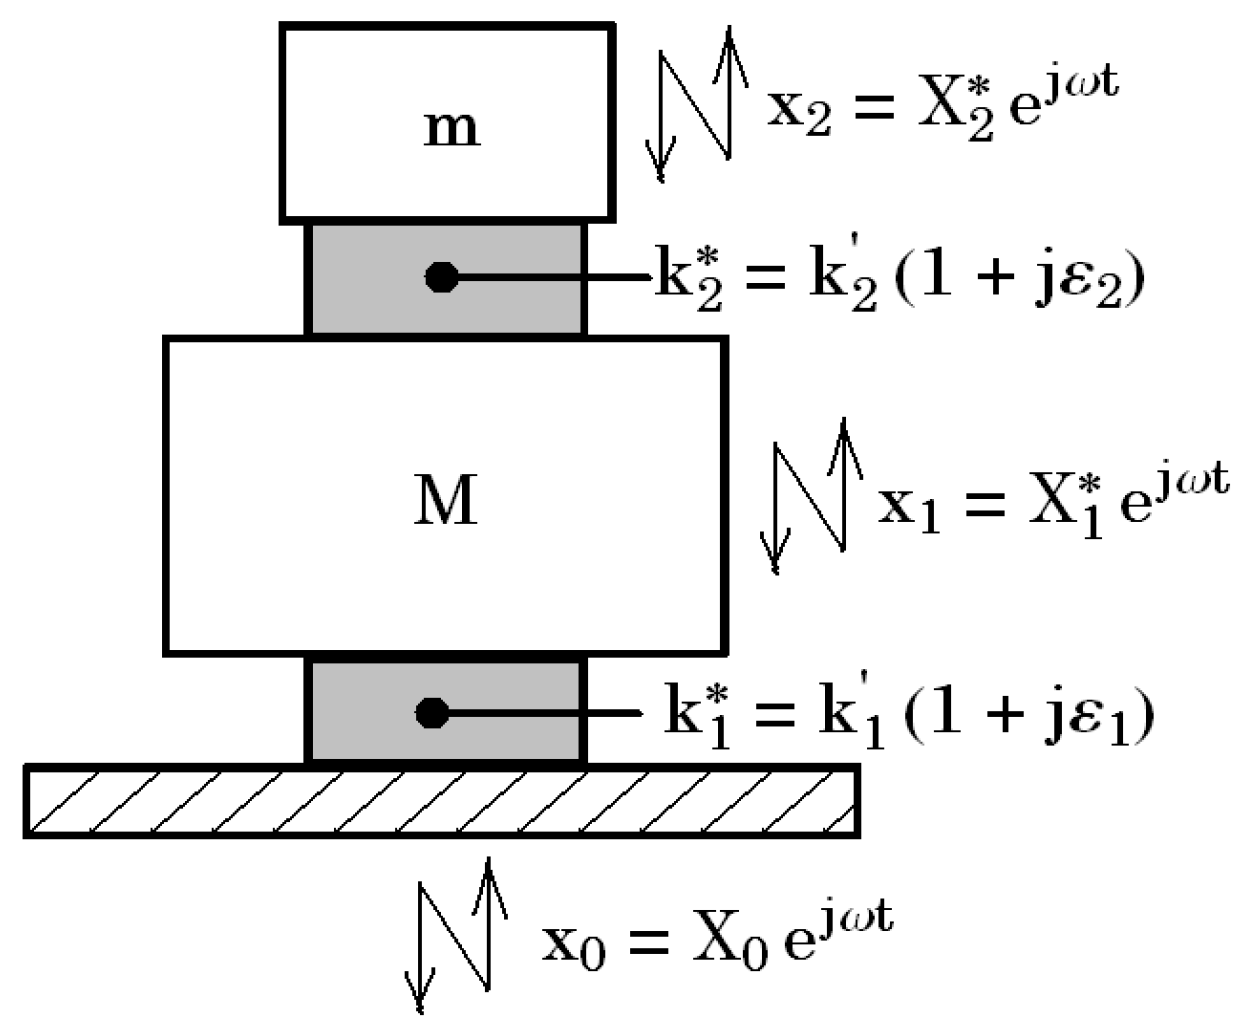
2.1. Analysis Model of the System Using Viscoelastic Body

Figure 1 shows the analysis model of the 2-DOF system, which consists of the main mass, M [kg]; sub-mass, m [kg]; and viscoelastic bodies. The ground was displaced, and the system vibrated. The displacement of the ground, mass M, and m are defined as x0 [m], x1 [m], and x2 [m], respectively. The displacements at time, t [s], are expressed as follows:
x 0 = X 0 e j ω t ,
x 1 = X 1 e j ω t ,
x 2 = X 2 e j ω t ,
where X 0 , X 1 , and X 2 are the amplitudes of displacement [m], and j is the imaginary unit. The spring constant, k* (In this paper, * indicates a complex number that includes both the real and imaginary parts.), of the viscoelastic body was modeled as follows:
k * = k + j k = k ( 1 + j ε ) ,
where k is the dynamic spring constant [N/m], and k is the complex spring constant [N/m]. The loss factor, ε, is defined as ε = k″/k′. This study assumed that the spring constants k1* and k2* did not change according to frequency, amplitude, and temperature.

2.2. Analysis Model in Which a Viscoelastic Body and Spring Are Installed in Parallel in the Main Mass

Figure 2 shows the analysis model of the 2-DOF system in which the viscoelastic body and spring with spring constant k0 [N/m] are installed in parallel in the main mass. The combined spring constant, K * , of the viscoelastic body and spring is expressed as follows:
K * = k 0 + k ( 1 + j ε ) = K ( 1 + j β ε ) ,
The combined dynamic spring constant, K [N/m], and combined loss factor, β , are defined as follows:
K = k 0 + k   ,   β = k k 0 + k
Equations of motion in mass M and m are expressed as follows:
M x ¨ 1 = K 1 * ( x 1 x 0 ) k 2 * ( x 1 x 2 ) ,
m x ¨ 2 = k 2 * ( x 2 x 1 ) ,
The transmissibility, TM, is obtained from these equations.
T M = | X 1 X 0 | = R u 2 + I u 2 R d 2 + I d 2 ,
R u = 1 β ε 1 ε 2 μ α ( ω ω n ) 2 I u = ε 2 + β ε 1 β ε 1 μ α ( ω ω n ) 2 R d = 1 β ε 1 ε 2 ( 1 + μ + μ α ) ( ω ω n ) 2 + μ α ( ω ω n ) 4 I d = β ε 1 + ε 2 { β ε 1 μ α + ε 2 ( 1 + μ ) } ( ω ω n ) 2
where the mass ratio, μ ; spring constant ratios, α and β ; and natural frequency of the main mass, ω n , are defined as follows:
μ = m M   ,   α = k 2 K   ,   β = k 1 K   , ω n = K M

3. Analysis by Changing Each Parameter in a 2-DOF Vibration System Model

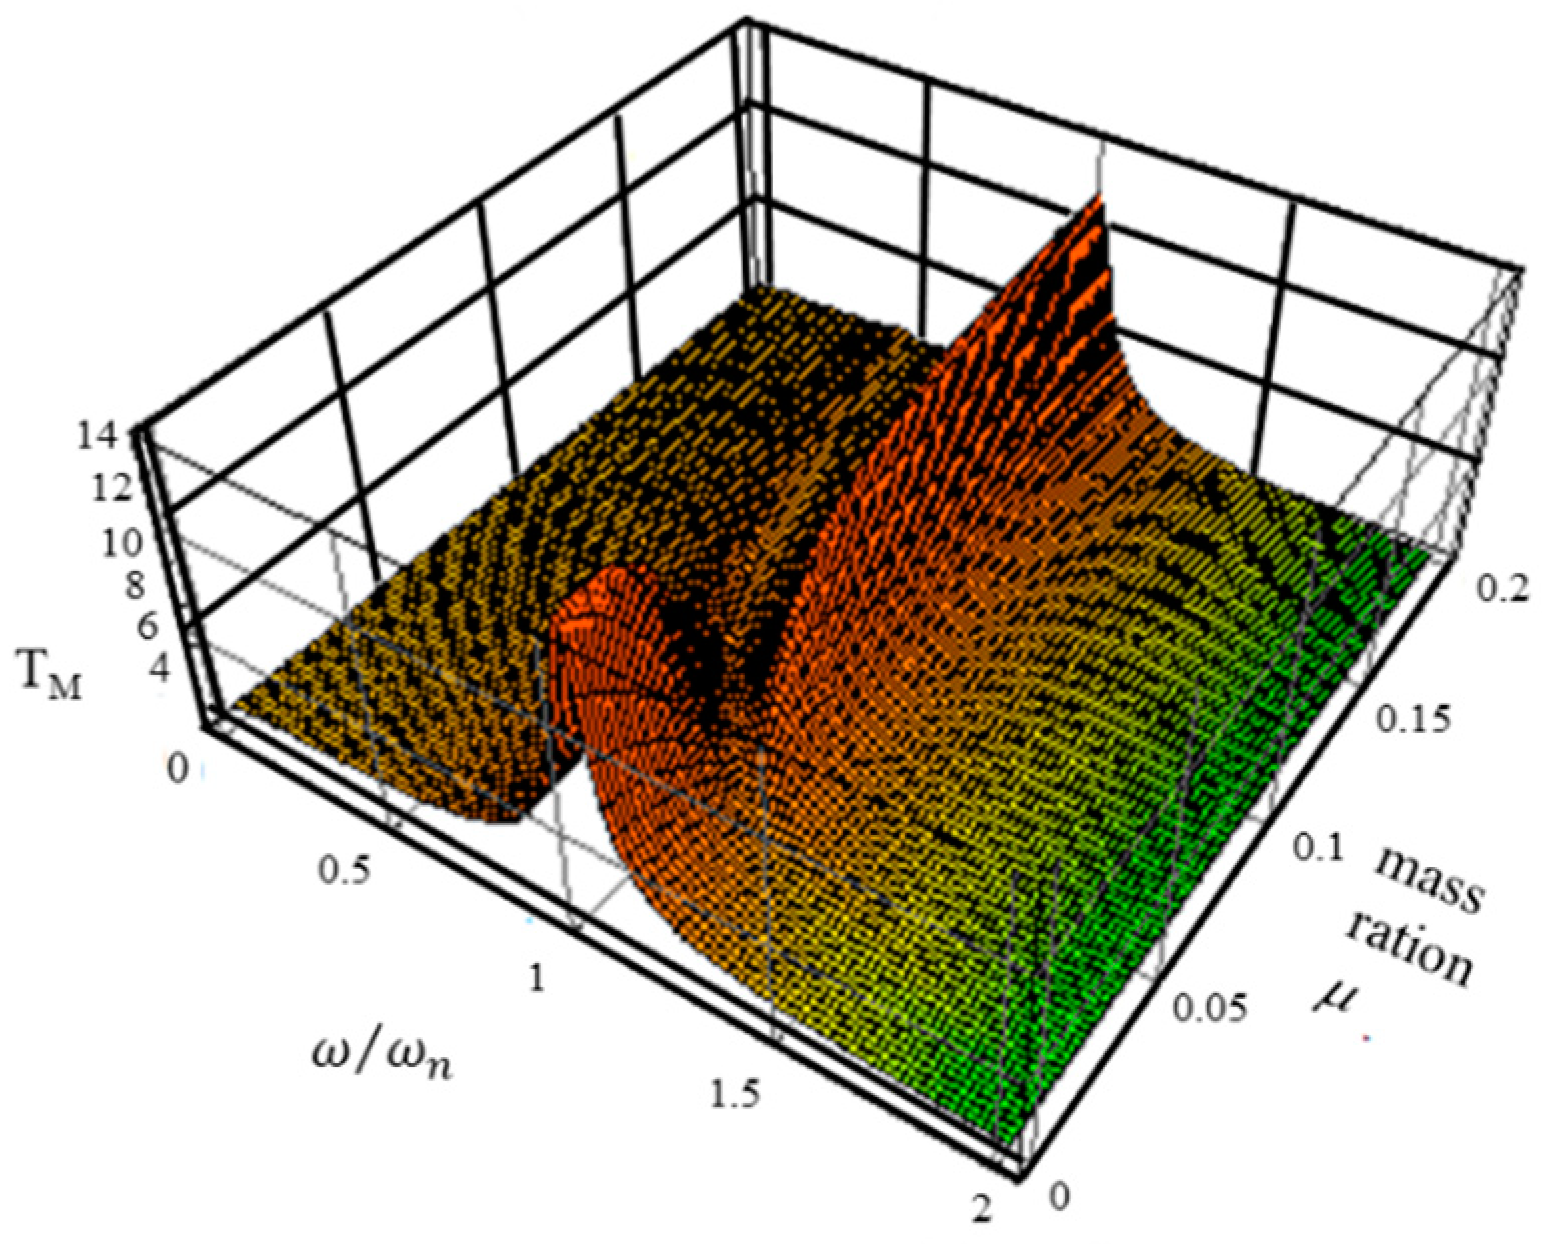
3.1. Resonance Vibration Analysis by Changing Mass Ratio μ

The characteristics of the forced vibration response in the 2-DOF system obtained in the previous section (Equation (8)) can be changed by varying the mass ratio, μ . When the mass ratio, μ , was changed from 0 to 0.2 under the conditions α = 0.05, ε 1 = 0.07 , and ε 2 = 0.17 , the transmissibility TM changes, as shown in Figure 3. When μ = 0 , the number of resonance points in the transmissibility TM was 1. When the mass ratio μ increased, the peak of the resonance point shifted to a lower area, where the natural frequency ratio ω / ω n  was 1, and another resonance point appeared in a higher area with a natural frequency ratio of more than 1. With an increase in the mass ratio, the peak of the lower resonance point decreased and that of the higher resonance point increased.

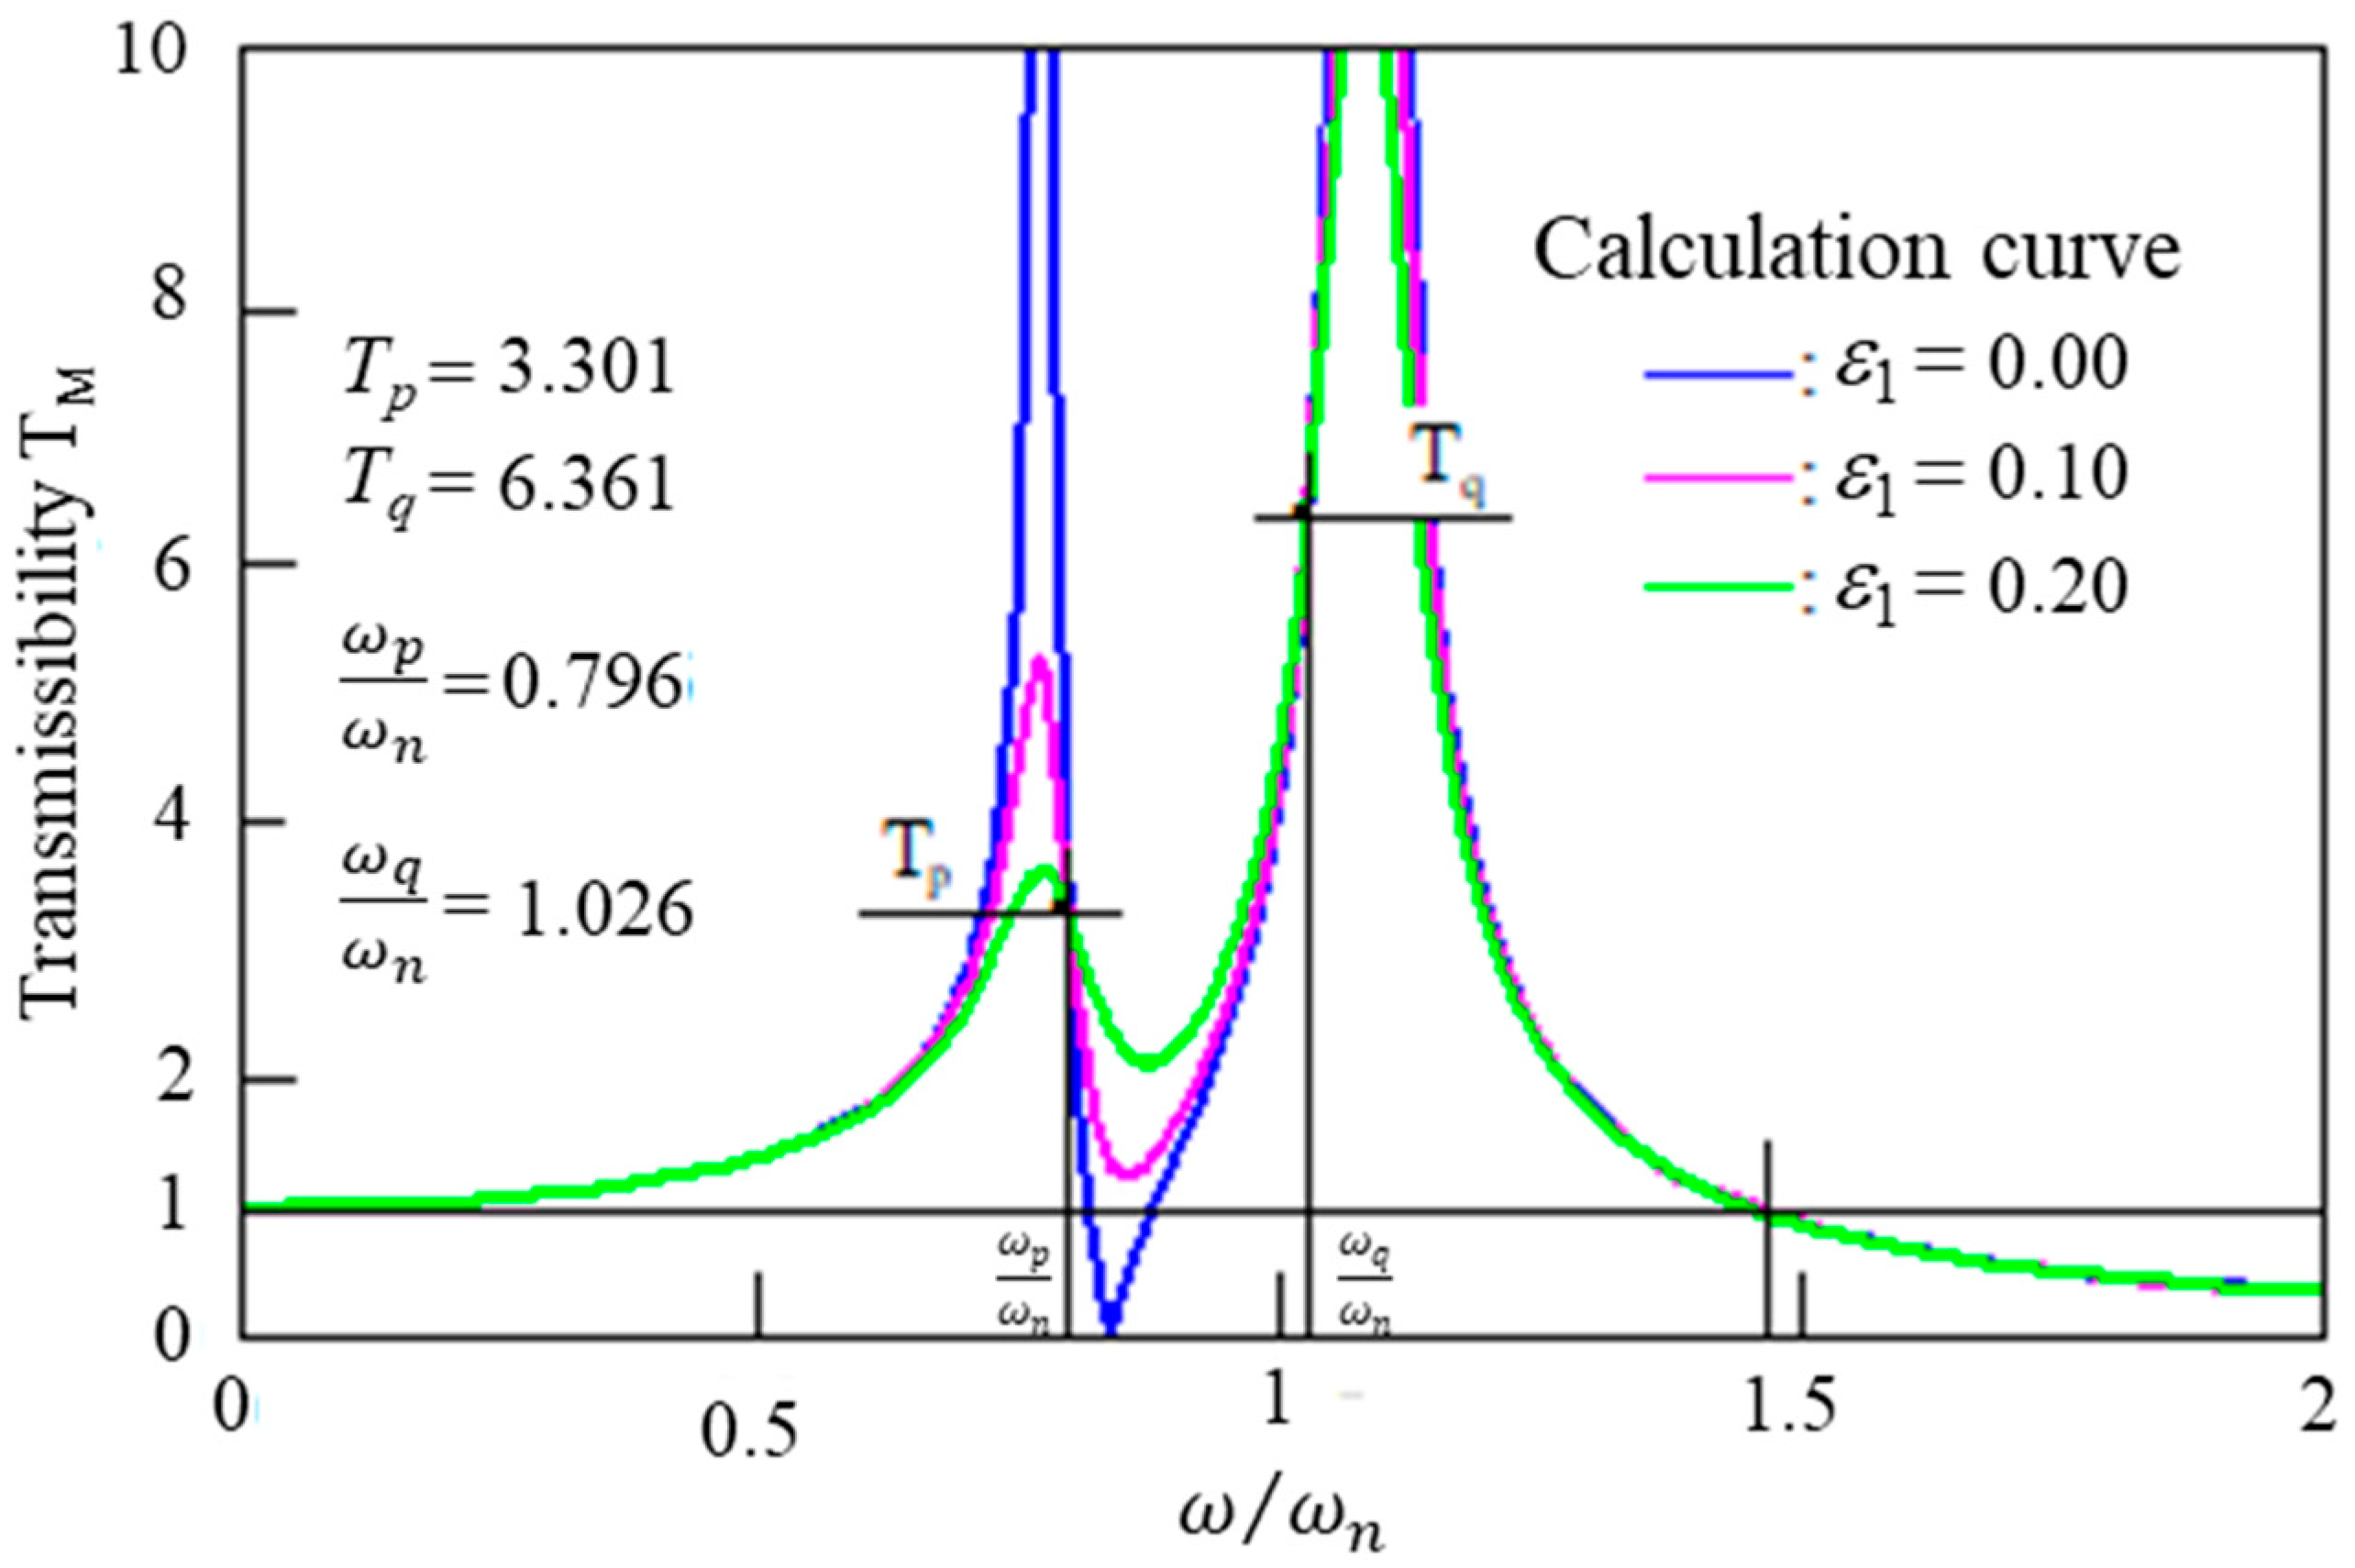
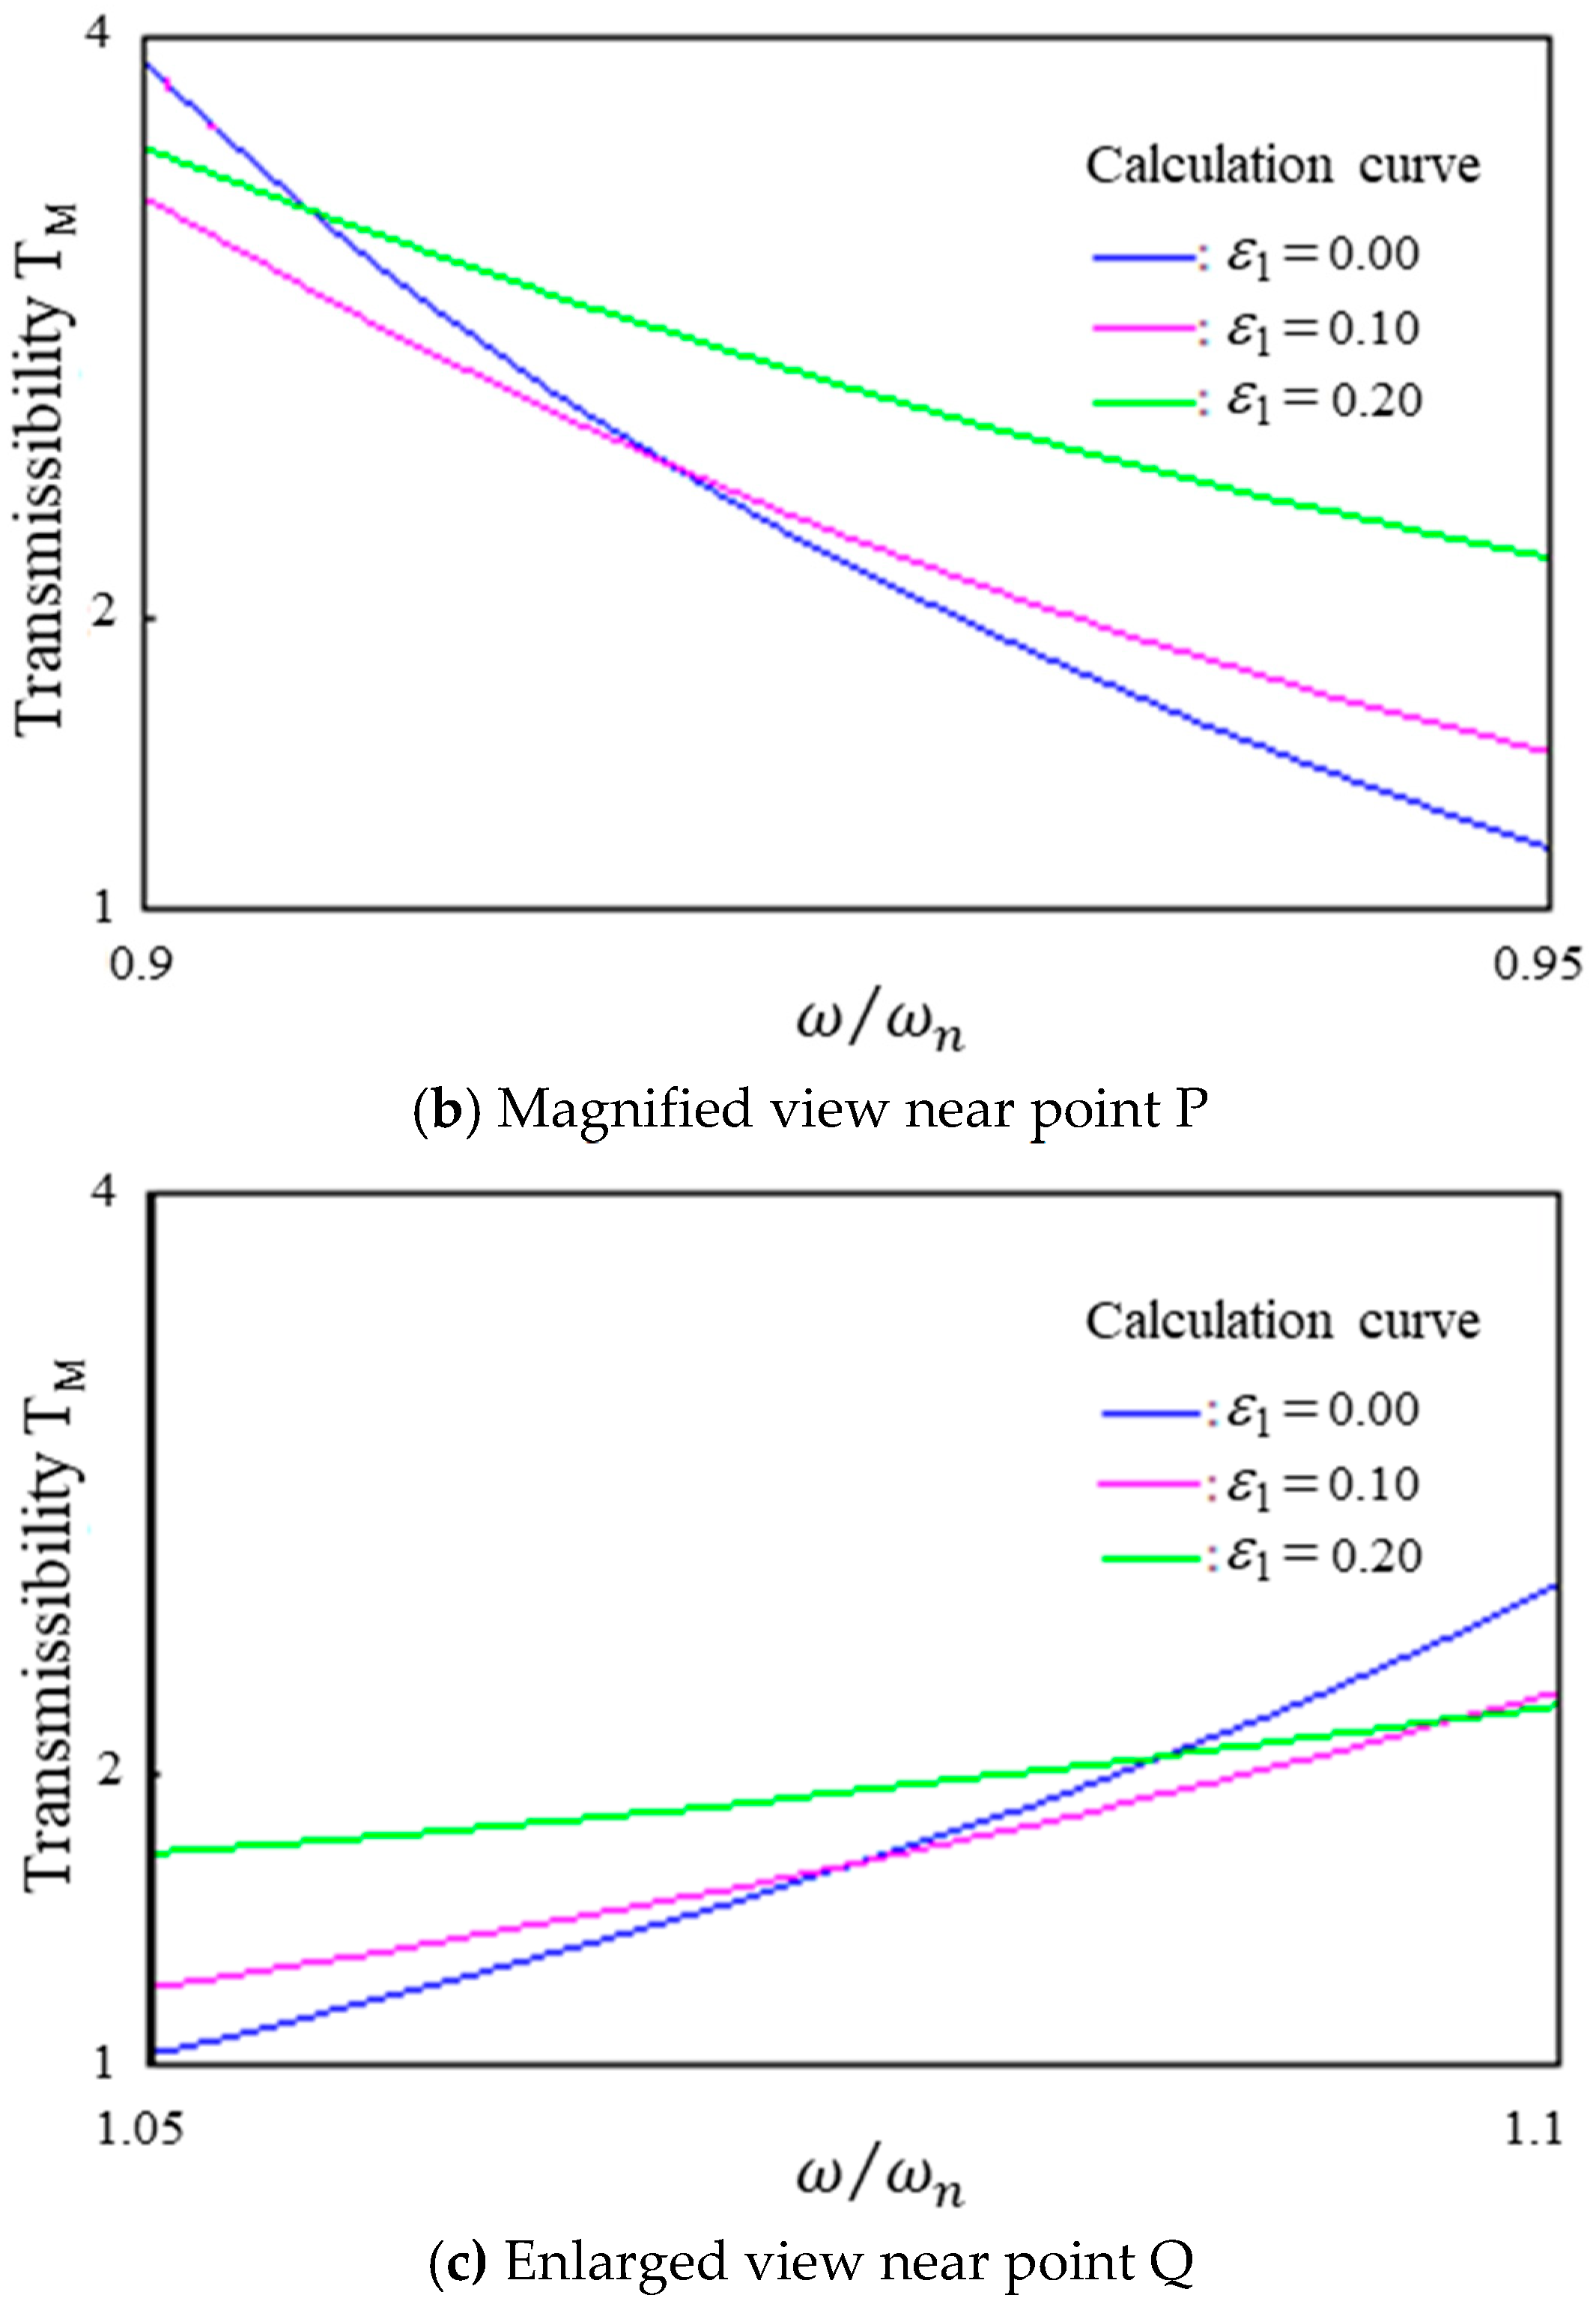
3.2. Resonance Vibration Analysis of 2-DOF System without the Loss Factor in the Main System

To verify the proposed equation, a resonance vibration analysis of the 2-DOF system without the loss factor in the main system was performed. In the case of the loss factor in the main system of ε 1 = 0, the terms Ru, Iu, Rd, and Id in the formula for transmissibility, TM, given in Equation (8) can be expressed as follows:
T M = | X 1 X 0 | = R u 2 + I u 2 R d 2 + I d 2 R u = 1 μ α ( ω ω n ) 2   I u = ε 2 R d = 1 ( 1 + μ + μ α ) ( ω ω n ) 2 + μ α ( ω ω n ) 4 I d = ε 2 ε 2 ( 1 + μ ) ( ω ω n ) 2 μ = m M ,   α = k 2 k 1 ,   ω n = k 1 M
The resonance curve, which is the relationship between the transmissibility TM and natural frequency ratio or frequency, is shown in Figure 4 for the spring ratio of α = 0.07, the mass ratio of μ = 0.1, and the subsystem loss factor of ε 2 = 0, 0.1 and 0.2. It can be confirmed that the increase in the loss factor ε 2 results in a decreased transmissibility at the resonance points, and there are two points at which the resonance curves in each case of ε 2 meet. These points are called fixed points P and Q. By applying the PQ fixed-point theory [24], it is possible to derive the optimum tuning condition and optimum loss factor.
It was confirmed that the intersection point of the vibration transmissibility is independent of the value of ε 2 when there is no loss in the main system. Therefore, the fixed points P and Q are obtained from the two vibration transmissibility values of ε 2 = 0.0 and ε 2 = ∞. Then, by setting the partial differentiation with (ω/ωn)2 to 0, a fourth-order algebraic equation is derived; by solving these equations, the optimal tuning condition, αopt; optimal loss coefficient, ε 2 opt ; and maximum vibration transmissibility, Tmax, can be obtained. An exact solution in which both maxima are perfectly matched has already been derived by Nishihara et al. [25]. The calculations have been omitted, and only the results are shown in the following equation:
α o p t = μ ( 1 + μ ) 2
ε 2 o p t = μ ( 3 + μ ) 2
T m a x = 2 ( 1 + μ ) μ
Figure 5 shows the resonance curve of the optimally designed 2-DOF system obtained using these equations. The transmissibility at the resonance points was confirmed to be the same.

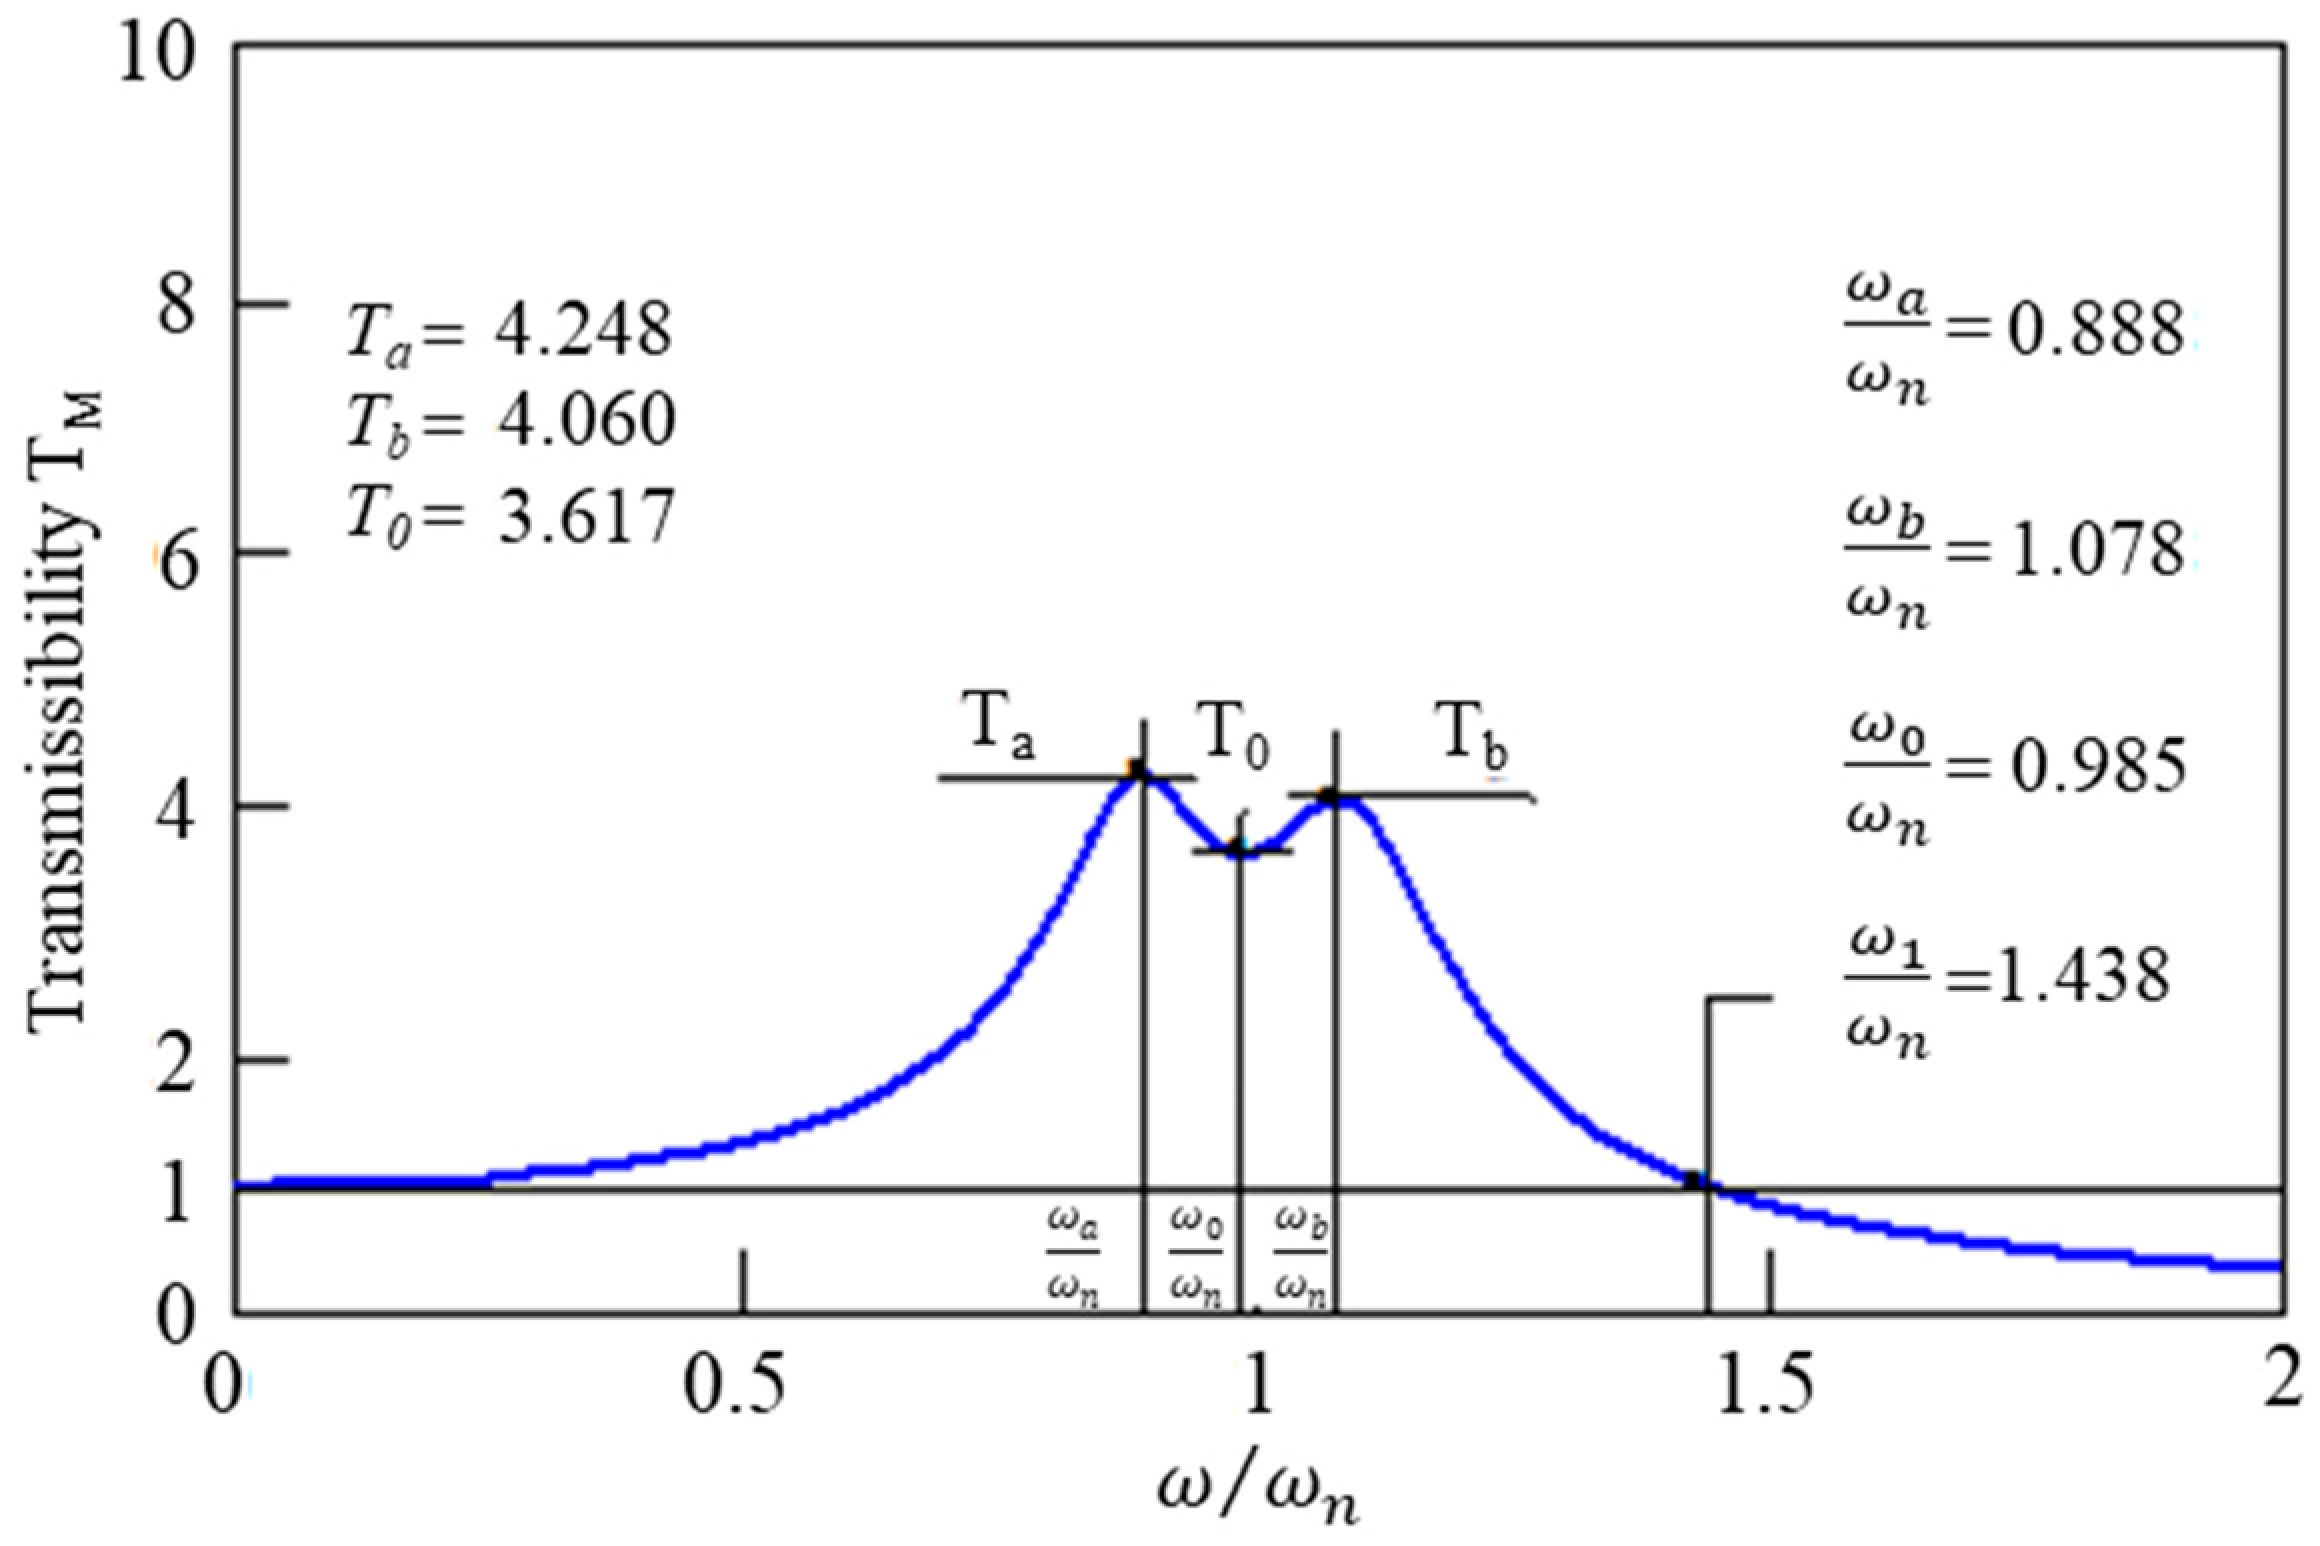
3.3. Resonance Vibration Analysis of 2-DOF System with the Loss Factor in the Main System

In an actual system, because every element has a damping factor, a resonance vibration analysis of the 2-DOF system with the loss factor in the main system was performed. The analysis was carried out with the spring ratio of α = 0.07, mass ratio of μ = 0.1, loss factor in the main system of ε 1 = 0.1, and subsystem loss factor of ε 2 = 0, 0.1, and 0.2. The resonance curves obtained are shown in Figure 6a. It was also confirmed that the increase in the loss factor, ε 2 , decreases the transmissibility at resonance points, similar to that of the 2-DOF system, without the loss factor in the main system from Section 3.2. However, focusing on points P and Q, the resonance curves for each condition of ε 2 did not meet at a point, as shown in Figure 6b,c.
Furthermore, the resonance curve for the loss factor in the main system as ε 1 = 0.1 is shown in Figure 7 using the optimum parameters αopt = 0.45 and ε 2 opt = 0.276, obtained by Equations (10) and (11), respectively. This figure shows that the transmissibility values at the peaks of the resonance curve are not the same.

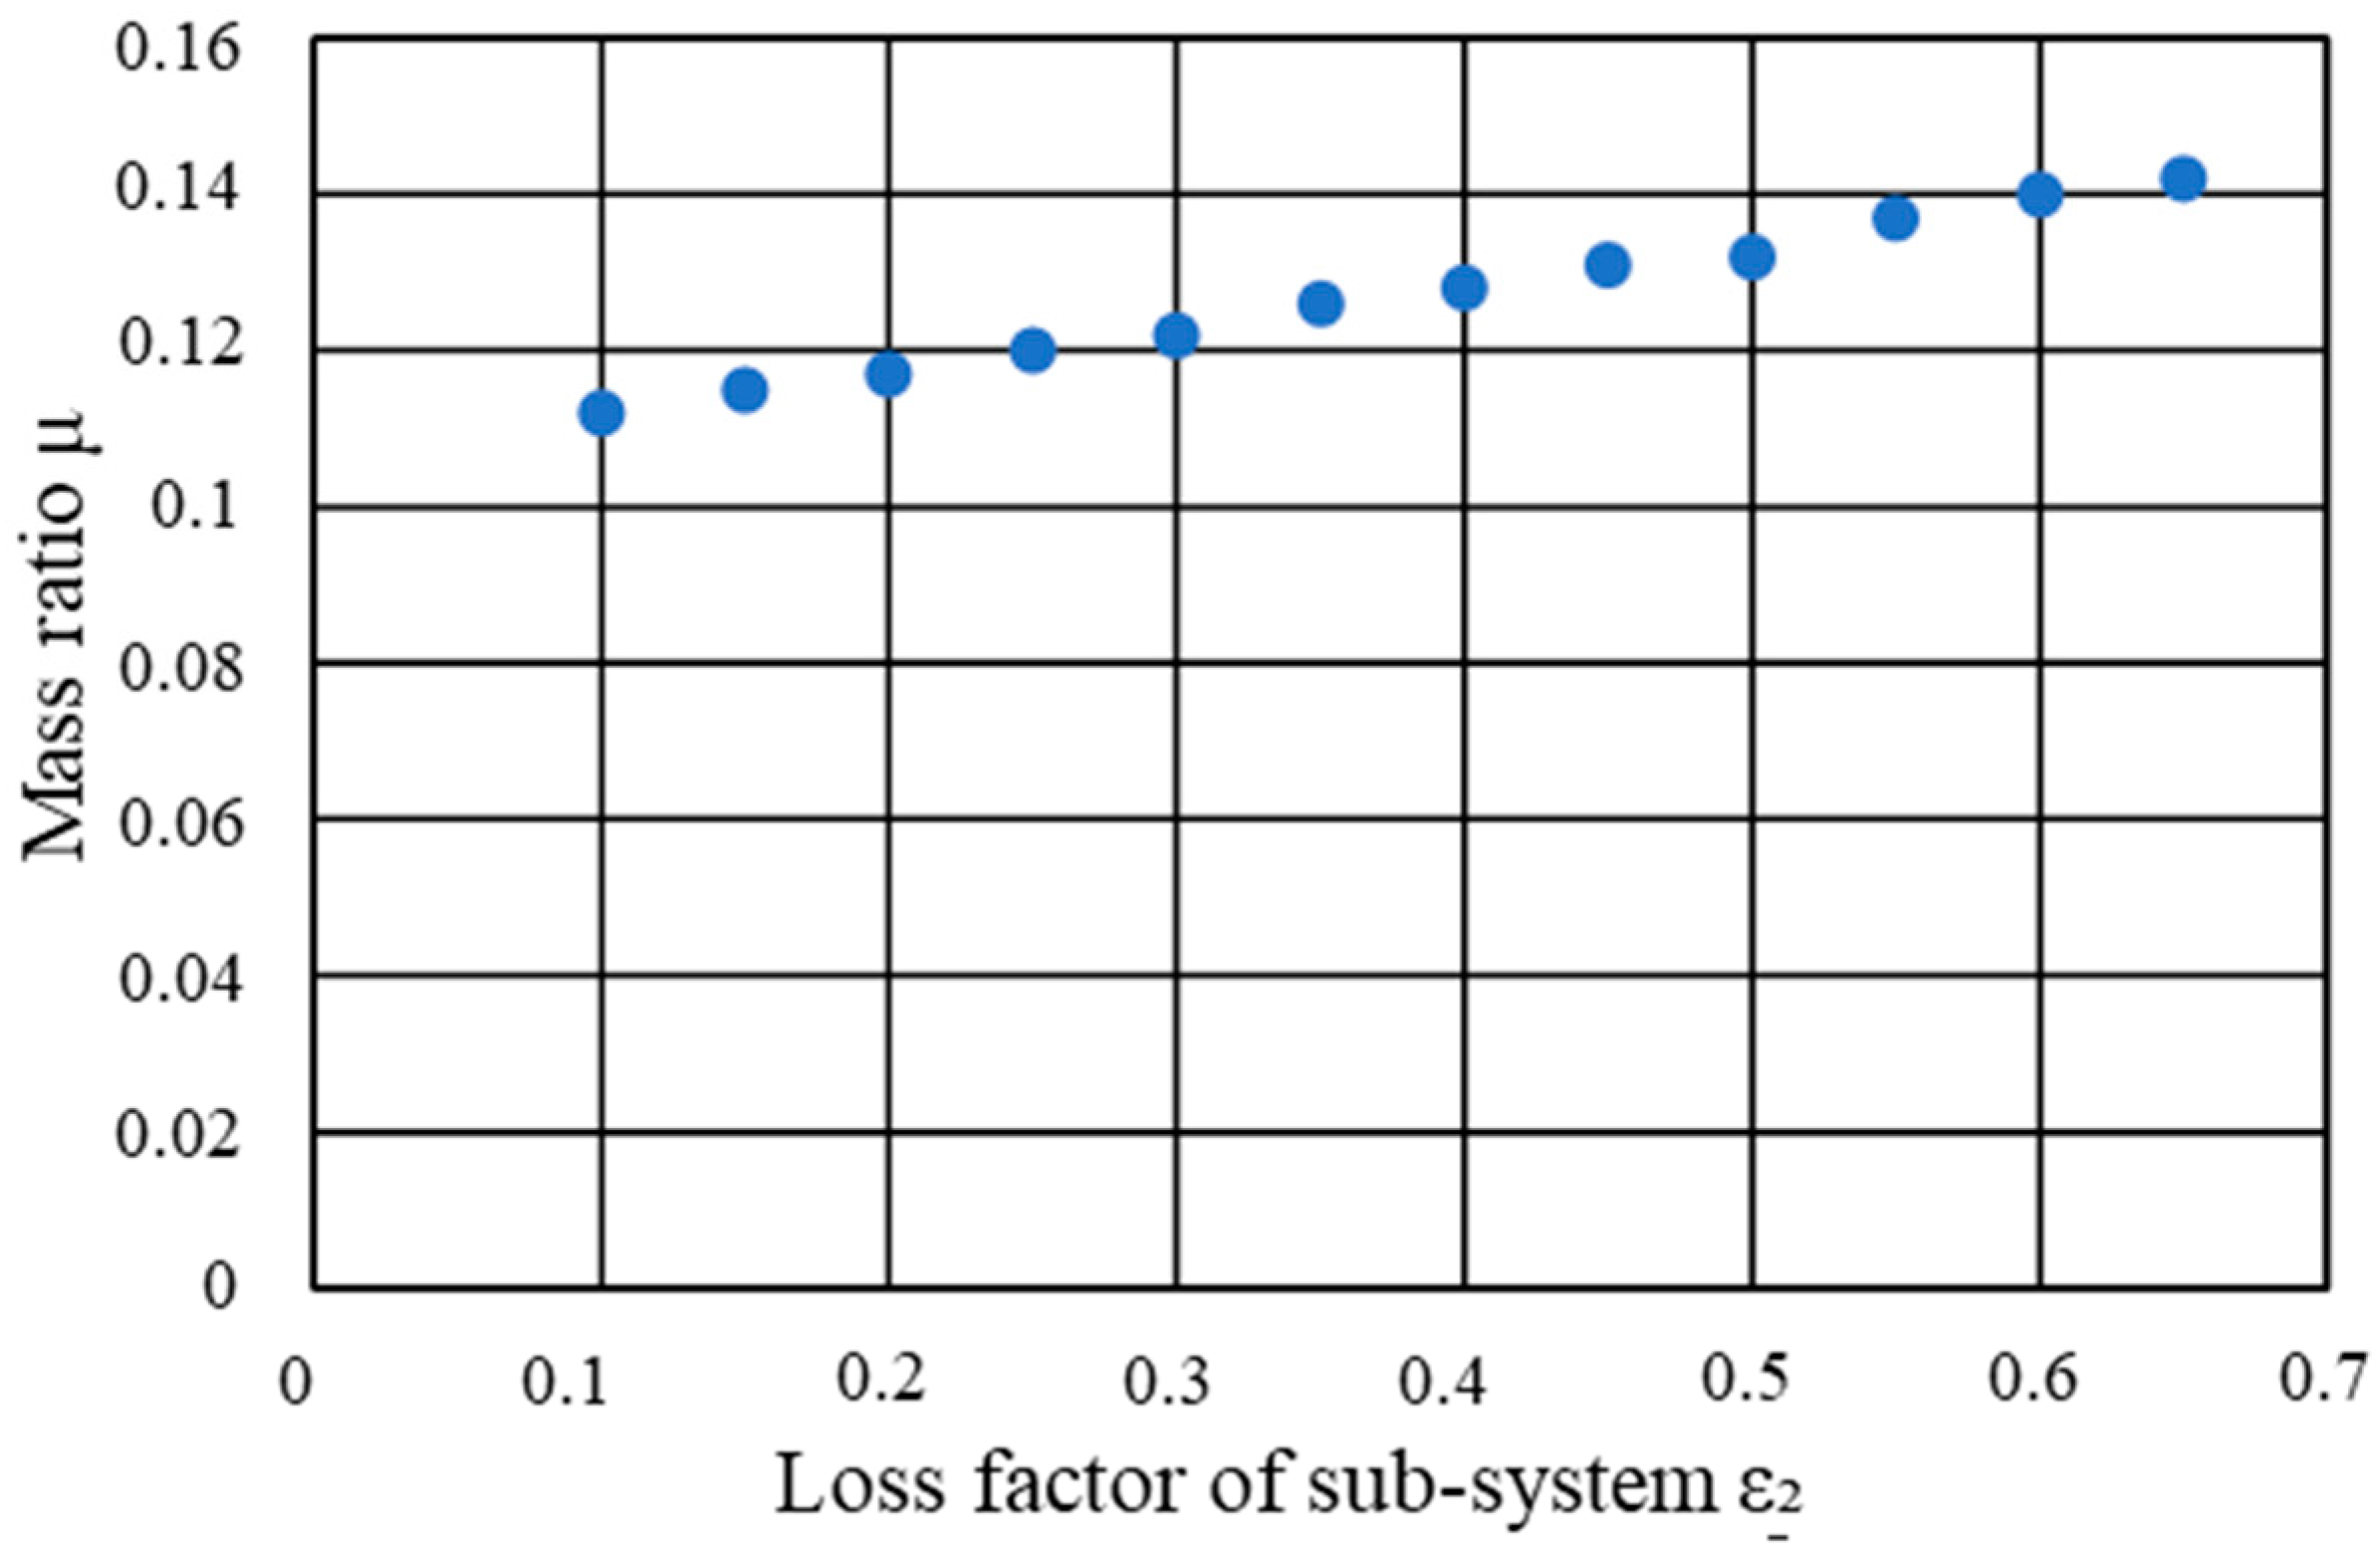
3.4. Optimization Method in 2-DOF System with a Damping Factor by Varying the Mass Ratio

To optimize the parameters in the 2-DOF system with a damping factor, we propose a method for changing the mass ratio. In this method, the mass ratio is changed slightly to ensure the same transmissibility at the resonance points. The resonance curve is expected to be minimized.
We applied this method for μ = 0.05, ε 1 = 0.1, αopt = 0.05, and ε 2 o p t = 0.276, as shown in Figure 7, and a comparison of the resonance curves with and without the method is shown in Figure 8. The solid blue line represents the resonance curve without the method, and the red dashed line represents the curve with the method. It was confirmed that applying the method, which slightly changes the mass ratio, can achieve the same transmissibility at the resonance points.
Furthermore, we investigated the optimal mass ratio when the subsystem loss factor, ε 2 , was varied. Figure 9 shows the relationship between ε 2 and the optimized mass ratio when ε 1 = 0.1 and α = 0.05. It can be confirmed that the larger the subsystem loss factor, the larger the optimum mass ratio.

4. Forced Vibration Experiments for 2-DOF System with Damping Factor

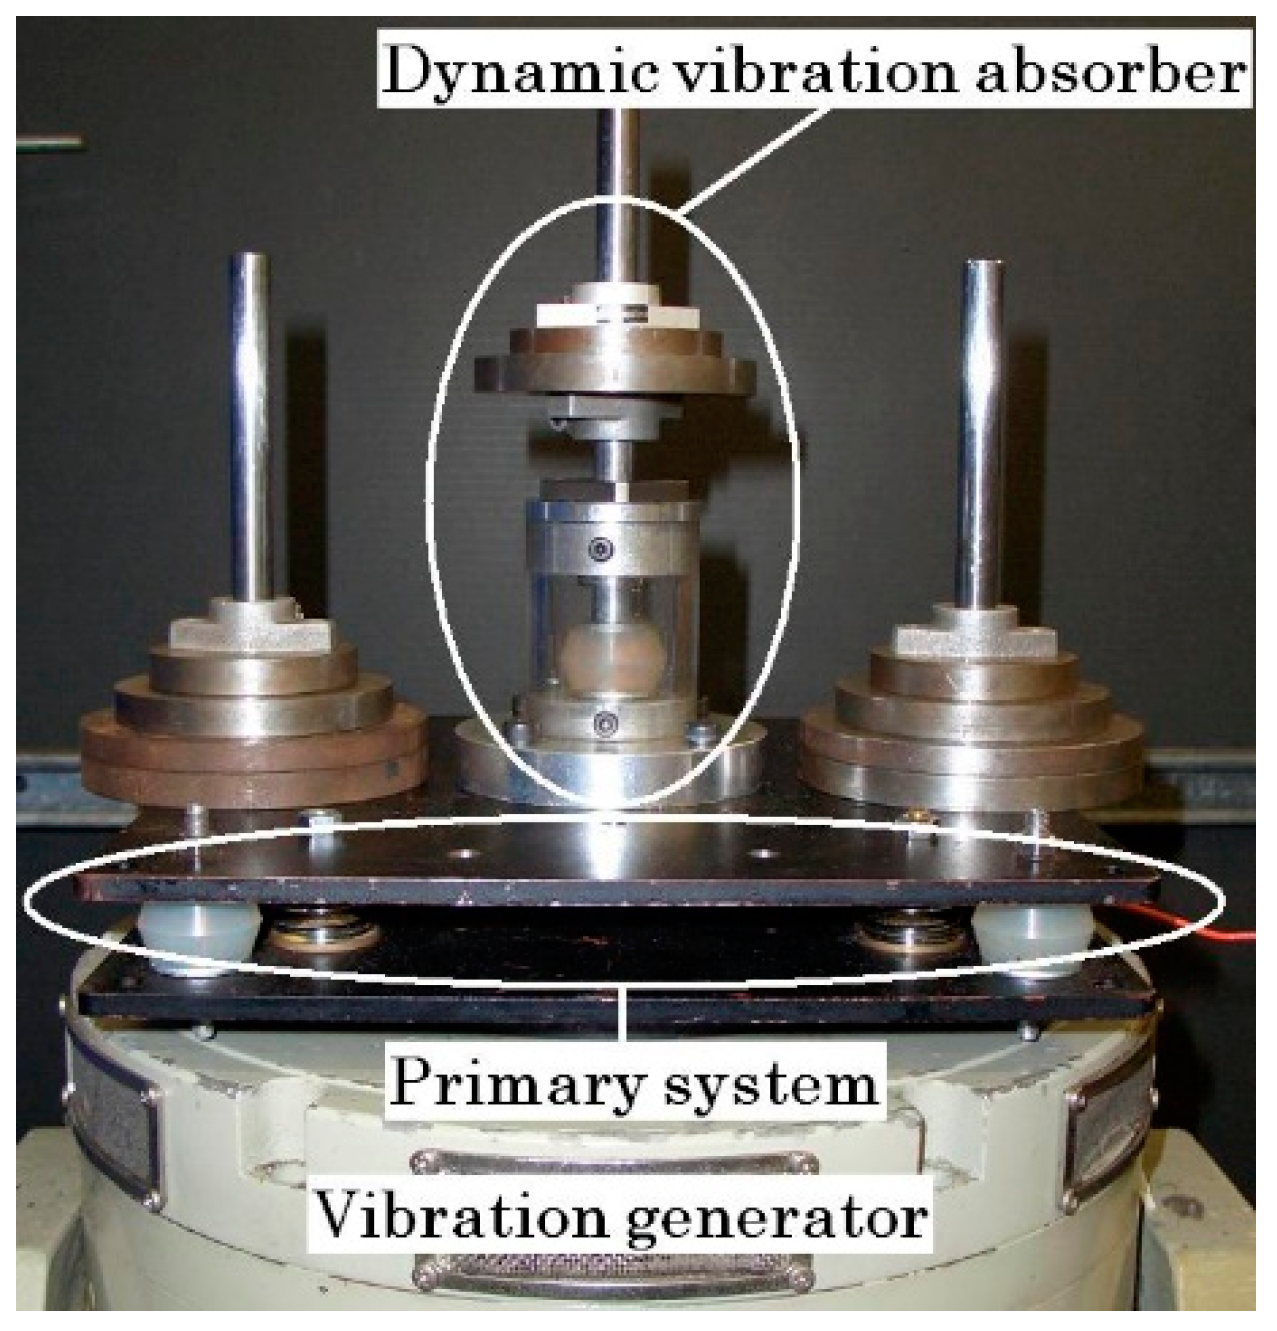
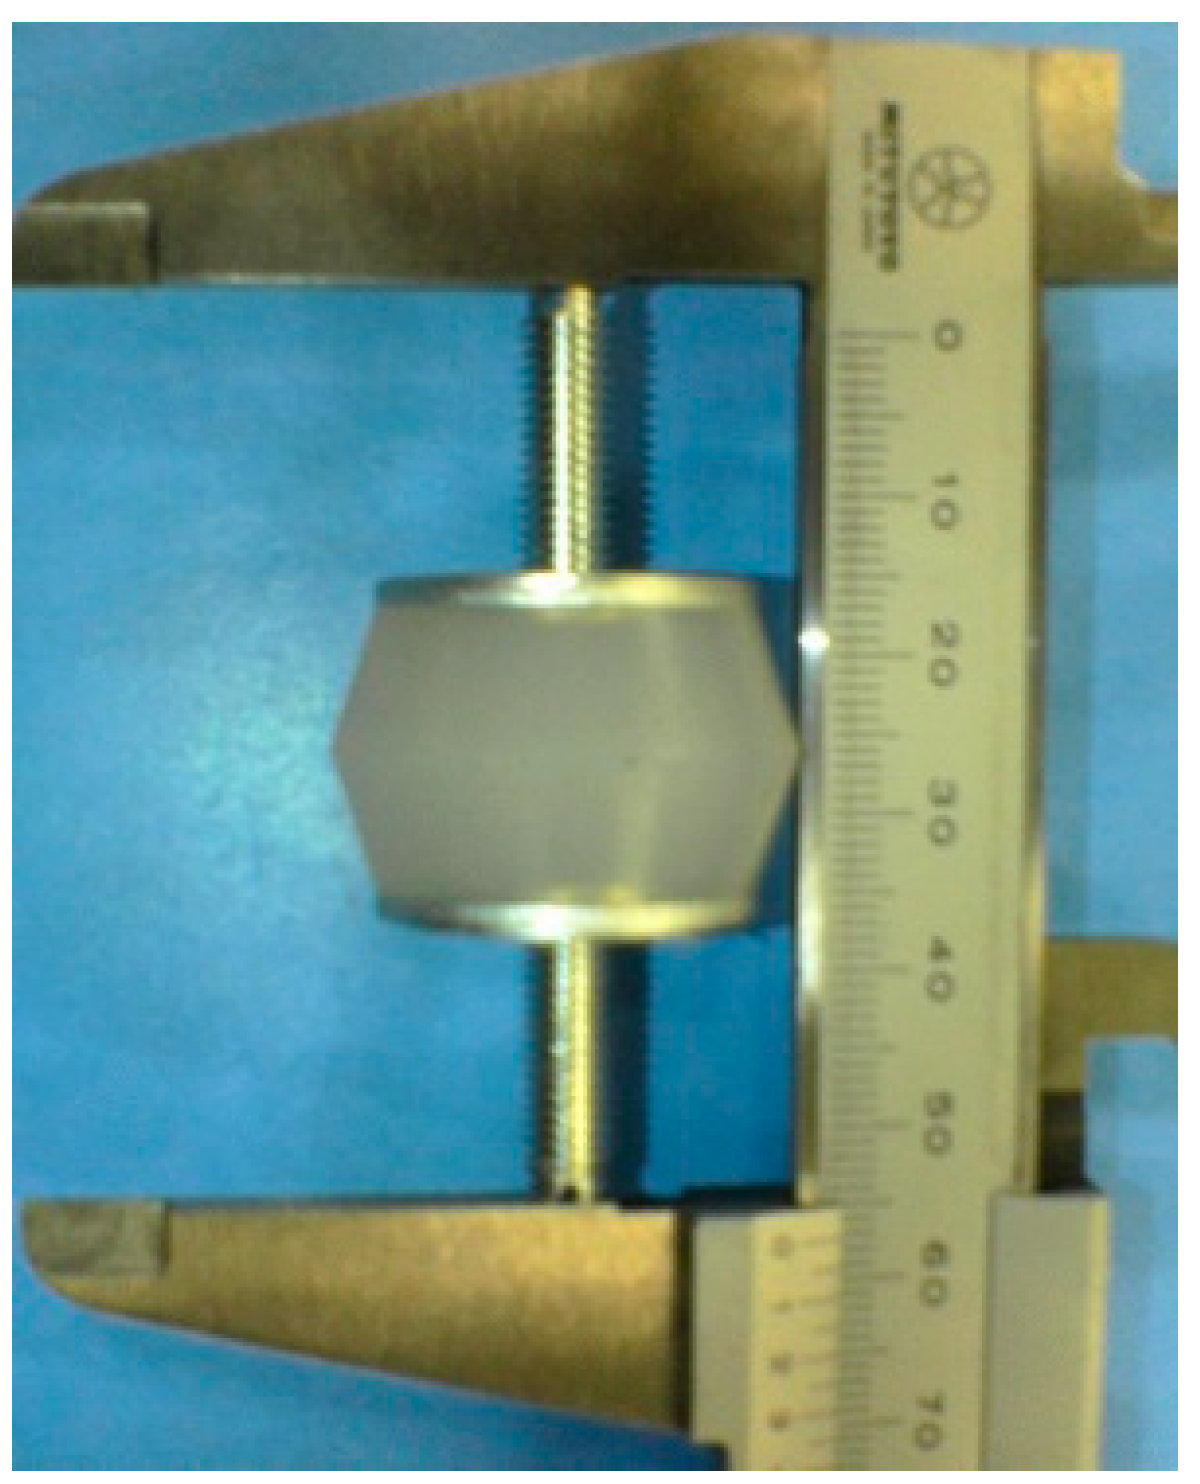
4.1. Conditions of Forced Vibration Experiments

Forced vibration experiments were performed to verify the analysis results. The experimental apparatus is shown in Figure 10. One steel plate was fixed with a vibration generator, and the other steel plate was used as the main mass. The steel plates were connected by four springs and four viscoelastic bodies. A subsystem was installed on the steel plate of the main mass. The mass of the main system and subsystem can be changed by adding weights. The viscoelastic body was αGEL (MN-3 and MN-7), manufactured by the Taica Corporation (Tokyo, Japan), as shown in Figure 11. MN-3 was used for the subsystem and M-7 was used for the main system. From the basic experiments, the dynamic spring ratios and loss factors were obtained, as listed in Table 1.
The experimental apparatus was vibrated using a vibration generator, as shown in Figure 12, under the sweep vibration conditions listed in Table 2. During the experiments, the vibration frequency was gradually changed from 5 Hz to 60 Hz, and the accelerations of the ground and main mass were measured using acceleration sensors. The ratio of the acceleration built into the vibration generator to the acceleration attached to the experimental apparatus was used to determine the transfer coefficient. This experiment was conducted at 20 °C to exclude temperature effects.

4.2. Experimenatal Results of Forced Vibration Using 2-DOF System with Damping Factor

The 2-DOF system, which consisted of the main mass M (3.56 kg) and a sub-mass (0.456 kg), was oscillated by the vibration generator. First, forced vibration experiments on the main system without the subsystem were performed. The obtained resonance curves are shown in Figure 13. The green line is the theoretical resonance curve, and the purple plots are the experimentally measured transmissibility values at each frequency. From the comparison of the theoretical and experimental results, it can be confirmed that the obtained transmissibility equation is in good agreement with the actual experimental results. Furthermore, forced vibration experiments were performed for a 2-DOF system. The resonance curve obtained using Equation (8) is also shown as a blue line in Figure 13, and the measured transmissibility is shown as the orange plots. These experimental results are in agreement with the theoretical resonance curve. This experiment was conducted 10 times and the results are representative.

5. Conclusions

In this study, a basic research study to establish a control model for a complex vibration control system, the vibration transmissibility of the 2-DOF system was obtained. Because the fixed-point theory cannot be applied when there is a loss factor in the main system, good agreement can be obtained by comparing the experimental and calculated values using an analytical model with complex springs using the mass ratio change method. Under the experimental conditions of this paper, the results verified that the vibration suppression performance differs greatly in the obtained results depending on the spring constant and mass. Viscoelastic properties in other frequency bands will also be studied. Furthermore, we proved that it is an important parameter in the development of dynamic vibration absorbers and in the construction of control systems. The result of these parameter settings is expected to be applied to other multi-DOF systems, for example, a tuned mass damper.

Author Contributions

Conceptualization, K.I. and T.N.; methodology, T.N.; software, A.E.; validation, K.O. and T.K.; formal analysis, K.I.; investigation, K.K. and A.E.; resources, T.N.; data curation, K.K.; writing—original draft preparation, K.K.; writing—review and editing, K.I.; visualization, J.K. and D.U.; supervision, H.K., M.H.B.P., X.L. and I.K.; project administration, T.N.; funding acquisition, T.N. All authors have read and agreed to the published version of the manuscript.

Funding

This study received no external funding.

Data Availability Statement

Not applicable.

Acknowledgments

We express our sincere thanks to Koichi Ozaki at Tokai University for the helpful discussions. All authors have consented to be acknowledged.

Conflicts of Interest

The authors declare no conflict of interest.

References

  1. Valeev, A.; Zotov, A. Application of complex technology for monitoring and vibration protection of industrial equipment and analysis of its efficiency. In Proceedings of the 2020 International Conference on Dynamics and Vibroacoustics of Machines, Samara, Russia, 16–18 September 2020; pp. 1–6. [Google Scholar] [CrossRef]
  2. Furinghetti, M. Definition and Validation of Fast Design Procedures for Seismic Isolation Systems. Vibration 2022, 5, 290–305. [Google Scholar] [CrossRef]
  3. Koszewnik, A.; Gosiewski, Z. Quasi-optimal locations of piezo-elements on a rectangular plate. Eur. Phys. J. Plus 2016, 131, 232. [Google Scholar] [CrossRef]
  4. Koszewnik, A.; Gosiewski, Z. Frequency domain identification of the active 3D mechanical structure for the vibration control system. J. Vibroengineering 2012, 14, 451–457. [Google Scholar]
  5. Grądzki, R.; Lindstedt, P.; Kulesza, Z.; Bartoszewicz, B. Rotor Blades Diagnosis Method Based on Differences in Phase Shifts. Shock. Vib. 2018, 2018, 9134607. [Google Scholar] [CrossRef]
  6. Gradzki, R.; Kulesza, Z.; Bartoszewicz, B. Method of shaft crack detection based on squared gain of vibration amplitude. Nonlinear Dyn. 2019, 98, 671–690. [Google Scholar] [CrossRef]
  7. Shaw, A.D.; Hill, T.L.; Neild, S.A.; Friswell, M.I. Multiharmonic Resonance Control Testing of an Internally Resonant Structure. Vibration 2020, 3, 217–234. [Google Scholar] [CrossRef]
  8. Yuan, M.; Jin, Y.; Liu, K.; Sadhu, A. Optimization of a Non-Traditional Vibration Absorber for Vibration Suppression and Energy Harvesting. Vibration 2022, 5, 383–407. [Google Scholar] [CrossRef]
  9. Olgac, N.; Jenkins, R. Actively Tuned Noncollocated Vibration Absorption: An Unexplored Venue in Vibration Science and a Benchmark Problem. IEEE Trans. Control Syst. Technol. 2020, 29, 294–304. [Google Scholar] [CrossRef]
  10. Ikeda, K.; Endo, A.; Minowa, R.; Kato, H.; Narita, T. A basic study on influence of jerk on riding comfort using active seat suspension for ultra-compact mobility. Int. J. Appl. Electromagn. Mech. 2020, 64, 1505–1513. [Google Scholar] [CrossRef]
  11. Ikeda, K.; Kuroda, J.; Uchino, D.; Ogawa, K.; Endo, A.; Kato, T.; Kato, H.; Narita, T. A Study of a Ride Comfort Control System for Ultra-Compact Vehicles Using Biometric Information. Appl. Sci. 2022, 12, 7425. [Google Scholar] [CrossRef]
  12. Zeng, j.; Xia, W.; Xiang, X.; Long, Z. Research on the Mechanism and Control Characteistics of Vehicle-Trac Beam Coupling ibration for Medium-Speed Maglev Vehicle. IEEE Trans. Transp. Electrif. 2022, 8, 3236–3246. [Google Scholar] [CrossRef]
  13. Ren, T.; Deng, Z.; Kou, L.; Li, Y.; Wang, L. Vibration Characteristics of HTS Maglev System Levitated Above a Halbach Per-maneent Magnet Track. IEEE Trans. Appl. Supercond. 2022, 32, 3601605. [Google Scholar] [CrossRef]
  14. Wang, X.; Liu, X.; Shan, Y.; Shen, Y.; He, T. Analysis and Optimization of the Novel Inerter-Based Dynamic Vibration Ab-sorbers. IEEE Access 2018, 6, 33169–33182. [Google Scholar] [CrossRef]
  15. Burnett, K.J.; Choi, T.Y.; Li, H.; Wereley, M.N.; Miller, H.R.; Shim, K.J. Vibration Suppression of a Composite Prosthetic Foot Using Piezoelectric Shunt Damping: Implications to Vibration-Induced Cumulative Trauma. IEEE Trans. Biomed. Eng. 2021, 68, 2741–2751. [Google Scholar] [CrossRef] [PubMed]
  16. Ogawa, K.; Miyazaki, R.; Uchida, Y.; Kobayashi, I.; Kuroda, J.; Uchino, D.; Ikeda, K.; Kato, T.; Endo, A.; Narita, T.; et al. Experimental Consideration on Suppression Effect of Elastic Vibration in Electromagnetic Levitation System for Flexible Thin Steel Plate with Curvature. Vibration 2022, 5, 817–828. [Google Scholar] [CrossRef]
  17. Yuan, M.; Liu, K. Vibration Suppression and Energy Harvesting with a Non-traditional Vibration Absorber: Transient Re-sponses. Vibration 2018, 1, 105–122. [Google Scholar] [CrossRef]
  18. Chen, T.; Lou, J.; Ren, Z.; Wei, Y. Optimal Switching Time Control for Suppressing Residual Vibration in a High-Speed Macro-Micro Manipulator System. IEEE Trans. Control Syst. Technol. 2021, 30, 360–367. [Google Scholar] [CrossRef]
  19. Ji, Z.; Cheng, S.; Lv, Y.; Wang, D.; Sun, W.; Li, X. The Mechanism for Suppressing High-Frequency Vibration of Multiphase Surface Permanent Magnet Motors via PWM Carrier Phase Shifting. IEEE Trans. Power Electron. 2021, 36, 10504–10513. [Google Scholar] [CrossRef]
  20. Seto, K.; Maruyama, K. Vibration Engineering, 1st ed.; Morikita Publishing Co., Ltd.: Tokyo, Japan, 2002; pp. 201–232. [Google Scholar]
  21. Badkoobehhezaveh, H.; Fotouhi, R.; Zhang, Q.; Bitner, D. Vibration Analysis of a 5-DOF Long-Reach Robotic Arm. Vibration 2022, 5, 585–602. [Google Scholar] [CrossRef]
  22. Williams, D.; Tagihpour, J.; Khodaparast, H.H.; Jiffri, S. Linear Control of a Nonlinear Equipment Mounting Link. Vibration 2021, 4, 679–699. [Google Scholar] [CrossRef]
  23. Brock, J.E. A Note on the Damped Vibration Absorber. J. Appl. Mech. 1946, 13, A284. [Google Scholar] [CrossRef]
  24. Boris, G.K.; Leonid, M.R. Dynamic Vibration Absorbers: Theory and Technical Application; John Wiley & Sons: Hoboken, NJ, USA, 1993; pp. 7–16. [Google Scholar]
  25. Nishihara, O.; Matsuhisa, H. Design of a Dynamic Vibration Absorber for Minimization of Maximum Amplitude Magnifi-cation Factor: Derivation of Algebraic Exact Solution. Trans. Jpn. Soc. Mech. Eng. Ser. C 1997, 63, 3438–3445. [Google Scholar] [CrossRef]
Figure 1. Schematic diagram of the 2-DOF system that consists of main mass, sub-mass, and viscoelastic bodies.
Vibration 06 00025 g001
Figure 2. Schematic diagram of the 2-DOF system with a viscoelastic body and a spring installed in parallel in the main mass.
Vibration 06 00025 g002
Figure 3. Relationship between the transmissibility TM, natural frequency ratio, and mass ratio μ   ( α = 0.05 ,   ε 1 = 0.07 ,   and   ε 2 = 0.17 ) .
Vibration 06 00025 g003
Figure 4. Resonance curve of 2-DOF system without the loss factor in the main system (α = 0.07, μ = 0.1).
Vibration 06 00025 g004
Figure 5. Resonance curve of optimally designed 2-DOF system.
Vibration 06 00025 g005
Figure 6. Resonance curve of 2-DOF system with the loss factor in the main system (α = 0.07, μ = 0.1, and ε 1 = 0.1). (a) Resonance curves of the three loss coefficients obtained from the proposed model; (b) Resonance curve obtained in the vicinity of point P; (c) Resonance curve obtained at point Q; It can be confirmed that the three obtained resonance curves do not overlap at points P and Q.
Vibration 06 00025 g006aVibration 06 00025 g006b
Figure 7. The resonance curve of 2-DOF system applying the optimum parameters (μ = 0.05, ε 1 = 0.1, αopt = 0.05, and ε 2 o p t = 0.276).
Vibration 06 00025 g007
Figure 8. Comparison of resonance curves without and with the proposed method.
Vibration 06 00025 g008
Figure 9. Relationship between the subsystem loss factor, ε 2 , and optimized mass ratio (ε1 = 0.1, and α = 0.05).
Vibration 06 00025 g009
Figure 10. Photograph of the experimental apparatus of 2-DOF system.
Vibration 06 00025 g010
Figure 11. Photograph of the viscoelastic body, which was αGEL, made by Taica Corporation (MN-7).
Vibration 06 00025 g011
Figure 12. Photograph of the vibration generator.
Vibration 06 00025 g012
Figure 13. The resonance curves obtained from transmissibility equation and experimental results.
Vibration 06 00025 g013
Table 1. Parameters of viscoelastic bodies.
Viscoelastic BodyMN-3MN-7
Dynamic spring constant k [N/m]12.7114.1
Loss factor ε0.2030.103
Table 2. Vibration conditions.
ParametersValues
Vibration time [s]120
Frequency [Hz]5–60
Input acceleration [m/s2]1.96
Disclaimer/Publisher’s Note: The statements, opinions and data contained in all publications are solely those of the individual author(s) and contributor(s) and not of MDPI and/or the editor(s). MDPI and/or the editor(s) disclaim responsibility for any injury to people or property resulting from any ideas, methods, instructions or products referred to in the content.

