1. Introduction
Vehicle occupants are exposed to whole-body vibration (WBV) while riding. WBV contributes to the driving comfort but prolonged exposure can cause health problems such as back pain, sciatica, digestive disorders, genitourinary problems and hearing damage, among others. For example, Bovenzi and Hulshof [
1] studied the epidemiologic evidence of the adverse health effects of WBV on the spinal system. In addition, Jao et al. [
2] used fatigue rating to demonstrate that WBV exposure affected the autonomic nerve activities while participants drove a simulator. From the aforementioned studies, concerns are also raised regarding the risk of traffic accidents due to fatigue caused by WBV. Thus, many measures have been investigated to reduce WBV in vehicles. These approaches to reduce WBV in a vehicle focused on the mechanical engineering side, such as the development of components including tires [
3,
4,
5], suspensions [
6,
7] and seats [
8,
9].
In recent years, the number of occupational accidents where workers who were engaged in the road transportation industry fell from heights during loading and unloading after driving has been increasing. In Japan, more than 10,000 work-related accidents annually occur in cargo-handling operations, accounting for 10% of all occupational accidents [
10]. The temporary loss of the workers’ standing-balance abilities is believed to cause these slips, trips and falls of land cargo workers. Hence, some experiments that investigated the effect of WBV on standing balance have been reported. Ahuja et al. [
11] measured the postural stability of truck drivers and identified significant changes in the postural stability due to WBV exposure. In addition, they [
11] advocated the need to investigate the recovery of postural stability after a whole-body exposure. Furthermore, Santos et al. [
12] investigated the standing balance change after WBV exposure at an average acceleration of
under no vibration condition and reported that WBV did not have any effect on the balance. Single-axis excitation was speculated to be one possible cause.
On the other hand, the positive effects of WBV have attracted the attention of researchers in the medical and rehabilitation field. Lee [
13] suggested that WBV in the horizontal direction might be a potential intervention for the improvement of motor function and balance in patients who previously experienced a stroke. Guadarrama-Molina et al. [
14] reported that the combination of conventional therapy and whole-body vibration therapy was significant for the improvement of functional balance status in patients with Parkinson’s disease. Moreover, the beneficial effect of WBV exercise on muscle strengthening, balance and walking exercises in improving the walking ability in the healthy older population has been reported [
15].
Based on the results of these previous studies, it can be assumed that the disturbance of the standing balance due to WBV exposure while in a vehicle is the main cause of slips and falls during loading and unloading works in the land transportation industry. In fact, the Ministry of Health, Labor and Welfare recommends stretching exercises and resting before work because the possibility of slip and fall accidents may increase after driving for a long period [
16]. However, details of these recommendations have not yet been released.
In addition, ISO2631-1 [
17] describes the health effect assessment of the WBV. Considering problems such as low back pain of occupational drivers who drive for long periods, the magnitude of vibration acceleration exposure from
to
has been focused on. However, the relationship between WBV exposure and the loss of standing balance ability, which causes falls and tumbles, is not considered at all in ISO 2631-1.
In the present study, an experiment was performed to investigate the effects of WBV exposure on human static standing balance function. Specifically, participants were exposed to WBV using a driving simulator (DS), and their center of gravity was measured before and after the vibration exposure using a stabilometer. In a previous study [
12], the relationship between vibration exposure and balance ability was not found in a laboratory experiment due to the single-axis excitation. The DS in this study has multimodal environment capabilities with not only a six-axis motion but also visual auditory stimuli. In the experiment, WBV exposure was performed under conditions using the magnitude of vibration exposure and driver and passenger conditions. Subsequently, the degree of recovery of the standing balance of the participants after WBV exposure over time was investigated. Eventually, this study attempted to determine any valuable findings to prepare guidelines such as rest periods after occupational driving to prevent fall injuries.
2. Materials and Methods
2.1. Experimental Outline
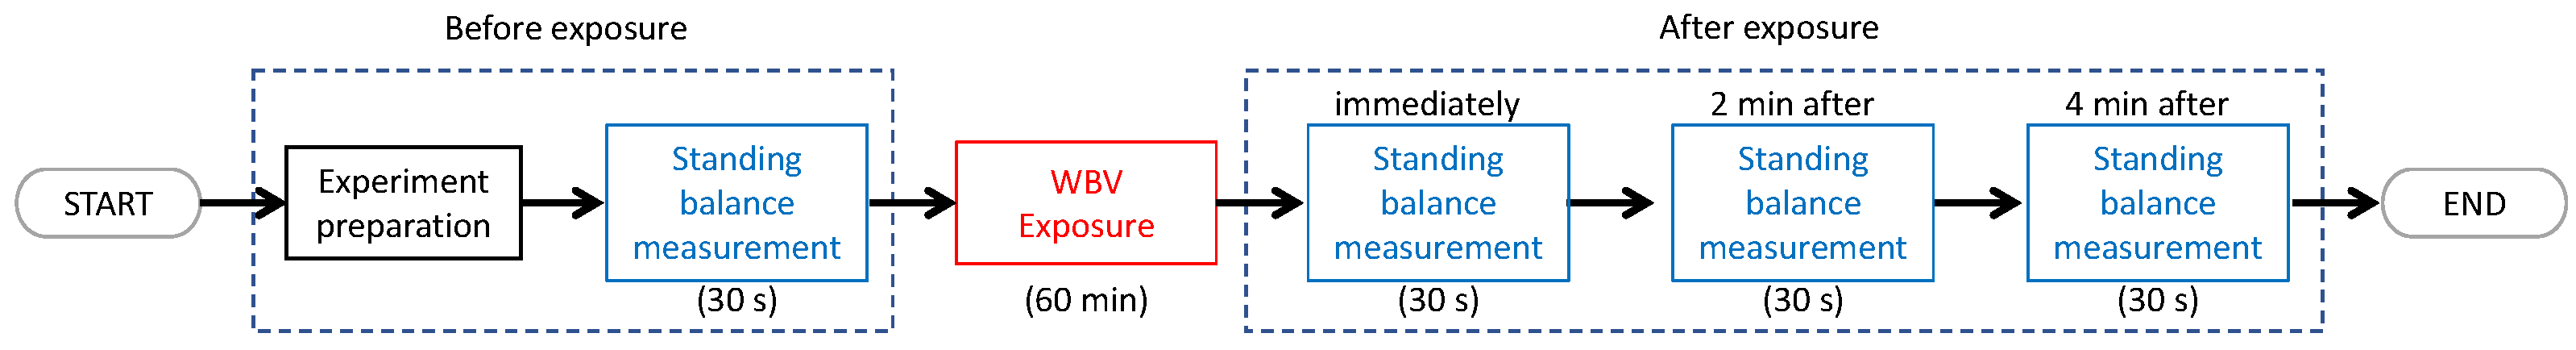
The following illustrates the flowchart of the experiment (
Figure 1). The experiment consists of two processes, namely, WBV exposure and static standing balance measurement.
The static standing balance of the participants was measured before the WBV exposure. The participants were then exposed to WBV for 60 min. Immediately after the WBV exposure, the standing balance function was measured in the same manner as that before the vibration exposure. In this experiment, the standing balance test was also performed at 2 min and 4 min after the vibration exposure to investigate the recovery of the standing balance function. The participants sat to rest during the nonmeasurement time.
2.2. Whole-Body Vibration Exposure
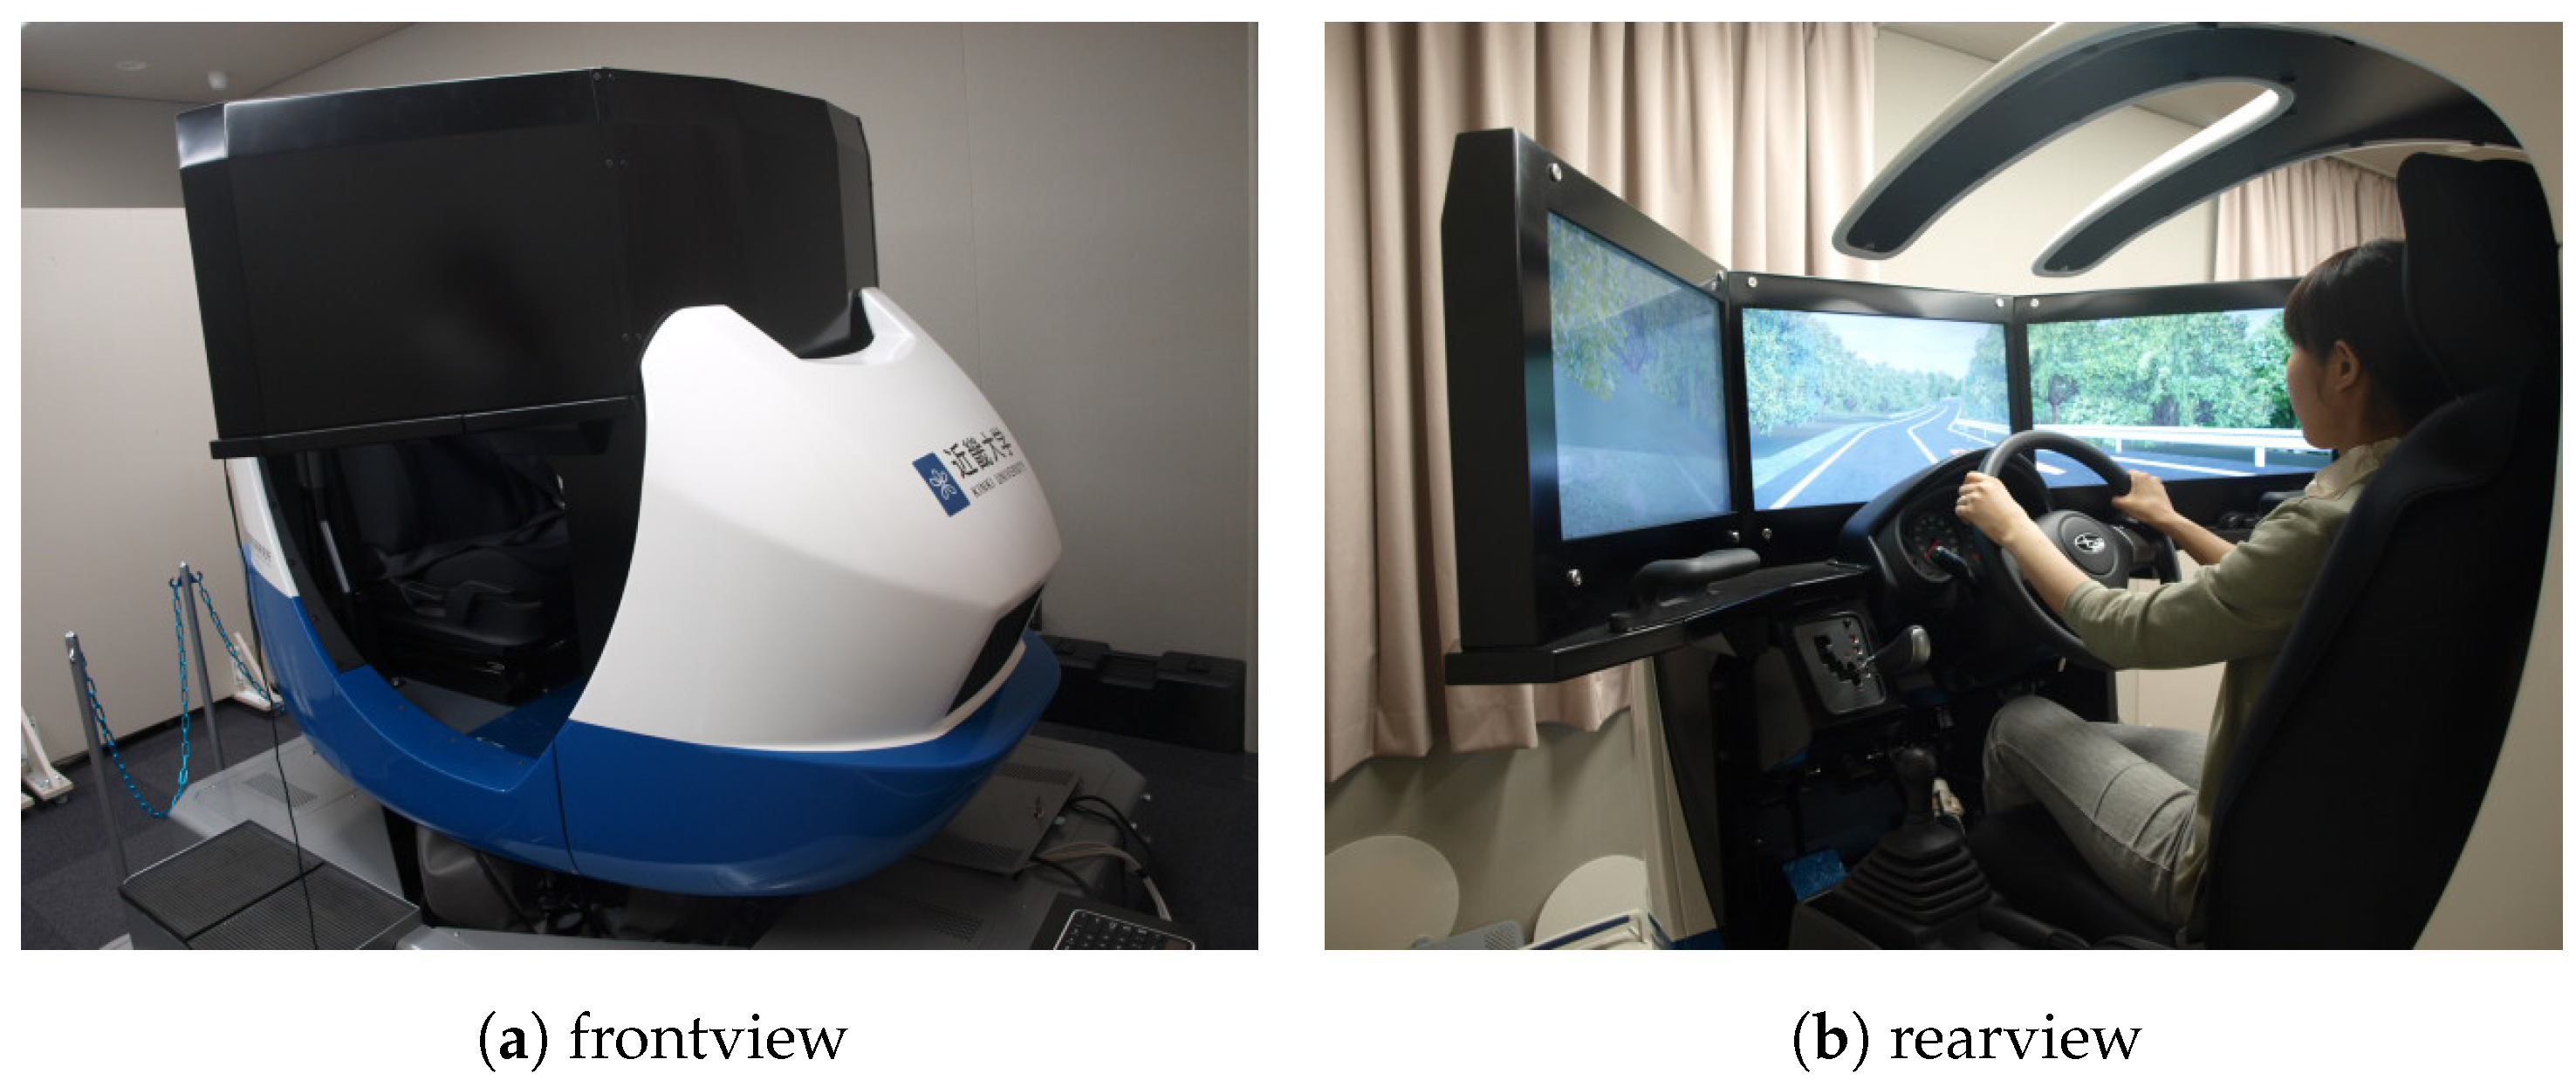
Figure 2 shows the DS used in this study for the WBV exposure of the participants. The moving part of the DS was manufactured by SUBARU CORPORATION, Tokyo, Japan. and is a Stewart platform with six DC motor-driven linear actuators. This mechanism can reproduce three degrees of freedom (DOFs) (
) in the translational direction and three DOFs (roll, pitch, yaw) in the rotational direction. As a result, the participants could feel as if they were driving a real car. Conventional studies using vibrators often reproduce acceleration data that are measured when an actual vehicle travels on a real road surface. In our experiment, the participants were subjected to WBV exposure based on the computational algorithm in the DS control software (UC-Win Road, FORUM 8 Co., Ltd, Tokyo, Japan) [
18].
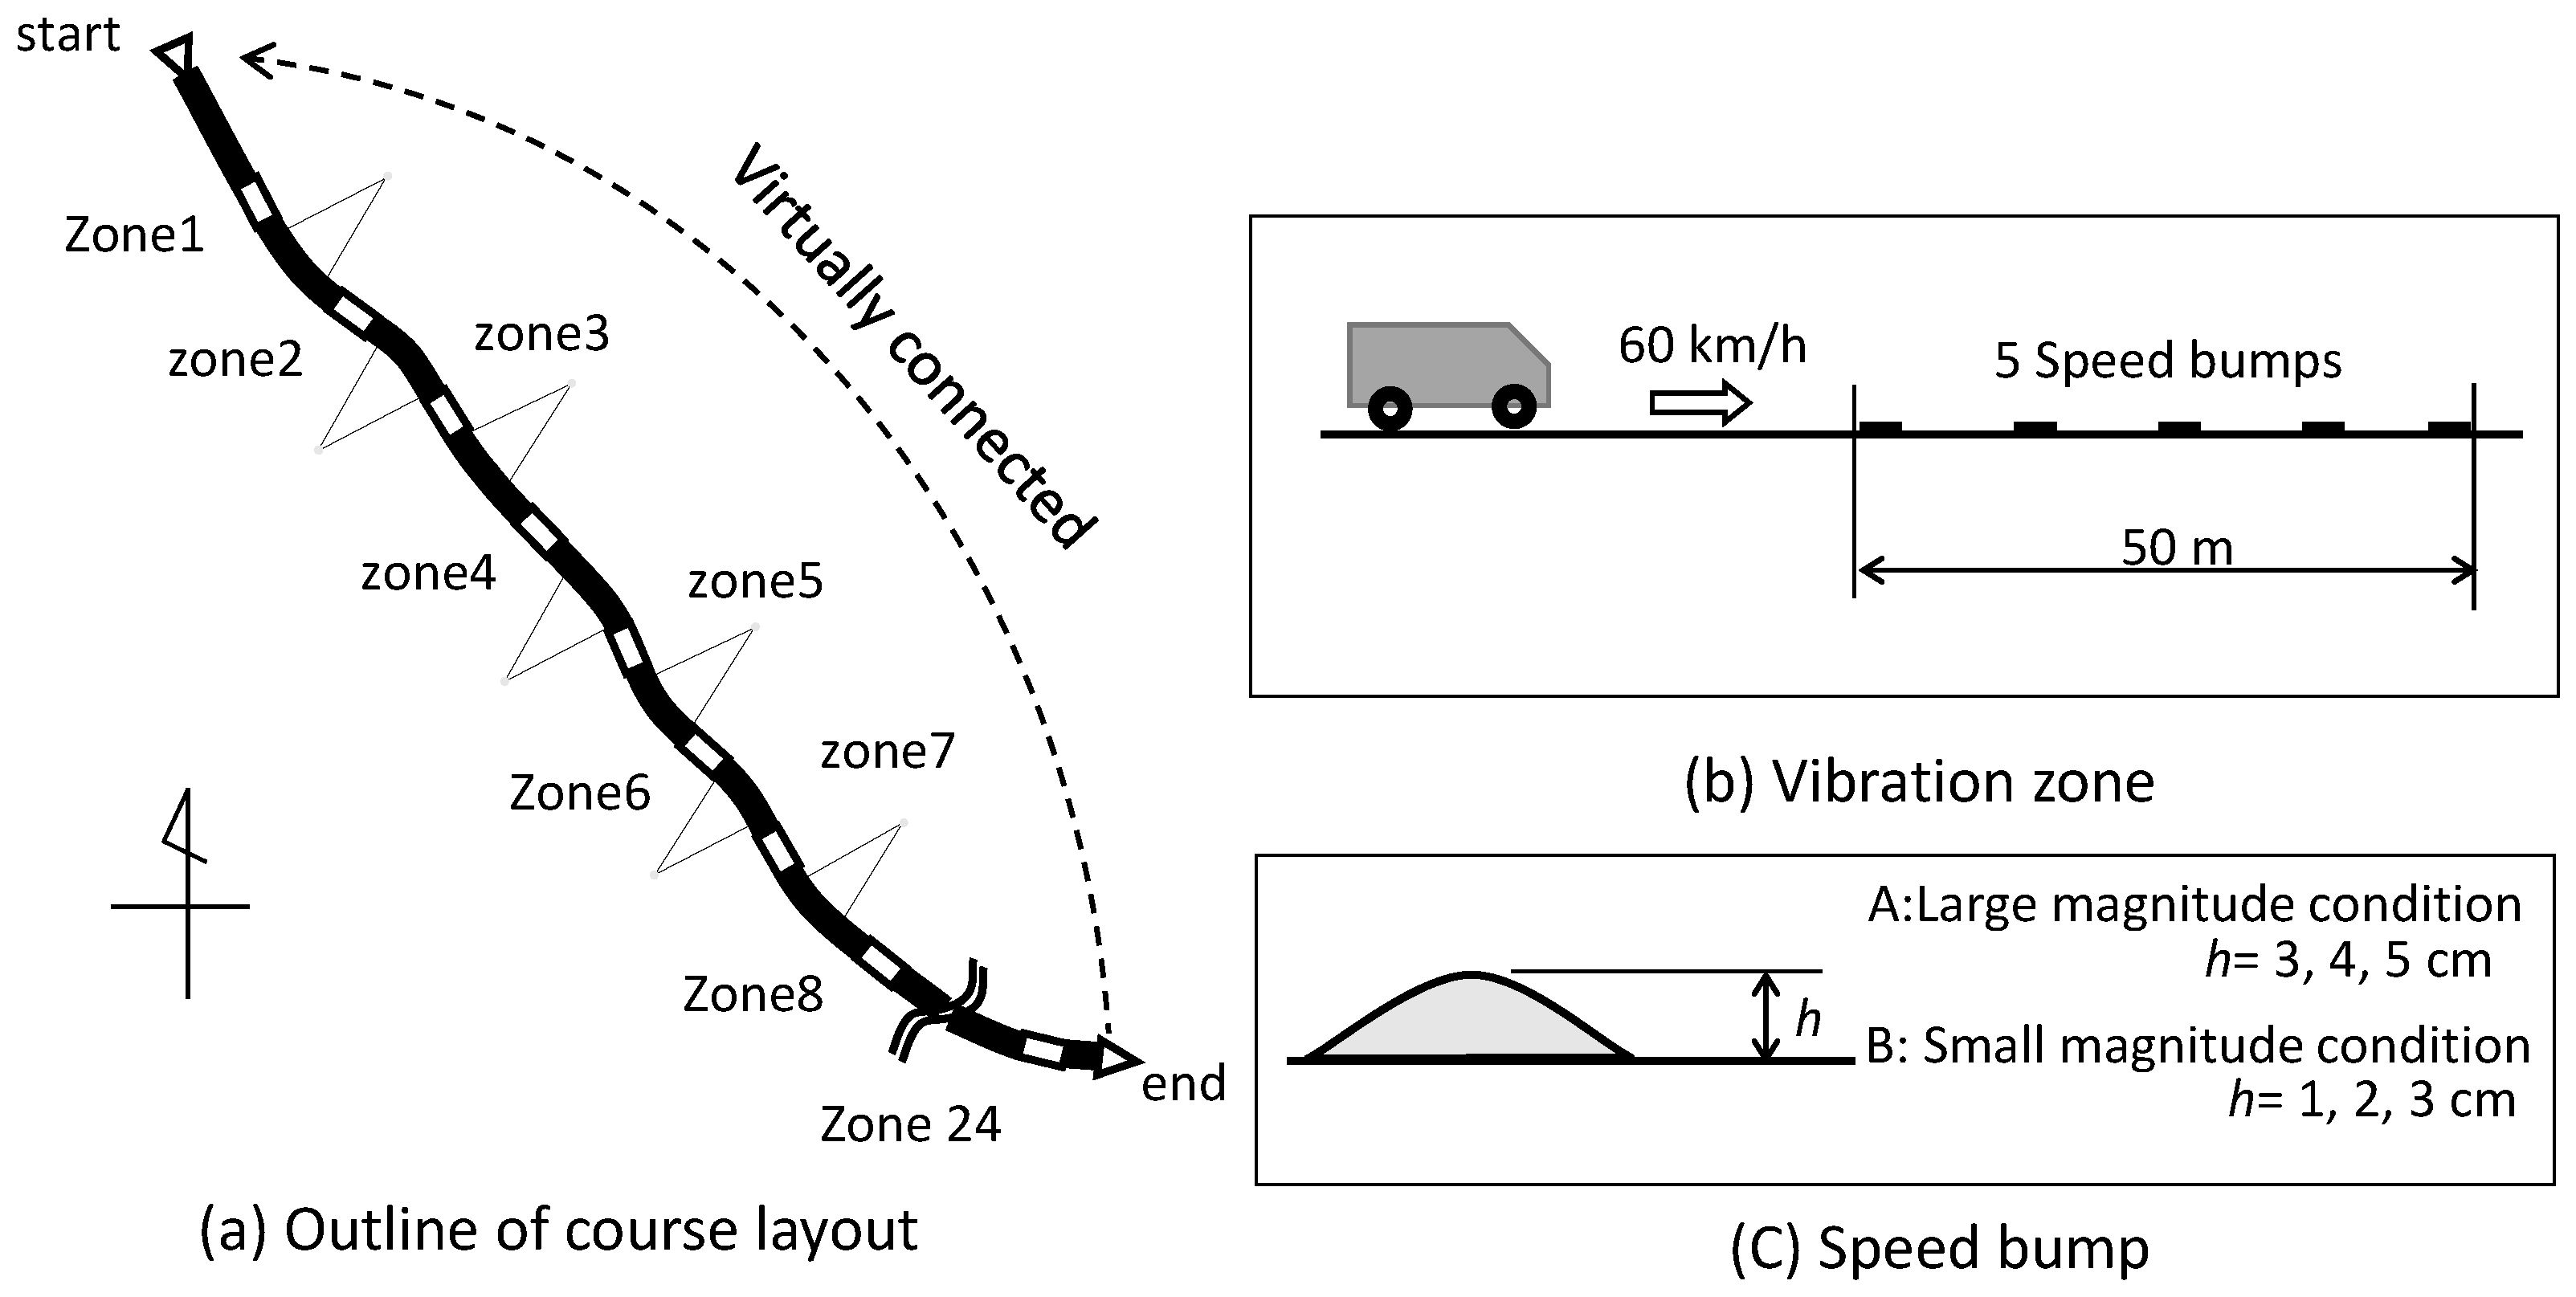
A test course was constructed in a virtual reality space. The course has a total length of approximately
, and was provided with gentle curves to prevent the participants from feeling bored during the experiment. Meanwhile, the vertical alignment was flat with no slope. As shown in
Figure 3, the 24 vibration exposure zones were present on the course and five bumps were placed at
intervals in each vibration exposure zone. Such a course layout was created based on reports that automobile manufacturers have constructed an experimental environment by laying speed bumps or rectangular prisms at some intervals on road surfaces to simulate various WBV exposures [
19]. In addition, the vibration acceleration that was measured in an actual vehicle on the test course was at most 1
[
19]. After performing trial and error in the preliminary experiments by referring to previous studies [
18,
20], five bump heights
h were selected as 1, 2, 3, 4 and 5 cm.
In the experiment, two courses (Courses A and B) with different magnitudes of vibration exposure were prepared. In Course A, where the participants were exposed to a large vibration magnitude, vibration exposure zones with bump heights of 3, 4 and were placed. In addition, the bump heights in Course B were set to 1, 2 and 3 cm to relatively reduce the vibration exposure. In other words, the test courses consisted of three levels by eight repetitions. The vibration exposure zones with three types of bump heights h were placed in the course in a random order for eight repetitions. The start and end points were virtually connected so that they could be used as a circuit.
2.3. Standing Balance Test
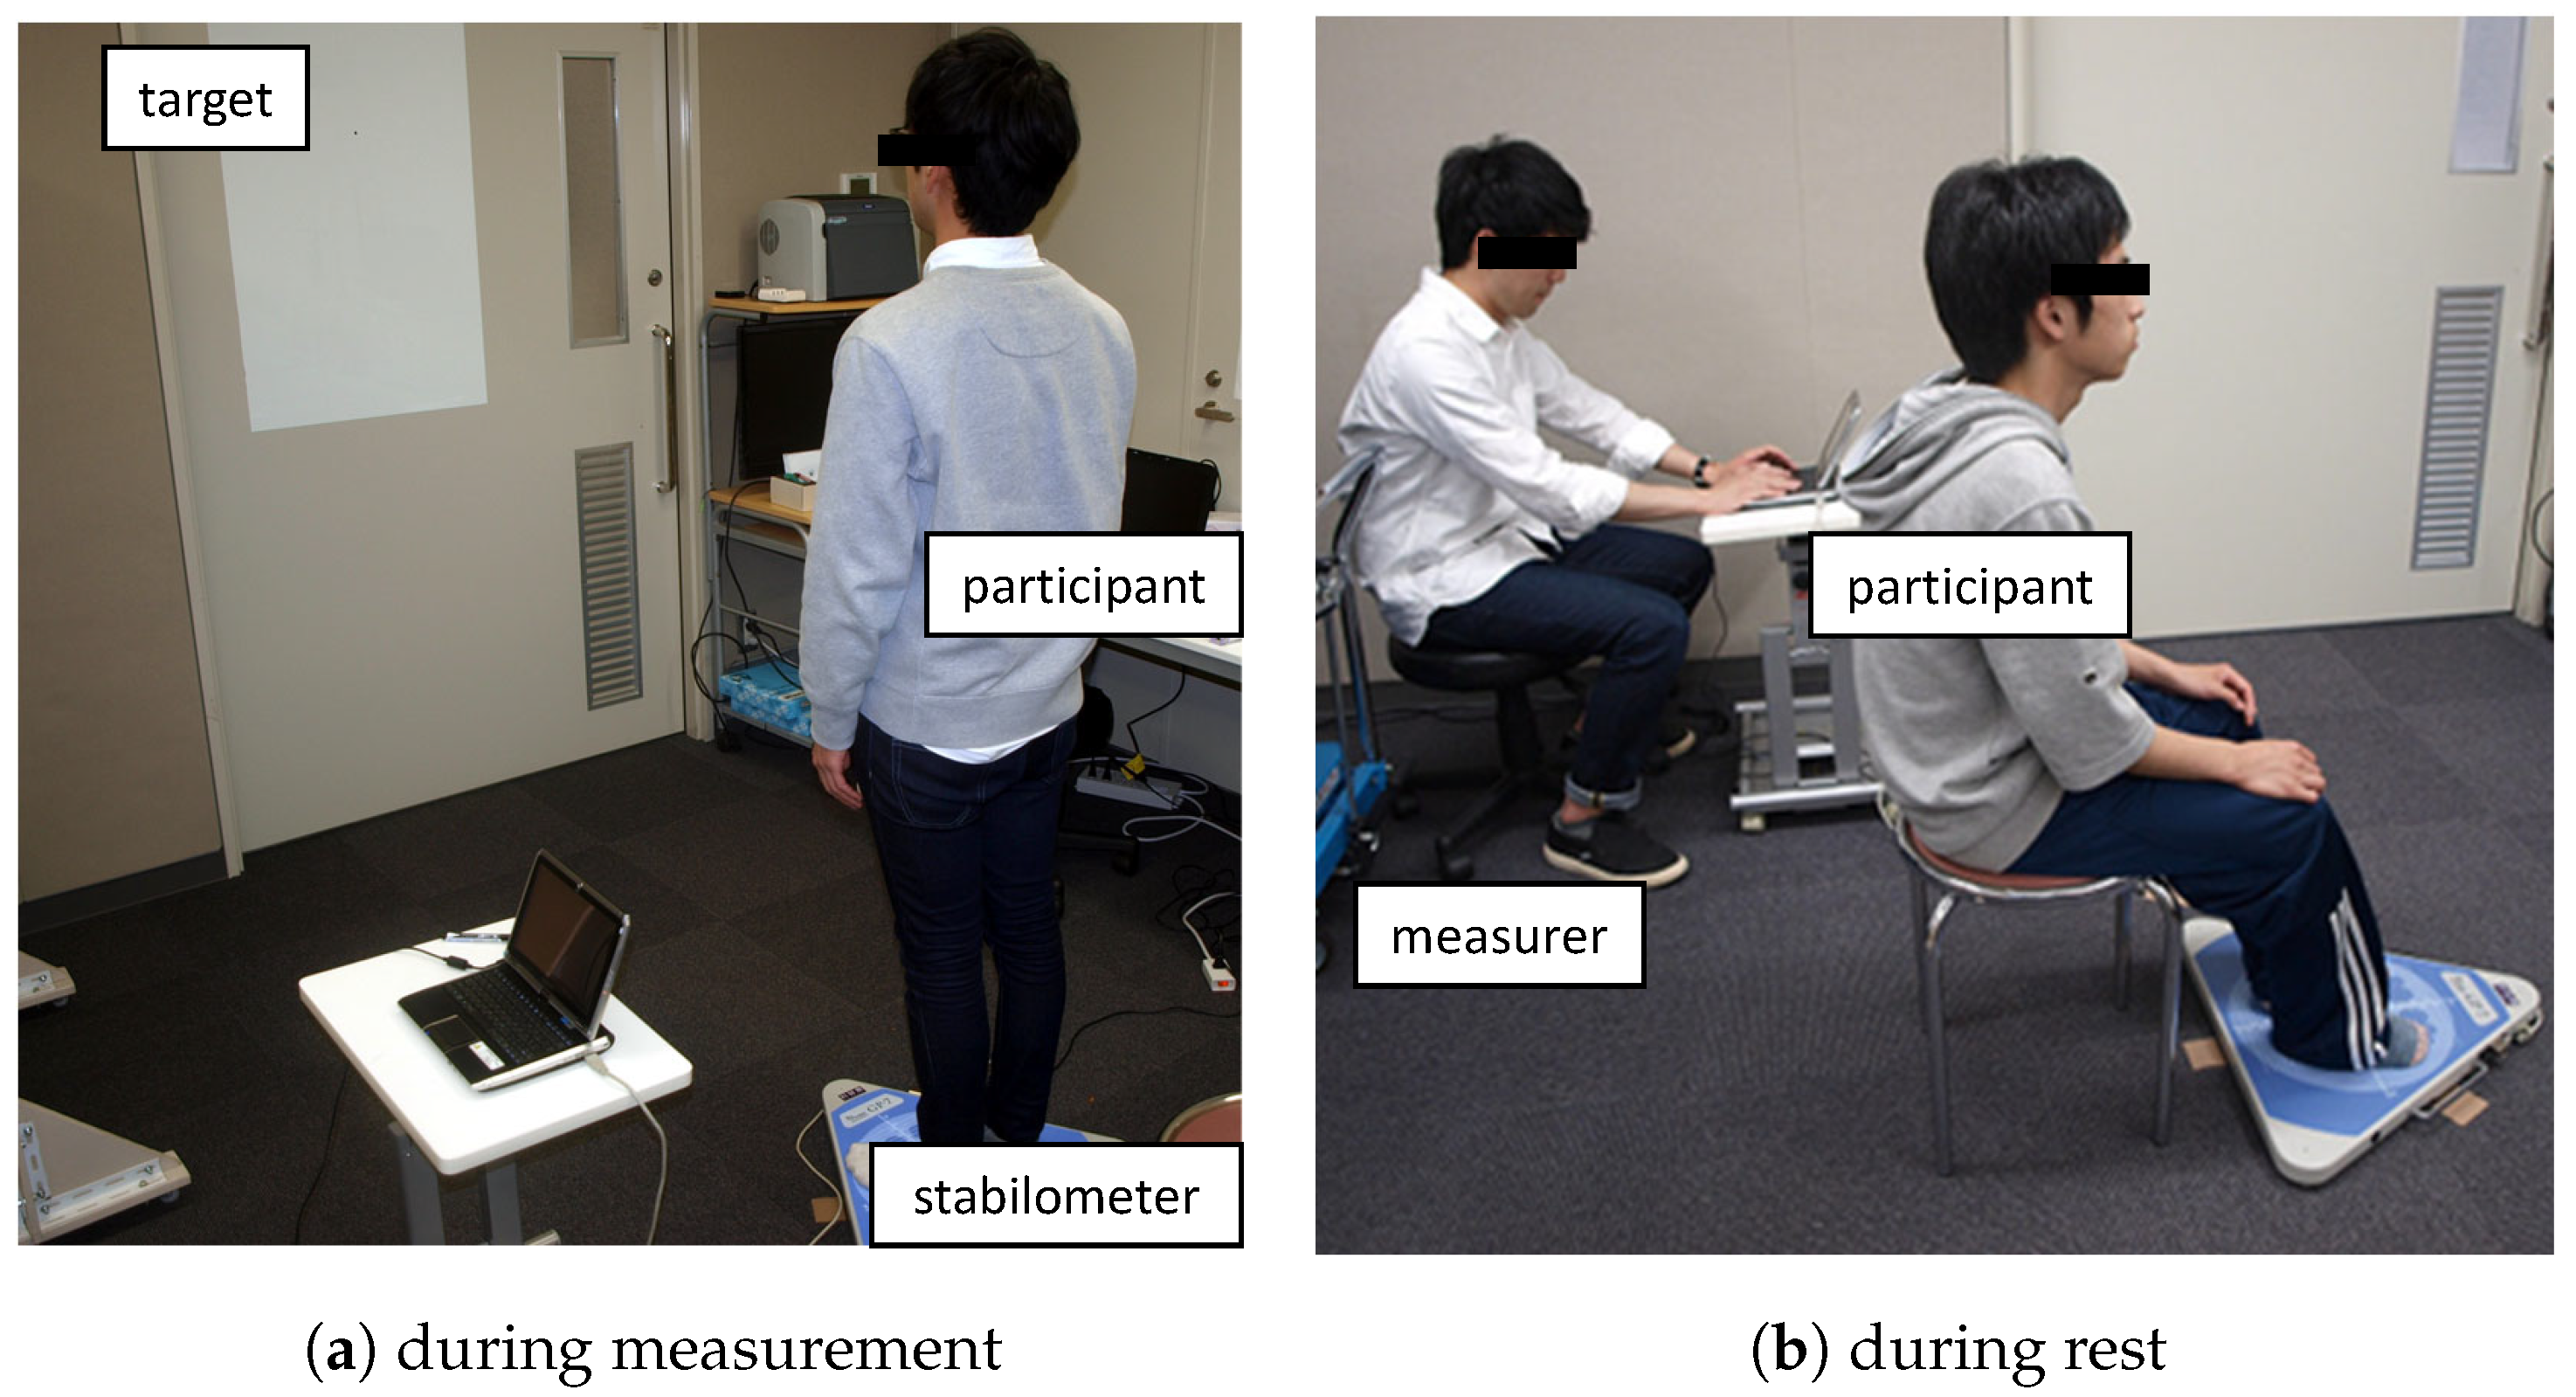
A stabilometer (GP7, Anima Co. Ltd., Tokyo, Japan) was used for the standing balance test in the experiment. As shown in
Figure 4, the participants were asked to stand without a foam rubber on the stabilometer and gaze at a target 2 m away for 30 s with open eyes. The participants sat during the nonmeasurement period.
2.4. Vibration Measurement
Three axes of seat surface translation must be measured from the evaluation of the WBV exposure from the viewpoint of the health effect [
17]. In this experiment, a triaxial human exposure meter (VM-54, RION Co., Ltd., Tokyo, Japan) and an accelerometer (Type 4515-B, Brüel & Kjær, Nærum, Denmark) were used to measure the translation vibration acceleration on the seat surface. Here a program for the WBV measurement was preinstalled in the human exposure meter, and the frequency weighting specified in ISO 2631-1 was automatically applied to the acceleration data in each axis (
x-axis:
,
y-axis:
,
z-axis:
). As a result, the weighted rms acceleration was obtained as expressed in the following equation.
where
Furthermore, the health effect was assessed using the highest rms value of the weighted acceleration among the determined values of the three directional components by considering the coefficients (x-axis: , y-axis: , z-axis: ).
2.5. Experimental Condition
The experiment was designed to investigate the effect of vibration magnitude and task difference when riding on the participants’ standing balance. Thus, the following five conditions were prepared, as presented in
Table 1.
In this experiment, two situations were assumed, in which the participants rode not only as the driver but also as the passenger. Therefore, an external controller was connected to the DS so that the experimenter could operate the vehicle. Four conditions were established by multiplying the vibration magnitude and driver and passenger conditions. The fifth condition was established as a control in which the participants were not exposed to vibrations.
2.6. Experimental Procedure
The experimental procedure was described as follows:
Before the experiment, the purpose and outline of the experiment were explained to the participants and their consent to participate was obtained. In addition, the participants were asked for their profile (age, height, weight and whether or not they had a driver’s license). Their responses were recorded.
The participants were asked to sit in the DS and to adjust the seat to a comfortable driving position. This instruction was also given in the nondriving condition because the passenger seat in commercial vehicles, which are focused on in this research, cannot be adjusted widely.
The participants were asked to practice driving to get familiarized with the DS operation. During this practice run, the participants were instructed to drive at a speed of 60 km/h, which was the same as the experiment instructions.
The standing balance of the participants 30 s before WBV exposure was measured using a stabilometer.
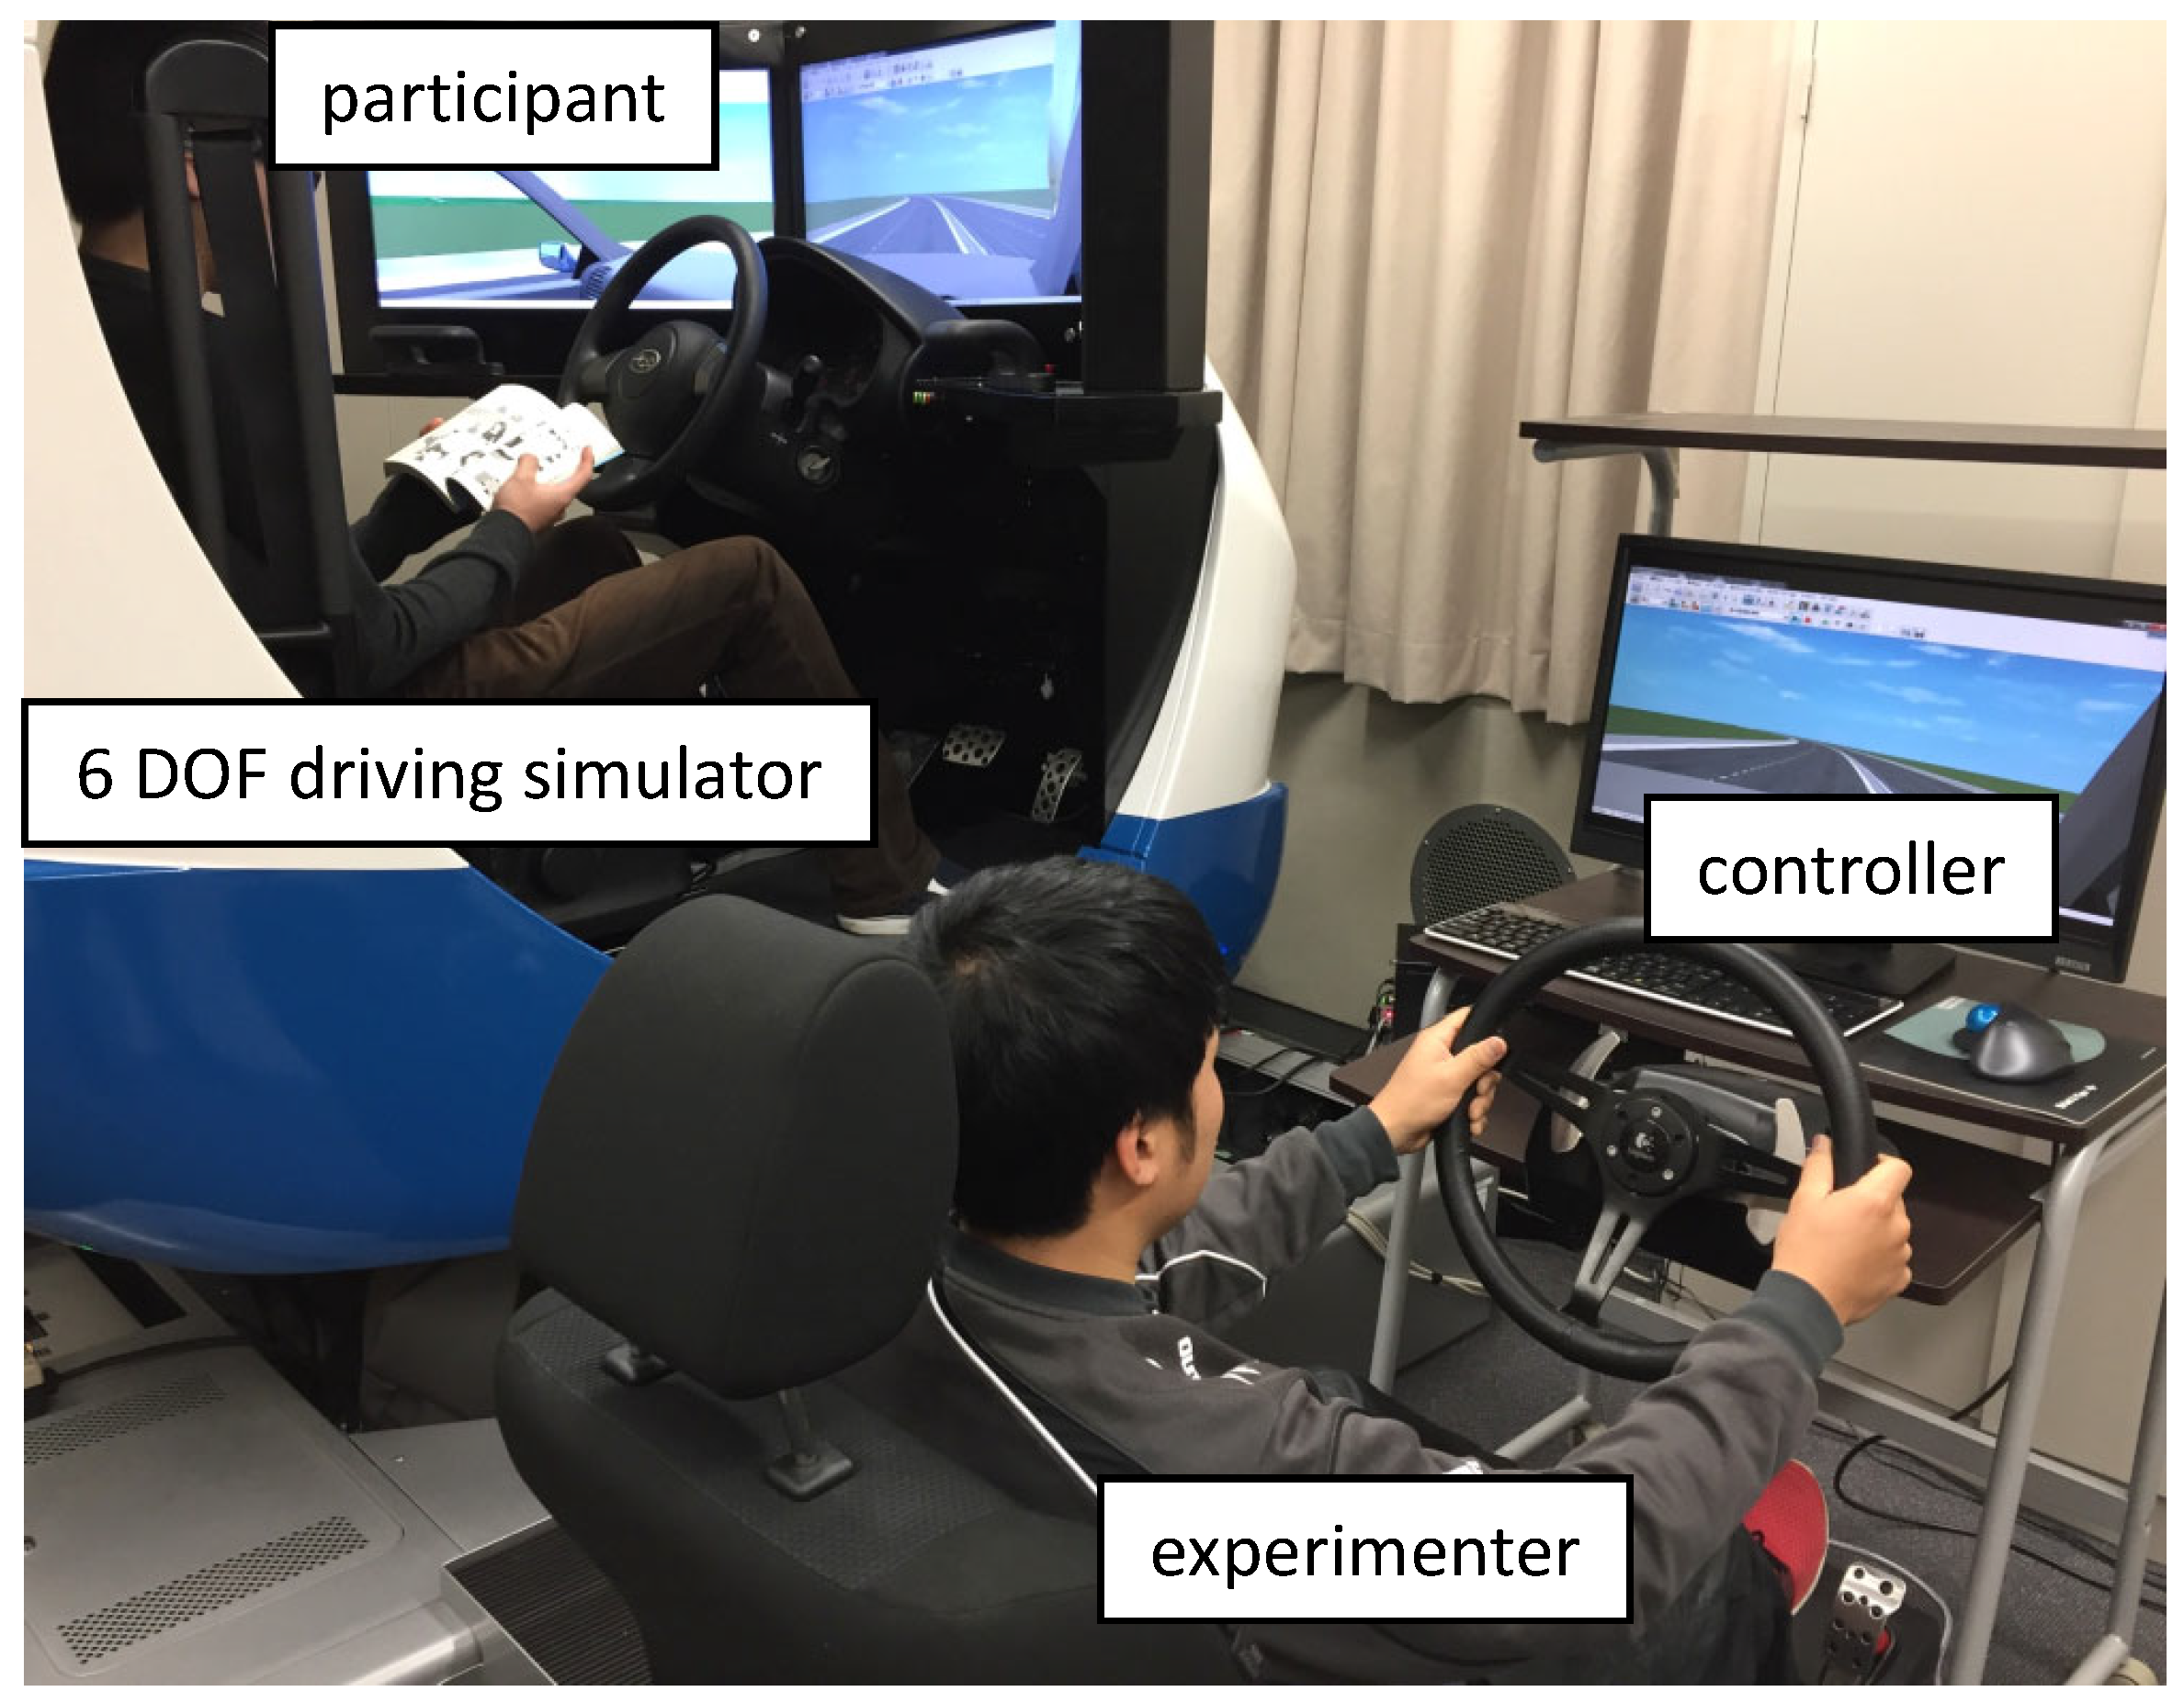
After confirming that the participants had no more questions, the experimental environment was fixed according to the order that was previously determined for each participant. Experimental driving at a travelling speed of 60 km/h was then started. Since this study aimed to investigate the effects of WBV exposure on standing balance, the scenarios during driving were not complex. Therefore, the participants paid less attention to the environment than the actual driving. Here, under the nondriving condition, a reading task was given to the participants instead of the driving task, and the experimenter operated the DS using an external controller, as shown in
Figure 5.
After the participants were exposed to WBV in the DS, their standing balance function was measured in the same manner as that before the exposure. Measurements were performed immediately after exposure to the vibration, after 2 min and after 4 min to investigate the recovery of the standing balance function. The measurements were set after 2 and 4 min because it was found that the balance ability tended to recover at 5 min after exposure to vibration in preliminary experiments. The participants then sat on chairs to rest, except during the measurement time.
An accelerometer was placed on the seats where the participants were seated to measure the triaxial vibration acceleration. The participants again experienced being driven at a speed of and the vibration acceleration was measured for one lap of the course. As previously mentioned, because the course length was approximately , the measurement time was approximately .
2.7. Participants
The participants consist of ten healthy male university students with regular driver’s licenses.
Table 2 lists the profiles of the participants in the experiment. Their ages were between 21 and 23 years with a mean of 21.7 ± 0.8 years. Because vibration acceleration is known to depend on body size, their height and weight were obtained to calculate their body mass index (BMI). The mean BMI was
. In accordance with the World Health Organization criteria [
21], three of the ten participants were classified as underweight, two as overweight and one as obese. The mean number of years of driving experience was
years. Three participants drove almost every day to school, one drove only on weekends and six drove when they went home to their parent’s houses. No participants were occupational drivers in the transportation industry. In addition, those who suffered from low back pain were excluded. The approval from the Bioethics Committee of the Faculty of Engineering, Kindai University (approval number: KUBE1404), was obtained before the experiment was designed. A gratuity was paid to each participant according to the hours spent in the experiment to provide benefit to the participants and ensure reliability of the experimental data.
3. Results
3.1. Whole-Body Vibration Exposure
As shown in the experimental protocol, after the DS riding was performed to measure the standing balance, the participants were asked to carry out another riding to measure the vibration acceleration. In the DS, if each riding with equal travel speed could be reproduced, the vibration exposed to the participants through the seat might be almost the same. Although the approximate exposure values in the preliminary experiment were known, the acceleration of each participant was measured as a reference value.
Table 3 lists the summary of the vibration total value. The mean values on the large magnitude course and the small course were approximately
and
, respectively. The results were similar to those of the preliminary experiment, but a variation in the values among the participants was observed. Two standard deviations were then used to evaluate the vibration total value of the weighted rms acceleration. As a result, the vibration total value, when the participant P03 experimented with the driver condition on a large magnitude course, was an outlier. When the acceleration in each axis was reviewed, it was found that the acceleration in the sway axis was greater than that of the other participants. It was guessed that the sensor was laterally displaced from the center of the buttocks.
A two-way analysis of variance (ANOVA) was performed to analyze the effect of the course condition and type of task while travelling on the vibration total value. Here, the possibility that P03 was exposed to more magnitude of vibration than the other participants in the experiment could not be ruled out completely. In this discussion, the data of P03 were excluded. As a result, the course condition induced a statistically significant effect on the vibration total value . Meanwhile, the task while travelling and interaction did not exhibit a statistically significant effect . These results indicate that the participants were exposed to an equal magnitude of vibration in both the driver and passenger conditions. On the other hand, the results of ANOVA when the P03 data were included also showed significant differences in the course factor. In any case, statistically, these results show that the participants were clearly exposed to different magnitudes of vibration acceleration on the two courses.
Whereas the statistical analysis showed significant differences under the course conditions, no significant differences were observed under the driving conditions. Although a few previous studies have compared the vibration acceleration of the driver and the front passenger seat, no difference was found between the vibration acceleration in the driver and the front passenger seat in measurements in actual vehicles [
19]. However, from the comments collected from the participants after the experiment, they felt tired associated with the accelerator pedal operation during the driving conditions. In the experiment by Smith et al. [
22], many participants reported ankle discomfort after a long riding time. They then said that adjusting the spring force of the pedal could reduce the degree of discomfort. Here, the accelerator pedal of the DS used in the experiment was the same as a real automobile.
3.2. Standing Balance Test
Figure 6 shows the statokinesigrams recorded during the standing balance tests for participant 01 under Condition 3 as a measurement example. The statokinesigram is a graphical representation of the trajectory of the center of pressure on the plate surface of the stabilometer. In the figure, the
x-axis and
y-axis mean longitudinal and transverse directions, respectively. The unit of each axis is centimeters. The four statokinesigrams show the results before the WBV exposure, immediately after exposure, 2 min after exposure and 4 min after exposure, respectively. From the data of each participant, many indicators could be derived, including the total length (
), rectangular area, enveloped area (
) and root mean square. In recent related studies, Oshima et al. [
23] used the unit locus length (
) and envelop area (
) to evaluate standing balance ability. Tanaka et al. [
24] then used the total track length (
), envelope area (
) and rectangular area (
) to evaluate the postural balance. Referring to these literature studies, this study focused on two indexes of
and
.
3.2.1.
The total trajectory length (
) is an indicator of the standing balance and represents the total length of the center-of-gravity point moved during the measurement time. The instantaneous moving distance
is calculated with the measured center-of-gravity data
. The
can then be obtained by integrating
over the measurement time.
Table 4 lists the
of all participants under each experimental condition. These results illustrated that the
was distributed in the range from 10 to 60 cm. Overall, it was found that the
data after WBV exposure were greater than those before the WBV exposure and the
values gradually decreased with time after the WBV exposure. As mentioned earlier, this experiment aimed to investigate the effect of WBV exposure on the standing balance of vehicle occupants.
The responses and thresholds of the participants in the experiment often vary depending on a variety of factors, even if the experimenter controls them. It is said that a single index cannot clearly evaluate the standing balance of participants because it varies not only from individual to individual but also within individuals depending on their physical condition and fatigue. Therefore, changes before and after stimulus exposure under experimental conditions, such as the temporary threshold shift, have been used as an index [
25,
26]. In this paper, the rate of change in the
before and after the WBV exposure was calculated. When the
before and after the WBV exposure are
and
, the rate of change
could be calculated using the following equation.
The value
t represents the elapsed time after the WVB exposure. The index is dimensionless because it represents the ratio between exposure and after exposure, and when this value becomes one, it means that the
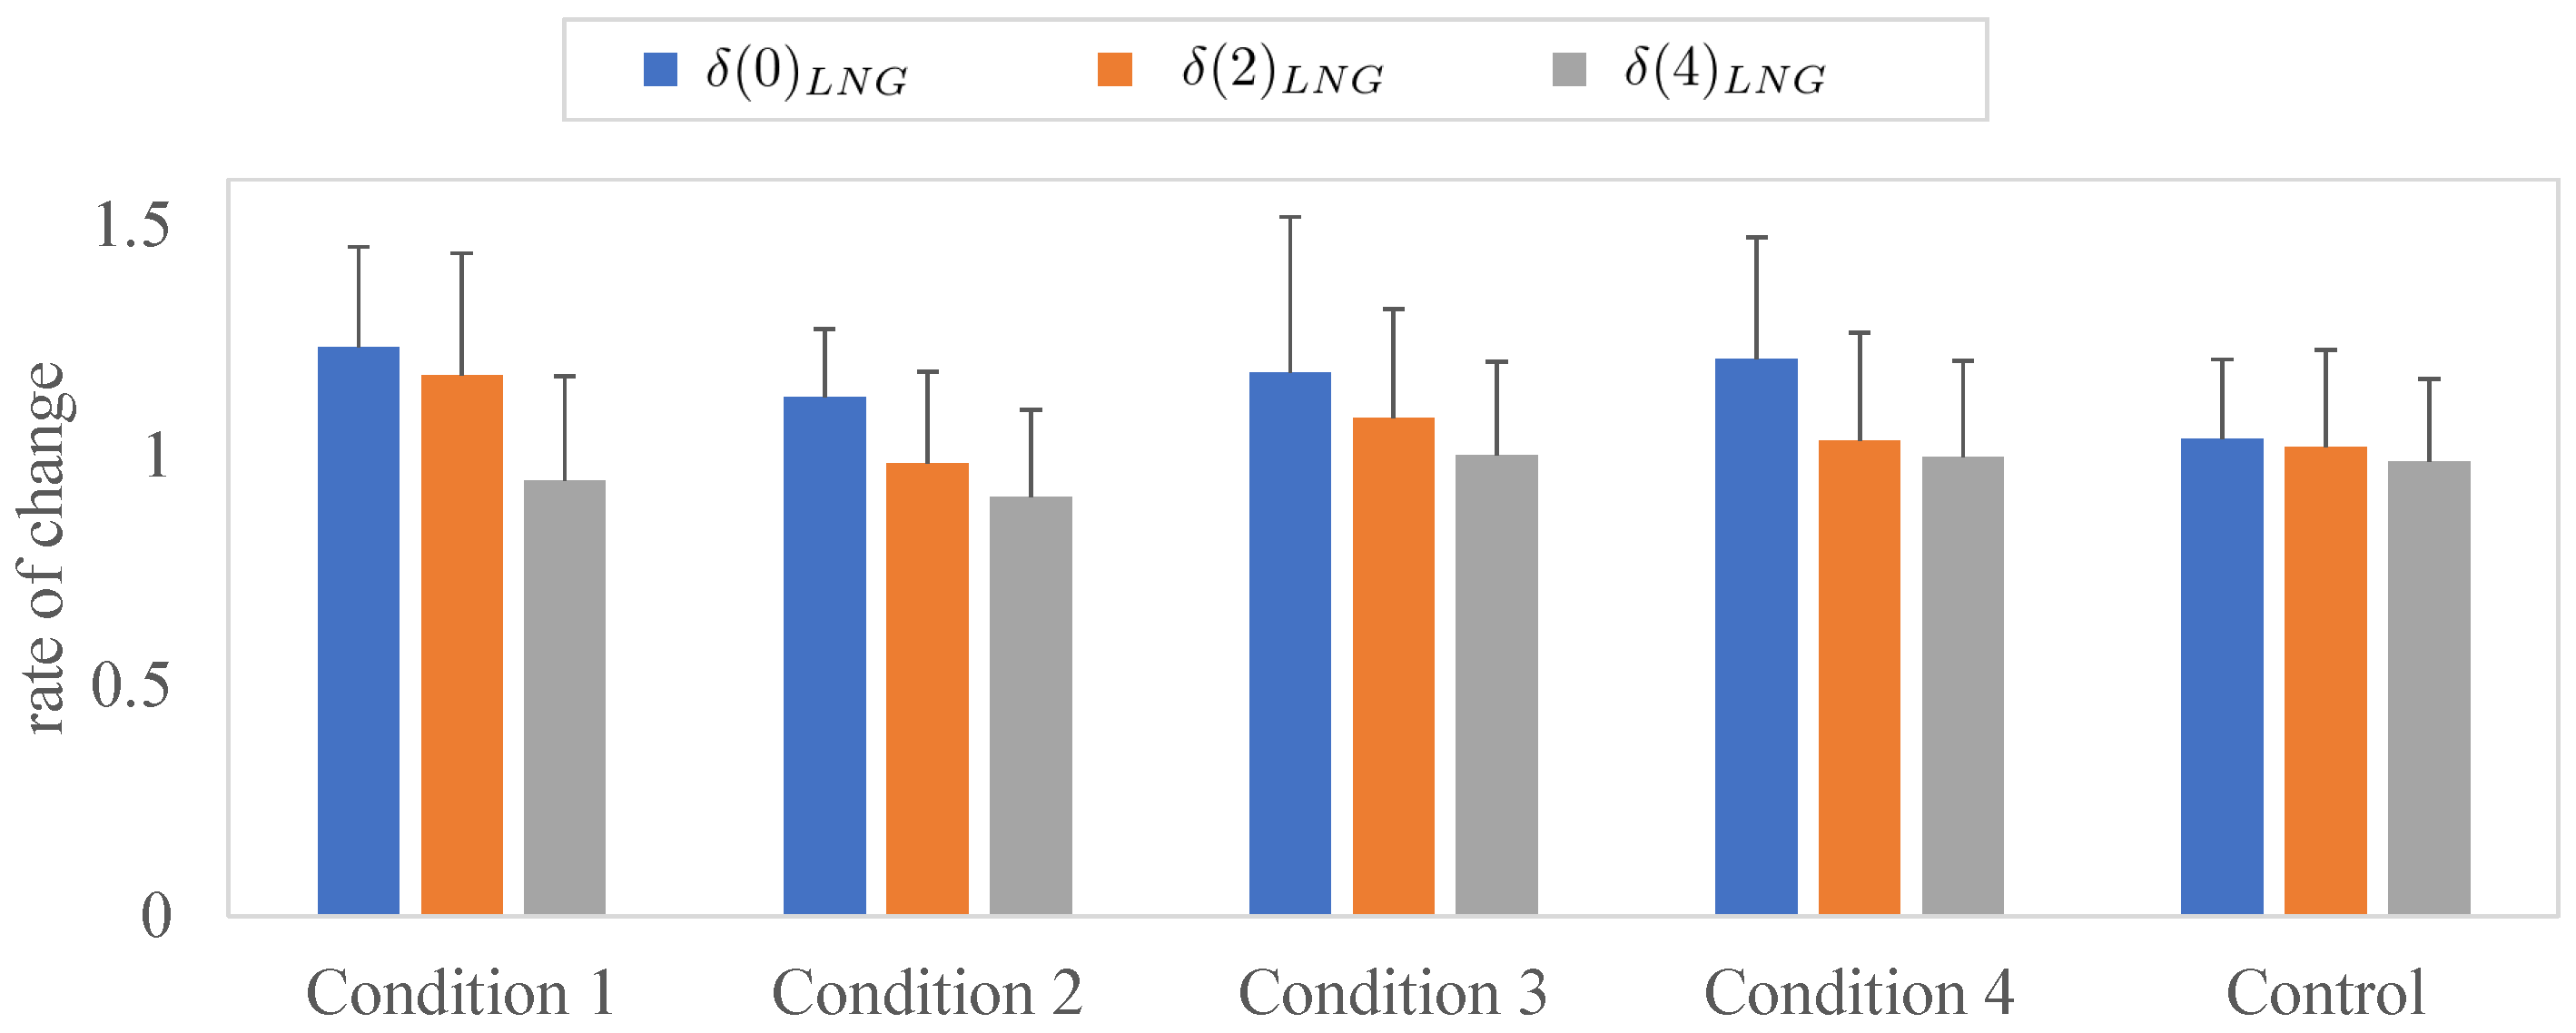
is the same as before exposure. A bar graph was drawn with the mean values of the rate of change
, as shown in
Figure 7. As shown in the diagram, the rate of change under the control condition, in which no participant was exposed to WBV, remained unchanged at approximately 1.0. On the other hand, the rate of change immediately after the whole-body exposure was the highest under Conditions 1–4 and it gradually decreased. These differences suggest that the WBV exposure exerted some effects on the standing balance abilities of the participants. A comparison of the results of Conditions 1–4 demonstrated that the rate of change immediately after exposure under Condition 1 was the largest. In addition, the rates of change after 2 min under Conditions 1 and 3 (driver conditions) became higher compared to those under Conditions 2 and 4 (passenger conditions).
A two-way ANOVA was performed to analyze the effect of the experimental conditions and elapsed time on the for reference due to the small sample size. As a result, whereas the experimental conditions showed no statistically significant effect , the elapsed time exhibited a statistically significant effect on . Subsequently, multiple comparisons were performed to analyze the main effect of the elapsed time. Significant differences were found between b1 (immediately after exposure) and b2 (2 min after exposure), b2 and b3 (4 min after exposure), and b1 and b3. Meanwhile, the interaction demonstrated no statistically significant effect .
3.2.2.
The enveloped area () is the area enclosed by the outermost center-of-pressure points in the statokinesigram. The calculation algorithm for the is as follows.
The origin of the statokinesigram
was defined by the mean value of the
x and
y axes.
The radial lines were drawn in 3-degree increments around the origin and the enveloped area was divided into 120 subregions.
In each subregion, the point with the longest distance from the origin was found.
The area of the triangle
was composed of two adjacent points (
and
) and the origin was calculated with Heron’s formula. In this case,
was
.
Finally, the sum of
became the
.
Table 5 lists the calculated values of the
. The
value of the participants before and after WBV exposure significantly differed.
In the
analysis, the rate of change in the
before and after the WBV exposure was also calculated. When the
before and after the WBV exposure are
and
, the rate of change
could be calculated using the following equation.
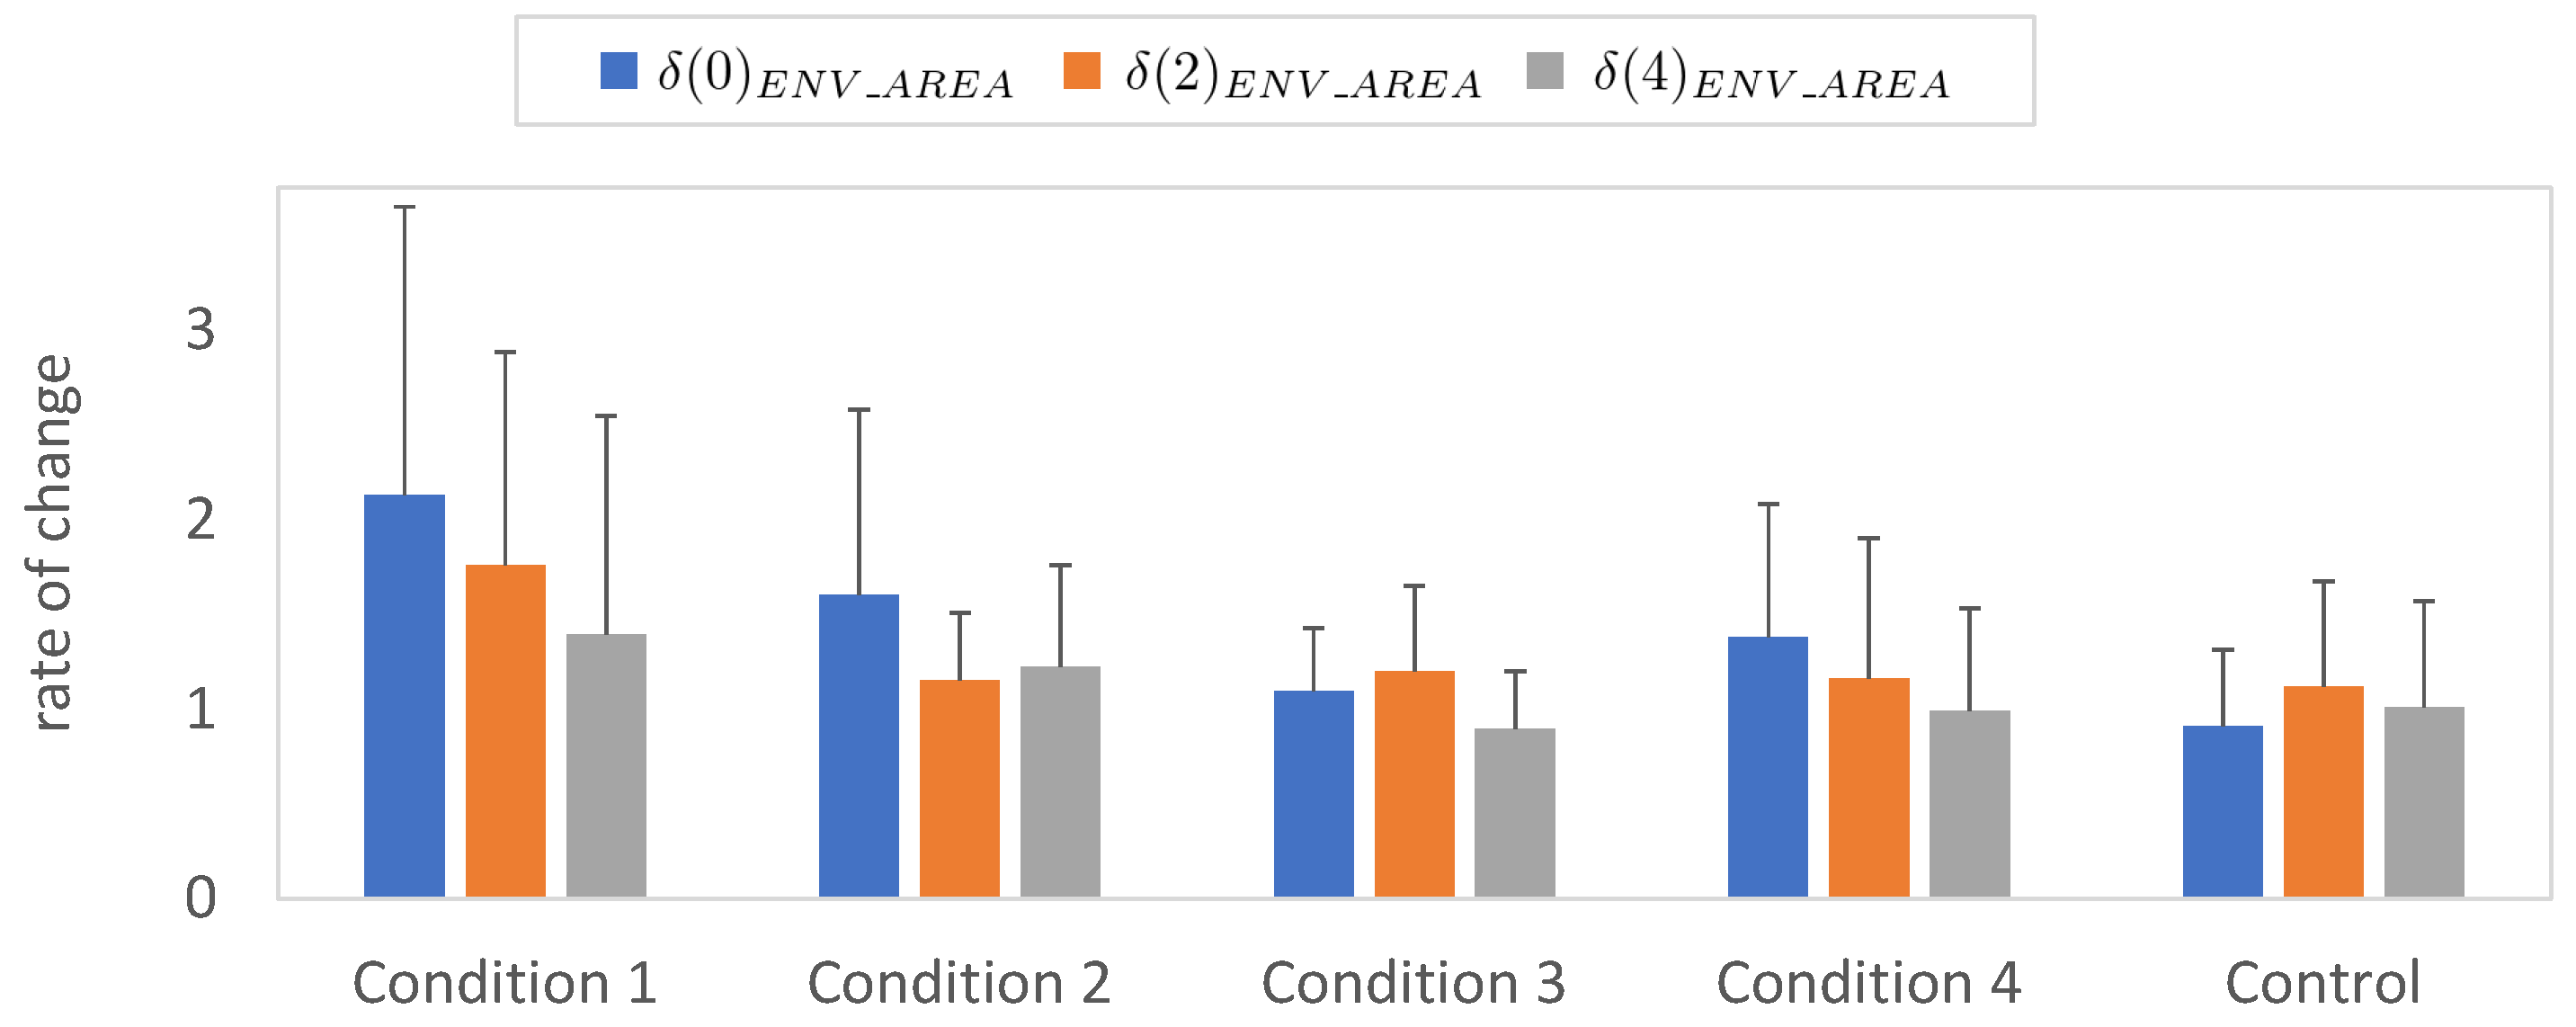
Figure 8 summarizes the mean value of the rate of change.
The results revealed that the rate of change value under Condition 1, in which the participants drove on the course and were exposed to a large vibration magnitude, was more significant compared to that under the other conditions. Specifically, the value immediately after exposure exceeded 2.0 and did not return to 1.0 after 4 min. Under Condition 2, the participants were in the passenger mode and exposed to a large vibration. The value after 4 min was greater than 1.0, suggesting that the effect of vibration exposure remained.
A two-way ANOVA was also performed to analyze the effect of the experimental conditions and elapsed time on . As a result, not only the experimental conditions but also the elapsed time exerted a statistically significant effect on . While multiple comparisons of the experimental condition factors revealed no significant differences, significant differences (p < 0.05) were observed in the elapsed time factor for b1 (immediately after exposure) and b3 (after 4 min). Incidentally, the interaction did not show any statistically significant effect .
4. Discussion
4.1. Conventional Health Effect Assessment
First, the WBV exposure must be evaluated with a conventional method. The daily exposure to vibration (
) is ascertained using the following formula [
27]:
where
is the highest frequency-weighted acceleration determined on any axis on the seat surface
is the maximum acceptable exposure time
is the reference duration of 8 h
is a multiplying factor
(for horizontal vibration (x and y directions), k = 1.4)
(for vertical vibration (z direction), k = 1.0)
By solving
T, the following equation can be obtained.
With regard to daily exposure value
, the upper and lower boundaries were
and
, respectively, based on the health guidance caution zone in ISO 2631-1. Meanwhile, according to the regulation [
27], the exposure limit and action values of WBV are determined as follows:
- (a)
The daily exposure limit value is
- (b)
The daily exposure action value is
Subsequently, the maximum acceptable exposure time (T) was calculated using the action value as daily exposure value and the mean values were listed.
As presented in
Table 6, the conventional health effect assessment is focused on the relationship between the vibration acceleration and the limitation of exposure time. For example, when
T was calculated using the mean
of the large magnitude course, those values of the driver and the passenger conditions were 7 h 48 min and 7 h 12 min, respectively. This might be understood to mean that a ride of fewer than 7 h has almost no effect on health.
Meanwhile, it was confirmed that the indexes of the standing balance changed even after a 1 h ride in this experiment. In other words, considering the prevention of fall accidents due to loss of balance ability, the ISO2631-1 should include any guideline to prevent such accidents in the future.
4.2. Assessment of the Loss of Standing Balance
This work focused on two indexes, namely, and , and considered the rate of change relative to the value before vibration exposure. Although the rate of change remained almost constant at 1.0 in the control condition without vibration exposure, the rate of change varied under the vibration exposure conditions. Specifically, in most cases, the rate of change reached a maximum value immediately after the exposure. Thereafter, the rate of change gradually decreased after 2 and 4 min. As easily predicted in the effect of the different vibration magnitudes on the change in the standing balance, the value of the rate of change under large magnitude vibration conditions was exceeded. This trend was more notable in the .
When the effects under the driver conditions were considered the reduction trend differed between the driver and passenger conditions. Under the driver condition, the rate of change at 2 min after exposure remained high, but that under the passenger condition decreased to almost 1.0. This phenomenon was observed in both
and
. As previously mentioned, no differences were observed in the vibration acceleration measured at the seating surface between the driver and passenger conditions. By considering the comment that the participants experienced tiredness in the right lower limb, it was assumed that the difference between the driving and passenger conditions was due to the accelerator pedal operation. Some studies [
28,
29] have shown that prolonged operation of the accelerator pedal causes fatigue. The results of the present study suggest that fatigue caused by the accelerator pedal operation might have influenced the disruption in the standing balance.
Finally, the recovery of the standing balance was presented. In almost all conditions, the rate of change returned to approximately 1.0 at 4 min after exposure. Thus, it was proposed that a rest period be allowed for the recovery of the standing balance ability. It was found that a suitable rest period might be approximately 4 min in the experiment in which the participants were exposed to vibration at rms for 60 min at the DS. Indeed, it was recognized that reasonable rest periods vary with the duration of the ride, vibration magnitude, vibration frequency, posture, action and so on. More investigations are needed to establish guidelines for preventing slip and fall accidents.
5. Conclusions
Since it was believed that the cause of fall accidents in the land transportation industry is related to the WBV exposure of workers in cars, an experiment was performed to investigate the effects of WBV exposure on the human static standing balance function. In particular, ten participants were asked to ride the DS for 60 min for WBV exposure. In addition, standing balance measurements were performed before exposure, immediately after exposure, 2 min after exposure and 4 min after exposure. In the experiment, four conditions were prepared by combining two-course conditions with different vibration exposures and driver and passenger conditions.
The rate of change of and is calculated as indexes in the standing balance ability. In most cases, the rate of change reached a maximum immediately after exposure and gradually decreased after 2 and 4 min. When the differences in the magnitude of vibration exposure were compared, it was found that the rate of change under large magnitude vibration conditions was more extensive in the results than in the results. With regard to the effects of the driving task, the rate of change at 2 min after exposure was higher in the driver mode. In accordance with the comments of the participants, it was assumed that the difference between the driver and passenger conditions was due to the lower limb fatigue caused by the accelerator pedal operation. Although the experiment was conducted in a limited environment, in which the participants were exposed to vibration at 0.5 rms for 60 min at the DS, the experimental results indicated that several minutes are required to regain the standing balance. Obviously, the standing balance change presented in this study is not considered in the health effects of ISO 2631-1. Therefore, a future study will intend to establish guidelines for preventing slip, trip and fall accidents in the land transportation industry.


