Concept Paper

Towards an Integrated Approach to Wildfire Risk Assessment: When, Where, What and How May the Landscapes Burn

by
Emilio Chuvieco
1,*,
Marta Yebra
2,3,
Simone Martino
4,
Kirsten Thonicke
5,
Marta Gómez-Giménez
6,
Jesus San-Miguel
7,
Duarte Oom
7,
Ramona Velea
8,
Florent Mouillot
9,
Juan R. Molina
10,
Ana I. Miranda
11,
Diogo Lopes
11,
Michele Salis
12,
Marin Bugaric
13,
Mikhail Sofiev
14,
Evgeny Kadantsev
14,
Ioannis Z. Gitas
15,
Dimitris Stavrakoudis
15,
George Eftychidis
15,
Avi Bar-Massada
16,
Alex Neidermeier
17,
Valerio Pampanoni
18,
M. Lucrecia Pettinari
1,
Fatima Arrogante-Funes
1,
Clara Ochoa
1,
Bruno Moreira
19 and
Domingos Viegas
20
add Show full author list remove Hide full author list
1
Environmental Remote Sensing Research Group, Department of Geology, Universidad de Alcalá, Geography and the Environment, Calle Colegios 2, 28801 Alcalá de Henares, Spain
2
Fenner School of Environment & Society, College of Science, The Australian National University, Canberra 0200, Australia
3
School of Engineering, College of Engineering, Computing and Cybernetics, The Australian National University, Canberra 0200, Australia
4
The James Hutton Institute, Craigiebuckler, Aberdeen AB15 8QH, UK
5
Research Domain 1 “Earth System Analysis”, Member of the Leibniz Association, Potsdam Institute for Climate Impact Research (PIK), P.O. Box 60 12 03, 14412 Potsdam, Germany
6
Remote Sensing & Geospatial Analytics, GMV Aerospace and Defence SAU, Isaac Newton 11, 28760 Tres Cantos, Spain
7
European Commission–Joint Research Centre, Via Enrico Fermi, 2749, 21027 Ispra, Italy
8
Institute of International Sociology of Gorizia, 34170 Gorizia, Italy
9
UMR 5175 CEFE, University de Montpellier, CNRS, IRD, 1919 Route de Mende, 34293 Montpellier, France
10
Forest Fire Laboratory, Department of Forest Engineering, Universidad de Córdoba, Edificio Leonardo da Vinci, Campus de Rabanales, 14071 Cordoba, Spain
11
Department of Environment and Planning, CESAM, University of Aveiro, 3810-193 Aveiro, Portugal
12
Institute of BioEconomy, National Research Council of Italy, Traversa La Crucca 3, 07100 Sassari, Italy
13
Faculty of Electrical Engineering, Mechanical Engineering and Naval Architecture, University of Split, 21000 Split, Croatia
14
Finnish Meteorological Institute, 00560 Helsinki, Finland
15
Laboratory of Forest Management and Remote Sensing, School of Forestry and Natural Environment, Aristotle University of Thessaloniki, 54124 Thessaloniki, Greece
16
Department of Biology and Environment, University of Haifa at Oranim, Kiryat Tivon 36006, Israel
17
Environmental Geography Group, Institute for Environmental Studies (IVM), Vrije Universiteit Amsterdam, de Boelelaan 1087, 1081 HV Amsterdam, The Netherlands
18
Earth Observation Satellite Images Applications Laboratory (EOSIAL), School of Aerospace Engineering, Sapienza University, 00138 Rome, Italy
19
Centro de Investigaciones Sobre Desertificación, Consejo Superior de Investigaciones Científicas (CIDE-CSIC), Carretera CV-315 km. 10,7, 46113 Moncada, Spain
20
Department of Mechanical Engineering, CEIF/ADAI, University of Coimbra, 3030-788 Coimbra, Portugal
*
Author to whom correspondence should be addressed.
Fire 2023, 6(5), 215; https://doi.org/10.3390/fire6050215
Submission received: 8 April 2023 / Revised: 9 May 2023 / Accepted: 16 May 2023 / Published: 22 May 2023

Abstract

:
This paper presents a review of concepts related to wildfire risk assessment, including the determination of fire ignition and propagation (fire danger), the extent to which fire may spatially overlap with valued assets (exposure), and the potential losses and resilience to those losses (vulnerability). This is followed by a brief discussion of how these concepts can be integrated and connected to mitigation and adaptation efforts. We then review operational fire risk systems in place in various parts of the world. Finally, we propose an integrated fire risk system being developed under the FirEUrisk European project, as an example of how the different risk components (including danger, exposure and vulnerability) can be generated and combined into synthetic risk indices to provide a more comprehensive wildfire risk assessment, but also to consider where and on what variables reduction efforts should be stressed and to envisage policies to be better adapted to future fire regimes. Climate and socio-economic changes entail that wildfires are becoming even more a critical environmental hazard; extreme fires are observed in many areas of the world that regularly experience fire, yet fire activity is also increasing in areas where wildfires were previously rare. To mitigate the negative impacts of fire, those responsible for managing risk must leverage the information available through the risk assessment process, along with an improved understanding on how the various components of risk can be targeted to improve and optimize the many strategies for mitigation and adaptation to an increasing fire risk.

1. Introduction: The Need of Wildfire Risk Assessment, Reduction and Adaptation

Wildfires are one of the critical factors affecting global ecosystems and societies, impacting atmospheric composition [1], vegetation succession [2], soil erosion and runoff, and societal values (resources and assets) [3]. Recent studies estimate that every year more than 4 million km2, which is approximately the size of India and Pakistan combined, are burned globally [4,5]. Notably, those estimations are likely to be conservative, as they are based on coarse resolution satellite images, which tend to miss small fires that are quite frequent in Tropical regions [6].
Fire is a natural process in several ecosystems [7], but in others it negatively affects biodiversity, particularly when natural fire regimes change abruptly [8]. Wildfires also have important socio-economic implications, and can affect lives, houses and other human values. Catastrophic seasons with many human casualties and/or large burned areas have occurred in the last decades, mainly associated with heat waves and droughts [9,10]. For this reason, most industrialized countries affected by wildland fires have fire management strategies in place [11]. Countries involved in managing fire assess risk in at least an informal way, often supported by systems that evaluate certain components of risk (e.g., fire danger systems). However, formal risk assessment systems that consider an integrated strategy for wildfire risk are still not widespread. The growing concern of extreme fire seasons—with extensive areas burned, human casualties and destruction of houses [12,13]—led by previously unobserved weather anomalies [14], have heightened the interest in wildfire risk assessment systems. They are part of a general approach to evaluate threat conditions for a certain area and period of time, and feeds into making risk-informed decisions to reduce unwanted impacts [15]. Risk assessment can consider a wide range of variables that affect fire ignition, propagation, potential impacts and some valuation of the importance of those impacts [16]. Risk assessment, along with the communication of that risk, should be adapted to the end users of risk information, who may include first responders, landowners, land managers, civil society organizations and the general public [17].
This paper reviews past efforts to estimate fire risk conditions in various parts of the world, including operational systems in place, and exemplifies risk assessment methods and integration approaches by presenting results from the European project FirEUrisk, which aims to develop an integrated management strategy for wildfires in Europe. The FirEUrisk approach covers risk assessment, reduction and adaptation to future conditions; in this review, however, only the aspects related to current wildfire risk assessment will be presented, with only essential references to reduction and adaptation. The paper includes three main sections. The first one introduces the components and variables that should be addressed by wildfire risk assessment systems, along with a review of how those components have been estimated. The second one presents some of the existing operational systems related to risk assessment, along with their recent evolution trends. The third section presents how the FirEUrisk project is addressing a comprehensive strategy for wildfire risk assessment, including methods to generate input variables and integrate them into synthetic risk components at different spatial scales, both for the European territory and selected pilot sites.

2. Frameworks for Wildfire Risk Assessment

2.1. Natural Hazards Terminology

Growing concern about the impacts that natural hazards may have on human lives and the built environment has motivated work on a variety of international programs focused on risk assessment and mitigation. For example, the United Nations Office for Disaster Risk Reduction (UNDRR) recently implemented the Sendai Framework [18], which is a major international agreement advocating for effective risk management and disaster risk reduction. The Sendai Framework highlights the crucial importance of the development and application of analytical frameworks to understand and quantify risk. According to the Sendai Framework’s guiding principles and priorities for action, Disaster Risk Reduction (DRR) must be accomplished through international, regional, subregional, transboundary and bilateral cooperation, and also shared between central governments, relevant national authorities, sectors and stakeholders. It requires a multi-hazard and inclusive risk-informed decision-making approach. The priorities for action include understanding disaster risk, strengthening disaster risk governance to manage it, investing in risk reduction to increase resilience and enhancing disaster preparedness for effective response and recovery [18].
Following common terminology of natural hazards, risk can be defined as “the potential for adverse consequences or impacts due to the interaction between one or more natural or human-induced hazards, exposure of humans, infrastructure and ecosystems, and systems’ vulnerabilities.” [19] (p. 55). Therefore, assessing risk entails a comprehensive analysis of the various dimensions. The three most commonly identified are hazard, exposure and vulnerability [19,20,21], with risk being the combination of the three (however, other authors suggest alternative formulations, such as Thywissen [22], who considers four risk dimensions: hazard, vulnerability, exposure and resilience; other studies also consider coping capacity [23]). A working definition of the three risk dimensions may be the following:
“Hazard, i.e., the process, phenomenon or human activity that carries the potential to cause loss of life, injury or other health impacts, property damage, social and economic disruption or environmental degradation. Hazards can be natural (e.g., wildfires, earthquakes, droughts, floods) or anthropogenic (e.g., oil spills, terrorist attacks) in origin and can be characterized by their location, likelihood of occurrence, intensity or magnitude, duration, and extent.” [19] (p. 56). Hazard therefore implies estimating the probability and intensity that a certain negative event occurs.
“Exposure represents the people and assets at risk of potential loss or that may suffer damage to hazard impact. It covers several dimensions like the physical (e.g., building stock and infrastructure), the social (e.g., humans and communities) and the economic dimensions” [24] (p. 59). For other authors, it refers to the extent to which a value, resource, asset or geographic area may be subject to or come into contact with a potential source of harm [16]. Therefore, exposure assessment implies the inventory of elements in an area in which hazard events may occur and during the time they may occur. Exposure analysis is the process of identifying the exposures to which various resources or assets could be subjected.
Vulnerability encompasses a variety of concepts and elements including sensitivity or susceptibility to harm and lack of capacity to cope and adapt [19] (p. 57). In other words, vulnerability is “the characteristics and circumstances of a community, system or asset that make it susceptible to the damaging effects of a hazard.” [25]. While most natural hazards are beyond human control, vulnerability can be modified by human actions, either increasing (vulnerable societies) or decreasing it (resilient societies).
Finally, risk assessment is the process of integrating information about the three dimensions: hazard, exposure and vulnerability. It should consider a wide range of factors, affecting both the physical phenomena (weather, geology, vegetation cover, topography, seismic activity, etc.) and the human dimensions that can potentially mitigate or increase the damaging effects of the event. Risk assessment entails understanding the nature, sources and causes of risk, as well as the valuation of magnitude, extent and duration. The magnitude of risk is sometimes conceived as the values at stake times the likelihood of occurrence. In this regard, risk management greatly benefits from analyzing historical occurrence [16].

2.2. Wildfire Risk Terminology and Components

Following the general terminology of natural hazards, wildfire risk assessment should include all factors that affect both the likelihood of occurrence and the potential damages (including exposure and vulnerability) that the fire may cause, not only on human lives and assets, but also on ecosystem services and ecological values as well. Historically, wildfire risk literature developed a particular set of concepts and terms, sometimes independent from the general literature on natural or technological hazards [26]. FAO terminology [27], for instance, defined in 1986 Fire Danger as “the resultant, often expressed as an index, of both constant and variable factors affecting the inception, spread, and difficulty of control of fires and the damage they cause”, while fire hazard was related to fuel conditions and fire risk was related to causative agents. Growing acceptance of the UN natural hazards terminology by the fire community implies that those terms are nowadays mostly discontinued, although reminiscences are still found in historical risk assessment systems. In any case, most fire managers now consider that integrated wildfire risk assessment should consider both the factors affecting fire ignition and propagation (e.g., fire causes, fuel properties, terrain and weather conditions), as well as the evaluation of assets at stake, those that may be affected by direct or indirect impacts of fires (human health and lives, houses, infrastructures, ecosystem services and ecological values).
Adapting the standard concepts used in natural hazards to wildfire risk is not a trivial issue. Terminology used in fire prevention planning has a long tradition, especially in the USA and Canada [28], but it has presented some controversy, as most wildfire risk assessment systems have focused just on the estimation of the likelihood that a fire ignites and propagates. These systems are commonly named fire danger [29,30,31,32,33,34,35]. For this reason, we will also refer to fire danger in this paper as the probability that a fire ignites and spreads.
The two other components of risk used in the natural hazards literature, exposure and vulnerability, have much less tradition in the wildfire community. In fact, there is not yet an operational system that incorporates a full consideration of these two components, although several authors have suggested new approaches to include them in the assessment of the potential damages of fire [36,37,38,39]. Recent analyses have extended these approaches to incorporate the exposure concept [40,41], which in fire events tends to be quite extended, as most territory with burnable vegetation may potentially be burned, with more or less intensity depending on fuel and weather conditions.
In summary, wildfire risk assessment entails an estimation of when, where, why and how wildfires are more likely to occur and propagate, which areas are potentially exposed and what potential damages those fires may imply. Therefore, a comprehensive risk characterization should include these three dimensions of risk (danger, exposure and vulnerability). Ideally, the risk assessment system should also be comprehensive (all relevant variables considered), flexible (applicable to a wide range of spatial and temporal conditions), coherent (internally logical) and replicable (based on transparent methods).
The constituents of such a system can be grouped in two categories: on one hand, components which identify the different dimensions of wildfire risk that the system is considering (for instance, ignition source/causes, propagation potential or landscape resilience), and on the other hand, variables which indicate specific parameters. These variables can be further divided into first-order quantities (those directly measurable, such as wind speed or population density) and second order (those estimated from a combination of first order variables, such as fire rate of spread). The aggregation of variables (either of first or second order) into different dimensions of risk will lead to generating risk components. For instance, human ignition is a component that requires different input variables related to how humans may generate fires, either intentionally or by carelessness.

2.2.1. Danger

Wildfire danger indicates the likelihood that a fire ignites and propagates in a certain area and period. Even though most natural hazard terminologies name this component as Hazard (see Section 2.1), Danger is more commonly used in the wildfire management community (such as the American, Canadian, Australian and European systems) to indicate a similar concept. Danger assessment considers human and natural causes leading to a fire ignition, as well as those factors that must be present to start a fire or affect fire behavior, including fuel availability and moisture status, slope and weather conditions (Figure 1).
Fire Ignition can be divided into human and natural ignition, defined according to the main fire causes. Prestemon et al. [42] differentiated between two broader categories of fire causes: natural (basically referring to lightning) and anthropocentric, the latter of which was further divided into accidental and intentional. However, since the statistics on causes are not widely available, human ignitions are generally considered as a single category.
Fire propagation is closely related to fire spread, but these terms are not fully identical. They both refer to the likelihood or probability that fire will spread in a particular direction or over a specific area, along with information about the intensity and speed of fire spread. Fire spread depends on concrete weather, topography, fuel conditions and on fire dynamics, where these conditions represent either current, historical or possible future scenarios. Propagation potential provides a more general understanding of the target area and conditions prevailing in that zone [43,44]. These conditions can be observed through shorter or longer time periods (ranging from 1 h to even decades).

2.2.2. Exposure

Exposure indicates the extent to which people, infrastructures and other tangible human assets, as well as ecosystems, could be affected by wildfires. Areas may be exposed directly through contact with the fire front or via flaming embers; or indirectly through the dispersion of smoke, or by fire-caused changes in hydrological cycles or soil erosion. The actual exposure to fire may change even in short periods of time as a result of weather patterns (e.g., heatwaves, changes in wind conditions that transport smoke in different directions) or population movements (summer holidays: [45]).
As a component in wildfire risk assessment systems, exposure forms a link between danger and vulnerability. Hence, the assessment of exposure is a crucial step in establishing the location and characteristics of landscape entities that may be adversely affected by wildfires. Exposure does not account for the properties of the given value at risk (as these are part of its vulnerability characteristics; see next section), but reflects the potential of a given place to be affected by wildfires, or the extent to which it is exposed to it; studies on wildfire exposure are often based on the intersection of predictions of fire behavior models, with available data on the presence of the elements at stake. For example, Bar-Massada et al. [46] overlaid the locations of built structures on top of the gridded predictions of burn probability derived from the FARSITE model [47] to estimate housing exposure to wildfires under both normal and extreme weather conditions in northern Wisconsin. Similarly, Alcasena et al. [48] estimated the exposure of highly-valued resources and assets in Navarra, Spain, based on the intersection of their locations and predictions of burn probability from the FlamMap model [49]. A simpler approach (without fire spread modelling) was used by Beverly et al. [50] to estimate the exposure of four communities in Alberta, Canada to wildfire based on the composition of hazardous fuels within multiple buffer distances around them, which reflect different mechanisms of fire spread (radiant heat, short-range and long-range spotting).
One critical aspect of fire exposure entails the wildland urban interface (WUI) mapping [51,52]. WUI maps typically use a set of predefined rules and parameters to identify where human settlements adjoin or intermingle with flammable vegetation, to highlight locations of potential fire exposure across landscapes. To date, there are multiple WUI mapping approaches [51,53,54], and these methods have been applied in many regions and at spatial scales ranging from local to global [50,55]. Information derived from these maps allowed policy makers and land managers to direct management efforts to reduce potential exposure to wildfires via the prioritization of fuel treatments around exposed areas.

2.2.3. Vulnerability

Vulnerability refers to the potential damages caused by wildfires on a particular territory, including the losses directly caused by fires but also the ability (or lack of) to recover afterwards. A vulnerable territory would be an area with high values (either socio-economic or ecological), which will be lost (or a significant part of them) by the effects of fire, and it will have little capacity to recuperate those pre-fire values. The boundaries of the definition of fire vulnerability are unavoidably blurred, due to the various thematizations of the term produced over time by different research perspectives and academic fields. Generally speaking, vulnerability encompasses several thematic elements (e.g., social, economic, physical, ecological, institutional) describing a broad range of phenomena. Since wildfires impact both socio-economic values (human lives, public health, houses, infrastructures), ecosystem services and ecological values (soil fertility and water holding capacity, biodiversity, protected areas, etc.), fire vulnerability can be approached from different perspectives.
Societal vulnerability to wildfires may be understood as both the magnitude of the socio-economic impacts deriving from wildfires, and the inability of local societies to cope with stressors to which they are exposed as a consequence of a wildfire [41,56]. However, from an ecological point of view, vulnerability has been defined as the interaction among exposure, resilience (also named sensitivity) and recovery potential (also called adaptive capacity) [57]. Leaving aside exposure (covered in Section 2.2.2), several authors defined sensitivity as the degree to which a system is affected or harmed by the disturbance, as an intrinsic feature of the system, but also driven by local environmental conditions [57]. Resilience includes coping capacity, which indicates the resistance of the ecosystem to be negatively affected by the fire, and the ability to recover. Therefore, vulnerability is linked to resilience as its ‘flip side’ [58], which includes the resistance to the fire disturbance, as well as its recovery trajectory [59], that is, its capacity to return to near-prior conditions [60]. In practical terms, the assessment of vulnerability requires considering not only the spatial and temporal scales, but also the hierarchical scales, from the individual organisms and the structural and functional relationships between them, to the abiotic environment [61]. All these reflect the inherent intricacy of ecological systems which makes their vulnerability rather difficult to quantify and reduce to a single or few metrics [62].
A longer-term perspective is to characterize the end-point impact and its deviation from the pre-disturbance stage so that the system is considered as vulnerable when not recovering, resilient when recovering at a similar state variable than before the disturbance, or adaptive when recovering at a higher state variable than before the disturbance [63,64].

2.3. Wildfire Risk Variables

Wildfire risk variables are the input variables required to generate a concrete risk component. They can be measurable with specific metrics. First order variables are generally estimated from original sources (census, field work, remote sensing, etc.), while second-order variables are modelled through empirical, semi-empirical or physical models, from a set of first-order variables.

2.3.1. Weather and Climate

Weather variables commonly used in wildfire risk assessment indicate those atmospheric variables that affect ignition or propagation (temperature, relative humidity, precipitation, wind speed and direction, etc.). They can refer to current (instantaneous), aggregated (last days-weeks) atmospheric conditions, or even historical conditions (past scenarios). These variables are obtained from meteorological observations or short-term weather forecasts based on climate models. Additionally, adaptation to future wildfire conditions requires understanding future weather patterns, which is done through Climate and Dynamic Global Vegetation Models (DGVM: [65]) to represent future values of meteorological danger indices [66], but also to estimate future fire occurrence by linking DGVM with fire models [67].
Weather variables are a critical element and widely used in existing wildfire risk assessment systems, which generally address only the fire danger component. Weather plays a key role in the ignition and propagation of wildfires. Temperature, atmospheric humidity (relative humidity and vapor pressure deficit), wind speed and direction are the common meteorological inputs to danger rating systems [35]. Fire weather extremes also drive large and at times catastrophic wildfires. These events have been increasing over much of the globe, and indicate that our fire climate is already changing [12].
In addition to weather or short-term atmospheric conditions, climate patterns are relevant to fire occurrence, particularly for the build-up of vegetation fuels. Climate plays a role in determining the fuel available to burn, the length of the fire season as well as the presence of lightning, which is the most common natural source of ignition. Climate including long-term averages has been used to explain the spatial variation in fire regimes. Additionally, climate variability helps explain the global interannual variability in areas burned, especially forested areas [68,69]. Many studies describe climate-fire relationships along a continuum, ranging from fuel limited to fire weather limited systems. Fire weather limited systems are largely driven by extreme fire weather and fuel moisture [12,70], whereas fuel limited regions are positively related to precipitation prior to the fire season that promotes vegetation growth and subsequent biomass for combustion during the fire season. Lastly, and perhaps most importantly, human-caused climate change is causing profound changes in global fire regimes through changes in fire season length, fuel moisture, fire intensity and fire severity [71].
Weather patterns also affect natural ignitions, both directly to the convergence of lightning and drought, as well as the characteristics of strikes and thunderstorms. Lightning strikes are one of the most common natural causes of wildfires, accounting for around 10–15% of all wildfires worldwide. Lightning-induced wildfires are particularly prevalent in regions with a high incidence of thunderstorms and dry vegetation [72,73,74]. While lightning strikes can occur at any time, they are most common during the summer months when hot and dry conditions make it easier for fires to start and spread. One of the significant challenges in identifying lightning-induced wildfires is the prolonged latent phase, known as the holdover time, between ignition and fire detection. Typically, lightning-caused fires start as smoldering in the organic matter surrounding the base of the tree struck by lightning. This smoldering phase can last from several minutes to one or three days or even several weeks in rare cases, making it difficult to accurately identify the lightning that caused the fire. This phenomenon poses a great challenge to the development of predictive methods that can establish a cause-effect relationship, which is currently limited to specific regions [75]. A robust association between lightning and wildfires can aid in understanding the natural fire regime, such as estimating holdover duration, identifying igniting lightning characteristics, and modelling lightning fire occurrence. The principal possibility of building such a model was demonstrated by Wotton and Martell [76] from Ontario, Canada. Unfortunately, there are currently no global datasets that unambiguously link igniting lightning to its corresponding wildfires. However, improvements in lightning location systems (LLSs) and fire databases [77] have facilitated the identification of possible igniting lightning, and numerous methodologies have been developed to match wildfires and related lightning [75]. Consequently, identifying the igniting lightning of a wildfire by searching the lightning dataset remains challenging, making predicting single lightning-ignition events difficult. However, utilizing a statistical approach that incorporates lightning data from Numerical Weather Prediction (NWP) models and other environmental factors occurring when a fire is observed may offer a potential solution [78]. The target variables for prediction could be widely available satellite products, such as Fire Radiative Power (FRP) or Burned Area (BA).

2.3.2. Topography

The terrain shape and morphology have great importance both for fire ignition and behavior. The former through wind regimes, solar exposure, rainfall and air temperature and humidity distribution, which all impact vegetation distribution [79] and moisture contents [80]. Impacts of terrain on fire behavior include the shape of the terrain and relations to prevailing winds. A fire front developing upwards on a slope will spread with a much higher average rate of spread than on a horizontal plane or a downslope, because the slope tilts the flame over the unburned fuels, pre-heating and drying them, and bringing them to ignition temperature sooner [44]. The presence of concave terrain like in canyons or gullies will induce a fire acceleration that is quite independent of the prevailing wind conditions [81].

2.3.3. Wildfire Fuels

Vegetation load, structure, composition and moisture status play a key role in wildfire ignition and spread: their characterization and mapping are therefore of paramount importance to fire risk assessment and reduction. Wildfire fuels can be described in terms of chemical characteristics, flammability and physical properties, which affect the combustion process, and include quantity, size and shape, compactness and arrangement [82,83].
According to their vertical layers, wildfire fuels can be classified into ground, surface and crown fuels, which present different fire behavior patterns [84]. As there are several potential combinations of vegetation types, characteristics and succession stages, and describing all these possible combinations is very challenging, the most common approach is to generalize and characterize fuels into a finite number of fuel models [85,86]. Overall, a fuel model is an identifiable association of fuel components of distinctive species, form, size, arrangement and continuity that exhibits a characteristic fire behavior under defined burning conditions [87,88]. The parameters that compose each fuel model are dependent on the input variables required by the fire behavior models they were created for. For example, the fuel modelling system developed by Rothermel [43] considers four strata for surface fire propagation (litter, herbs, shrubs, slash) organized in 13 fuel models, and provides a simplified set of fuel parameters that are inputs for the equations of fire spread developed at the Northern Forest Fire Laboratory of the US Forest Service [47,89]. Scott and Burgan [88] expanded those fuel models to 40, adding fuels representing those existing in high-humidity areas, and in forests with different kinds of understory vegetation. A more detailed fuel model characterization was the one developed as part of the Fuel Characteristic Classification System (FCCS) [90]. This system allows for the creation of as many fuel models as necessary, organized in six strata: canopy, shrubs, non-woody vegetation, woody fuels, litter-lichen-moss and ground fuels. For each of these strata, a set of parameters needs to be assigned, representing strata characteristics such as percent cover, depth, fuel load, etc. [83]. These fuel models are then used to run the FCCS fire behavior and emission models [91], based on a reformulation of the Rothermel equations [92]. Complementary, several customized fuel models have also been developed to represent better the fuel characteristics and to estimate observed fire behavior characteristics in many other countries, including European regions [93,94,95,96] and Australia [97].
Another important property of wildland fuels for fire risk characterization is the fuel moisture content (FMC). FMC is defined as the ratio of the water content to dry mass within the fuel and is usually expressed in percentage [98]. It is commonly divided into live (LFMC) and dead fuel moisture content (DFMC), which relate to the FMC of living (e.g., grass, foliage) and dead (e.g., litter, woody debris) vegetation components, respectively [99]. While dead fuel moisture responds to short-term weather conditions [100], live fuel is more responsive to longer-term weather events, such as dry spells, and plant species-specific water use strategies [101], although it has also been demonstrated to respond to short heatwave events as well [102].
DFMC determines the amount of energy and time required to vaporize moisture before fuels are ignited [103], which means that it greatly affects fire ignition, intensity, rate of spread and extent [104]. It determines whether a fire will start, spread and the amount of fuel available to burn that translates into the potential intensity. High DFMC values reduce ignitability and fire spread, while low DFMC values are associated with high fuel flammability and, subsequently, higher risk of fire ignition and spread [105]. In particular, large fires occur once moisture decreases below a certain threshold value, depending on the different forest environments (e.g., DFMC of 12% or lower for the Mediterranean and temperate broadleaved and mixed forests) [70]. Given its importance as one of the key drivers of fire danger, the estimation of DFMC is one of the key components of meteorological danger indices [35].
The role of LFMC in wildfire ignition and spread is more complex. Laboratory experiments have shown a positive correlation between LFMC and time to ignition [106] in foliage from both needle-leaved and broad-leaved trees, as well as a negative correlation with the rate of spread in shrub and tree species [107] and the temperature reached and the heat released during the combustion. However, these interactions are not as clear from field experiments likely due to confounding factors, the different magnitudes of heat flux generated by wildfires or the range of LFMC used being too moist to reveal a significant effect. Alexander and Cruz [108] found no statistically significant relationship between LFMC and crown fire rate of spread in conifer forests and shrublands, but Rossa [109] demonstrated that in the absence of wind and slope, fuel moisture can have a significant impact on the rate of spread. Nevertheless, several broad scale empirical studies using remote sensing data and GIS have proven LFMC influences fire activity [110]. This highlights the need to improve our understanding of the relationship between LFMC and fire behavior to refine fire risk models [111].
Traditionally, both DFMC and LFMC is estimated through field measurements [112]. Even though these measurements are fairly accurate [113], they are very local and extremely time-consuming and labor-intensive, rendering FMC estimation over a large spatial and/or temporal scale nearly impossible [99]. The use of meteorological indices and satellite imagery constitute the two alternative methods which avoid the limitations of ground field measurements [99,114,115,116]. Nevertheless, due to the usual inadequacy of existing meteorological stations and subsequent spatial incomprehensiveness of the respective meteorological data, FMC estimation is performed through interpolation techniques, which result in significant computational errors [100]. Utilization of weather forecasting models alleviates the problem of limited representativeness of individual stations, but is not free from caveats either, the most important being the quality of precipitation predictions. Moreover, the meteorological data-based estimation of LFMC is additionally challenged since live fuels have multiple drought adaptation strategies [102]. Among the meteorological indices used for DFMC estimation, the Keetch-Byram Drought Index and the Cumulative Water Balance Index are the ones most widely employed in fire risk systems [35,114,117], although some authors have found saturation problems in dry regions [118].
Satellite remote sensing data can overcome most of those limitations, providing estimations at various spatial and temporal scales. The remote sensing based LFMC estimation methods can be categorized into two approaches, depending on whether they rely on radiative transfer models (RTM) [119,120] or on empirical methods [121,122,123]. The former models depend on the physical associations between canopy properties and its spectral reflectance, while the latter on statistical approaches comparing ground observations and satellite estimations. The RTM methods are more robust than the empirical ones since they are independent of sensor and environmental conditions [124], yet they are more complex to parameterize [119]. On the contrary, empirical approaches are usually easier to parameterize but are more local and difficult to generalize. Some authors have shown similar accuracy values between the two approaches [125,126].
Coarse and medium resolution multispectral satellite data, such as those acquired by Terra’s Moderate Resolution Imaging Spectroradiometer (MODIS), Landsat TM/ETM, MSG-Spinning Enhanced Visible and Infrared Imager (SEVIRI) and Sentinel-2 MSI have been employed for LFMC estimation, since they provide either the required frequent temporal or spatial detail coverage [99,121,127]. However, cloud coverage and smoke can hinder the retrieval of spectral information over extended areas. Microwave wavelengths have been presented as an alternative data source to overcome such limitations [128,129]. Being sensitive to moisture of certain vegetation parts (e.g., crown, stems), different Synthetic Aperture Radar (SAR) bands from sensors, such as the RADARSAT-1 and most recently the Sentinel-1, have been used to reliably estimate FMC in various environments [130,131]. Current advances in satellite technology are expected to introduce data from new sensors, such as the upcoming Meteosat Third Generation (MTG)—Flexible Combined Imager (FCI), Biomass SAR and OzFuel [132], providing new insights and additional possibilities for LFMC retrieval.

2.3.4. Human Components

The human dimension of wildfire risk assessment includes two main components: one linked to the beginning or the suppression of the fire, as a causative or control agent, respectively, and the other one as an element of vulnerability, related to those people’s lives and values potentially affected by fires. Human relations with fire are very diverse on different continents, ranging from the traditional use of managed fires by indigenous communities [133,134], to the total fire exclusion policy [135].
Even though many references acknowledge that humans are behind most fire ignitions (90% according to FAO [136]), wildfire risk assessment (and research) has been much less active with the social aspects than with the biophysical aspects of fire ignition. Only in the last years has a growing interest to understand better how human behavior relates to wildfire prevention [137] led to new approaches to model human causes of fire ignition [138,139,140,141]. These studies have emphasized the complexity and regional variability of human-fire interactions, both including fire occurrence [142,143] and persistency [144]. Population density and aging, proximity to roads and urbanized areas, livestock density and social conflicts have been identified as closely related to human fire ignition [145,146,147].
Humans not only cause fires, but they are also affected by them, depending on exposure and vulnerability [41,148]. Frequently, human assets are assessed through monetary values. Fuchs et al. [149], for instance, estimated the economic value of the exposed buildings and the number of citizens involved in fire danger areas. The KULTURisk Framework (based on UNISDR [25]) used a monetary index to assess people and assets in a given area. However, human assets can also be assessed by their intangible value: cultural and historical heritage, for instance, has a value which cannot be fully monetized, and which is usually strictly related with the identity of a local community, thus affecting its coping capacity. Human assets can also be categorized according to the “capital(s)” they embed (i.e., social, economic, institutional, human, and environmental). Additional aspects related to social capital [150] exploring the relationships between communities, their activities to contain fire ignition and spread and their strengths and relations with the current institutional system are not yet introduced in integrated approaches, giving space for new research along with the consideration of sociological indicators of community vulnerability [151,152,153].
Finally, humans have an indirect effect on fire via land cover change, particularly through fragmentation (increase in land use intensity) or abandonment (reduction), which impact fire propagation. Humans also fragment the landscape due to settlements, infrastructure (e.g., roads, powerlines, railroad tracks) and permanent agriculture. Increases in small-scale agriculture and the abandonment of fire-management practices to manage the landscape are likely to be responsible for the global decline of burned areas (particularly clear in Africa) and fire-related carbon emissions [154,155]. When the land is no longer used, fragmentation decreases while fuel connectivity increases and thus the fuel horizontal and vertical continuity, leading to fire risk increments. The effects can differ regionally depending on the changes in land-use, e.g., if pastoralism continues in the high mountain areas, agriculture is less intensive in lowland areas.

2.3.5. Ecosystem Services

Ecosystem services (ES) may be defined as the human benefits generated by nature, such as forest, fauna, water, soil, or minerals, the latter being the stock of renewable and non-renewable resources that, using economic terminology, can also be identified as natural capital [156]. ES are drivers of social wellbeing emerging through their interaction with human and social capitals [157]. For instance, the contribution to human wellbeing derived from forestry and agriculture ecosystems requires human labor energy, and capital (machinery) input to convert them in societal benefits (e.g., crops and timber) [156].
A recent assessment carried out at the EU scale has defined and mapped a set of ES such as crops, pollination, timber, recreation, carbon sequestration, flood regulation, water purification and soil retention [158]. Limited attention has been given in the economic literature to soil erosion, water supply and regulation following wildfire events [153,158]. Conversely, ecological values such as biodiversity, have been considered in the wildfire economic literature and monetized by eliciting the willingness to pay for its use value (e.g., wildlife watching) or non-use value, such as the existence value [159,160]. Biodiversity can also be valued by its optional value, referring to the potential benefits generated by the protection of living beings because of their future bioprospecting use, such as for the production of drugs or new materials [161]. Provisioning services of forest ecosystems, such as timber and mushrooms, are usually considered in economic impact valuation or welfare analysis (cost benefit analysis) because they have a market price [162].
In terms of vulnerability, the ES most commonly affected by fire are timber supply, carbon sequestration and storage, pastures, hunting, mushrooms collection and recreation [163]. The value of those services can be either provided in biophysical units or in monetary terms. The latter can be obtained by adopting the total economic value (TEV) framework [164,165] in combination with a “cascade model” that shows the relationships (for simplicity assumed linear) between the stock of natural capital (e.g., forest), the underpinning processes generating ecosystem services (e.g., woodland biomass, flood protection, carbon sequestration), and the benefits that contribute to human wellbeing (timber, non-timber forest products, health, safety, recreation and other cultural values, etc.) [166]. Regulating services like carbon sequestration can be the object of an ample range of values according to the methods used, fluctuating from the social cost of carbon, the price generated in the carbon market, and the marginal abatement cost of the national technology used to achieve a specific target of carbon reduction [167,168]. Recreational values are a measure of welfare analyzed by preferences for natural areas, parks, and species using travel cost methods [167,169], and integrated with stated preferences, based on contingent valuation methods to assess the expected changes in number of recreationists under different fire scenarios [169,170,171,172]. Landscape has also received attention with analysis of monetary values measuring quality [173], resilience to wildfire intensity [37] and loss of multiple values carried out by integrating the analysis of stated preference (contingent valuation method) [173] and burn probability [174].
In all these studies the goal has been measuring the net value change or, in other terms, the lost benefits of the pristine environment net of the regeneration caused by forest recovery [37,175,176]. The goal is estimating the net value change of the asset, that is, the difference between its pre-fire value and the estimated post-fire value (assuming a certain fire severity level) and integrating the current losses incurred throughout the time until the full recovery of that asset is obtained. This has been named as the present marginal loss (PML), which can be computed using either a more traditional geometric discount or a hyperbolic approach that penalizes less the long terms benefits (over 50 years) achieved by the recovery of the natural ecosystem (e.g., forest), as proposed by Román et al. [177]:
P M L = M L × 1 ( 1 + r ) log n b r
where ML is the marginal loss (difference of value between pre and post-fire conditions), r is the discount rate (set by Roman et al. to 2%, but suggested to be between 1% and 3% to better reflect the social temporal preferences of society [178] rather than private market conditions—5 to 10%), and nb is the estimated recovery time of the particular ES being assessed. PML should be added to the actual ML to estimate the total loss.
However, it should also be pointed out that the use of monetary valuation has been controversial for decades [179,180,181], and many alternative methods exist to account for the multiplicity of ES components and their trade-offs. A recent review of existing methods for the valuation of nature by the Intergovernmental Science-Policy Platform on Biodiversity and Ecosystem Services (IPBES) (approved by 139 countries) [182,183] indicated that in less than 20% of the studies dealing with the quantification of ecosystem services, a common unit was used, and monetary units were used in a subset of these studies.

2.3.6. Ecological Values

Ecological values (EV) are defined by Cordell et al. [184] as “the level of benefits that biotic or abiotic components provide for the maintenance of any living organisms”, except humans. In turn, besides ecosystem services related to humans, Ratcliffe [185] provided a list of criteria to assign EV to an entity, considering different aspects: its size (extent), diversity, naturalness, rarity, fragility, typicalness, recorded history, position within an ecological/geographical unit and potential value. As these criteria remain loosely defined, EV used for vulnerability assessment to wildfires or to other disturbances are largely heterogeneous in the literature.
Among others, a commonly assessed EV is biodiversity through species richness and abundance or rarity and typicalness, as a major driver of ecosystem productivity [186] or aesthetic value [187]. Biodiversity includes all the variability of life (organisms, species, populations), their complex interactions and assemblages of communities and ecosystems. There are different scales and measures of biodiversity, including genetic diversity (that may be measured both at intraspecific or interspecific levels), species diversity (variation within and between populations or communities, different measures such as taxonomic, functional, or phylogenetic diversity) and ecosystem diversity (variation within and between ecosystems in habitats, communities and ecological processes). At the landscape level, a major EV relies on habitat fragmentation (size and shape from landscape metrics) and connectivity (corridor and distance between patches). Habitats relate to the benefit that nature provides to sustain life, including vegetation biomass and structure allowing animal foraging (food resource), movement (connectivity) and nesting (protection). Additional EV can be attributed to habitat naturalness, which refers to an ‘index describing how close a landscape is to a natural state’ [188] or how intact the habitat is from human impact or disturbances [189]. The conservation value depicts the human view and investment in conserving these intrinsic EV, and relies on legal protection using regional, national or international standards [190]. EV then include the structural assemblage of plants and animals, their associated biogeochemical stocks and cycles (carbon, water, nutrient), and the soil status (fertility based on nutrient content and available water content) required to maintain ecosystem functioning.

2.3.7. Resilience

Resilience indicates the capacity of a certain resource to resist and absorb the impact of fires (or to avoid being affected by them) and naturally recover the pre-fire value after it occurs [63]. Therefore, resilience is composed of two elements: coping capacity and recovery time. The former can be defined as the resistance of the system to the disturbance and its ability to reinitiate a recovery after the disturbance.
From a social point of view, the concept of resilience is related with the capability of a community to absorb, recover from, or adapt to hazards, including the capability to restore and eventually improve basic functions and structures [191]. A resilient community is one that suffers fewer losses and recovers more quickly after a risk takes place [192]. Resilience assessment comprises both quantitative, qualitative, and quanti-qualitative approaches. Both take into account the dynamic nature of the resilience and the unit of analysis (i.e., the community), as well as the inherent specificity of every community. They consider resilience as a relative feature [193,194], socially constructed and temporally changing [195]. In the unavoidable absence of critical benchmarks or thresholds, resilience should be assessed in comparison with other similar units of analysis (e.g., neighboring communities). This is the methodology applied in many studies [196,197], and is often combined with self-assessment approaches that allow for end-users and stakeholders to contribute their local knowledge to the broader assessment and to interact with statistical data.
From an ecological point of view, resilience can be derived from few plant species strategies allowing a simplified classification in selected plant types [198]: (i) resistors, which include species able to survive the disturbance through their resistance strategies to high temperature, such as bark thickness and wood density or composition (as cork); (ii) tolerators at the individual level, which are highly affected by the disturbance (low resistance) but can easily regenerate by resprouting from canopy buds, or the rooting system (very short regeneration time); (iii) tolerators at the community level, which are highly affected by fire cannot resprout but could deliver resistant seeds in the soil or the canopy (serotiny of coniferous species) with a short regeneration time; and (iv) tolerators at the landscape level, which have none of the previous abilities to resist or regenerate, but developed efficient seed dispersal strategies to regenerate from the closest seeders outside of the disturbance, with a delayed regeneration time. The recovery time can be decomposed into the recovery rate (RCR) and regeneration time (RGT). The recovery rate is the standard rate of growth of species composing the ecosystem, assuming the presence of regenerative material on the site. It can be theoretically assessed from logistic curves along time [199] or through forest growth models. The regeneration time (RGT) is intrinsically linked to regeneration strategies, depending on the size of the fire, which affects the ability of new seedlings to colonize the site [200]. Altogether, the recovery rate and the regeneration onset time will define the recovery time, as the time needed to recover and stabilize at a similar (resilient), lower (vulnerable) or higher (adaptative) state level.
Abiotic factors can affect resistance (RST), regeneration time (RGT) and recovery rate (RCR), such as soil available water content (derived from soil texture, depth and rock fragment content) and fertility, or climate conditions (precipitation amount and intensity, temperatures, air humidity, etc.) locally modified by slope and aspects. In addition, time since last fire directly affects tree age and, in turn, resistance (RST) [201]; and it also affects the viable seed bank availability based on the vital attribute model from Noble and Slatyer [202] stating that viable seeds are only available when mature individuals are present, or viable seeds could persist in the soil seed bank (seed longevity). In turn, time since last fire (a proxy for tree age for seeders) combined with age of maturity (either of saplings or resprouts) will affect regeneration time (RGT), so that cascading effects might apply with recurrent and short interval fires [203]. Fire size will drive the distance to unburned individuals providing seeds through dispersion (located outside the burn patch) and, in turn, the regeneration time for tolerators at the landscape level. Management strategies (through human-driven plantations after fires) will act as a similar process to widespread seed dispersal in accelerating the regeneration time, as provided in forest management maps [204].

2.4. Integration Approaches

Even though the different risk components can be valuable in themselves for the end user [183], an integrated evaluation of fire risk conditions frequently requires the merging of the risk components into synthetic ones, so the actual integration approach can be attained. For doing so, two conceptual steps need to be developed; on the one hand, defining common integration scales of measurement, and on the other hand, finding suitable methods to weigh the importance of each component.

2.4.1. Risk Integration Scales

To obtain integrated risk indices from the risk components previously reviewed, they need to be converted to a common measurement scale, since each component is likely measured with a different metric. For instance, ignition probability is commonly measured in a 0–1 probability scale, while FMC is expressed in percentage of dry weight, and propagation potential is calculated as rate of spread (m) or fire line intensity (kW/m). Combining all these variables requires generating a common risk metric where all inputs can be later merged into synthetic indices.
Methods to obtain those common measurement scales are diverse, but the most used are normalization, qualitative categorization and probabilistic approaches. Normalization implies modifying the original measurement scale to a common range (0/1 or 0/100). This is generally done using the extremes of the distribution (min and max values), using a single algorithm [41,205]:
V o u t = V i n V m i n V m a x V m i n × c
where c is a constant for convenience scaling. Instead of the minimum and maximum values, the user can select a certain percentile (5 and 95%, for instance). When the target variable has a skewed distribution, non-linear normalization approaches can be used instead.
Qualitative categorization implies converting the original measurement scale into classes, generally ordered into risk importance or priority of intervention. Risk categories are commonly identified by a set of experts dealing with fire suppression or fire prevention. They assign danger levels and weights according to their own perception of fire risk in the area [206]. The main problem of this approach is its subjectivity and its excessive orientation to local characteristics, which reduces its generalization potential. Experts make the decisions based on their familiarity with fire events in the study area, but their judgement may not be applicable to other regions.
Alternatives for quantitative categorization entail the use of statistical or physical models. A good example of the former is the application of empirical models to estimate ignition probability based on historical fire occurrence [140,207,208]. Physical models are based on the properties of risk variables related to any of the fire risk dimensions. For instance, FMC values can be converted to probability of ignition (PI) based on the concept of moisture of extinction (ME), which indicates the moisture threshold above which fire cannot be sustained [43]. Since the vegetation is unlikely to burn above that value, the ME can be used as a threshold of ignition probability, lowering the probability as FMC exceeds the ME of that fuel. The shape of that function may be exponential or linear depending on whether the assumption of abrupt changes above a threshold stands or not [105].
Even though it is not related to fire risk, a good example of an integrated approach to measure a multifaceted problem is the Environmental Performance Index (EPI: https://epi.yale.edu/, accessed on 4 April 2023), developed by different institutions to quantify the countries’ environmental operation. The index synthesizes a wide range of indicators (32 in the version of 2020) of environmental sustainability into a single number. All those indicators were converted to a common suitability 0–100 scale, from worst to best performance, respectively, utilizing a normalization process. Some of the variables were log-transformed before normalization to avoid the impact of a highly skewed distribution [209]. The normalization to the 0–100 score of each indicator was based on the distance-to-target technique, considering the best and the worst performance (similar to Equation (2)), the best being the value that would follow ideal performance (targeted by international treaties or expert judgement).

2.4.2. Generation of Integrated Risk Indices

Once the variables have a common risk scale, that is, assigned risk values with a common metric, the integration of the different components and variables into summary wildfire danger, exposure and vulnerability indices can be carried out. There are different alternatives to obtain those integrated indices, including qualitative and quantitative approaches.
If the variable was converted to a categorical risk scale, the obvious alternative is a cross-tabulation analysis [29,210] in which the different risk components are integrated by assigning qualitative ranks to the different combinations of the two-variable categories being compared. A previous conversion from the original scale to ordinal levels of risk (low, medium, high, and very high) facilitates this cross-tabulation process [211]. The assignment of output risk values to those combinations is based on experts’ judgement. Multicriteria evaluation techniques may be a good alternative to reduce the subjectivity of this assigning process, since the opinion of experts may be quantitatively assessed [212]. Moreover, each expert’s opinion may be weighed according to his/her degree of knowledge in the field or the study area [151,213].
Quantitative integration methods can be based on simple conceptual formulas, for instance, the estimation of risk by multiplying danger and vulnerability [214], or the potential damages by the product between danger, economic value and ecosystem vulnerability [215]. Probabilistic approaches may also be used, for instance, by estimating the joint probability of two independent components using the Kolmogorov probabilistic rule [216]. This approach was followed by Chuvieco et al. [36] to integrate ignition probability derived from causative agents P(Ca) as a result of the human ignition probability P(H) and lightning probability P(L) following:
P ( C a ) = P ( H ) + P ( L ) P ( H ) × P ( L )
Statistical models based on regression analysis between fire historical occurrence and explanatory variables have also been widely used in fire risk assessment, including interval scale regression models [142,217], logistic regression [218], geographically weighted regression [147,219] and global additive models [220]. More recently, machine learning methods have been extensively used for integrating different risk variables, also based on historical fire occurrence. The most common algorithms are Random Forest [144,221], Neural Networks [218,222], MaxEnt [223] and Support Vector Machines [205].
An alternative for the merging of the different risk components is the Pareto ranking aggregation [224], which has been used with the pan-European risk assessment system (see Section 3.4) to preserve the ranking of values even when the input components are modified [225].
Outside of the wildfire risk assessment field, it is worth quoting again the EPI approach [209], as it integrates multiple indicators into single indices easily understandable and comparable. Once the different performance indicators are normalized to a common score, they are combined into integrated indices by weighed averages. For instance, the two main sub-indices, Ecosystem Vitality and Environmental Health, receive a weight of 60 and 40%, respectively. Within each of these sub-indices, the indicators are weighed according to their relative importance and uncertainty of the input data [209].

2.5. Risk Validation

Risk assessment aims to mitigate the negative impacts of fire on people, infrastructures and natural values by improving how societies deal with fire risk conditions. This implies that fire risk assessment is considered an estimation of potential fire occurrence, both in time and space. Therefore, the evaluation of the quality of a particular fire risk assessment system seems logically related to how well it estimates fire ignition or behavior, or to how well it defines the exposure or vulnerability of the target area. The former is easier to verify, as statistics on fire ignitions and, to some extent, on fire propagation may be obtained after fire occurs. For this reason, most researchers developing wildfire risk assessment systems have compared their results with actual fire occurrence, either obtained from fire reports [33,38] or from satellite observations [215]. The former approach is based on national statistics derived from fire suppression services and usually includes a high accuracy, even for small sizes, but may be not homogeneous for large territories [226]. The latter relies on global observation of active fires or burned areas and provides a regional to global view of fire occurrence, very useful for those regions with few suppression resources. Active fires are detected by thermal sensors and provide a high accuracy for medium-size fires, particularly in terms of dating the ignitions [124,227], while burned area products provide a more detailed assessment of the total area affected by fire, as well as fire persistency [66,68,228] and specific fire characteristics [229,230].
Regarding wildfire exposure and vulnerability, the validation is much more complex, as the estimation of affected resources is done assuming a certain fire scenario (intensity or persistency), which may or not be like the one actually occurring. In any case, the validation of the specific variables that are used for exposure or vulnerability estimation should be validated independently of their integration [231]. For instance, smoke propagation models can be validated with specific measurements performed in real or prescribed fires, and, therefore, those models can be considered accurate enough regardless of whether the pre-fire modelled conditions are similar or not to the those occurring in actual fires.
However, we should emphasize that likelihood of occurrence is not the same as occurrence, particularly when dealing with specific components. For instance, meteorological danger indices, used in all operational fire danger systems, help estimating when and where a fire may ignite, but high meteorological danger does not necessarily correlate with high fire occurrence [232]. Reasons for this apparent disparity of danger indicators and actual occurrences vary for different regions and in many cases remain speculative. The realization of high danger into a strong fire depends on both fire ignition and suppression. Depending on region, local habits, agriculture and forestry practices, the same level of fire danger may lead to very different fire patterns.

2.6. Communication of Risk Conditions

Risk assessment would be practically useless without a proper strategy of risk communication and management [233]. Wildfire communication is an essential aspect of management that involves effective exchange between fire management personnel, emergency services and the public to ensure the safety of those involved in managing wildfires and those who may be impacted by them. Communication of risk conditions should be done by a proper media, at a proper time and to the proper recipients’ group, including a wide range of stakeholders, from public authorities and operational services to the local population. Public involvement, effective risk communication, and relative training should consider how citizens perceive the actual risk, and foster their responsibility to manage it, while reducing their level of exposure and improving their preparedness.
Key wildfire risk communication techniques include:
  • Risk awareness, which involves informing the public about wildfire risks and potential impacts. It is important to provide accurate and timely information that is easy to understand and to address any concerns or questions the public may have. This should be combined with community outreach. Participatory approaches, in which the local communities can express their own perception of risk, have also been proven very efficient [234];
  • Public Messaging, which involves communicating important information to lay people, particularly during the fire season, through various channels, including social media, news releases and public meetings. Effective public messaging should be clear, concise and consistent. Formalized radio or SMS alerts shared through competent services, such as the telephone line 112 in Europe, may also be used to communicate risk conditions;
  • Media Relations. Wildfire management agencies should work with the media to ensure that accurate and timely information is shared with the public. This involves providing regular updates to the media, arranging interviews with experts and officials, and providing access to fire scenes when appropriate [235];
  • Social media can be an effective tool for wildfire communication, as it allows agencies to reach a large audience quickly and easily. Agencies can use social media to provide real-time updates, share photos and videos, and respond to questions and concerns from the public;
  • Dedicated apps and web-based services. Depending on the recipient, the mean can differ from mobile apps [236] to web mapping services, of which many are already in place, such as those provided by the European Forest Fire Information System (EFFIS: https://effis.jrc.ec.europa.eu/, accessed on 30 March 2023) or the NASA Fire Information for Resource Management System (FIRMS: https://firms.modaps.eosdis.nasa.gov/, accessed on 30 March 2023).
Risk communication is essential to modern Incident Command Systems (ICS), used by wildfire management agencies to manage and coordinate emergency incidents, including wildfires. Fire risk conditions and, thus, the population at threat may change quite rapidly, depending mainly on the weather and fire potential. Therefore, risk communication should be activated at any time during a wildfire incident.
Adapting the best practices of risk communication [233] to the wildfire case implies reflecting on the perception of fire risk when deciding about the contents of the message, including possible mental models of the local population; ensuring that materials are comprehensible, accurate, updated and have the capacity to motivate the desired reaction; taking into account the potential of over-information produced by social networks of media; adapting the message to specific groups with special needs or risk perception (aging groups or permanent versus temporary residents, for instance); fostering community involvement (engage volunteers both in fire prevention and suppression); providing interactive communication tools (not just one-sided); and taking into consideration the credibility of the different risk information sources.
Wildfire risk communication can be ensured against several challenging factors, including the complexity of the topic, since such communication often involves complex scientific concepts that can be difficult for the public to understand. This can make communicating the risks challenging, in terms of effectively ensuring appropriate responses. Furthermore, the public usually has a limited attention span for topics not immediately relevant to their daily lives or lifestyle. Thus, engaging people and sustaining their interest in wildfire risk communication efforts can be difficult and may require systematic information sharing during critical periods.
Misinformation is also a challenging issue in risk communication. Misleading information and rumors can spread quickly during (also before and after) a wildfire event, which can complicate formal risk communication efforts and lead to confusion among the public [237]. In addition, language and cultural barriers are critical issues that should be considered in risk communication. This can lead to a lack of understanding and preparedness among non-native speakers and those from different risk cultural backgrounds [238].

2.7. Linking Wildfire Risk Assessment, Reduction and Adaptation

Wildfire risk assessment is a critical part of reducing fire impacts, but to be a properly integrated approach it should also be linked to different strategies to mitigate negative fire impacts, as well as to adapt better to future risk conditions [13,239]. Wildfire risk management involves assessments of the likelihood and magnitude of wildfires while developing appropriate responses to reduce ignitions or exposure or increase resilience [240,241,242]. In addition, climate and societal changes require adaptation policies that may prevent the negative impacts of changing fire regimes. Several authors have emphasized the impact of climate change on fire occurrence, particularly the increasing frequency of drought periods and heat waves [243] leading to extreme events [244]. These climatological changes interact with trends of agricultural abandonment, particularly in the South of Europe, as many areas experience a rural exodus [162]. Therefore, these areas face new and heightened risks as landscapes shift from managed, mosaic types with ample variation in fuel density and distribution, to more pyrologically homogenous land covers of even-aged stands with dense, continuous understories [162,245,246]. The expansion of anthropic interfaces and values into fire-prone wildlands explained why WUI [247,248,249] are nowadays areas of big concern, both in terms of human lives and economic losses, especially when coupled with finite financial and labor resources, creating limitations in the application of land, fuel and wildfire management programs [210,250].
Paradigms that focus on complete fire suppression versus fire management and prevention of unwanted fires are still prevalent in some parts of the world, such as in Europe. Given the expense, labor resources, negative effects on fire-adapted ecosystems, and evidence that complete fire exclusion is likely to cause larger, more dangerous fires, both research and policy communities are recognizing the effects of the fire paradox [148,251,252]. In this light, evaluating how wildfire risk can be modified by management and adaptation strategies is crucial to risk-informed decision-making. In order to prioritize activities in the highest risk areas and to identify the best management strategies [41,253,254,255], options must be assessed based on wildfire risk and related components, clear management objectives and coherent identification of management priorities [242,256].
Risk reduction and adaptation strategies span a range of targets, strategies and spatial patterns depending on the objectives, legal structures, socioeconomic considerations and physical constraints in the local context [255,257,258]. Implementing and adopting wildland fire prevention programs requires knowledge about what to do, an awareness of the risks involved, even after mitigation measures are implemented, and, often, the risks associated with taking no action [141]. A number of recent studies have explored some of the spatial and temporal considerations of fire risk mitigation and adaptation strategies, including constraints and performance evaluations [259,260]. Several such studies apply probabilistic modelling approaches based on fire spread simulators, quantifying the spatial and temporal variations in wildfire transmission and losses using measurable variables or metrics (e.g., burn probability, flame length, fire size, source-sink ratios) [259,261]. Outputs from these approaches can be used to characterize and quantify wildfire danger and exposure, as well as to estimate uncertainty associated with wildfire events in terms of timing, location, duration, spread and behavior, and environmental conditions in terms of weather and fuel characteristics [262].
Other studies take a more qualitative or scenario-based approach for addressing fire risk, aiming to include the aforementioned drivers of risk, including climate, socioeconomic and land use changes, to build fire resilience at the landscape level [263,264]. Some studies assess the opportunities to manage fire risk at landscape scales through land management strategies, such as prescribed burn, silvopastoralism, or mechanical removal of fuels [265]. However, the uncertainty around many of the drivers of risk makes the selection and implementation of landscape-level risk management strategies difficult. In the case of prescribed burns, for example, the number and distribution of days which meet meteorological safety and ecological requirements has decreased in parts of the United States due to climate change [266,267], limiting options for its use. Similarly, land-use (such as urbanization, forest conversion, or afforestation efforts) in many parts of the world is very dynamic, creating tension between fire risk planning and the provision of necessary ecosystem services, such as carbon sequestration and biodiversity [200,268]. Adaptation to future fire risk will need to integrate anticipated patterns of land cover and use, socioeconomic trends, and trade-offs for ecosystem services, including the diversity of stakeholder perspectives, to design more fire resilient landscapes.

2.8. Non-Fire Hazards: Cascading Effects

Cascading effects refer to the combination of fire with other natural hazards, which may potentially increase negative fire impacts. This is particularly critical with the growing influence of climate change on different natural hazards, including wildfires and forest diseases as well as their intertwined interactions [269]. These interactions mediate changes in forest health conditions, producing amplifying or dampening effects of wildfires, potentially weakening/enhancing ecosystem resilience [203], but their magnitude is still not well understood. To overcome these challenges, a continuous monitoring system should be developed [270]. Recurrent and distinct disturbances can trigger unexpected effects when they occur in ecosystems that are still recovering from a previous disturbance of a rather different nature. For example, successive disturbances can act synergistically (amplifying effect), antagonistically (buffering effect), or neutrally regarding the differential resistance traits they are linked to. Paine et al. [271] identified how the initial disturbance can change the likelihood and characteristics of the subsequent one (‘linked’ disturbances) or produce effects that change the resistance and resilience of ecosystems to the subsequent disturbance (‘compound’ disturbances). When disturbances co-occur frequently, their interactions may favor adaptations that maintain biome states. By contrast, when disturbances co-occur infrequently, synergistic interactions might cause an expected cascading effect that could result in altered resilience or even switch to alternative biome states [203].
One of the clear examples of cascading effects of wildfires and other natural hazards relies on the increasing fire risk caused by forest plagues. Seidl et al. [272] estimated that climate change will increase the damage from windstorms, bark beetle (Ips typographus) attacks, and wildfires up to +0.91× 10⁶ m3 of timber per year until 2030. However, in the last decades, massive bark beetle outbreaks and wildfires have already occurred at an unprecedented scale and in unusual regions [273,274,275]. While fire-related disturbances barely occurred in Central Europe from 1986 to 2016 [276], wildfires have started to become an emerging threat [277]. In the last 30 years, tree canopy mortality has doubled in European temperate forests because of natural disturbances, land-use change, and especially because of an intensified wood extraction from naturally disturbed areas where trees were dying [272,278]. The combination of different vegetation stressors such as high temperatures, droughts and windstorms in homogeneous forests increases the probability of bark beetle outbreaks at landscape scales [279]. Model simulations indicate that climate change will amplify the effects of future bark beetle outbreaks in Central Europe, however, their intensity could be reduced because of the negative effects of climate change on the spatial distribution of Norway spruce, which is its main host [280]. Increasing dead wood and changing climate conditions bring along a higher risk of wildfires. Therefore, any conceptual scheme for wildfire risk assessment should also consider the integration of other natural hazards, potentially emphasizing, or even mitigating fire risk conditions accordingly.

3. Review of Existing Wildfire Risk Assessment Systems

To illustrate how wildfire risk assessment has been approached by different operational entities, a review on those covering extensive regions, with long tradition and wide range of risk conditions is included in this section.

3.1. USA

A wide range of risk assessment systems and decision support tools are used in the United States, which vary by data and modelling approaches as well as intended uses and decision contexts [281]. In terms of fire danger, it is worth mentioning the National Fire Danger Rating System (NFDRS) [282], now operationally computed within the Wildland Fire Assessment System (http://www.wfas.net/, access on 30 March 2023). The NFDRS is widely used in the United States to account for fire ignition and propagation potential, the latter divided into two components: Spread Component (value numerically equivalent to the predicted forward rate of spread) and Burning Index (index relating to the flame length at the head of the fire, which determines how difficult it might be to control a fire depending on its speed and temperature).
Many of the wildfire risk assessment tools have been developed by or in concert with the USDA Forest Service, the largest wildland fire research and management organization in the US. Perhaps most well-known is the Wildland Fire Decision Support System (WFDSS: https://wfdss.usgs.gov/wfdss/WFDSS_Home.shtml, accessed on 30 March 2023), used for real-time incident decision making and documentation and providing a spectrum of risk-based functionality, including operational risk assessment, probabilistic fire spread modelling and exposure assessment [15,283]. A related quantitative wildfire risk assessment framework is built on common approaches for hazard and exposure assessment, but incorporates vulnerability through the characterization of fire effects as a function of fire intensity, and integrates risk metrics across various resources and assets by accounting for the relative importance through multi-criteria analysis [284]. This framework is now widely used to support preparedness, fuels, and response decisions and is embedded in corporate systems like the Interagency Fuels Treatment Decision Support System [285,286]. Despite its successes, the framework does have some notable limitations; for instance, a poor ability to account for fire impacts that play out over different time scales and the typical use of expected values masks low-probability high-consequence events [287].
One notable area of growing emphasis is on wildfire risk to communities and better characterizing risk in the wildland-urban interface. There is a growing availability of national datasets to support community risk assessment (e.g., https://wildfirerisk.org/, accessed on 30 March 2023), and to prioritize landscape areas for hazardous fuels reduction on the basis of community exposure and fire transmission across landscapes. At the same time, there is growing awareness that risk to communities is much more than risk to homes and structures, for example, considering public health impacts of smoke exposure [288]. There are also trends towards more inclusive participation, collaboration, and incorporation into structured decision making [289], and further towards systems thinking and recognizing the interaction of biophysical and social systems [290].
Another area of growing emphasis in the US is on cross-boundary, collaborative strategic wildfire planning with the potential operational delineation (POD) framework [291]. PODs can encode information from quantitative wildfire risk assessments, as well as information on risk to strategy and risk to fire personnel, and reflect a growing sophistication of fire analytics. PODs are now widely deployed for wildfire planning, landscape fuels management and incident response [292].
Lastly, there is a growing role for risk assessment to support safer fire operations. This expansion reflects increased concern for firefighter safety, and as stated above, a growing portfolio of tools designed to improve situational awareness and assess risk to fire personnel. One recent development is the Severe Fire Danger Index, built by integrating Energy Release Component and Burning Index values from the NFDRS that can forecast extreme fire danger and provide critical information to firefighters [293].

3.2. Canada

Despite having fairly active fire regimes with millions of hectares burned annually, and a long history of fire management and research, Canada does not have a national risk framework or risk-assessment system as in other parts of the world. However, great efforts have been made to assess fire risk for more than 80 years, and research on wildland fire ignition and behavior has been incorporated into the operational decision support systems within wildland fire management agencies in Canada. Outcomes of this long-lasting research effort have been collected in a framework called the Canadian Forest Fire Danger Rating System [294], which consists of four linked modules. Among them, the Canadian Forest Fire Weather Index (FWI) System [295] and the Canadian Forest Fire Behavior Prediction (FBP) System [34,296] are the foundation for wildland fire environment assessment and operational forest fire management decision making in Canada and many countries around the world [34].
The FWI System is strictly a weather-based system that outputs six main indices representing fuel moisture and fire behavior potential. These indices provide a critical tool to tracking fuel moisture and potential expected fire ignition and spread for the day and provide critical information for fire management activities. Fire occurrence models for lightning-caused [76] and human-caused [297] fires have been developed and implemented in some Canadian jurisdictions. The FBP System takes outputs of the FWI System along with other inputs specific to an individual fire and provides quantitative estimates of head fire spread rate, fuel consumption, and fire intensity, along with a basic fire description (e.g., surface vs. crown fire, and crown fraction burned) for 16 forest and rangeland types across Canada. Key elements of the fire environment such as slope and aspect, live fuel moisture content, and curing state of grass fuels are also part of the inputs. In addition, the FBP System also produces a set of secondary outputs to estimate lateral (or flank) and backfire spread rates, and consequently overall fire area perimeter length and growth rate.
These systems are also the foundation for wildfire risk assessment in Canada including propagation probability and fire behavior parameters such as fire intensity and rate of spread. Although burn probability can be assessed using various statistical and mathematical methods (e.g., logistic regression model, machine learning techniques), in Canada it is often assessed using a fire simulation model called Burn-P3 [298]. Burn probability, or the local hazard of burning [299], is the outcome of patterns of ignition and fire spread that vary with local vegetation, topography and climate [300]. This measure [301] provides a spatially explicit, gridded estimate (i.e., per analysis cell) of the likelihood of a grid cell burning for one year (often the upcoming fire season). The Burn-P3 model explicitly simulates the ignition and spread of several fires in a given year over a gridded landscape using the Prometheus fire growth engine [79], then repeats this procedure for a large number (e.g., 104 to 106) of years (i.e., iterations) [298]. Burn probability is estimated as the number of times each pixel burned divided by the number of iterations. This estimate provides a simple proxy for wildfire hazard, but it is not without limitations, as burn probability estimates derived from Burn-P3 have limited predictive power of actual burned areas in subsequent years [302,303]. The Burn-P3 model can also produce some Canadian FBP System outputs, including head fire intensity, rate of spread and fuel consumption. Together with burn probability, these variables can be used to assess fire danger [241,304].
On the fire impacts side of risk assessment in Canada, early work using cost-benefit analysis techniques have addressed issues related to fire risk in fire economics, fire management, and level of protection [305,306,307]. Quantitative methods have also been developed to assess costs and benefits within forest management and timber supply [305,306,308,309]; impact modelling using expert opinion has considered the social, economic, and emergency response impacts [310]; and recent work has been done on response functions for structure impact modelling [311].
Although not adopted by the whole country, some fire management agencies in Canada do incorporate some form of risk assessment in their decision-making within their internal agency systems. These agencies use a variety of tools to inform their decision-making in operational fire management, in the context of their responsibilities and priorities. Applications may include longer-term planning, moderate-term preparedness procedures, and shorter-term operations; though there is no standard set of tools or approaches for risk-based decision making across the various fire management agencies. Insurance companies in Canada use risk assessments for other natural hazards, but wildfire risk assessments are still lagging despite significant economic damages due to wildland fires (e.g., $3.7 billion of direct insurable losses from the fire that damaged Fort McMurray, Alberta, in 2016 [312]).
Much of the data needed for comprehensive risk assessment is available in Canada, including: fuels, weather, topography, various human activities related to likelihood of fire, fire activity, fire danger, human population, structural and infrastructure information and socioeconomic information [304]; and there are many options for modelling fire risk and its components [313]. Research on many topics related to risk is continuing, and there are a variety of initiatives aimed at the development of specific risk assessment tools for a variety of purposes. A national fire risk assessment framework is being developed, national-scale fire risk mapping is being carried out, and a variety of tools to directly support community risk assessment will become available in the coming years.

3.3. Australia

Over the last 60 years Australia has been using a two fuel-specific fire danger system, including the Grassland Fire Danger Index (GFDI) and Forest Fire Danger Index (FFDI) [314]. The McArthur fire danger indexes were operationally applied to all fuel types in Australia and were produced based on the predicted rate of spread and the difficulty of suppression of fires burning in grasslands [314] and dry sclerophyll forest fuels [315] under different weather conditions using a dataset of over 800 experimental fires, complemented with data from high-intensity wildfires.
McArthur’s FFDI uses as inputs air temperature, relative humidity, 10 m open wind speed and precipitation. The latest variable is used to determine fuel availability by applying the drought factor (DF), which is determined based on recent rainfall and partly based on the soil moisture deficit, commonly calculated using the Keetch-Byram Drought Index (KBDI [316]). As the KBDI increases, fuels increasingly become more available due to stress and moisture deficiency. The GFDI is calculated using air temperature, relative humidity, wind speed (10 m), fuel load and the degree of grassland curing, which is used to compute fuel moisture content.
The strength of the system is its simplicity, and it is well understood by the fire industry given its long adoption in Australia. However, the most important limitation is that it was limited to two fuel types and, as such, it does not account for fuel variability (e.g., availability, load, type and structure) [317]. Fuel structural and physical conditions are key determinants of fire behavior and the consequences and impacts of fire. Therefore, the points of transition and descriptors that define each fire danger class also need to be specific to the different fuel types in Australia [317,318].
A new fuel type-specific Australian Fire Danger Rating System (AFDRS) was implemented in September 2022. This system combines fuel-specific fire behavior models for eight vegetation types with fuel, weather and climate datasets to derive Fire Danger Ratings (FDR) and the Fire Behaviour Index (FBI) across Australia. These vegetation types include grassland, savannah, spinifex, buttongrass, forest, mallee heath, shrubland and pine. The purpose of the FDR is to provide an efficient and easy to understand way to communicate fire danger broadly to the community, with categories including moderate, high, extreme and catastrophic based on the range of possible fire behavior, prescribed burning potential, suppression opportunities, and potential consequences of a fire [317].
The FBI is a simple numerical scale that can be used consistently across Australia for a decision that needs finer detail than the FDR categories allow. FBI ranges from 0 to 100 and beyond with increasingly high values indicating increasingly dangerous fire behavior and therefore high fire risk. FBI is calibrated using fire line intensity (kW m−1) for most fuel types (grassland, savannah, forest, shrubland, pine). For mallee heath, three fire behavior metrics are combined: spread probability, crown fire probability and fire line intensity, while for buttongrass and spinifex fuel the fire behavior metric is the rate of fire spread (m h−1). Fuel mapping and modelling use fire history maps to provide time since the fire (years) and calculate fuel levels. Finally, FBI thresholds of 12, 24, 50 and 100 are applied to derive FDR. Calculations are made in a 1.5 km pixel.
The most significant weakness of the system now is the lack of suitable fuel availability models for fuel types other than grass and buttongrass. There is lots of promising work being done to retrieve live fuel moisture content modelling and remote sensing [120,319,320] but it is not yet clear how this information can be applied to fire behavior or fire danger modelling given live fuel moisture is not a direct input in fire spread models.
The future developments of the system will also include fire ignition, suppression and impact (ISI) indices that are still under testing and development [317]. ISI indices will inform a range of decision-making beyond the declared FDR [321]. The ignition index is defined as the likelihood and ease of ignition and comprises three sub-indices: arson, power lines and lightning. This index will improve warning triggers and prepositioning of firefighting resources. The suppression index is defined as the likelihood of initial attack suppression success and will improve situational awareness by real time automated tracking of firefighting resources. The impact index is defined as the likelihood of impact on assets and exposure although current development of the index is purely based on infrastructures lost.

3.4. Europe

The development of a pan-European Wildfire Risk Assessment (EWRA) is the result of the need for a standardized approach for the conception and implementation of European Union (EU) policies. These policies, in the form of EU regulations, which are implemented by the European Commission, or Directives, which are transposed in national legislation, require a unified approach in the EU territory, now composed of 27 countries. The investments of the European Commission in prevention, mitigation, management and restoration of areas damaged by fires are in the order of billions every year, which must be allocated to wildfire risk areas. For example, 1.55 billion Euro were used for prevention and restoration measures in areas at medium or high risk of forest fires within the Rural Development Regulation during the period 2013–2017. Accordingly, in 2014, a request was done to the European Court of Auditors to set up common criteria to assess fire risk in the EU [322]. The EWRA development evolves from the establishment of an agreed expert definition of wildfire risk [28] and the delineation of common basic criteria to assess it [323]. The EWRA development was closely linked with the requirements, advice and iterative peer review of the Expert Group on Forest Fires (EGFF), composed by fire management representatives from 43 countries (including non-EU) and part of the European Forest Fire Information System (EFFIS). EWRA assesses the structural risk based on a climatological analysis of data from 2003 to 2020. Following previous developments [36], fire risk was defined in the EWRA as the combined impact of wildfire hazard on people, infrastructures and ecosystems services exposed in vulnerable areas, explicitly accounting for the multiplicity of risk dimensions and the sources of uncertainty, with a priority for human lives, while also considering ecological and socioeconomic aspects [38,182,324]. The modelling methodology is designed to be scalable to wider spatial extents in future, up to global scale in principle.
Core harmonization elements were introduced to develop the EWRA, including a high-resolution (~0.000257 degrees, approximately 580 m2 at 45-degree latitude) layer of potential burnable land based on state-of-art available information [325]. This layer served as a detailed mask to estimate the probability of false positives when processing the time series of historical fire activity. The iterations with the EGFF consolidated the EWRA structure considering the heterogeneity of the European continent, both bioclimatically and from a social and administrative perspective, and the corresponding diversity of scope and methods for wildfire risk assessment among the European countries. The final EWRA approach [225] defines risk as the joint effect of wildfire danger (or hazard) and the damage that it may cause (exposure and vulnerability), assessed together by considering the wildfire vulnerability of people, ecosystems and goods exposed to wildfires.
An extensive satellite remote sensing data was used to generate the different components and variables of the EWRA. The high-resolution burnable mask was developed using the Global Human Settlement Layer’s built-up product [326], the PROBA-V NDVI from the Land Service of Copernicus and the Joint Research Centre (JRC) Global Water Layer [327]. Historical records (2003–2020) on the location, damage and number of fires (derived from the MODIS thermal anomalies, EFFIS burned area dataset and Corine Land Cover aggregated in two classes (Wildland and Non-Wildland, the latter including urban, industrial and agricultural areas) were used to assess the contribution of fire ignition to wildfire risk. The number and the location of ignitions (based on the proximity between burned areas and thermal anomalies and the percentage of the burnable area in each thermal-anomaly footprint) were used to filter thermal anomalies not corresponding to vegetation fires (i.e., with footprint outside any potential burnable vegetation fuel) as well as to assess the level of fuzzy-confidence in each thermal anomaly being part of a real wildfire. With this robust fuzzy classification, the possibility for thermal anomalies to be wildfire-related was ranked in a way more tolerant to data uncertainty and misclassification, and an improved version of the wildfire danger by thermal anomalies was estimated (mitigating the otherwise large impact of purely cropland fires). Daily data from the Canadian FWI, for the same period (2003–2020), were used to assess the weather wildfire danger conditions, since FWI was also proven suitable for European conditions [33]. As a proxy of high-to-extreme conditions of fire danger by weather [30], the number of days where FWI was higher than 30 was computed for each EURO-CORDEX cell. Additionally, the fraction of burnable area for each thermal anomaly footprint was assessed for each land-cover class from the four Corine Land Cover collections (2000 to 2018) and used as a first proxy to assess the vegetation classes most affected by fires.
Vulnerability, assessed together with the exposure was designed to encompass people (1), ecosystems (2) and goods (3) prone to fire in vulnerable areas. To estimate the people exposed in those areas, the wildland-urban interface (WUI) model specifically developed by Costa et al. [30] was used. The ecosystems exposed were estimated by a qualitative approach using the Natura 2000 network, the World Database on Protected Areas and the Ecological irreplaceability score [328] for each protected area, which reflects the potential contribution of a protected area to conservation goals. The goods exposed in vulnerable areas were assessed by considering the restoration cost of forests and cropland per spatial cell if the entire cell was burned [329,330].
The aggregation of the different risk components included a variety of semi-quantitative and qualitative methods [225]. The chosen aggregation characterized the EWRA methodology as trade-off aware, without introducing any weighting between irreducible dimensions (which includes as a special case monetary weighting or pricing). Weighting, as an additional transformation of distinctly quantified dimensions into a single artificial flat dimension, is unnecessary in the EWRA approach, and would have masked trade-offs. Several components were integrated based on a classical Pareto ranking aggregation [224], which is stable for any possible transformation of the components where the ranking of values is preserved, including change of units and percentile ranking. Moreover, lower priority was given to the areas where all the dimensions of a risk component were consistently lower than in other areas. This mathematical approach ensures that, irrespective of any special preference for a given dimension over the other ones, the lower-concern areas would be de-prioritized in the same consistent, unambiguous way, allowing the assessment to focus on the higher-concern areas.
Virtually all the risk components of the EWRA system are associated with an intrinsic uncertainty, so that integrating them to estimate the final risk magnifies the cumulative aggregated uncertainty. Therefore, this structural uncertainty is the key element of a robust method for identifying which areas to prioritize, where the estimated risk is consistently higher than in other areas. This robust risk assessment is computed by considering multiple simulations of the uncertainty, as explored in a corresponding set of multiple model instances (or model runs). In each model instance, the risk components and their dimensions are aggregated with the aforementioned integration up to a corresponding risk ranking for each instance. The degree of agreement between model instances is estimated, thereby identifying the high-priority areas where most instances agree on these areas being at high risk. Analogously, areas with relatively low risk (lower priority areas) can also be identified, where most instances agree on the same low-risk classification.
The EWRA aggregated wildfire risk index identifies risk classes (from low to high risk) with a simple score ranging from 0 to 100%, which could then be aggregated in three levels of risk: low, intermediate, and high. This index prioritizes the risk for human lives, while also considering ecological and socioeconomic aspects. For this ranking, the mathematical mechanism relied on standard long-established lexicographic sorting algorithms [224]. High risk may be expected where high wildfire danger affects the most critical areas for people, and secondarily for the other ecological and socioeconomic aspects (Figure 2).
Next steps of the EWRA development will include testing and validating the current and future versions in close collaboration with the EGFF. At the same time, future research will focus on deriving enhanced datasets and methods for fuel classification, socio-economic components, and live fuel moisture content.

4. Description of the FirEUrisk Assessment System

This section presents an example of an integrated wildfire risk strategy, which has been developed within the European research project FirEUrisk. The overall strategy includes three phases of wildfire risk: assessment, reduction and adaptation. Once the main factors of risk are defined and assessed, different approaches to reduce the negative impacts of fires on society and ecosystems need to be considered, including minimizing the causes of fire ignition, decreasing the propagation potential leading to extreme conditions, reducing exposure of people and assets and increasing resilience of societies, ecosystem services and ecological values to fire damages [210]. In addition, the FirEUrisk strategy includes modelling how the main risk components will evolve in the future, according to the expected climate and socio-economic changes, to propose adaptation measures that would reduce the negative impacts of wildfires in the foreseeable future [260]. Within this paper, we will present the FirEUrisk developments in the first phase, dealing with fire risk assessment, following the general scope of this review. The FirEUrisk assessment system was designed to cover a wide range of temporal and spatial scales, as well as users, including European, national and regional managers, decision makers, local communities and policy makers. The description of the system includes methods for retrieving the risk components and variables and integrating them into synthetic risk indices for comprehensive characterization of fire risk conditions.

4.1. Spatial and Temporal Resolution

An integrated risk system should be as scale independent as possible. However, the availability and the quality of input datasets is highly dependent on the target scale. Generally speaking, global or continental scales tend to cover larger territories using coarse resolution data, while regional-local scales cover smaller territories at much higher spatial resolution. For the FirEUrisk project, two target scales have been developed: the European Territory (ET), with a total area of around 5 Mkm2 of land covering 33 countries at a target resolution of 1 km2, and selected pilot sites (PS), covering a few thousand square kilometers and a minimum resolution of 0.01 km2 (1 hectare).
The ET area covers European Union member states, except for their tropical islands and Cyprus, plus the United Kingdom, Switzerland, Norway and the countries in the Western Balkans. The selection of PS aimed to consider the variety of fire conditions in Europe, including regions in Mediterranean Europe (Portugal, Spain, Greece), Central Europe (Germany, Czech Republic, Poland) and Northern Europe (Sweden).
Two temporal scales have been considered for assessing risk conditions: near-real time and reference scenarios. The former involves evaluating current conditions, especially for those variables that can change rapidly such as fuel moisture, precipitation, wind speed and direction. For the FirEUrisk project, they will be updated daily (weather variables) or weekly (live fuel moisture content). This near-real time temporal scale should be useful for pre-emergency management and tactical decisions.
Historical reference scenarios, on the other hand, are useful for long-term planning, for instance, to estimate how much area would be exposed in case those reference conditions occur again. Since the FirEUrisk project is mostly interested in extreme fires, two reference scenarios leading to very high or high-risk conditions were selected. The first one was defined by selecting the 95th highest percentile of weather parameters at noon (12 h) for high-risk days, while the high-risk conditions scenario was computed from the same set of high-risk days but taking instead the 50th percentile of the weather parameters. High-risk days were obtained by selecting the ignition dates of any fire that burned more than 2000 hectares in the ET area. The selection of ignition dates was based on the analysis of the 2001 to 2019 time-series of the FireCCI51 burned area product. This dataset was produced within the European Space Agency Climate Change Initiative’s program [331], based on satellite earth observation data [4]. The original product was available at 250 m, organized in continental monthly files that extend from 2001–2019. To estimate ignition points, burned pixels of the FireCCI51 were grouped into burned patches using a contextual algorithm that accounted for the spatial proximity and the date of detection [332]. Ignition points (and respective dates) were obtained by computing the geographic centroid of the contiguous pixels that have no other neighboring pixels with a previous fire date. A total of 403 high-risk days corresponding to those ignition points was obtained for the 19 years of the FireCCI51 time series.
Weather parameters for those 403 days were computed from ERA5-Land global reanalysis data (https://cds.climate.copernicus.eu/cdsapp#!/dataset/reanalysis-era5-land?tab=overview accessed on 30 March 2023). A topography-based transfer function [333] was applied to the 9 km-resolution time series of the hourly ERA5-Land reanalysis data (https://cds.climate.copernicus.eu/cdsapp#!/dataset/reanalysis-era5-land?tab=overview, accessed on 30 March 2023) for the following variables: Temperature, Dew Point Temperature, Relative Humidity, Wind and Daily Precipitation. Particularly, for each climate variable simulated by the reanalysis, the statistical downscaling was based on three steps: (1) For all the variables and for each time step (with 0.073° × 0.073° resolution), a purely geo-statistical approach was performed to a 1km×1km grid by using AIC-based stepwise regression [334] with topological and geographical parameters (altitude above sea level, latitude, longitude and distance to the Atlantic Ocean and Mediterranean Sea). Finally, a bilinear model was applied to the residual errors obtained by comparison of the geo-statistical approach and the original ERA5Land grid point values. In other words, for each hour of the target days, a stepwise regression is used to obtain the interpolation function of ERA5Land data to a 1 km2 grid using as selection method the likelihood function as described in Akaike [335], using the R stat package. The interpolated data are subsequently compared with the original ERA5Land ones in order to obtain the residual errors that are then interpolated with a bilinear model to obtain the final values for the target grid.
In addition, altitude was taken into consideration in the case of temperature. (2) Similarly, for each targeted time step, residual errors of the AIC-based stepwise regression were interpolated from the original grid (0.073° × 0.073°) to the final 1 km2 grid by using a bilinear model. (3) Finally, the projected value for each time step was obtained by adding the result of Step (1) and Step (2), obtaining climate scenarios in a 1 km × 1 km grid at an hourly timescale (daily in case of precipitation).

4.2. FirEUrisk Integration Scheme

In line with the main risk dimensions described in Section 2 of this paper, the FirEUrisk integrated wildfire risk assessment system includes the assessment of danger, exposure and vulnerability (Figure 3). It was built on previous integrated approaches that took into account those elements at different spatial scales [36,38]. The integration of the different components aimed to provide a comprehensive view of risk conditions, which may be later on integrated with other natural hazards, while considering the potential cascading multi-risk effects. This section covers the three main components of wildfire risk, while the following one (4.3) deals with the variables that each of those components include.

4.2.1. FirEUrisk Danger

Danger was estimated from ignition causes and propagation potential. The former includes human and natural fire ignitions, while the latter includes the estimation of fire behavior, considering fuel and terrain characteristics, as well as the weather scenarios indicated in Section 4.1. Section 4.3 contains a detailed analysis of the variables generated for this component, including the probability that lightning causes fires, human factors that lead to accidental or intentional ignitions, as well as fuel moisture content and propagation modelling.

4.2.2. FirEUrisk Exposure

Exposure potential was quantified based on the juxtaposition of fire exposed related values with the spatial distribution of fire metrics. The final output—fire exposure potential (ranging from 0 to 1, for a combination of a given fire metric and value at risk)—was computed using the following equation:
E x p o s u r e   p o t e n t i a l   = F i r e   m e t r i c s × V a l u e s   a t   r i s k M a x   ( F i r e   m e t r i c s × V a l u e s   a t   r i s k )
where the fire metrics include the main fire propagation characteristics (see Section 4.3.4), such as fireline intensity or rate of spread, but also atmospheric emissions (gases and smoke), while values at risk include both human assets and ecosystem services. The main purpose of this equation is to easily identify the grid points with higher values of exposure, and exposure results from the product between the chosen fire metric value and the chosen exposed element quantity (i.e., fireline intensity and number of buildings). It is assumed that both fire metric and exposed element always have a similar weight and it is possible to have one of the components of exposure driving the final value and this is part of the exposure concept. For instance, in case the quantity of exposed elements is low, but the fire metric is high, the final exposure value will be low. Moreover, this equation allows representing with the same dimensionless scale, and for all the selected fire metrics and exposed elements, the exposure potential spatial distribution, which can be used in the development of an integrated approach to wildfire risk assessment. As a first approach to estimate this variable, the exposure to population and assets was modelled, taking as a case study one of the PSs of the project (see technical details in Section 4.3.5).

4.2.3. FirEUrisk Vulnerability

Vulnerability was determined by the initial values at stake and their resilience (in terms of coping capacity and recovery time) and comprised potential impacts of fires on both social (including here houses, infrastructures and ecosystem services) and ecological values. Figure 4 includes the general model that was used to estimate vulnerability, which is better adapted to ecological values (EV), but can also be applicable to social assets and ecosystem services (ES). Actual loss was obtained from how much of the pre-fire value (Potential Loss) would vanish as a result of fire. For EV, losses depend on fire conditions, but also on landscape resistance to fire (RST), while for ES they depend on the characteristics of that specific service. For instance, with a mild-severity fire the timber value may be reduced just in a small proportion, while pastures may be completely lost. The resistance to social assets would depend on the level of protection of houses and fuel density in the surroundings of the WUI.
The time length needed to recover up to the pre-fire conditions indicates the recovery time (RT), which is related to the landscape resilience to regrowth after fire, in turn related to the plants’ reproductive strategies (regeneration time, RGT), their recovery growth rate (RCR) and in turn their recovery time (RT) (time needed to recover to pre-fire state based on the RCR) locally modified by the landscape abiotic conditions in the case of EV, while for ES and social assets would vary greatly depending on the ES considered (i.e., pastures would have a quick recovery, while timber would require a 20–40 years depending on the species and the biophysical conditions of the area).

4.3. Methods to Generate Risk Variables and Components

4.3.1. Natural Ignition

Natural ignition usually refers to lightning activity, which is the dominant natural cause of fires and can be the main ignition mechanism in remote areas with low population density and poor accessibility. The primary type of lightning that can ignite wildfires is lightning strikes with a long continuing current (LCC), which refers to a discharge that lasts for more than 40 ms in a return stroke. Compared to short-duration lightning, LCC lightning can heat wildland fuels for a more extended period and transfer more energy, making it more effective at igniting fuels. Therefore, lightning-caused wildfires can potentially be assessed based on the duration of lightning’s discharge or the amount of energy it produces [336]. Another dimension is added to this by considering the polarity of the lightning strike: Latham and Williams [337] theorized that positive Cloud-to-Ground (CG) strikes are more likely to ignite wildfires. Interestingly, regions with the highest number of lightning flashes do not necessarily produce the most flashes containing LCC [338]. In other words, less frequently occurring lightning is more likely to contain LCC. It is essential to take into account the change in the global occurrence rate and spatial pattern of total lightning due to climate change [339].
The first step of the natural ignition model was the prediction of the lightning flashes themselves. Despite the availability of global lightning observing systems, their quality and data availability may be problematic in many parts of the world. However, modern weather prediction models provide a sufficiently detailed description of convective clouds and thunderstorms, allowing for quite accurate lightning flash density prediction for up to a few days forward [340] (Figure 5). The next step includes converting lightning flash density into fire ignitions. It involves numerous governing physical processes such as wind speed, precipitation occurrences and strength, lightning characteristics (e.g., presence of a long continuous stream of electrical current), and fuel readiness and availability to ignite. Therefore, statistical models seem more suitable for their description [78]. The FirEUrisk project utilizes the Fire Forecasting Model developed by the Finish Meteorological Institute, which employs a multi-step machine-learning procedure to construct a statistical model predicting FRP. The model uses various meteorological parameters and Fire Danger Indices as predictors for training and predictions computing their corresponding contributions to total FRP. Then, Cloud-to-ground lightning flash density contribution to FRP serves as a proxy for natural ignition probability that is integrated with ignitions caused by humans.

4.3.2. Human Ignition

Modelling of human ignition was approached from empirical models based on historical fire occurrence. Unfortunately, there is not yet a publicly available centralized database in Europe where all fires are recorded, as temporal length and spatial accuracy of available fire reports varies throughout European countries. For this reason, the same method used to define the high-risk days (see Section 4.1) was selected to define historical fire occurrence for human ignition modelling. However, in this case, ignition points from all sizes of burned patches were considered, not just those from patches above 2000 ha. Since those small patches also included agricultural fires, only those ignition points located in wildland areas were kept. Patches within wetlands or agricultural areas not interfacing with forested covers (>500 m) were removed. The final ignition point dataset included 55,214 fire observations (Figure 6).
The Ignition probability model was derived from a Random Forest algorithm [341], using a wide set of explanation variables derived from different statistical and cartographic sources [342]: distance to roads, urban-forest, forest-grassland and forest-cropland interfaces, urbanization degree, livestock density, land cover and land cover change, gross domestic product, population density and senior population proportion (>65 years), and various bioclimatic indices. All were resampled at the target spatial resolution of 1 km2. The RF model was run using a sample of 70% of ignition points for calibration and the remaining 30% for validation. Non-ignition points were selected randomly in the whole ET area, selecting 1.5 times the number of ignition points to avoid model imbalance. Several models were run, including all variables and only those that were human-related. Since fires in the Mediterranean have different characteristics to those in Central and Northern Europe, these two regions were modelled independently as well. Finally, two seasonal models were derived to account for variations between summer fires (May-September) and late winter-early spring ones, as both have regularly different fire conditions.
Figure 6. Ignition points selected for the human ignition model (left) and final output of the model (right). After [342]).
Fire 06 00215 g006
Results offered a high degree of accuracy, with omission and commission errors lower than 15% in most models. Spatial patterns of the model closely resemble the distribution of ignition points (Figure 6). The global model including all ignition points identified the livestock density, distance to roads and population aging as the most explanatory variables. When the biophysical variables were taken into account, average evapotranspiration and aridity index also had high importance. Partial dependency graphs showed non-linear relations in several variables, which indicate the complex patterns of fire-human relations [342].

4.3.3. Fuel

To consider the great variety of European fuel conditions, first a hierarchical fuel classification system was developed, including surface and canopy fuels, which could be used for both target scales, ET and PS [343]. This FirEUrisk classification system includes 80 fuel categories, structured into the following seven main fuel types: (a) Forests (areas with canopy cover ≥ 15% and canopy height ≥ 2 m); (b) Shrublands (areas with shrubs, scrub, garrigue, and maquis); (c) Grasslands (areas with herbaceous non-cultivated vegetation); (d) Cropland: (areas with cultivated vegetation); (e) Wet and peat/semi-peat land (which in turn comprises areas with a permanent mixture of vegetation and water, including marshes; moorland/heathland; peatlands and peat bog, and moss and lichens; (f) Urban (areas with ≥15% of built-up structures and/or buildings); (g) Nonfuel: (areas with permanent water bodies, open sea, snow, ice, bare soil, sparse vegetation (<10% of terrain cover). Forest fuel types were subdivided as a function of both canopy characteristics: leaf type (broadleaf/needleleaf), phenology (evergreen/deciduous), and fractional cover (open/closed), as well as the understory characteristics, including type (grass/shrub/timber litter) and depth (three height classes). Regarding the other main fuels, subcategories were based on fuelbed depth (grasslands and shrublands) and characteristics (herbaceous or woody, for croplands; tree, shrublands and grasslands for wet/semi peatlands). Urban fuels were split into continuous and discontinuous fabric.
This classification system was used to generate all fuel type datasets for the FirEUrisk project, including the whole ET [343] (Figure 7 left) and PS (Figure 7 right). The former were obtained from existing land cover and biophysical models, while the latter were generated from high resolution satellite image classification [344], with resolutions ranging from 100 to 20 m. Both ET and PS fuel type maps were associated to existing fuel models: a preliminary assignment for the ET area was done using the Fire Behavior Fuel Model (FBFM) standard models [88], where for the PS the fuel models were estimated from field data or biophysical regional estimations.
Fuel moisture content was computed for fire propagation potential. For dead fuels, the FMC was computed from weather variables using an adaptation of the Nelson model [345] to estimate the 10h Dead FMC for high-risk and extreme-high conditions (see Section 4.1). The weather inputs were obtained and rescaled from ERA-5 (https://www.ecmwf.int/en/forecasts/datasets/reanalysis-datasets/era5, accessed on 30 March 2023) and Worldclim (https://www.worldclim.org/data/worldclim21.htmland, accessed on 30 March 2023), and downscaled to 1 km2. DFMC values were divided into four classes, according to the 10-h DFMC code: D1L1: Very low dead FMC, fully cured herb, D2L2: Low dead FMC, 2/3 cured herb, D3L3: Moderate dead FMC, 1/3 cured herb, D4L4: High dead FMC, fully green herb.
The procedure to estimate Live Fuel Moisture Content (LFMC) was based on retrieval from Sentinel-2 and Sentinel-3 satellite observations, following previous studies from Yebra and collaborators [99,120,346]. The vegetation was described in terms of three basic vegetation types: grassland, shrubland and forest. The first two were represented using the combination of two Radiative Transfer Models (RTM): the PROSPECT-D leaf optical properties model [347] and the 4SAIL canopy bidirectional reflectance model [348]. In addition, the forest vegetation type was described using the version of the Jasinski geometric model developed for GeoSail [349,350], which allows the use of the 4SAIL output to represent discontinuous vegetation. In order to classify vegetated pixels into the three basic classes, the EU Worldcover 2021 (https://esa-worldcover.org/, accessed on 30 March 2023) was used for the Sentinel-2′s 10–20 m resolution product, and Corine Land Cover 2018 (https://land.copernicus.eu/pan-european/corine-land-cover/clc2018, accessed on 25 March 2023) for the Sentinel-3′s 300 m resolution product. These broad categories are used to differentiate the boundaries and distributions of the biochemical and geometric parameters that describe the leaf and canopy model.
To ensure the feasibility of the estimation of the parameters relevant to LFMC through an inversion procedure, Global Sensitivity Analyses of the different model combinations and parametrizations were performed in the Sentinel-2 MSI and Sentinel-3 OLCI and SLSTR channels [351] using the spectral response functions published by ESA (https://sentinels.copernicus.eu/web/sentinel/user-guides/, accessed on 25 March 2023).
The inversion strategy was based on Look-Up Tables (LUT), a methodology which is often favored in the related literature for the sake of its performance and relative simplicity of implementation. In addition, using LUTs allows to leverage the parametrization studies performed in past years with the explicit objective of LFMC estimation [119,352]. The 300-m resolution product based on Sentinel-3 was developed for different PS areas of the FirEUrisk project (Figure 8), while the 10–20 m product based on Sentinel-2 was computed only for certain demo areas.

4.3.4. Propagation

Modelling of propagation variables was carried out with two different methodologies. For the ET area, custom implementation of Rothermel’s equations for cell-based wildland landscape fire growth simulations was carried out. These equations take into account mid flame wind speed, fuel moisture, elevation, aspect and fuel model. Exact pixel values for slope and mid flame wind speed were used. Each weather scenario (see Section 4.1) represented either the average or extreme weather conditions associated with a specified wind direction scenario (e.g., northeast wind). 95th percentile values were used to define extreme conditions, while 50th percentile values were used to define high-average ones. Outputs of Rothermel equations were: Rate of Spread (m/s), Reaction intensity (kW/m2), Fireline Intensity (kW/m) (see Figure 9) and Flame Length (m). These variables were computed for the ET area using the two reference weather scenarios, with the DFMC modelled for those conditions and the fuel type dataset described in Section 4.3.3, using the adaptation to the Scott and Burgan fuel models [88], done by Aragoneses et al. [343]. Elevation data was downloaded and rescaled from NASA Shuttle Radar Topography Mission data (https://lpdaac.usgs.gov/products/srtmgl1v003/, accessed on 30 March 2023). Both aspect and slope density data were extracted from this dataset.
The method used to estimate propagation for the different PS of the project was based on a different approach to obtain a more detailed analysis of spatial variations within those sites, based on higher resolution spatial datasets. Propagation modelling was based on the Minimum Travel Time algorithm provided by FlamMap [49], which estimates burn probability for every pixel based on certain weather conditions, fuel parameters and topography, using a stochastic method. To obtain the reference weather conditions, historical fire ignitions were obtained from national statistics, taking at least the last 20 years. Only weather scenarios responsible for more than 10% of overall detected burned area were taken for further examination. Fuel types were obtained from high-resolution products (as indicated in Section 4.3.3). In this case, the propagation model included forest canopy characteristics. Tree Cover Density data was obtained from the Copernicus land service (https://land.copernicus.eu/pan-european/high-resolution-layers/forests/tree-cover-density, accessed on 25 March 2023), while tree height was obtained from Simard et al. [353]. Canopy bulk density (CBD) and canopy base height (CBH) were spatialized using canopy height and canopy cover data intervals, using average CBD and CBH data extracted from the PREVINCAT project (https://previncat.ctfc.cat/en/index.html, accessed on 25 March 2023).

4.3.5. Exposure to Population and Assets

As a first approximation to consider exposure in the integrated FirEUrisk strategy, a methodology was developed to assess the level of exposition of human population to smoke emissions derived from wildfires. The selected area to test it was one of the Mediterranean PS of the project (the province of Barcelona). This area is located in northeast Spain and encompasses 7.726 km2. It includes the metropolitan area sprawling around the city of Barcelona, with high density of population and extensive WUI zones. More than 22% of this area includes some nature protection figures, experiencing high touristic pressure. Exposure was estimated as the potential level of smoke pollution for the whole PS with a spatial resolution of 1 ha. The methodology to estimate atmospheric emissions per grid cell was based on fuel type, burned area, fuel consumption, fire characteristics and emissions factors (by combustion phase: flaming and smoldering).
National maps were used to generate a point file with residential house locations, in order to accurately identify all individual residential structures. The road network was obtained from the OpenStreetMap dataset (https://wiki.openstreetmap.org/wiki/Downloading_data, accessed on 13 March 2023), and the Natura 2000 protected sites was downloaded from the European Environment Agency (https://www.eea.europa.eu/data-and-maps/data/natura-14, accessed on 20 November 2022). The GISCO database was used to obtain the spatial distribution of the population in the study region (https://ec.europa.eu/eurostat/web/gisco/geodata/reference-data/population-distribution-demography/geostat, accessed on 20 November 2022). Its database contains core geographic data (e.g, administrative boundaries, and population grid data) covering the whole of Europe and is based on the official statistics from National Statistical Institutes.
A large set of modelled fire perimeters corresponding to more than 12,000 years or iterations using the FlamMap algorithm [49] were used to generate fireline intensity and wildfire rate of spread for each grid cell. Atmospheric emissions were estimated by a bottom-up approach where the main required input data were the fuel type, fuel load, burned area (ha), fuel consumption (t/ha), fire intensity (kW m−2), and emission factors (g kg−1) by combustion phase (i.e., flaming and smoldering) [354]. The fuel type and fuel load were obtained from the FirEUrisk products (see Section 4.3.3). Fire intensity was estimated from fireline intensity (kW/m) and flame length (m) per grid cell provided by the FlamMap simulations. This fire parameter was used to provide separate estimates of flaming and smoldering for each fuel type by assuming that flaming combustion cannot be sustained below an intensity of about 15 kW m−2 [355]. The burned area per grid cell was estimated also using the fire progression provided by the outputs results from FlamMap. To estimate fuel consumption, an empirical model developed by Prichard et al. [356] was used. A literature review was performed to obtain the most suitable emission factors for the European Region [357,358]. Based on smoke emissions, pollutant concentration levels in the air were simulated considering the maximum expected value of concentration assuming the Gaussian dispersion modelling approach [359]. Figure 10 illustrates the result of this calculation, showing population’s potential exposure to PM10 emissions from wildfires in the Barcelona province. The average potential exposure computed was low (99% of the values were lower than 0.2), with an average of 0.01 and a standard deviation of 0.03. The higher values were found in the surroundings of the city of Mataró, located the NE of Barcelona (red box indicated in Figure 10).

4.3.6. Ecosystem Services

Assessment of regulating ES for the FirEUrisk project for the ET area was done using the standard methods of natural capital used previously in Europe: including the work of La Notte [158] and outputs generated by the INCA project carried out by the JRC (https://ecosystem-accounts.jrc.ec.europa.eu/, accessed on 25 March 2023) on crop pollination, flood control, carbon sequestration, water purification and soil erosion. Provisioning services provided by the agricultural and forestry sectors were estimated for the stock of perennial crops (fruit trees, olive trees and vineyards), timber and livestock. Manufactured capital like residential properties in the WUI was also considered. To estimate the value of the natural and manufactured capital (expressed in euros per hectare in 2021 constant price), our approach has integrated statistical information (biophysical indicators) provided by EUROSTAT at NUTS1 or NUTS2 scale with the Corine Land Cover maps (https://land.copernicus.eu/pan-european/corine-land-cover, accessed on 10 March 2023), for each of the habitats and land use assessed, and prices of each asset provided by different sources (reports, peer reviewed papers and information from the different websites). Figure 11 includes an example of the total value of the ES assessed expressed in monetary units (€/ha year), in 2021 constant prices.
ES values at local scale for the different PS areas were generated using the SEVEIF model [360,361], which integrates a broad range of ecosystem services, such as timber, fruits and cork harvesting, pasture, hunting, carbon sequestration, soil protection, biodiversity, landscape and recreational resources. The objective of the SEVEIF model is the monetary quantification (in terms of euros per hectare) of the impact that wildfires have on natural resources, based on the net value change of the resources (NVC). The model considers the pre-fire value of each resource and a depreciation ratio based on wildfire scenarios simulated by Visual SEVEIF software (www.labif.es, accessed on 15 March 2023). Fire propagation was classified into seven categories of fire intensity to predict expected damages. The depreciation ratio for each of these levels and each ES is expressed as a percentage of value to simplify the methodology and field inventories. Finally, the net value change of each resource (value loss or value gain) was calculated as the product between ES values and fire intensity level. The SEVEIF model incorporates the net-value change based on field inventories performed for large wildfires, comparing burned areas with unburned control areas for each of the ES. The sum of all potential impacts on environmental services is presented as the potential fire impacts in each PS. In this sense, the SEVEIF tool involves more than an economic assessment of natural resources, showing the potential losses to fire (Figure 12).

4.3.7. Ecological Values

The EV included in the first version of the FirEUrisk integrated scheme took into account four components: soils, vegetation, fauna and the conservation value through natural protected areas. The ecological values of soils were first assessed as the main resource for vegetation growth, regeneration and survival. Soils provide the water storage and nutrient supply for plant growth. The subsoil and topsoil Available Water Content (AWC) based on soil texture, soil depth and rock fragment content provided by the JRC (https://esdac.jrc.ec.europa.eu/content/european-soil-database-derived-data, accessed on 10 March 2023) was used. Soil N and P content was also available from the JRC referring to top soil N and P concentration in soils and it was used as the standard fertility status without disturbance (https://esdac.jrc.ec.europa.eu/themes/npk-european-soils, accessed on 10 March 2023).
Ecological values related to vegetation were assessed through forest biomass [362], maximum tree height as a proxy of forest diversity [363] taken from [364] (https://glad.umd.edu/dataset/gedi, accessed on 10 March 2023), landscape habitat diversity based on tree cover from Hansen et al. [365] (https://data.globalforestwatch.org/documents/tree-cover-loss/explore, accessed on 15 March 2023), and tree height coefficient of variation within a 1km grid cell from the 30m resolution raw data.
Animal species diversity was obtained from the potential habitat data for each species of mammals, birds, reptiles, and amphibians available in the IUCN repository (https://www.iucnredlist.org/resources/spatial-data-download, accessed on 20 January 2023). Bird biodiversity analysis was taken from Fusco et al. [366] (http://datazone.birdlife.org/home, accessed on 10 March 2023). For reptiles and amphibians, the data were produced by Sillero et al. [367] (https://www.seh-herpetology.org/distribution-atlas, accessed on 15 March 2023) and for mammals the input data came from the European atlas for mammals (https://discovermammals.org/projects/the-2nd-european-mammal-atlas/, accessed on 15 March 2023). From these databases, the presence of each species was resampled at 1 km2, following the target resolution of the FirEUrisk project. The same source was used to estimate the potential habitat data for each species belonging to the category of “critically endangered”, “endangered” and “vulnerable” of mammals, birds, reptiles, amphibians and vascular plants.
Finally, places of special conservation were used to weigh each ecological value according to human perception and strategies of conservation priorities. Data were downloaded from the World Database on Protected Areas (WDPA) (https://www.protectedplanet.net/en/thematic-areas/wdpa?tab=WDPA, accessed on 15 March 2023). Only the terrestrial protected areas classified under the International Union for Conservation of Nature’s categories I–IV were considered, since they have reliable data, verified on the ground, and they are managed in a similar way, thus enabling us to assume that they all have the same biodiversity conservation values. The vector data layer was converted to raster binary data by assigning the value 1 where a WDPA was located and 0 where it was not.
Objective valuations for conservation areas were estimated from the Key Biodiversity Areas (KBA) maps [368]. KBAs have outstanding biodiversity value due to their extraordinary ecological integrity, globally significant ecosystems, or significant populations of animals, fungi, and plants. The Intact Forest Landscapes (IFL) dataset [368] was used to obtain the extent of the forests and terrestrial ecosystems that remain unaltered by humans, with a minimum mapping unit of 500 km2. Human pressure was also used as a surrogate of landscape fragmentation produced by human infrastructures, road and railways, with the highest percentages corresponding to highly degraded or heterogeneous landscapes and the lowest to areas that are unfragmented or homogeneous. The database was collected from the United Nations Environment Program (www.unep.org%2Fdata-resources&usg=AOvVaw3tEdJJmd7wlzixU-1TIMNN, accessed on 25 January 2023). Old growth undisturbed forests were derived from forest cover change dataset of Hansen et al. [365].
All the variables were normalized between 0 and 1 through a linear function for an equal weight assemblage in a Principal Components Analysis (PCA) [369]. This technique reduces the complexity of a multivariate dataset by extracting the most explicative axis that summarizes the input variables by minimizing the correlation among the new components. PCA has been previously used for spatial assessment of ecosystem multifunctionality [370]. In the context of ecological values, PCA can be used to identify the most important factors that contribute to biodiversity, ecosystem health, or other ecological measures. For example, a PCA analysis of ecological data might identify factors such as habitat diversity, soil quality, water quality, and nutrient availability as the primary drivers of ecosystem health in a particular area (Figure 13).

4.3.8. Resilience

Following the general integration scheme and the resilience theory (see Section 2.3.7) a conceptual mechanistic approach using plant species strategies of resistance and coping capacities to generate an ET resilience map based on plant species distribution was used as a more consistent approach to identify and assemble keystone variables related to ecological resilience. As a first step, the actual loss (AL) caused by a fire occurring at time t0 can be calculated as follows:
AL = PL − RST 
where PL is the potential loss and RST the species resistance to the disturbance.
The second step integrates the post fire regeneration delay, which is the period after the fire when the vegetation remains at state RST during the regeneration time (RGT) until viable regeneration material is available on site. As a third step, the recovery time can be estimated from a generic logistic function, which was used by several authors for post disturbance dynamics [199] and applied for multiple ecosystem functions as follows
f r e s ( t R G T ) = A L 1 + e R C R · ( t R G T R C T 2 )
where fres is a function of time after fire t (in years), with parameters related to recovery concepts of regeneration time (RGT, in years), as the time needed to get a viable seed bank and to start growing, and recovery rate (RCR) as the slope the maximum recovery at the inflexion point occurring at time ti = RCT/2. RCT is the time (in years) needed to recover the actual loss (AL in biomass), thus being AL/RCR. The main parameters of Equations (5) and (6) were deduced from species functional traits and forest growth models. Resilience (RES) was finally evaluated as the area under the curve; meanwhile, the regeneration process takes place.
Based on the dominant tree species map from the European Atlas (https://forest.jrc.ec.europa.eu/en/european-atlas/atlas-data-and-metadata/, accessed on 30 March 2023), the information on resistance and recovery of vegetation to fire for each of these species was obtained from the BROT 2 and TRY databases. The BROT 2.0 is a database of functional traits for vascular plant species of the Mediterranean Basin (https://www.uv.es/jgpausas/brot.htm, accessed on 30 March 2023). The database includes 25,764 individual records of 44 traits from 2457 plant taxa distributed in 119 taxonomic families. Trait data were obtained from a comprehensive literature review, plus some field and experimental observations. All records are fully referenced and, in many cases, include geographic coordinates. The TRY (TRY Plant Trait Database) data is a global database of plant traits that provides standardized information on the characteristics of plant species from around the world (https://www.try-db.org/TryWeb/Home.php, accessed on 30 March 2023). The TRY database contains information on a wide range of plant traits, including morphological, physiological, biochemical, and ecological traits. The data were completed for temperate and boreal biomes from a collaborative expert knowledge.
Resistance was assessed through species traits on bark thickness, wood density, and specific wood composition as cork (as in the Quercus suber species). The ecosystem resistance at 1 km2 resolution was calculated as the weighted mean of traits according to species cover.
Vegetation regeneration time (RGT) was assessed through species regeneration strategies (seeders or resprouters). Recovery rate (RCR) was assessed through shade and drought tolerance, and growth rate obtained from forestry models [371,372]. The ecosystem recovery at 1 km2 resolution was calculated as the weighted mean of RGT and RCR traits according to species cover.
From this standard potential resilience, local modifiers that alter regeneration and recovery were identified and assembled. The regeneration time RGT of species, according to their regeneration strategies, is affected by time since the last fire, as short fire intervals might prevent tree maturity and subsequent seed production allowing for regeneration (RGT). This information was built from the FireCCI51 burned area product [4] for fire events larger than 250 ha. The daily burned date information at the pixel level was used to deduce the time since the last fire (in days), which was combined with fire size as a modifier for regeneration time, since seeder species take longer time to colonize a large fire than a small fire. The pixel aggregation from Laurent et al. [332] was used for the fire patch event database.
The recovery rate RCR locally depends on climate and edaphic conditions. ERA5-land mean annual temperature, solar radiation and precipitation were assembled at 5 km resolution, locally modified by slope, aspect and altitude derived from Aster-gDEM at 30 m and resampled at 1 km2 resolution. Post fire recovery rate (RCR) was also modified by soil AWC, soil fertility based on the standard soil N/P content (see Section 4.3.7), affected by fires from volatilization and wind/water post fire erosion potentials.
Post-fire soil loss and recovery was assessed by estimating nutrient depletion as the amount of leaf N and P volatilized during combustion, as the product of Leaf Area Index (LAI), specific leaf area (SLA) (mm2 mg−1), leaf nitrogen content (LNC) (mg g−1) and leaf phosphorus content (LPC) (mg g−1). These datasets were obtained from Moreno-Martínez et al. [373]. Post fire N/P stock recovery was based on N Atmospheric deposition map (https://www.syke.fi/en-US/Current/Sciencepolicy_cooperation_has_improved_a%2859833%29, accessed on 20 March 2023). Since water and wind erosion can affect soil AWC and N/P deposition from ashes through erosion processes, both factors were considered taken the information from Borrelli et al. [374]. To estimate post-fire soil erosion potential, the Soil Erosion map for Europe (https://data.jrc.ec.europa.eu/dataset, accessed on 18 December 2022) was used as an input to the Revised Universal Soil Loss Equation (RUSLE). The values were then transformed into a categorical variable, 1 for lowest values and 5 to highest values according to the criterion for soil erosion due to water, proposed by the FAO (FAO/UNEP/UNESCO, 1979): 1 for values between 0–20, 2 for values between 20–50, 3 for values between 50–200 and 4 for values over to 200, which is also applicable to fire erosion processes [211].
Finally, humans might play a significant role in post-fire forest recovery by stimulating planting. For this variable, we used different management maps [204,375] which affect the regeneration time (RGT) as a local modifier of regeneration.
From this mechanistic framework, all identified resilience variables were combined using again PCA to generate the final ecological resilience map.

4.4. Integration Approaches

4.4.1. Conversion to Risk Values

The original measurement scales of the different input values were converted to common risk scales using different approaches, adapted to the particularities of each variable. For the Ignition components, the original probability scale (0–1) was maintained. The FMC of live and dead fuels was kept as a percentage of dry weight to be included in the propagation potential model, along with slope, and wind conditions for the two reference wildfire scenarios described in Section 4.1.
Based on the propagation outputs, propagation probability (PP) was computed from the fireline intensity (FI), which is considered as a synthetic measure of fire suppression difficulty. Based on previous studies [36], this conversion used the threshold values for fire suppression proposed by Rothermel [44] (Table IV-1). The PP values increased linearly from 0 for FI = 0 kW/m to 0.5 for FI up to 346 kW/m (100 BTU/feet/s), implying fires that can be attacked by fire brigades with manual tools, from 0.5 to 0.75 for FI between 346 and 1731 kW/m (500 BTU/feet/s), where machines and aircrafts can be used, and from 0.75 to 1 for values ranging from that threshold to the maximum FI.
Vulnerability was estimated from potential losses in ecosystem services, population and infrastructures, and ecological values. The socio-economic aspects were quantified in monetary units, while the ecological vulnerability was quantified using principal component analysis, leading to a common risk score (0–1). To facilitate the integration between these two components, the monetary values were converted to a 0–1 score using a normalization process after logarithmic transformation, since the distribution of values was skewed by the high values of houses and infrastructures.

4.4.2. Integrated Risk Indices

To obtain the synthetic fire danger component, ignition and propagation probability were combined using the Kolmogorov probabilistic rule (following Equation (3)).
For the integration of the Danger component of the FirEUrisk scheme, a simple weighed average of ignition potential (IP) related to causative agents and propagation probability (PP) was performed, following experiences from previous projects [38]. As a first approximation to Danger (D), PP was given twice the importance of the IP component:
D = 0.33 × IP + 0.66 × PP
The integrated vulnerability was obtained by merging the socio-economic and ecological vulnerability using a weighted average: the former was weighed by a factor of 0.6 and the latter by 0.4, assuming that human values are more important in wildfire risk assessment.
Finally, the FirEUrisk integrated risk index (IRI) was obtained by combining the Danger, Vulnerability and Exposure. From the first two, higher weight was given to the danger component, which is more dynamic, than to the vulnerability component (0.6 and 0.4 respectively). The Exposure was divided into three classes: unburnable (0), burnable (0.8) and areas with a wildland urban interface or intermix (1), which are the most exposed in terms of human lives and houses. Exposure was included as a multiplicative factor, to avoid considering at risk unburnable covers. The final formula of the IRI was:
IRI = (0.6 × D + 0.4 × V) × E
Figure 14 includes an example of the final index, considering the weather scenario related to historical occurrence of extreme fires, as indicated in Section 4.1. As expected, higher values are found in the Mediterranean countries, particularly in Western Portugal, Northwest and Central Spain, Southern Italy, the Balkans, Greece, Central Bulgaria and Romania. Lower values are found in Central and Northern Europe, with intermediate in Western British Islands and scattered regions in Central and Northern Europe, including the Baltic countries.
It should be considered that the integration of the different risk variables implies simplifying the different dimensions of risk, and therefore the FirEUrisk risk assessment system will provide all intermediate risk products to the end-users, along with a flexible tool to combine them in different ways. In addition, the most experienced users may create their own combinations of variables, by assigning different weights to the risk components. In this way, the various end-users can access the information they are most interested on, as well as combine the different risk variables and components following his-her own priorities, while the general public and policymakers at least a first approximation to the integration of the different wildfire risk components.

4.5. FirEUrisk Information System

The FirEUrisk project has built a dedicated platform to store all spatial data sets generated and geodatabases developed in the context of FirEUrisk by the consortium partners for the ET and PS areas, which will be the primary target for integration. In addition, the system hosts all the risk components and variables considered in FirEUrisk for the ET and PSs. Access to this information is available through a dedicated web mapping service. Some layers are also accessible through a dedicated mobile app, developed as a citizen-science application that allows ordinary citizens to report and gather fire risk information, such as fuel information or fire alerts.
Wildfire risk communication and citizen science applications can work together to improve the understanding and management of wildfires. In particular, citizen science applications can play an important role in wildfire risk communication by engaging the public in research and monitoring efforts, providing valuable data for fire management agencies, and increasing public awareness and understanding of wildfire impacts.
End users of wildfire risk information will test the relevant FirEUrisk component in six Demonstration Events. In these events, the consortium will engage with stakeholders to show them preliminary results of the project. Representatives of the target audiences addressed in the different PS and ET area will use web tools to provide relevant feedback via validation forms. The contributions collected from members of the scientific community, first responders, landowners/managers, policy and regulation makers, industrial stakeholders, civil society organizations, risk prevention communities, and the general public will help improve the FirEUrisk information system in the following two years. The system was developed during the project’s first half and will be demonstrated during the fire seasons of 2023 and 2024.

4.6. Integration of Assessment, Reduction and Adaptation

As indicated earlier, the FirEUrisk project aims to link risk assessment with reduction and adaptation to future wildfire regimes. In terms of reduction, different strategies are considered, including actions related to mitigate human ignitions and vulnerability. Within the role of fuel management in wildfire risk reduction, three alternatives have been modelled: herbivory (grazing, browsing, domesticated and wild), prescribed burns (professional and pastoral), and mechanical removal (silviculture, pruning, clearing) [265]. Suitability maps of these different land management strategies were created, based on existing ET spatial data.
To understand how current policy, socioeconomic, and environmental dynamics may affect future fire risk, FirEUrisk is also contributing to further improve fire-enabled Dynamic Global Vegetation Models (DGVMs) which simulate vegetation and fire patterns under scenarios of future climate and land use. Realistic future land use scenarios are an integral component of such fire enabled DGVMs. FirEUrisk has developed land use scenarios which incorporate variables critical to fuel distribution and thus fire hazard, such as afforestation, forest fragmentation, and land abandonment. The land use scenarios are based on two Shared Socioeconomic Pathways (SSPs) developed in the 6th Assessment Report by the IPCC [376] which are also bias-corrected for European climate conditions: SSP 1, “Sustainability”, and SSP3 “Regional rivalry”. The pathways lay out how changes in global mean temperature and greenhouse gas emissions may be affected by global economic and environmental drivers based on a set of storylines.
The resulting demands for goods and services (e.g., crops or livestock), local spatial characteristics, and climate change scenarios were allocated across the landscape using CLUMondo, a spatially explicit and dynamic land system change model [377]. Using the land use results from CLUMondo, which cover the decades from 2020 to 2050, the DGVMs then simulate vegetation patterns, highlighting specific areas that may present greater fire risk. The DGVMs, however, also require historic land use data that is consistent in terms of spatial characteristics with the future land used scenarios. Thus, the CLUMondo land use scenario results were linked to representations of historical land use extending back to the year 1960 provided via the HILDA+ dataset [378], which combines several open data streams to estimate land use change. The resulting dataset is the first long term Europe-specific land use scenario set that is aligned with a historic reconstruction, improving the ability of the DGVMs to forecast future fire regimes [155] at a fine spatial resolution. While the final time series is based on a 1-km2 resolution, the results were converted to a 9-km2 resolution to match the resolution that is used natively in the DGVMs and harmonized the land cover class legend to the fuel map generated within the project [343]. Data are available at DataverseNL (https://dataverse.nl/dataset.xhtml?persistentId=doi:10.34894/ALZTYS, accessed on 20 April 2023).
FirEUrisk also aims to create stylized fuel management scenarios that explore the potential to manage future fire risk using land management strategies that link land use scenarios from CLUMondo and associated vegetation patterns simulated in the DGVMs. Together, the findings will be synthesized into a series of stylized fuel management scenarios representing low and high adoption of land management strategies and potential trade-offs between them and other desired outcomes, such as biodiversity and ecosystem services. The results will help to better understand how anticipated changes to forest structure and distribution may respond to policies initiatives such as the EU Green Deal and if they will still hold under climate change conditions. The results will be a helpful tool in calibrating policy with diverse stakeholder goals (including fire risk, carbon storage, biodiversity, etc.), thus reducing the risk of policy failure and unintended consequences.

5. Synthesis

This paper aimed to present an update status of the wildfire risk assessment research and practice, reviewing the terms and concepts implied in generating an integrated approach to risk conditions, as well as revising the methods used to generate the input variables and the approaches for merging them. The text has also briefly commented on operational wildfire risk assessment systems being currently used in some large countries. Finally, the integrated approach to wildfire risk assessment has been illustrated by the system that it has been developed within, the FirEUrisk European project.
Despite the complexity of taking into account all relevant dimensions of wildfire risk, this paper stresses the importance of adopting a comprehensive approach to wildfire risk assessment, which considers not just the main variables associated to danger (ignition and propagation), but also exposure and vulnerability (including human and ecological values). A further integration should also consider how risk assessment is related to reduction and adaptation, as well as the cascading effects that wildfire brings along with other natural hazards.

Author Contributions

Conceptualization, E.C.; Review material of Section 1 and Section 2. All authors; Review Section 3: E.C., D.O., J.S.M., M.Y.; Section 4: all authors. writing: all authors.; maps: M.L.P., C.O., V.P. and F.A. All authors have read and agreed to the published version of the manuscript.

Funding

This paper is part of the FirEUrisk project research funded by the European Union’s Horizon 2020 research and innovation program under Grant Agreement No. 101003890. MS and EK acknowledge the support of the HE project EXHAUSTION (grant 820655) and the Academy of Finland HEATCOST (grant 334798) to the global-scale developments. FAF acknowledges the support of the Spanish Ministerio de Ciencia, Innovación y Universidades (grant #PRE2019-089208).

Institutional Review Board Statement

Not applicable.

Data Availability Statement

The data presented in this study are available on request from the corresponding author.

Acknowledgments

The authors really appreciate the suggestions and contributions to the draft version of this paper by Matthew Thompson, Xianli Wang, Lynn Johnston and Mike Flannigan, particularly in Section 3.

Conflicts of Interest

The authors declare no conflict of interest.

References

  1. Van der Werf, G.R.; Randerson, J.T.; Giglio, L.; van Leeuwen, T.T.; Chen, Y.; Rogers, B.M.; Mu, M.; van Marle, M.J.E.; Morton, D.C.; Collatz, G.J.; et al. Global fire emissions estimates during 1997–2016. Earth Syst. Sci. Data 2017, 9, 697–720. [Google Scholar] [CrossRef]
  2. Gleason, K.E.; McConnell, J.R.; Arienzo, M.M.; Chellman, N.; Calvin, W.M. Four-fold increase in solar forcing on snow in western US burned forests since 1999. Nat. Commun. 2019, 10, 2026. [Google Scholar] [CrossRef] [PubMed]
  3. Bowman, D.M.; Kolden, C.A.; Abatzoglou, J.T.; Johnston, F.H.; van der Werf, G.R.; Flannigan, M. Vegetation fires in the Anthropocene. Nat. Rev. Earth Environ. 2020, 1, 500–515. [Google Scholar] [CrossRef]
  4. Lizundia-Loiola, J.; Otón, G.; Ramo, R.; Chuvieco, E. A spatio-temporal active-fire clustering approach for global burned area mapping at 250 m from MODIS data. Remote Sens. Environ. 2020, 236, 111493. [Google Scholar] [CrossRef]
  5. Giglio, L.; Boschetti, L.; Roy, D.P.; Humber, M.L.; Justice, C.O. The Collection 6 MODIS Burned Area Mapping Algorithm and Product. RSE Remote Sens. Environ. 2018, 217, 72–85. [Google Scholar] [CrossRef] [PubMed]
  6. Chuvieco, E.; Roteta, E.; Sali, M.; Stroppiana, D.; Boettcher, M.; Kirches, G.; Khairoun, A.; Pettinari, L.; Franquesa, M.; Albergel, C. Building a small fire database for Sub-Saharan Africa from Sentinel-2 high-resolution images. Sci. Total Environ. 2022, 845, 157139. [Google Scholar] [CrossRef]
  7. Kelly, L.; Brotons, L. Using fire to promote biodiversity. Science 2017, 355, 1264–1265. [Google Scholar] [CrossRef]
  8. Lewis, S.L.; Edwards, D.P.; Galbraith, D. Increasing human dominance of tropical forests. Science 2015, 349, 827–832. [Google Scholar] [CrossRef]
  9. Bowman, D.M.; Williamson, G.; Yebra, M.; Lizundia-Loiola, J.; Pettinari, M.L.; Shah, S.; Bradstock, R.; Chuvieco, E. Wildfires: Australia needs a national monitoring agency. Nature 2020, 584, 188–191. [Google Scholar] [CrossRef]
  10. Bowman, D.M.; Williamson, G.J.; Abatzoglou, J.T.; Kolden, C.A.; Cochrane, M.A.; Smith, A.M. Human exposure and sensitivity to globally extreme wildfire events. Nat. Ecol. Evol. 2017, 1, 0058. [Google Scholar] [CrossRef]
  11. Fitch, R.A.; Kim, Y.S.; Waltz, A.E.M.; Crouse, J.E. Changes in potential wildland fire suppression costs due to restoration treatments in Northern Arizona Ponderosa pine forests. For. Policy Econ. 2018, 87, 101–114. [Google Scholar] [CrossRef]
  12. Jain, P.; Castellanos-Acuna, D.; Coogan, S.C.P.; Abatzoglou, J.T.; Flannigan, M.D. Observed increases in extreme fire weather driven by atmospheric humidity and temperature. Nat. Clim. Chang. 2021, 12, 63–70. [Google Scholar] [CrossRef]
  13. Tedim, F.; Leone, V.; Amraoui, M.; Bouillon, C.; Coughlan, M.R.; Delogu, G.M.; Fernandes, P.M.; Ferreira, C.; McCaffrey, S.; McGee, T.K.; et al. Defining Extreme Wildfire Events: Difficulties, Challenges, and Impacts. Fire 2018, 1, 9. [Google Scholar] [CrossRef]
  14. Duane, A.; Castellnou, M.; Brotons, L. Towards a comprehensive look at global drivers of novel extreme wildfire events. Clim. Chang. 2021, 165, 43. [Google Scholar] [CrossRef]
  15. Calkin, D.E.; Thompson, M.P.; Finney, M.A.; Hyde, K.D. A real-time risk assessment tool supporting wildland fire decision making. J. For. 2011, 109, 274–280. [Google Scholar]
  16. Thompson, M.P.; MacGregor, D.G.; Calkin, D. Risk Management: Core Principles and Practices, and Their Relevance to Wildland Fire; U.S. Department of Agriculture, Forest Service, Rocky Mountain Research Station: Fort Collins, CO, USA, 2016. [Google Scholar]
  17. Moore, P.F. Global Wildland Fire Management Research Needs. Curr. For. Rep. 2019, 5, 210–225. [Google Scholar] [CrossRef]
  18. UNISDR. Technical Guidance for Monitoring and Reporting on Progress in Achieving the Global Targets of the Sendai Framework for Disaster Risk Reduction; United Nations: Geneva, Switzerland, 2017. Available online: https://www.undrr.org/publication/technical-guidance-monitoring-and-reporting-progress-achieving-global-targets-sendai (accessed on 5 May 2023).
  19. Tagarev, T.; Papadopoulos, G.A. Integrating the risk management cycle. In Science for Disaster Risk Management 2020: Acting Today, Protecting Tomorrow; Casajus Valles, A., Marin Ferrer, M., Poljanšek, K., Clark, I., Eds.; UR 30183 EN; Publications Office of the European Union: Luxembourg, 2020; pp. 49–106. [Google Scholar]
  20. McGlade, J.; Bankoff, G.; Abrahams, J.; Cooper-Knock, S.; Cotecchia, F.; Desanker, P.; Erian, W.; Gencer, E.; Gibson, L.; Girgin, S. Global Assessment Report on Disaster Risk Reduction 2019; UN Office for Disaster Risk Reduction: Geneva, Switzerland, 2019. [Google Scholar]
  21. Field, C.B.; Barros, V.R.; Dokken, D.J.; Mach, K.J.; Mastrandrea, M.D.; Bilir, T.E.; Chatterjee, M.; Ebi, K.L.; Estrada, Y.O.; Genova, R.C. Climate Change 2014: Impacts, Adaptation, and Vulnerability. Contribution of Working Group II to the Fifth Assessment Report of the Intergovernmental Panel on Climate Change; Cambridge University Press: Cambridge, UK, 2014. [Google Scholar]
  22. Thywissen, K. Components of Risk: A Comparative Glossary; UNU-EHS: Bonn, Germany, 2006. [Google Scholar]
  23. UNDRR. Bangladesh INFORM Sub-National Risk Index 2022; United Nations Office for Disaster Risk Reduction: Dhaka, Bangladesh, 2022. [Google Scholar]
  24. Poljanšek, K.; Marin Ferrer, M.; Clark, I.; De Groeve, T. Science for Disaster Risk Management 2017. Knowing Better and Losing Less; Publications Office of the European Union: Luxembourg, 2017. [Google Scholar]
  25. UNISDR. Terminology on Disaster Risk Reduction; United Nations International Strategy for Disaster Reduction (UNISDR): Geneva, Switzerland, 2009; Available online: http://www.unisdr.org/files/7817_UNISDRTerminologyEnglish.pdf (accessed on 30 April 2023).
  26. Bachmann, A.; Allgöwer, B. A consistent wildland fire risk terminology is needed! Fire Manag. Today 2001, 61, 28–33. [Google Scholar]
  27. FAO. Wildland Fire Management Terminology. Terminologie de la Lutte Contre les Incendies de Forêt. Terminología del Control de Incendios en Tierras Incultas; Report nº 70; Food and Agriculture Organization, Forestry Paper: Rome, Italy, 1986. [Google Scholar]
  28. San Miguel-Ayanz, J.; Chuvieco, E.; Handmer, J.; Moffat, A.; Montiel-Molina, C.; Sandahl, L.; Viegas, D. Climatological risk: Wildfires. In Science for Disaster Risk Management: Knowing Better and Losing Less; Poljanšek, K., Marín Ferrer, M., De Groeve, T., Clark, I., Eds.; Scientific and Technical Research; Publications Office of the European Union: Luxembourg, 2017; pp. 294–305. Available online: http://drmkc.jrc.ec.europa.eu/portals/0/Knowledge/ScienceforDRM/ch03_s03/ch03_s03_subch0310.pdf (accessed on 6 May 2023).
  29. Chuvieco, E.; Salas, F.J. Mapping the spatial distribution of forest fire danger using GIS. IJGIS Int. J. Geogr. Inf. Sci. 1996, 10, 333–345. [Google Scholar] [CrossRef]
  30. Costa, H.; de Rigo, D.; Libertà, G.; Houston Durrant, T.; San-Miguel-Ayanz, J. European Wildfire Danger and Vulnerability in a Changing Climate: Towards Integrating Risk Dimensions; Publications Office of the European Union: Luxembourg, 2020; p. 59.
  31. Flannigan, M.D.; Wotton, B.D. A study of interpolation methods for forest fire danger rating in Canada. Can. J. For. Res. 1989, 19, 1059–1066. [Google Scholar] [CrossRef]
  32. Vasilakos, C.; Kalabokidis, K.; Hatzopoulos, J.; Kallos, G.; Matsinos, Y. Integrating new methods and tools in fire danger rating. Int. J. Wildland Fire 2007, 16, 306–316. [Google Scholar] [CrossRef]
  33. Viegas, D.X.; Bovio, G.; Ferreira, A.; Nosenzo, A.; Sol, B. Comparative study of various methods of fire danger evaluation in southern Europe. Int. J. Wildland Fire 1999, 9, 235–246. [Google Scholar] [CrossRef]
  34. Wotton, B.M. Interpreting and using outputs from the Canadian Forest Fire Danger Rating System in research applications. Environ. Ecol. Stat. 2009, 16, 107–131. [Google Scholar] [CrossRef]
  35. Zacharakis, I.; Tsihrintzis, V.A. Environmental Forest Fire Danger Rating Systems and Indices around the Globe: A Review. Land 2023, 12, 194. [Google Scholar] [CrossRef]
  36. Chuvieco, E.; Aguado, I.; Jurdao, S.; Pettinari, M.L.; Yebra, M.; Salas, J.; Hantson, S.; de la Riva, J.; Ibarra, P.; Rodrigues, M.; et al. Integrating geospatial information into fire risk assessment. Int. J. Wildland Fire 2014, 23, 606–619. [Google Scholar] [CrossRef]
  37. Thompson, M.P.; Calkin, D.E.; Finney, M.A.; Ager, A.A.; Gilbertson-Day, J.W. Integrated national-scale assessment of wildfire risk to human and ecological values. Stoch. Environ. Res. Risk Assess. 2011, 25, 761–780. [Google Scholar] [CrossRef]
  38. Chuvieco, E.; Aguado, I.; Yebra, M.; Nieto, H.; Salas, J.; Martín, P.; Vilar, L.; Martínez, J.; Martín, S.; Ibarra, P.; et al. Development of a framework for fire risk assessment using remote sensing and geographic information system technologies. Ecol. Model. 2010, 221, 46–58. [Google Scholar] [CrossRef]
  39. Thompson, M.P.; Calkin, D.E.; Gilbertson-Day, J.W.; Ager, A.A. Advancing effects analysis for integrated, large-scale wildfire risk assessment. Environ. Monit. Assess. 2010, 179, 217–239. [Google Scholar] [CrossRef]
  40. Oliveira, S.; Rocha, J.; Sá, A. Wildfire risk modeling. Curr. Opin. Environ. Sci. Health 2021, 23, 100274. [Google Scholar] [CrossRef]
  41. Oliveira, S.; Gonçalves, A.; Benali, A.; Sá, A.; Zêzere, J.L.; Pereira, J.M. Assessing Risk and Prioritizing Safety Interventions in Human Settlements Affected by Large Wildfires. Forests 2020, 11, 859. [Google Scholar] [CrossRef]
  42. Prestemon, J.P.; Butry, D.T. Time to Burn: Modeling Wildland Arson as an Autoregressive Crime Function. Am. J. Agric. Econ. 2005, 87, 756–770. [Google Scholar] [CrossRef]
  43. Rothermel, R.C. A Mathematical Model for Predicting Fire Spread in Wildland Fuels; USDA, Forest Service. Research Paper INT-115; USDA: Ogden, UT, USA, 1972.
  44. Rothermel, R.C. How to Predict the Spread and Intensity of Forest and Range Fires; USDA, Forest Service, GTR INT-143; USDA: Ogden, UT, USA, 1983; p. 161.
  45. Deville, P.; Linard, C.; Martin, S.; Gilbert, M.; Stevens, F.R.; Gaughan, A.E.; Blondel, V.D.; Tatem, A.J. Dynamic population mapping using mobile phone data. Proc. Natl. Acad. Sci. USA 2014, 111, 15888–15893. [Google Scholar] [CrossRef] [PubMed]
  46. Bar Massada, A.; Radeloff, V.C.; Stewart, S.I.; Hawbaker, T.J. Wildfire risk in the wildland–urban interface: A simulation study in northwestern Wisconsin. For. Ecol Manag. 2009, 258, 1990–1999. [Google Scholar] [CrossRef]
  47. Finney, M.A. FARSITE: Fire Area Simulator–Model Development and Evaluation; USDA Forest Service. RMRS-RP-4; USDA: Missoula, MT, USA, 1998; p. 51.
  48. Alcasena, F.J.; Salis, M.; Vega-García, C. A fire modeling approach to assess wildfire exposure of valued resources in central Navarra, Spain. Eur. J. For. Res. 2016, 135, 87–107. [Google Scholar] [CrossRef]
  49. Finney, M.A. An Overview of FlamMap Fire Modeling Capabilities. In Fuels Management-How to Measure Success: Conference Proceedings RMRS-P-41, Portland, OR, USA 28–30 March 2006; Andrews, P.L., Butler, B.W., Eds.; U.S. Department of Agriculture, Forest Service, Rocky Mountain Research: Portland, OR, USA, 2006; pp. 213–220. [Google Scholar]
  50. Beverly, J.; Bothwell, P.; Conner, J.; Herd, E. Assessing the exposure of the built environment to potential ignition sources generated from vegetative fuel. Int. J. Wildland Fire 2010, 19, 299–313. [Google Scholar] [CrossRef]
  51. Radeloff, V.C.; Hammer, R.B.; Stewart, S.I.; Fried, J.S.; Holcomb, S.S.; McKeefry, J.F. The wildland-urban interface in the United States. Ecol. Appl. 2005, 15, 799–805. [Google Scholar] [CrossRef]
  52. Argañaraz, J.P.; Radeloff, V.C.; Bar-Massada, A.; Gavier-Pizarro, G.I.; Scavuzzo, C.M.; Bellis, L.M. Assessing wildfire exposure in the Wildland-Urban Interface area of the mountains of central Argentina. J. Environ. Manag. 2017, 196, 499–510. [Google Scholar] [CrossRef]
  53. Bar-Massada, A.; Stewart, S.I.; Hammer, R.B.; Mockrin, M.H.; Radeloff, V.C. Using structure locations as a basis for mapping the wildland urban interface. J. Environ. Manag. 2013, 128, 540–547. [Google Scholar] [CrossRef]
  54. Modugno, S.; Balzter, H.; Cole, B.; Borrelli, P. Mapping regional patterns of large forest fires in Wildland–Urban Interface areas in Europe. J. Environ. Manag. 2016, 172, 112–126. [Google Scholar] [CrossRef]
  55. Carlson, A.R.; Helmers, D.P.; Hawbaker, T.J.; Mockrin, M.H.; Radeloff, V.C. The wildland–urban interface in the United States based on 125 million building locations. Ecol. Appl. 2022, 32, e2597. [Google Scholar] [CrossRef]
  56. Oliveira, S.; Félix, F.; Nunes, A.; Lourenço, L.; Laneve, G.; Sebastián-López, A. Mapping wildfire vulnerability in Mediterranean Europe. Testing a stepwise approach for operational purposes. J. Environ. Manag. 2018, 206, 158–169. [Google Scholar] [CrossRef]
  57. Turner, B.L.; Kasperson, R.E.; Matson, P.A.; McCarthy, J.J.; Corell, R.W.; Christensen, L.; Eckley, N.; Kasperson, J.X.; Luers, A.; Martello, M.L. A framework for vulnerability analysis in sustainability science. Proc. Natl. Acad. Sci. USA 2003, 100, 8074–8079. [Google Scholar] [CrossRef] [PubMed]
  58. Kasperson, R.E.; Kasperson, J.X. Climate Change, Vulnerability and Social Justice; Stockholm Environment Institute: Stockholm, Sweden, 2001. [Google Scholar]
  59. Weisshuhn, P.; Müller, F.; Wiggering, H. Ecosystem vulnerability review: Proposal of an interdisciplinary ecosystem assessment approach. Environ. Manag. 2018, 61, 904–915. [Google Scholar] [CrossRef] [PubMed]
  60. Swanston, C.W.; Janowiak, M.K.; Brandt, L.A.; Butler, P.R.; Handler, S.D.; Shannon, P.D.; Derby Lewis, A.; Hall, K.; Fahey, R.T.; Scott, L.; et al. Forest Adaptation Resources: Climate Change Tools and Approaches for Land Managers, 2nd ed.; U.S. Department of Agriculture, Forest Service, Northern Research Station: Newtown Square, PA, USA, 2016. [Google Scholar]
  61. De Lange, H.; Sala, S.; Vighi, M.; Faber, J.H. Ecological vulnerability in risk assessment—A review and perspectives. Sci. Total Environ. 2010, 408, 3871–3879. [Google Scholar] [CrossRef] [PubMed]
  62. Beroya-Eitner, M.A. Ecological vulnerability indicators. Ecol. Indic. 2016, 60, 329–334. [Google Scholar] [CrossRef]
  63. Ingrisch, J.; Bahn, M. Towards a Comparable Quantification of Resilience. Trends Ecol. Evol. 2018, 33, 251–259. [Google Scholar] [CrossRef]
  64. Lei, Y.; Wang, J.a.; Yue, Y.; Zhou, H.; Yin, W. Rethinking the relationships of vulnerability, resilience, and adaptation from a disaster risk perspective. Nat. Hazards 2014, 70, 609–627. [Google Scholar] [CrossRef]
  65. Ciais, P.; Sabine, C.; Bala, G.; Bopp, L.; Brovkin, V.; Canadell, J.; Chhabra, A.; DeFries, R.; Galloway, J.; Heimann, M. Carbon and other biogeochemical cycles. In Climate Change 2013: The Physical Science Basis. Contribution of Working Group I to the Fifth Assessment Report of the Intergovernmental Panel on Climate Change; Stocker, T.F., Qin, D., Plattner, G.-K., Tignor, M., Allen, S., Boschung, J., Nauels, A., Xia, Y., Bex, V., Midgley, P.M., Eds.; Cambridge University Press: Cambridge, UK, 2014; pp. 465–570. [Google Scholar]
  66. Jones, M.W.; Abatzoglou, J.T.; Veraverbeke, S.; Andela, N.; Lasslop, G.; Forkel, M.; Smith, A.J.P.; Burton, C.; Betts, R.A.; van der Werf, G.R.; et al. Global and Regional Trends and Drivers of Fire Under Climate Change. Rev. Geophys. 2022, 60, e2020RG000726. [Google Scholar] [CrossRef]
  67. Hantson, S.; Kelley, D.I.; Arneth, A.; Harrison, S.P.; Archibald, S.; Bachelet, D.; Forrest, M.; Hickler, T.; Lasslop, G.; Li, F. Quantitative assessment of fire and vegetation properties in simulations with fire-enabled vegetation models from the Fire Model Intercomparison Project. Geosci. Model Dev. 2020, 13, 3299–3318. [Google Scholar] [CrossRef]
  68. Zheng, B.; Ciais, P.; Chevallier, F.; Yang, H.; Canadell, J.G.; Chen, Y.; van der Velde, I.R.; Aben, I.; Chuvieco, E.; Davis, S.J.; et al. Record-high CO2 emissions from boreal fires in 2021. Science 2023, 379, 912–917. [Google Scholar] [CrossRef]
  69. Abatzoglou, J.T.; Williams, A.P.; Boschetti, L.; Zubkova, M.; Kolden, C.A. Global patterns of interannual climate-fire relationships. Glob. Chang. Biol. 2018, 24, 5164–5175. [Google Scholar] [CrossRef]
  70. Ellis, T.M.; Bowman, D.M.; Jain, P.; Flannigan, M.D.; Williamson, G.J. Global increase in wildfire risk due to climate-driven declines in fuel moisture. Glob. Chang. Biol. 2022, 28, 1544–1559. [Google Scholar] [CrossRef] [PubMed]
  71. Flannigan, M.D.; Krawchuk, M.A.; de Groot, W.J.; Wotton, B.M.; Gowman, L.M. Implications of changing climate for global wildland fire. Int. J. Wildland Fire 2009, 18, 483–507. [Google Scholar] [CrossRef]
  72. Flannigan, M.D.; Wotton, B.M. Lightning-ignited forest fires in northwestern Ontario. Can. J. For. Res. 1991, 21, 277–287. [Google Scholar] [CrossRef]
  73. Veraverbeke, S.; Rogers, B.M.; Goulden, M.L.; Jandt, R.R.; Miller, C.E.; Wiggins, E.B.; Randerson, J.T. Lightning as a major driver of recent large fire years in North American boreal forests. Nat. Clim. Chang. 2017, 7, 529. [Google Scholar] [CrossRef]
  74. Nieto, H.; Aguado, I.; Garcia, M.; Chuvieco, E. Lightning-caused fires in Central Spain: Development of a probability model of occurrence for two Spanish regions. Agric. For. Meteorol. 2012, 162–163, 35–43. [Google Scholar] [CrossRef]
  75. Moris, J.V.; Conedera, M.; Nisi, L.; Bernardi, M.; Cesti, G.; Pezzatti, G.B. Lightning-caused fires in the Alps: Identifying the igniting strokes. Agric. For. Meteorol. 2020, 290, 107990. [Google Scholar] [CrossRef]
  76. Wotton, B.M.; Martell, D.L. A lightning fire occurrence model for Ontario. Can. J. For. Res. 2005, 35, 1389–1401. [Google Scholar] [CrossRef]
  77. Schulz, W.; Diendorfer, G.; Pedeboy, S.; Poelman, D.R. The European lightning location system EUCLID–Part 1: Performance analysis and validation. Nat. Hazards Earth Syst. Sci. 2016, 16, 595–605. [Google Scholar] [CrossRef]
  78. Coughlan, R.; Di Giuseppe, F.; Vitolo, C.; Barnard, C.; Lopez, P.; Drusch, M. Using machine learning to predict fire-ignition occurrences from lightning forecasts. Meteorol. Appl. 2021, 28, e1973. [Google Scholar] [CrossRef]
  79. Tymstra, C.; Bryce, R.W.; Wotton, B.M.; Taylor, S.W.; Armitage, O.B. Development and Structure of Prometheus: The Canadian Wildland Fire Growth Simulation Model; Information Report NOR-X-417; Northern Forestry Centre: Edmonton, AB, Canada, 2010; p. 102. [Google Scholar]
  80. Nyman, P.; Metzen, D.; Noske, P.J.; Lane, P.N.J.; Sheridan, G.J. Quantifying the effects of topographic aspect on water content and temperature in fine surface fuel. Int. J. Wildland Fire 2015, 24, 1129–1142. [Google Scholar] [CrossRef]
  81. Viegas, D.X.; Pita, L.P. Fire spread in canyons. Int. J. Wildland Fire 2004, 13, 253–274. [Google Scholar] [CrossRef]
  82. Pyne, S.J.; Andrews, P.L.; Laven, R.D. Introdution to Wildland Fire; Jonh Wiley & Sons, Inc.: Hoboken, NJ, USA, 1996. [Google Scholar]
  83. Riccardi, C.L.; Prichard, S.J.; Sandberg, D.V.; Ottmar, R.D. Quantifying physical characteristics of wildland fuels using the fuel characteristic classification system. Can. J. For. Res. 2007, 37, 2413–2420. [Google Scholar] [CrossRef]
  84. Barrows, J. Fire Behavior in the Northern Rocky Mountain Forests; 29; USDA, Forest Service, Northern Rocky Mountain Forest and Range Experiment Station: Ogden, UT, USA, 1951.
  85. Keane, R.E.; Burgan, R.; Van Wagtendonk, J. Mapping wildland fuels for fire management across multiple scales: Integrating remote sensing, GIS, and biophysical modeling. Int. J. Wildland Fire 2001, 10, 301–319. [Google Scholar] [CrossRef]
  86. Arroyo, L.A.; Pascual, C.; Manzanera, J.A. Fire models and methods to map fuel types: The role of remote sensing. For. Ecol. Manag. 2008, 256, 1239–1252. [Google Scholar] [CrossRef]
  87. Anderson, H.E. Aids to Determining Fuel Models for Estimating Fire Behavior; USDA, Forest Service, General Technical Report INT-122; USDA: Ogden, UT, USA, 1982.
  88. Scott, J.; Burgan, R.E. Standard Fire Behavior Fuel Models: A Comprehensive Set for Use with Rothermel’s Surface Fire Spread Model; US Department of Agriculture, Forest Service, Rocky Mountain Research Station: Ogden, UT, USA, 2005. [Google Scholar]
  89. Fernandes, P.A.M. Fire spread prediction in shrub fuels in Portugal. For. Ecol. Manag. 2001, 144, 67–74. [Google Scholar] [CrossRef]
  90. Ottmar, R.D.; Sandberg, D.V.; Riccardi, C.L.; Prichard, S.J. An overview of the Fuel Characteristic Classification System–Quantifying, classifying, and creating fuelbeds for resource planning. Can. J. For. Res. 2007, 37, 2383–2393. [Google Scholar] [CrossRef]
  91. Pettinari, M.; Chuvieco, E. Fire Behavior Simulation from Global Fuel and Climatic Information. Forests 2017, 8, 179. [Google Scholar] [CrossRef]
  92. Prichard, S.J.; Sandberg, D.V.; Ottmar, R.D.; Eberhardt, E.; Andreu, A.; Eagle, P.; Swedin, K. Fuel Characteristic Classification System Version 3.0: Technical Documentation; United States Department of Agriculture, Forest Service, Pacific Northwest: Missoula, MT, USA, 2013. [Google Scholar]
  93. Dimitrakopoulos, A. Mediterranean fuel models and potential fire behaviour in Greece. Int. J. Wildland Fire 2002, 11, 127–130. [Google Scholar] [CrossRef]
  94. Salis, M.; Arca, B.; Alcasena, F.; Arianoutsou, M.; Bacciu, V.; Duce, P.; Duguy, B.; Koutsias, N.; Mallinis, G.; Mitsopoulos, I. Predicting wildfire spread and behaviour in Mediterranean landscapes. Int. J. Wildland Fire 2016, 25, 1015–1032. [Google Scholar] [CrossRef]
  95. Rodríguez y Silva, F.; Molina-Martínez, J.R. Modeling Mediterranean forest fuels by integrating field data and mapping tools. Eur. J. For. Res. 2012, 131, 571–582. [Google Scholar] [CrossRef]
  96. Ascoli, D.; Vacchiano, G.; Scarpa, C.; Arca, B.; Barbati, A.; Battipaglia, G.; Elia, M.; Esposito, A.; Garfì, V.; Lovreglio, R.; et al. Harmonized dataset of surface fuels under Alpine, temperate and Mediterranean conditions in Italy. A synthesis supporting fire management. Iforest-Biogeosci. For. 2020, 13, 513–522. [Google Scholar] [CrossRef]
  97. Cruz, M.G.; Gould, J.S.; Hollis, J.J.; McCaw, W.L. A Hierarchical Classification of Wildland Fire Fuels for Australian Vegetation Types. Fire 2018, 1, 13. [Google Scholar] [CrossRef]
  98. Simard, A.J. The Moisture Content of Forest Fuels–A Review of the Basic Concepts; FF-X-14; Forest Fire Research Institute: Ottawa, ON, USA, 1968; p. 47. [Google Scholar]
  99. Yebra, M.; Dennison, P.; Chuvieco, E.; Riaño, D.; Zylstra, P.; Hunt, E.R.; Danson, F.M.; Qi, Y.; Jurdao, S. A global review of remote sensing of live fuel moisture content for fire danger assessment: Moving towards operational products. Remote Sens. Environ. 2013, 136, 455–468. [Google Scholar] [CrossRef]
  100. Aguado, I.; Chuvieco, E.; Boren, R.; Nieto, H. Estimation of dead fuel moisture content from meteorological data in Mediterranean areas. Applications in fire danger assessment. Int. J. Wildland Fire 2007, 16, 390–397. [Google Scholar] [CrossRef]
  101. Jolly, W.M.; Johnson, D.M. Pyro-Ecophysiology: Shifting the Paradigm of Live Wildland Fuel Research. Fire 2018, 1, 8. [Google Scholar] [CrossRef]
  102. Ruffault, J.; Martin-StPaul, N.; Pimont, F.; Dupuy, J.-L. How well do meteorological drought indices predict live fuel moisture content (LFMC)? An assessment for wildfire research and operations in Mediterranean ecosystems. Agric. For. Meteorol. 2018, 262, 391–401. [Google Scholar] [CrossRef]
  103. Viegas, D.X.; Viegas, T.P.; Ferreira, A.D. Moisture content of fine forest fuels and fire occurrence in central Portugal. Int. J. Wildland Fire 1992, 2, 69–85. [Google Scholar] [CrossRef]
  104. Viegas, D.X.; Viegas, T.P.; Ferreira, A.D. Characteristics of Some Forest Fuels and Their Relation to the Occurrence of Fires. In Proceedings of the International Conference of Forest Fire Research, Coimbra, Portugal, 19–22 November 1990; pp. 1–13. [Google Scholar]
  105. Chuvieco, E.; Aguado, I.; Dimitrakopoulos, A. Conversion of fuel moisture content values to ignition potential for integrated fire danger assessment. Can. J. For. Res. 2004, 34, 2284–2293. [Google Scholar] [CrossRef]
  106. Dimitrakopoulos, A.; Papaioannou, K.K. Flammability assessment of Mediterranean forest fuels. Fire Technol. 2001, 37, 143–152. [Google Scholar] [CrossRef]
  107. Rossa, C.G.; Veloso, R.; Fernandes, P.M. A laboratory-based quantification of the effect of live fuel moisture content on fire spread rate. Int. J. Wildland Fire 2016, 25, 569–573. [Google Scholar] [CrossRef]
  108. Alexander, M.E.; Cruz, M.G. Are the applications of wildland fire behaviour models getting ahead of their evaluation again? Environ. Model. Softw. 2013, 41, 65–71. [Google Scholar] [CrossRef]
  109. Rossa, C.G. The effect of fuel moisture content on the spread rate of forest fires in the absence of wind or slope. Int. J. Wildland Fire 2017, 26, 24–31. [Google Scholar] [CrossRef]
  110. Jurdao, S.; Chuvieco, E.; Arevalillo, J.M. Modelling fire ignition probability from satellite estimates of live fuel moisture content. Fire Ecol. 2012, 8, 77–97. [Google Scholar] [CrossRef]
  111. Pimont, F.; Ruffault, J.; Martin-StPaul, N.K.; Dupuy, J.-L. Why is the effect of live fuel moisture content on fire rate of spread underestimated in field experiments in shrublands? Int. J. Wildland Fire 2019, 28, 127–137. [Google Scholar] [CrossRef]
  112. Yebra, M.; Scortechini, G.; Badi, A.; Beget, M.E.; Boer, M.M.; Bradstock, R.; Chuvieco, E.; Danson, F.M.; Dennison, P.; Resco de Dios, V.; et al. Globe-LFMC, a global plant water status database for vegetation ecophysiology and wildfire applications. Sci. Data 2019, 6, 155. [Google Scholar] [CrossRef]
  113. Chuvieco, E.; González, I.; Verdú, F.; Aguado, I.; Yebra, M. Prediction of fire occurrence from live fuel moisture content measurements in a Mediterranean ecosystem. Int. J. Wildland Fire 2009, 18, 430–441. [Google Scholar] [CrossRef]
  114. Dennison, P.E.; Roberts, D.A.; Thorgusen, S.R.; Regelbrugge, J.C.; Weise, D.; Lee, C. Modeling seasonal changes in live fuel moisture and equivalent water thickness using a cumulative water balance index. Remote Sens. Environ. 2003, 88, 442–452. [Google Scholar] [CrossRef]
  115. Jurdao, S.; Yebra, M.; Guerschman, J.P.; Chuvieco, E. Regional estimation of woodland moisture content by inverting Radiative Transfer Models. Remote Sens. Environ. 2013, 132, 59–70. [Google Scholar] [CrossRef]
  116. Stow, D.; Niphadkar, M.; Kaiser, J. MODIS-derived visible atmospherically resistant index for monitoring chaparral moisture content. Int. J. Remote Sens. 2005, 26, 3867–3873. [Google Scholar] [CrossRef]
  117. Luo, K.; Quan, X.; He, B.; Yebra, M. Effects of Live Fuel Moisture Content on Wildfire Occurrence in Fire-Prone Regions over Southwest China. Forests 2019, 10, 887. [Google Scholar] [CrossRef]
  118. Fox-Hughes, P.; Yebra, M.; Kumar, V.; Dowdy, A.; Hope, P.; Peace, M.; Narsey, S.; Shokirov, S.; Delage, F.; Zhang, H. Soil and Fuel Moisture Precursors of Fire Activity during the 2019–20 Fire Season; Bushfire and Natural Hazards CRC: Melbourne, Australia, 2021. [Google Scholar]
  119. Yebra, M.; Chuvieco, E. Linking ecological information and radiative transfer models to estimate fuel moisture content in the Mediterranean region of Spain: Solving the ill-posed inverse problem. Remote Sens. Environ. 2009, 113, 2403–2411. [Google Scholar] [CrossRef]
  120. Yebra, M.; Quan, X.; Riaño, D.; Larraondo, P.R.; van Dijk, A.I.; Cary, G.J. A fuel moisture content and flammability monitoring methodology for continental Australia based on optical remote sensing. Remote Sens. Environ. 2018, 212, 260–272. [Google Scholar] [CrossRef]
  121. Cunill Camprubí, À.; González-Moreno, P.; Resco de Dios, V. Live fuel moisture content mapping in the Mediterranean Basin using random forests and combining MODIS spectral and thermal data. Remote Sens. 2022, 14, 3162. [Google Scholar] [CrossRef]
  122. Garcia, M.; Chuvieco, E.; Nieto, H.; Aguado, I. Combining AVHRR and meteorological data for estimating live fuel moisture content in forest fire danger rating. Remote Sens. Environ. 2008, 112, 3618–3627. [Google Scholar] [CrossRef]
  123. Chuvieco, E.; Riaño, D.; Aguado, I.; Cocero, D. Estimation of fuel moisture content from multitemporal analysis of Landsat Thematic Mapper reflectance data: Applications in fire danger assessment. Int. J. Remote Sens. 2002, 23, 2145–2162. [Google Scholar] [CrossRef]
  124. Chuvieco, E.; Aguado, I.; Salas, J.; García, M.; Yebra, M.; Oliva, P. Satellite Remote Sensing Contributions to Wildland Fire Science and Management. Curr. For. Rep. 2020, 6, 81–96. [Google Scholar] [CrossRef]
  125. Marino, E.; Yebra, M.; Guillén-Climent, M.; Algeet, N.; Tomé, J.L.; Madrigal, J.; Guijarro, M.; Hernando, C. Investigating live fuel moisture content estimation in fire-prone shrubland from remote sensing using empirical modelling and RTM simulations. Remote Sens. 2020, 12, 2251. [Google Scholar] [CrossRef]
  126. Yebra, M.; Chuvieco, E.; Riaño, D. Estimation of live Fuel Moisture Content from MODIS images for fire risk assessment. Agric. For. Meteorol. 2008, 148, 523–536. [Google Scholar] [CrossRef]
  127. Chuvieco, E.; Cocero, D.; Riaño, D.; Martín, M.P.; Martínez-Vega, J.; de la Riva, J.; Pérez, F. Combining NDVI and Surface Temperature for the estimation of live fuel moisture content in forest fire danger rating. Remote Sens. Environ. 2004, 92, 322–331. [Google Scholar] [CrossRef]
  128. Forkel, M.; Schmidt, L.; Zotta, R.-M.; Dorigo, W.; Yebra, M. Estimating leaf moisture content at global scale from passive microwave satellite observations of vegetation optical depth. Hydrol. Earth Syst. Sci. 2023, 27, 39–68. [Google Scholar] [CrossRef]
  129. Rao, K.; Williams, A.P.; Flefil, J.F.; Konings, A.G. SAR-enhanced mapping of live fuel moisture content. Remote Sens. Environ. 2020, 245, 111797. [Google Scholar] [CrossRef]
  130. Moghaddam, M.; Saatchi, S.S. Monitoring tree moisture using an estimation algorithm applied to SAR data from BOREAS. IEEE Trans. Geosci. Remote. Sens. 1999, 37, 901–916. [Google Scholar] [CrossRef]
  131. Tanase, M.A.; Nova, J.P.G.; Marino, E.; Aponte, C.; Tomé, J.L.; Yáñez, L.; Madrigal, J.; Guijarro, M.; Hernando, C. Characterizing Live Fuel Moisture Content from Active and Passive Sensors in a Mediterranean Environment. Forests 2022, 13, 1846. [Google Scholar] [CrossRef]
  132. Younes, N.; Yebra, M.; Sharp, R.; Lee, J.-U.; Hughes, D.; Gilbert, J.; Grigoriev, A.; Mathew, J.; Griffin, D.; Barraclough, S. OzFuel Pre-Phase A Study. Space-Based Australian Forest Fuel Flammability Monitoring; The University of New South Wales: Canberra, Australia, 2022. [Google Scholar]
  133. Bilbao, B.; Mistry, J.; Millán, A.; Berardi, A. Sharing Multiple Perspectives on Burning: Towards a Participatory and Intercultural Fire Management Policy in Venezuela, Brazil, and Guyana. Fire 2019, 2, 39. [Google Scholar] [CrossRef]
  134. Rodríguez, I.; Sletto, B.; Bilbao, B.; Sánchez-Rose, I.; Leal, A. Speaking of fire: Reflexive governance in landscapes of social change and shifting local identities. J. Environ. Policy Plan. 2018, 20, 689–703. [Google Scholar] [CrossRef]
  135. Cochrane, M.A.; Bowman, D.M.J.S. Manage fire regimes, not fires. Nat. Geosci. 2021, 14, 455–457. [Google Scholar] [CrossRef]
  136. FAO. Fire Management–Global Assessment 2006. A Thematic Study Prepared in the Framework of the Global Forest Resources Assessment 2005; FAO Forestry Paper 151; FAO: Rome, Italy, 2007. [Google Scholar]
  137. Brotons, L.; Aquilué, N.; De Cáceres, M.; Fortin, M.-J.; Fall, A. How fire history, fire suppression practices and climate change affect wildfire regimes in Mediterranean landscapes. PLoS ONE 2013, 8, e62392. [Google Scholar] [CrossRef] [PubMed]
  138. Coughlan, M.R.; Ellison, A.; Cavanaugh, A.H. Social Vulnerability and Wildfire in the Wildland-Urban Interface: Literature Synthesis; Northwest Fire Science Consortium, University of Oregon: Eugene, OR, USA, 2019. [Google Scholar]
  139. Scott, J.H.; Thompson, M.P.; Gilbertson-Day, J.W. Exploring how alternative mapping approaches influence fireshed assessment and human community exposure to wildfire. GeoJournal 2017, 82, 201–215. [Google Scholar] [CrossRef]
  140. Costafreda-Aumedes, S.; Comas, C.; Vega-Garcia, C. Human-caused fire occurrence modelling in perspective: A review. Int. J. Wildland Fire 2017, 26, 983–998. [Google Scholar] [CrossRef]
  141. Hesseln, H. Wildland Fire Prevention: A Review. Curr. For. Rep. 2018, 4, 178–190. [Google Scholar] [CrossRef]
  142. Martínez, J.; Vega-García, C.; Chuvieco, E. Human-caused wildfire risk rating for prevention planning in Spain. J. Environ. Manag. 2009, 90, 1241–1252. [Google Scholar] [CrossRef]
  143. Parisien, M.-A.; Miller, C.; Parks, S.A.; DeLancey, E.R.; Robinne, F.-N.; Flannigan, M.D. The spatially varying influence of humans on fire probability in North America. Environ. Res. Lett. 2016, 11, 075005. [Google Scholar] [CrossRef]
  144. Chuvieco, E.; Pettinari, M.L.; Koutsias, N.; Forkel, M.; Hantson, S.; Turco, M. Human and climate drivers of global biomass burning variability. Sci. Total Environ. 2021, 779, 146361. [Google Scholar] [CrossRef]
  145. Knorr, W.; Arneth, A.; Jiang, L. Demographic controls of future global fire risk. Nat. Clim. Chang. 2016, 6, 781–785. [Google Scholar] [CrossRef]
  146. Hantson, S.; Lasslop, G.; Kloster, S.; Chuvieco, E. Anthropogenic effects on global mean fire size. Int. J. Wildland Fire 2015, 24, 589–596. [Google Scholar] [CrossRef]
  147. Rodrigues, M.; de la Riva, J.; Fotheringham, S. Modeling the spatial variation of the explanatory factors of human-caused wildfires in Spain using geographically weighted logistic regression. Appl. Geogr. 2014, 48, 52–63. [Google Scholar] [CrossRef]
  148. Canadas, M.J.; Leal, M.; Soares, F.; Novais, A.; Ribeiro, P.F.; Schmidt, L.; Delicado, A.; Moreira, F.; Bergonse, R.; Oliveira, S.; et al. Wildfire mitigation and adaptation: Two locally independent actions supported by different policy domains. Land Use Policy 2023, 124, 106444. [Google Scholar] [CrossRef]
  149. Fuchs, R.; Alexander, P.; Brown, C.; Cossar, F.; Henry, R.C.; Rounsevell, M. Why the US–China trade war spells disaster for the Amazon. Nature 2019, 567, 451–454. [Google Scholar] [CrossRef]
  150. Górriz-Mifsud, E.; Burns, M.; Marini Govigli, V. Civil society engaged in wildfires: Mediterranean forest fire volunteer groupings. For. Policy Econ. 2019, 102, 119–129. [Google Scholar] [CrossRef]
  151. Andersen, L.M.; Sugg, M.M. Geographic multi-criteria evaluation and validation: A case study of wildfire vulnerability in Western North Carolina, USA following the 2016 wildfires. Int. J. Disaster Risk Reduct. 2019, 39, 101123. [Google Scholar] [CrossRef]
  152. Palaiologou, P.; Ager, A.A.; Nielsen-Pincus, M.; Evers, C.R.; Day, M.A. Social vulnerability to large wildfires in the western USA. Landsc. Urban Plan. 2019, 189, 99–116. [Google Scholar] [CrossRef]
  153. Vallejo-Villalta, I.; Rodríguez-Navas, E.; Márquez-Pérez, J. Mapping Forest Fire Risk at a Local Scale—A Case Study in Andalusia (Spain). Environments 2019, 6, 30. [Google Scholar] [CrossRef]
  154. Andela, N.; Morton, D.C.; Giglio, L.; Chen, Y.; van der Werf, G.R.; Kasibhatla, P.S.; DeFries, R.S.; Collatz, G.J.; Hantson, S.; Kloster, S.; et al. A human-driven decline in global burned area. Science 2017, 356, 1356–1362. [Google Scholar] [CrossRef] [PubMed]
  155. Forkel, M.; Andela, N.; Harrison, S.P.; Lasslop, G.; van Marle, M.; Chuvieco, E.; Dorigo, W.; Forrest, M.; Hantson, S.; Heil, A.; et al. Emergent relationships on burned area in global satellite observations and fire-enabled vegetation models. Biogeosciences 2019, 16, 47–76. [Google Scholar] [CrossRef]
  156. Bateman, I.; Mace, G. The natural capital framework for sustainable, efficient and equitable decision making. Nat. Sustain. 2020, 3, 776–783. [Google Scholar] [CrossRef]
  157. Costanza, R.; de Groot, R.; Sutton, P.; van der Ploeg, S.; Anderson, S.J.; Kubiszewski, I.; Farber, S.; Turner, R.K. Changes in the global value of ecosystem services. Glob. Environ. Chang. 2014, 26, 152–158. [Google Scholar] [CrossRef]
  158. La Notte, A.; Vallecillo, S.; Garcia Bendito, E.; Grammatikopoulou, I.; Czucz, B.; Ferrini, S.; Grizzetti, B.; Rega, C.; Herrando, S.; Villero, D. Ecosystem Services Accounting: Part III-Pilot Accounts for Habitat and Species Maintenance, On-Site Soil Retention and Water Purification; Publication Office of the European Commission: Luxembourg, 2021. [Google Scholar]
  159. Molina-Martínez, J.R.; Zamora, R.; Rodríguez y Silva, F. The role of flagship species in the economic valuation of wildfire impacts: An application to two Mediterranean protected areas. Sci. Total Environ. 2019, 675, 520–530. [Google Scholar] [CrossRef]
  160. Molina-Martínez, J.R.; Herrera, M.A.; Rodríguez y Silva, F. Wildfire-induced reduction in the carbon storage of Mediterranean ecosystems: An application to brush and forest fires impacts assessment. Environ. Impact Assess. Rev. 2019, 76, 88–97. [Google Scholar] [CrossRef]
  161. Faith, D.P. Valuation and appreciation of biodiversity: The “maintenance of options” provided by the variety of life. Front. Ecol. Evol. 2021, 9, 635670. [Google Scholar] [CrossRef]
  162. Sil, Ã.n.; Fernandes, P.M.; Rodrigues, A.P.; Alonso, J.M.; Honrado, J.o.P.; Perera, A.; Azevedo, J.o.C. Farmland abandonment decreases the fire regulation capacity and the fire protection ecosystem service in mountain landscapes. Ecosyst. Serv. 2019, 36, 1. [Google Scholar] [CrossRef]
  163. Martino, S.; Roberts, M.; Stevenson, T.; Ovando, P.; Mouillot, F.; Pernice, U.; Ortega, M.; Velea, R.; Laterza, R.; Moreira, B. Developing an Integrated Capitals Approach to Understanding Wildfire Vulnerability: Preliminary Considerations from a Literature Review. In Proceedings of the IX International Conference on Forest Fire Research, Coimbra, Portugal, 11–18 November 2022; Viegas, D.X., Ribeiro, L.M., Eds.; 2022; pp. 1073–1083. [Google Scholar]
  164. Pearce, D.W.; Turner, R.K. Economics of Natural Resources and the Environment; Johns Hopkins University Press: Baltimore, MD, USA, 1990; p. 378. [Google Scholar]
  165. Turner, R.; Badura, T.; Ferrini, S. Valuation, Natural Capital Accounting and Decision-Support Systems: Process, Tools and Methods; University of East Anglia Centre for Social and Economic Research on the Global Environment: Norwich, UK, 2019. [Google Scholar]
  166. Potschin, M.B.; Haines-Young, R.H. Ecosystem services: Exploring a geographical perspective. Prog. Phys. Geogr. Earth Environ. 2011, 35, 575–594. [Google Scholar] [CrossRef]
  167. Molina-Martínez, J.R.; González-Cabán, A.; Rodríguez y Silva, F. Wildfires impact on the economic susceptibility of recreation activities: Application in a Mediterranean protected area. J. Environ. Manag. 2019, 245, 454–463. [Google Scholar] [CrossRef] [PubMed]
  168. Valatin, G. Carbon Valuation in Forestry and Prospects for European Harmonisation. EFI Tech. Rep. 2014, 97. [Google Scholar]
  169. Boxall, P.C.; Englin, J.E. Fire and Recreational Values in Fire-Prone Forests: Exploring an Intertemporal Amenity Function Using Pooled RP-SP Data. J. Agric. Resour. Econ. 2008, 33, 1–15. [Google Scholar]
  170. Abiodun, A.A. The Economic Implications of Remote Sensing from Space for the Developing Countries; ESA SP-134; Earth Observation from Space and Management of Planetary Resources: Paris, France, 1978; pp. 575–584. [Google Scholar]
  171. Loomis, J.; Gonzalez-Caban, A.; Englin, J. Testing for differential effects of forest fires on hiking and mountain biking demand and benefits. J. Agric. Resour. Econ. 2001, 508–522. [Google Scholar]
  172. Sánchez, J.J.; Baerenklau, K.; González-Cabán, A. Valuing hypothetical wildfire impacts with a Kuhn–Tucker model of recreation demand. For. Policy Econ. 2016, 71, 63–70. [Google Scholar] [CrossRef]
  173. Molina-Martínez, J.R.; Moreno, R.; Castillo, M.; Rodríguez y Silva, F. Economic susceptibility of fire-prone landscapes in natural protected areas of the southern Andean Range. Sci. Total Environ. 2018, 619–620, 1557–1565. [Google Scholar] [CrossRef] [PubMed]
  174. Molina-Martínez, J.R.; Rodríguez-Silva, F.; Machuca, M. Economic vulnerability of fire-prone landscapes in protected natural areas: Application in a Mediterranean Natural Park. Eur. J. For. Res. 2017, 136, 609–624. [Google Scholar] [CrossRef]
  175. Varela, E.; Jacobsen, J.B.; Mavsar, R. Social demand for multiple benefits provided by Aleppo pine forest management in Catalonia, Spain. Reg. Environ. Chang. 2017, 17, 539–550. [Google Scholar] [CrossRef]
  176. Wu, T.; Kim, Y.-S. Pricing ecosystem resilience in frequent-fire ponderosa pine forests. For. Policy Econ. 2013, 27, 8–12. [Google Scholar] [CrossRef]
  177. Roman, M.V.; Azqueta, D.; Rodrígues, M. Methodological approach to assess the socio-economic vulnerability to wildfires in Spain. For. Ecol. Manag. 2012, 294, 158–165. [Google Scholar] [CrossRef]
  178. Treasury, H. The Green Book: Central Government Guidance on Appraisal and Evaluation; OGL Press: London, UK, 2018. Available online: www.gov.uk/government/publications (accessed on 30 March 2023).
  179. Ackerman, F.; Heinzerling, L. Pricing the priceless: Cost-benefit analysis of environmental protection. Univ. Pa. Law Rev. 2002, 150, 1553–1584. [Google Scholar] [CrossRef]
  180. Baveye, P.C.; Baveye, J.; Gowdy, J. Monetary valuation of ecosystem services: It matters to get the timeline right. Ecol. Econ. 2013, 95, 231–235. [Google Scholar] [CrossRef]
  181. Victor, P.A. Cents and nonsense: A critical appraisal of the monetary valuation of nature. Ecosyst. Serv. 2020, 42, 101076. [Google Scholar] [CrossRef]
  182. Masood, E. More than dollars: Mega-review finds 50 ways to value nature. Nature 2022. [Google Scholar] [CrossRef] [PubMed]
  183. IPBES. Methodological Assessment Report on the Diverse Values and Valuation of Nature of the Intergovernmental Science-Policy Platform on Biodiversity and Ecosystem Services; IPBES Secretariat: Bonn, Germany, 2022.
  184. Cordell, H.K.; Murphy, D.; Riitters, K.H.; Harvard, J. The natural ecological value of wilderness. In The Natural Ecological Value of Wilderness; Cordell, H.K., Bergstrom, J.C., Bowker, J.M., Eds.; Venture Publishing Inc.: Calgary, AB, Canada, 2005; pp. 205–249. [Google Scholar]
  185. Ratcliffe, D. A Nature Conservation Review: Volume 1: The Selection of Biological Sites of National Importance to Nature Conservation in Britain; Cambridge University Press: Cambridge, UK, 1997; Volume 1. [Google Scholar]
  186. Tilman, D.; Isbell, F.; Cowles, J.M. Biodiversity and ecosystem functioning. Annu. Rev. Ecol. Evol. Syst. 2014, 45, 471–493. [Google Scholar] [CrossRef]
  187. Tribot, A.-S.; Deter, J.; Mouquet, N. Integrating the aesthetic value of landscapes and biological diversity. Proc. R. Soc. B Biol. Sci. 2018, 285, 20180971. [Google Scholar] [CrossRef]
  188. Fry, G.; Tveit, M.S.; Ode, Å.; Velarde, M. The ecology of visual landscapes: Exploring the conceptual common ground of visual and ecological landscape indicators. Ecol. Indic. 2009, 9, 933–947. [Google Scholar] [CrossRef]
  189. Watson, J.E.; Evans, T.; Venter, O.; Williams, B.; Tulloch, A.; Stewart, C.; Thompson, I.; Ray, J.C.; Murray, K.; Salazar, A. The exceptional value of intact forest ecosystems. Nat. Ecol. Evol. 2018, 2, 599–610. [Google Scholar] [CrossRef] [PubMed]
  190. Kangas, K.M.; Tolvanen, A.; Tarvainen, O.; Nikula, A.; Nivala, V.; Huhta, E.; Jäkäläniemi, A. A method for assessing ecological values to reconcile multiple land use needs. Ecol. Soc. 2016, 21. [Google Scholar] [CrossRef]
  191. Cutter, S.L.; Ash, K.D.; Emrich, C.T. The geographies of community disaster resilience. Glob. Environ. Chang. 2014, 29, 65–77. [Google Scholar] [CrossRef]
  192. Scherzer, S.; Lujala, P.; Rød, J.K. A community resilience index for Norway: An adaptation of the Baseline Resilience Indicators for Communities (BRIC). Int. J. Disaster Risk Reduct. 2019, 36, 101–107. [Google Scholar] [CrossRef]
  193. Cutter, S.L. Resilience to What? Resilience for Whom? Geogr. J. 2016, 182, 110–113. [Google Scholar] [CrossRef]
  194. Fekete, A. Social Vulnerability (Re-)Assessment in Context to Natural Hazards: Review of the Usefulness of the Spatial Indicator Approach and Investigations of Validation Demands. Int. J. Disaster Risk Sci. 2019, 10, 220–232. [Google Scholar] [CrossRef]
  195. Cutter, S.L. Linkages between Vulnerability and Resilience. In Vulnerability and Resilience to Natural Hazards; Cambridge University Press: Cambridge, UK, 2018; pp. 257–270. [Google Scholar]
  196. Cutter, S.L.; Boruff, B.J.; Shirley, W.L. Social Vulnerability to Environmental Hazard. Soc. Sci. Q. 2003, 84, 242–261. [Google Scholar] [CrossRef]
  197. Guillard-Gonçalves, C.; Cutter, S.L.; Emrich, C.T.; Zêzere, J.L. Application of Social Vulnerability Index (SoVI) and delineation of natural risk zones in Greater Lisbon, Portugal. J. Risk Res. 2015, 18, 651–674. [Google Scholar] [CrossRef]
  198. Archibald, S.; Hempson, G.P.; Lehmann, C. A unified framework for plant life-history strategies shaped by fire and herbivory. New Phytol. 2019, 224, 1490–1503. [Google Scholar] [CrossRef]
  199. Amani, B.H.; N’Guessan, A.E.; Van der Meersch, V.; Derroire, G.; Piponiot, C.; Elogne, A.G.; Traoré, K.; N’Dja, J.K.; Hérault, B. Lessons from a regional analysis of forest recovery trajectories in West Africa. Environ. Res. Lett. 2022, 17, 115005. [Google Scholar] [CrossRef]
  200. Moghli, A.; Santana, V.M.; Baeza, M.J.; Pastor, E.; Soliveres, S. Fire recurrence and time since last fire interact to determine the supply of multiple ecosystem services by Mediterranean forests. Ecosystems 2021, 25, 1358–1370. [Google Scholar] [CrossRef]
  201. Hood, S.M.; Varner, J.M.; Jain, T.B.; Kane, J.M. A framework for quantifying forest wildfire hazard and fuel treatment effectiveness from stands to landscapes. Fire Ecol. 2022, 18, 1–12. [Google Scholar]
  202. Noble, I.R.; Slatyer, R. The use of vital attributes to predict successional changes in plant communities subject to recurrent disturbances. Vegetatio 1980, 43, 5–21. [Google Scholar] [CrossRef]
  203. Ibanez, T.; Platt, W.J.; Bellingham, P.J.; Vieilledent, G.; Franklin, J.; Martin, P.H.; Menkes, C.; Pérez-Salicrup, D.R.; Russell-Smith, J.; Keppel, G. Altered cyclone–fire interactions are changing ecosystems. Trends Plant Sci. 2022, 27, 1218–1230. [Google Scholar] [CrossRef] [PubMed]
  204. Nabuurs, G.-J.; Verweij, P.; Van Eupen, M.; Pérez-Soba, M.; Pülzl, H.; Hendriks, K. Next-generation information to support a sustainable course for European forests. Nat. Sustain. 2019, 2, 815–818. [Google Scholar] [CrossRef]
  205. Hong, H.; Tsangaratos, P.; Ilia, I.; Liu, J.; Zhu, A.X.; Xu, C. Applying genetic algorithms to set the optimal combination of forest fire related variables and model forest fire susceptibility based on data mining models. The case of Dayu County, China. Sci. Total Environ. 2018, 630, 1044–1056. [Google Scholar] [CrossRef] [PubMed]
  206. Yool, S.R.; Eckhardt, D.W.; Estes, J.E.; Cosentino, M.J. Describing the brushfire hazard in southern California. Ann. Assoc. Am. Geogr. 1985, 75, 417–430. [Google Scholar] [CrossRef]
  207. Bistinas, I.; Harrison, S.; Prentice, I.C.; Pereira, J. Causal relationships versus emergent patterns in the global controls of fire frequency. Biogeosciences 2014, 11, 5087–5101. [Google Scholar] [CrossRef]
  208. Syphard, A.D.; Radeloff, V.C.; Keeley, J.E.; Hawbaker, T.J.; Clayton, M.K.; Stewart, S.I.; Hammer, R.B. Human Influence on California Fire Regimes. Ecol. Appl. 2007, 17, 1388–1402. [Google Scholar] [CrossRef] [PubMed]
  209. Wendling, Z.A.; Emerson, J.W.; de Sherbinin, A.; Etsy, D.C. Environmental Performance Index 2020; Yale Center for Environmental Law and Policy: New Haven, CT, USA, 2020; p. 205. [Google Scholar]
  210. Alcasena, F.J.; Ager, A.A.; Bailey, J.D.; Pineda, N.; Vega-Garcia, C. Towards a comprehensive wildfire management strategy for Mediterranean areas: Framework development and implementation in Catalonia, Spain. J. Environ. Manag. 2019, 231, 303–320. [Google Scholar] [CrossRef]
  211. Chuvieco, E.; Martinez, S.; Roman, M.V.; Hantson, S.; Pettinari, L. Integration of ecological and socio-economic factors to assess global wildfire vulnerability Glob. Ecol. Biogeogr. 2014, 23, 245–258. [Google Scholar] [CrossRef]
  212. Gómez-Delgado, M.; Tarantola, S. GLOBAL sensitivity analysis, GIS and multicriteria evaluation for a sustainable planning of a hazardous waste disposal site in Spain. Int. J. Geogr. Inf. Sci. 2006, 20, 449–466. [Google Scholar] [CrossRef]
  213. Alcázar, J.; Vega-García, C.; Grauet, M.; Pemán, J.; Fernández, A. Human risk and fire danger estimation through multicriteria evaluation methods for forest fire prevention in Barcelona, Spain. In III International Conference on Forest Fire Research–14th Conference on Fire and Forest Meteorology, Coimbra; Viegas, D.X., Ed.; ADAI: Coimbra, Portugal, 1998; pp. 2379–2387. [Google Scholar]
  214. Bachmann, A.; Allgöwer, B. Framework for Wildfire Risk Analysis. In III International Conference on Forest Fire Research–14th Conference on Fire and Forest Meteorology, Coimbra; Viegas, D.X., Ed.; ADAI: Coimbra, Portugal, 1998; pp. 2177–2190. [Google Scholar]
  215. Parente, J.; Pereira, M.G. Structural fire risk: The case of Portugal. Sci. Total Environ. 2016, 573, 883–893. [Google Scholar] [CrossRef] [PubMed]
  216. Tarantola, A. Inverse Problem Theory and Methods for Model Parameter Estimation; Society for Industrial and Applied Mathematics: Philadelphia, PA, USA, 2005; p. 342. [Google Scholar]
  217. Oliveira, S.; Oehler, F.; San-Miguel-Ayanz, J.; Camia, A.; Pereira, J.M. Modeling spatial patterns of fire occurrence in Mediterranean Europe using Multiple Regression and Random Forest. For. Ecol Manag. 2012, 275, 117–129. [Google Scholar] [CrossRef]
  218. Vasconcelos, M.J.P.; Silva, S.; Tomé, M.; Alvim, M.; Pereira, J.M.C. Spatial prediction of fire ignition probabilities: Comparing logistic regression and neural networks. PERS 2001, 67, 73–83. [Google Scholar]
  219. Koutsias, N.; Martínez-Fernández, J.; Allgöwer, B. Do Factors Causing Wildfires Vary in Space? Evidence from Geographically Weighted Regression. GISci. Remote Sens. 2010, 47, 221–240. [Google Scholar] [CrossRef]
  220. Fernandez-Anez, N.; Krasovskiy, A.; Müller, M.; Vacik, H.; Baetens, J.; Hukić, E.; Kapovic Solomun, M.; Atanassova, I.; Glushkova, M.; Bogunović, I.; et al. Current Wildland Fire Patterns and Challenges in Europe: A Synthesis of National Perspectives. Air Soil Water Res. 2021, 14, 11786221211028185. [Google Scholar] [CrossRef]
  221. Leuenberger, M.; Parente, J.; Tonini, M.; Pereira, M.G.; Kanevski, M. Wildfire susceptibility mapping: Deterministic vs. stochastic approaches. Environ. Model. Softw. 2018, 101, 194–203. [Google Scholar] [CrossRef]
  222. Vega-García, C.; Lee, B.; Wooddard, T. Applying neural network technology to human-caused wildfire occurence prediction. AI Appl. 1996, 10, 9–18. [Google Scholar]
  223. Yang, X.; Jin, X.; Zhou, Y. Wildfire risk assessment and zoning by integrating Maxent and GIS in Hunan province, China. Forests 2021, 12, 1299. [Google Scholar] [CrossRef]
  224. Ben-Tal, A. Characterization of Pareto and Lexicographic Optimal Solutions; Fandel, G., Gal, T., Eds.; Springer: Berlin/Heidelberg, Germany, 1980; pp. 1–11. [Google Scholar]
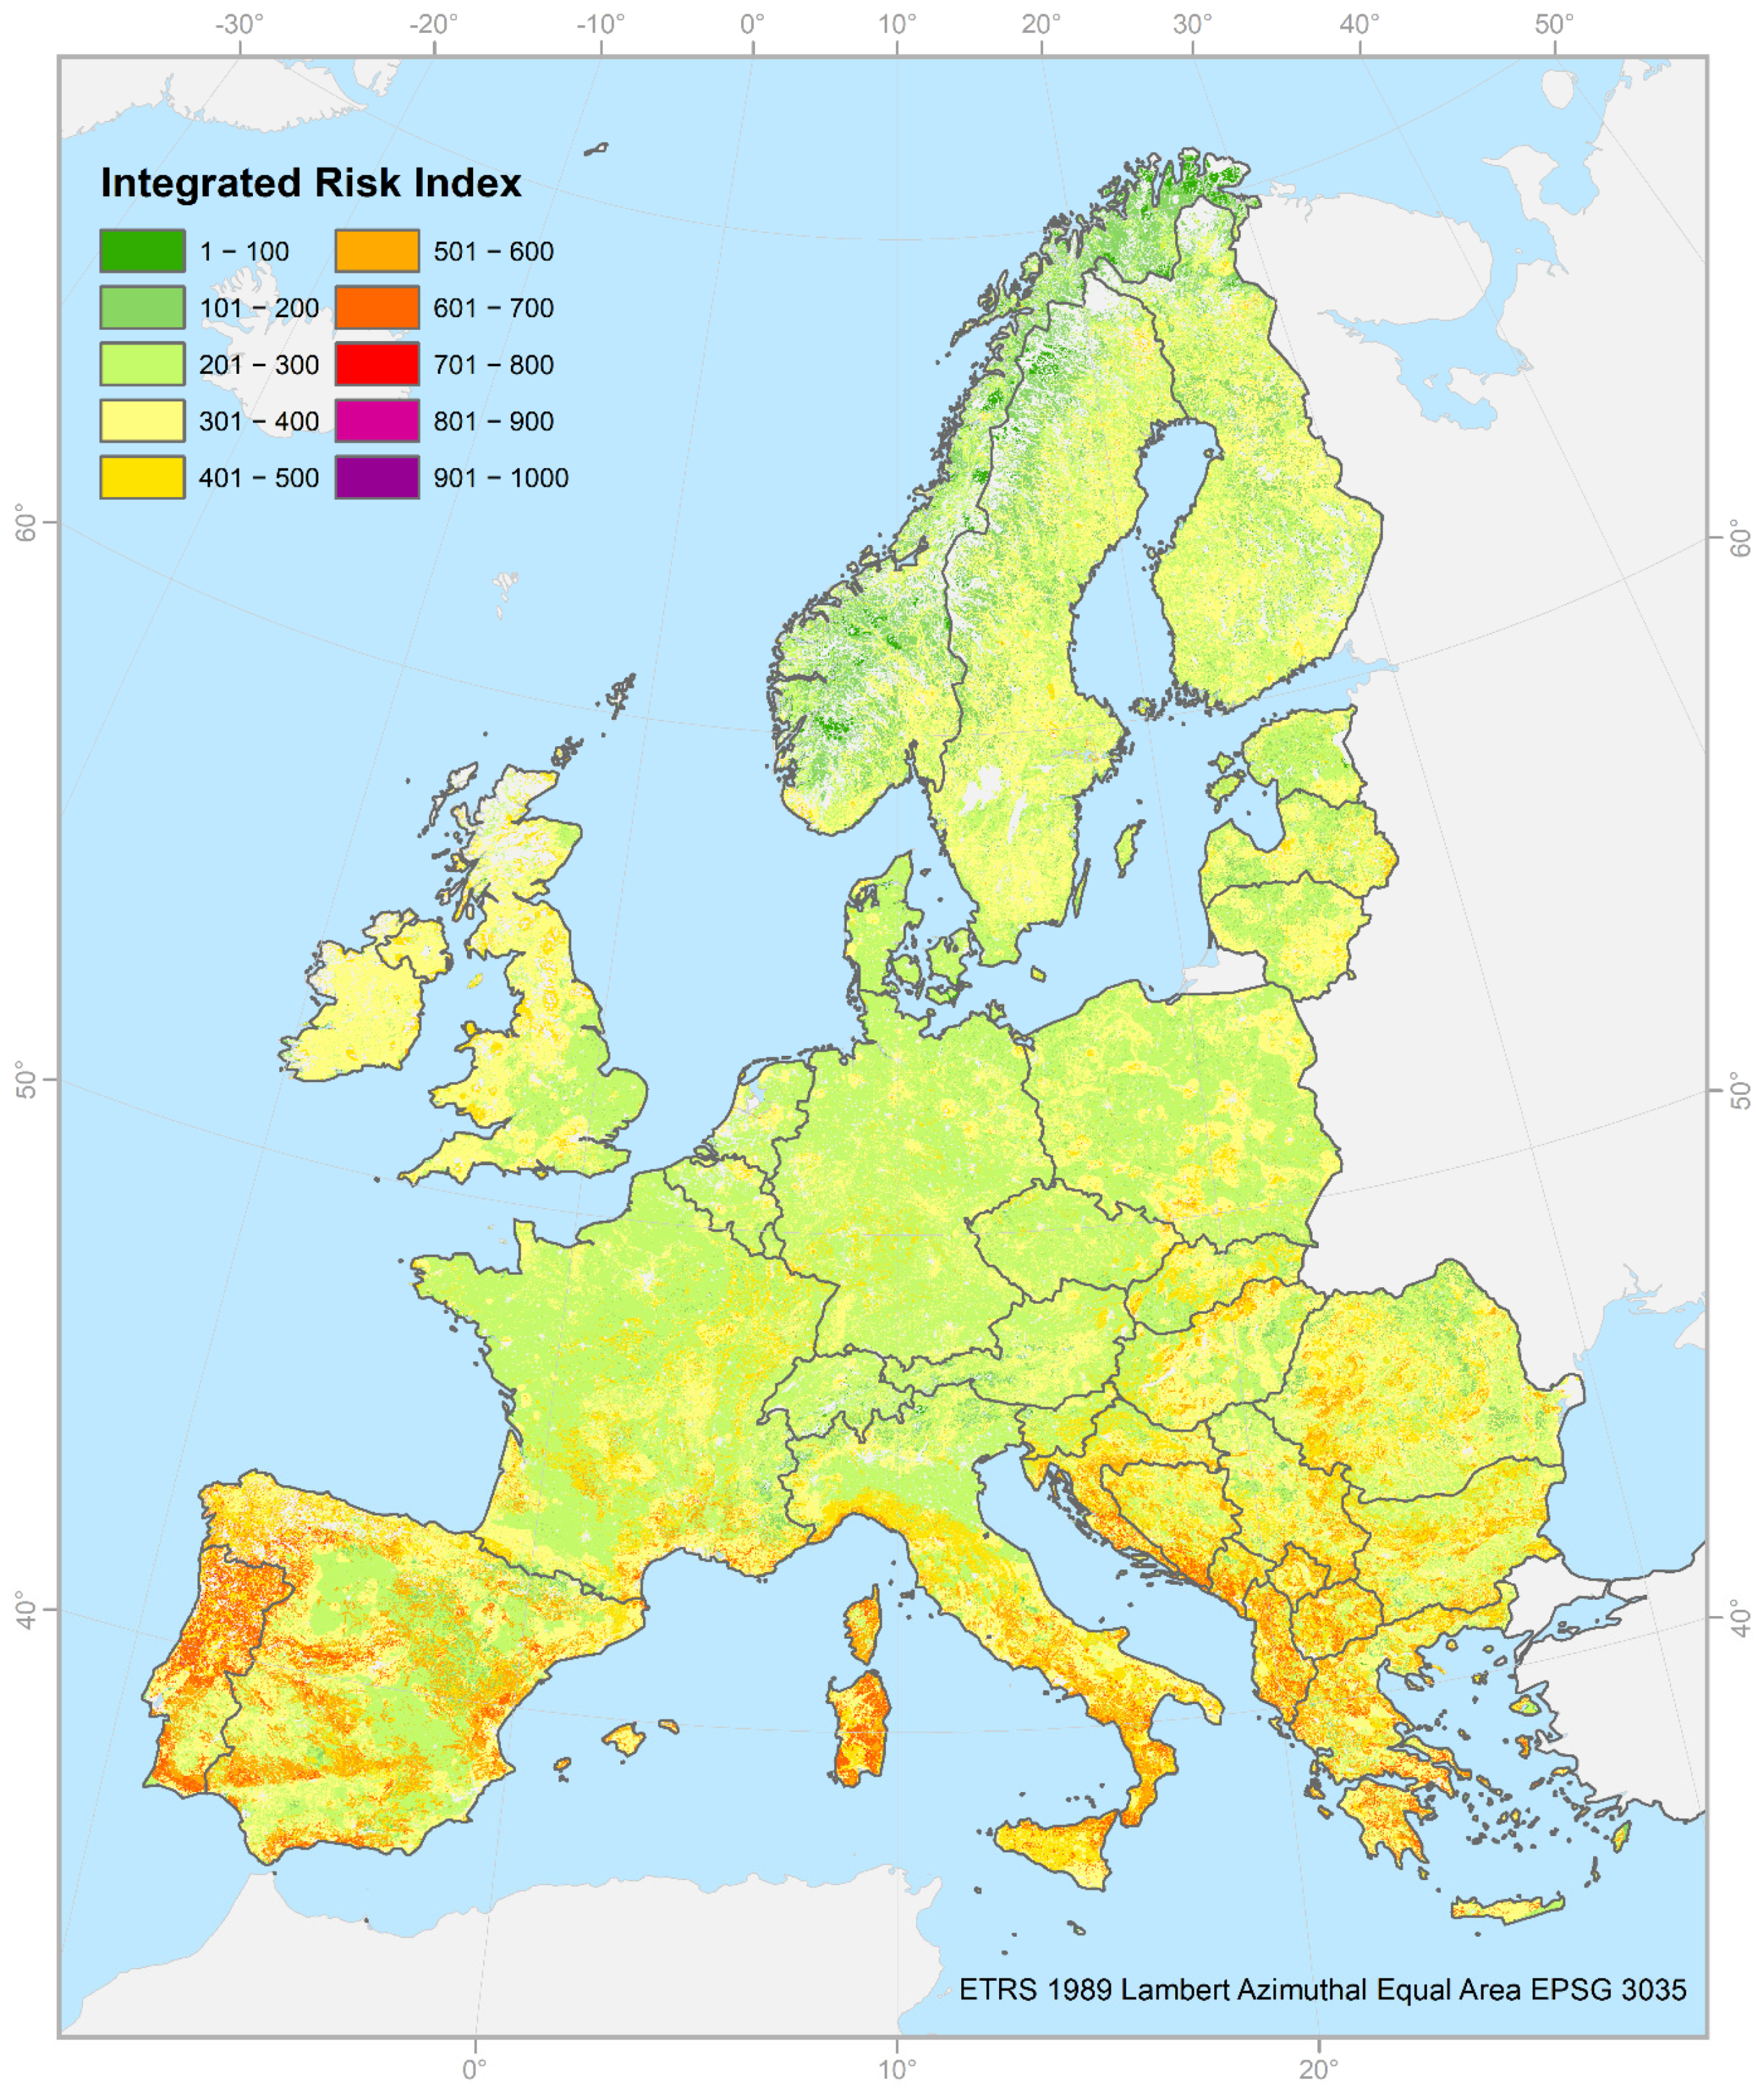
  225. Oom, D.; DeRigo, D.; Pfeiffer, H.; Branco, A.; Ferrari, D.; Grecchi, R.; Artes, T.; Durrant, T.; Boca, R.; Maianti, P.; et al. Pan-European Wildfire Risk Assessment; Publications Office of the European Union: Luxembourg, 2022. [Google Scholar]
  226. Moreno, V.; Chuvieco, E. Characterising fire regimes in Spain from fire statistics. Int. J. Wildland Fire 2013, 22, 296–305. [Google Scholar] [CrossRef]
  227. Chen, D.M.; Pereira, J.M.C.; Masiero, A.; Pirotti, F. Mapping fire regimes in China using MODIS active fire and burned area data. Appl. Geogr. 2017, 85, 14–26. [Google Scholar] [CrossRef]
  228. Hawbaker, T.J.; Vanderhoof, M.K.; Schmidt, G.L.; Beal, Y.-J.; Picotte, J.J.; Takacs, J.D.; Falgout, J.T.; Dwyer, J.L. The Landsat Burned Area algorithm and products for the conterminous United States. Remote Sens. Environ. 2020, 244, 111801. [Google Scholar] [CrossRef]
  229. Andela, N.; Morton, D.C.; Giglio, L.; Paugam, R.; Chen, Y.; Hantson, S.; van der Werf, G.R.; Randerson, J.T. The Global Fire Atlas of individual fire size, duration, speed, and direction. Earth Syst. Sci. Data 2019, 11, 529–552. [Google Scholar] [CrossRef]
  230. Artés, T.; Oom, D.; De Rigo, D.; Durrant, T.H.; Maianti, P.; Libertà, G.; San-Miguel-Ayanz, J. A global wildfire dataset for the analysis of fire regimes and fire behaviour. Sci. Data 2019, 6, 1–11. [Google Scholar] [CrossRef] [PubMed]
  231. Stehman, S.V.; Foody, G.M. Key issues in rigorous accuracy assessment of land cover products. Remote Sens. Environ. 2019, 231, 111199. [Google Scholar] [CrossRef]
  232. Shah, S.U.; Yebra, M.; Van Dijk, A.I.J.M.; Cary, G.J. Relating McArthur fire danger indices to remote sensing derived burned area across Australia. Int. J. Wildland Fire 2023, 32, 133–148. [Google Scholar] [CrossRef]
  233. Rohrmann, B. The role of risk communication processes in disaster preparedness. In Sharing the Future: Risk Communicaiton in Practice; Gough, J., Ed.; Centre for Advanced Engineering: Christchurch, New Zealand, 2003; pp. 85–104. [Google Scholar]
  234. Arvai, J.L. Rethinking of risk communication: Lessons from the decision sciences. Tree Genet. Genomes 2007, 3, 173–185. [Google Scholar] [CrossRef]
  235. Walker, H.M.; Reed, M.G.; Fletcher, A.J. Wildfire in the news media: An intersectional critical frame analysis. Geoforum 2020, 114, 128–137. [Google Scholar] [CrossRef]
  236. Psaroudakis, C.; Xanthopoulos, G.; Stavrakoudis, D.; Barnias, A.; Varela, V.; Gkotsis, I.; Karvouniari, A.; Agorgianitis, S.; Chasiotis, I.; Vlachogiannis, D.; et al. Development of an Early Warning and Incident Response System for the Protection of Visitors from Natural Hazards in Important Outdoor Sites in Greece. Sustainability 2021, 13, 5143. [Google Scholar] [CrossRef]
  237. Jones, G.; Hessburg, P.F.; Keane II, R.E.; Spies, T.; North, M.P.; Collins, B.M.; Finney, M.A.; Lydersen, J. Counteracting wildfire misinformation. Front. Ecol. Environ. 2022, 20, 392–393. [Google Scholar] [CrossRef]
  238. Aliperti, G.; Cruz, A.M. Risk communication to tourists: Towards the definition of a research agenda for a more effective disaster preparedness in Japan. Almatourism-J. Tour. Cult. Territ. Dev. 2018, 9, 1–12. [Google Scholar]
  239. Thompson, M.P.; Ager, A.A.; Finney, M.A.; Calkin, D.E.; Vaillant, N.M. The science and opportunity of wildfire risk assessment. In Novel Approaches and Their Applications in Risk Assessment; Luo, Y., Ed.; InTech: London, UK, 2012; pp. 99–120. [Google Scholar]
  240. Fairbrother, A.; Turnley, J.G. Predicting risks of uncharacteristic wildfires: Application of the risk assessment process. For. Ecol. Manag 2005, 211, 28–35. [Google Scholar] [CrossRef]
  241. Finney, M.A. The challenge of quantitative risk analysis for wildland fire. For. Ecol Manag. 2005, 211, 97–108. [Google Scholar] [CrossRef]
  242. Thompson, M.P.; Calkin, D.E. Uncertainty and risk in wildland fire management: A review. J. Environ. Manag. 2011, 92, 1895–1909. [Google Scholar] [CrossRef] [PubMed]
  243. Abatzoglou, J.T.; Williams, A.P.; Barbero, R. Global emergence of anthropogenic climate change in fire weather indices. Geophys. Res. Lett. 2019, 46, 326–336. [Google Scholar] [CrossRef]
  244. Turco, M.; Jerez, S.; Augusto, S.; Tarín-Carrasco, P.; Ratola, N.; Jiménez-Guerrero, P.; Trigo, R.M. Climate drivers of the 2017 devastating fires in Portugal. Sci. Rep. 2019, 9, 13886. [Google Scholar] [CrossRef] [PubMed]
  245. Fernandes, P.M.; Davies, G.M.; Ascoli, D.; Fernández, C.; Moreira, F.; Rigolot, E.; Stoof, C.R.; Vega, J.A.; Molina, D. Prescribed burning in southern Europe: Developing fire management in a dynamic landscape. Front. Ecol. Environ. 2013, 11, e4–e14. [Google Scholar] [CrossRef]
  246. Moreira, F.; Viedma, O.; Arianoutsou, M.; Curt, T.; Koutsias, N.; Rigolot, E.; Barbati, A.; Corona, P.; Vaz, P.; Xanthopoulos, G.; et al. Landscape–wildfire interactions in southern Europe: Implications for landscape management. J. Environ. Manag. 2011, 92, 2389–2402. [Google Scholar] [CrossRef]
  247. Calkin, D.; Price, O.; Salis, M. WUI Risk Assessment at the Landscape Level. In Encyclopedia of Wildfires and Wildland-Urban Interface (WUI) Fires; Manzello, S.L., Ed.; Springer International Publishing: Cham, Switzerland, 2020; pp. 1184–1195. [Google Scholar]
  248. Calkin, D.E.; Cohen, J.D.; Finney, M.A.; Thompson, M.P. How risk management can prevent future wildfire disasters in the wildland-urban interface. Proc. Natl. Acad. Sci. USA 2014, 111, 746–751. [Google Scholar] [CrossRef]
  249. Radeloff, V.C.; Helmers, D.P.; Kramer, H.A.; Mockrin, M.H.; Alexandre, P.M.; Bar-Massada, A.; Butsic, V.; Hawbaker, T.J.; Martinuzzi, S.; Syphard, A.D. Rapid growth of the US wildland-urban interface raises wildfire risk. Proc. Natl. Acad. Sci. USA 2018, 115, 3314–3319. [Google Scholar] [CrossRef]
  250. Wunder, S.; Calkin, D.E.; Charlton, V.; Feder, S.; Arano, I.; Moore, P.; Rodríguez; Silva, F.; Tacconi, L.; Vega-García, C. Resilient landscapes to prevent catastrophic forest fires: Socioeconomic insights towards a new paradigm. For. Policy Econ. 2021, 128, 102458. [Google Scholar] [CrossRef]
  251. Moritz, M.A.; Batllori, E.; Bradstock, R.A.; Gill, A.M.; Handmer, J.; Hessburg, P.F.; Leonard, J.; McCaffrey, S.; Odion, D.C.; Schoennagel, T. Learning to coexist with wildfire. Nature 2014, 515, 58–66. [Google Scholar] [CrossRef] [PubMed]
  252. North, M.P.; Stephens, S.L.; Collins, B.; Agee, J.; Aplet, G.; Franklin, J.; Fule, P. Reform forest fire management. Science 2015, 349, 1280–1281. [Google Scholar] [CrossRef] [PubMed]
  253. Ager, A.A.; Vaillant, N.M.; Finney, M.A. A comparison of landscape fuel treatment strategies to mitigate wildland fire risk in the urban interface and preserve old forest structure. For. Ecol. Manag. 2010, 259, 1556–1570. [Google Scholar] [CrossRef]
  254. Palaiologou, P.; Kalabokidis, K.; Ager, A.A.; Galatsidas, S.; Papalampros, L.; Day, M.A. Spatial Optimization and Tradeoffs of Alternative Forest Management Scenarios in Macedonia, Greece. Forests 2021, 12, 697. [Google Scholar] [CrossRef]
  255. Salis, M.; Laconi, M.; Ager, A.A.; Alcasena, F.J.; Arca, B.; Lozano, O.; Oliveira, A.; Spano, D. Evaluating alternative fuel treatment strategies to reduce wildfire losses in a Mediterranean area. For. Ecol. Manag. 2016, 368, 207–221. [Google Scholar] [CrossRef]
  256. Calkin, D.E.; Ager, A.A.; Gilbertson-Day, J.; Scott, J.; Finney, M.; Schrader-Patton, C.; Quigley, T.; Strittholt, J.; Kaiden, J. Wildfire Risk and Hazard: Procedures for the First Approximation; Gen Tech. Rep. RMRS-GTR-235; US Department of Agriculture, Forest Service, Rocky Mountain Research Station: Fort Collins, CO, USA, 2010; 62p. [Google Scholar]
  257. Hand, M.S.; Gebert, K.M.; Liang, J.; Calkin, D.E.; Thompson, M.P.; Zhou, M. Development and Application of Wildland Fire Expenditures Models. In Economics of Wildfire Management: The Development and Application of Suppression Expenditure Models, SpringerBriefs in Fire; Hand, M.S., Gebert, K.M., Liang, J., Calkin, D.E., Thompson, M.P., Zhou, M., Eds.; Springer: New York, NY, USA, 2014; pp. 5–18. [Google Scholar]
  258. Reinhardt, E.D. Objectives and considerations for wildland fuel treatment in forested ecosystems of the interior western United States. For. Ecol. Manag. 2008, 256, 1997–2006. [Google Scholar] [CrossRef]
  259. Parisien, M.A.; Dawe, D.A.; Miller, C.; Stockdale, C.A.; Armitage, O.B. Applications of simulation-based burn probability modelling: A review. Int. J. Wildland Fire 2020, 28, 913–926. [Google Scholar] [CrossRef]
  260. Sample, M.; Thode, A.E.; Peterson, C.; Gallagher, M.R.; Flatley, W.; Friggens, M.; Evans, A.; Loehman, R.; Hedwall, S.; Brandt, L.; et al. Adaptation Strategies and Approaches for Managing Fire in a Changing Climate. Climate 2022, 10, 58. [Google Scholar] [CrossRef]
  261. Ager, A.A.; Vaillant, N.M.; Finney, M.A.; Preisler, H.K. Analyzing wildfire exposure and source–sink relationships on a fire prone forest landscape. For. Ecol. Manag. 2012, 267, 271–283. [Google Scholar] [CrossRef]
  262. Salis, M.; Arca, B.; Del Giudice, L.; Palaiologou, P.; Alcasena-Urdiroz, F.; Ager, A.; Fiori, M.; Pellizzaro, G.; Scarpa, C.; Schirru, M.; et al. Application of simulation modeling for wildfire exposure and transmission assessment in Sardinia, Italy. Int. J. Disaster Risk Reduct. 2021, 58, 102189. [Google Scholar] [CrossRef]
  263. Campos, J.C.; Bernhardt, J.; Aquilué, N.; Brotons, L.; Domínguez, J.; Lomba, Â.; Marcos, B.; Martínez-Freiría, F.; Moreira, F.; Pais, S. Using fire to enhance rewilding when agricultural policies fail. Sci. Total Environ. 2021, 755, 142897. [Google Scholar] [CrossRef] [PubMed]
  264. Pais, S.; Aquilué, N.; Campos, J.; Sil, Â.; Marcos, B.; Martínez-Freiría, F.; Domínguez, J.; Brotons, L.; Honrado, J.P.; Regos, A. Mountain farmland protection and fire-smart management jointly reduce fire hazard and enhance biodiversity and carbon sequestration. Ecosyst. Serv. 2020, 44, 101143. [Google Scholar] [CrossRef]
  265. Neidermeier, A.N.; Zagaria, C.; Pampanoni, V.; West, T.A.P.; Verburg, P.H. Mapping Opportunities for Wildfire Hazard Reduction in Europe through Targeted Land Management Strategies. 2023. Available online: https://ssrn.com/abstract=4410640 (accessed on 30 April 2023).
  266. Baijnath-Rodino, J.A.; Foufoula-Georgiou, E.; Banerjee, T. Reviewing the “Hottest” Fire Indices Worldwide. Authorea Prepr. 2022. [Google Scholar] [CrossRef]
  267. Kupfer, J.A.; Terando, A.J.; Gao, P.; Teske, C.; Hiers, J.K. Climate change projected to reduce prescribed burning opportunities in the south-eastern United States. Int. J. Wildland Fire 2020, 29, 764–778. [Google Scholar] [CrossRef]
  268. Hurteau, M.D.; Bradford, J.B.; Fulé, P.Z.; Taylor, A.H.; Martin, K.L. Climate change, fire management, and ecological services in the southwestern US. For. Ecol Manag. 2014, 327, 280–289. [Google Scholar] [CrossRef]
  269. Cobb, R.C. The Intertwined Problems of Wildfire, Forest Disease, and Climate Change Interactions. Curr. For. Rep. 2022, 8, 214–228. [Google Scholar] [CrossRef]
  270. Biedermann, P.H.W.; Müller, J.; Grégoire, J.-C.; Gruppe, A.; Hagge, J.; Hammerbacher, A.; Hofstetter, R.W.; Kandasamy, D.; Kolarik, M.; Kostovcik, M.; et al. Bark Beetle Population Dynamics in the Anthropocene: Challenges and Solutions. Trends Ecol. Evol. 2019, 34, 914–924. [Google Scholar] [CrossRef]
  271. Paine, R.T.; Tegner, M.J.; Johnson, E.A. Compounded perturbations yield ecological surprises. Ecosystems 1998, 1, 535–545. [Google Scholar] [CrossRef]
  272. Seidl, R.; Schelhaas, M.-J.; Rammer, W.; Verkerk, P.J. Increasing forest disturbances in Europe and their impact on carbon storage. Nat. Clim. Chang. 2014, 4, 806–810. [Google Scholar] [CrossRef]
  273. Lausch, A.; Heurich, M.; Fahse, L. Spatio-temporal infestation patterns of Ips typographus (L.) in the Bavarian Forest National Park, Germany. Ecol. Indic. 2013, 31, 73–81. [Google Scholar] [CrossRef]
  274. Löwe, R.; Sedlecký, M.; Sikora, A.; Prokůpková, A.; Modlinger, R.; Novotný, K.; Turčáni, M. How Bark Beetle Attack Changes the Tensile and Compressive Strength of Spruce Wood (Picea abies (L.) H. Karst.). Forests 2022, 13, 87. [Google Scholar] [CrossRef]
  275. Morris, J.L.; Cottrell, S.; Fettig, C.J.; Hansen, W.D.; Sherriff, R.L.; Carter, V.A.; Clear, J.L.; Clement, J.; DeRose, R.J.; Hicke, J.A.; et al. Managing bark beetle impacts on ecosystems and society: Priority questions to motivate future research. J. Appl. Ecol. 2017, 54, 750–760. [Google Scholar] [CrossRef]
  276. Senf, C.; Seidl, R. Storm and fire disturbances in Europe: Distribution and trends. Glob. Chang. Biol. 2021, 27, 3605–3619. [Google Scholar] [CrossRef] [PubMed]
  277. Heisig, J.; Olson, E.; Pebesma, E. Predicting Wildfire Fuels and Hazard in a Central European Temperate Forest Using Active and Passive Remote Sensing. Fire 2022, 5, 29. [Google Scholar] [CrossRef]
  278. Fernandez-Carrillo, A.; Patočka, Z.; Dobrovolný, L.; Franco-Nieto, A.; Revilla-Romero, B. Monitoring Bark Beetle Forest Damage in Central Europe. A Remote Sensing Approach Validated with Field Data. Remote Sens. 2020, 12, 3634. [Google Scholar] [CrossRef]
  279. Raffa, K.F.; Aukema, B.H.; Bentz, B.J.; Carroll, A.L.; Hicke, J.A.; Turner, M.G.; Romme, W.H. Cross-scale Drivers of Natural Disturbances Prone to Anthropogenic Amplification: The Dynamics of Bark Beetle Eruptions. BioScience 2008, 58, 501. [Google Scholar] [CrossRef]
  280. Sommerfeld, A.; Rammer, W.; Heurich, M.; Hilmers, T.; Müller, J.; Seidl, R. Do bark beetle outbreaks amplify or dampen future bark beetle disturbances in Central Europe? J. Ecol. 2021, 109, 737–749. [Google Scholar] [CrossRef]
  281. Colavito, M. The human dimensions of spatial, pre-wildfire planning decision support systems: A review of barriers, facilitators, and recommendations. Forests 2021, 12, 483. [Google Scholar] [CrossRef]
  282. Deeming, J.E. The National Fire Danger Rating System; Rocky Mountain Forest and Range Experiment Station, Forest Service, US Department of Agriculture: Ogden, UT, USA, 1977; p. 63. [Google Scholar]
  283. Noonan-Wright, E.; Seielstad, C.A. Patterns of wildfire risk in the United States from systematic operational risk assessments: How risk is characterised by land managers. Int. J. Wildland Fire 2021, 30, 569–584. [Google Scholar] [CrossRef]
  284. Scott, J.H.; Thompson, M.P.; Calkin, D.E. A Wildfire Risk Assessment Framework for Land and Resource Management; CreateSpace Independent Publishing Platform: Scotts Valley, CA, USA, 2013. [Google Scholar] [CrossRef]
  285. Drury, S.A.; Rauscher, H.M.; Banwell, E.M.; Huang, S.; Lavezzo, T.L. The interagency fuels treatment decision support system: Functionality for fuels treatment planning. Fire Ecol. 2016, 12, 103–123. [Google Scholar] [CrossRef]
  286. Thompson, M.P.; Haas, J.R.; Gilbertson-Day, J.W.; Scott, J.H.; Langowski, P.; Bowne, E.; Calkin, D.E. Development and application of a geospatial wildfire exposure and risk calculation tool. Environ. Model. Softw. 2015, 63, 61–72. [Google Scholar] [CrossRef]
  287. McEvoy, A.; Kerns, B.K.; Kim, J.B. Hazards of risk: Identifying plausible community wildfire disasters in low-frequency fire regimes. Forests 2021, 12, 934. [Google Scholar] [CrossRef]
  288. Iglesias, V.; Stavros, N.; Balch, J.K.; Barrett, K.; Cobian-Iñiguez, J.; Hester, C.; Kolden, C.A.; Leyk, S.; Nagy, R.C.; Reid, C.E. Fires that matter: Reconceptualizing fire risk to include interactions between humans and the natural environment. Environ. Res. Lett. 2022, 17, 045014. [Google Scholar] [CrossRef]
  289. Metlen, K.L.; Fairbanks, T.; Bennett, M.; Volpe, J.; Kuhn, B.; Thompson, M.P.; Thrailkill, J.; Schindel, M.; Helmbrecht, D.; Scott, J. Integrating forest restoration, adaptation, and proactive fire management: Rogue River Basin case study. Can. J. For. Res. 2021, 51, 1292–1306. [Google Scholar] [CrossRef]
  290. Balch, J.K.; Iglesias, V.; Braswell, A.E.; Rossi, M.W.; Joseph, M.B.; Mahood, A.L.; Shrum, T.R.; White, C.T.; Scholl, V.M.; McGuire, B. Social-environmental extremes: Rethinking extraordinary events as outcomes of interacting biophysical and social systems. Earth’s Future 2020, 8, e2019EF001319. [Google Scholar] [CrossRef]
  291. Greiner, S.M.; Schultz, C.A.; Kooistra, C. Pre-season fire management planning: The use of Potential Operational Delineations to prepare for wildland fire events. Int. J. Wildland Fire 2020, 30, 170–178. [Google Scholar] [CrossRef]
  292. Thompson, M.P.; O’Connor, C.D.; Gannon, B.M.; Caggiano, M.D.; Dunn, C.J.; Schultz, C.A.; Calkin, D.E.; Pietruszka, B.; Greiner, S.M.; Stratton, R. Potential operational delineations: New horizons for proactive, risk-informed strategic land and fire management. Fire Ecol. 2022, 18, 1–20. [Google Scholar] [CrossRef]
  293. Jolly, W.M.; Freeborn, P.H.; Page, W.G.; Butler, B.W. Severe fire danger index: A forecastable metric to inform firefighter and community wildfire risk management. Fire 2019, 2, 47. [Google Scholar] [CrossRef]
  294. Stocks, B.J.; Lawson, B.D.; Alexander, M.E.; Van Wagner, C.E.; McAlpine, R.S.; Lynham, T.J.; Dubé, D.E. Canadian Forest Fire Danger Rating System: An Overview. For. Chron. 1989, 65, 258–265. [Google Scholar] [CrossRef]
  295. Van Wagner, C.E. Development and structure of the Canadian Forest Fire Weather Index System; 35; Canadian Forest Service: Otawa, ON, Canada, 1987; p. 48. [Google Scholar]
  296. Hirsch, K.G. Canadian Forest Fire Behavior Prediction (FBP) System: User’s Guide; Northern Forestry Centre: Edmonton, AB, Canada, 1996; p. 122. [Google Scholar]
  297. Woolford, D.G.; Martell, D.L.; McFayden, C.B.; Evens, J.; Stacey, A.; Wotton, B.M.; Boychuk, D. The development and implementation of a human-caused wildland fire occurrence prediction system for the province of Ontario, Canada. Can. J. For. Res. 2020, 51, 303–325. [Google Scholar] [CrossRef]
  298. Parisien, M.A.; Kafka, V.G.; Hirsch, K.G.; Todd, J.B.; Lavoie, S.G.; Maczek, P.D. Mapping Wildfire Susceptibility with the Burn-P3 Simulation Model; NOR-X-405; Natural Resources Canada, Canadian Forest Service, Northern Forestry Centre: Edmonton, AB, Canada, 2005; p. 45. [Google Scholar]
  299. Reed, W.J. A note on fire frequency concepts and definitions. Can. J. For. Res. 2006, 36, 1884–1888. [Google Scholar] [CrossRef]
  300. Taylor, S.W.; Woolford, D.G.; Dean, C.B.; Martell, D.L. Wildfire Prediction to Inform Fire Management: Statistical Science Challenges. Stat. Sci. 2013, 28, 586–615. [Google Scholar] [CrossRef]
  301. IGBP. Report of the 4th IGBP-DIS Fire Working Group Meeting; IGBP-DIS Working Paper #21; IGBP-DIS: Toulousse, France, 1999. [Google Scholar]
  302. Beverly, J.L.; McLoughlin, N. Burn probability simulation and subsequent wildland fire activity in Alberta, Canada–implications for risk assessment and strategic planning. For. Ecol Manag. 2019, 451, 117490. [Google Scholar] [CrossRef]
  303. Parisien, M.-A.; Ager, A.A.; Barros, A.M.; Dawe, D.; Erni, S.; Finney, M.A.; McHugh, C.W.; Miller, C.; Parks, S.A.; Riley, K.L. Commentary on the article “Burn probability simulation and subsequent wildland fire activity in Alberta, Canada–Implications for risk assessment and strategic planning” by JL Beverly and N. McLoughlin. For. Ecol Manag. 2020, 460, 117698. [Google Scholar] [CrossRef]
  304. Johnston, L.M.; Wang, X.; Erni, S.; Taylor, S.W.; McFayden, C.B.; Oliver, J.A.; Stockdale, C.; Christianson, A.; Boulanger, Y.; Gauthier, S.; et al. Wildland fire risk research in Canada. Environ. Rev. 2020, 28, 164–186. [Google Scholar] [CrossRef]
  305. Fuglem, P.L.; Lawson, B.D.; Hawkes, B.C. Fire Protection Guidelines For Juvenile Spacing Projects; British Columbia Ministry of Forests, Canadian Forestry Service: Victoria, BC, Canada, 1983; p. 25. [Google Scholar]
  306. Muraro, S.J. Prescribed Fire–Evaluation Of Hazard Abatement. Departmental Publication Number 1231; Canadian Department of Forestry And Rural Development/Congress of the International Union of Forest Research Organizations: Ottawa, ON, Canada; Munich, Germany, 1968; p. 28. [Google Scholar]
  307. Simard, A.J. Wildland Fire Management–A Systems Approach. Forestry Technical Report 17. Catalogue No. F064-17/1977; Department Of Fisheries And Environment, Canadian Forestry Service: Gatineau, QC, Canada, 1977; p. 33. [Google Scholar]
  308. Boychuk, D.; Martell, D.L. A Multistage Stochastic Programming Model for Sustainable Forest-Level Timber Supply Under Risk of Fire. For. Sci. 1996, 42, 10–26. [Google Scholar]
  309. Savage, D.W.; Martell, D.L.; Wotton, B.M. Evaluation of two risk mitigation strategies for dealing with fire-related uncertainty in timber supply modelling. Can. J. For. Res. 2010, 40, 1136–1154. [Google Scholar] [CrossRef]
  310. McFayden, C.B.; Boychuk, D.; Woolford, D.G.; Wheatley, M.J.; Johnston, L. Impacts of wildland fire effects on resources and assets through expert elicitation to support fire response decisions. Int. J. Wildland Fire 2019, 28, 885–900. [Google Scholar] [CrossRef]
  311. Abo El Ezz, A.; Boucher, J.; Cotton-Gagnon, A.; Godbout, A. Framework for spatial incident-level wildfire risk modelling to residential structures at the wildland urban interface. Fire Saf. J. 2022, 131, 103625. [Google Scholar] [CrossRef]
  312. MNP. A Review of the 2016 Horse River Wildfire: Alberta Agriculture and Forestry Preparedness and Response; MNP LLP: Edmonton, AB, Canada, 2017; p. 92. [Google Scholar]
  313. Xi, D.D.Z.; Taylor, S.W.; Woolford, D.G.; Dean, C.B. Statistical Models of Key Components of Wildfire Risk. Annu. Rev. Stat. Its Appl. 2019, 6, 197–222. [Google Scholar] [CrossRef]
  314. McArthur, A.G. Fire Danger Rating Tables for Annual Grassland; Forestry and Timber Bureau: Canberra, Australia, 1960. [Google Scholar]
  315. Luke, R.H.; McArthur, A.G.; Luke, R. Bushfires in Australia; Luke, R., McArthur, A., Eds.; Australian Government Publishing Service: Canberra, Australia, 1978. [Google Scholar]
  316. Keetch, J.J.; Byram, G.M. A Drought Index for Forest Fire Control; US Department of Agriculture, Forest Service, Southeastern Forest Experiment Station: Asheville, NC, USA, 1968. [Google Scholar]
  317. Matthews, S.; Fox-Hughes, P.; Grootemaat, S.; Hollis, J.J.; Kenny, B.J.; Sauvage, S. Australian Fire Danger Rating System: Research Prototype; NSW Rural Fire Service: Lidcombe, Australia, 2019; p. 384. [Google Scholar]
  318. Alexander, M.E. Proposed Revision of Fire Danger Class Criteria for Forest and Rural Areas in New Zealand, 2nd ed.; National Rural Fire Authority, Wellington, in association with the Scion Rural Fire Research Group: Christchurch, New Zealand, 2008. [Google Scholar]
  319. Vinodkumar, V.; Dharssi, I.; Yebra, M.; Fox-Hughes, P. Continental-scale prediction of live fuel moisture content using soil moisture information. Agric. For. Meteorol. 2021, 307, 108503. [Google Scholar] [CrossRef]
  320. Dharssi, I. Vinodkumar, 2017: A Prototype high Resolution Soil Moisture Analysis System for Australia; Bureau of Meteorology Research Report: Canberra, Australia, 2017. [Google Scholar]
  321. eJenkins, M.J.; Holmes, A.; Monks, J.; Runcie, J.W.; Sauvage, S.; Matthews, S. Ignition, Suppression and Impact Research Prototype: Australian Fire Danger Rating System; NSW Rural Fire Service: Olympic Park, Australia, 2022. [Google Scholar]
  322. European Court of Auditors. Is EU Support for Preventing and Restoring Damage to Forests Caused by Fire and Natural Disasters Well Managed; ECA: Luxembourg, 2014.
  323. San-Miguel-Ayanz, J.; Costa, H.; de Rigo, D.; Libertà, G.; Artés Vivancos, T.; Houston Durrant, T.; Nuijten, D.; Löffler, P.; Moore, P.; Baetens, J.; et al. Basic Criteria to Assess Wildfire Risk at the Pan-European Level; Publications Office of the European Union: Luxembourg, 2019.
  324. Martín-López, B.; Gómez-Baggethun, E.; García-Llorente, M.; Montes, C. Trade-offs across value-domains in ecosystem services assessment. Ecol. Indic. 2014, 37, 220–228. [Google Scholar] [CrossRef]
  325. Oom, D.; de Rigo, D.; Pfeiffer, H.; San-Miguel-Ayanz, J.; Grecchi, R.; Durrant, T.H.; Libertà, G.; Artes-Vivancos, T.; Boca, R.; Maianti, P.; et al. Developing the European wildfire risk assessment (WRA). In Atlas of the Human Planet 2020; Publications Office of the European Union: Luxembourg, 2020; pp. 37–38. [Google Scholar]
  326. Corbane, C.; Florczyk, A.J.; Pesaresi, M.; Politis, P.; Syrris, V. GHS-BUILT R2018A–GHS Built-Up Grid, Derived from Landsat, Multitemporal (1975-1990-2000-2014). European Commission, Joint Research Centre (JRC) [Dataset]. 2018. Available online: http://data.europa.eu/89h/jrc-ghsl-10007 (accessed on 1 May 2023).
  327. Pekel, J.-F.; Cottam, A.; Gorelick, N.; Belward, A.S. High-resolution mapping of global surface water and its long-term changes. Nature 2016, 540, 418–422. [Google Scholar] [CrossRef] [PubMed]
  328. Le Saout, S.L.; Hoffmann, M.; Shi, Y.; Hughes, A.; Bernard, C.; Brooks, T.M.; Bertzky, B.; Butchart, S.H.M.; Stuart, S.N.; Badman, T.; et al. Protected areas and effective biodiversity conservation. Science 2013, 342, 803–805. [Google Scholar] [CrossRef] [PubMed]
  329. Mavsar, R.; Pettenella, D.; San-Miguel-Ayanz, J.; Camia, A. Development of a methodology for the analysis of socio-economic impact of forest fires in Europe. In Proceedings of the 5th International Wildland Fire Conference, Sun City, South Africa, 9–13 May 2011. [Google Scholar]
  330. Camia, A.; Libertà, G.; San-Miguel-Ayanz, J. Modeling the Impacts of Climate Change on Forest Fire Danger in Europe: Sectorial Results of the PESETA II Project; Publications Office of the European Union: Luxembourg, 2017; p. 24.
  331. Plummer, S.; Lecomte, P.; Doherty, M. The ESA Climate Change Initiative (CCI): A European contribution to the generation of the Global Climate Observing System. Remote Sens. Environ. 2017, 203, 2–8. [Google Scholar] [CrossRef]
  332. Laurent, P.; Mouillot, F.; Yue, C.; Ciais, P.; Moreno, M.V.; Nogueira, J.M.P. FRY, a global database of fire patch functional traits derived from space-borne burned area products. Sci. Data 2018, 5, 180132. [Google Scholar] [CrossRef] [PubMed]
  333. Tesfa, T.K.; Leung, L.R.; Ghan, S.J. Exploring topography-based methods for downscaling subgrid precipitation for use in Earth System Models. J. Geophys. Res. Atmos. 2020, 125, e2019JD031456. [Google Scholar] [CrossRef]
  334. Murtaugh, P.A. Methods of variable selection in regression modeling. Commun. Stat.-Simul. Comput. 1998, 27, 711–734. [Google Scholar] [CrossRef]
  335. Akaike, H. Likelihood and the Bayes procedure. In Bayesian Statistics; Bernardo, J.M., DeGroot, D., Lindley, V., Smith, A.F.M., Eds.; University Press: Valencia, Spain, 1980; pp. 143–166. [Google Scholar]
  336. Zhang, H.; Guo, P.; Chen, H.; Liu, N.; Qiao, Y.; Xu, M.; Zhang, L. Lightning-induced smoldering ignition of peat: Simulation experiments by an electric arc with long continuing current. Proc. Combust. Inst. 2023. [Google Scholar] [CrossRef]
  337. Latham, D.; Williams, E. Lightning and forest fires. In Forest Fires. Behavior and Ecological Aspects, Johnson, E.A., Miyanishi, K., Eds.; Academic Press: San Diego, CA, USA, 2001; pp. 375–418. [Google Scholar]
  338. Bitzer, P.M. Global distribution and properties of continuing current in lightning. J. Geophys. Res. Atmos. 2017, 122, 1033–1041. [Google Scholar] [CrossRef]
  339. Pérez-Invernón, F.J.; Gordillo-Vázquez, F.J.; Huntrieser, H.; Jöckel, P. Variation of lightning-ignited wildfire patterns under climate change. Nat. Commun. 2023, 14, 739. [Google Scholar] [CrossRef] [PubMed]
  340. Lopez, P. A lightning parameterization for the ECMWF integrated forecasting system. Mon. Weather Rev. 2016, 144, 3057–3075. [Google Scholar] [CrossRef]
  341. Breiman, L. Random forests. Mach. Learn. 2001, 45, 5–32. [Google Scholar] [CrossRef]
  342. Sueur-Ochoa, C.; Chuvieco, E. Mapping the likelihood of human-caused fire ignitions in the European territory. Appl. Geogr. 2023. in review. [Google Scholar]
  343. Aragoneses, E.; García, M.; Salis, M.; Ribeiro, L.M.; Chuvieco, E. Classification and mapping of European fuels using a hierarchical-multipurpose fuel classification system. Earth Syst. Sci. Data 2023, 15, 1287–1315. [Google Scholar] [CrossRef]
  344. Mohammadpour, P.; Viegas, D.X.; Viegas, C. Vegetation Mapping with Random Forest Using Sentinel 2 and GLCM Texture Feature&mdash;A Case Study for Lous&atilde; Region, Portugal. Remote Sens. 2022, 14, 4585. [Google Scholar]
  345. Nelson, R.M. Water Relations of Forest Fuels. In Forest Fires: Behavior and Ecological Effects; Johnson, E.A., Miyanishi, K., Eds.; Academic Press: San Diego, CA, USA, 2001; pp. 79–149. [Google Scholar]
  346. Quan, X.; Yebra, M.; Riaño, D.; He, B.; Lai, G.; Liu, X. Global fuel moisture content mapping from MODIS. Int. J. Appl. Earth Obs. Geoinf. 2021, 101, 102354. [Google Scholar] [CrossRef]
  347. Féret, J.-B.; Gitelson, A.; Noble, S.; Jacquemoud, S. PROSPECT-D: Towards modeling leaf optical properties through a complete lifecycle. Remote Sens. Environ. 2017, 193, 204–215. [Google Scholar] [CrossRef]
  348. Verhoef, W.; Jia, L.; Xiao, Q.; Su, Z. Unified optical-thermal four-stream radiative transfer theory for homogeneous vegetation canopies. IEEE Trans. Geosci. Remote Sens. 2007, 45, 1808–1822. [Google Scholar] [CrossRef]
  349. Jasinski, M.F.; Eagleson, P.S. Estimation of subpixel vegetation cover using red-infrared scattergrams. IEEE Trans. Geosci. Remote Sens. 1990, 28, 253–267. [Google Scholar] [CrossRef]
  350. Huemmrich, K.F. The GeoSail model: A simple addition to the SAIL model to describe discontinuous canopy reflectance. Remote Sens. Environ. 2001, 75, 423–431. [Google Scholar] [CrossRef]
  351. Pampanoni, V.; Laneve, G.; Santilli, G. Evaluating Sentinel-3 Viability for Vegetation Canopy Monitoring and Fuel Moisture Content Estimation. In Proceedings of the IGARSS 2022-2022 IEEE International Geoscience and Remote Sensing Symposium, Kuala Lumpur, Malaysia, 17–22 July 2022; pp. 5634–5637. [Google Scholar]
  352. Yebra, M.; Chuvieco, E. Generation of a species-specific look-up table for fuel moisture content assessment. IEEE J. Sel. Top. Appl. Earth Obs. Remote Sens. 2009, 2, 21–26. [Google Scholar] [CrossRef]
  353. Simard, M.; Pinto, N.; Fisher, J.B.; Baccini, A. Mapping forest canopy height globally with spaceborne lidar. J. Geophys. Res. 2011, 116, 12. [Google Scholar] [CrossRef]
  354. Fernandes, A.P.; Lopes, D.; Sorte, S.; Monteiro, A.; Gama, C.; Reis, J.; Menezes, I.; Osswald, T.; Borrego, C.; Almeida, M.; et al. Smoke emissions from the extreme wildfire events in central Portugal in October 2017. Int. J. Wildland Fire 2022, 31, 989–1001. [Google Scholar] [CrossRef]
  355. Albini, F.; Reinhardt, E. Improved Calibration of a Large Fuel Burnout Model. Int. J. Wildland Fire 1997, 7, 21–28. [Google Scholar] [CrossRef]
  356. Prichard, S.J.; Kennedy, M.C.; Wright, C.S.; Cronan, J.B.; Ottmar, R.D. Predicting forest floor and woody fuel consumption from prescribed burns in southern and western pine ecosystems of the United States. For. Ecol Manag. 2017, 405, 328–338. [Google Scholar] [CrossRef]
  357. Vicente, A.; Calvo, A.; Gonçalves, C.; Nunes, T.; Fernandes, A.P.; Monteiro, C.; Mirante, F.; Evtyugina, M.; Alves, C. Emission factors of trace gases and aerosols from wildfire events in central Portugal. Zenodo 2019. [Google Scholar] [CrossRef]
  358. Prichard, S.J.; O’Neill, S.M.; Eagle, P.; Andreu, A.G.; Drye, B.; Dubowy, J.; Urbanski, S.; Strand, T.M. Wildland fire emission factors in North America: Synthesis of existing data, measurement needs and management applications. Int. J. Wildland Fire 2020, 29, 132–147. [Google Scholar] [CrossRef]
  359. Fernandes, A.P.; Rafael, S.; Lopes, D.; Coelho, S.; Borrego, C.; Lopes, M. The air pollution modelling system URBAIR: How to use a Gaussian model to accomplish high spatial and temporal resolutions. Air Qual. Atmos. Health 2021, 14, 1969–1988. [Google Scholar] [CrossRef]
  360. Rodríguez y Silva, F.; Molina-Martínez, J.R.M.; Herrera Machuca, M.Á.; Rodríguez Leal, J.M. VISUAL-SEVEIF, a Tool for Integrating Fire Behavior Simulation and Economic Evaluation of the Impact of Wildfires. In Proceedings of the Fourth International Symposium on Fire Economics, Planning, and Policy; Climate Change and Wildfires, Department of Agriculture, Forest Service, Pacific Southwest Research Station: Albany, CA, USA, 2013; pp. 163–178. [Google Scholar]
  361. Rodríguez y Silva, F.; Ramón Molina, J.; Rodriguez Leal, J. The efficiency analysis of the fire control operations using the VISUAL-SEVEIF tool. In Advances in Forest fire Research. Social and Economic Issues; Viegas, D.X., Ed.; ADAI: Coimbra, Portugal, 2014. [Google Scholar] [CrossRef]
  362. Santoro, M.; Cartus, O.; Carvalhais, N.; Rozendaal, D.; Avitabile, V.; Araza, A.; De Bruin, S.; Herold, M.; Quegan, S.; Rodríguez-Veiga, P. The global forest above-ground biomass pool for 2010 estimated from high-resolution satellite observations. Earth Syst. Sci. Data 2021, 13, 3927–3950. [Google Scholar] [CrossRef]
  363. Chen, X.; Niu, J. Relationships between tree height and tree species richness at small scales. Acta Oecologica 2020, 109, 103668. [Google Scholar] [CrossRef]
  364. Potapov, P.; Li, X.; Hernandez-Serna, A.; Tyukavina, A.; Hansen, M.C.; Kommareddy, A.; Pickens, A.; Turubanova, S.; Tang, H.; Silva, C.E. Mapping global forest canopy height through integration of GEDI and Landsat data. Remote Sens. Environ. 2021, 253, 112165. [Google Scholar] [CrossRef]
  365. Hansen, M.C.; Potapov, P.V.; Moore, R.; Hancher, M.; Turubanova, S.; Tyukavina, A.; Thau, D.; Stehman, S.; Goetz, S.; Loveland, T. High-resolution global maps of 21st-century forest cover change. Science 2013, 342, 850–853. [Google Scholar] [CrossRef]
  366. Fusco, J.; Walker, E.; Papaïx, J.; Debolini, M.; Bondeau, A.; Barnagaud, J.-Y. Land Use Changes Threaten Bird Taxonomic and Functional Diversity Across the Mediterranean Basin: A Spatial Analysis to Prioritize Monitoring for Conservation. Front. Ecol. Evol. 2021, 9, 612356. [Google Scholar] [CrossRef]
  367. Sillero, N.; Campos, J.; Bonardi, A.; Corti, C.; Creemers, R.; Crochet, P.-A.; Isailović, J.C.; Denoël, M.; Ficetola, G.F.; Gonçalves, J. Updated distribution and biogeography of amphibians and reptiles of Europe. Amphib.-Reptil. 2014, 35, 1–31. [Google Scholar] [CrossRef]
  368. Potapov, P.; Hansen, M.C.; Laestadius, L.; Turubanova, S.; Yaroshenko, A.; Thies, C.; Smith, W.; Zhuravleva, I.; Komarova, A.; Minnemeyer, S.; et al. The last frontiers of wilderness: Tracking loss of intact forest landscapes from 2000 to 2013. Sci. Adv. 2017, 3, e1600821. [Google Scholar] [CrossRef]
  369. Bro, R.; Smilde, A.K. Principal component analysis. Anal. Methods 2014, 6, 2812–2831. [Google Scholar] [CrossRef]
  370. Salata, S.; Grillenzoni, C. A spatial evaluation of multifunctional Ecosystem Service networks using Principal Component Analysis: A case of study in Turin, Italy. Ecol. Indic. 2021, 127, 107758. [Google Scholar] [CrossRef]
  371. Mahnken, M.; Cailleret, M.; Collalti, A.; Trotta, C.; Biondo, C.; D’Andrea, E.; Dalmonech, D.; Marano, G.; Mäkelä, A.; Minunno, F.; et al. Accuracy, realism and general applicability of European forest models. Glob. Chang. Biol. 2022, 28, 6921–6943. [Google Scholar] [CrossRef]
  372. Schelhaas, M.-J.; Hengeveld, G.M.; Heidema, N.; Thürig, E.; Rohner, B.; Vacchiano, G.; Vayreda, J.; Redmond, J.; Socha, J.; Fridman, J.; et al. Species-specific, pan-European diameter increment models based on data of 2.3 million trees. For. Ecosyst. 2018, 5, 21. [Google Scholar] [CrossRef]
  373. Moreno-Martínez, Á.; Camps-Valls, G.; Kattge, J.; Robinson, N.; Reichstein, M.; van Bodegom, P.; Kramer, K.; Cornelissen, J.H.C.; Reich, P.; Bahn, M. A methodology to derive global maps of leaf traits using remote sensing and climate data. Remote Sens. Environ. 2018, 218, 69–88. [Google Scholar] [CrossRef]
  374. Borrelli, P.; Panagos, P.; Ballabio, C.; Lugato, E.; Weynants, M.; Montanarella, L. Towards a pan-European assessment of land susceptibility to wind erosion. Land Degrad. Dev. 2016, 27, 1093–1105. [Google Scholar] [CrossRef]
  375. Hengeveld, G.M.; Nabuurs, G.-J.; Didion, M.; van den Wyngaert, I.; Clerkx, A.; Schelhaas, M.-J. A forest management map of European forests. Ecol. Soc. 2012, 17. [Google Scholar] [CrossRef]
  376. Masson-Delmotte, V.; Zhai, P.; Pirani, A.; Connors, S.L.; Péan, C.; Berger, S.; Caud, N.; Chen, Y.; Goldfarb, L.; Gomis, M. Climate Change 2021: The Physical Science Basis; Cambridge University Press: Cambridge, UK, 2021. [Google Scholar]
  377. van Asselen, S.; Verburg, P.H. Land cover change or land-use intensification: Simulating land system change with a global-scale land change model. Glob. Chang. Biol. 2013, 19, 3648–3667. [Google Scholar] [CrossRef] [PubMed]
  378. Winkler, K.; Fuchs, R.; Rounsevell, M.; Herold, M. Global land use changes are four times greater than previously estimated. Nat. Commun. 2021, 12, 2501. [Google Scholar] [CrossRef]
Figure 1. Fire danger components and variables.
Fire 06 00215 g001
Figure 2. Final aggregated wildfire risk by pixel level for higher-risk class in each EURO-CORDEX spatial cell prototype version 1 (after [225]). Percentage based on the risk classification in each EURO-CORDEX cell of 100 equi-possible model runs, to assess the combined effect of all the modelled sources of uncertainty. Exterior EU islands are not shown in the figure.
Fire 06 00215 g002
Figure 3. Conceptual integration of wildfire risk assessment components within the FirEUrisk project. This scheme could also be eventually applied to risk reduction and adaptation.
Fire 06 00215 g003
Figure 4. Conceptual model quantifying ecological vulnerability (V, grey area) as a function of potential loss (PL), coping capacity (resistance, RST), regeneration time (RGT) and recovery time (RT) following the resilience curve fres, parameterized with its recovery rate (RCR).
Fire 06 00215 g004
Figure 5. Daily total lightning flash density over Sweden forecasted for 5 February 2020 by weather prediction model of the European Centre of Medium-Range Weather Forecast (ECMWF) (left panel) and in situ observed lightning flashes during the same day (right panel) (data provided by Johan Sjöström).
Fire 06 00215 g005
Figure 7. Fuel type classification of the ET area (right: source [343], codes are explained in the source) and the PS of Central Portugal (left, simplified version from [344]).
Fire 06 00215 g007
Figure 8. Sentinel-3 based LFMC in the ET (left) and in the PS of Central Portugal (right) on the 8 March 2023.
Fire 06 00215 g008
Figure 9. Estimation of Fireline Intensity (FI) (kW/m) for extreme 95th percentile wind speed and 5th percentile fuel moisture.
Fire 06 00215 g009
Figure 10. Spatial distribution (at 0.01 km2 resolution) of the population’s potential exposure to PM10 emissions from wildfires in the Barcelona province. The red box indicates the area with the maximum fire exposure potential value (i.e., 1).
Fire 06 00215 g010
Figure 11. Value of ecosystem services for the ET area.
Fire 06 00215 g011
Figure 12. Values of ES potentially lost by wildfires for the Barcelona PS.
Fire 06 00215 g012
Figure 13. Normalized scale for ecological values of the ET area. The highest ecological values are shown in dark green, while those with the lowest value are shown in light green.
Fire 06 00215 g013
Figure 14. Example of the IRI for historical conditions leading to large wildfires. IRI values have been multiplied by 1000.
Fire 06 00215 g014
Disclaimer/Publisher’s Note: The statements, opinions and data contained in all publications are solely those of the individual author(s) and contributor(s) and not of MDPI and/or the editor(s). MDPI and/or the editor(s) disclaim responsibility for any injury to people or property resulting from any ideas, methods, instructions or products referred to in the content.

