
Simulation Research on Effects of Ambient Pressure on Plug-Holing Phenomenon in Tunnel Fires with a Shaft

Abstract
:1. Introduction
2. Numerical Modeling
2.1. Fire Model Analysis
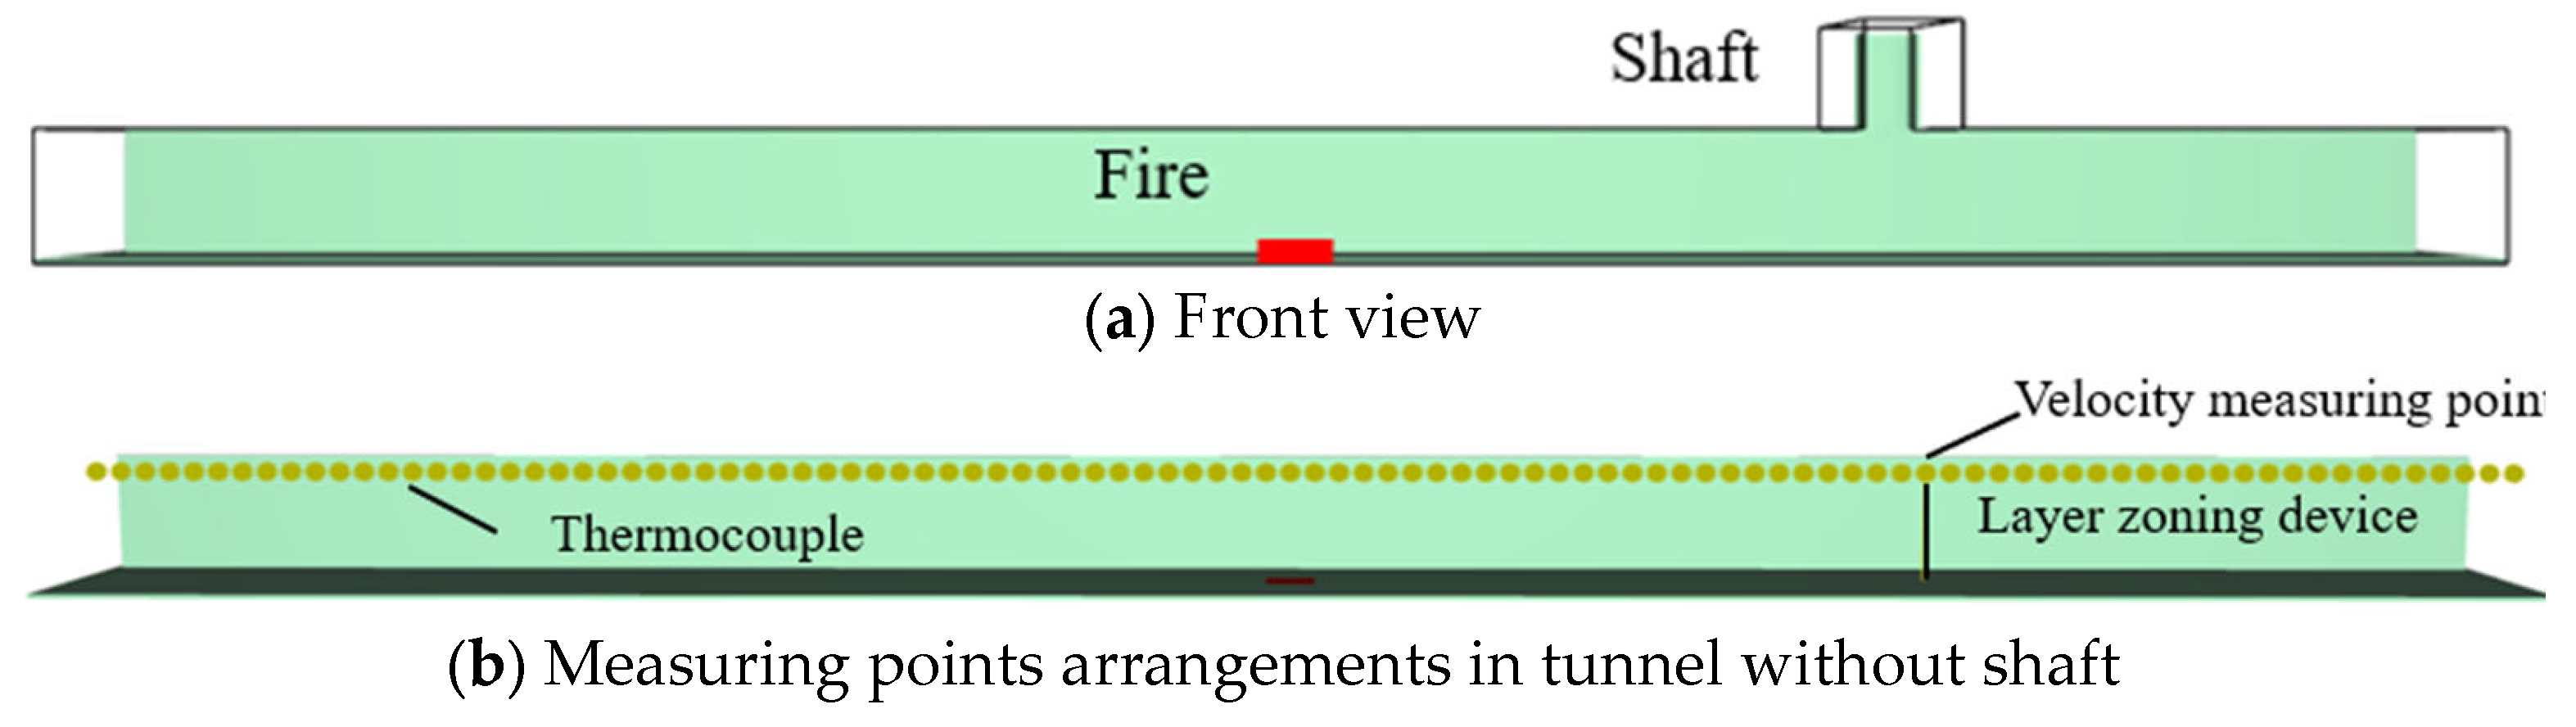
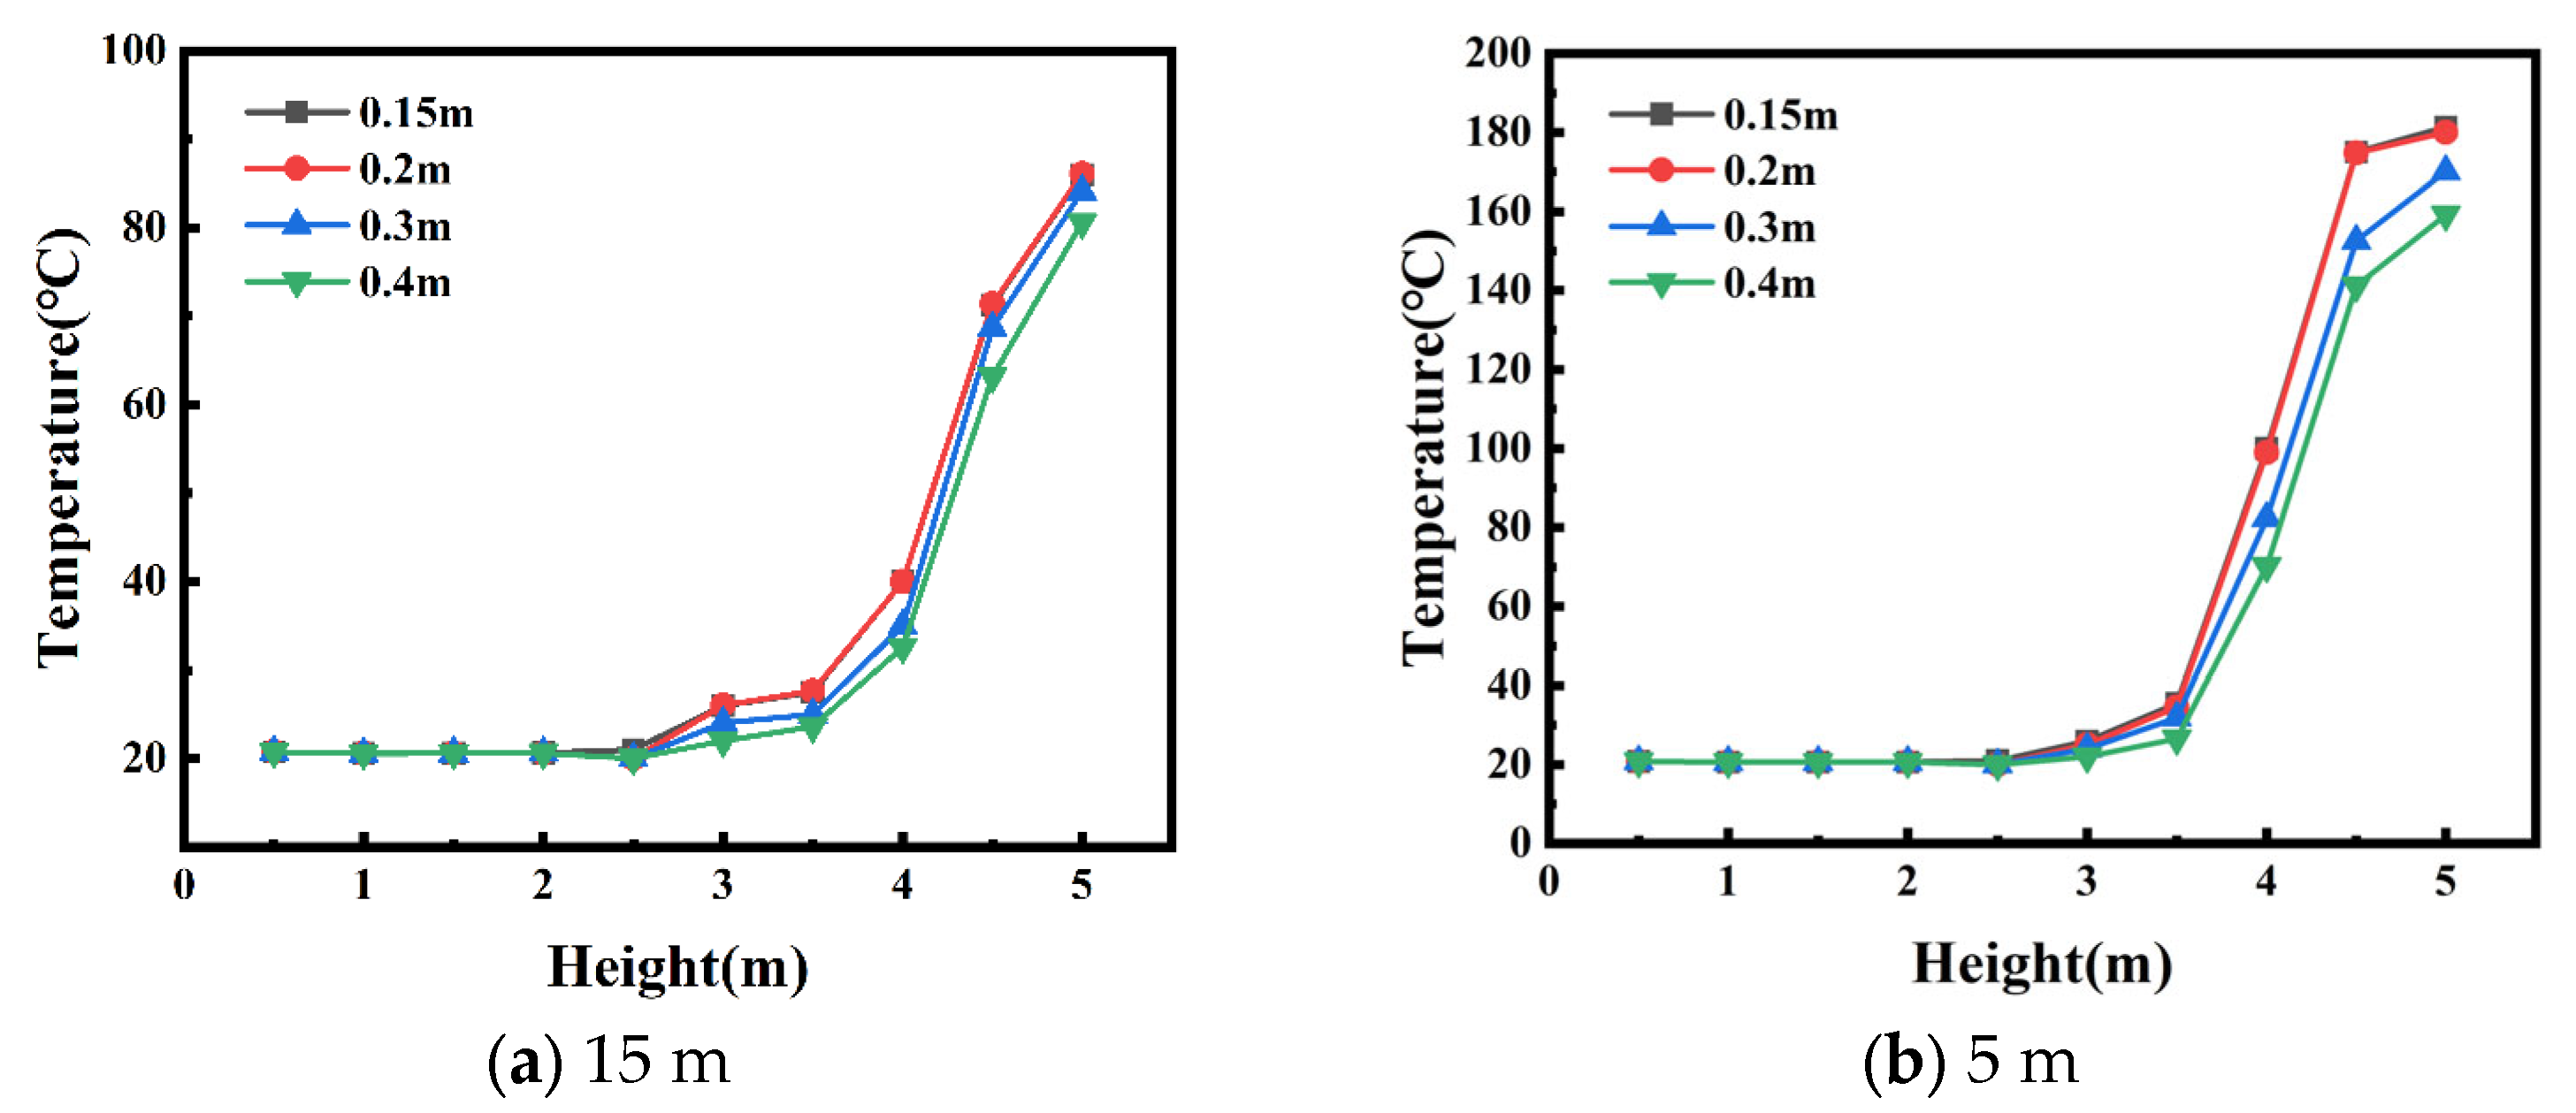
2.2. Meshes
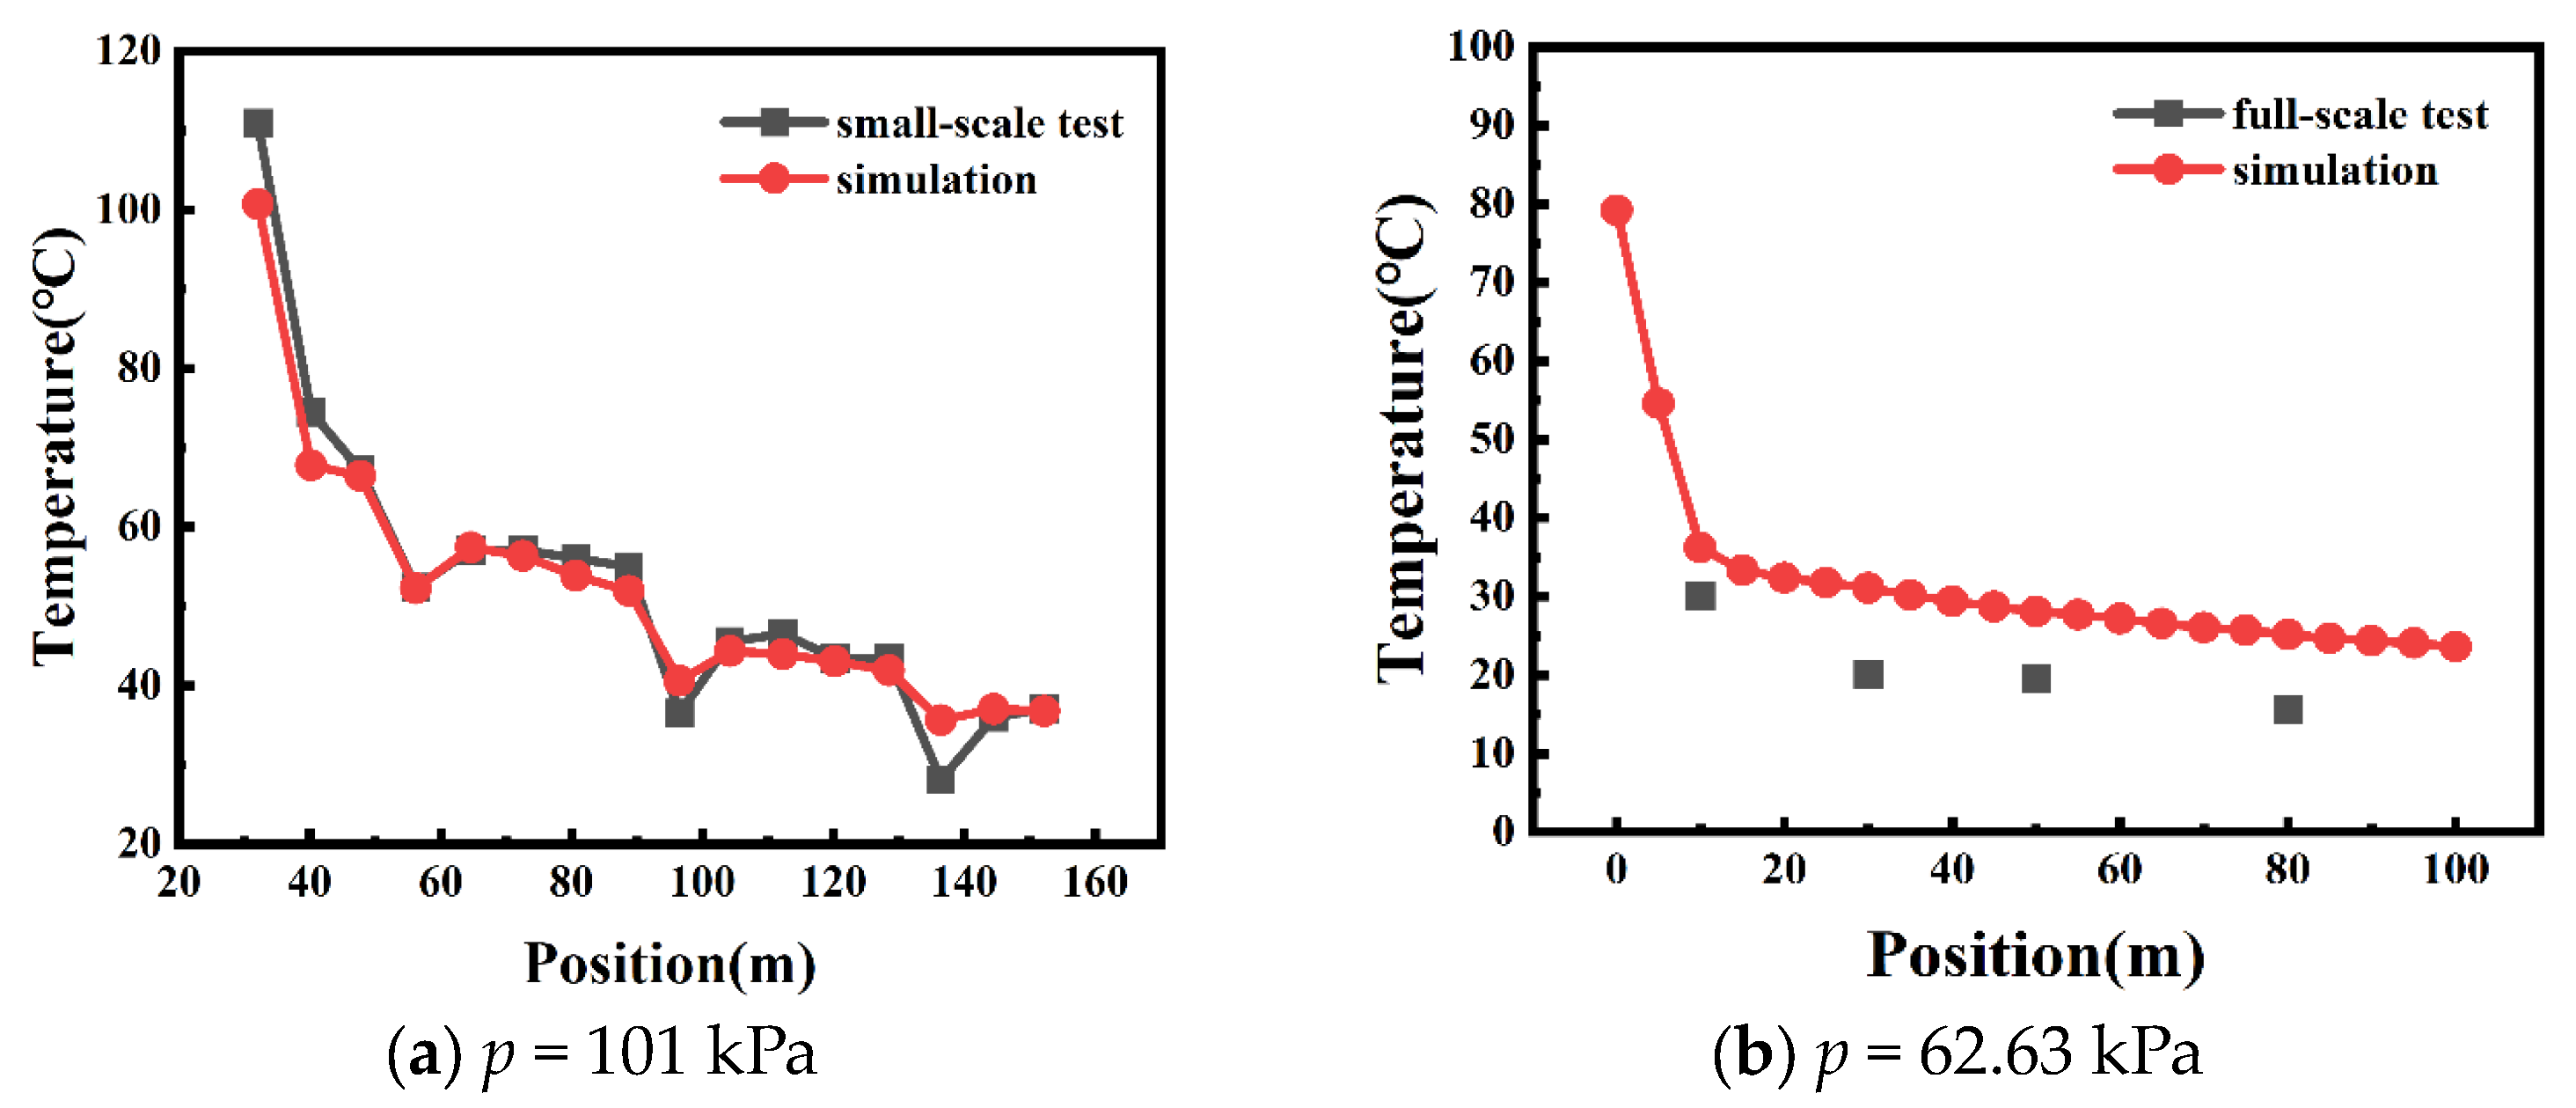
2.3. Validation
3. Results and Discussion
3.1. Smoke Flow Velocity Beneath the Ceiling
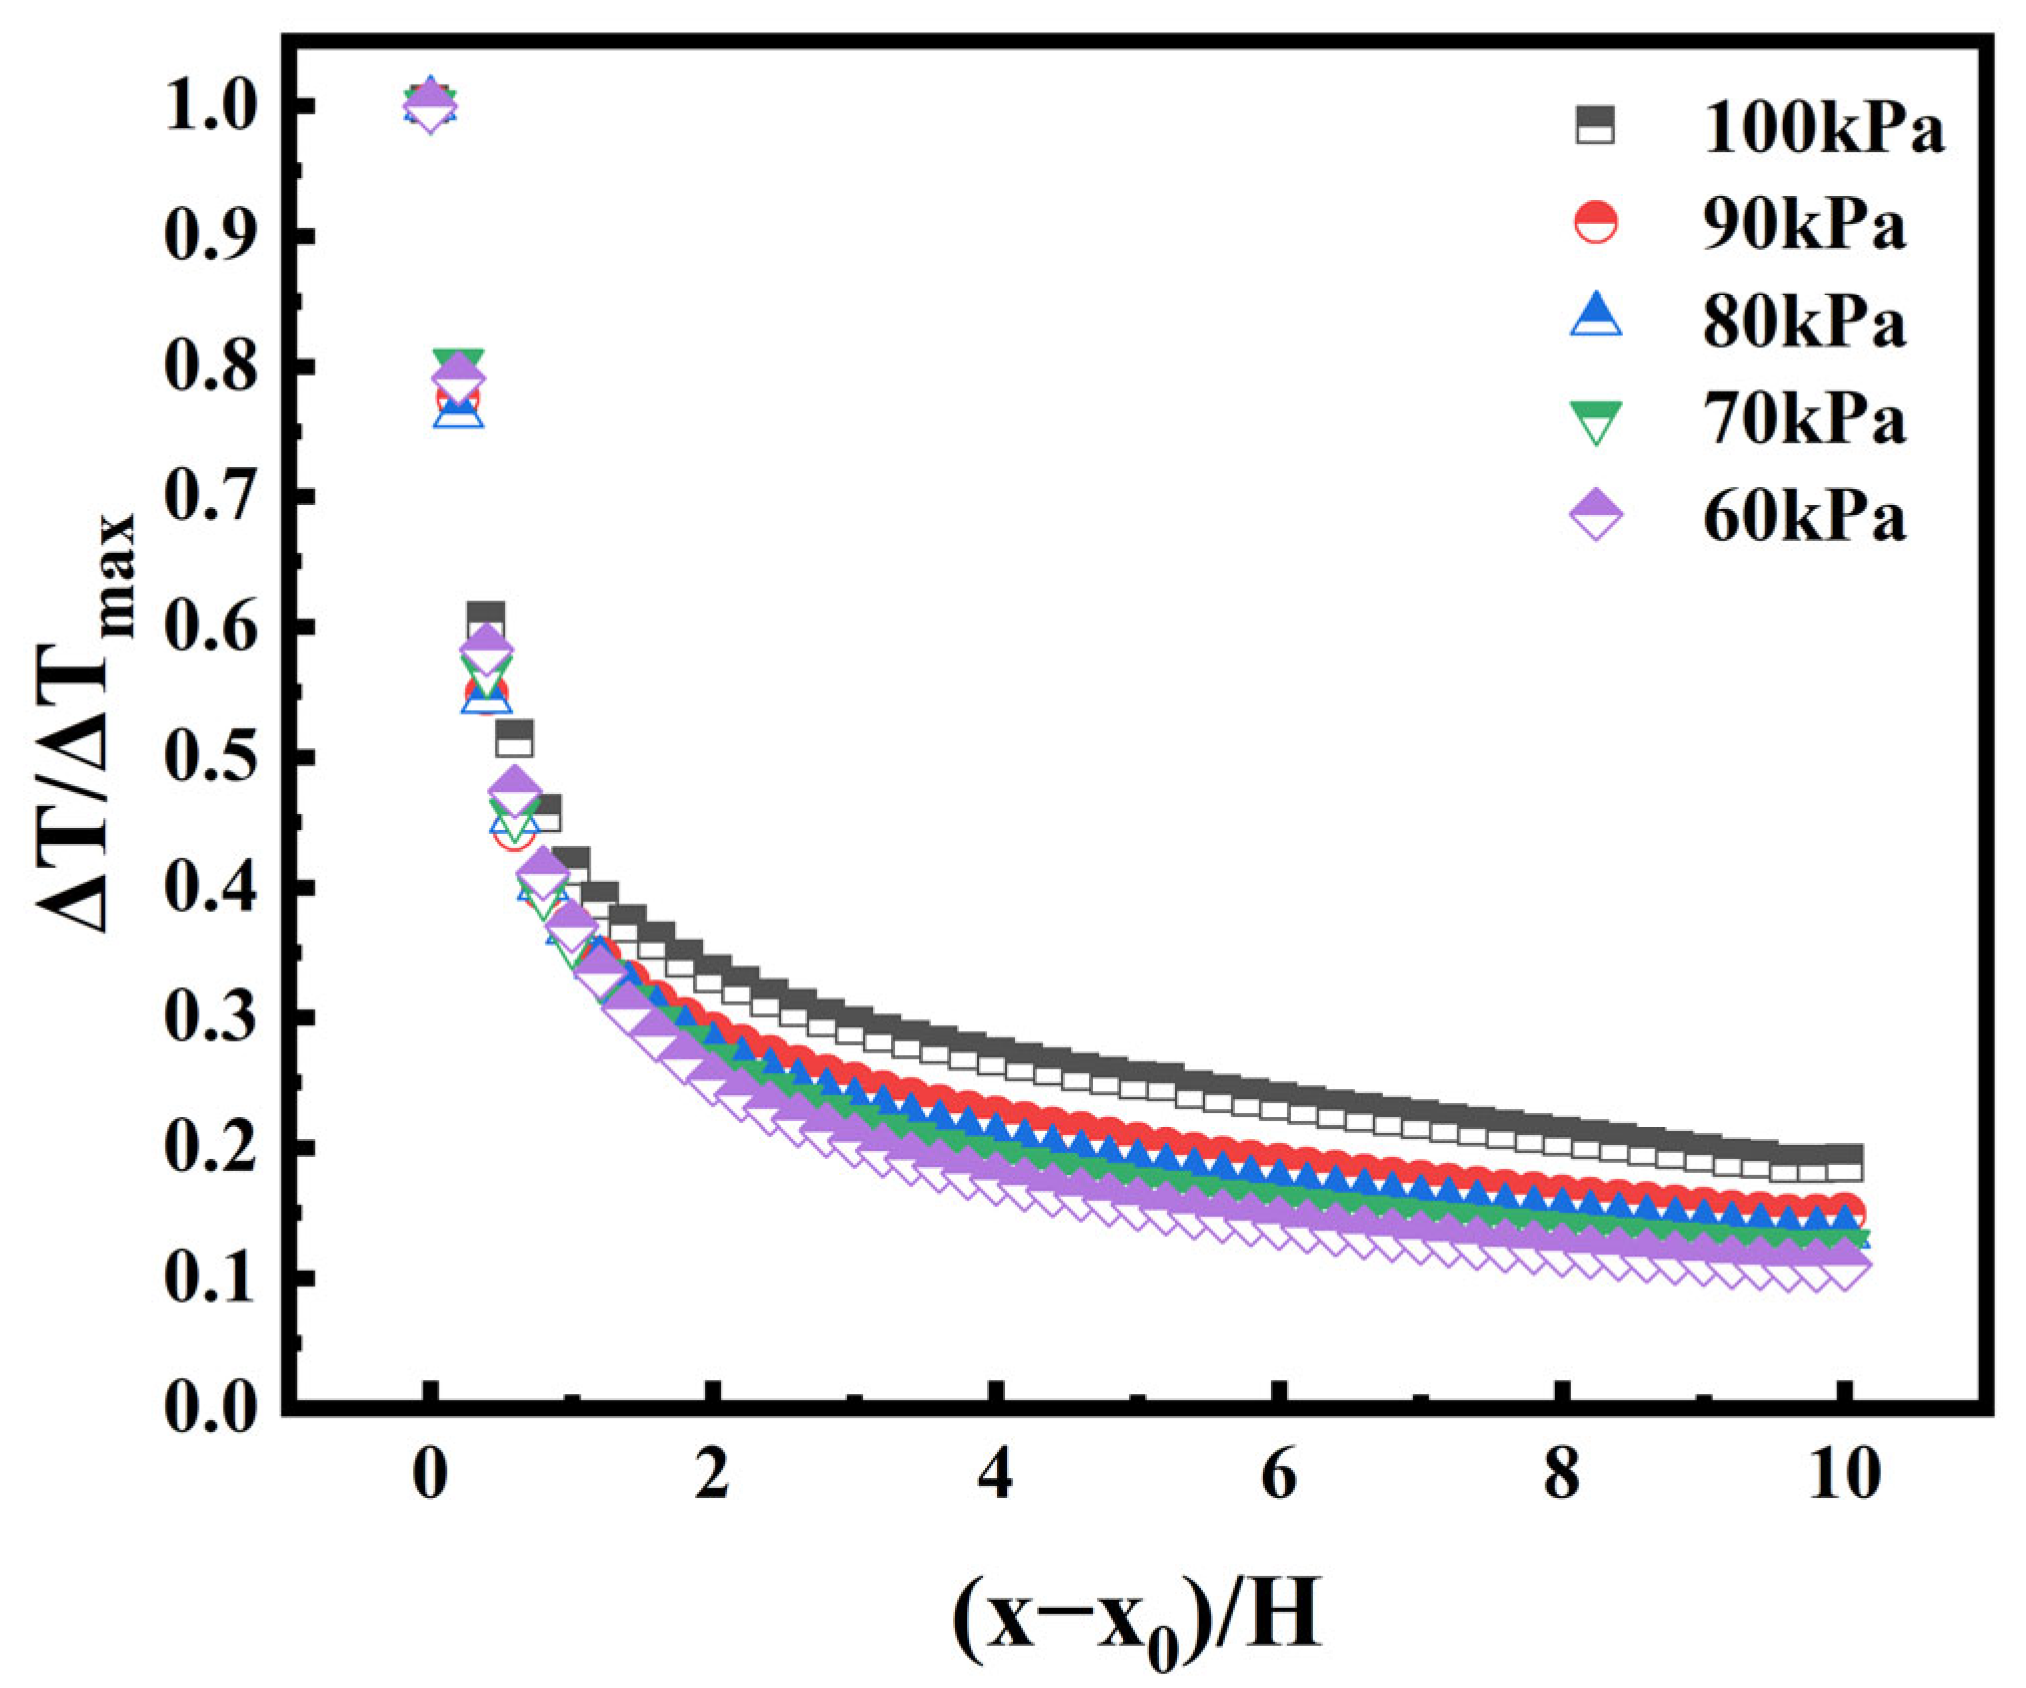
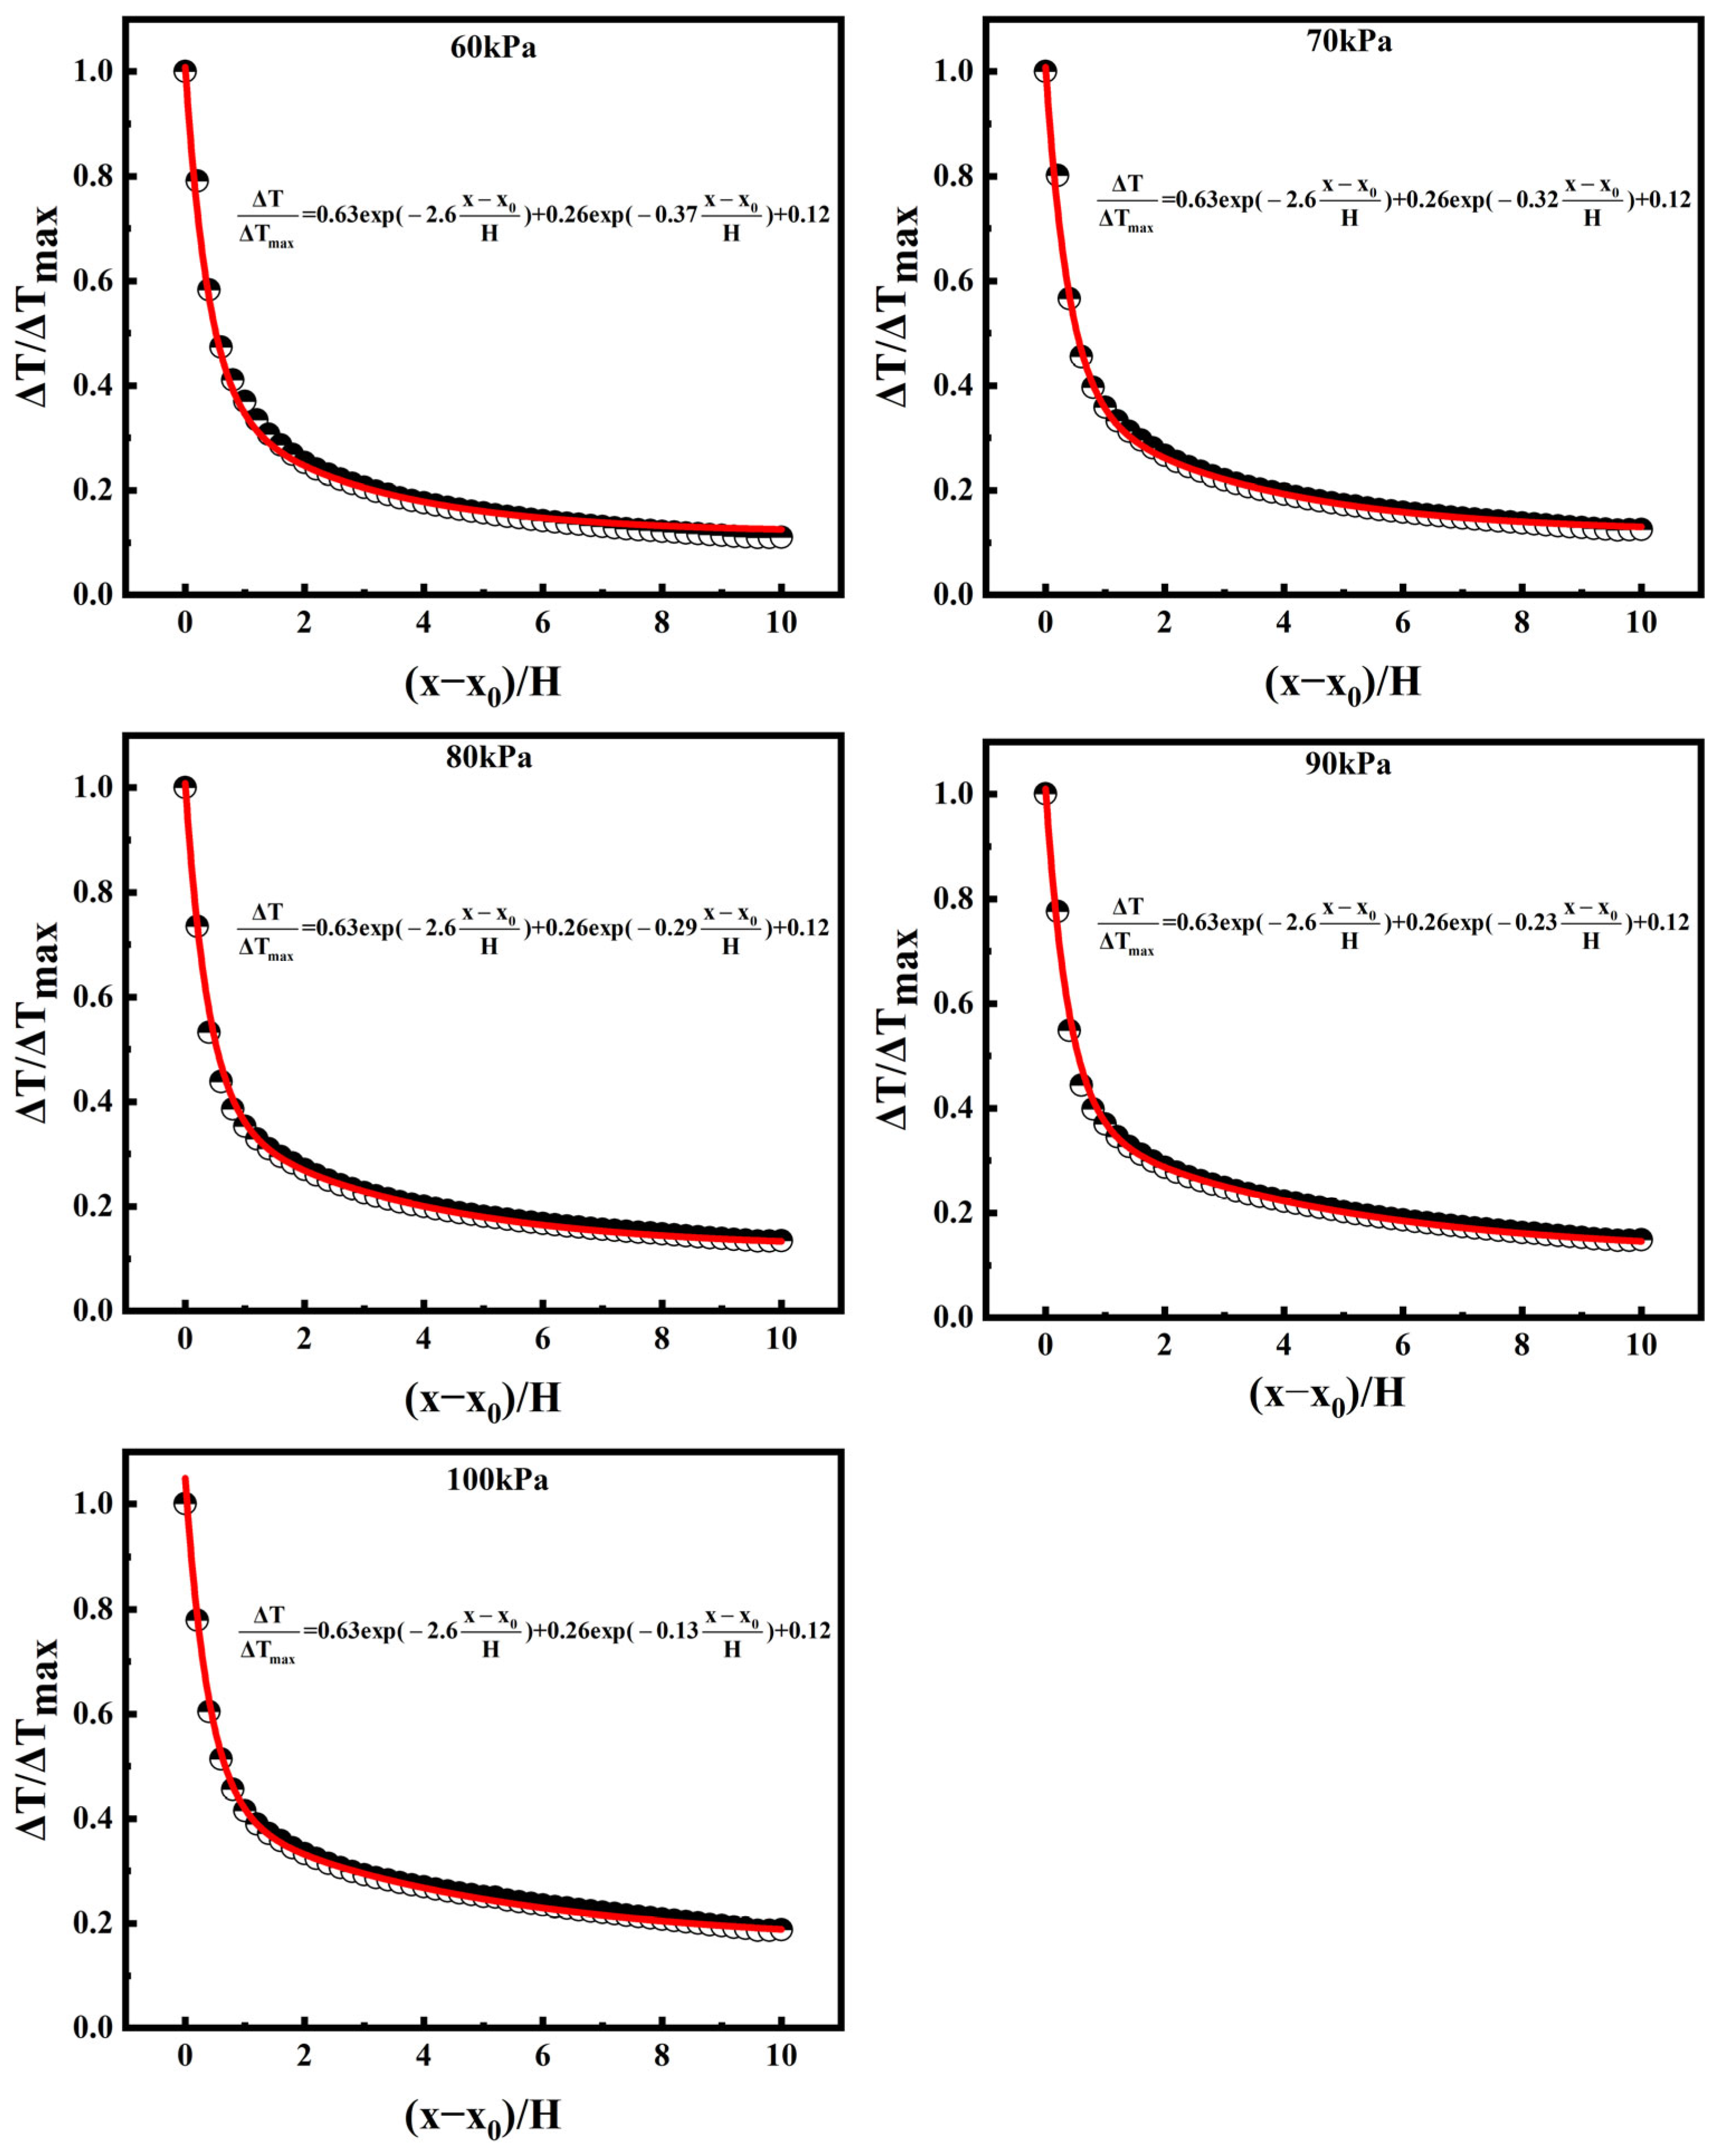
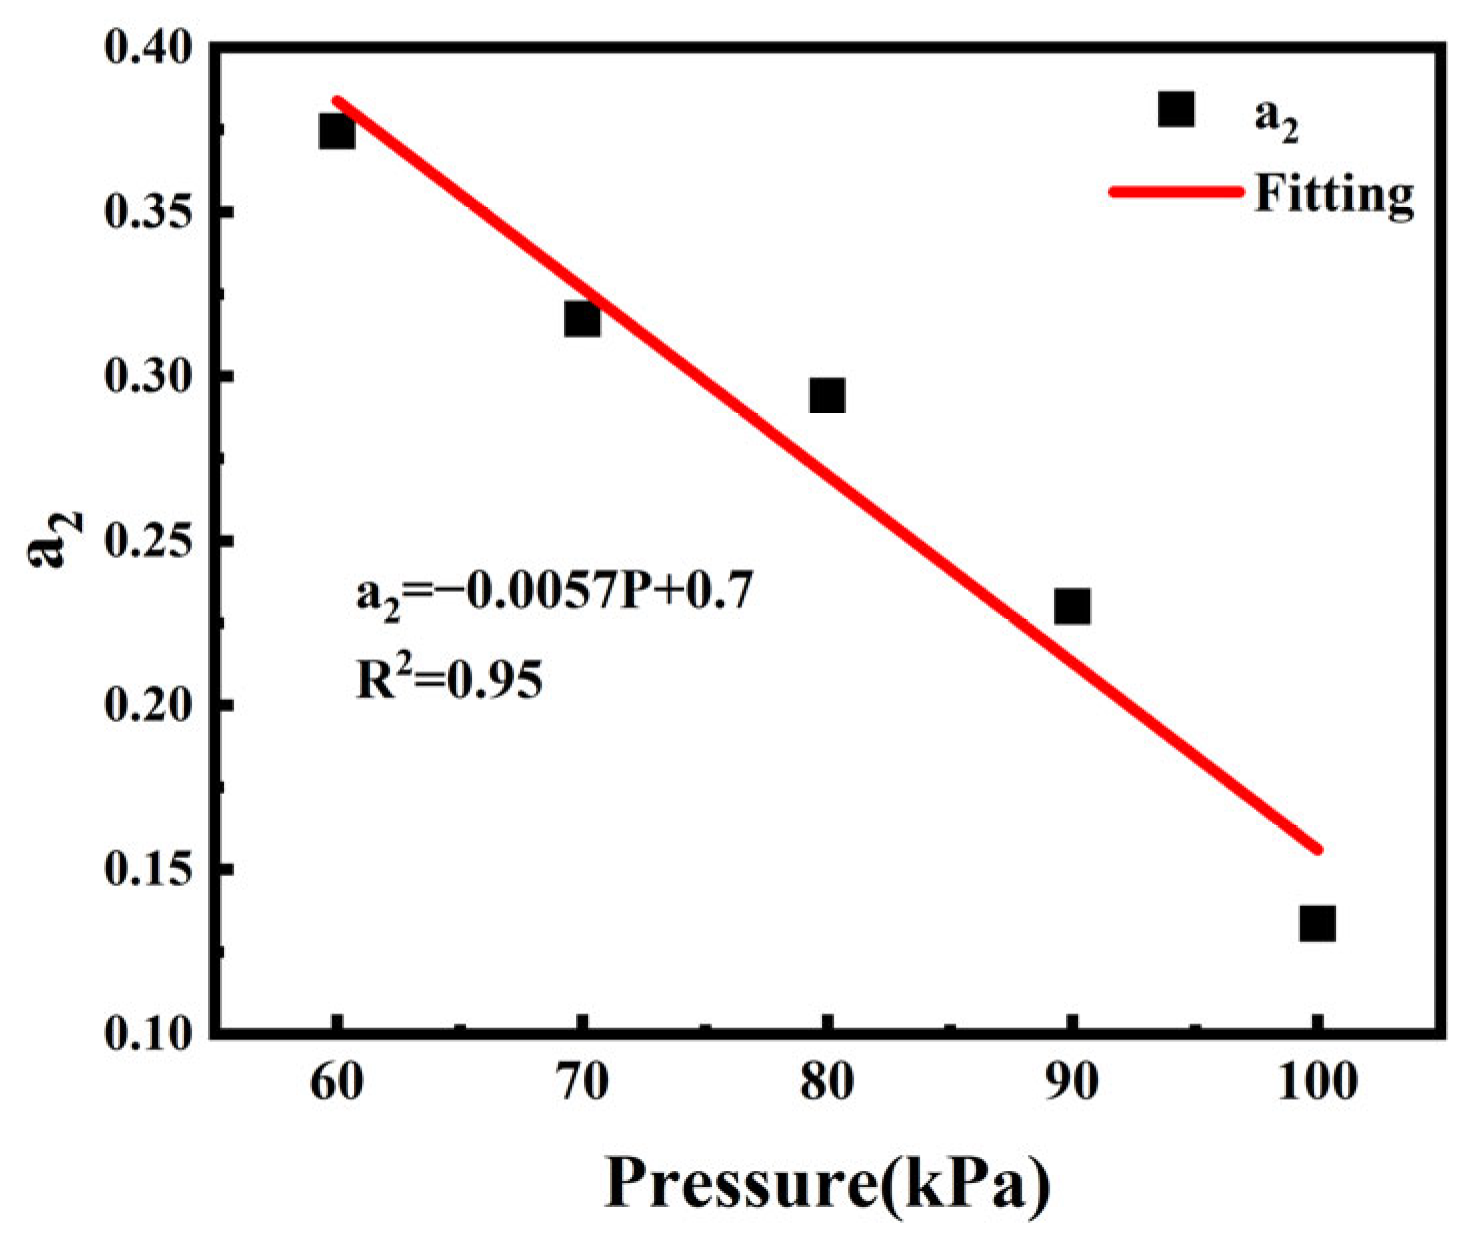
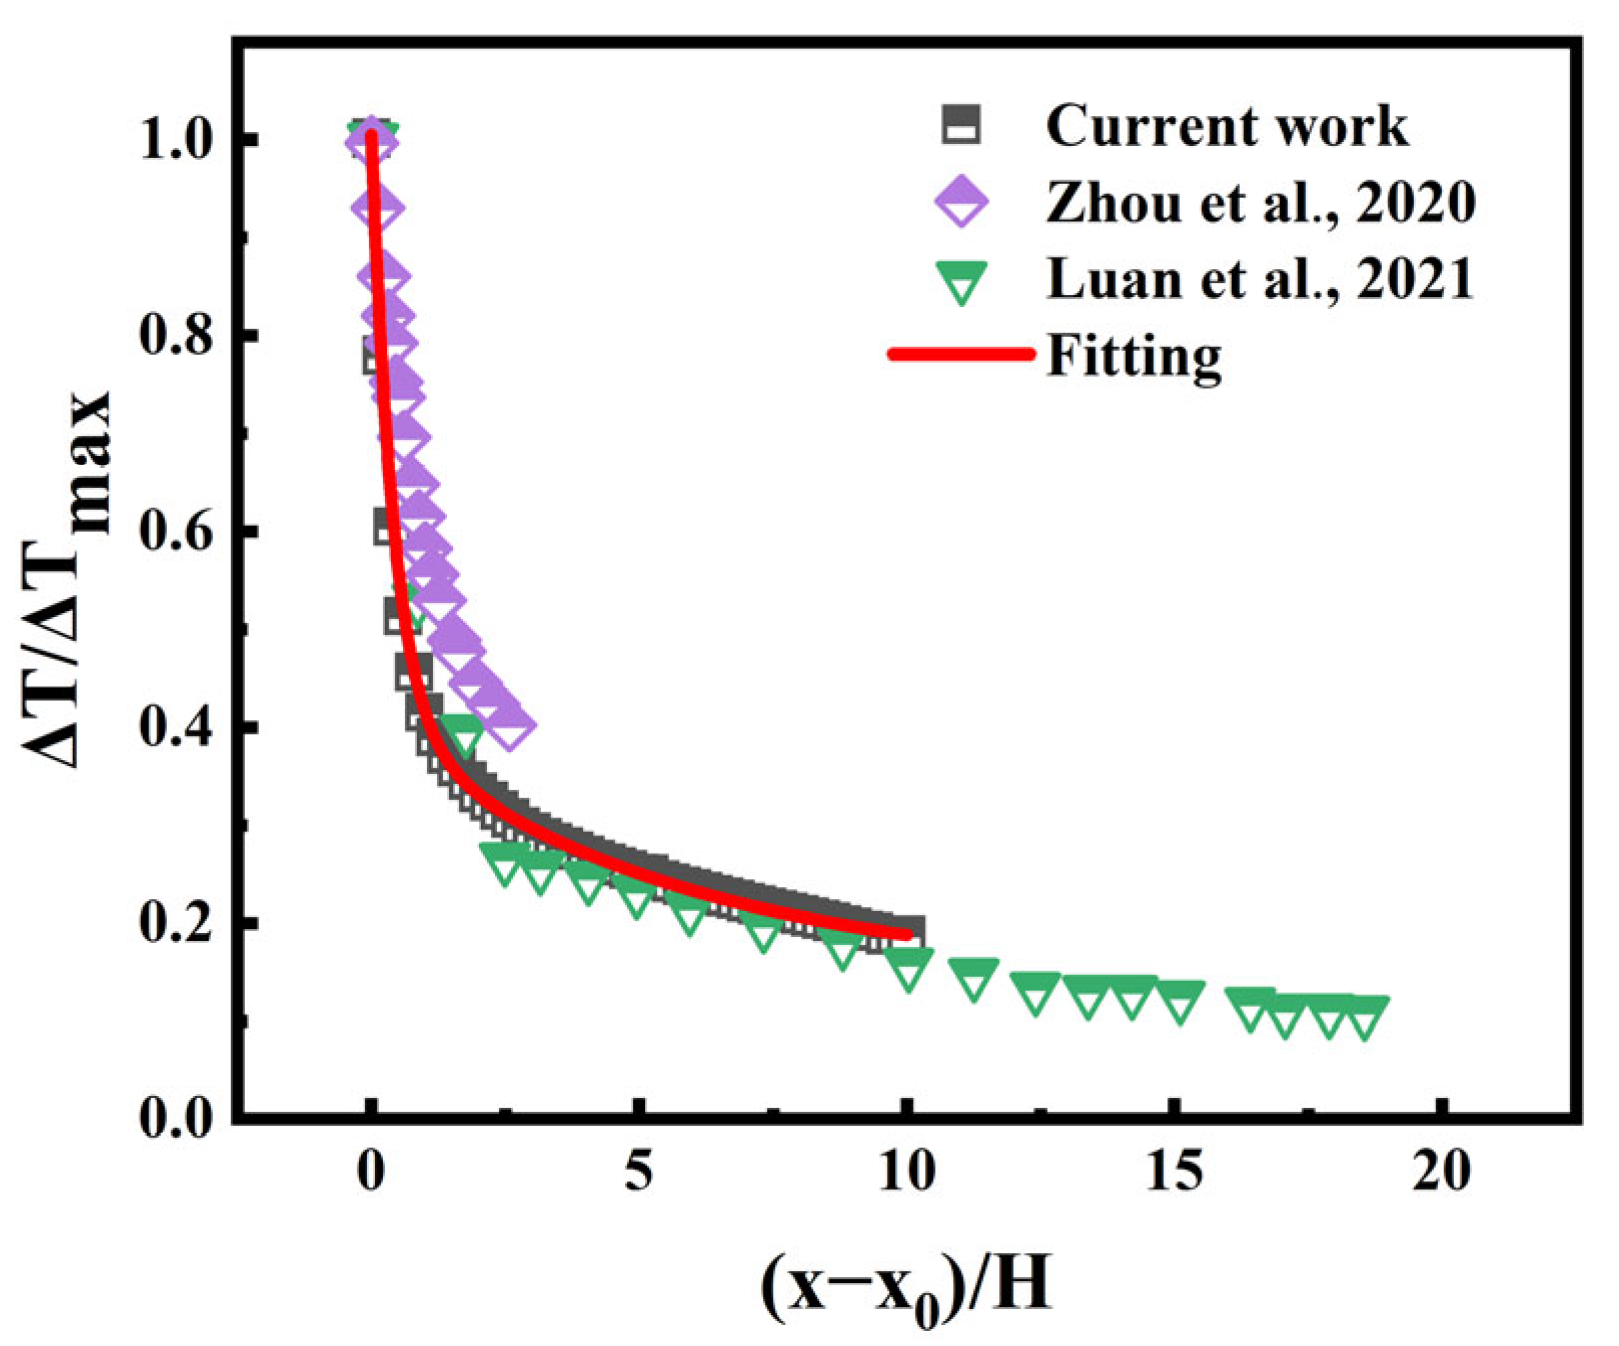
3.2. Longitudinal Temperature Distribution
3.3. Richard Number under Different Ambient Pressures
4. Conclusions
- (1)
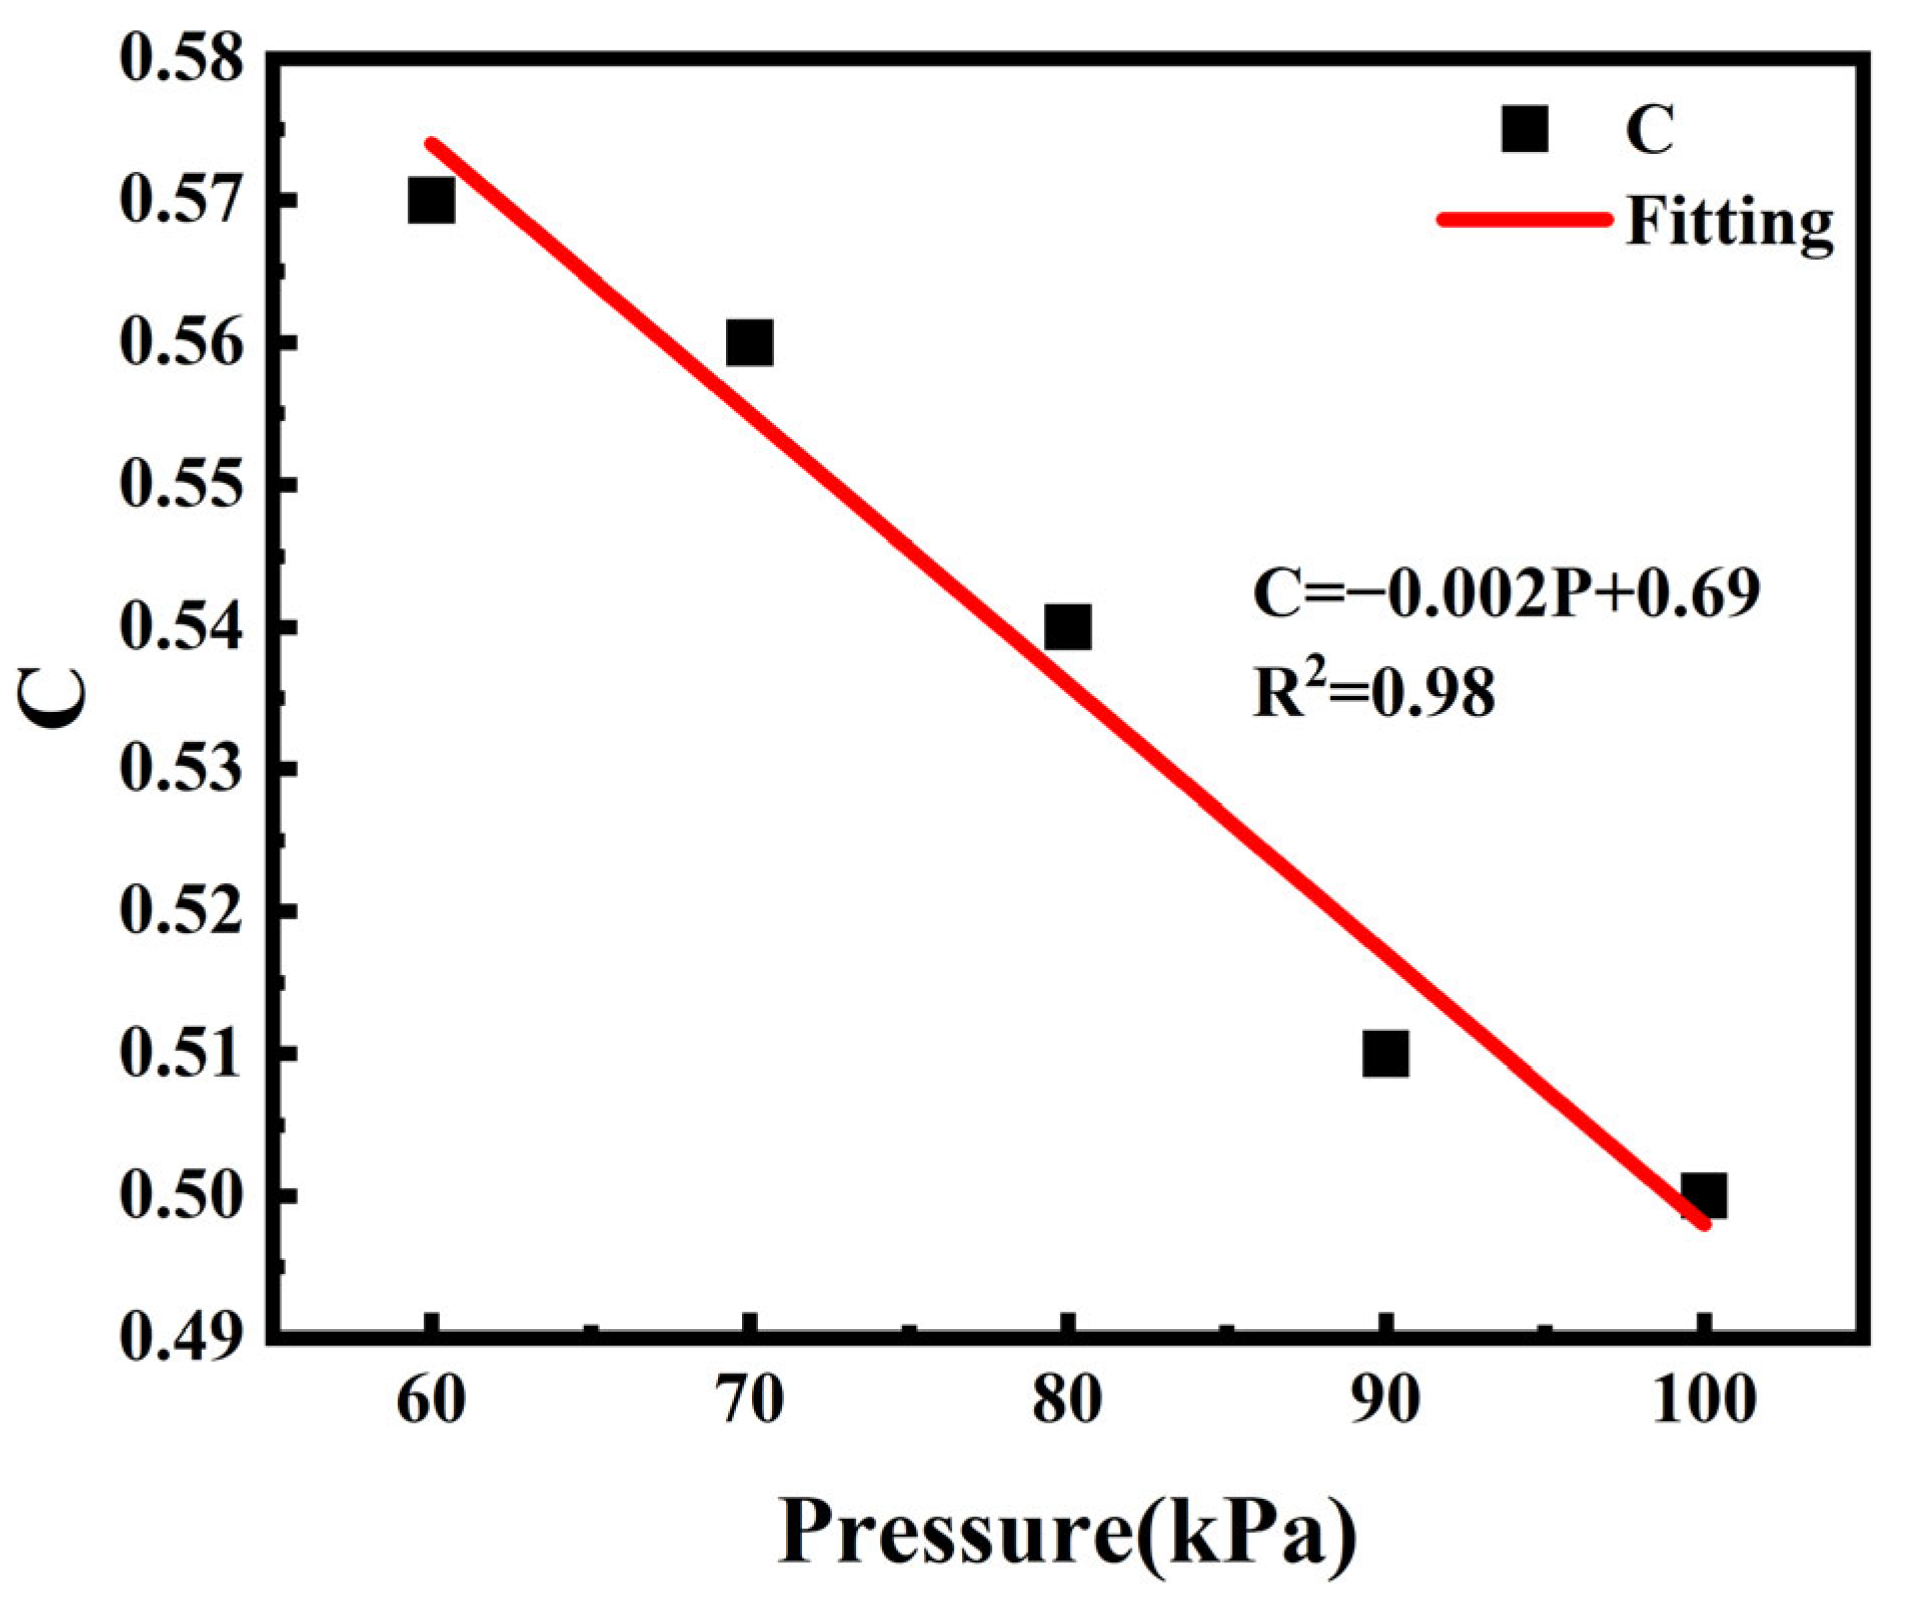
- The effects of different ambient pressures on the smoke flow velocity were analyzed. It is found that the smoke flow velocity increases as the ambient pressure decreases. A prediction formula of smoke flow velocity under different pressures was modified;
- (2)
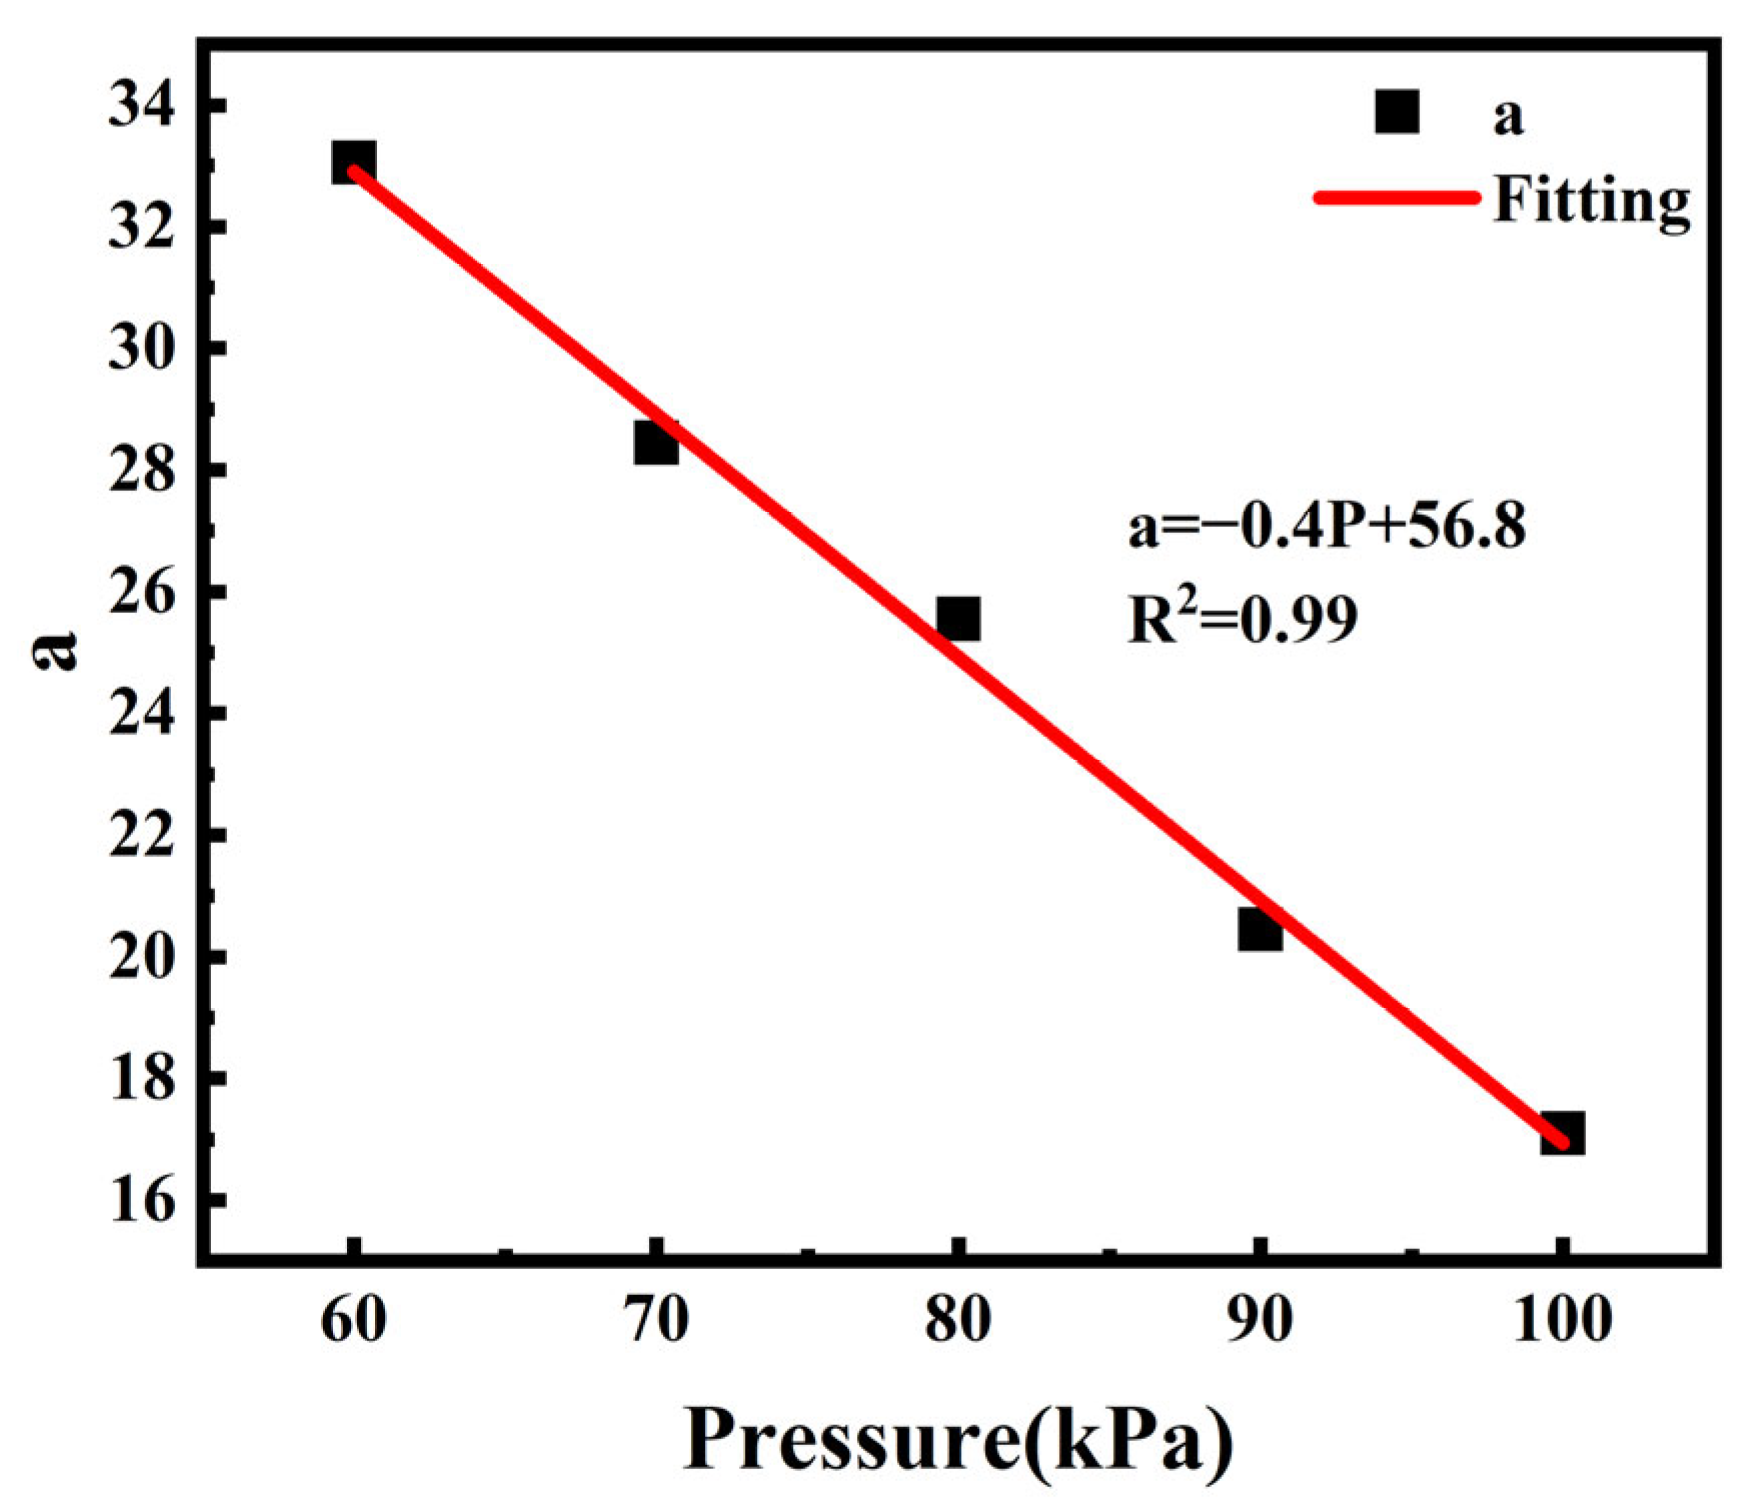
- The effects of different ambient pressures on the temperature distribution were analyzed. It is found that the maximum smoke temperature rise increases as the ambient pressure decreases, but the temperature decays faster at a lower ambient pressure. A prediction model of smoke temperature distribution was proposed considering different ambient pressures.
- (3)
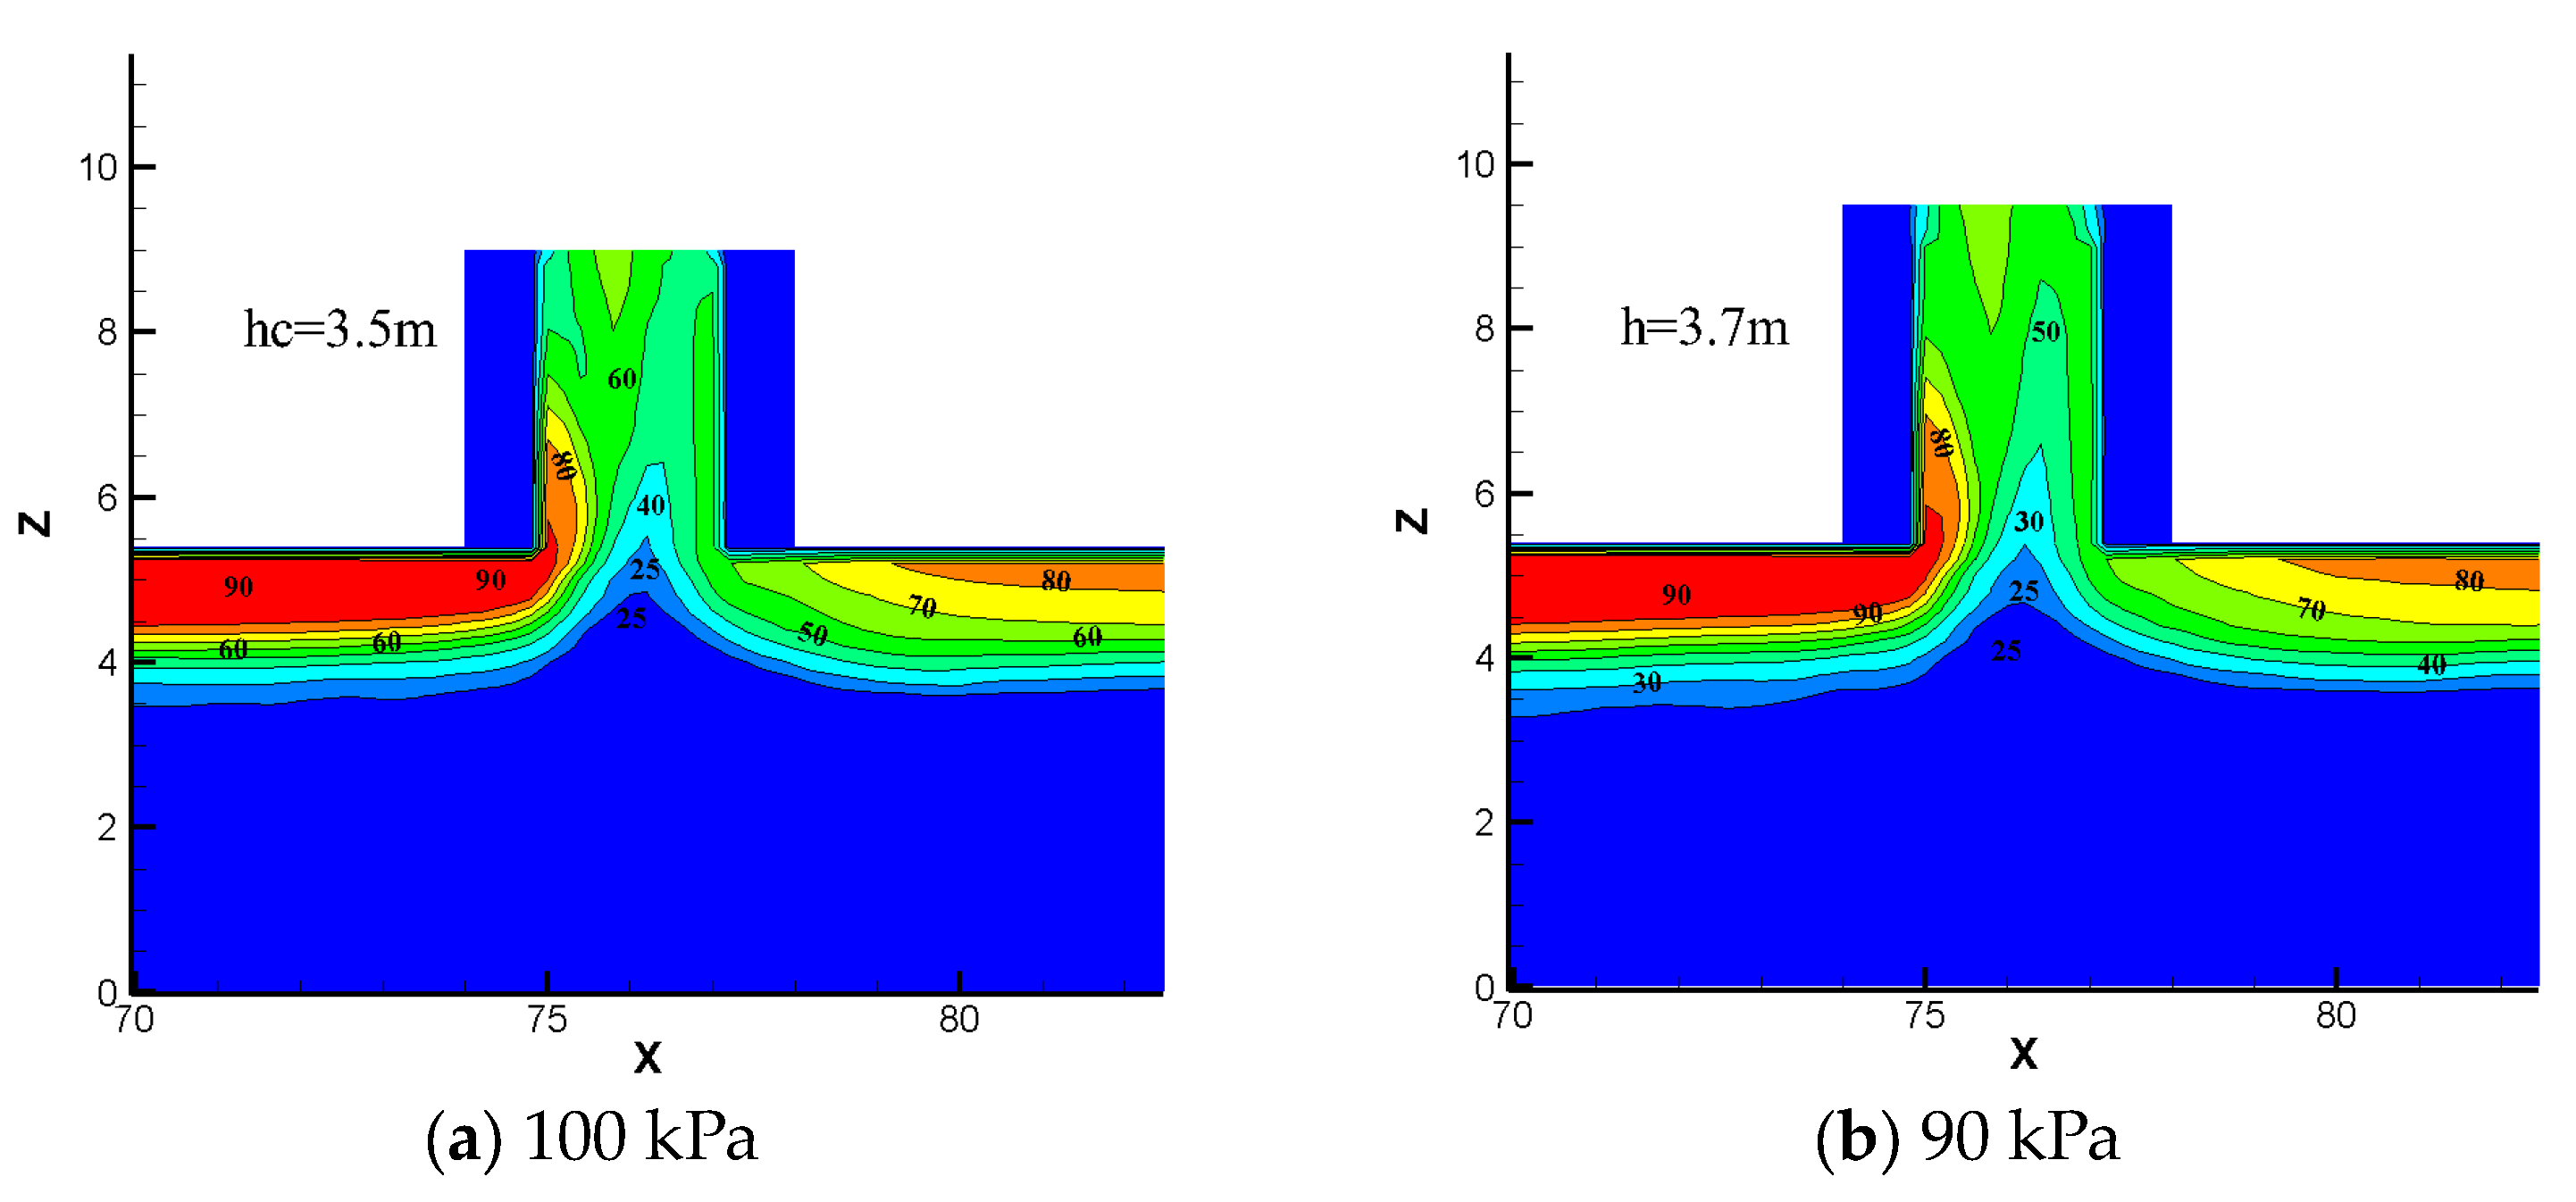
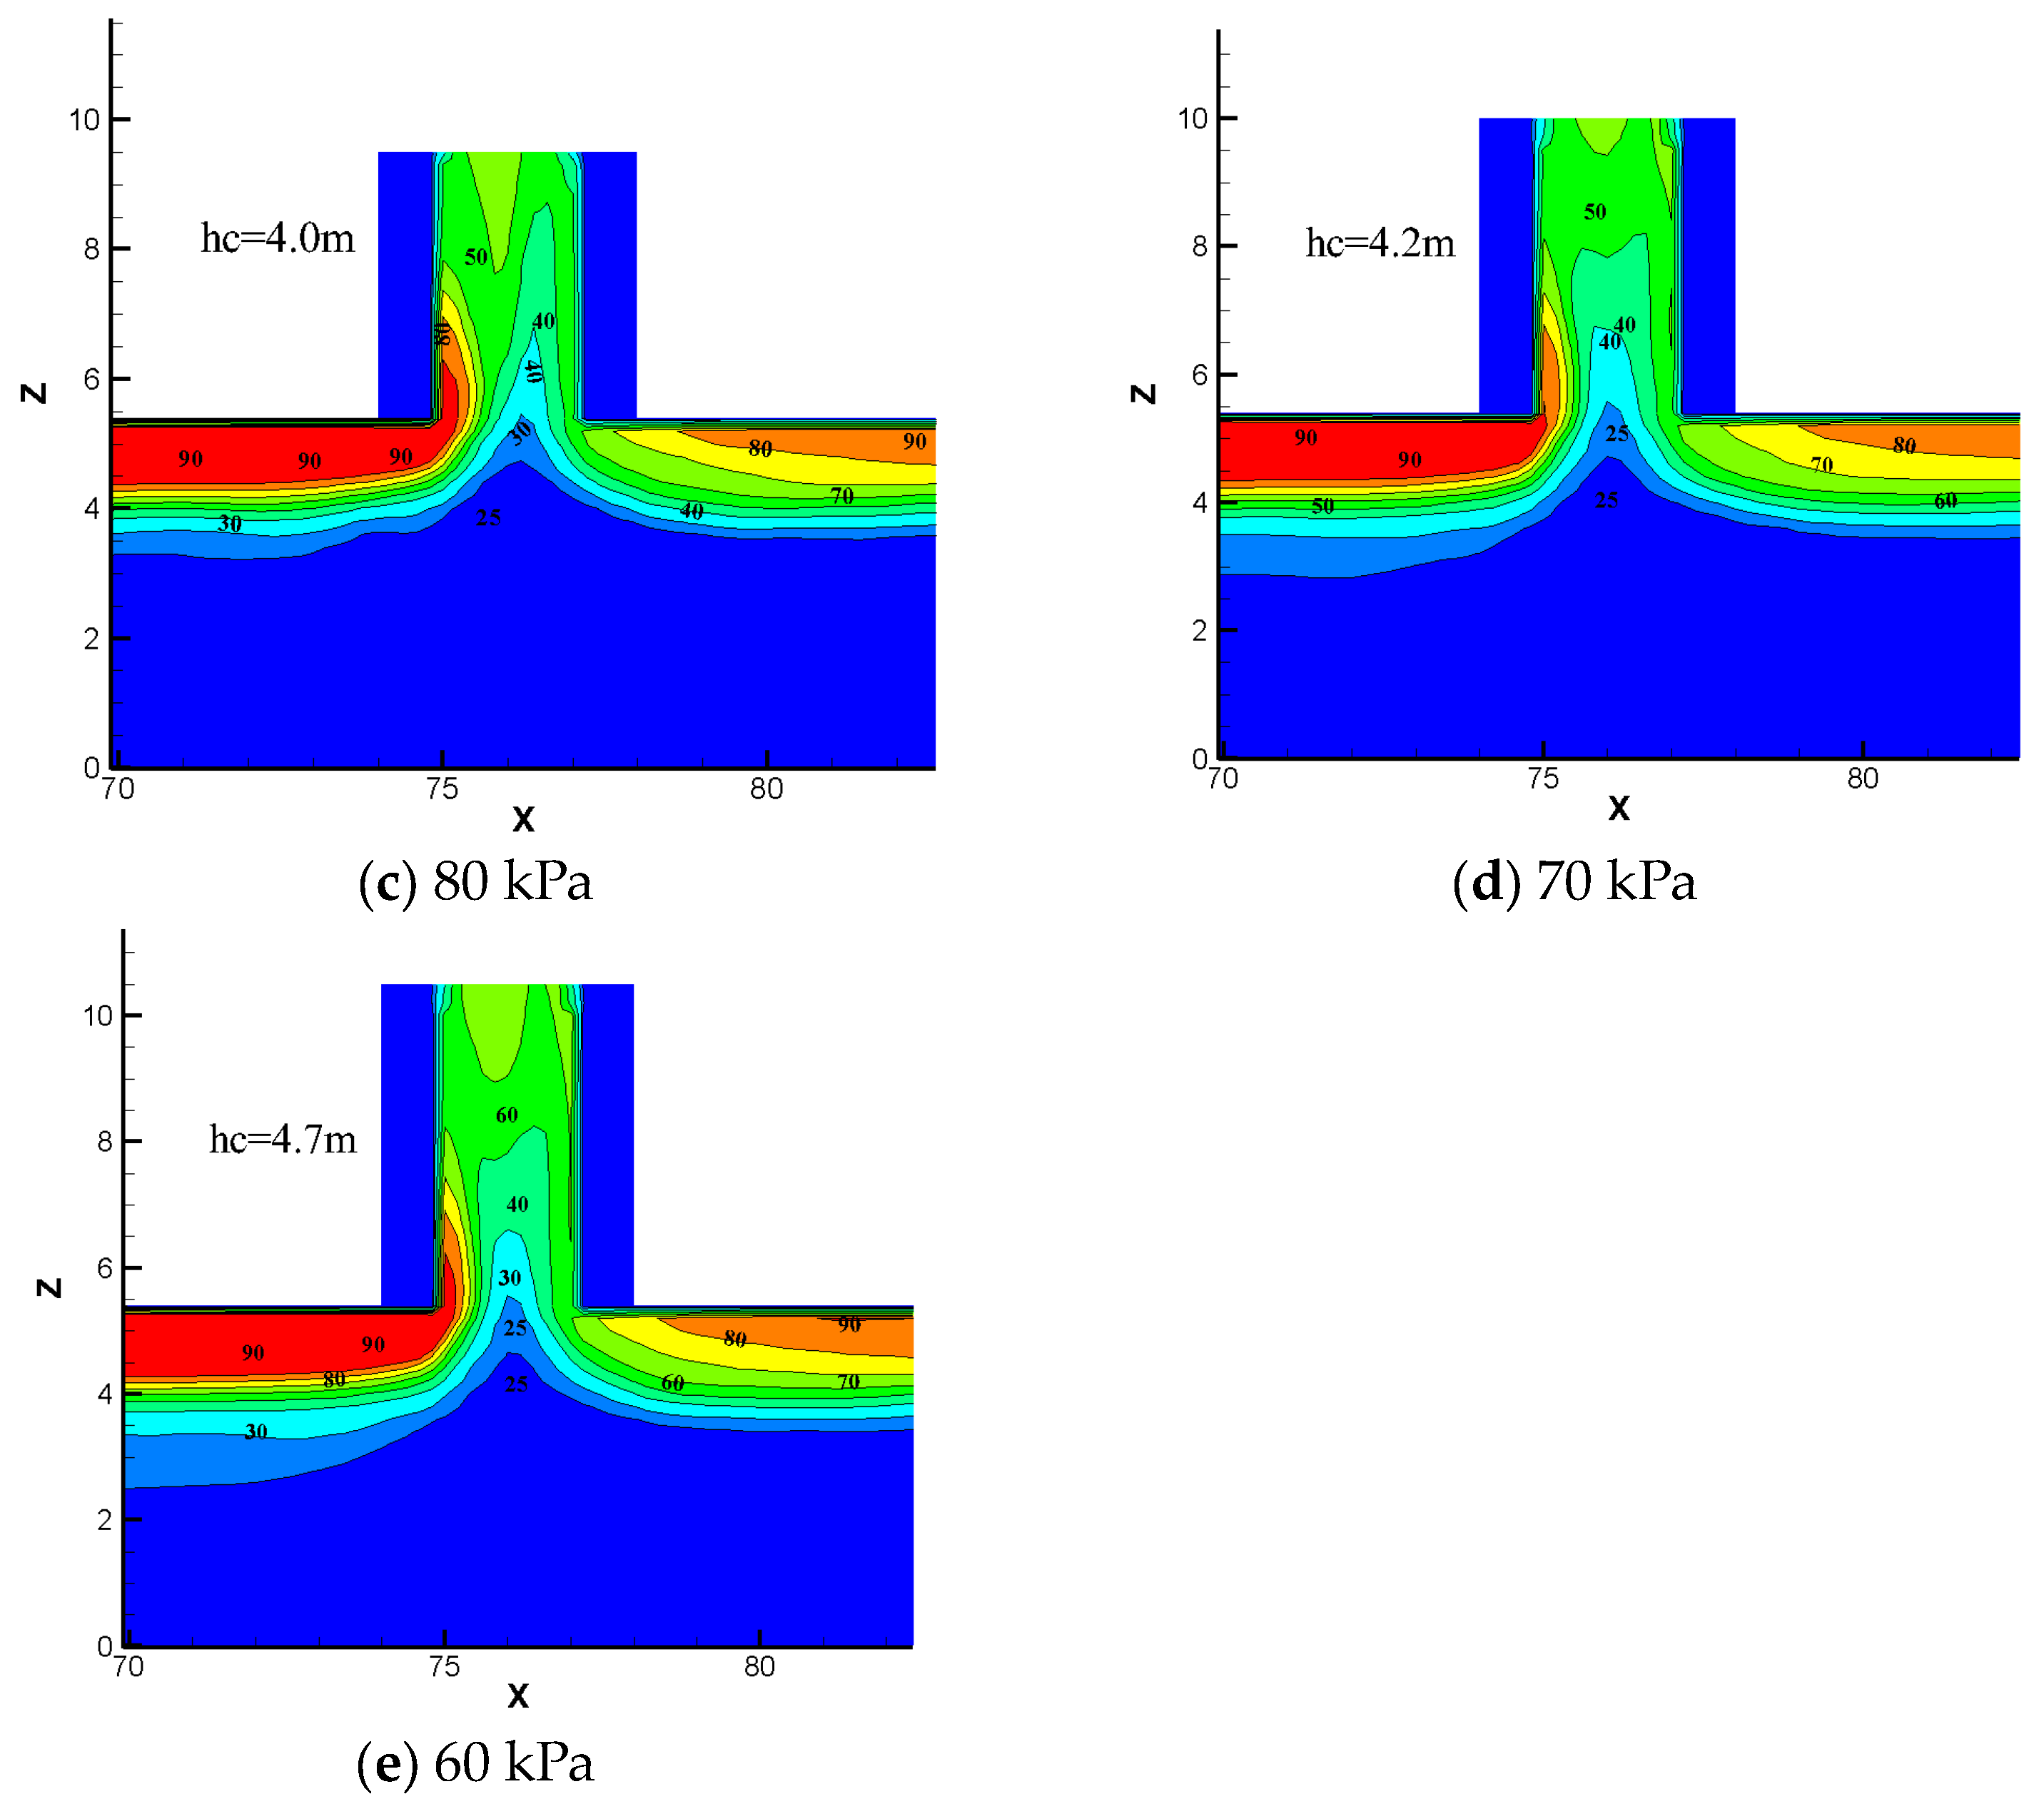
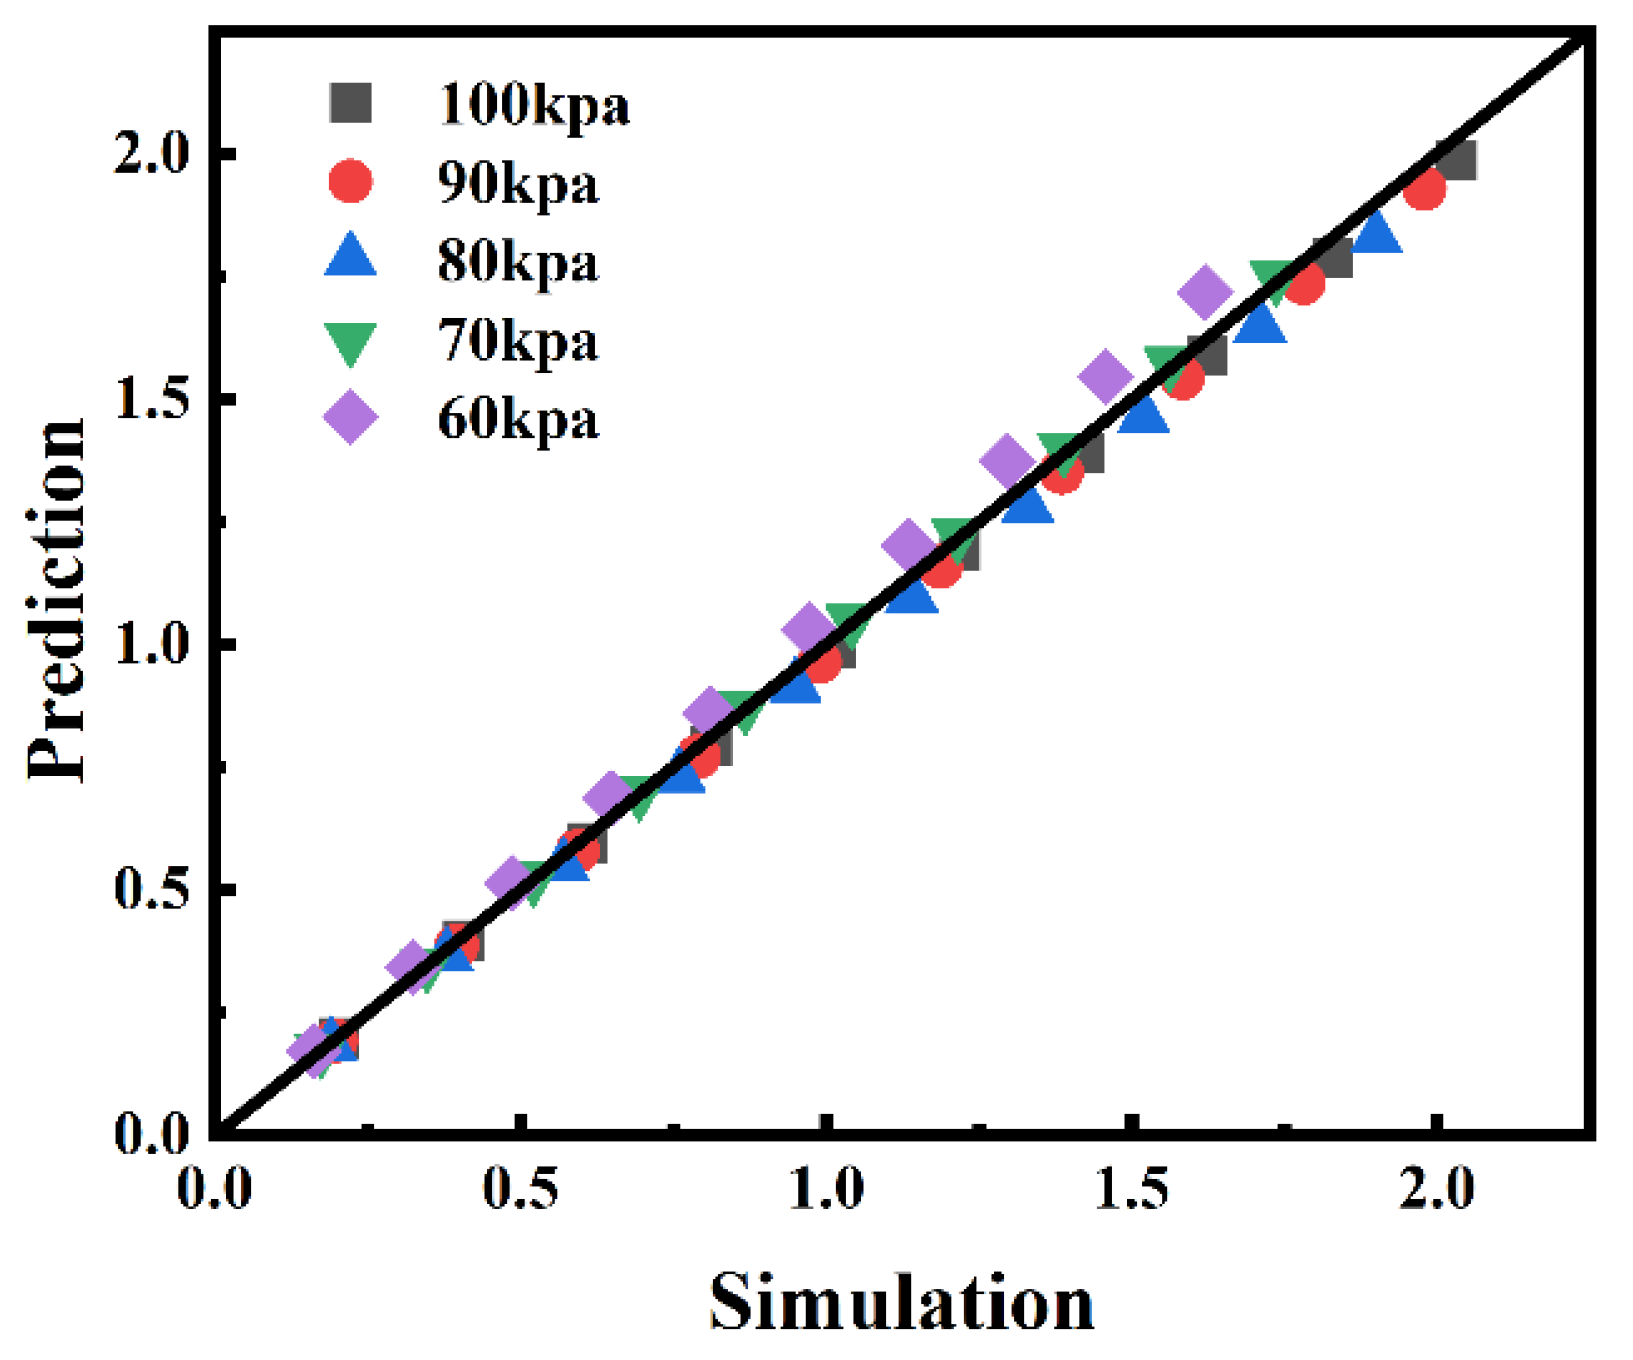
- A prediction model of Richard numbers to determine whether the plug-holing occurs was proposed by combining the prediction formulas of smoke flow velocity and temperature distribution. The predicted value of the Richard number shows good agreement with the result from the simulation. The critical Richard number and the critical height of the shaft both increase as the ambient pressure decreases. For the 60 kPa, 70 kPa, 80 kPa, 90 kPa and 100 kPa of ambient pressures, the critical height of the shaft is 4.7 m, 4.2 m, 4 m, 3.7 m and 3.5 m, respectively.
Author Contributions
Funding
Institutional Review Board Statement
Informed Consent Statement
Data Availability Statement
Acknowledgments
Conflicts of Interest
References
- Hong, K.R.; Feng, H.H. Development Trends and Views of Highway Tunnels in China over the Past Decade. China J. Highw. Transp. 2020, 33, 62–76. [Google Scholar]
- Fan, C.G.; Jin, Z.F.; Zhang, J.Q.; Zhu, H.Y. Effects of ambient wind on thermal smoke exhaust from a shaft in tunnels with natural ventilation. Appl. Therm. Eng. 2017, 117, 254–262. [Google Scholar] [CrossRef]
- Ren, F.; Shi, C.L.; Li, J.; Che, H.L.; Xu, X. Numerical study on the flow characteristics and smoke temperature evolution under double fires condition with a metro train in tunnel. Tunn. Undergr. Space Technol. 2021, 114, 103943. [Google Scholar] [CrossRef]
- Yao, Y.Z.; Qu, B.L.; Zhu, H.Q.; Wang, J.X.; Zhao, S.Z.; Wang, Q. Theoretical and numerical study on critical velocity and driving force for preventing smoke backlayering in a connection roadway fire of coal mines. Tunn. Undergr. Space Technol. 2022, 127, 104566. [Google Scholar] [CrossRef]
- Ingason, H.; Loennermark, A. Fire development of large vehicles in road tunnels. Tunn. Manage. Int. 2005, 8, 7–14. [Google Scholar]
- Silva, D.; Andreini, M.; Bilotta, A.; Rosa, G.D.; Mendola, S.L. Structural safety assessment of concrete tunnel lining subjected to fire. Fire Saf. J. 2022, 134, 103697. [Google Scholar] [CrossRef]
- Johansson, N.; Ronchi, E.; Scozzari, R.; Fronterre, M. The use of multi-zone modelling for tunnel fires. Tunn. Undergr. Space Technol. 2023, 134, 104996. [Google Scholar] [CrossRef]
- Shi, C.L.; Li, J.; Xu, X. Full-scale tests on smoke temperature distribution in long-large subway tunnels with longitudinal mechanical ventilation. Tunn. Undergr. Space Technol. 2021, 109, 103784. [Google Scholar] [CrossRef]
- Alarie, Y. Toxicity of Fire Smoke. Crit. Rev. Toxicol. 2002, 32, 259–289. [Google Scholar] [CrossRef]
- Gao, Z.H.; Li, L.J.; Sun, C.P.; Zhong, W.; Yan, C.B. Effect of longitudinal slope on the smoke propagation and ceiling temperature characterization in sloping tunnel fires under natural ventilation. Tunn. Undergr. Space Technol. 2022, 123, 104396. [Google Scholar] [CrossRef]
- Hu, L.H.; Li, Y.Z.; Huo, R.; Yi, L.; Chow, W.K. Full-scale experimental studies on mechanical smoke exhaust efficiency in an underground corridor. Built. Environ. 2006, 41, 1622–1630. [Google Scholar] [CrossRef]
- Liu, Q.L.; Xu, Z.S.; Xu, W.K.; Tao, H.W.; Zhao, J.M.; Ying, H.L. Study of the Heat Exhaust Coefficient of Lateral Smoke Exhaust in Tunnel Fires: The Effect of Tunnel Width and Transverse Position of the Fire Source. Fire 2022, 5, 167. [Google Scholar] [CrossRef]
- Li, Y.; Huang, F.; Ma, C.; Tang, K. A Simulation Study on the Smoke Control Effect with Different Smoke Exhaust Patterns and Longitudinal Air Supply for Ultra-Wide Tunnels. Fire 2022, 5, 72. [Google Scholar] [CrossRef]
- Baek, D.; Sung, K.H.; Ryou, H.S. Experimental study on the effect of heat release rate and aspect ratio of tunnel on the plug-holing phenomena in shallow underground tunnels. Int. J. Heat Mass Transf. 2017, 113, 1135–1141. [Google Scholar] [CrossRef]
- Li, M.; Qiang, Y.; Wang, X.; Shi, W.; Zhou, Y.; Yi, L. Effect of Wind Speed on the Natural Ventilation and Smoke Exhaust Performance of an Optimized Unpowered Ventilator. Fire 2022, 5, 18. [Google Scholar] [CrossRef]
- Kashef, A.; Yuan, Z.; Lei, B. Ceiling temperature distribution and smoke diffusion in tunnel fires with natural ventilation. Fire Saf. J. 2013, 62, 249–255. [Google Scholar] [CrossRef] [Green Version]
- Yuan, Z.Y.; Lei, B.; Kashef, A. Experimental and Theoretical Study for Tunnel Fires with Natural Ventilation. Fire Technol. 2015, 51, 691–706. [Google Scholar] [CrossRef]
- Fan, C.G.; Ji, J.; Gao, Z.H.; Han, J.Y.; Sun, J.H. Experimental study of air entrainment mode with natural ventilation using shafts in road tunnel fires. Int. J. Therm. 2013, 56, 750–757. [Google Scholar] [CrossRef]
- Xie, B.C.; Han, Y.X.; Huang, H.; Chen, L.; Zhou, Y.; Fan, C.G.; Liu, X.P. Numerical study of natural ventilation in urban shallow tunnels: Impact of shaft cross section. Sustain. Cities Soc. 2018, 42, 521–537. [Google Scholar] [CrossRef]
- Ji, J.; Gao, Z.H.; Fan, C.G.; Zhong, W.; Sun, J.H. A study of the effect of plug-holing and boundary layer separation on natural ventilation with vertical shaft in urban road tunnel fires. Int. J. Heat Mass Transf. 2012, 55, 6032–6041. [Google Scholar] [CrossRef]
- Yao, Y.Z.; Zhang, S.G.; Shi, L.; Cheng, X.D. Effects of shaft inclination angle on the capacity of smoke exhaust under tunnel fire. Indoor Built. Environ. 2019, 28, 77–87. [Google Scholar] [CrossRef]
- Fan, C.G.; Chen, J.; Mao, Z.L.; Zhou, Y.; Mao, S.H. A numerical study on the effects of naturally ventilated shaft and fire locations in urban tunnels. Fire Mater. 2019, 43, 949–960. [Google Scholar] [CrossRef]
- He, L.; Xu, Z.S.; Markert, F.; Zhao, J.M.; Liu, Q.L.; Tao, H.W.; Wang, Z.H.; Fan, C.G. Experimental study of heat exhaust efficiency with natural ventilation in tunnel fire: Impact of shaft height and heat release rate. J. Win. Eng. Ind. Aerodyn. 2020, 201, 104173. [Google Scholar] [CrossRef]
- Zukoski, E.E. A Review of Flows Driven by Natural Convection in Adiabatic Shafts; US Department of Commerce, National Institute of Standards and Technology: Gaithersburg, MD, USA, 1995.
- Vauquelin, O.; M’egret, O. Smoke extraction experiments in case of fire in a tunnel. Fire Saf. J. 2002, 37, 525–533. [Google Scholar] [CrossRef]
- Wang, Q.W.; Chen, B.G. Research on Environmental Impact Risk Assessment of Mila Mountain High Altitude Tunnel Construction. Chin. J. Undergr. Space Eng. 2018, 14, 976–979. [Google Scholar]
- Ji, J.; Guo, F.Y.; Gao, Z.H.; Zhu, J.P.; Sun, J.H. Numerical investigation on the effect of ambient pressure on smoke movement and temperature distribution in tunnel fires. Appl. Therm. Eng. 2017, 118, 663–669. [Google Scholar] [CrossRef]
- Yan, Z.G.; Guo, Q.H.; Zhu, H.H. Full-scale experiments on fire characteristics of road tunnel at high altitude. Tunn. Undergr. Space Technol. 2017, 66, 134–146. [Google Scholar] [CrossRef]
- Ji, J.; Tan, T.T.; Gao, Z.H.; Wan, H.X.; Zhu, J.P.; Ding, L. Numerical Investigation on the Influence of Length–Width Ratio of Fire Source on the Smoke Movement and Temperature Distribution in Tunnel Fires. Fire Technol. 2019, 55, 963–979. [Google Scholar] [CrossRef]
- Yan, G.; Wang, M.; Yu, L.; Duan, R.; Xia, P. Effects of ambient pressure on smoke movement patterns in vertical shafts in tunnel fires with natural ventilation systems. Build. Simul. 2020, 13, 931–941. [Google Scholar] [CrossRef]
- Zhang, S.G.; Wang, J.H.; He, K.; Yao, Y.Z.; Peng, M. Study on the smoke back-layering and critical ventilation in the road tunnel fire at high altitude. Fire. Mater. 2019, 43, 422–429. [Google Scholar] [CrossRef]
- Guo, F.Y.; Gao, Z.H.; Wan, H.X.; Ji, J. Influence of ambient pressure on critical ventilation velocity and backlayering distance of thermal driven smoke in tunnels with longitudinal ventilation. Int. J. Therm. Sci. 2019, 145, 105989. [Google Scholar] [CrossRef]
- Yao, Y.Z.; Zhang, Y.; Zhu, H.Q.; Han, Z.Q. Effects of ambient pressure on characteristics of smoke movement in tunnel fires. Tunn. Undergr. Space Technol. 2023, 134, 104981. [Google Scholar] [CrossRef]
- Huang, Y.B.; Li, Y.F.; Dong, B.Y.; Li, J.M.; Liang, Q. Numerical investigation on the maximum ceiling temperature and longitudinal decay in a sealing tunnel fire. Tunn. Undergr. Space Technol. 2018, 72, 120–130. [Google Scholar] [CrossRef]
- Roh, J.S.; Ryou, H.S.; Kim, D.H.; Jung, W.S.; Jang, Y.J. Critical velocity and burning rate in pool fire during longitudinal ventilation. Tunn. Undergr. Space Technol. 2007, 22, 262–271. [Google Scholar] [CrossRef]
- Hu, L.H.; Peng, W.; Yang, R.X. Fundamentals of Tunnel Fire Dynamics and Prevention Technology; Science Press: Beijing, China, 2014. [Google Scholar]
- Gannouni, S.; Maad, R.B. Numerical study of the effect of blockage on critical velocity and backlayering length in longitudinally ventilated tunnel fires. Tunn. Undergr. Space Technol. 2015, 48, 147–155. [Google Scholar] [CrossRef]
- Liu, B.; Mao, J.; Xi, Y.H.; Hu, J.W. Effects of altitude on smoke movement velocity and longitudinal temperature distribution in tunnel fires. Tunn. Undergr. Space Technol. 2021, 112, 103850. [Google Scholar] [CrossRef]
- Ji, J.; Gao, Z.H.; Fan, C.G.; Sun, J.H. Large Eddy Simulation of stack effect on natural smoke exhausting effect in urban road tunnel fires. Int. J. Heat Mass Transf. 2013, 66, 531–542. [Google Scholar] [CrossRef]
- Oka, Y.; Kakae, N.; Imazeki, O.; Inagaki, K. Temperature property of ceiling jet in an inclined tunnel. Procedia Eng. 2013, 62, 234–241. [Google Scholar] [CrossRef] [Green Version]
- Ko, J.S.; Yoon, C.H.; Yoon, S.W.; Kim, J. Determination of the applicable exhaust airflow rate through a ventilation shaft in the case of road tunnel fires. Saf. Sci. 2010, 48, 722–728. [Google Scholar] [CrossRef]
- Yao, Y.Z.; Li, Y.Z.; Ingason, H.; Cheng, X.D. Numerical study on overall smoke control using naturally ventilated shafts during fires in a road tunnel. Int. J. Therm. Sci. 2019, 140, 491–504. [Google Scholar] [CrossRef]
- Mcgrattan, K.B.; Hostikka, S.; Floyd, J.E. Fire Dynamics Simulator (Version 5): User’s Guide; NIST Special Publications: Gaithersburg, MD, USA, 2008; Volume 4, pp. 206–207.
- Zhao, S.Z.; Li, Y.Z.; Ingason, H.; Liu, F. A theoretical and experimental study on the buoyancy-driven smoke flow in a tunnel with vertical shafts. Int. J. Therm. Sci. 2019, 141, 33–46. [Google Scholar] [CrossRef]
- Bailey, J.L.; For, G.P.; Tatem, P.A.; Jones, W.W. Development and Validation of Corridor Flow Sub model for CFAST. J. Fire Prot. Eng. 2002, 12, 139–161. [Google Scholar] [CrossRef]
- Gao, Y.J.; Zhu, G.Q.; Gu, S.N.; Tao, H.J.; Zhao, Y.C. Experimental and numerical studies on ceiling maximum smoke temperature and longitudinal decay in a horseshoe shaped tunnel fire. Case Stud. Therm. Eng. 2018, 12, 134–142. [Google Scholar] [CrossRef]
- Gong, L.; Jiang, L.; Li, S.Y.; Shen, N.; Zhang, Y.C.; Sun, J.H. Theoretical and experimental study on longitudinal smoke temperature distribution in tunnel fires. Int. J. Therm. Sci. 2016, 102, 319–328. [Google Scholar] [CrossRef]
- Zhou, T.N.; Zhou, Y.; Fan, C.G.; Wang, J. Experimental study on temperature distribution beneath an arced tunnel ceiling with various fire locations. Tunn. Undergr. Space Technol. 2020, 98, 103344. [Google Scholar] [CrossRef]
- Luan, D.; Yi, L.; Yang, L.L.; Chen, T.; Tao, H.W.; Xu, Z.S.; Fan, C.G. Experimental investigation of smoke temperature and movement characteristics in tunnel fires with canyon cross wind. J. Wind. Eng. Ind. Aerodyn. 2021, 210, 104531. [Google Scholar] [CrossRef]
- Alpert, R.L. Calculation of response time of ceiling-mounted fire detectors. Fire Technol. 1972, 8, 181–195. [Google Scholar] [CrossRef]
- Li, Y.Z.; Lei, B.; Ingason, H. The maximum temperature of buoyancy-driven smoke flow beneath the ceiling in tunnel fires. Fire Saf. J. 2011, 46, 204–210. [Google Scholar] [CrossRef]


| Test No. | Ambient Pressure (kPa) | Shaft Height (m) | Fire Size (MW) |
|---|---|---|---|
| 1–9 | 100 | 0,1,2,3,3.2,3.4,3.5,3.6,4 | 5 |
| 10–18 | 90 | 0,2,3,3.4,3.5,3.6,3.7,3.8,4 | |
| 19–27 | 80 | 0,3,3.5,3.7,3.8,3.9,4,4.1,4.5 | |
| 28–36 | 70 | 0,3,3.5,4,4.1,4.2,4.3,4.4,5 | |
| 37–43 | 60 | 0,4,4.5,4.6,4.7,4.8,5 | |
| 44–49 | 100,80 | 0 | 3,7,10 |
| 50–54 | 90 | 3,3.5,3.6,3.7,4 | 10 |
| Pressure (kPa) | Ta (K) | d (m) | ΔTs (K) | Ts (K) | v (m/s) | Coefficient C Calculated by Equation (3) |
|---|---|---|---|---|---|---|
| 100 | 293 | 1 | 362 | 382 | 1.71 | 0.50 |
| 90 | 368 | 388 | 1.79 | 0.51 | ||
| 80 | 372 | 392 | 1.86 | 0.54 | ||
| 70 | 377 | 397 | 1.99 | 0.56 | ||
| 60 | 380 | 400 | 2.08 | 0.57 |
| Pressure (kPa) | 100 | 90 | 80 | 70 | 60 |
|---|---|---|---|---|---|
| ΔTmax (K) | 342 | 409 | 511 | 569 | 661 |
| α (-) | 17.1 | 20.5 | 25.6 | 28.5 | 33.0 |
| Pressure (kPa) | Ric | hc (m) |
|---|---|---|
| 100 | 1.42 | 3.5 |
| 90 | 1.46 | 3.7 |
| 80 | 1.48 | 4.0 |
| 70 | 1.49 | 4.2 |
| 60 | 1.61 | 4.7 |
Disclaimer/Publisher’s Note: The statements, opinions and data contained in all publications are solely those of the individual author(s) and contributor(s) and not of MDPI and/or the editor(s). MDPI and/or the editor(s) disclaim responsibility for any injury to people or property resulting from any ideas, methods, instructions or products referred to in the content. |
© 2023 by the authors. Licensee MDPI, Basel, Switzerland. This article is an open access article distributed under the terms and conditions of the Creative Commons Attribution (CC BY) license (https://creativecommons.org/licenses/by/4.0/).
Share and Cite
Yao, Y.; Wang, Y.; Zhang, Y.; Zhao, J. Simulation Research on Effects of Ambient Pressure on Plug-Holing Phenomenon in Tunnel Fires with a Shaft. Fire 2023, 6, 143. https://doi.org/10.3390/fire6040143
Yao Y, Wang Y, Zhang Y, Zhao J. Simulation Research on Effects of Ambient Pressure on Plug-Holing Phenomenon in Tunnel Fires with a Shaft. Fire. 2023; 6(4):143. https://doi.org/10.3390/fire6040143
Chicago/Turabian StyleYao, Yongzheng, Yintong Wang, Yue Zhang, and Jinlong Zhao. 2023. "Simulation Research on Effects of Ambient Pressure on Plug-Holing Phenomenon in Tunnel Fires with a Shaft" Fire 6, no. 4: 143. https://doi.org/10.3390/fire6040143