Article

Occurrence, Area Burned, and Seasonality Trends of Forest Fires in the Natural Subregions of Alberta over 1959–2021

Department of Geomatics Engineering, Schulich School of Engineering, University of Calgary, 2500 University Dr. NW, Calgary, AB T2N 1N4, Canada
*
Author to whom correspondence should be addressed.
Submission received: 11 January 2023 / Revised: 24 February 2023 / Accepted: 1 March 2023 / Published: 2 March 2023

Abstract

:
We analyzed the distribution and number of forest fire occurrences, burned areas, and seasonality, and their trends of human- and lightning-caused small (<200 ha) and large (≥200 ha) fires from 1959 to 2021 in the forested 14 subregions of Alberta, based on the Canadian National Fire Database. We applied a non-parametric statistical test, i.e., Mann–Kendall and Sen’s slope estimator, for the patterns and magnitudes of the trends. Our results revealed that all subregions experienced significantly increasing trends of fire occurrences, either monthly or yearly, except the Alpine subregion. In the burned area case, nine ecoregions demonstrated significantly decreasing monthly trends for small fires caused by humans, except for an increasing trend in the Lower Boreal Highlands subregion in May. For seasonality, we found one to two days for both early start and delayed end of fire season, and eventually two to four days longer fire seasons in five ecoregions. This study provides an updated understanding of the fire regimes in Alberta. It would be helpful for fire management agencies to make strategic plans by focusing on high-priority regions to save lives and properties.

1. Introduction

Occurrences of fires are an integral part of many forest ecosystems around the world. In Canada, it is a rising concern that the number of forest fire occurrences [1,2] and associated areas burned [2] are increasing in the past decades, despite the increased capacity and effectiveness of fire suppression and the increased coverage for suppression [3,4]. Early start, delayed end, and increased length of forest fire season are also believed to be happening [1]. Occurrences of the number of fires and changes in the fire season in a region are considered as critical factors for fire management agencies to determine the necessary fire suppression resources [5,6]. Such resources are usually developed based on the existing knowledge, experience, and understanding of fire occurrence trends and seasonality. Therefore, when even a small number of forest fires exceed the historical number or the fire season extends in a region, it might transcend the existing resource capacities [5,7]. It could lead more escaped fires, and potentially cause a larger burned area [6]. In fact, climate change (mostly warming; [8]) and more human activities in the forest [9,10] are considered responsible for the changes in fire weather that lead to the increasing trends of forest fire occurrences and longer season. These are likely putting the fire management agencies in a difficult situation to respond and deploy required resources in time to suppress the fires.
Increases in the number of forest fires and the length of the fire season are already happening in many parts of Canada and are projected to continue in the entire country [11,12], which would affect forest ecosystems and human health and safety [13]. Fire weather is one of the principal drivers of fires in the forest ecosystems on a regional scale [14,15,16], where the amount of fuel (vegetation) moisture is a key component [17]. Fuel moisture varies in different ecoregions and subregions depending on the forest type and associated climate or weather [18]. In fact, forest ecosystems and climate change have a close interrelationship. For instance, forest ecosystems are sensitive to climate, and thus changes in climate directly or indirectly affect the growth and productivity of forests [19]. It significantly effects tree species distributions, growth rate, and forest structure by altering the growth, reproduction, and mortality of trees [20]. On the other hand, local climate or weather are also influenced by forests that remove and release large amounts of atmospheric carbon, reflect/absorb solar radiation, cool the ground through evapotranspiration, and produce aerosols to form clouds [21,22]. Different subregions have different forest compositions and tree species with variable leaf and wood water contents [23], bark properties [24], and fire resistance capacities [25] that behave differently in the initial ignition and fire spread [26,27,28]. Additionally, local warming characteristics and their relationships with the large-scale atmospheric oscillations vary in the subregions [29]. It is probably one of the primary reasons that most of the forest-fire-related studies in the literature performed their analysis based on the characteristics of ecoregions or subregions. For instance, a study showed that the western ecozones (ecoregions) in Canada, such as Montane Cordillera, Boreal Plains, and Boreal Shield West, had the highest density of total wildfires, where the longer seasonal trend was evidenced in the Montane Cordillera during 1959–2018 [1]. Another study found significant differences in spatial metrics, such as fire size, shape (eccentricity and complexity), clustering, and geographic orientation, among ecozones in Canada [30]. Further, a study on local warming (related to climate change) reported variable rates of land surface temperature change in the subregions of Alberta (a western province of Canada) [29], which have the potential to influence differently the number of occurrences, area burned, and seasonality of forest fires.
In Alberta, a study was conducted on fire regime, including annual fire occurrence, area burned, density, cause, size, and seasonal frequency and distribution of area burned, over the period of 1961–2002 [31] for the six natural regions and twenty subregions prepared in 1994 [32]. In fact, considering forest fires as the major disturbance in the forest ecosystems, the study was performed for the important scalar context to understand disturbances that would help forest managers to better understand the management options available to conserve biodiversity and ensure sustainability [33]. However, the study became outdated in the face of ongoing climate change, and has some limitations as well, such as (i) Alberta was further updated to 21 subregions in 2005 with revised subregional boundaries based on the diverse attributes of climate, physiography, vegetation, soil, wildlife, and land use [34]; and (ii) no systematic trend analysis was performed for the historical fire occurrences, area burned, and seasonality.
Considering the limitations described in the previous section and aiming to develop an updated knowledge on the diversity of forest fires in the natural subregions of Alberta, our overall goal of this study was to determine the trends of occurrence, area burned, and seasonality over the period of 1959-2021. To achieve the main goal, we set the following specific objectives: (i) prepare a historical fire occurrence point database of 1959-2021 for the 21 subregions of Alberta from the Canadian National Fire Database; (ii) calculate summary statistics of the total number of forest fire occurrences and area burned, and their percentage, density, mean, and standard deviation in each subregion; (iii) monthly and annual trend analysis of fire occurrences and area burned in the subregions related to the human- and lightning-caused fires with burned area categories of <200 ha and ≥200 ha; and (iv) trend analysis of start, end, and length of fire season from historical numbers of daily fire occurrences. The novelty of our study is that it provides the latest understanding of the occurrence, area burned, and seasonality trends of forest fires that have never been explored for the subregions of Alberta. It contributes to helping the fire managers and fire management agencies with an informed decision to save lives and properties in Alberta.

2. Materials and Methods
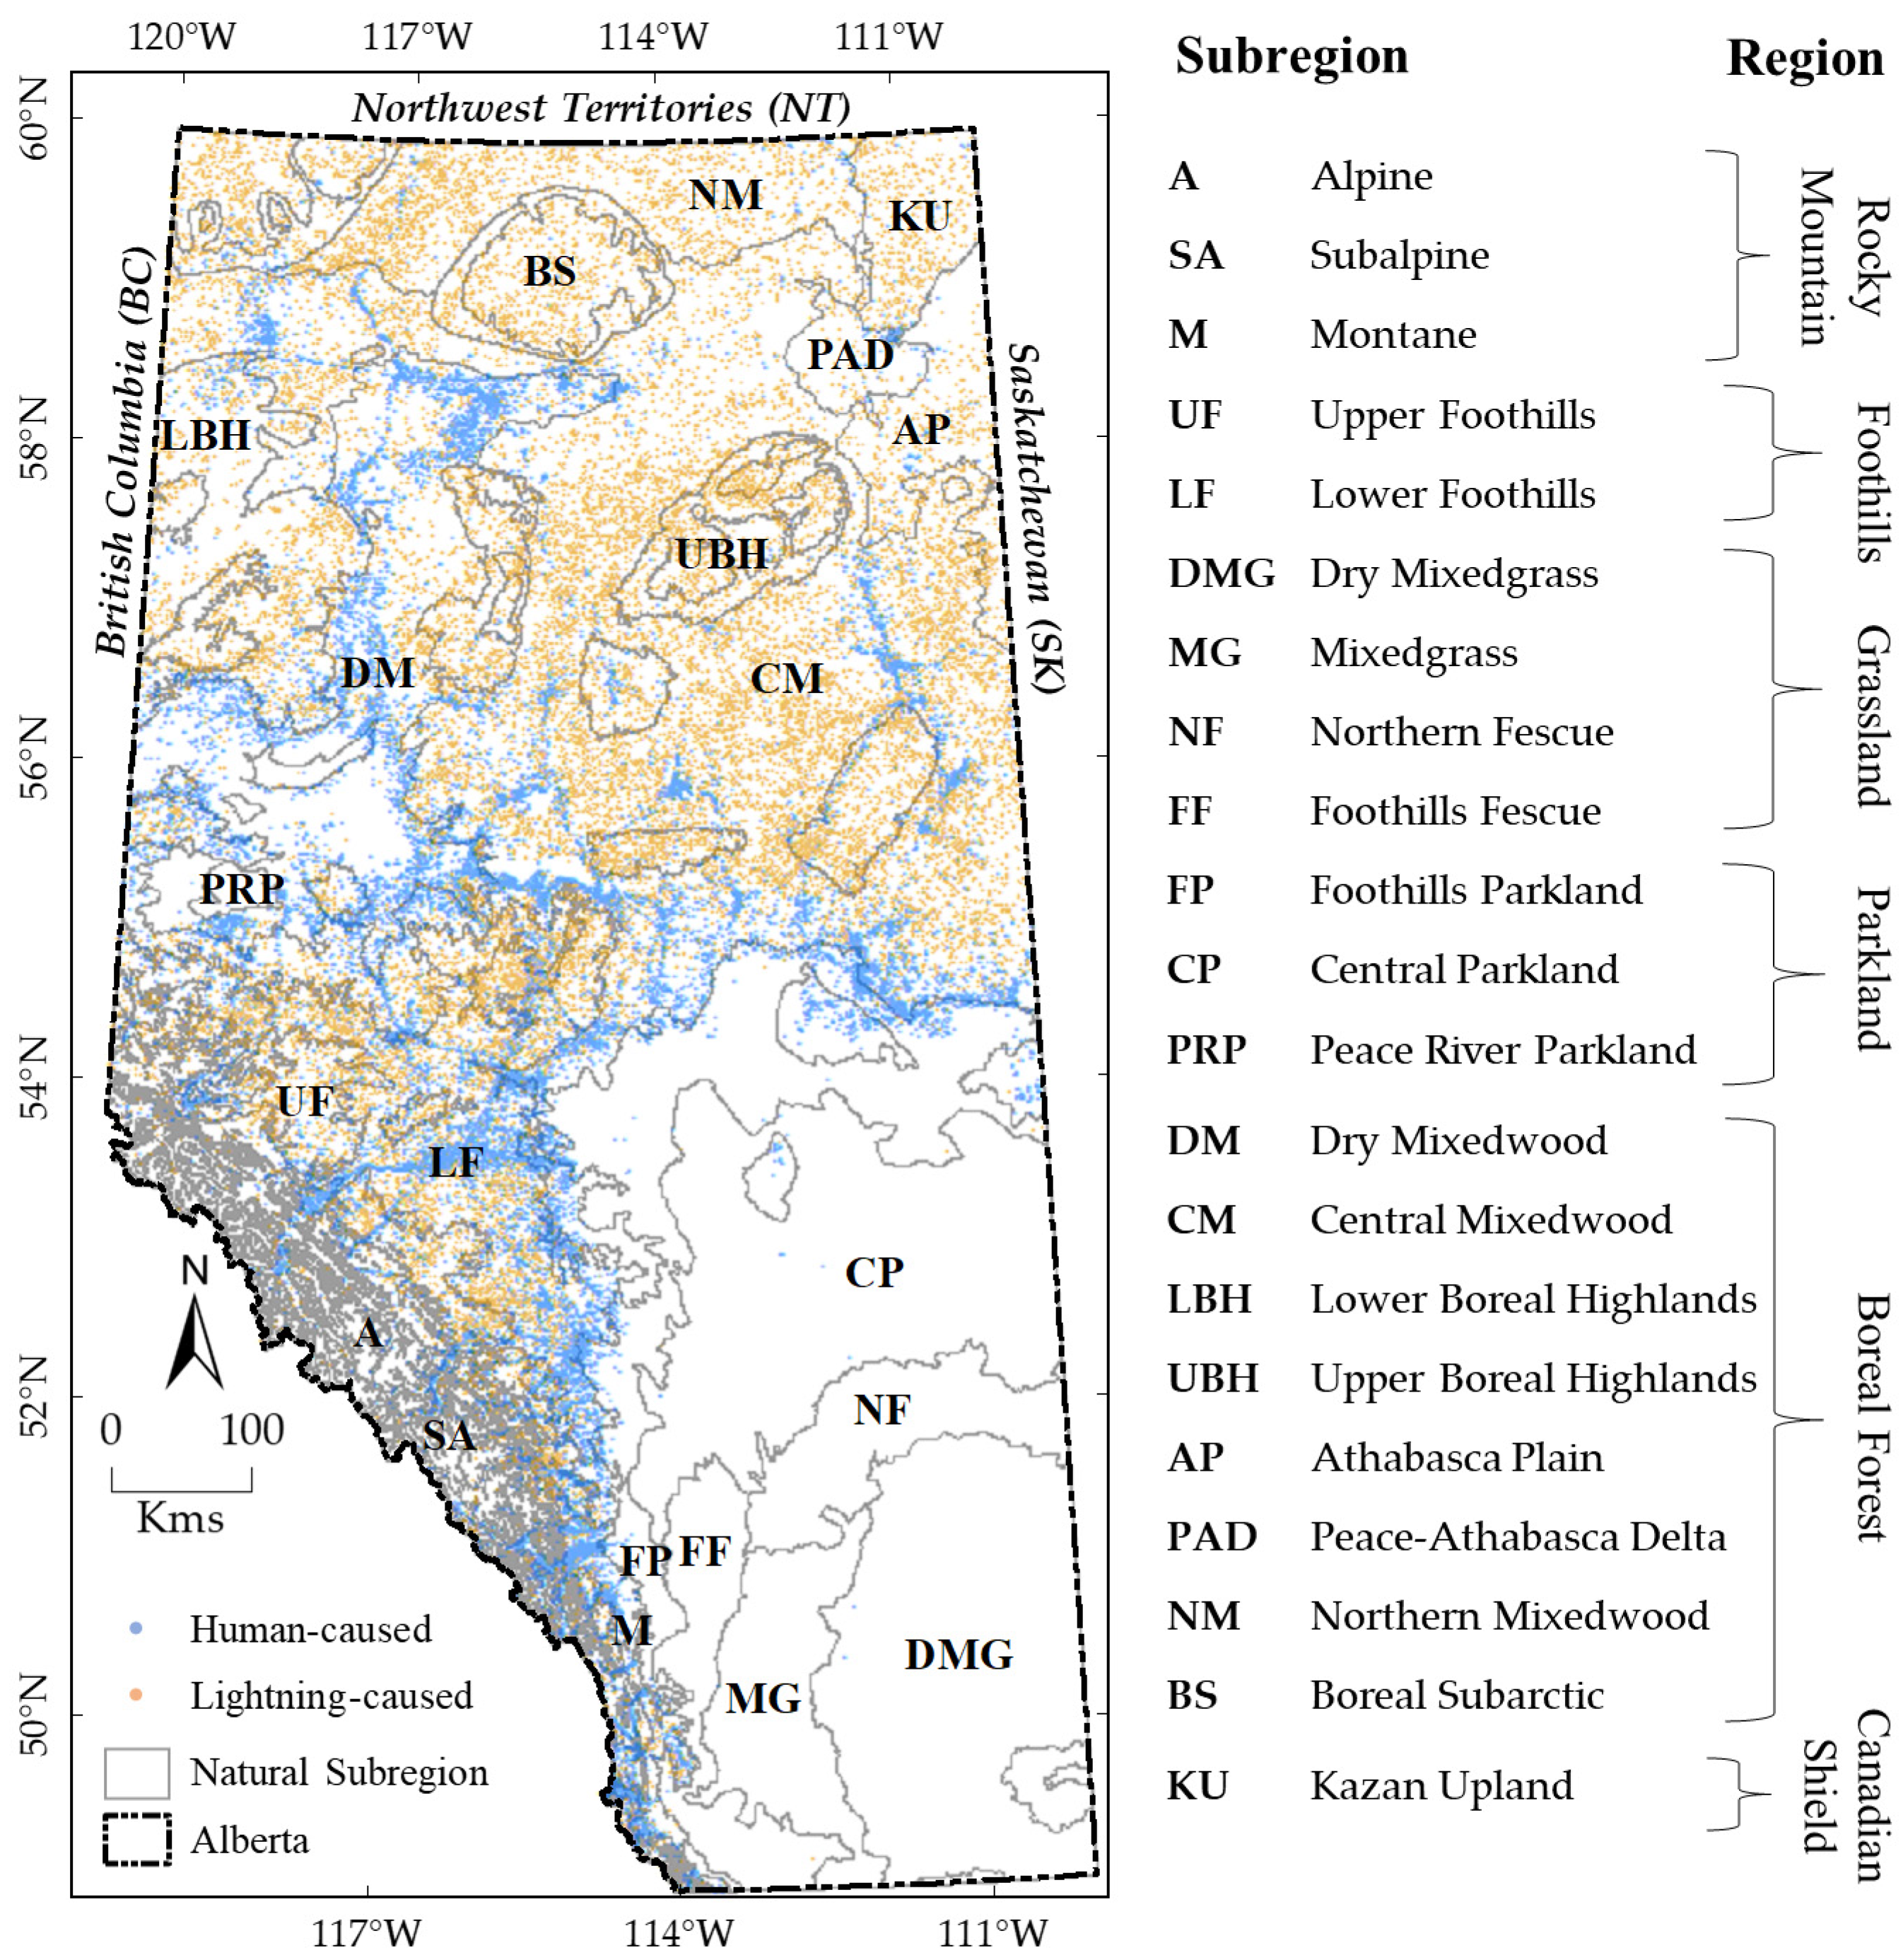
2.1. Study Area

The study focused on the forest fire occurrences in the natural subregions of Alberta (Figure 1), a western province of Canada, between latitudes 49 and 60° N and longitudes 110 and 120° W. A major part of the province comprises Canada’s terrestrial ecozones of Boreal Plains and Prairies, and includes small areas of the Montane Cordillera, Boreal Shield, Taiga Shield, and Taiga Plains [35]. Alberta is further subdivided into 21 subregions (under six regions) for their unique landscape patterns, vegetation, soil types, elevations, and physiographic features [34] that are controlled by the local climate, topography, and geology [32,36]. The elevation of the province ranges from 150 to 3650 m (above mean sea level), where the mean annual precipitation is 510 mm and the mean temperature varies from −7.1 to 6 °C, with long cold winters and short summers [29]. Human- and lightning-caused forest fires usually occur every year in the 14 subregions of Rocky Mountain, Foothills, Boreal Forest, and Canadian Shield regions (Figure 1). In contrast, forest fire occurrence is extremely low in the seven subregions of Grassland and Parklands regions because of the dominant land use type of grazing, irrigation-based farming, till-cropping, and recreation [34].

2.2. Data

The following datasets (shapefiles) were used in this study.
i.
National Fire Database fire point data of the Canadian National Fire Database (CNFDB), obtained from the fire history data of the Natural Resources Canada, Government of Canada [37], available up to the year 2021. It is an integrated database of the source agency (province, territory, and parks) provided data with 26 attributes, including the fire date (year, month, and day), fire size (in hectares), cause (L: lightning, H: human, H-PB: human-prescribed burn, Re: reburn, U: unknown, and n/a: not available), ecozone, and others. We used CNFDB, instead of the Historical Wildfire Database of Alberta without the fire occurrences in the national parks, because it includes the fire-occurrence points of both provincial jurisdictions and national parks.
ii.
Natural regions and subregion of Alberta (2005) polygons from the open data repository of the Government of Alberta [38].
iii.
The provincial boundary polygon of Alberta from the open data repository of the Government of Alberta [39].

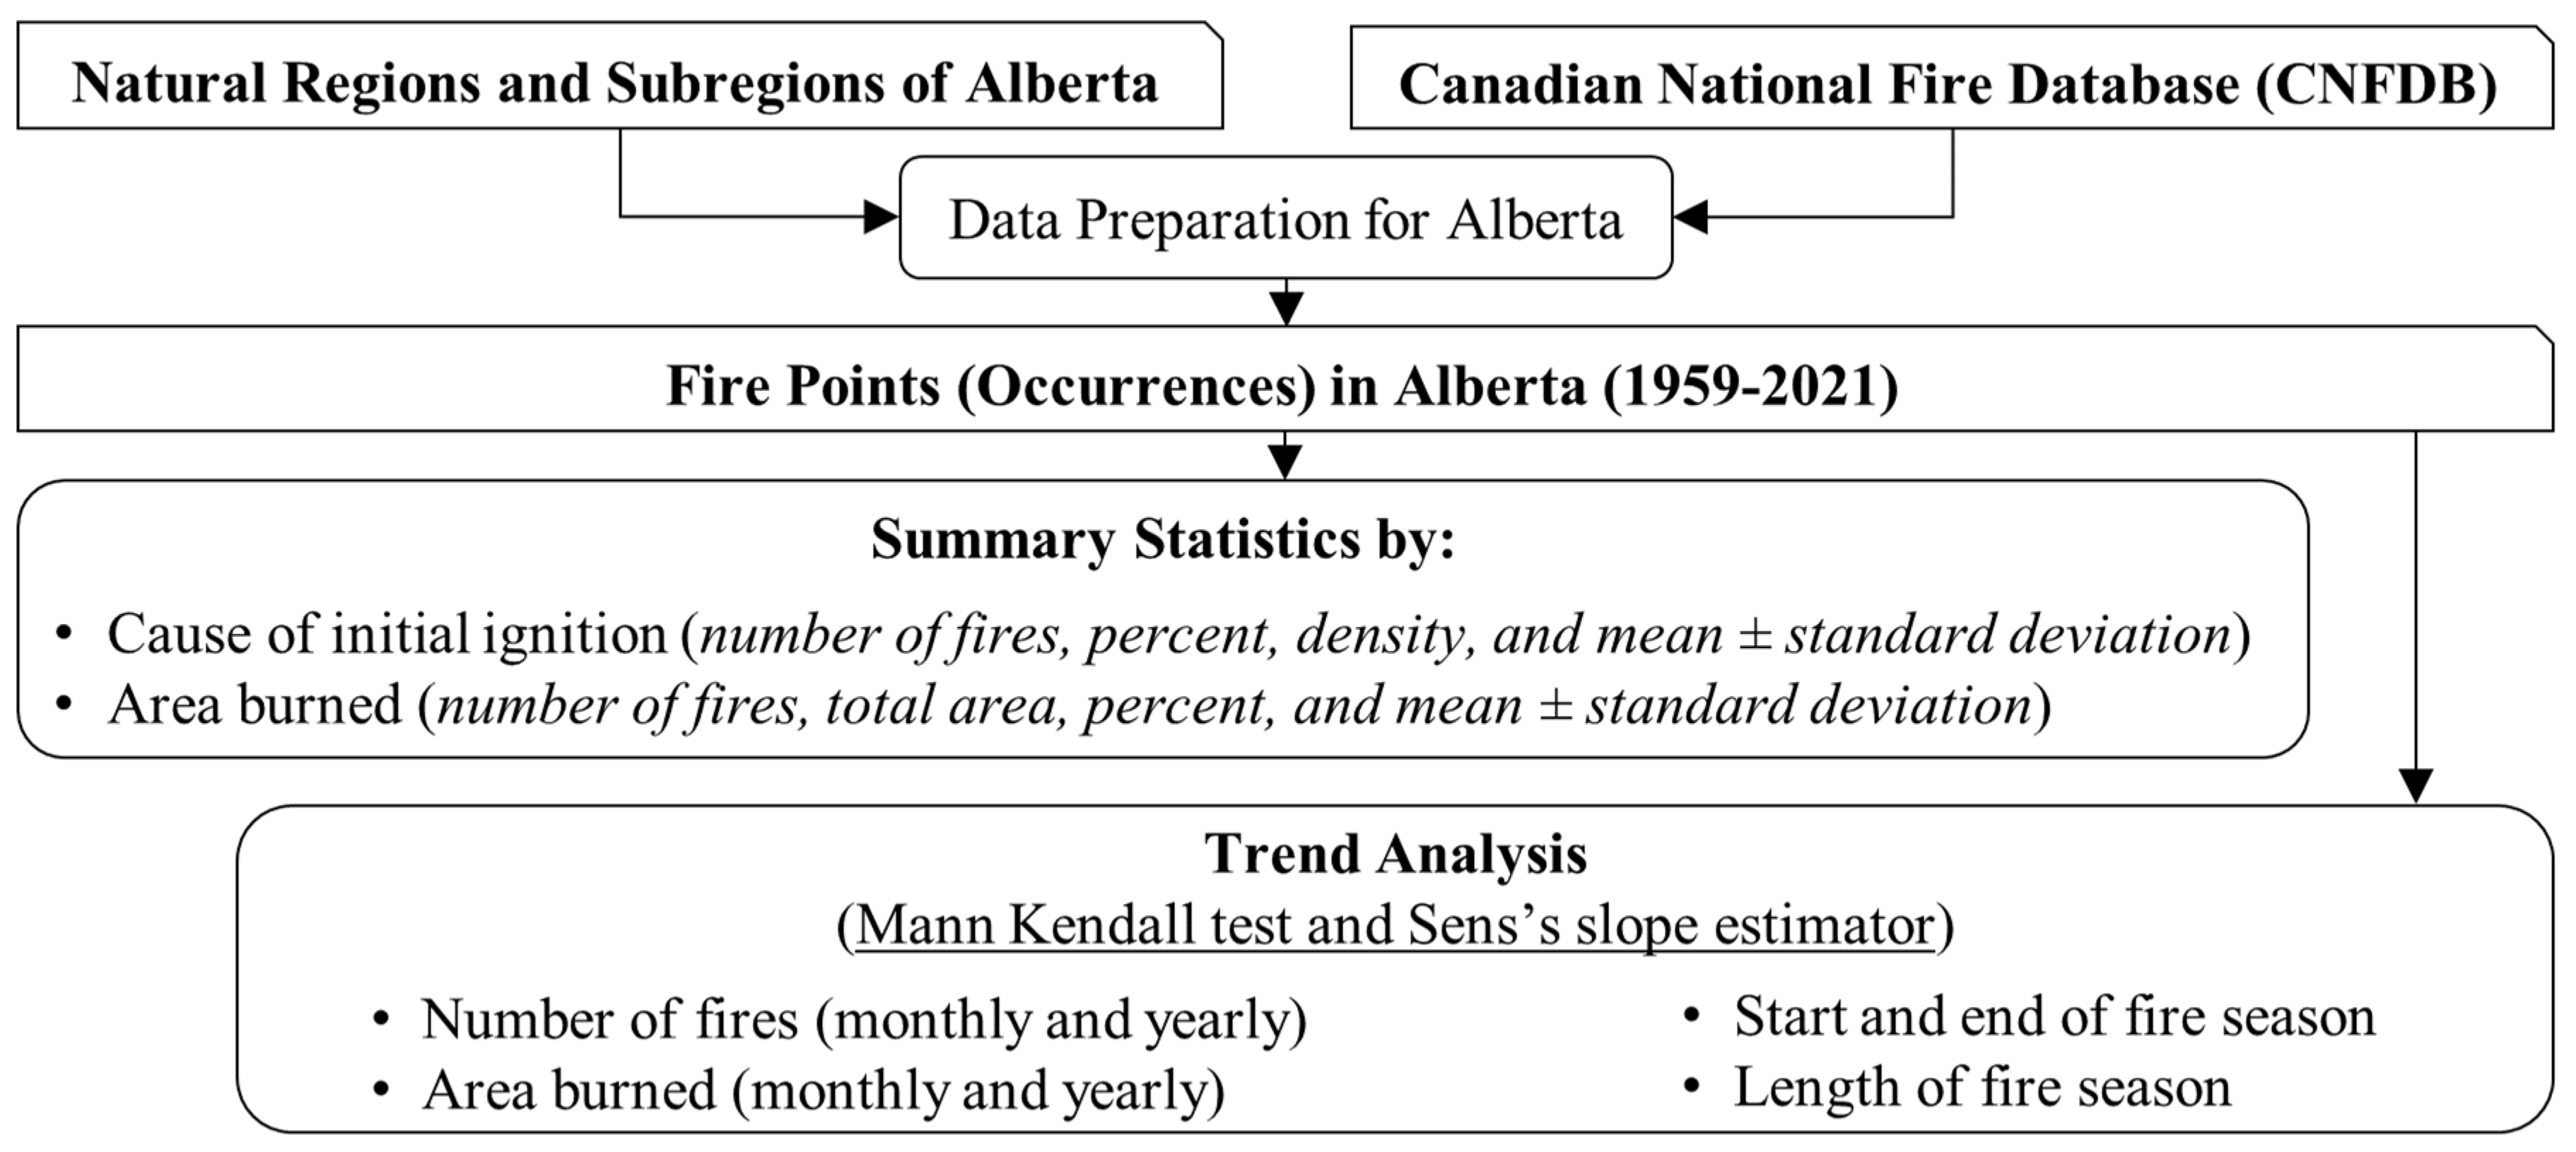
2.3. Database Preparation

We spatially extracted the fire points of Alberta (64,992) from CNFDB using the administrative boundary of Alberta. It included 86 fire points of the adjacent provinces or territories, i.e., British Columbia (BC: 69), Northwest Territories (NT: 5), and Saskatchewan (SK: 12), which we removed from the database. We also discarded 77 fire points of the Wood Buffalo National Park (PC-WB) from 1946 to 1958, because the rest of Alberta reported from 1959 to 2021. Therefore, a total of 64,829 fire points of Alberta during 1959–2021 were used in our analyses. Finally, the fire points were designated for the 21 subregions of Alberta by spatial selection and coding by using the natural subregion polygons.

2.4. Methods

A schematic diagram of the methodology we followed is shown in Figure 2.

2.4.1. Summary Statistics

We prepared summary statistics from the fire points database of Alberta for the period of 1959–2021. It was divided into two groups by cause of initial ignition and area burned. The total number of fires (NOF), percent, density, and mean ± standard deviation were calculated for the categories of initial ignition causes of occurrences, i.e., human (includes prescribed burn), lightning, and others, in each subregion. The percent was derived using the total NOF in each subregion and the total fires of Alberta in each cause. The density was obtained using the total NOF in each cause and the area of each subregion. For the burned area (BA) statistics, we calculated the total NOF, total BA, percent of BA, and mean ± standard deviation for small and large fire sizes caused by human and lightning in each subregion. The size categorization was based on the area burned by each fire, i.e., less than 200 hectares (ha) for the small fire and more than or equal to 200 ha for the large fire—common threshold sizes in Canada. Here, the percent of BA was prepared using the total BA in each subregion and the total BA of each size–cause category.

2.4.2. Trend Analyses

We examined monthly and annual trends in the number of fire occurrences by two initial ignition causes (human and lightning) and two burned area sizes (small and large) in the subregions of Alberta over the period of 1959–2021. We did not examine the trends for other ignition causes, because it was only 2.6% of the total fire occurrences during 1959–2021. We also examined trends of fire season parameters, i.e., start and end dates (day of year, DOY) and length. The parameters were based on the number of annual fire occurrences in each subregion using quantile estimates [2,17]. Various quantiles were used in previous studies, including 0.05 and 0.95 quantiles (5th and 95th percentiles, respectively) [1,2], 0.10 and 0.90 quantiles (10th and 90th percentiles, respectively) [40], 0.25 and 0.75 quantiles (25th and 75th percentiles, respectively) [41], and 90%, 95%, and 99% thresholds of confidence interval [42]. In our study, two season start DOYs were determined for 1% and 5% of annual fire occurrences, i.e., the 1st and 5th percentiles, or 0.01 and 0.05 quantiles [1]. Likewise, 0.99 and 0.95 quantiles were used to estimate the season end DOYs [1]. The annual season lengths were calculated from the difference between start and end DOYs of each quantile set, i.e., 0.01 and 0.99, and 0.05 and 0.95.
The parameters of forest fire regimes were determined in the literature by linear regression (least-square method) and were tested for trend significance through the Mann–Kendall (MK) test [43]. In our study, we implemented the MK test [44,45], a non-parametric statistical test, to determine the trends of our interests (fire occurrences, area burned, and seasonality) in the subregions. MK compared each value in the time series preceding it in sequential order with the null hypothesis for no trend, and alternative for a trend. The advantages of the MK test are that it does not require normally distributed data, is not affected by missing data, is insensitive to outliers, and is suitable for skewed data [29,46]. MK starts calculating the sum of all counts in a time series (statistics S) by Equation (1).
S = i = 1 n 1 j = i + 1 n s g n (   x j x i   )
where n is the number of samples or points (we considered n > 10),  x i  and  x j  are the values of i and j (j > i), respectively, and  s g n ( x j x i )  is the sign function calculated by Equation (2).
s g n ( x j x i ) = {   + 1   i f   x j x i > 0   0   i f   x j x i = 0 1   i f   x j x i < 0
In the case of large n, S tends to normality with the variance  v a r ( S ) , calculated by Equation (3).
v a r ( S ) = 1 18   [ n ( n 1 ) ( 2 n + 5 ) i = 1 m t i   ( t i 1 ) ( 2 t i + 5 ) ]
where the number of tied values and the length of time series are m and n, respectively, and the number of ties of i extent is  t i . Note, a set of points with a same value are considered a tied value.
A standardized test statistic,  Z S , was also calculated by Equation (4) to understand the increasing and decreasing trends with positive and negative values (respectively) at the significance levels of 95 and 99% confidences (i.e., p values of 0.05 and 0.01, respectively).
Z S = {   S 1 v a r ( S )   i f   S > 0   0   i f   S = 0 S + 1 v a r ( S )   i f   S < 0  
To determine the magnitude of trend (rate of a unit parameter/year) for our variables of interest, we further used Sen’s slope estimator ( Q i ) [47] to calculate the slopes for N pairs of data by Equation (5). Here,  Q i  ranges from the smallest to largest with positive, negative, and zero values for the increase, decrease, and no-change trends, respectively.
Q i = x j x k j k   f o r   j = 1 , 2 , 3 , , N
where  x j  and  x k  are values of data pairs at times j and k, considering j > k.

3. Results

3.1. Data Summary Statistics

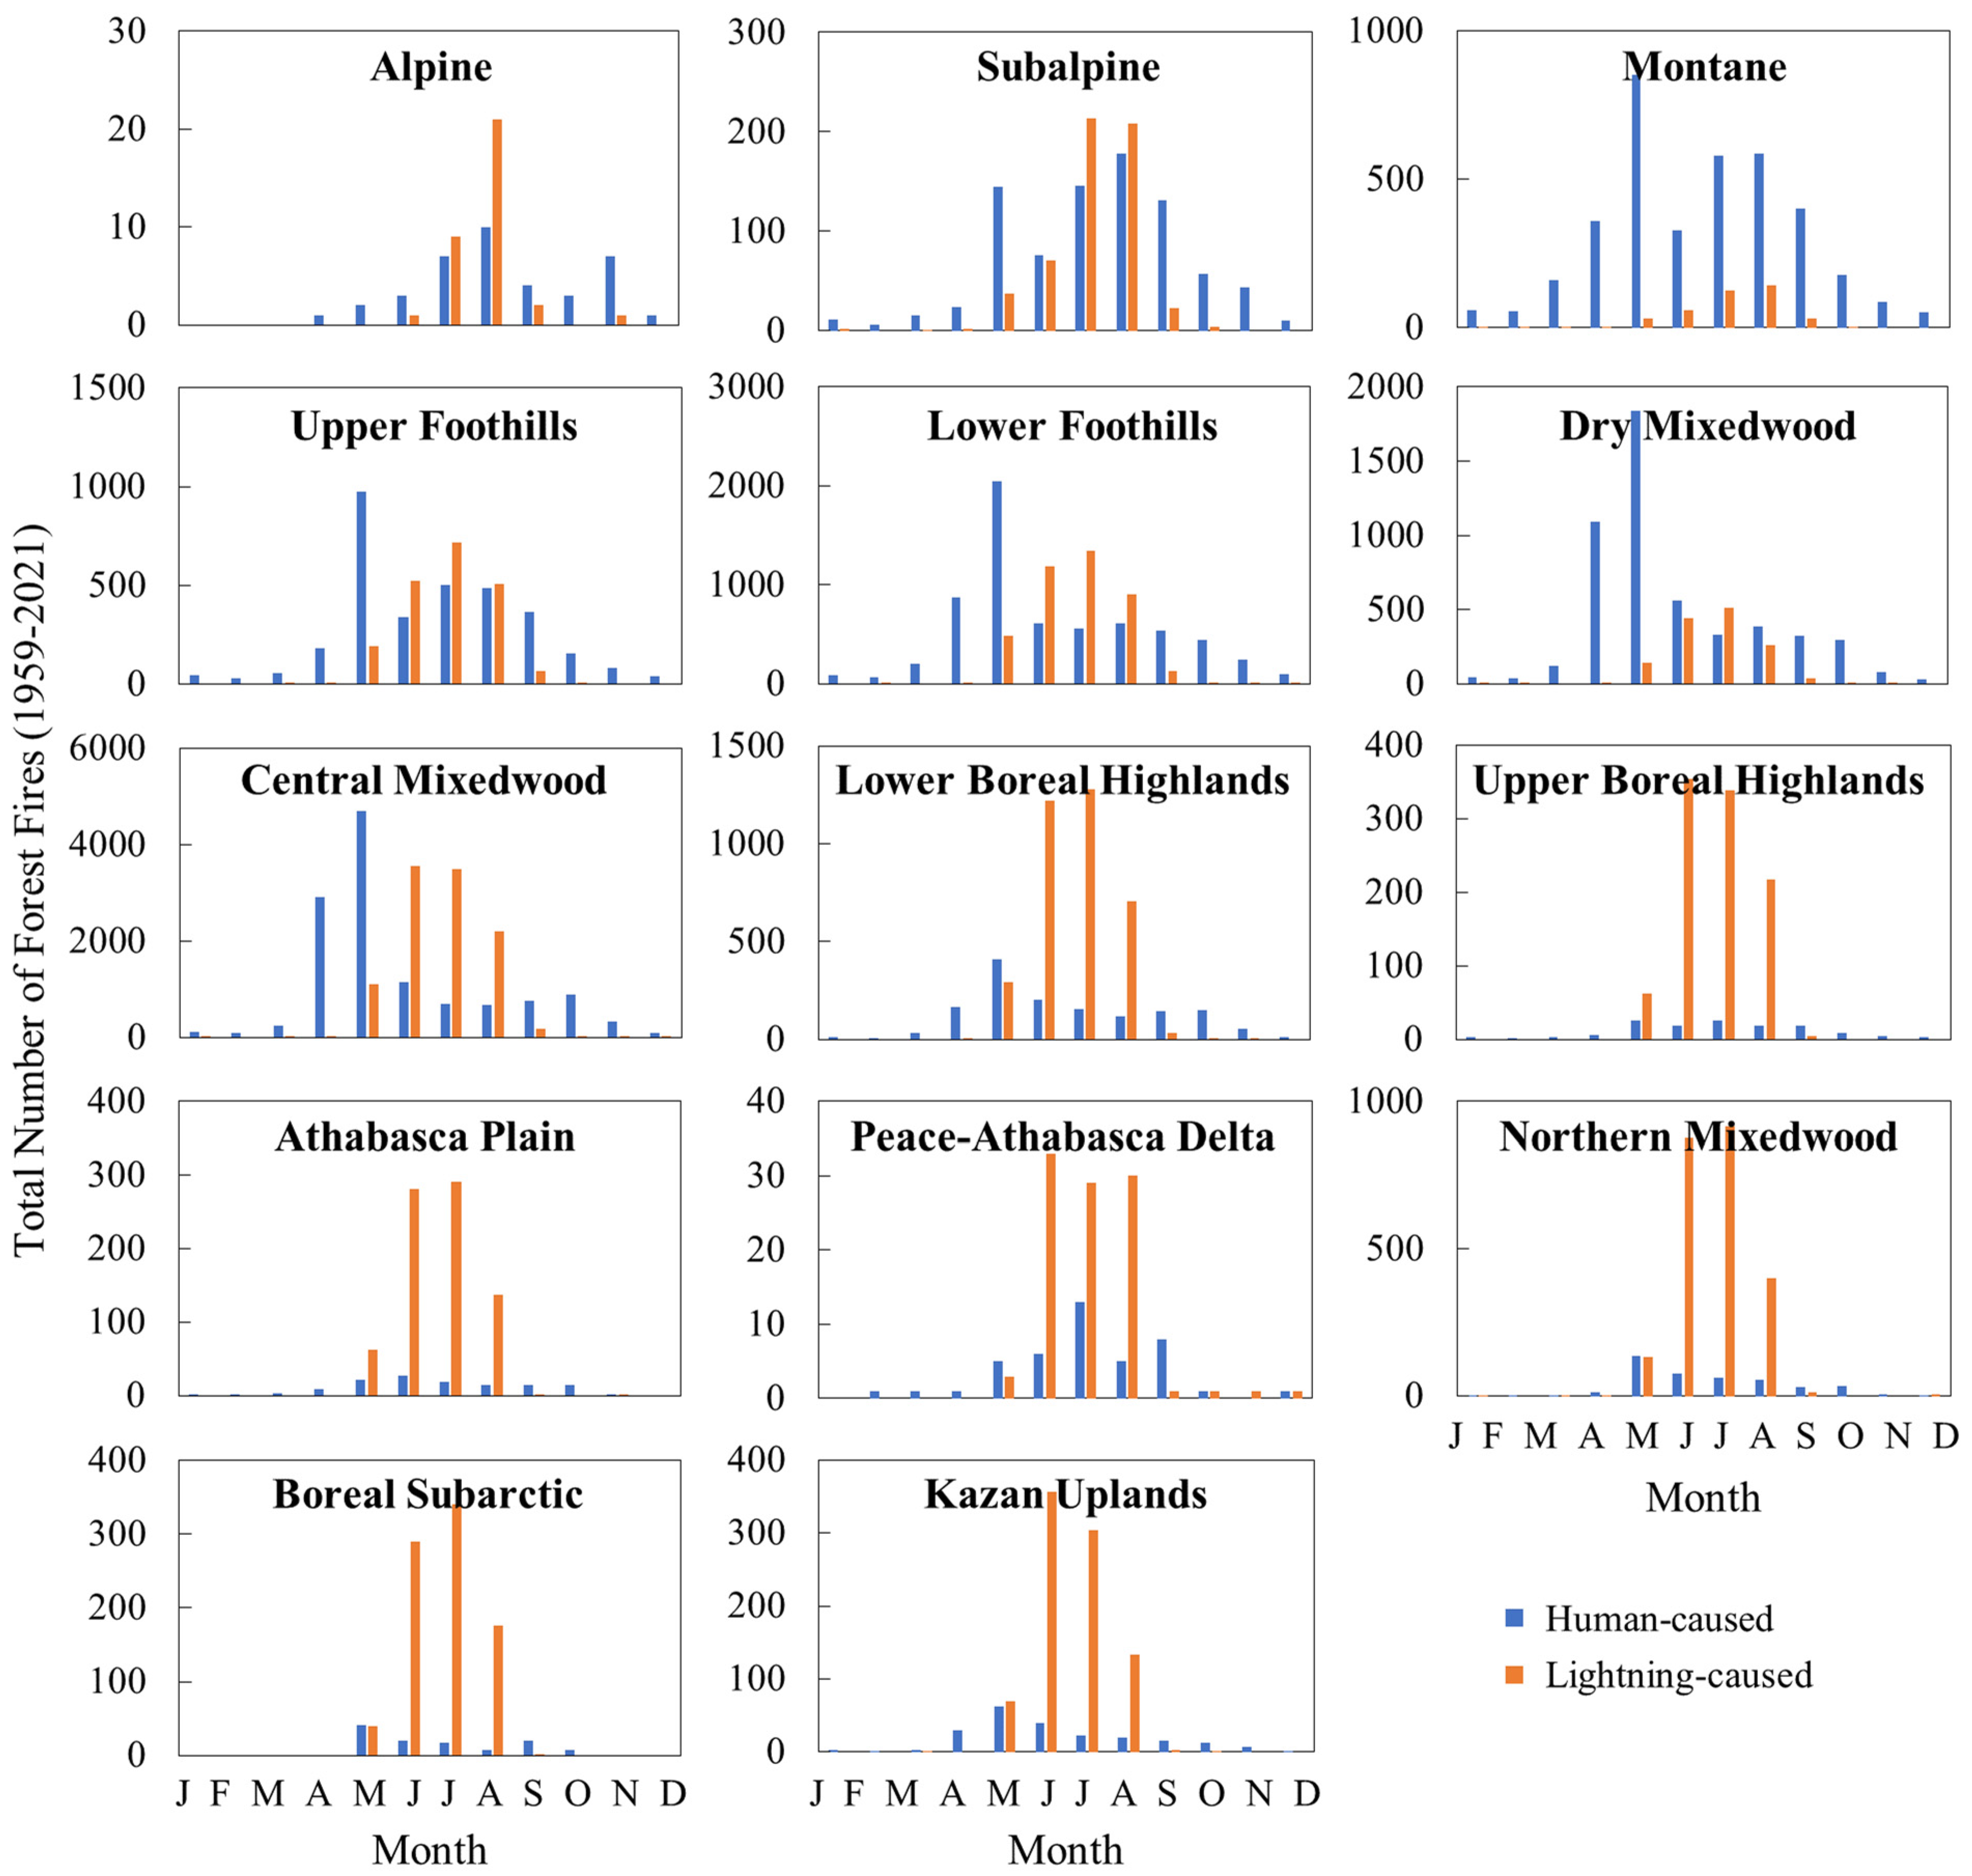
3.1.1. Forest Fire Occurrences

In general, human-caused fire occurrences were observed closer to anthropogenic features such as municipalities, communities, roads, railroads, campgrounds, and other structures and infrastructures. In terms of subregion, the highest number of all forest fires (36.72%) occurred in the Central Mixedwood with an average of about 378 fires each year (M ± SD = 377.8 ± 186.7) in Alberta over the period 1959–2021 (Table 1). Occurrences of human-caused fires (55%) were attributed more in compared to the lightning-caused fires (44%). The Central Mixedwood reported the highest human-caused fires (36.51%) among the subregions of Alberta, with an average of over 200 fires in each year (M ± SD = 200.4 ± 97.9). The Lower Foothills, Dry Mixedwood, and Montane subregions were the next with 18.42% (M ± SD = 101.1 ± 53.3), 14.84% (M ± SD = 81.5 ± 36.9), and 10.71% (M ± SD = 58.8 ± 47.3) of human-caused fires, respectively. In the case of lightning-caused fires, the Central Mixedwood was again attributed the highest (37.06%; M ± SD = 168 ± 116.6), followed by the Lower Foothills (14.23%; M ± SD = 64.5 ± 48.3), and Lower Boreal Highlands (12.39%; M ± SD = 56.1 ± 40.7). However, the highest density of the number of total fires by all-causes (4.80 per 1000 ha) and human-caused (4.22 per 1000 ha) were observed in Montane, and lightning-caused in the Upper Foothills (0.94 per 1000 ha). In general, human-caused fires in the subregions mostly occurred in the early months of the fire season (up to May), followed by the lightning-caused fires in the rest of season with the peak from June to August (Figure 3). The subregions of Grassland (Dry Mixedgrass, Mixedgrass, Northern Fescue, and Foothills Fescue) and Parkland (Foothills Parkland, Central Parkland, and Peace River Parkland) regions showed no to very small NOF (Table 1). Therefore, we did not either present these seven subregions in Figure 3 or further perform trend analysis of fire occurrences and area burned by them in our study.

3.1.2. Burned Area

Large fire numbers were about 2.2% (1404) of the total NOF (64,829) during 1959–2021, which were responsible for 98.3% (12.4 million ha) of the total 12.6 million ha burned area (BA) in Alberta (Table 2). Large fire BAs were 1.8 million ha human-caused (14.1%), 8.6 million ha (67.7%) lightning-caused, and the remaining other-caused. The highest percent (43.46%) of BA in Alberta was observed in the Central Mixedwood subregion, the average BA/year was 87.20 thousand ha (M ± SD = 87.20 ± 157.42). Here, for large fires, 53.01% BA was human-caused with an average of 14.14 thousand ha (M ± SD = 14.14 ± 51.45), and 36.99% BA was caused by lightning with an average of 16.56 thousand ha (M ± SD = 16.56 ± 52.79). In the case of small fires in the subregion, the highest 46.51 and 38.86% of BAs were attributed to human- and lightning-caused, with an average of 0.79 (M ± SD = 0.79 ± 0.60) and 0.63 thousand ha (M ± SD = 0.63 ± 0.51), respectively (Table 2). Because of zero to extremely low BA values for the seven subregions of Grassland (Dry Mixedgrass, Mixedgrass, Northern Fescue, and Foothills Fescue), and Parkland (Foothills Parkland, Central Parkland, and Peace River Parkland) regions (Table 2), we further performed BA trend analysis for the remaining 14 subregions only.

3.2. Trends

3.2.1. Monthly and Annual Fire Occurrences

We observed monthly significant increasing (positive) trends of fire occurrences in Alberta during 1959–2021, spread over March to October by different subregions (Table 3). Among the analyzed 14 subregions, except Alpine (A), the remaining showed significant increasing trends when considering combinations of temporal (monthly or annual), fire size (large or small), and cause of fire (human or lightning).
In the case of small fires (<200 ha) caused by humans, significant monthly increasing trends (95 and 99% confidences) were found in eight ecoregions (SA, M, UF, LF, DM, CM, LBH, and NM), at least for a month (Table 3). Montane (M) showed significant increasing trends for a continuous seven months (April to October), which was the highest, followed by the Upper Foothills (UF) with significant increasing trends over six months (April to September). Significant increasing trends were observed only in the Dry Mixedwood (DM) and Montane (M) at the start (March) and end (October) of the fire season, respectively. Central Mixedwood (CM) exhibited significant increasing trends from April to August, with the highest two magnitudes among the subregions in May (slope = 1.56 NOF/year) and April (slope = 1.1 NOF/year). UBH (Upper Boreal Highlands), AP (Athabasca Plain), PAD (Peace-Athabasca Delta), BS (Boreal Subarctic), and KU (Kazan Uplands) did not show any monthly significant trend, in which UBH, BS, and KU showed annual significant trends. Except for DM, AP, and PAD, all analyzed subregions indicated significant increasing annual trends. The highest annual rate of significant increase was observed in CM (3.68 NOF/year), followed by LF (1.56 NOF/year) and UF (1.41 NOF/year).
In the trend analysis of small fires (<200 ha) caused by lightning (Table 3), we found significant increasing trends in eight subregions, i.e., M (September), DM (June to August), CM (June to August), LBH (June and July), UBH (June), AP (June), NM (June and July), and KU (June). The most significant increasing trends were observed in seven subregions in June, followed by four subregions in July. In contrast, we noticed significant decreasing trends in two subregions in two months, i.e., UF in June (−0.12 NOF/year) and PAD in August (−0.02 NOF/year). However, no annual decreasing trend was found. The highest annual increase rate was in CM with 2.04 NOF/year. We did not find any significant trends of small fires caused by lightning in the first three months of the fire season, i.e., March to May.
Northern Mixedwood (NM) was the only subregion that experienced a significant monthly increasing trend (0.03 NOF/year at 99% significance) in June for the large lightning fires (≥200 ha), and the annual increasing trend rate of 0.05 NOF/year at the 95% significance.

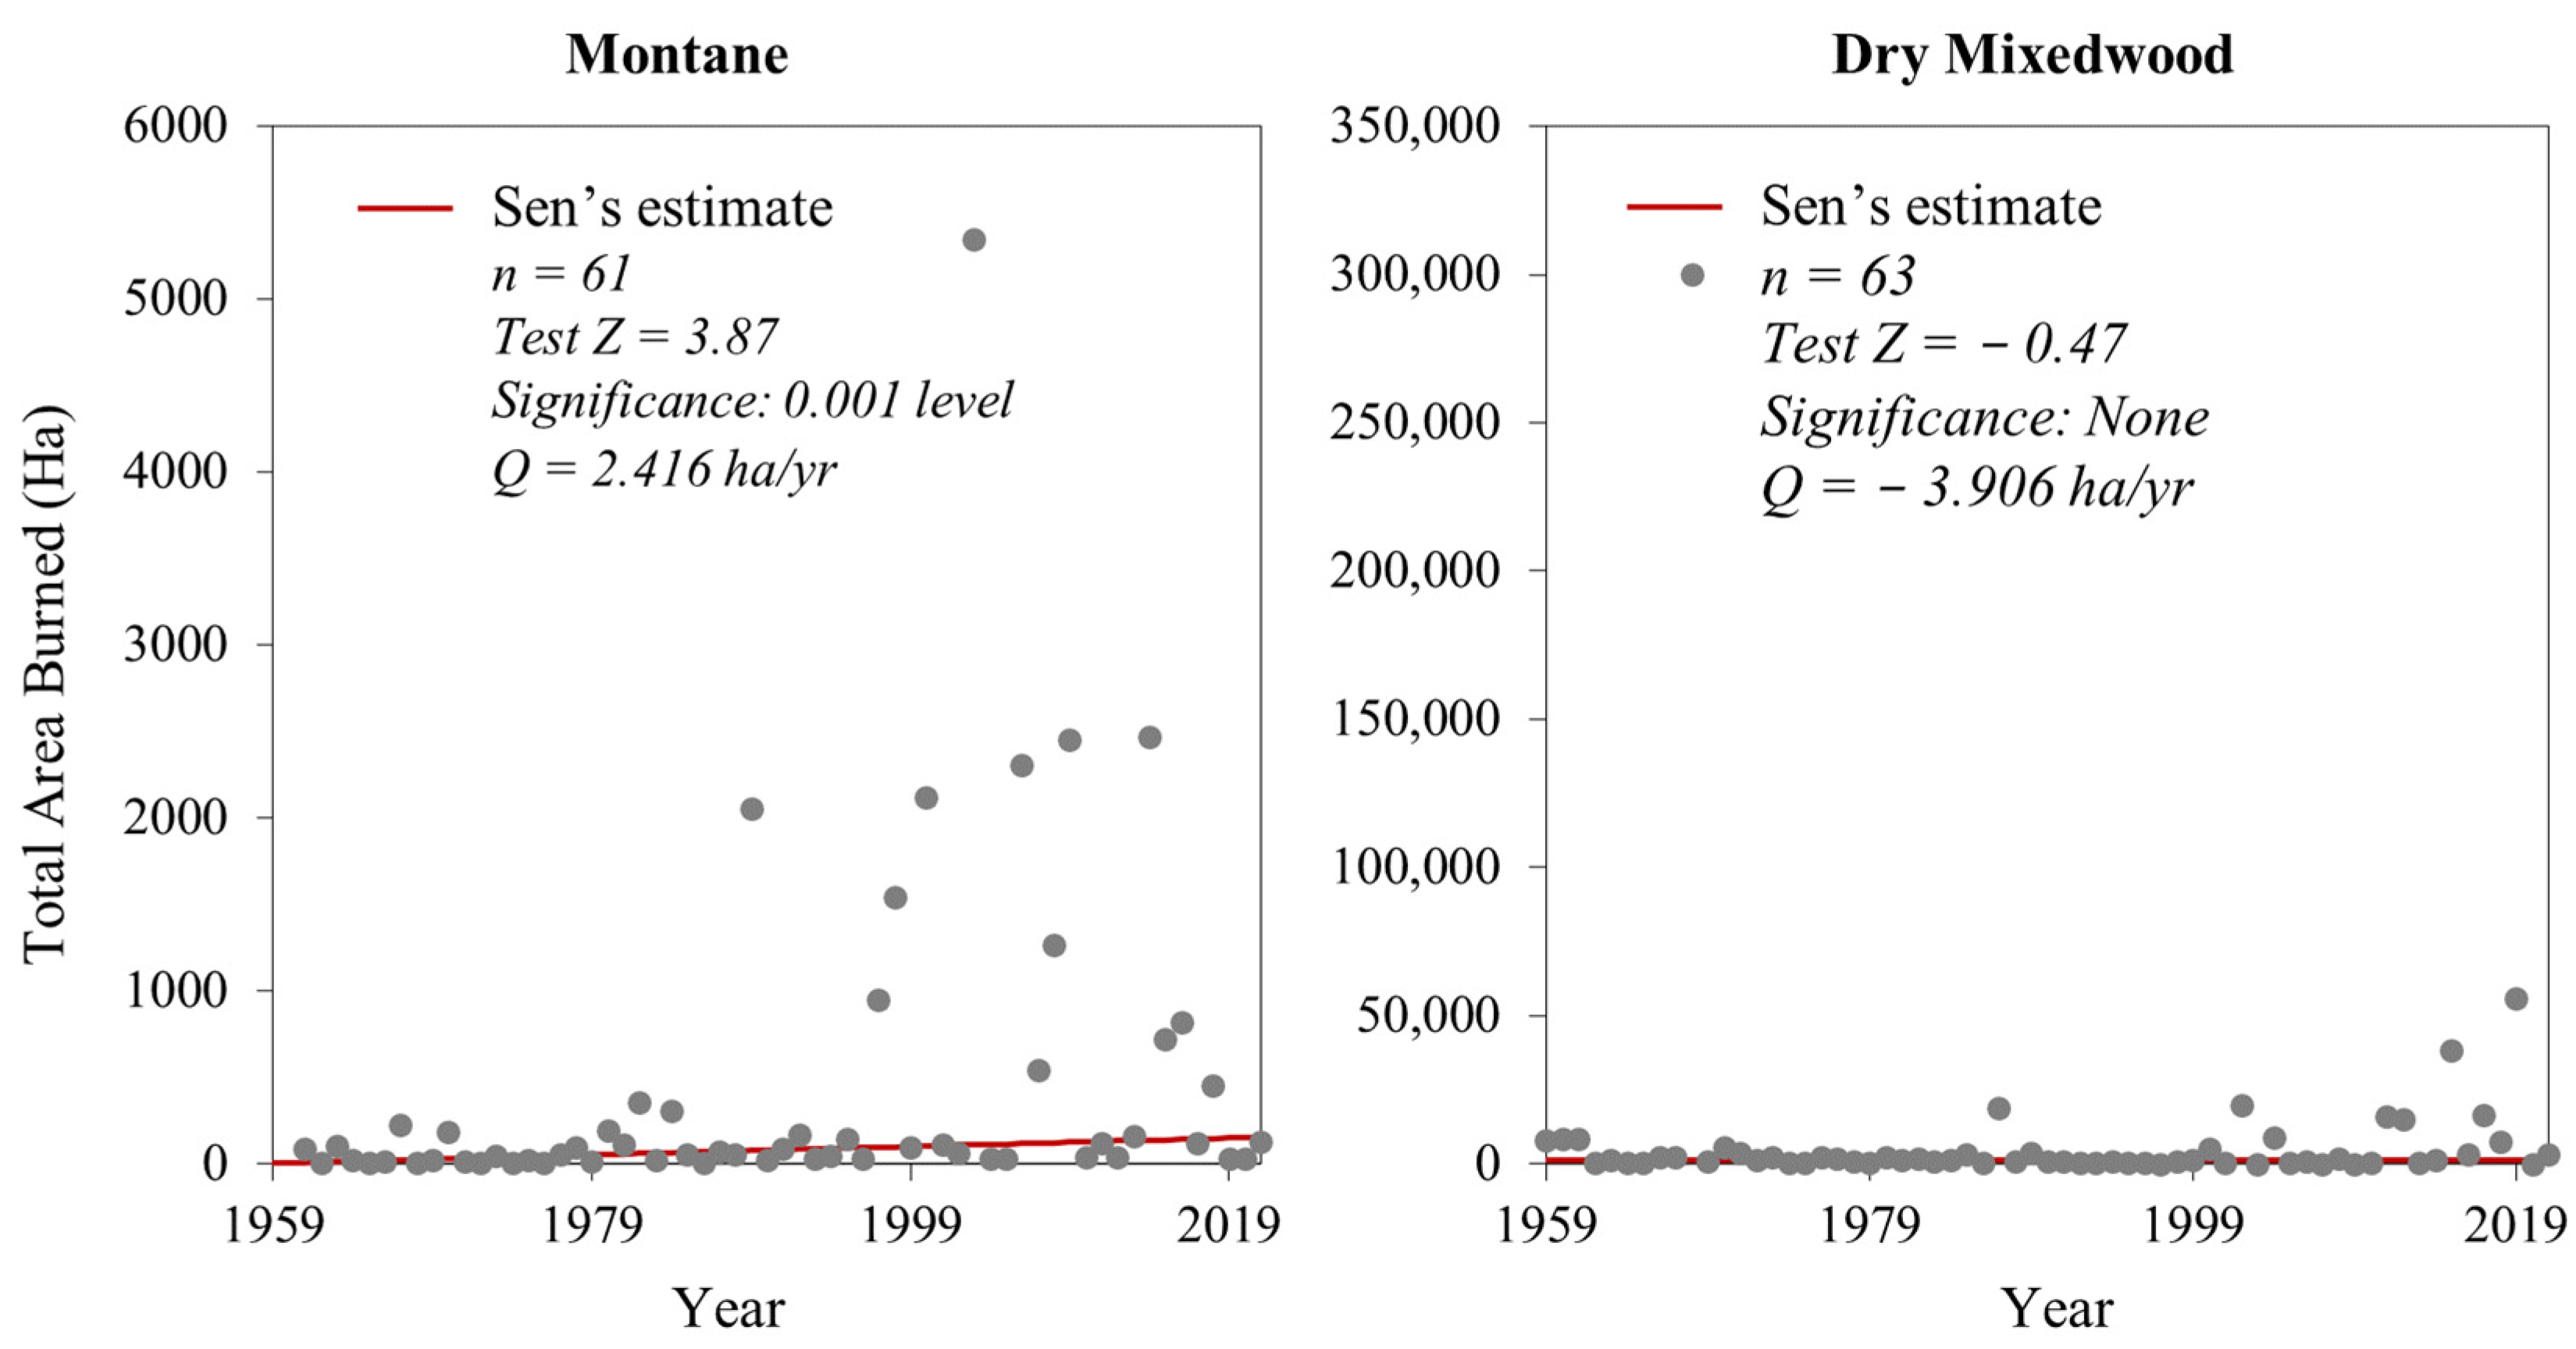
3.2.2. Monthly and Annual Area Burned

Nine ecoregions (SA, M, LF, DM, CM, LBH, AP, BS, and KU) exhibited significant (95% and 99% confidence levels) decreasing trends in the monthly burned area of small fires caused by humans, except a significant increasing trend (0.16 ha/year at 99% confidence) for LBH in May (Table 4). Here, the highest significant decreasing trend was observed in DM in May with a rate of 8.24 ha/year at 99% confidence. In the case of the annual trend, three ecoregions (M, UF, and LBH) showed significant increasing trends against the four ecoregions (A, LF, DM, and AP) with decreasing trends, the highest in DM (−14.83 ha/year).
In the case of monthly and annual significant trends of burned areas due to lightning-caused small fires (Table 4), five ecoregions (DM, CM, LBH, UBH, and NM) demonstrated increasing trends, with the highest areas in CM at 1.91 ha/year in July and 6.72 ha/year for annual. These five ecoregions also showed evidence of significant annual increases. In contrast, five ecoregions (SA, M, UF, LF, and AP) indicated monthly decreasing trends, all less than 0.8 ha/year, and A and UF ecoregions with small rates of annual decreasing (−0.01 and −0.1 ha/year). Interestingly, in the burned area from large lightning fire cases (Table 4), the monthly trend was found to increase significantly (549.29 ha/year) in May, but no annual trends were observed. Considering both human- and lightning-caused fires, an example of the trends in area burned for Montane and Dry Mixedwood subregions is shown in Figure 4.

3.2.3. Start and End Days, and Length of Fire Season

Five ecoregions (M, LBH, UBH, AP, and KU) exhibited significant early start dates (negative slopes from 0.4 to 1 day/year) of fire season corresponding to the trends of the 1st and 5th percentiles over the period 1959–2021, with the confidence levels of 95 and 99% (Figure 5a). In the reverse side, the trends of the 95th and 99th percentiles indicated that the end dates in three subregions (AP, BS, and KU) were significantly delayed (positive slopes) during 1959–2021 at the rate of 0.7 to 1.3 day/year (Figure 5a). Additionally, the length of the fire season was found to be significantly longer in three ecoregions (LBH, NM, and KU) when considering both the 1st/99th and 5th/95th percentiles, with the rates ranging from 1.1 to 1.7 day/year (Figure 5b). M and AP subregions also showed significantly longer season lengths with the rates of 1.3 and 1.4 day/year, respectively, when considering the 5th/95th percentile only (Figure 5b). An example of the trends in the length of the fire season for the Montane and Dry Mixedwood subregions is shown in Figure 6.

4. Discussion

4.1. Distribution of Fire Occurrences and Area Burned

Fire occurrences in Alberta were more prominent in the 14 subregions with forests, because trees are the fuel and a prime requirement of fire ignition and spreading. Therefore, due to the lack of forest (fuel) in the seven subregions of the Grassland and Parkland regions in the south and southeast of the province, we did not find any significant fire occurrences there during 1959–2021. In the 14 fire-prone subregions, human-caused fires occurred closer to the anthropogenic features and were related to the outdoor activities and campfires starting after the winter season. That is why we probably found the most human-caused fires in the early months of fire season, up to May. Coogan et al. [1] presented similar results for many ecoregions in Canada. Among the subregions in Alberta, the highest number of fire occurrences and areas burned were observed in the Central Mixedwood, probably because it is the largest subregion in Alberta (167,856 km2) with the highest coverage of forests (38.9% [48], mostly boreal forest). However, the highest density of historical fire occurrences in the Montane subregion with a smaller area coverage (1.2%, or 8768 km2) is likely related to the highest density of human-caused fires for being very close to the City of Calgary (the largest and the highest populated city in Alberta) and having the Banff National Park, a popular tourist attraction and the most visited tourist place in Alberta [49]. The Montane subregion is located in the southern part of Alberta, and an evaluation study of spatial and temporal patterns of the ignition locations of forest fires also indicated that the human-caused fires were highly concentrated in the southern parts during 2003–07 [50]. Human-caused fires usually occur from the human activities (mostly campfires) in the forests of Montane, and fire management agencies suppress them before they can burn a large area, considering the safety of the tourists. Thanks to the immediate and aggressive suppression actions that are usually possible due to having easy and close accessibility and management infrastructures in the area, this is likely the reason for finding a very small percentage (0.69% in Table 2) of human-caused large burned areas (≥200 ha) in the Montane subregion.

4.2. Trends in the Number of Fire Occurrences

The Alpine (A) is the only subregion in Alberta that did not show any significant monthly or annual increasing trend in the number of fire occurrences probably due to its cold and wet weather and the presence of very limited trees to no tree [34]. Alpine has the mean annual temperature of −2.4 °C with only 40 frost-free days/year, and the highest average elevations (among the subregions) of ~2350 m (range 1900–3650 m) [34,51]. Additionally, yearly significant warming trends in the land surface temperature due to ongoing climate change were not found in the literature for the subregion, except monthly significant warming trend in May during 2001–2020 [29].
The number of human-caused small fires showed increasing trends in most of the ecoregions probably due to the increasing human activities and tourist visits into the forests with the increasing population in Alberta [52]. Increasing trends in lightning-caused small fire occurrences in most of the subregions are following the projections of climate change that predict increased lightning activity to cause an increase in lightning-caused forest fires [53,54]. Increase in average temperature would probably be a cause of increasing lightning activities in Canada. A study showed a 317% increase in lightning-caused fires nationally (from 1959 to 2018) [1] with an increase in average temperature of 1.7 °C from 1948 to 2016 [55]. Such an increasing pattern of the temperature assists in decreasing soil and vegetation (fuel) moisture contents, and eventually producing more flammable fuels [3]. The combined effect of increasing drier fuels and lightning activities would, therefore, likely be responsible for increasing lightning ignitions and subsequent fire spread in the forests to further increase the number of lightning-caused fires. In contrast, more soil moisture in a subregion, i.e., more moisture contents in the wood and leaves of trees, makes it less susceptible to ignitions. This was evidenced in the Peace-Athabasca Delta (PAD) subregion by showing a significant decreasing monthly trend in August, and no significant yearly trends, not even in other months. The soil moisture is certainly greater in PAD, because of two large feeder water bodies, i.e., Lake Claire which comprises a major part of PAD, and the Athabasca Lake that shares a boundary with PAD.

4.3. Trends in Area Burned

Significant decreasing monthly trends in the burned area of most subregions, especially human-caused fires, may be attributed to intense fire management strategies and programs. The management programs aim to suppress forest fire immediately to save lives and properties [56]. Human-caused ignitions usually tend to occur in the wild (forest)–urban interface and in close vicinity of human activities, where immediate detection and initial attack to suppress forest fires may occur sooner than for the fires that occur in remote areas due to lightning [57,58,59]. It could be a reason that Central Mixedwood (CM), the largest subregion in Alberta with remote areas, showed a significant increasing trend in the burned area (May) related to large (≥200 ha) lightning-caused forest fires. Another study [2] supports this result that burned areas are increasing in most of western Canada. However, the long-term fire data (i.e., CNFDB) used in this study may have several data-quality-related issues, such as incomplete record keeping in earlier years and improved lightning detection systems in recent decades [1]. Additionally, the CNFDB might have reported more area burned for some fires in some earlier years due to perimeter mapping techniques used based on sketch mapping, point buffering from geographic coordinates, and digitization from a global positioning system unit [60]. Therefore, the decreasing trends observed in the subregions might have different results if all the fire perimeters of the time series used in this study were adjusted using the model-predicted estimates proposed in Skakun et al. [60]. Overall, the decreasing trends of burned area in many ecoregions are likely related to the forest fire suppression efforts and efficacy that have significantly improved in many parts of Canada [61,62,63].

4.4. Trends in Start and End Days and Length of Fire Season

Significant trends in the early start and delayed end of the fire season, and eventually a significant increasing trend in season length, were observed in some subregions of Alberta, which is aligned with national trends reported in the literature [2,17]. For example, Hanes et al. [2] found that the fire season started one week earlier and ended one week later in many parts of Canada from 1959 to 2015. However, we found an approximately one to two days earlier start and a one to two days delayed end in some subregions, forming a two to four day increase in the length of the fire season. Another study also reported that the lightning-caused fire season started significantly earlier and ended significantly later in Alberta for the number of lightning-caused fire occurrences from 1961 to 2003 [42]. Nevertheless, the early start of the fire season could be a reason for the warming trends observed in the subregions [29] that caused continuous declines in the duration of winter and an earlier onset of spring above-freezing temperatures in Alberta from 1950 to 2017 [64]. It has a direct impact on the workload of fire management agencies, even before they get prepared for the season. It could lead a greater number of escaped fires to burn large areas, because the higher fire load increases the probability that fire management agencies will not have enough resources to suppress all forest fires immediately through initial attacks [5].

5. Conclusions

In this study, we demonstrated the distribution and number of forest fire occurrences, burned areas, and seasonality, and their trends of human- and lightning-caused small and large fires over the period 1959–2021 in the 14 subregions of Alberta. We did not perform analysis for the remaining seven subregions under two regions, i.e., Grassland and Parkland, due to not considering them as forestland and having none to a very insignificant number of historical forest fire occurrences. The results showed that all analyzed subregions experienced significant increasing (positive) trends of fire occurrences, either monthly or yearly, except the Alpine subregion. However, in the case of burned areas, nine ecoregions exhibited significantly decreasing monthly trends for small fires caused by humans, except a significantly increasing trend for the Lower Boreal Highlands in May. In general, we found one to two days for both early start and delayed end of fire season, and subsequently two to four days longer fire season, in five ecoregions. These results would have an implication of proving the latest understanding of forest fire regimes in Alberta that would help fire management agencies to make strategic fire suppression plans to save lives, properties, and natural resources. The results of this study have some limitations, such as the fire database used in the analyses possibly having the limitation of providing a smaller number of historical fires and presenting more burned areas of some historical fires, and other methods might provide different values than the percentile method that we used for seasonality. Therefore, we suggest a careful evaluation before adopting the results for any application in the region. Following the observed trends of this study for forest fire regimes in Alberta, our further research could involve finding their relationships with historical trends of climate variables (e.g., temperate and precipitation), large-scale atmospheric oscillations, and growing degree days.

Author Contributions

Conceptualization, M.R.A. and Q.K.H.; methodology, M.R.A. and Q.K.H.; formal analysis, M.R.A.; writing—original draft preparation, M.R.A.; writing—review and editing, Q.K.H.; supervision, Q.K.H.; funding acquisition, Q.K.H. All authors have read and agreed to the published version of the manuscript.

Funding

This study was partially funded by a Discovery Grant from the Natural Sciences and Engineering Research Council of Canada to Q.K.H.

Data Availability Statement

Canadian National Fire Database (CNFDB) is freely available online https://cwfis.cfs.nrcan.gc.ca/ha/nfdb (accessed on 1 October 2022). Natural regions and subregion (2005) and provincial boundary of Alberta are publicly available online https://open.alberta.ca/opendata/ (accessed on 2 October 2022). All the analyzed data are presented in the manuscript in the forms of tables and figures.

Acknowledgments

We would like to thank the Government of Canada and the Government of Alberta to make the data available for this study.

Conflicts of Interest

The authors declare no conflict of interest.

References

  1. Coogan, S.C.P.; Cai, X.; Jain, P.; Flannigan, M.D. Seasonality and trends in human- and lightning-caused wildfires ≥ 2 ha in Canada, 1959–2018. Int. J. Wildl. Fire 2020, 29, 473–485. [Google Scholar] [CrossRef]
  2. Hanes, C.C.; Wang, X.; Jain, P.; Parisien, M.A.; Little, J.M.; Flannigan, M.D. Fire-regime changes in canada over the last half century. Can. J. For. Res. 2019, 49, 256–269. [Google Scholar] [CrossRef]
  3. Flannigan, M.D.; Wotton, B.M.; Marshall, G.A. Fuel moisture sensitivity to temperature and precipitation: Climate change implications. Clim. Change 2016, 134, 59–71. [Google Scholar] [CrossRef] [Green Version]
  4. Abatzoglou, J.T.; Williams, A.P. Impact of anthropogenic climate change on wildfire across western US forests. Proc. Natl. Acad. Sci. USA 2016, 113, 11770–11775. [Google Scholar] [CrossRef] [PubMed] [Green Version]
  5. Podur, J.; Wotton, M. Will climate change overwhelm fire management capacity? Ecol. Modell. 2010, 221, 1301–1309. [Google Scholar] [CrossRef]
  6. Wotton, B.M.; Nock, C.A.; Flannigan, M.D. Forest fire occurrence and climate change in Canada. Int. J. Wildl. Fire 2010, 19, 253–271. [Google Scholar] [CrossRef]
  7. Wotton, B.M.; Flannigan, M.D.; Marshall, G.A. Potential climate change impacts on fire intensity and key wildfire suppression thresholds in Canada. Environ. Res. Lett. 2017, 12, 095003. [Google Scholar] [CrossRef]
  8. Flannigan, M.D.; Krawchuk, M.A.; De Groot, W.J.; Wotton, B.M.; Gowman, L.M. Implications of changing climate for global wildland fire. Int. J. Wildland Fire 2009, 18, 483–507. [Google Scholar] [CrossRef]
  9. Gillett, N.P.; Weaver, A.J.; Zwiers, F.W.; Flannigan, M.D. Detecting the effect of climate change on Canadian forest fires. Geophys. Res. Lett. 2004, 31, L18211. [Google Scholar] [CrossRef] [Green Version]
  10. Parisien, M.A.; Miller, C.; Parks, S.A.; Delancey, E.R.; Robinne, F.N.; Flannigan, M.D. The spatially varying influence of humans on fire probability in North America. Environ. Res. Lett. 2016, 11, 075005. [Google Scholar] [CrossRef]
  11. Flannigan, M.D.; Amiro, B.D.; Logan, K.A.; Stocks, B.J.; Wotton, B.M. Forest fires and climate change in the 21ST century. Mitig. Adapt. Strateg. Glob. Chang. 2006, 11, 847–859. [Google Scholar] [CrossRef]
  12. Flannigan, M.; Cantin, A.S.; De Groot, W.J.; Wotton, M.; Newbery, A.; Gowman, L.M. Global wildland fire season severity in the 21st century. For. Ecol. Manag. 2013, 294, 54–61. [Google Scholar] [CrossRef]
  13. Natural Resources Canada Increases in Length of Fire Season will Affect Forest Ecosystems and Both Human Health and Safety. Available online: https://www.nrcan.gc.ca/climate-change/impacts-adaptations/climate-change-impacts-forests/forest-change-indicators/fire-weather/17776 (accessed on 2 January 2023).
  14. Flannigan, M.D.; Wotton, B.M. Climate, Weather, and Area Burned. In Forest Fires: Behavior and Ecological Effects; Johnson, E., Miyanishi, K., Eds.; Academic Press: Cambridge, MA, USA; Elsevier Inc.: San Diego, CA, USA, 2001; pp. 351–373. ISBN 978-0-12-386660-8. [Google Scholar]
  15. Abatzoglou, J.T.; Kolden, C.A. Relationships between climate and macroscale area burned in the western United States. Int. J. Wildl. Fire 2013, 22, 1003–1020. [Google Scholar] [CrossRef]
  16. Littell, J.S.; Mckenzie, D.; Peterson, D.L.; Westerling, A.L. Climate and wildfire area burned in western U.S. ecoprovinces, 1916–2003. Ecol. Appl. 2009, 19, 1003–1021. [Google Scholar] [CrossRef] [PubMed]
  17. Jain, P.; Wang, X.; Flannigan, M.D. Trend analysis of fire season length and extreme fire weather in North America between 1979 and 2015. Int. J. Wildl. Fire 2017, 26, 1009–1020. [Google Scholar] [CrossRef]
  18. Podur, J.J.; Martell, D.L. The influence of weather and fuel type on the fuel composition of the area burned by forest fires in Ontario, 1996–2006. Ecol. Appl. 2009, 19, 1246–1252. [Google Scholar] [CrossRef]
  19. Groffman, P.M.; Kareiva, P.; Carter, S.; Grimm, N.B.; Lawler, J.; Mack, M.; Matzek, V.; Tallis, H. Ecosystems, biodiversity, and ecosystem services. In Climate Change Impacts in the United States: The Third National Climate Assessment; Melillo, J.M., Richmond, T., Yohe, G.W., Eds.; U.S. Global Change Research Program: Washington, DC, USA, 2014; pp. 195–219. [Google Scholar]
  20. Gebeyehu, M.N.; Hirpo, F.H. Review on Effect of Climate Change on Forest Ecosystem. Int. J. Environ. Sci. Nat. Resour. 2019, 17, 126–129. [Google Scholar] [CrossRef]
  21. Pielke, R.A.; Pitman, A.; Niyogi, D.; Mahmood, R.; McAlpine, C.; Hossain, F.; Goldewijk, K.K.; Nair, U.; Betts, R.; Fall, S.; et al. Land use/land cover changes and climate: Modeling analysis and observational evidence. Wiley Interdiscip. Rev. Clim. Chang. 2011, 2, 828–850. [Google Scholar] [CrossRef]
  22. Arneth, A.; Harrison, S.P.; Zaehle, S.; Tsigaridis, K.; Menon, S.; Bartlein, P.J.; Feichter, J.; Korhola, A.; Kulmala, M.; O’Donnell, D.; et al. Terrestrial biogeochemical feedbacks in the climate system. Nat. Geosci. 2010, 3, 525–532. [Google Scholar] [CrossRef] [Green Version]
  23. Osunkoya, O.O.; Sheng, T.K.; Mahmud, N.A.; Damit, N. Variation in wood density, wood water content, stem growth and mortality among twenty-seven tree species in a tropical rainforest on Borneo Island. Austral Ecol. 2007, 32, 191–201. [Google Scholar] [CrossRef]
  24. Lawes, M.J.; Richards, A.; Dathe, J.; Midgley, J.J. Bark thickness determines fire resistance of selected tree species from fire-prone tropical savanna in north Australia. Plant Ecol. 2011, 212, 2057–2069. [Google Scholar] [CrossRef]
  25. Stevens, J.T.; Kling, M.M.; Schwilk, D.W.; Varner, J.M.; Kane, J.M. Biogeography of fire regimes in western U.S. conifer forests: A trait-based approach. Glob. Ecol. Biogeogr. 2020, 29, 944–955. [Google Scholar] [CrossRef]
  26. Fons, W.L. Analysis of fire spread in light forest fuels. J. Agric. Res. 1946, 72, 93–121. [Google Scholar]
  27. Sedano, F.; Randerson, J.T. Multi-scale influence of vapor pressure deficit on fire ignition and spread in boreal forest ecosystems. Biogeosciences 2014, 11, 3739–3755. [Google Scholar] [CrossRef] [Green Version]
  28. Kitzberger, T.; Aráoz, E.; Gowda, J.H.; Mermoz, M.; Morales, J.M. Decreases in Fire Spread Probability with Forest Age Promotes Alternative Community States, Reduced Resilience to Climate Variability and Large Fire Regime Shifts. Ecosystems 2012, 15, 97–112. [Google Scholar] [CrossRef]
  29. Hassan, Q.K.; Ejiagha, I.R.; Ahmed, M.R.; Gupta, A.; Rangelova, E.; Dewan, A. Remote sensing of local warming trend in Alberta, Canada during 2001–2020, and its relationship with large-scale atmospheric circulations. Remote Sens. 2021, 13, 3441. [Google Scholar] [CrossRef]
  30. Parisien, M.; Peters, V.S.; Wang, Y.; Little, J.M.; Bosch, E.M.; Stocks, B.J. Spatial patterns of forest fires in Canada, 1980–1999. Int. J. Wildl. Fire 2006, 15, 361–374. [Google Scholar] [CrossRef]
  31. Tymstra, C.; Wang, D.; Rogeay, M.-P. Alberta Wildfire Regime Analysis; Alberta Department of Sustainable Resource Development, Forest Protection Division, Wildfire Policy and Business Planning Branch: Banff, AB, Canada, 2005. [Google Scholar]
  32. Achuff, P.L. Natural Regions, Subregions and Natural History Themes of Alberta: A Classification for Protected Areas Management; Alberta Environmental Protection: Edmonton, AB, Canada, 1994.
  33. Adamowicz, W.L.; Burton, P.J. Sustainability and sustainable forest management. In Towards Sustainable Management of the Boreal Forest; Burton, P.J., Messier, C., Smith, D.W., Eds.; National Research Council: Ottawa, ON, Canada, 2003; pp. 41–64. ISBN 0-660-18762-0. [Google Scholar]
  34. Downing, D.J.; Pettapiece, W.W. Natural Regions Committee. In Natural Regions and Subregions of Alberta; Government of Alberta: Edmonton, AB, Canada, 2006. [Google Scholar]
  35. Ecological Stratification Working Group. A National Ecological Framework for Canada; Agriculture and Agri-Food Canada, Research Branch, Centre for Land and Biological Resources Research and Environment Canada, State of the Environment Directorate, Ecozone Analysis Branch: Ottawa/Hull, ON, Canada, 1995.
  36. Marshall, I.B.; Smith, S.C.A.; Selby, C.J. A national framework for monitoring and reporting on environmental sustainability in Canada. Environ. Monit. Assess. 1996, 39, 25–38. [Google Scholar] [CrossRef]
  37. Natural Resources Canada CWFIS (Canadian Wildland Fire Information System) Datamart. Available online: https://cwfis.cfs.nrcan.gc.ca/datamart (accessed on 1 October 2022).
  38. Government of Alberta Natural Regions and Subregions of Alberta. Available online: https://open.alberta.ca/opendata/gda-2f36921e-41e3-4cd8-813e-3333ea3c5983#summary (accessed on 2 October 2022).
  39. Government of Alberta Alberta Provincial Boundary. 2007. Available online: https://open.alberta.ca/opendata/gda-b4d9ba14-5429-42d5-992c-feae995dbf95 (accessed on 2 October 2022).
  40. Dennison, P.E.; Brewer, S.C.; Arnold, J.D.; Moritz, M.A. Large wildfire trends in the western United States, 1984–2011. Geophys. Res. Lett. 2014, 41, 2928–2933. [Google Scholar] [CrossRef]
  41. Balch, J.K.; Bradley, B.A.; Abatzoglou, J.T.; Chelsea Nagy, R.; Fusco, E.J.; Mahood, A.L. Human-started wildfires expand the fire niche across the United States. Proc. Natl. Acad. Sci. USA 2017, 114, 2946–2951. [Google Scholar] [CrossRef] [Green Version]
  42. Albert-Green, A.; Dean, C.B.; Martell, D.L.; Woolford, D.G. A methodology for investigating trends in changes in the timing of the fire season with applications to lightning-caused forest fires in Alberta and Ontario, Canada. Can. J. For. Res. 2013, 43, 39–45. [Google Scholar] [CrossRef]
  43. Salguero, J.; Li, J.; Farahmand, A.; Reager, J.T. Wildfire Trend Analysis over the Contiguous United States Using Remote Sensing Observations. Remote Sens. 2020, 12, 2565. [Google Scholar] [CrossRef]
  44. Mann, H.B. Nonparametric Tests Against Trend. Econometrica 1945, 13, 245–259. [Google Scholar] [CrossRef]
  45. Bevan, J.M.; Kendall, M.G. Rank Correlation Methods. Statistician 1971, 20, 74. [Google Scholar] [CrossRef]
  46. Kocsis, T.; Kovács-Székely, I.; Anda, A. Comparison of parametric and non-parametric time-series analysis methods on a long-term meteorological data set. Cent. Eur. Geol. 2017, 60, 316–332. [Google Scholar] [CrossRef] [Green Version]
  47. Sen, P.K. Estimates of the Regression Coefficient Based on Kendall’s Tau. J. Am. Stat. Assoc. 1968, 63, 1379–1389. [Google Scholar] [CrossRef]
  48. Ahmed, M.R.; Hassan, Q.K.; Abdollahi, M.; Gupta, A. Introducing a New Remote Sensing-Based Model for Forecasting Forest Fire Danger Conditions at a Four-Day Scale. Remote Sens. 2019, 11, 2101. [Google Scholar] [CrossRef] [Green Version]
  49. Law, L.; Law, M. 16 Top-Rated Tourist Attractions in Alberta. Available online: https://www.planetware.com/tourist-attractions-/alberta-cdn-ab-ab.htm (accessed on 9 January 2023).
  50. Wang, Y.; Anderson, K.R. An evaluation of spatial and temporal patterns of lightning- and human- caused forest fires in Alberta, Canada, 1980–2007. Int. J. Wildl. Fire 2010, 19, 1059–1072. [Google Scholar] [CrossRef]
  51. Alberta Parks. Natural Regions and Subregions of Alberta: A Framework for Alberta’s Parks; Alberta Tourism, Parks and Recreation: Edmonton, AB, Canada, 2015; ISBN 978-1-4601-1362-2.
  52. Ejiagha, I.R.; Ahmed, M.R.; Dewan, A.; Gupta, A.; Rangelova, E.; Hassan, Q.K. Urban Warming of the Two Most Populated Cities in the Canadian Province of Alberta, and Its Influencing Factors. Sensors 2022, 22, 2894. [Google Scholar] [CrossRef]
  53. Price, C.; Rind, D. The impacts of a 2 X CO2 climate on lightning-caused fires. J. Clim. 1994, 7, 1484–1494. [Google Scholar] [CrossRef]
  54. Romps, D.M.; Seeley, J.T.; Vollaro, D.; Molinari, J. Projected increase in lightning strikes in the United States due to global warming. Science 2014, 346, 851–854. [Google Scholar] [CrossRef] [PubMed]
  55. Bush, E.; Lemmen, D.S. (Eds.) Canada’s Changing Climate Report; Environment and Climate Change Canada, Government of Canada: Ottawa, ON, Canada, 2019.
  56. Tymstra, C.; Stocks, B.J.; Cai, X.; Flannigan, M.D. Wildfire management in Canada: Review, challenges and opportunities. Prog. Disaster Sci. 2019, 5, 100045. [Google Scholar] [CrossRef]
  57. Arienti, M.C.; Cumming, S.G.; Boutin, S. Empirical models of forest fire initial attack success probabilities: The effects of fuels, anthropogenic linear features, fire weather, and management. Can. J. For. Res. 2006, 36, 3155–3166. [Google Scholar] [CrossRef]
  58. Robinne, F.-N.; Parisien, M.-A.; Flannigan, M. Anthropogenic influence on wildfire activity in Alberta, Canada. Int. J. Wildl. Fire 2016, 25, 1131–1143. [Google Scholar] [CrossRef]
  59. Campos-Ruiz, R.; Parisien, M.A.; Flannigan, M.D. Temporal patterns of wildfire activity in areas of contrasting human influence in the Canadian boreal forest. Forests 2018, 9, 159. [Google Scholar] [CrossRef] [Green Version]
  60. Skakun, R.; Whitman, E.; Little, J.M.; Parisien, M.A. Area burned adjustments to historical wildland fires in Canada. Environ. Res. Lett. 2021, 16, 064014. [Google Scholar] [CrossRef]
  61. Stocks, B.J.; Mason, J.A.; Todd, J.B.; Bosch, E.M.; Wotton, B.M.; Amiro, B.D.; Flannigan, M.D.; Hirsch, K.G.; Logan, K.A.; Martell, D.L.; et al. Large forest fires in Canada, 1959–1997. J. Geophys. Res. Atmos. 2003, 108, 8149. [Google Scholar] [CrossRef]
  62. Cumming, S.G. Effective fire suppression in boreal forests. Can. J. For. Res. 2005, 35, 772–786. [Google Scholar] [CrossRef]
  63. Stocks, B.J.; Martell, D.L. Forest fire management expenditures in Canada: 1970–2013. For. Chron. 2016, 92, 298–306. [Google Scholar] [CrossRef] [Green Version]
  64. Newton, B.W.; Farjad, B.; Orwin, J.F. Spatial and temporal shifts in historic and future temperature and precipitation patterns related to snow accumulation and melt regimes in Alberta, Canada. Water 2021, 13, 1013. [Google Scholar] [CrossRef]
Figure 1. Study area showing the human- and lightning-caused forest fires in the natural subregions of Alberta during 1959–2021.
Fire 06 00096 g001
Figure 2. A schematic diagram of the methods of the study.
Fire 06 00096 g002
Figure 3. Distribution of human- and lightning-caused forest fires over the months (J = January, F = February, M = March, A = April, M = May, J = June, J = July, A = August, S = September, O = October, N = November, and D = December) of 1959–2021 in the 14 subregions.
Fire 06 00096 g003
Figure 4. An example of the yearly trends (Sen’s estimate) in area burned for the Montane and Dry Mixedwood subregions over the period 1959–2021.
Fire 06 00096 g004
Figure 5. Trends of the forest fire season in the natural subregions of Alberta over the period 1959–2021 with significance levels of 99% (*) and 95% (+). Slopes (day/year) of fire season start and end dates (a), and length (b) were determined using 1st and 99th, and 5th and 95th percentiles.
Fire 06 00096 g005
Figure 6. An example of the yearly trends (Sen’s estimate) in fire season length (1 and 99 percentiles) for the Montane and Dry Mixedwood subregions over the period 1959–2021.
Fire 06 00096 g006
Table 1. Total number (#), percent (%), density (D, per 1000 hectares—ha), and mean ± standard deviation (M ± SD) of forest fire occurrences by cause of initial ignition in the subregions of Alberta during 1959–2021. Here, human category includes both human (H) and human-prescribed burn (H-PB) causes.
SubregionArea
(1000 ha)
Human (H and H-PB)Lightning (L) OthersTotal
#%DM ± SD#%DM ± SD#%DM ± SD#%DM ± SD
Alpine1352.5410.120.030.7 ± 0.9360.130.020.6 ± 1.240.2400.1 ± 0.4810.120.051.3 ± 2
Subalpine1182.38452.440.3413.4 ± 9.85671.990.229 ± 9.4201.180.010.3 ± 0.614322.210.5722.7 ± 14.6
Montane16,785.6370410.714.2258.8 ± 47.34001.400.466.3 ± 5.61086.370.121.7 ± 2.142126.504.8066.9 ± 49.9
Upper Foothills8532.132449.381.5151.5 ± 5320197.070.9432 ± 23.51146.720.051.8 ± 2.353778.292.5085.3 ± 57
Lower Foothills1185.8636818.421.42101.1 ± 53.3406414.230.9164.5 ± 48.330618.040.074.9 ± 410,73816.562.39170.4 ± 83.1
Dry Mixedgrass5561.50000000020.1200 ± 0.22000 ± 0.2
Mixedgrass2951.30000000050.2900.1 ± 0.450.0100.1 ± 0.4
Northern Fescue553.5000000000000 ± 00000
Foothills Fescue971.980.020.010.1 ± 0.420.0100 ± 0.230.1800 ± 0.3130.020.010.2 ± 0.5
Foothills Parkland4489.9790.230.201.3 ± 1.220.010.010 ± 0.260.350.020.1 ± 0.3870.130.221.4 ± 1.4
Central Parkland2153.780.0200.1 ± 0.520.0100 ± 0.20000 ± 0100.0200.2 ± 0.6
Peace River Parkland4693.7230.070.070.4 ± 0.7100.040.030.2 ± 0.540.240.010.1 ± 0.4370.060.120.6 ± 1
Dry Mixedwood1362.3513314.840.6081.5 ± 36.914044.920.1622.3 ± 20.834320.220.045.4 ± 4.8688010.610.81109.2 ± 49.3
Central Mixedwood2007.212,62636.510.75200.4 ± 97.910,58337.060.63168 ± 116.659435.020.049.4 ± 7.523,80336.721.42377.8 ± 186.7
Lower Boreal Highlands1493.314584.220.2623.1 ± 18.9353712.390.6456.1 ± 40.7985.780.021.6 ± 2.350937.860.9280.8 ± 54.1
Upper Boreal Highlands5370.614560.390.112.1 ± 39773.420.8215.5 ± 11.5130.770.010.2 ± 0.411241.730.9517.8 ± 13.2
Athabasca Plain392.11250.360.092 ± 2.57752.710.5712.3 ± 9.9191.120.010.3 ± 0.79191.420.6814.6 ± 11.3
Peace-Athabasca Delta312430.120.080.7 ± 1.11000.350.181.6 ± 250.290.010.1 ± 0.31480.230.272.3 ± 2.6
Northern Mixedwood1508.44141.200.146.6 ± 7.323598.260.8037.4 ± 24.2231.360.010.4 ± 0.527964.310.9544.4 ± 28.8
Boreal Subarctic876.81120.320.091.8 ± 2.98492.970.7213.5 ± 11.710.0600 ± 0.19621.480.8115.3 ± 12.2
Kazan Uplands2521.82140.620.223.4 ± 3.18683.040.8913.8 ± 14.8281.650.030.4 ± 111101.711.1417.6 ± 16.3
TOTAL66,258.335,901 28,554 1696 64,829
Table 2. Total number of forest fire occurrences (#), total burned area (BA, in 1000 ha), percent of total BA (%), and mean ± standard deviation (M ± SD in thousand ha) by small and large forest fires caused by human and lightning in the subregions of Alberta during 1959–2021.
SubregionSmall (<200 ha)Large (≥200 ha)Total
(All Fires by All Causes)
HumanLightningHumanLightning
#BA%M ± SD#BA%M ± SD#BA%M ± SD#BA%M ± SD#BA%M ± SD
Alpine370.110.100.00 ± 0.01360.010.010.0 ± 0.00143.690.210 ± 000.000.000 ± 0813.810.030.06 ± 0.27
Subalpine8241.901.790.03 ± 0.065491.241.220.02 ± 0.052159.363.340.02 ± 0.101829.110.340 ± 0143291.610.721.45 ± 5.59
Montane36914.334.070.07 ± 0.073940.410.400.01 ± 0.031312.310.690.60 ± 2.5769.450.119.49 ± 41.17421226.710.210.42 ± 0.90
Upper Foothills32352.462.310.04 ± 0.0520072.222.190.04 ± 0.07918.021.011.40 ± 3.651238.810.453.81 ± 13.07537781.570.651.30 ± 3.79
Lower Foothills633110.9810.330.17 ± 0.2040186.486.400.10 ± 0.153795.945.405.21 ± 17.4746143.391.6813.96 ± 38.2810,738257.432.044.09 ± 9.21
Dry Mixedgrass0000 ± 00000 ± 00000 ± 000042.64 ± 86.8922.390.020.04 ± 0.26
Mixedgrass0000 ± 00000 ± 00000 ± 00000 ± 058.190.060.13 ± 0.842
Northern Fescue0000 ± 00000 ± 00000 ± 00000 ± 00000 ± 0
Foothills Fescue80.170.160.00 ± 0.022000 ± 00000.01 ± 0.090000 ± 0130.200.000.003 ± 0.02
Foothills Parkland750.600.570.01 ± 0.032000 ± 045.320.300 ± 00000 ± 0876.090.050.10 ± 0.35
Central Parkland50.020.020.0 ± 0.0022000 ± 039.180.520 ± 00000 ± 0109.200.070.15 ± 1.07
Peace River Parkland210.150.140.0 ± 0.019000 ± 020.770.040 ± 010.4200 ± 0371.340.010.02 ± 0.09
Dry Mixedwood504530.8429.010.49 ± 0.5013683.243.200.05 ± 0.0788363.4220.446.13 ± 23.5436110.321.290.003 ± 0.036880589.844.679.36 ± 38.33
Central Mixedwood12,46849.4446.510.79 ± 0.6010,25439.3838.860.63 ± 0.51158942.6453.0114.14 ± 51.453293164.6636.9916.56 ± 52.7923,8035493.8243.4687.20 ± 157.42
Lower Boreal Highlands14442.842.680.05 ± 0.07338512.3712.210.20 ± 0.181413.020.730.06 ± 0.171521470.7817.1931.04 ± 72.5150931505.5311.9123.90 ± 78.55
Upper Boreal Highlands1340.340.320.01 ± 0.029333.613.5657 ± 8300.000.000.03 ± 0.1244310.593.639.51 ± 57.421124314.582.494.99 ± 13.21
Athabasca Plain1230.230.220.00 ± 0.027304.714.650.08 ± 0.102225.6912.690.13 ± 0.70451003.8111.734.05 ± 28.729191282.0510.1420.35 ± 69.93
Peace-Athabasca Delta390.100.100.00 ± 0.01900.680.670.01 ± 0.03420.441.150.01 ± 0.071022.290.260.11 ± 0.5514874.790.591.19 ± 4.17
Northern Mixedwood4121.091.030.02 ± 0.04219917.6217.380.28 ± 0.2326.180.350.36 ± 2.281601335.7815.620.01 ± 0.1027961387.0210.9722.02 ± 46.54
Boreal Subarctic1120.250.230.00 ± 0.027725.925.850.09 ± 0.1200.000.000.13 ± 1.0277432.295.054.02 ± 17.68962438.463.476.96 ± 19.53
Kazan Uplands2110.440.420.01 ± 0.038113.453.400.06 ± 0.0832.210.120 ± 057482.695.640.28 ± 1.5111101066.978.4416.94 ± 76.13
TOTAL34,215106 27,561101 3641778 9938554 64,82912,642
Table 3. Significant trends of the number of monthly and annual (YR) fire occurrences during 1959–2021 in the natural subregions of Alberta. Slopes (NOF/year) at the significance levels of 99% (*) and 95% (+) are presented for large and small fires caused by human and lightning.
NSRMarAprMayJunJulAugSepOctYRJunJulAugSepYRJunYR
<200 ha: Human<200 ha: Lightning≥200 ha: Lightning
SA 0.08 * 0.22 *
M 0.14 *0.41 *0.06 +0.19 *0.19 *0.11 *0.03 +0.85 * 0.05 +
UF 0.04 +0.49 *0.12 *0.25 *0.25 *0.18 * 1.41 *−0.12 *
LF 0.14 +0.56 * 0.18 *0.25 *0.15 * 1.56 *
DM0.01 +0.28 * 0.18 *0.12 *0.07 + 0.51 *
CM 1.1 *1.56 *0.17 +0.1 +0.1 + 3.68 *0.87 *0.96 *0.21 + 2.04 *
LBH 0.21 *0.05 *0.06 * 0.64 *0.42 *0.35 * 0.64 *
UBH 0.09 *0.11 * 0.22 +
AP 0.09 * 0.17 *
PAD -0.02 +
NM 0.04 * 0.02 *0.04 + 0.11 *0.18 +0.22 * 0.59 *0.03 *0.05 +
BS 0.05 +
KU 0.04 +0.09 + 0.25 *
Table 4. Significant trends of the monthly and annual BA during 1959–2021 in the natural subregions of Alberta. Slopes (hectares/year) at the significance levels of 99% (*) and 95% (+) are presented for large and small fires caused by human and lightning.
NSRMayJunJulAugSepOctYRMayJunJulAugSepYRMay
<200 ha: Human<200 ha: Lightning≥200 ha: Lightning
A −0.01 + −0.01 +
SA−0.80 +−0.60 *−0.10 *−0.10 * −0.80 +−0.17 +−0.20 +
M −0.70 +−0.13 + 0.83 * −0.13 +
UF 0.51 *−0.25 *−0.19 * −0.12 + −0.1 +
LF−0.83 +−0.82 * −0.24 + −1.66 + −0.33 +−0.23 +
DM−8.24 *−0.52 *−0.15 *−0.74 *−0.46 +−0.22 +−14.83 * 0.12 + 0.41 +
CM −0.56 + 1.91 + 6.72 +549.29 +
LBH0.16 *−0.23 +−0.17 + 0.40 * 0.69 * 3.15 *
UBH 0.27 * 0.78 *
AP −0.60 + −0.02 + −0.18 +
NM 1.52 + 5.11 *
BS −0.40 +
KU −0.17 * −0.25 *
Disclaimer/Publisher’s Note: The statements, opinions and data contained in all publications are solely those of the individual author(s) and contributor(s) and not of MDPI and/or the editor(s). MDPI and/or the editor(s) disclaim responsibility for any injury to people or property resulting from any ideas, methods, instructions or products referred to in the content.

