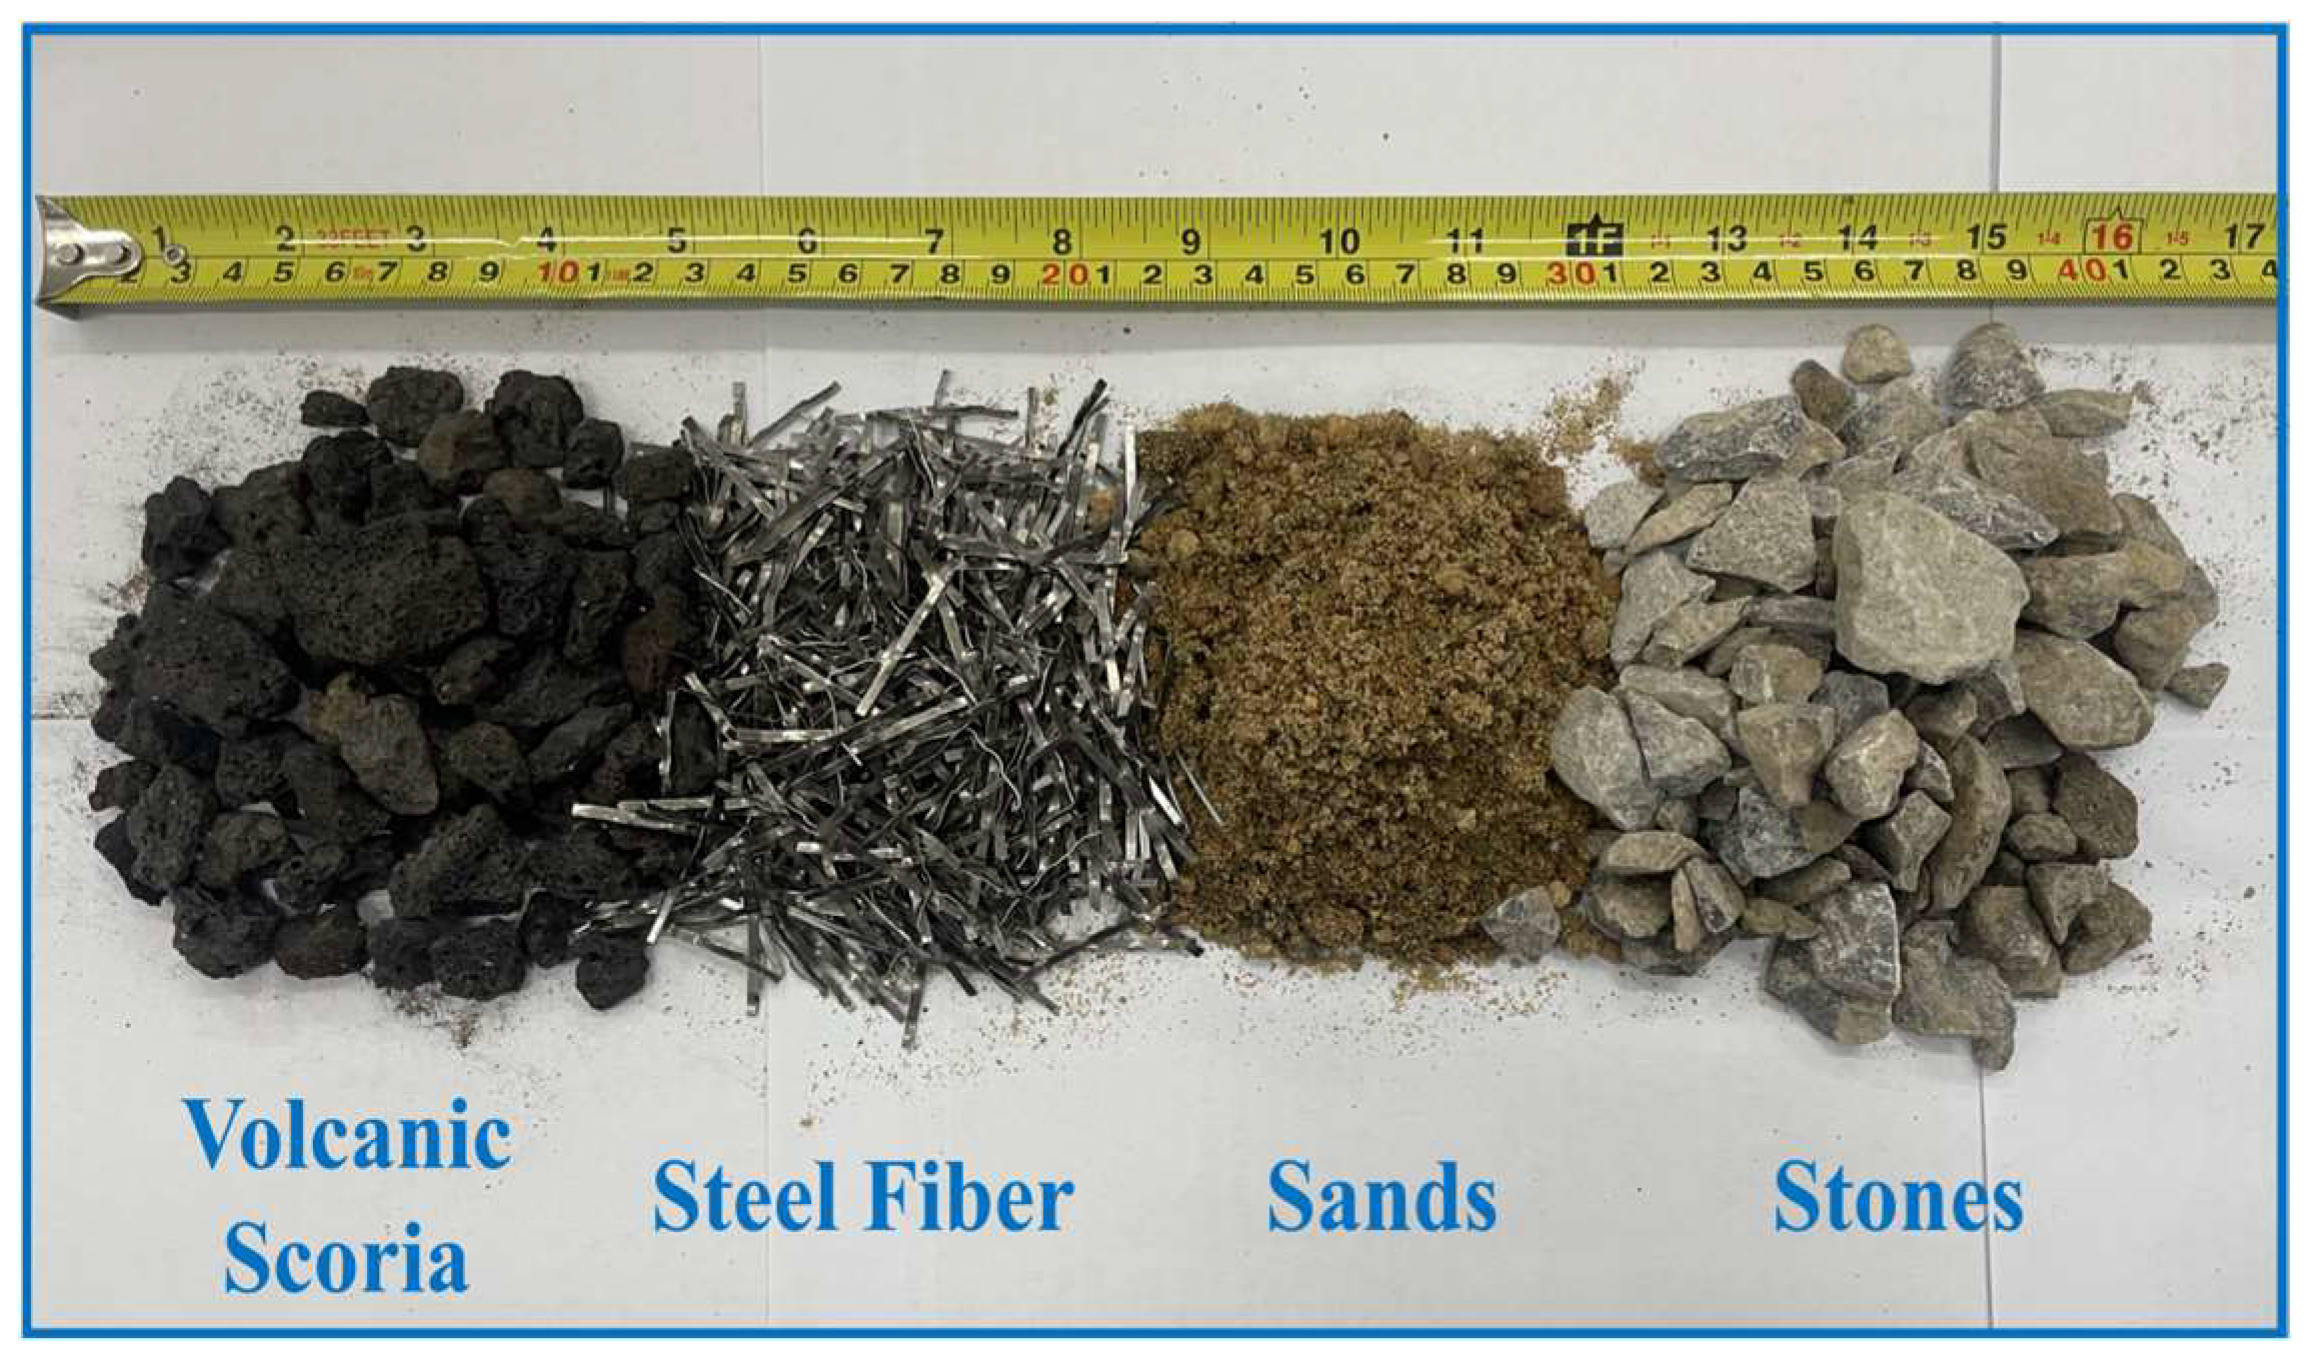
Article

Experimental Study on Steel-Fiber-Reinforced Scoria Aggregate Concrete Subjected to Freeze-Thaw Cycles and Then Exposure to Elevated Temperatures

1
School of Civil Engineering, Jilin Jianzhu University, Changchun 130118, China
2
Department of Engineering, School of Science and Technology, University of London, London EC1V 0HB, UK
*
Authors to whom correspondence should be addressed.
Fire 2023, 6(3), 119; https://doi.org/10.3390/fire6030119
Submission received: 13 February 2023 / Revised: 8 March 2023 / Accepted: 11 March 2023 / Published: 14 March 2023
(This article belongs to the Special Issue Structures in Fire: Focus on Steel and Composite Structures)

Abstract

:
Steel-fiber-reinforced scoria aggregate concrete (SFSAC), which contains scoria aggregate and steel fiber, was developed to reduce the environmental impacts and improve the energy efficiency of buildings. Experimental studies were performed. The test variables included steel fiber volume contents (0%, 0.5%, 1.0%, and 1.5%), freeze-thaw cycles (0 and 25 times), and temperature (20 °C, 200 °C, 400 °C, 600 °C, and 800 °C). Mass loss, relative dynamic elastic modulus, mechanical properties, and the variation pattern of the complete stress–strain curves were analyzed through rapid freeze-thaw, high-temperature, and mechanical tests. The test results showed that after 25 freeze-thaw cycles and then exposure to high temperatures, the surfaces of SFSAC specimens showed aggregate spalling accompanied by dense cracks. Moreover, the residual mechanical properties of steel-fiber-reinforced natural aggregate concrete (SFNAC) were better than those of natural aggregate concrete (NAC). Although the incorporation of steel fiber cannot significantly improve the anti-freezing performance of SFSAC, it can improve the residual mechanical properties of SFSAC, and the optimal amount of incorporation is 1%, considering the economic cost factors. The stress–strain curves of both SFSAC and SFNAC showed the same trend after freeze-thaw cycles and then high temperatures, i.e., the peak stress decreased, the peak strain increased, and the descending section tended to level off. Finally, based on the concrete damage mechanics theory, considering the role of steel fibers in the uniaxial compression process of scoria aggregate concrete (SAC) and the effect of freeze-thaw and high-temperature tests on the SFSAC, the mechanical damage model and the uniaxial compression stress–strain constitutive model were proposed as being able to highly accurately reflect the overall process damage characteristics of SFSAC after freeze-thaw and then high-temperature tests, and also provided a theoretical basis for the high-temperature resistance assessment of SFSAC structures in cold regions.

1. Introduction

Lightweight concrete (LWC) has been extensively researched as a structural and nonstructural building material due to its beneficial qualities, which include low density, superior thermal insulation, and fire resistance. However, compared with natural aggregate concrete, lightweight concrete has a lower load-bearing capacity, and the coarse and fine aggregates tend to float during the preparation process, which leads to a weak part at its top [1]. To minimize the disadvantages of lightweight concrete and to reduce its self-weight, the coarse aggregates can be partially replaced with light aggregates to obtain lightweight concrete [2,3]. Lightweight concrete has been used for over 50 years in the United States, Italy, and Sweden [3,4]. Its significant benefits include reduced dead loads [5], reduced thermal conductivity, and thermal and acoustic insulation [6,7]. Different types of lightweight aggregates, such as expanded clay and shale, pumice perlite, and various wastes, are used in concrete to make it lightweight [8,9,10]. For example, Bogas J A used natural lightweight volcanic scoria from the Azores to replace the crushed stone in normal concrete to prepare lightweight concrete and investigated the slag substitution rate’s effect on the concrete’s mechanical properties [11]. Hossain K M A and Klccedi A et al. reached similar conclusions through their experiments, i.e., the compressive strength of concrete was reduced by 30–68% when ordinary crushed stone aggregates were replaced by volcanic scoria aggregates at a volume admixture of approximately 50% [12,13]. In response to the above problems, many studies [14,15] have shown that using fibers in lightweight aggregate concrete is a suitable solution. For example, Campione G investigated the effect of steel fibers on the compressive strength of expanded clay light aggregate concrete under monotonic loading and cyclic loading and showed that the incorporation of steel fibers at 0.5%, 1%, and 2% by volume increased the compressive strength of the lightweight concrete by 22%, 29%, and 38% under monotonic loading and by 23%, 23%, and 41% under cyclic loading, respectively [16]. The steel-fiber-reinforced scoria aggregate concrete (SFSAC) employed in this study is a novel material that uses both steel fiber and scoria aggregate to reduce environmental impact and improve building energy efficiency.
In recent years, scholars have extensively investigated the material properties of lightweight concrete after exposure to high temperatures [17] or freeze-thaw cycles [18]. The results have shown that the performance of lightweight concrete after exposure is significantly degraded. Bin Cai investigated the mechanical properties of scoria aggregate concrete (SAC) after heating it to 800 °C. The test results showed that the damage mode of volcanic scoria concrete is greatly influenced by temperature. The strength reduction increases when the temperature exceeds 400 °C, and the strength reduction reaches 78% when the temperature reaches 800 °C [19]. In addition, Bin Cai and Wen-Li Hu developed a finite element model (FEM) and simulated the seismic behavior of SAC beam-column nodes to analyze the postfire seismic performance of SAC and to address the beam-column nodes accurately and efficiently. R Rahnavard conducted an experimental study of the fire resistance of four CF-CFS combination columns [20]. The test results showed that the main failure mode of the short square and rectangular CF-CFS combination columns was local and twisted buckling of the CFS members. Bin Cai and Ning Lv conducted four-point bending tests on volcanic scoria concrete beams (VSC) after being subjected to fire [21]. The test results showed that when subjected to fire for 90 min, the ultimate bearing capacity of VSC decreased by about 11% compared with that of beams at ambient temperature, and the ultimate bearing capacity of normal concrete beams under the same conditions decreased by about 17.5%.
The study’s results showed that nonlinear spring units representing scoria and natural aggregates could be used to simulate bond-slip behavior. The spring elements simulate the clamping curve well [22]. Rubén Serrano studied the performance of steel-fiber-modified concrete after exposure to high temperatures, and the test results showed that the concrete cooling rate after fire exposure is slowed after adding steel fibers and that concrete with PP fibers has lower strength than concrete with steel fibers at the same admixture and temperature (below 400 °C) [23]. Xiaoyong Zhang investigated the mechanical properties of steel-fiber-reinforced nano concrete (SFRNC) after high-temperature exposure and found that SFRNC incorporated with steel fibers could improve the mechanical properties of the specimens [24]. Dugenci studied the effect of high temperature on concrete with four steel fiber doses (0%, 0.5%, 1%, and 1.5%), and the test results showed that 1.0% steel fiber concrete had the lowest compressive strength loss [25]. L. Feo and F. Ascione studied the compressive strength of high-strength concrete after freeze-thaw cycles at different steel fiber admixtures, and the test results showed that the compressive strength of the concrete after the freeze-thaw cycles increased by 25% and 29% after adding 1.25% and 2.50% steel fibers, respectively [26]. Cesar Medina prepared recycled aggregate concrete with aggregates containing 20–25% ceramic sanitary ware industrial waste and explored its durability. The test results showed that the recycled aggregate contents was positively correlated with the frost resistance of the concrete [27].
However, in actual projects, concrete structures are not subjected to only a single influencing factor and may experience the combined effects of several factors. In cold regions, concrete structures such as roads and bridges continue to be subjected to freeze-thaw cycles after a fire. In addition to freeze-thaw damage, buildings of metallurgical and chemical enterprises, high-temperature flue gas chimneys, and other structures are also exposed to high temperatures. The internal temperature of a building can reach 200 °C~300 °C or even 500 °C~600 °C. Freeze-thaw cycles can degrade the mechanical properties and durability of concrete. For buildings that are exposed to fire, high-temperature safety performance is essential. Wu Y. studied the frost durability of ordinary concrete after high-temperature exposure through experiments. In contrast, few studies have been reported on the damage mechanism of lightweight concrete when subjected to high temperatures and freeze-thaw cycles [28]. In summary, studying the mechanical properties of steel-fiber-reinforced scoria concrete (SFSAC) after being subjected to freeze-thaw cycles and then exposure to high temperatures is essential for analyzing the fire response of fiber lightweight concrete structures after severe cold conditions and for post-disaster damage assessment and repair.
In this study, freeze-thaw and high-temperature tests were conducted on lightweight scoria aggregate concrete (volcanic scoria isovolumetric partial replacement of crushed stone) with four steel fiber admixtures (0%, 0.5%, 1.0%, and 1.5%) to investigate the freeze-thaw and high-temperature damage, mechanical property degradation, and stress–strain curve change law of SFSAC and to establish a mechanical property damage model under different steel fiber admixtures. A mechanical damage model and an SFSAC constitutive structure equation with different steel fiber dopings are proposed, which can provide a reference for the research and application of SFSAC after freeze-thaw cycles followed by high temperature damage.

2. Materials and Methods

2.1. Materials

The materials used to prepare test blocks are described in Table 1. Figure 1 shows the appearance of the volcanic scoria and steel fiber used for concrete preparation. The volcanic scoria used in the test was porous volcanic scoria from the Gushanzi Mine, Huinan County, Jilin Province, China. The chemical and mineral compositions of the volcanic scoria are listed in Table 2 and Table 3, respectively. The chemical composition of each component of the scoria aggregate sample was analyzed by X-ray fluorescence spectrometry to obtain the percentage of oxides, and mineral composition was analyzed using X-ray diffractometry. Figure 2 shows the grading curves of volcanic scoria aggregate.

2.2. Mix Proportion Design of the Specimens

Because the mechanical properties of lightweight concrete can be greatly reduced when the replacement rate of lightweight aggregate exceeds 50% [2], four groups of scoria aggregate concrete (SAC) test blocks and four groups of natural aggregate concrete (NAC) test blocks were designed in the experiment by replacing 40% of the crushed stone with an equal volume of volcanic scoria aggregate and adding steel fibers (0%, 0.5%, 1.0%, and 1.5% by volume). The designations and mixing ratios of the concrete test block groups are shown in Table 4. The numbers after “SAC” or “NAC” denote the volume of steel fibers added. For example, the SAC-1.5 test block group represents volcanic scoria concrete blended with steel fibers (SFSAC) at a volumetric ratio of 1.5%. Referring to GB/T50080-2002 [29], concrete specimens were created using second feeding and ready-mixed cement mortar (mortar stone wrapping method), and a total of 480 cubic blocks with dimensions of 100 mm × 100 mm × 100 mm and 240 prismatic blocks with dimensions of 100 mm × 100 mm × 300 mm were prepared.

2.3. Freeze-Thaw Cycle Testing of the Specimens

Freeze-thaw cycle tests were carried out on the concrete blocks according to the rapid freezing method of GB/T50082-2009 [30]. After 25 freeze-thaw cycles, the test blocks were removed to measure their mass and dynamic elastic modulus. The dynamic elastic modulus of the concrete was measured with a dynamic elastic modulus measuring instrument (HYT-DT-10W, Beijing Hangjian Huaye Science and Technology Development Co., Ltd., Beijing, China). Figure 3 shows the instrument of the freeze-thaw test.

2.4. Thermal Treatment of the Specimens

A combined resistance furnace with a heating rate of 10 °C/min was used for the elevated temperature tests, as shown in Figure 4. These tests were performed using a stepwise heating scheme. The initial furnace temperature was set to 20 °C. When the center temperature of the test block reached 100 °C, the furnace temperature was held for 30 min and then increased by 50 °C, followed by further increases to the target temperatures of 200 °C, 400 °C, 600 °C, and 800 °C sequentially. When the furnace temperature reached one of the target temperatures (200 °C, 400 °C, 600 °C, or 800 °C), it was held for 2 h so that thermal stability was achieved in the test block, after which the high-temperature furnace was turned off. The test block was cooled to room temperature in the furnace before being removed.

2.5. Loading Tests and Data Acquisition

Uniaxial compression tests and splitting tensile tests were carried out in accordance with GT50081-2019 [31] using a Type YAR-2000 electrohydraulic servo universal testing machine. The loading schemes of the uniaxial compression tests and splitting tensile tests are shown in Figure 5a and Figure 5b, respectively. The loading rates of the two tests were set to 5 kN/s and 0.6 kN/s, respectively. To obtain complete stress–strain curves in the axial compression tests, loading was applied with displacement control at a rate of 0.002 mm/s, which was adjusted to 0.001 mm/s when the peak load was reached. The data in Table 5 are the average values of the results from three strength tests.
The stress was read directly by a computer. The strain measurements were acquired using the digital image correlation (DIC) technique, as shown in Figure 6a,b. Compared with the traditional contact measurement method, DIC has the advantages of high accuracy, noncontact measurement, and no special-environmental requirements.

3. Results and Discussion

3.1. Observations of SFSAC after Freeze-Thaw Cycles and High-Temperature Exposure

Figure 7 shows the apparent condition of the SAC-1.0 test block after freeze-thaw cycles and then elevated-temperature exposure. The number before the letters “SAC” indicating the concrete type, represents the number of freeze-thaw cycles.
As shown in Figure 7, after 25 freeze-thaw cycles, the surface of SAC-1.0 became rough and uneven, and its mortar spalled to different degrees. Furthermore, after being subjected to a temperature of 200 °C following the freeze-thaw cycles, the surface of SAC-1.0 showed a small number of microcracks with small widths generated outwardly at the edge of the spalling mortar. As the temperature rose to 400 °C, the cement mortar on the surface of SAC-1.0 further spalled after the freeze-thaw cycles, and steel fibers and coarse aggregate were faintly visible.
With increasing temperature, surface degradation of the test blocks that did not undergo freeze-thaw cycles was mainly reflected in the formation, propagation, and development of cracks. In contrast, the surfaces of the test blocks that did undergo freeze-thaw cycles showed flaky or scaly spalling due to freeze-thaw damage prior to being subjected to elevated temperatures. These spalling areas were easily connected and penetrated each other, resulting in relatively fine and dense cracks on the surfaces of the test blocks that had undergone freeze-thaw cycles.

3.2. Freeze-Thaw Damage to SFSAC and SFNAC

Quantitatively evaluating the degree of freeze-thaw damage to concrete through observation in a comprehensive and objective manner is difficult. The mass loss rate and the relative dynamic elastic modulus loss are generally considered effective indicators for evaluating the degree of freeze-thaw damage. In this study, the mass loss rate of concrete blocks was calculated using Equation (1) by measuring the wet weight of 100 mm × 100 mm × 400 mm prismatic blocks, with the surface water wiped off before and after freeze-thaw cycles, and the relative dynamic elastic modulus of the concrete blocks after freeze-thaw cycles was calculated using Equation (2).
Δ W n = W 0 W n W 0 × 100 %
where ΔWn is the mass loss rate of the concrete specimen after n freeze-thaw cycles, W0 is the water-filled mass of the concrete specimen before any freeze-thaw cycles (g), and Wn is the mass of the concrete specimen after n freeze-thaw cycles (g).
P n = E fn E f 0 = T 0 2 T n 2
where Pn is the relative dynamic elastic modulus of the concrete specimen after n freeze-thaw cycles, Efn is the dynamic elastic modulus of the concrete specimen after n freeze-thaw cycles (GPa), Ef0 is the dynamic elastic modulus of the concrete specimen before any freeze-thaw cycles (GPa), Tn and T0 are the ultrasonic waves of the specimen after n and 0 freeze-thaw cycles (μs), respectively.
Figure 8a compares the mass loss rates of SFSAC and SFNAC with different steel fiber content after 25 freeze-thaw cycles. Regardless of the steel fiber contents, after 25 freeze-thaw cycles, the mass of the SFSAC did not decrease but rather increased, while that of the SFNAC showed a significant loss. Considering the appearance of the SFSAC after the freeze-thaw cycles, the increase in the SFSAC mass was probably due to the frost heave of capillary water stored in a large number of pores in the volcanic scoria aggregate during the alternation of positive and negative temperatures; as a result, the micro-cracks in the volcanic scoria aggregate and concrete matrix propagated and developed, thereby increasing the volume of the pores in the concrete matrix and enabling the concrete to draw a large amount of water, the mass of which was greater than the mass lost by the spalling of the outer mortar. In comparison, the ordinary crushed stone aggregate was not as rich a pore structure as the volcanic scoria. Therefore, with the same steel fiber content, the mass loss rate of the SFNAC was generally higher than that of the SFSAC.
Figure 8b compares the relative dynamic elastic modulus values of the SFSAC and SFNAC with different steel fiber contents after 25 freeze-thaw cycles. With the same steel fiber contents, after 25 freeze-thaw cycles, the relative dynamic elastic modulus of the SFNAC was slightly higher than that of the SFSAC. In addition, the relative dynamic elastic modulus values of the SFSAC and SFNAC increased slightly with increasing steel fiber contents, but the increase did not exceed 13%. When the steel fiber contents exceeded 1%, the relative dynamic elastic modulus values of the SFSAC and SFNAC decreased to different degrees, indicating that a small number of steel fibers slightly inhibited the development of cracks inside the SAC and NAC but that an excessive steel fiber content aggravated the damage inside the concrete that had undergone freeze-thaw cycles.

3.3. Cube Compressive Strength

The cube compressive strength values were derived from the failure loads obtained from the uniaxial compression tests and were calculated using Equation (3). Table 5 shows the cube compressive strengths of the test blocks obtained from the tests.
f cu = F A
where fcu is the concrete cube compressive strength (MPa), F is the test-block breaking load (N), and A is the test-block bearing area (mm2).
Figure 9a,b show the compressive strengths of the SFSAC and SFNAC, respectively, with different steel fiber contents after freeze-thaw cycles followed by elevated-temperature exposure. The cube compressive strengths of the SFSAC and SFNAC both decreased gradually with increasing temperature, and their cube compressive strengths decreased significantly more quickly when the temperature exceeded 400 °C.
Figure 10a,b show the relative compressive strengths of the SFSAC and SFNAC, respectively, with different steel fiber contents after freeze-thaw cycles and elevated-temperature exposure. After freeze-thaw cycling and exposure to a temperature of 800 °C, for steel fiber contents of 0%, 0.5%, 1.0%, and 1.5%, the compressive strength of the SFSAC decreased by 75%, 73.2%, 70.6%, and 68.7%, respectively. The compressive strength of the SFNAC decreased by 83.6%, 82.4%, 81.3%, and 80.9%, demonstrating that the compressive strengths of SAC and NAC could be improved to some extent by adding steel fibers. Still, the improvement was insignificant when the steel fiber content exceeded 1%. In summary, combined with the effect of steel fiber agglomeration on SFSAC compatibility and economic benefits, the optimal volume contents of steel fiber is 1% [25]. The residual axial compressive strengths of NAC are calculated by Euro code 1992-1-2 [32] at various temperatures. The decreasing trend of the relative compressive strength of SFSAC and SFNAC specimens subjected to 25 freeze-thaw cycles after being subjected to high temperature tends to be consistent with Euro code 1992-1-2. Since SFSAC and SFNAC are affected by freeze-thaw action in this paper, the residual compressive strengths of SFSAC and SFNAC are generally smaller than NAC (Euro code) in the range of 20 °C to 800 °C.
The compressive strengths of the test blocks with a steel fiber content of 1% are shown in Figure 11a. Regardless of the number of freeze-thaw cycles, after the temperature exceeded 400 °C, the strength of the SFNAC decreased rapidly. In contrast, the strength of the SFSAC decreased relatively slowly. The strength of the SFSAC was higher than that of the SFNAC, indicating that the addition of volcanic scoria aggregate improved the high-temperature resistance of the concrete.
As shown in Figure 11b, the test and fitted values of the SFSAC compressive strength after freeze-thaw cycles and then elevated-temperature exposure are in good agreement, indicating that the fitting formulas can satisfactorily predict the cube compressive strength of SFSAC after freeze-thaw cycles and elevated-temperature exposure. We choose the qualitative standard of the coefficient of determination R2 proposed to assess the regression coefficients in each graph. The R2 is calculated as Equation (4). Table 6 shows the fitting formulas for the cube compressive strengths of SFSAC with different steel fiber contents after freeze-thaw cycles and then elevated-temperature exposure. In Table 6, the coefficient of determination R2 is an indication of the degree of fit of the regression equation or regression curve to the test results. When R2 tends to 1, it indicates a good fit of the regression equation; when R2 tends to 0, it indicates a poor fit of the regression equation.
R 2 = 1 y i y 2 y i y ¯ 2
where y = f(xi) is the value of the function obtained by bringing xi into the regression equation, yi is the experimental result, and y ¯ is the average of the experimental results.

3.4. Cube Splitting Tensile Strength

The values of the cube splitting tensile strength were also derived from the failure loads obtained in the tests and were calculated by Equation (9). Table 7 shows the cube splitting tensile strengths of the tested blocks. The data in Table 7 are the average values of the results from three strength tests.
f Lpt = 2 F π A
where fLpt is the concrete splitting tensile strength (MPa), F is the test-block breaking load (N), and A is the test-block splitting surface area (mm2).
Figure 12a,b present the cube splitting tensile strengths of SAC and NAC with different steel fiber contents, respectively, after freeze-thaw cycles and then elevated-temperature exposure. The splitting tensile strengths of the SFSAC and SFNAC both decreased gradually with increasing temperature, and the rates of decrease in the splitting tensile strengths of the two began to increase to different degrees when the temperature exceeded 200 °C.
Figure 13a,b show the relative cube splitting tensile strengths of SFSAC and SFNAC, respectively, with different steel fiber contents after freeze-thaw cycles and then elevated temperature exposure. After 25 freeze-thaw cycles and then 800 °C exposure, the splitting strengths of SAC-0, SAC-0.5, SAC-1.0, and SAC-1.5 decreased by 75.2%, 71.7%, 68.5%, and 66%, respectively, and the splitting strengths of NAC-0, NAC-0.5, NAC-1.0, and NAC-1.5 decreased by 86.8%, 85%, 84.8%, and 84.7%, respectively. Therefore, the splitting strength loss of the SFSAC was smaller than that of the SFNAC, and the addition of steel fibers effectively improved the splitting tensile strengths of the SFSAC and SFNAC. In addition, the increase in tensile strength by steel fibers was lower when the steel fiber content exceeded 1%. In summary, combined with the effect of steel fiber agglomeration on SFSAC compatibility and economic benefits, the optimal volume contents of steel fiber is 1% [25]. Xiaoyong Zhang explored the splitting tensile strength of SFRNC under different steel fiber contents [24]. From Figure 13, the splitting tensile strength of SFSAC and SFNAC subjected to freeze-thaw action was significantly less than that of SFRNC after the temperature exceeded 400 °C. This indicates that the hydration products such as Ca(OH)2 in the SFSAC and SFNAC specimens that had experienced 25 freeze-thaw cycles began to decompose earlier when the temperature action was higher, resulting in a large degree of decay of the bond stress between the aggregates and the cement mortar, causing further damage to the integrity of the concrete.
Analysis of Figure 14a reveals that the splitting tensile strength of the SFNAC decreased more quickly than that of the SFSAC in the range of 400 °C to 800 °C, regardless of whether they had undergone freeze-thaw cycles. In addition, the splitting tensile strengths of SFSAC and SFNAC that had undergone freeze-thaw cycles decreased at a slower rate than those of SFSAC and SFNAC that had not undergone freeze-thaw cycles, indicating that the freeze-thaw cycles inhibited the reduction in the splitting tensile strength of the fiber-reinforced concrete with increasing temperature.
As shown in Figure 14b, the test and fitted values of the SFSAC splitting tensile strength after freeze-thaw cycles and then elevated-temperature exposure are in good agreement, indicating that the fitting formulas can satisfactorily predict the splitting tensile strength of SFSAC after freeze-thaw cycles and then elevated-temperature exposure. The R2 is also calculated as Equation (4). Table 8 shows the fitting formulas for the splitting tensile strength of SFSAC with different steel fiber contents after freeze-thaw cycles and then elevated-temperature exposure. The correlation coefficients R2 of regression Formulas (10)–(13) are 0.9957, 0.9982, 0.9989, and 0.9983, respectively.

3.5. Stress–Strain Relationship

3.5.1. Characteristic Indices

Table 9 and Table 10 show the two characteristic indices (elastic modulus Ec and peak strain εcp) of the stress–strain curves of different groups of test blocks with different steel fiber volume contents. The elastic modulus of the concrete was taken as the slope of the secant line from the point corresponding to the 40% peak stress (fc,r) in the ascending section of the stress–strain curve to the origin of the coordinate. The peak strain was taken as the strain corresponding to the axial stress at the peak of the stress–strain curve.
Figure 15a shows the elastic modulus values of SFSAC and SFNAC with steel fiber contents of 0% and 1%, respectively, after freeze-thaw cycles and then elevated-temperature exposure. Analysis of Table 9 and Figure 15a indicates that the elastic modulus values of SFSAC and SFNAC that had undergone freeze-thaw cycles and then elevated-temperature exposure were hardly influenced by the addition of steel fibers and decreased gradually with increasing temperature. Because the freeze-thaw cycles had similar weakening effects on the elastic moduli of test blocks with different steel fiber contents, the change in the elastic modulus under a steel fiber contents of 1% was selected for analysis, as shown in Figure 15b. After freeze-thaw cycles, as the fire temperature of SFSAC and SFNAC increased from 400 °C to 800 °C, the elastic moduli of SAC-1.0 and NAC-1.0 decreased by 21.1% and 28.9%, respectively. The elastic modulus of SFNAC decreased rapidly, indicating that adding the volcanic scoria aggregate effectively improved the high-temperature resistance of the concrete at a high fire temperature.
Figure 16a shows the variations in the peak strains of SFSAC and SFNAC with steel fiber contents of 0% and 1%, respectively, that had undergone freeze-thaw cycles with increasing temperature. Analysis of Table 9 and Figure 16a reveals that after 25 freeze-thaw cycles, the peak strains of the SFSAC and SFNAC both increased gradually with increasing temperature. When the temperature exceeded 400 °C, the peak strains of the two increased significantly because the strain difference between the aggregate and the cement mortar at elevated temperatures induced a small compressive stress in the mortar in the initial stage. As the temperature increased, the compressive stress gradually decreased and changed to high tensile stress, resulting in increases in the microcracks inside the test block. This thermal expansion incompatibility gradually became pronounced after the temperature exceeded 400 °C.
The peak strain corresponding to a steel fiber content of 1% is shown in Figure 16b. As the fire temperature of SFSAC and SFNAC that had undergone freeze-thaw cycles increased from 200 °C to 800 °C, the peak strains of SAC-1.0 and NAC-1.0 that had undergone freeze-thaw cycles increased by 37.3% and 26.6%, respectively, and the peak strains of SAC-1.0 and NAC-1.0 that had not undergone freeze-thaw cycles increased by 37.7% and 28.6%, respectively. After the temperature exceeded 200 °C, the peak strain of the SFSAC increased slowly compared with that of the SFNAC, and the peak strain of the SFSAC was always smaller than that of the SFNAC.

3.5.2. Compressive Stress–Strain Curve

Figure 17a,b show the stress–strain curves of SFSAC with steel fiber contents of 0% and 1%, respectively, that had not undergone freeze-thaw cycles and had been exposed to different temperatures. Figure 18a,b show the stress–strain curves of SAC-0 and SAC-1.0, which had undergone 25 freeze-thaw cycles and had been exposed to different temperatures. Figure 19a,b show the stress–strain curves of NAC-0 and NAC-1.0 that had not undergone freeze-thaw cycles and had been exposed to different temperatures. Figure 20a,b show the stress–strain curves of NAC with steel fiber contents of 0% and 1%, respectively, that had undergone 25 freeze-thaw cycles and had been exposed to different temperatures.
Figure 17, Figure 18, Figure 19 and Figure 20 illustrate that the SFSAC and SFNAC that had undergone 25 freeze-thaw cycles had a reduced peak stress, increased peak strain, and simultaneously decreased initial tangent modulus and peak secant modulus. These results occurred because the freeze-thaw cycles caused damage inside the concrete, which led to a decrease in concrete strength and resulted in a compaction effect in the concrete, decreased stiffness and increased strain. In addition, regardless of whether freeze-thaw cycles were conducted, as the temperature increased, the peak stress and the corresponding peak strain of the stress–strain curve of the test block with each steel fiber contents gradually increased, the descending section of the curve gradually became gentler, the ultimate strain gradually increased, and the curve tended to flatten overall.
Figure 21 shows the stress–strain curves of SAC-1.0 and NAC-1.0 that had undergone 25 freeze-thaw cycles and then 200 °C exposure, which demonstrates that after test blocks with the same steel fiber contents underwent the same number of freeze-thaw cycles and elevated temperature exposure, the slope of the ascending section of the SFSAC curve at the initial stage of loading was smaller than that of the SFNAC, and the peak stress decreased slightly. As the strain exceeded the peak strain, the curves of the test blocks made of volcanic scoria concrete declined more quickly, and SFSAC showed more pronounced brittleness.
Compared with test blocks that had not undergone freeze-thaw cycles, test blocks that had undergone freeze-thaw cycles experienced increases in peak strain and ultimate strain and a decrease in the area enclosed by the descending section and the horizontal axis, as shown in Figure 22, indicating that a “pseudoplastic” platform appeared in the test blocks after the freeze-thaw cycles and that the overall energy dissipation capacity of the concrete was reduced.
Figure 23 shows the stress–strain curves of SFSAC with various steel fiber contents after 25 freeze-thaw cycles. With increasing steel fiber content, the test blocks in each group exhibited two significant differences, i.e., the peak strain increased, and the descending section decreased at a slower rate because the steel fibers had little influence on the mechanical properties of the SFSAC in the initial stage of compression. However, in the crack development stage and the failure stage, the steel fibers effectively impeded the development of cracks within the SFSAC, provided restraints and improved the brittleness of the SAC.

3.6. Constitutive Model of SFSAC

A wealth of research results on the constitutive equations of ordinary concrete after elevated-temperature exposure or simulated freeze-thaw cycles are available [33,34]. Nonetheless, few studies have examined the uniaxial compressive constitutive relations of fiber volcanic scoria concrete after freeze-thaw cycles and then elevated-temperature exposure. In this study, with reference to the uniaxial compressive stress–strain relation model in GB50010-2010 [35], the stress–strain curve of SFSAC after freeze-thaw cycles and then high-temperature exposure is divided into ascending and descending sections. The parameters n and α in Equation (14) are the shape parameters related to the ascending and descending sections, respectively, of the stress–strain curve, and the stress–strain curve becomes steeper as n and α increase. The constitutive stress–strain equation and the parameters n and α are given in Equations (14) and (15), respectively. Table 11 shows the results of the regression fitting analysis for the stress–strain curves under different steel fiber contents.
y = n x n 1 + x n , x 1 y = x α ( x 1 ) 2 + x , x 1
where x = ε ε cp , y = σ f c,r
n = E c ε cp E c ε cp f c,r
Figure 24, Figure 25, Figure 26 and Figure 27 compares the experimental curve and its fit under each steel fiber content. The correlation coefficients R2 are all greater than 0.95 for the ascending sections of the curves, and the average correlation coefficient R2 is 0.946 for the descending sections. Comprehensively considering the correlation coefficients R2 of the ascending and descending sections of the fitted curves and Figure 24, Figure 25, Figure 26 and Figure 27 clearly reveals that the curves calculated by the constitutive stress–strain equation are in good agreement with the test curves, indicating that the established constitutive equation is able to accurately predict the full stress–strain curve from the tests.

4. Conclusions

According to the experimental results obtained in this study, the following conclusions are drawn regarding the cube compressive strength, cube splitting tensile strength, stress–strain curve and constitutive equation of SFSAC after freeze-thawing and then high-temperature exposure:
(1)
After only 25 freeze-thaw cycles, the surfaces of the SFSAC specimens showed a light degree of surface mortar peeling and fine aggregate dislodgement, while after the SFSAC specimens were subjected to both freeze-thaw cycles and high temperatures, the surfaces showed dense and fine cracks caused by connecting through in the peeled areas.
(2)
The incorporation of steel fibers did not significantly reduce the freeze-thaw damage to SAC, and the incorporation of steel fibers caused a small increase in the dynamic elastic modulus, but the increase was not more than 13%, which had little effect on the mass loss rate. The addition of air-entraining agents could be considered to further improve the freezing resistance.
(3)
After 25 freeze-thaw cycles, the mechanical properties of both SFSAC and SFNAC decayed with increasing temperature, but the decay characteristics were different. In particular, after the temperature exceeded 400 °C, the incorporation of the volcanic scoria aggregate had an enhancing effect on the mechanical properties of the concrete, which indicated that the advantages of SAC incorporated with volcanic scoria aggregate at a 40% substitution rate in freeze-thaw followed by high-temperature environments could not be ignored. In addition, the incorporation of steel fibers can improve the compressive strength and splitting tensile strength of SFSAC, and 1% incorporation is optimal.
(4)
Considering the effects of steel fiber admixtures on the compressive strength and splitting tensile strength of SFSAC after the dual action of freeze-thaw cycles and then high-temperature exposure, the fitting equations of the compressive strength and splitting tensile strength were established based on an analysis of experimental data, and the accuracy of each model was verified by the experimental results reported in this paper.
(5)
After experiencing freeze-thaw and then high-temperature effects, the stress–strain curves of SFSAC and SFNAC had basically the same characteristics, i.e., the peak stress decreased, the peak strain increased, the elastic modulus decreased significantly, and the decreasing section decreased more slowly with increasing temperature. In contrast, the curve of SFSAC was more affected by freeze-thaw cycles. In addition, the incorporation of steel fibers can improve the ductility of SAC after freeze-thaw cycling and improve the brittleness of SAC.
(6)
Based on the existing theoretical model of the concrete, a segmental stress-strain full-curve constitutive model was established by considering the characteristics of SFSAC, and the model fitting results were in good agreement with the test curves, which accurately described the deformation characteristics of SFSAC under a uniaxial compressive load with different steel fiber admixtures.

Author Contributions

Conceptualization, B.C. and F.F.; methodology, B.C. and F.F.; test, S.W. and W.D.; validation, S.W. and L.W.; investigation, W.D. and L.W.; resources, B.C.; data curation, W.D. and L.W.; writing—original draft preparation, S.W.; writing—review and editing, S.W.; visualization, B.C.; supervision, B.C.; project administration, B.C.; funding acquisition. All authors have read and agreed to the published version of the manuscript.

Funding

This research was funded by of Scientific research projects of education department of Jilin province, grant number JJKH20210279KJ, JJKH20200279KJ; China Scholarship Council, grant number 201805975002; and Jilin Provincial Science and Technology Development Plan Project, grant number 20220203082SF. The authors wish to acknowledge the sponsors. However, any opinions, findings, conclusions and recommendations presented in this paper are those of the authors and do not necessarily reflect the views of the sponsors.

Institutional Review Board Statement

Not applicable.

Informed Consent Statement

Not applicable.

Data Availability Statement

The data used to support the findings of this study are available from the authors upon request.

Conflicts of Interest

The authors declare that they have no competing interests.

References

  1. Zhang, X.; Zhang, S.; Fan, Y.; Ding, Y.; Wang, X.; Meng, E. The axial compressive behavior of stone-lightweight aggregate concrete-filled steel tubular stub columns. Constr. Build. Mater. 2021, 298, 123815. [Google Scholar] [CrossRef]
  2. Karthika, R.B.; Vidyapriya, V.; Sri, K.N.; Beaula KM, G.; Harini, R.; Sriram, M. Experimental study on lightweight concrete using pumice aggregate. Mater. Today Proc. 2021, 43, 1606–1613. [Google Scholar] [CrossRef]
  3. Bahsandy, A.A.; Eid, F.M.; Abdou, E.H. Lightweight concrete cast using Recycled aggregates. Int. J. Constr. Eng. Manag. 2017, 6, 35–45. [Google Scholar]
  4. Gerritse, A. Design considerations for reinforced lightweight concrete. Int. J. Cem. Compos. Lightweight Concr. 1981, 3, 57–69. [Google Scholar] [CrossRef]
  5. Cavalline, T.L.; Castrodale, R.W.; Freeman, C.; Wall, J. Impact of Lightweight Aggregate on Concrete Thermal Properties. ACI Mater. J. 2017, 114, 945–956. [Google Scholar] [CrossRef]
  6. Yun, T.S.; Jeong, Y.J.; Han, T.S.; Youm, K.S. Evaluation of thermal conductivity for thermally insulated concretes. Energy Build. 2013, 61, 125–132. [Google Scholar] [CrossRef]
  7. Miller, N.M.; Tehrani, F.M. Mechanical properties of rubberized lightweight aggregate concrete. Constr. Build. Mater. 2017, 147, 264–271. [Google Scholar] [CrossRef]
  8. Bogas, J.A.; De Brito, J.; Cabaço, J. Long-term behaviour of concrete produced with recycled lightweight expanded clay aggregate concrete. Constr. Build. Mater. 2014, 65, 470–479. [Google Scholar] [CrossRef]
  9. Libre, N.A.; Shekarchi, M.; Mahoutian, M.; Soroushian, P. Mechanical properties of hybrid fiber reinforced lightweight aggregate concrete made with natural pumice. Constr. Build. Mater. 2011, 25, 2458–2464. [Google Scholar] [CrossRef]
  10. Mo, K.H.; Mohd Anor, F.A.; Alengaram, U.J.; Jumaat, M.Z.; Rao, K.J. Properties of metakaolin-blended oil palm shell lightweight concrete. Eur. J. Environ. Civ. Eng. 2018, 22, 852–868. [Google Scholar] [CrossRef]
  11. Bogas, J.A.; Gomes, T. Mechanical and durability behaviour of structural lightweight concrete produced with volcanic scoria. Arab. J. Sci. Eng. 2015, 40, 705–717. [Google Scholar] [CrossRef]
  12. Hossain, K.M.A. Blended cement and lightweight concrete using scoria: Mix design, strength, durability and heat insulation characteristics. Int. J. Phys. Sci. 2006, 1, 5–16. [Google Scholar]
  13. Kılıc, A.; Teymen, A. The effects of scoria and pumice aggregates on the strengths and unit weights of lightweight concrete. Sci. Res. Essay 2009, 4, 961–965. [Google Scholar]
  14. Li, J.; Niu, J.; Wan, C.; Jin, B.; Yin, Y. Investigation on mechanical properties and microstructure of high performance polypropylene fiber reinforced lightweight aggregate concrete. Constr. Build. Mater. 2016, 118, 27–35. [Google Scholar] [CrossRef]
  15. Afroughsabet, V.; Ozbakkaloglu, T. Mechanical and durability properties of high-strength concrete containing steel and polypropylene fibers. Constr. Build. Mater. 2015, 94, 73–82. [Google Scholar] [CrossRef]
  16. Campione, G.; Cucchiara, C.; La Mendola, L.; Papia, M. Steel–concrete bond in lightweight fiber reinforced concrete under monotonic and cyclic actions. Eng. Struct. 2005, 27, 881–890. [Google Scholar] [CrossRef]
  17. Liu, Y.; Wang, W.; Chen, Y.F.; Ji, H. Residual stress-strain relationship for thermal insulation concrete with recycled aggregate after high temperature exposure. Constr. Build. Mater. 2016, 129, 37–47. [Google Scholar] [CrossRef]
  18. Qiu, J.; Zhou, Y.; Vatin, N.I.; Guan, X.; Sultanov, S.; Khemarak, K. Damage constitutive model of coal gangue concrete under freeze-thaw cycles. Constr. Build. Mater. 2020, 264, 120720. [Google Scholar] [CrossRef]
  19. Cai, B.; Tao, Y.; Fu, F. Residual Stress-Strain Relationship of Scoria Aggregate Concrete with the Addition of PP Fiber after Fire Exposure. Fire 2021, 4, 91. [Google Scholar] [CrossRef]
  20. Rahnavard, R.; Craveiro, H.D.; Simoes, R.A.; Laím, L.; Santiago, A. Fire resistance of concrete-filled cold-formed steel (CF-CFS) built-up short columns. J. Build. Eng. 2022, 48, 103854. [Google Scholar] [CrossRef]
  21. Cai, B.; Lv, N.; Fu, F. Flexural Performance of Polypropylene Fiber Reinforced Scoria Aggregate Concrete Beams after Exposure to Elevated Temperatures. J. Perform. Constr. Facil. 2022, 36, 04022015. [Google Scholar] [CrossRef]
  22. Cai, B.; Hu, W.-L.; Fu, F. Numerical Analysis of Seismic Performances of Post-Fire Scoria Aggregate Concrete Beam-Column Joints. Fire 2021, 4, 70. [Google Scholar] [CrossRef]
  23. Serrano, R.; Cobo, A.; Prieto, M.I.; González, M.D.L.N. Analysis of fire resistance of concrete with polypropylene or steel fibers. Constr. Build. Mater. 2016, 122, 302–309. [Google Scholar] [CrossRef] [Green Version]
  24. Zhang, X.; Lin, X.; Chen, Y. Study on mechanical properties of steel fiber reinforced nano-concrete (SFRNC) after elevated temperature. Compos. Struct. 2021, 268, 113941. [Google Scholar] [CrossRef]
  25. Düğenci, O.; Haktanir, T.; Altun, F. Experimental research for the effect of high temperature on the mechanical properties of steel fiber-reinforced concrete. Constr. Build. Mater. 2015, 75, 82–88. [Google Scholar] [CrossRef]
  26. Feo, L.; Ascione, F.; Penna, R.; Lau, D.; Lamberti, M. An experimental investigation on freezing and thawing durability of high performance fiber reinforced concrete (HPFRC). Compos. Struct. 2020, 234, 111673. [Google Scholar] [CrossRef]
  27. Medina, C.; de Rojas, M.I.S.; Frías, M. Freeze-thaw durability of recycled concrete containing ceramic aggregate. J. Clean. Prod. 2013, 40, 151–160. [Google Scholar] [CrossRef]
  28. Wu, Y.; Wu, B. Residual compressive strength and freeze–thaw resistance of ordinary concrete after high temperature. Constr. Build. Mater. 2014, 54, 596–604. [Google Scholar] [CrossRef]
  29. GB/T 50080-2002; Standard for Ordinary Concrete Mix Performance Test Method. China Architecture Building Press: Beijing, China, 2002.
  30. GB/T 50082-2009; Standard for Test Metgod of Long-Term Performance and Durability of Ordinary Concrete. China Architecture Building Press: Beijing, China, 2009.
  31. GT 50081-2019; Standard for Test Metgod of Concrete Physical and Mechanical Properties. China Architecture Building Press: Beijing, China, 2019.
  32. EN1994-1-2; Eurocode 4, Design of Composite Steel and Concrete Structures, Part 1–2, General Rules—Structure Fire Design. European Committee for Standardization: Bruxelles, Belgium, 2005.
  33. Shafigh, P.; Mahmud, H.; Jumaat, M.Z. Effect of steel fiber on the mechanical properties of oil palm shell lightweight concrete. Mater. Des. 2011, 32, 3926–3932. [Google Scholar] [CrossRef]
  34. Lie, T.T.; Erwin, R.J. Method to calculate the fire resistance of reinforced concrete columns with rectangular cross section. ACI Struct. J. 1993, 90, 52–60. [Google Scholar]
  35. GB 50010-2010; Technical Specification for Concrete Structure. China Architecture Building Press: Beijing, China, 2015.
Figure 1. Materials.
Fire 06 00119 g001
Figure 2. Grading curves of volcanic scoria aggregate.
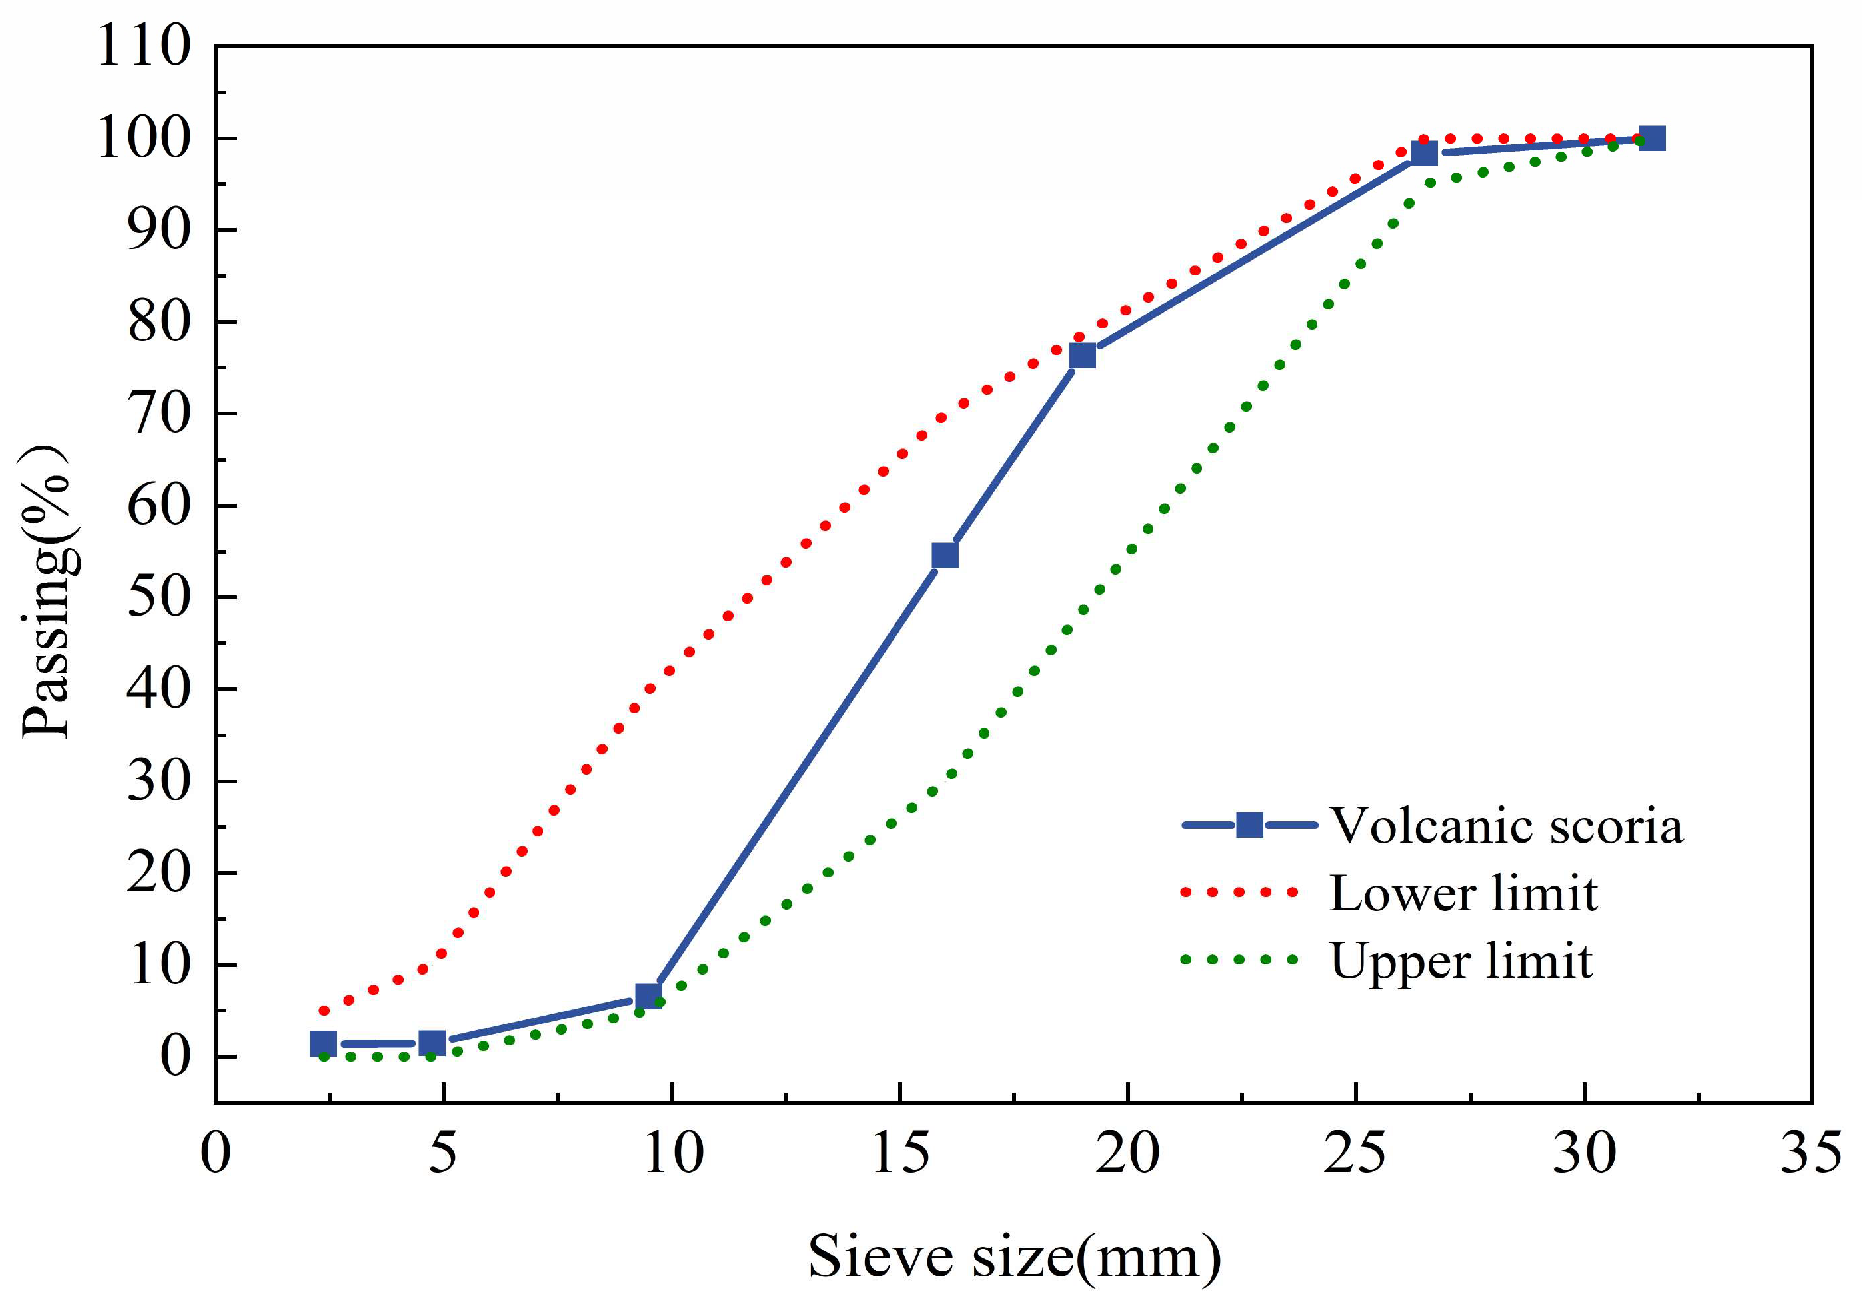
Fire 06 00119 g002
Figure 3. The instrument of the freeze-thaw test. (a) The interior of the freeze-thaw machine. (b) The exterior of freeze-thaw machine (c) Real-time temperature monitoring. (The legend shows the information on the outside display of the freeze-thaw machine to monitor the real-time temperature of the test block and the freeze-thaw cycle process. −18.1 °C represents the sensor center temperature; −21 °C indicates the temperature of the freezing fluid.) (d) Schematic diagram of the freeze-thaw machine.
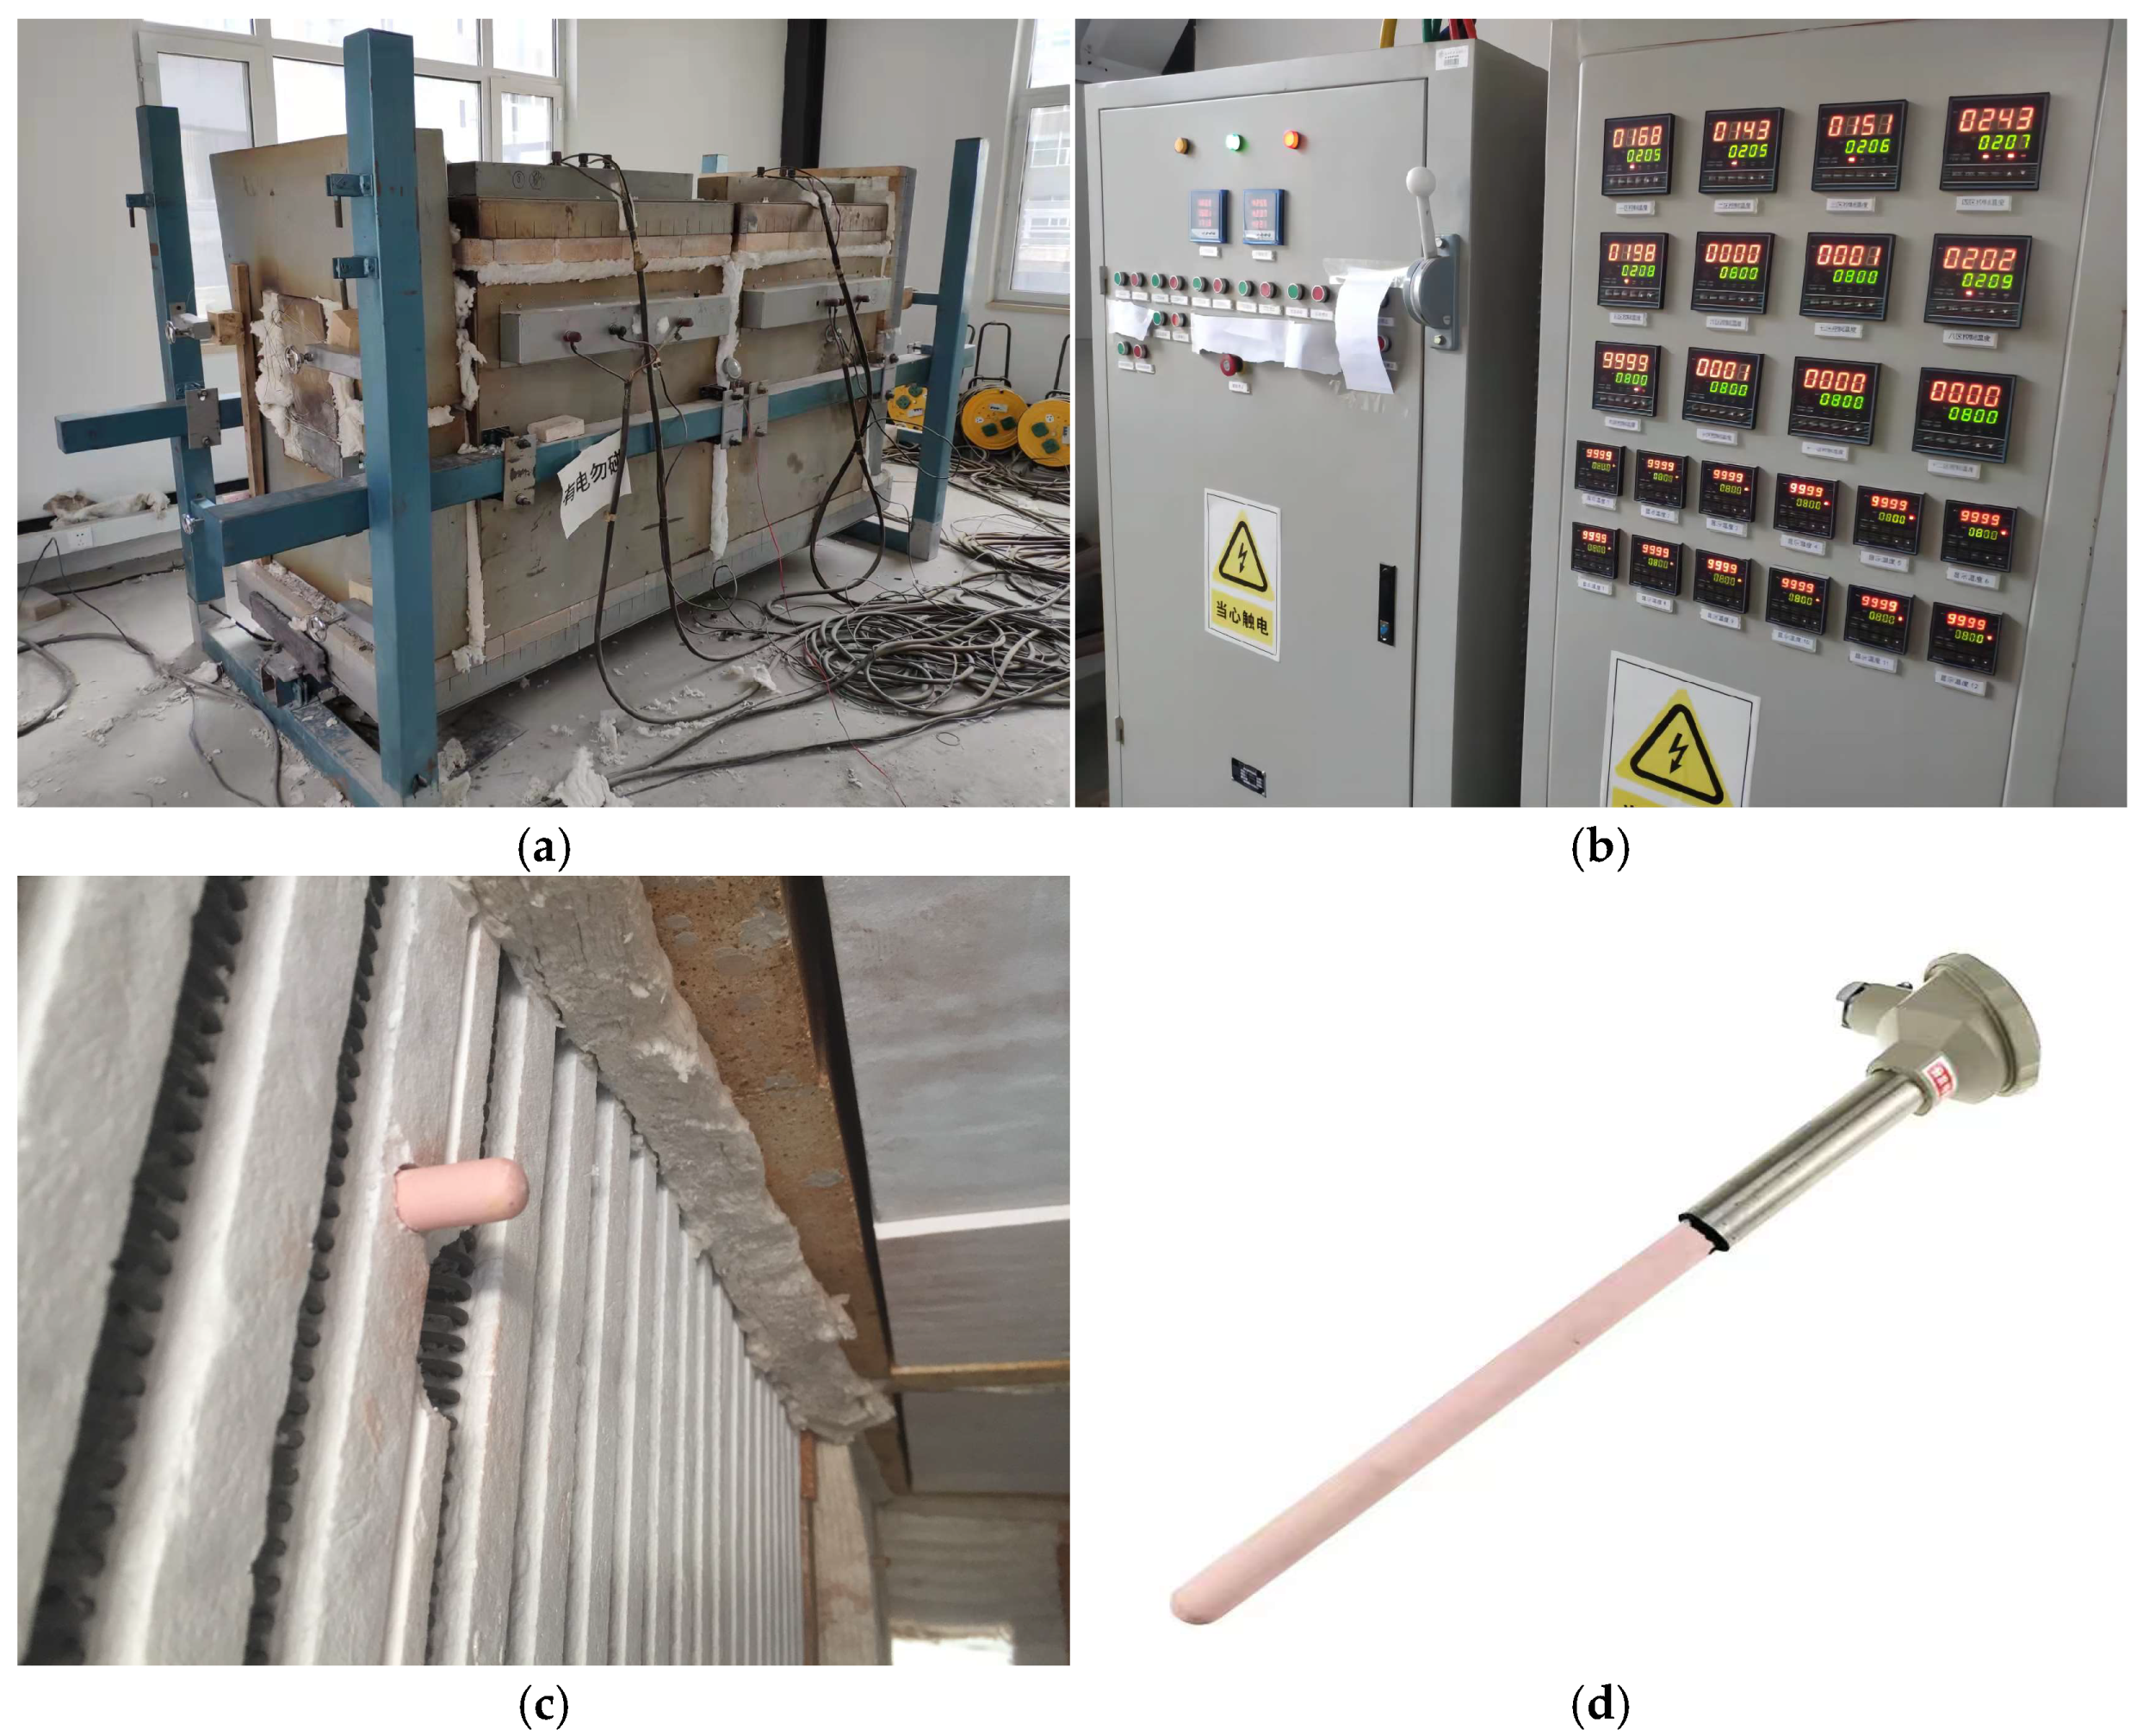
Fire 06 00119 g003
Figure 4. The instrument of the elevated temperature test. (a) Combined resistance furnace diagram. (b) Intelligent precision temperature controllers. (c) The thermocouples installed inside the furnace. (d) K-Type Thermocouple Sensors.
Fire 06 00119 g004
Figure 5. Schematic diagram of concrete strength tests. (a) Compressive strength. (b) Splitting tensile strength.
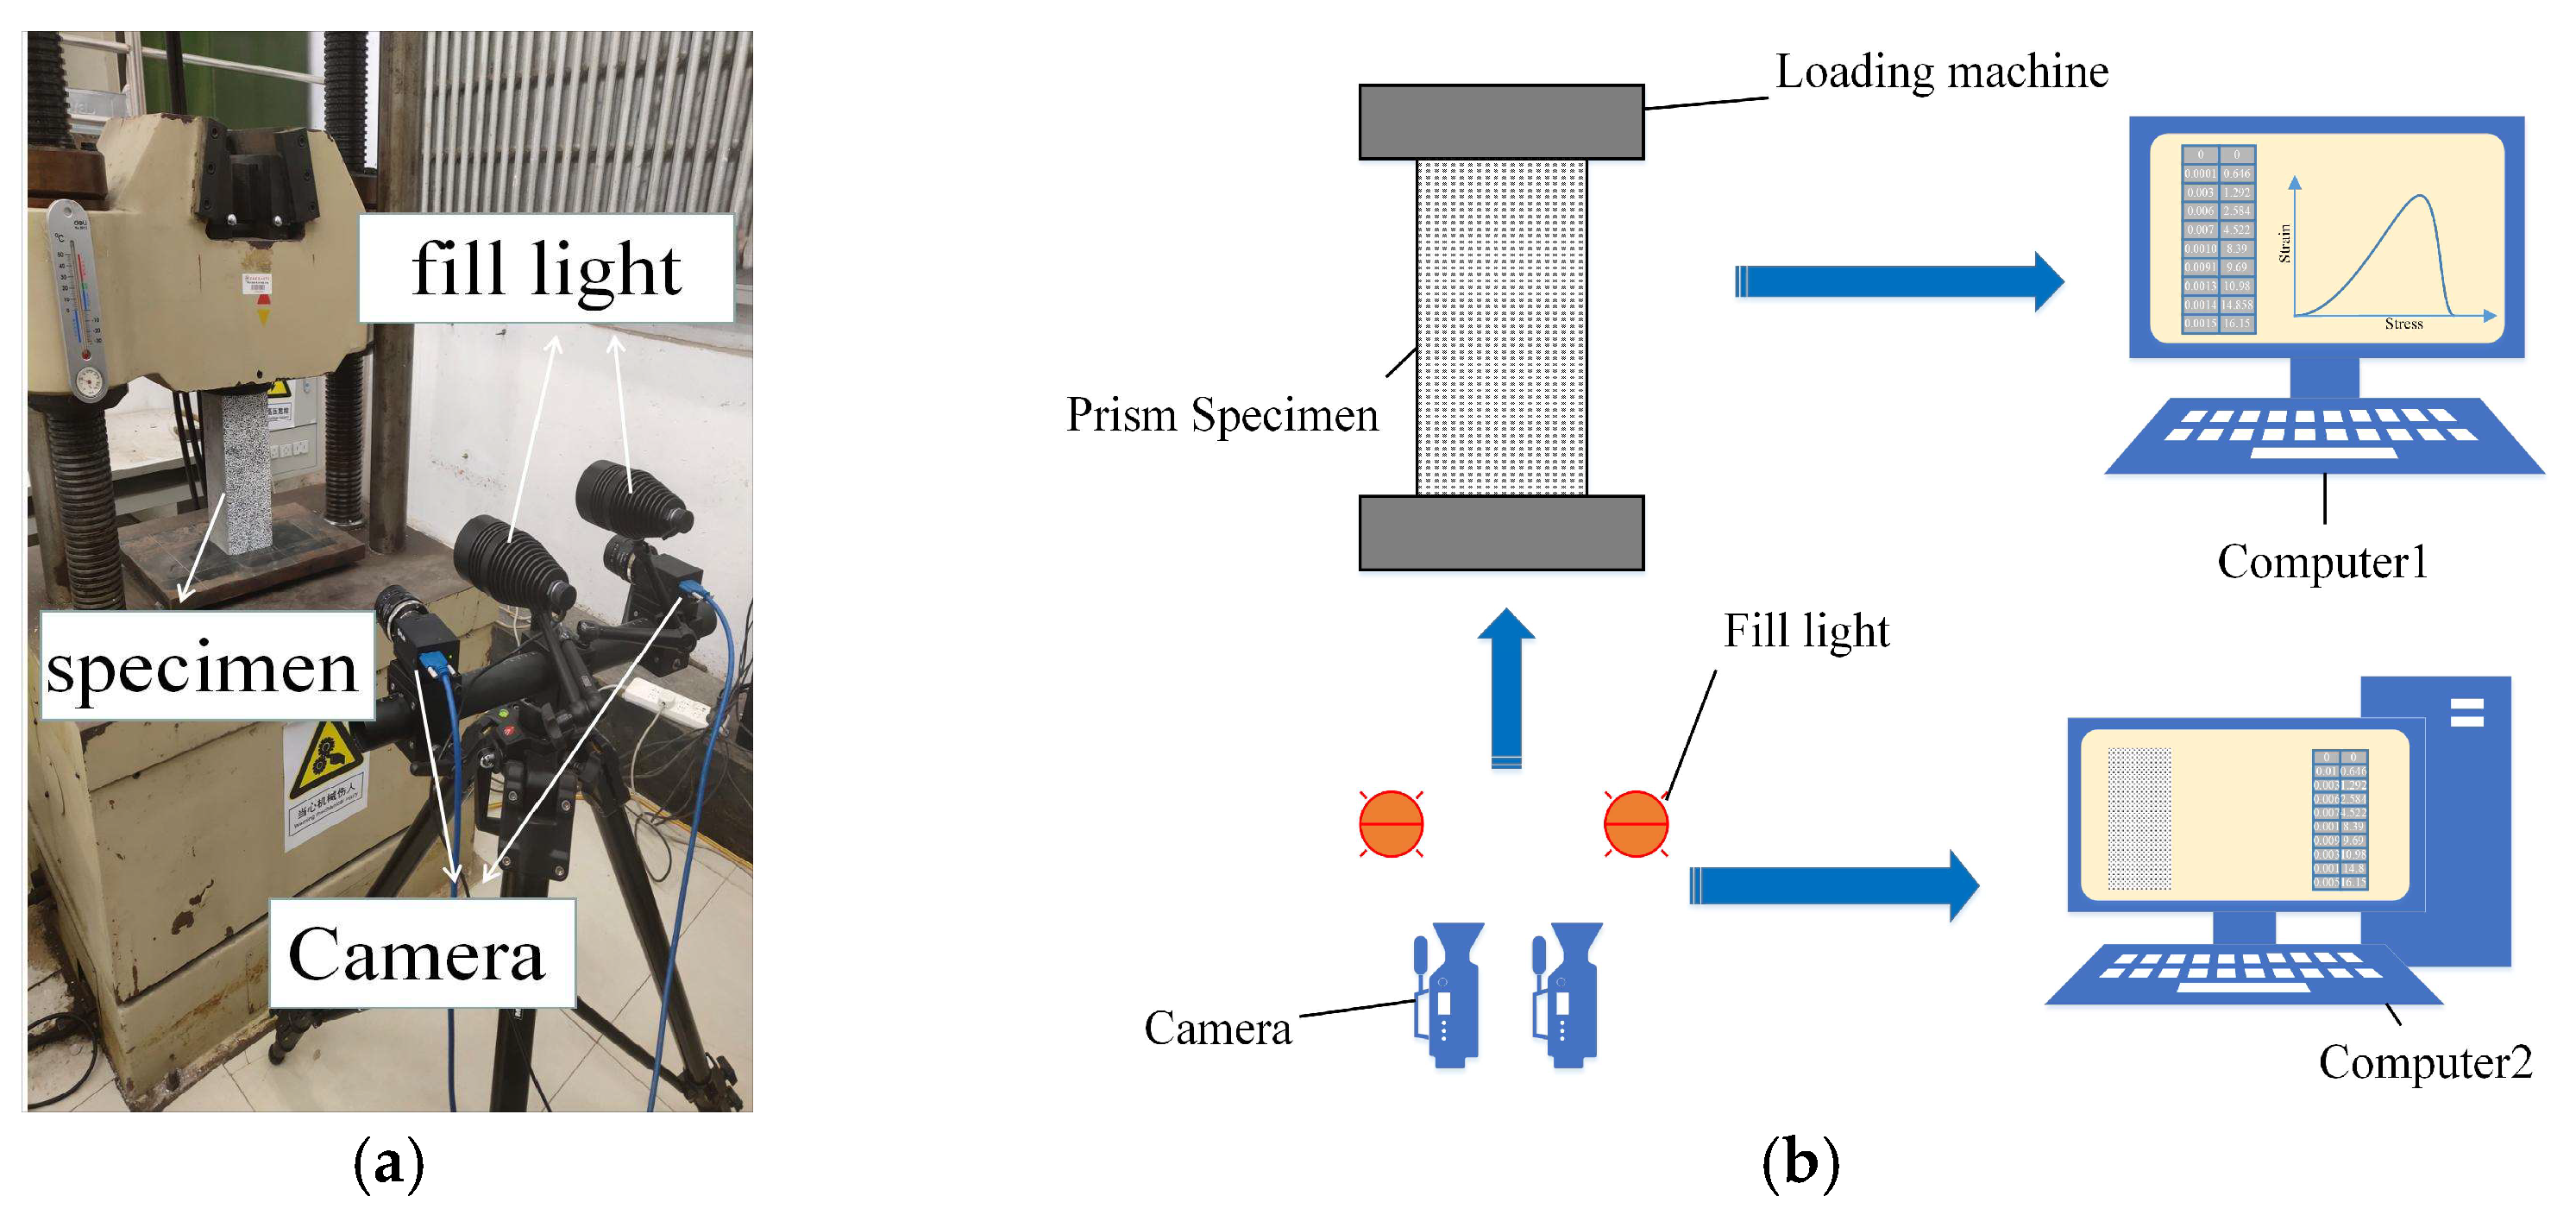
Fire 06 00119 g005
Figure 6. Diagram of the DIC equipment. (a) Physical view of DIC equipment. (b) Diagram of the DIC equipment.
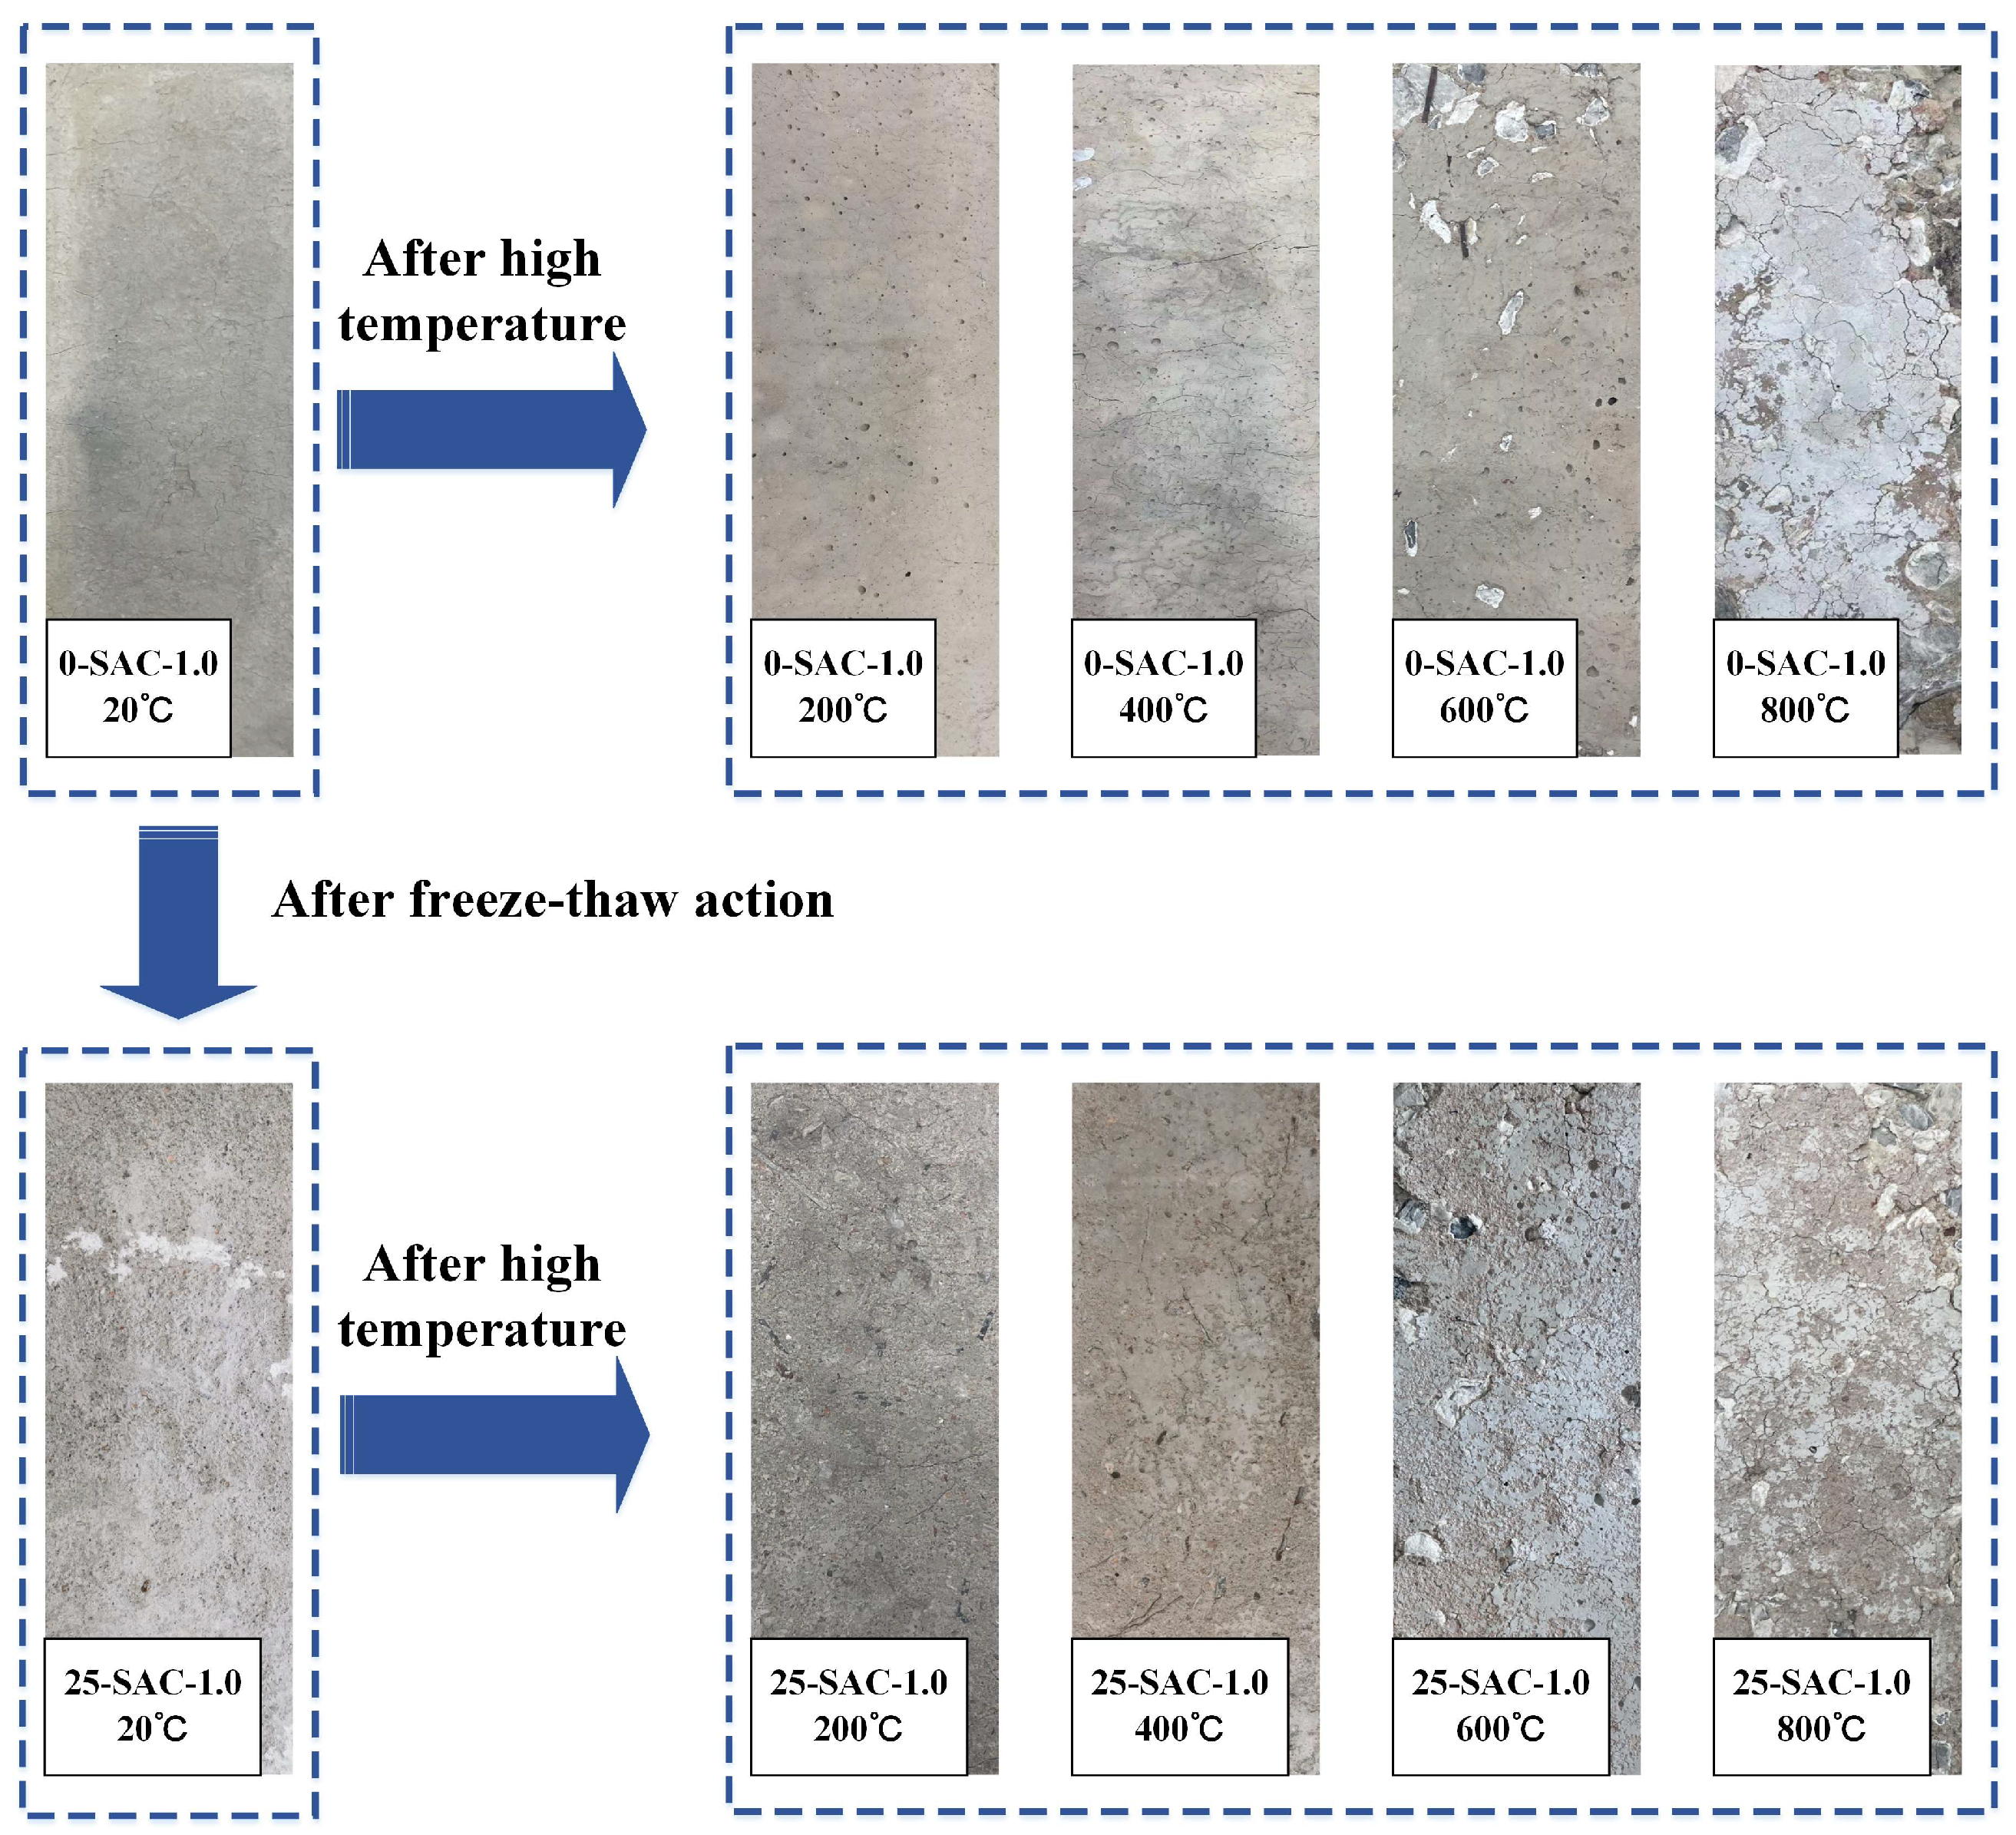
Fire 06 00119 g006
Figure 7. Apparent condition of SAC-1.0 specimens after freeze-thaw and then high temperature.
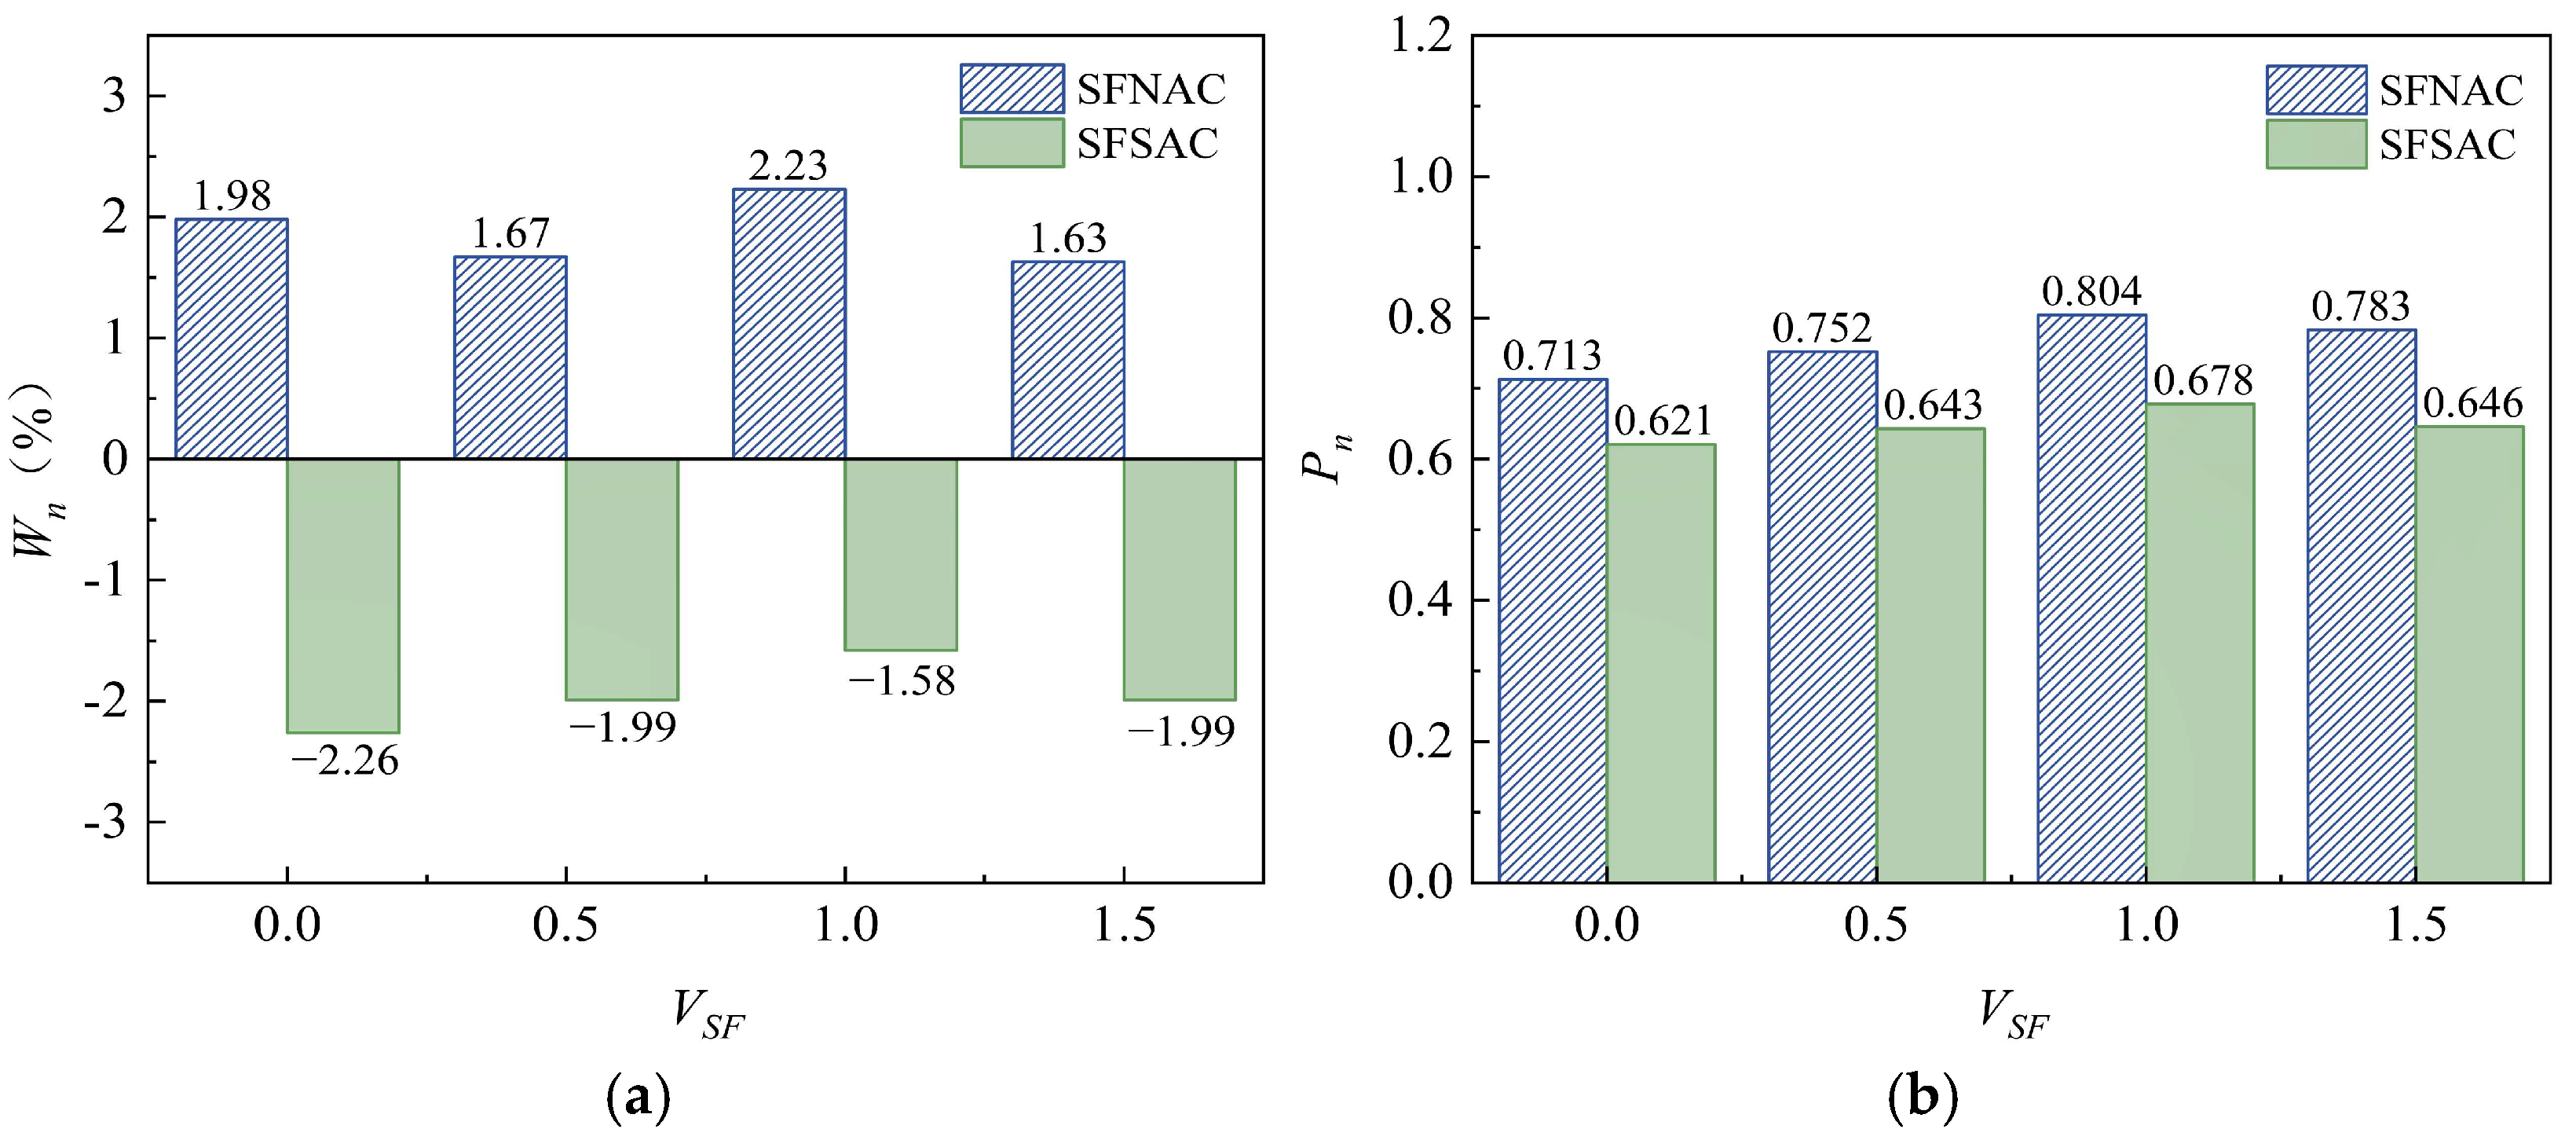
Fire 06 00119 g007
Figure 8. (a) Comparison of mass loss rates of SFSAC and SFNAC with different steel fiber contents after 25 freeze-thaw cycles. (b) Comparison of relative dynamic elastic modulus of SFSAC and SFNAC after 25 freeze-thaw cycles.
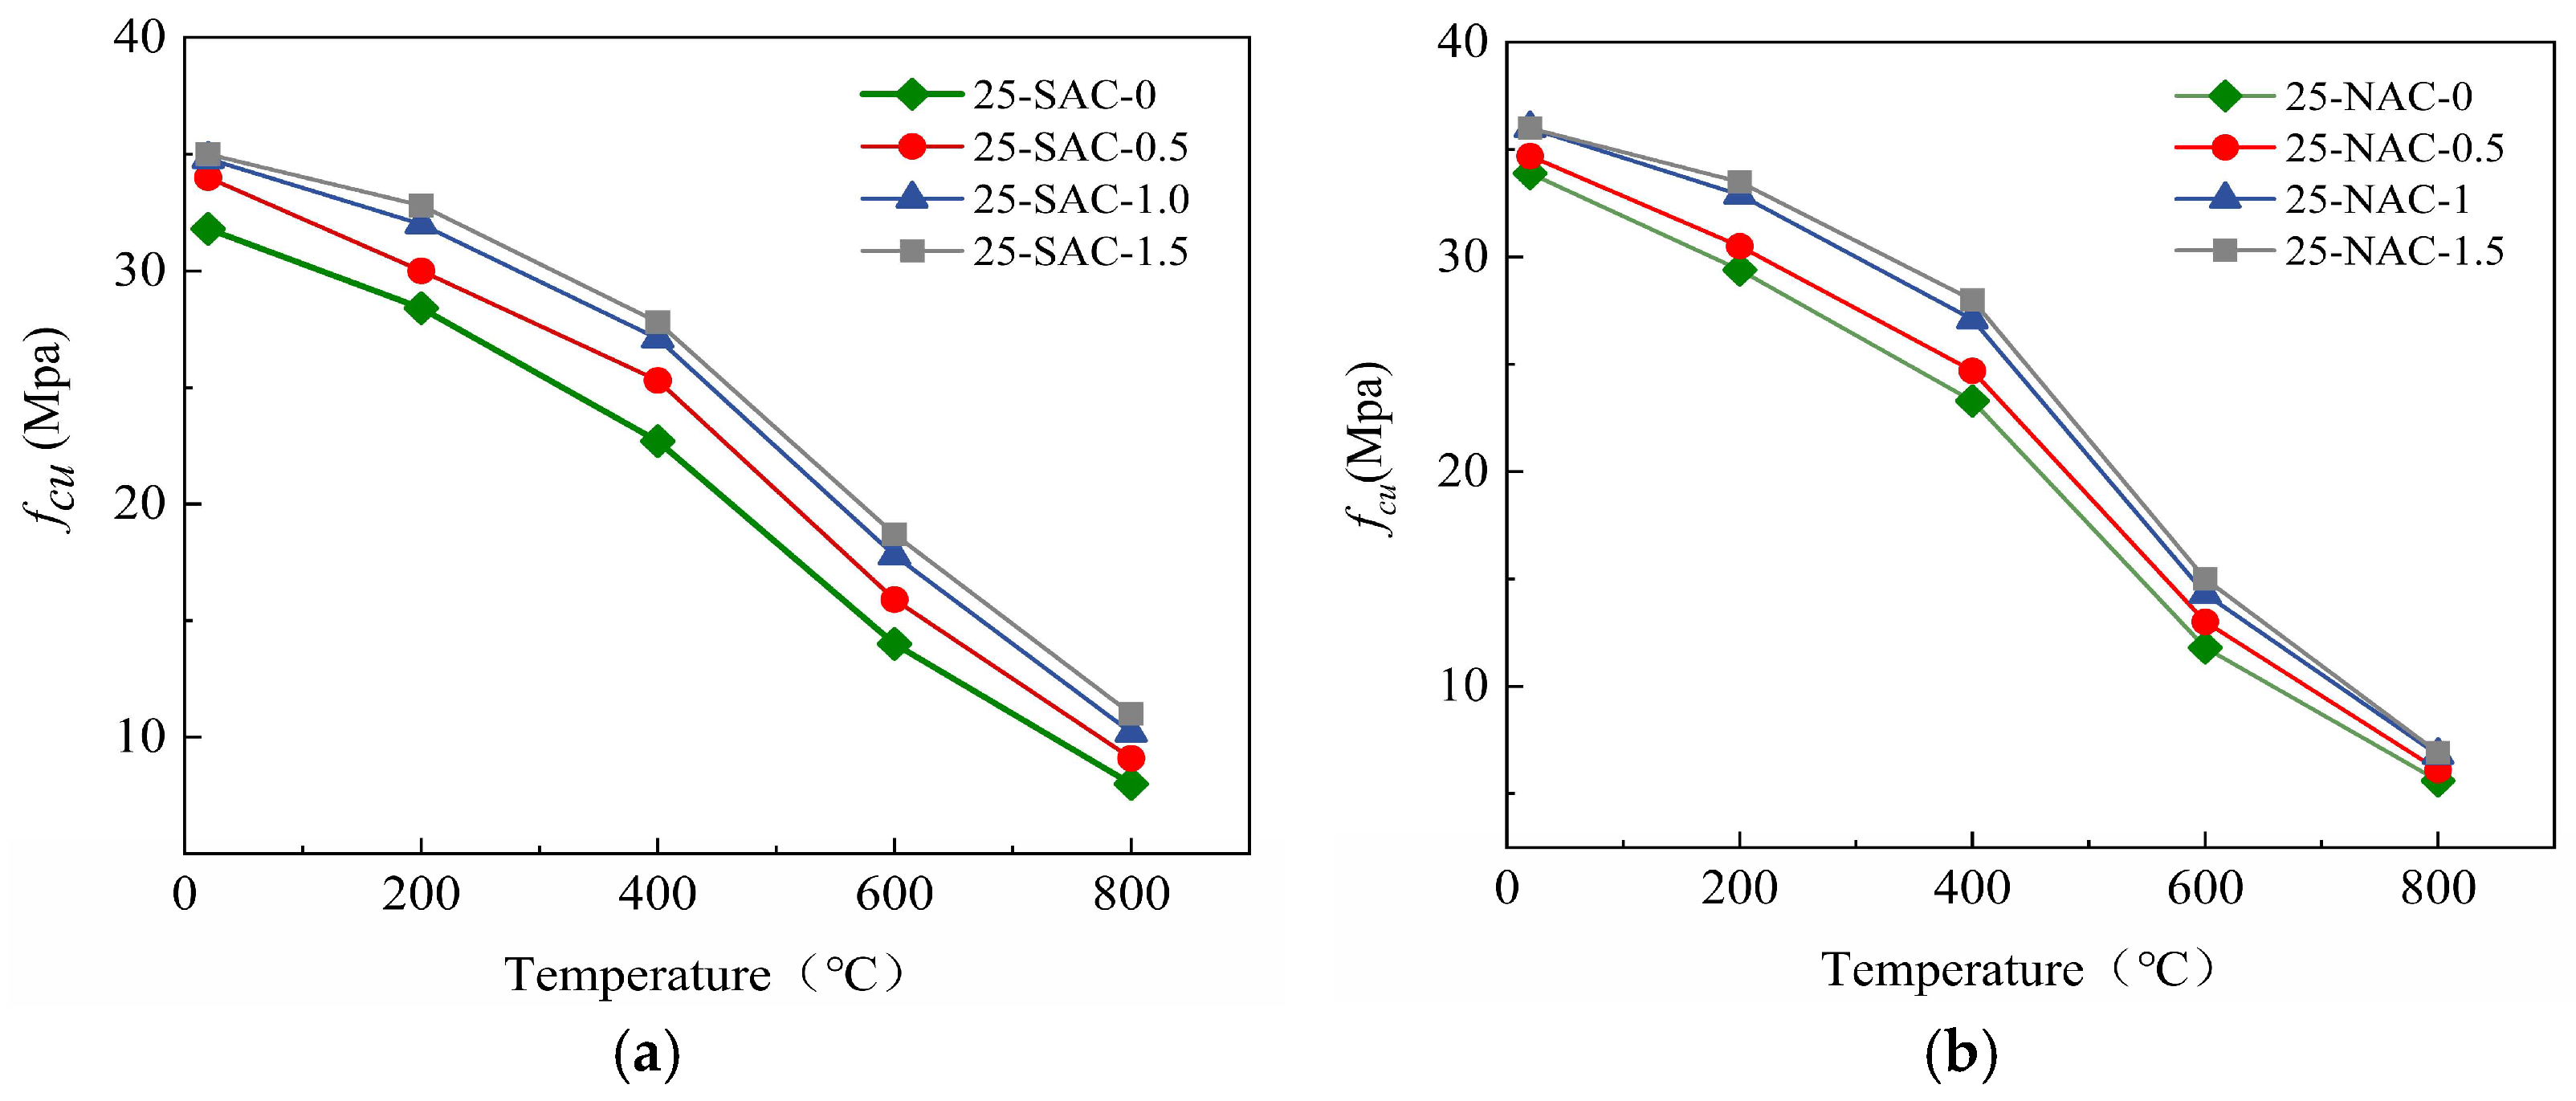
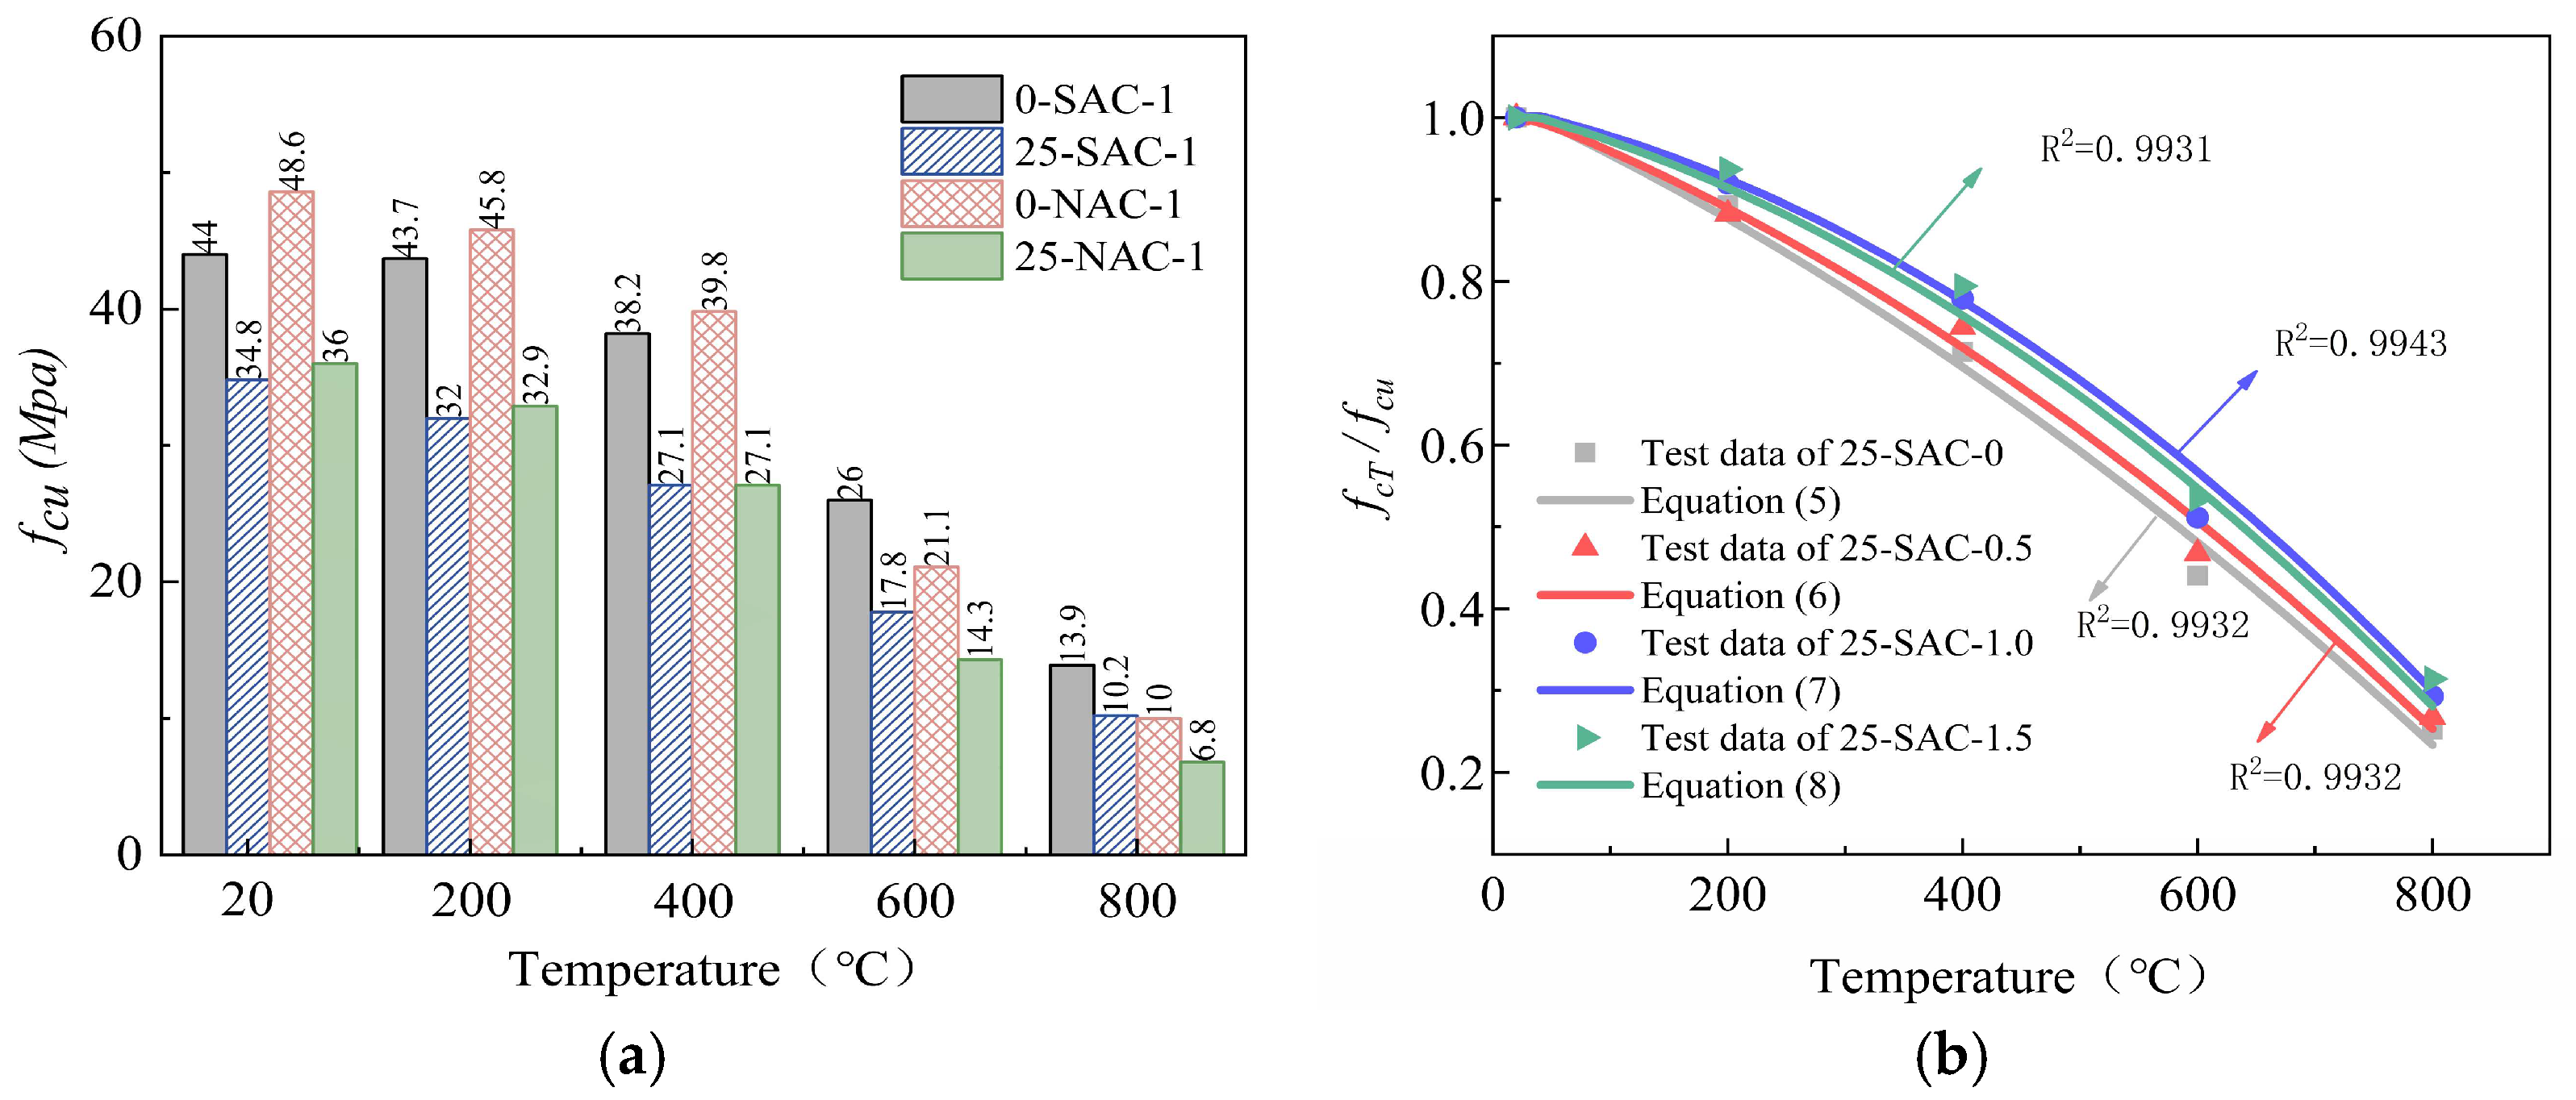
Fire 06 00119 g008
Figure 9. Cube compressive strength of SFSAC and SFNAC after 25 freeze-thaw cycles and then high temperature. (a) Cube compressive strength of SFSAC after 25 freeze-thaw cycles and then high temperature. (b) Cube compressive strength of SFNAC after 25 freeze-thaw cycles and then high temperature.
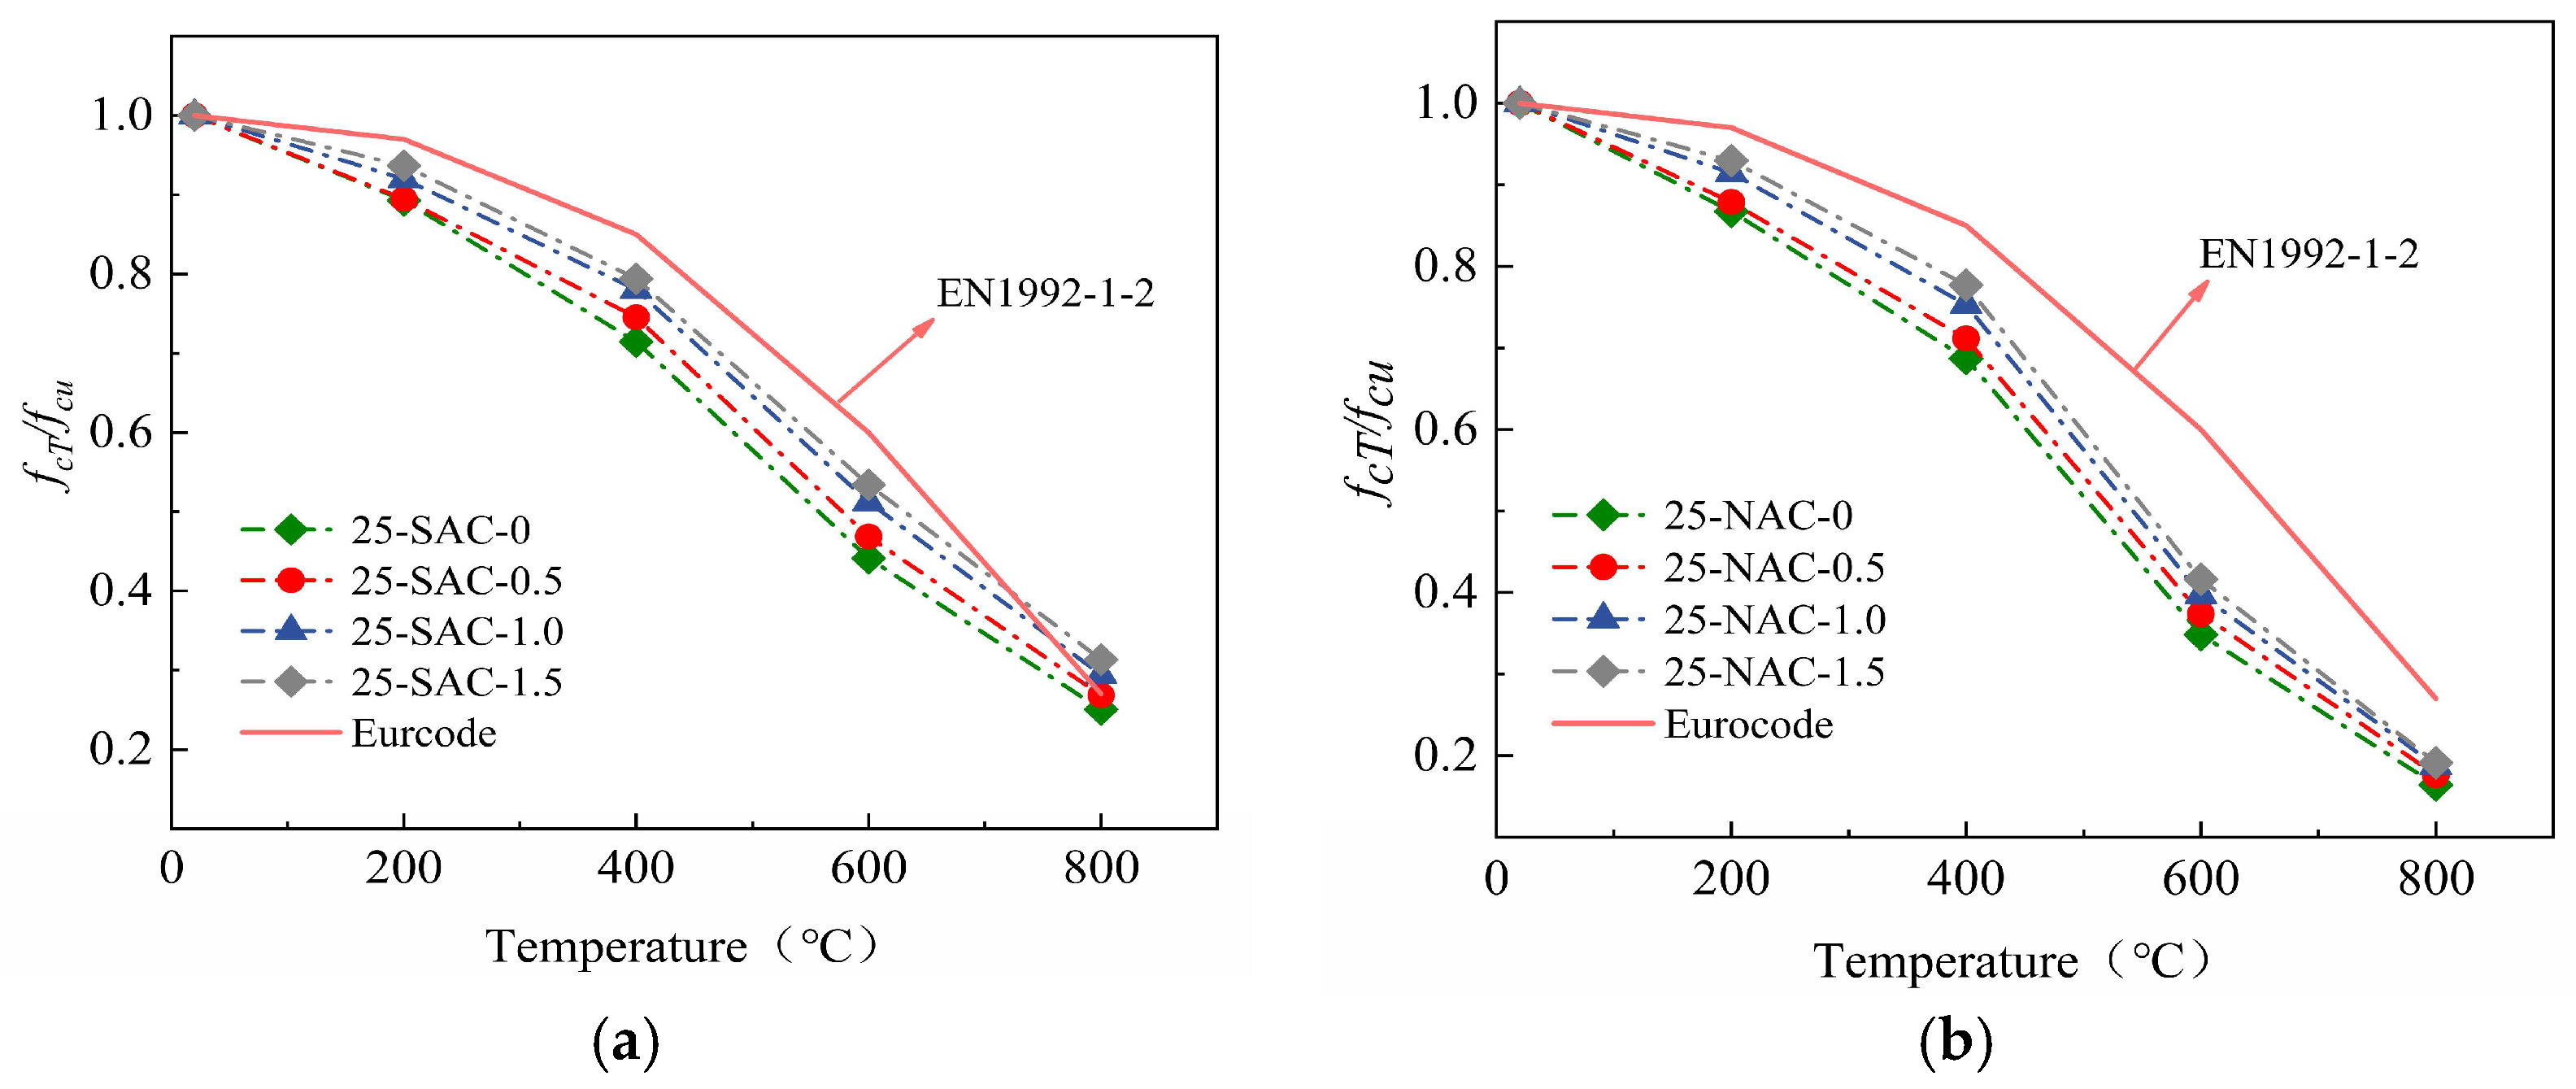
Fire 06 00119 g009
Figure 10. Relative compressive strength of SFSAC and SFNAC after 25 freeze-thaw cycles and then high temperature. (a) Relative compressive strength of SFSAC after 25 freeze-thaw cycles and then high temperature. (b) Relative compressive strength of SFNAC after 25 freeze-thaw cycles and then high temperature.
Fire 06 00119 g010
Figure 11. (a) Cube compressive strength of NAC-1.0 and SAC-1.0 before and after freeze-thaw cycle. (b) Fitting and test results of the cubes’ compressive strength of SFSAC after freeze-thaw cycles and then elevated-temperature exposure.
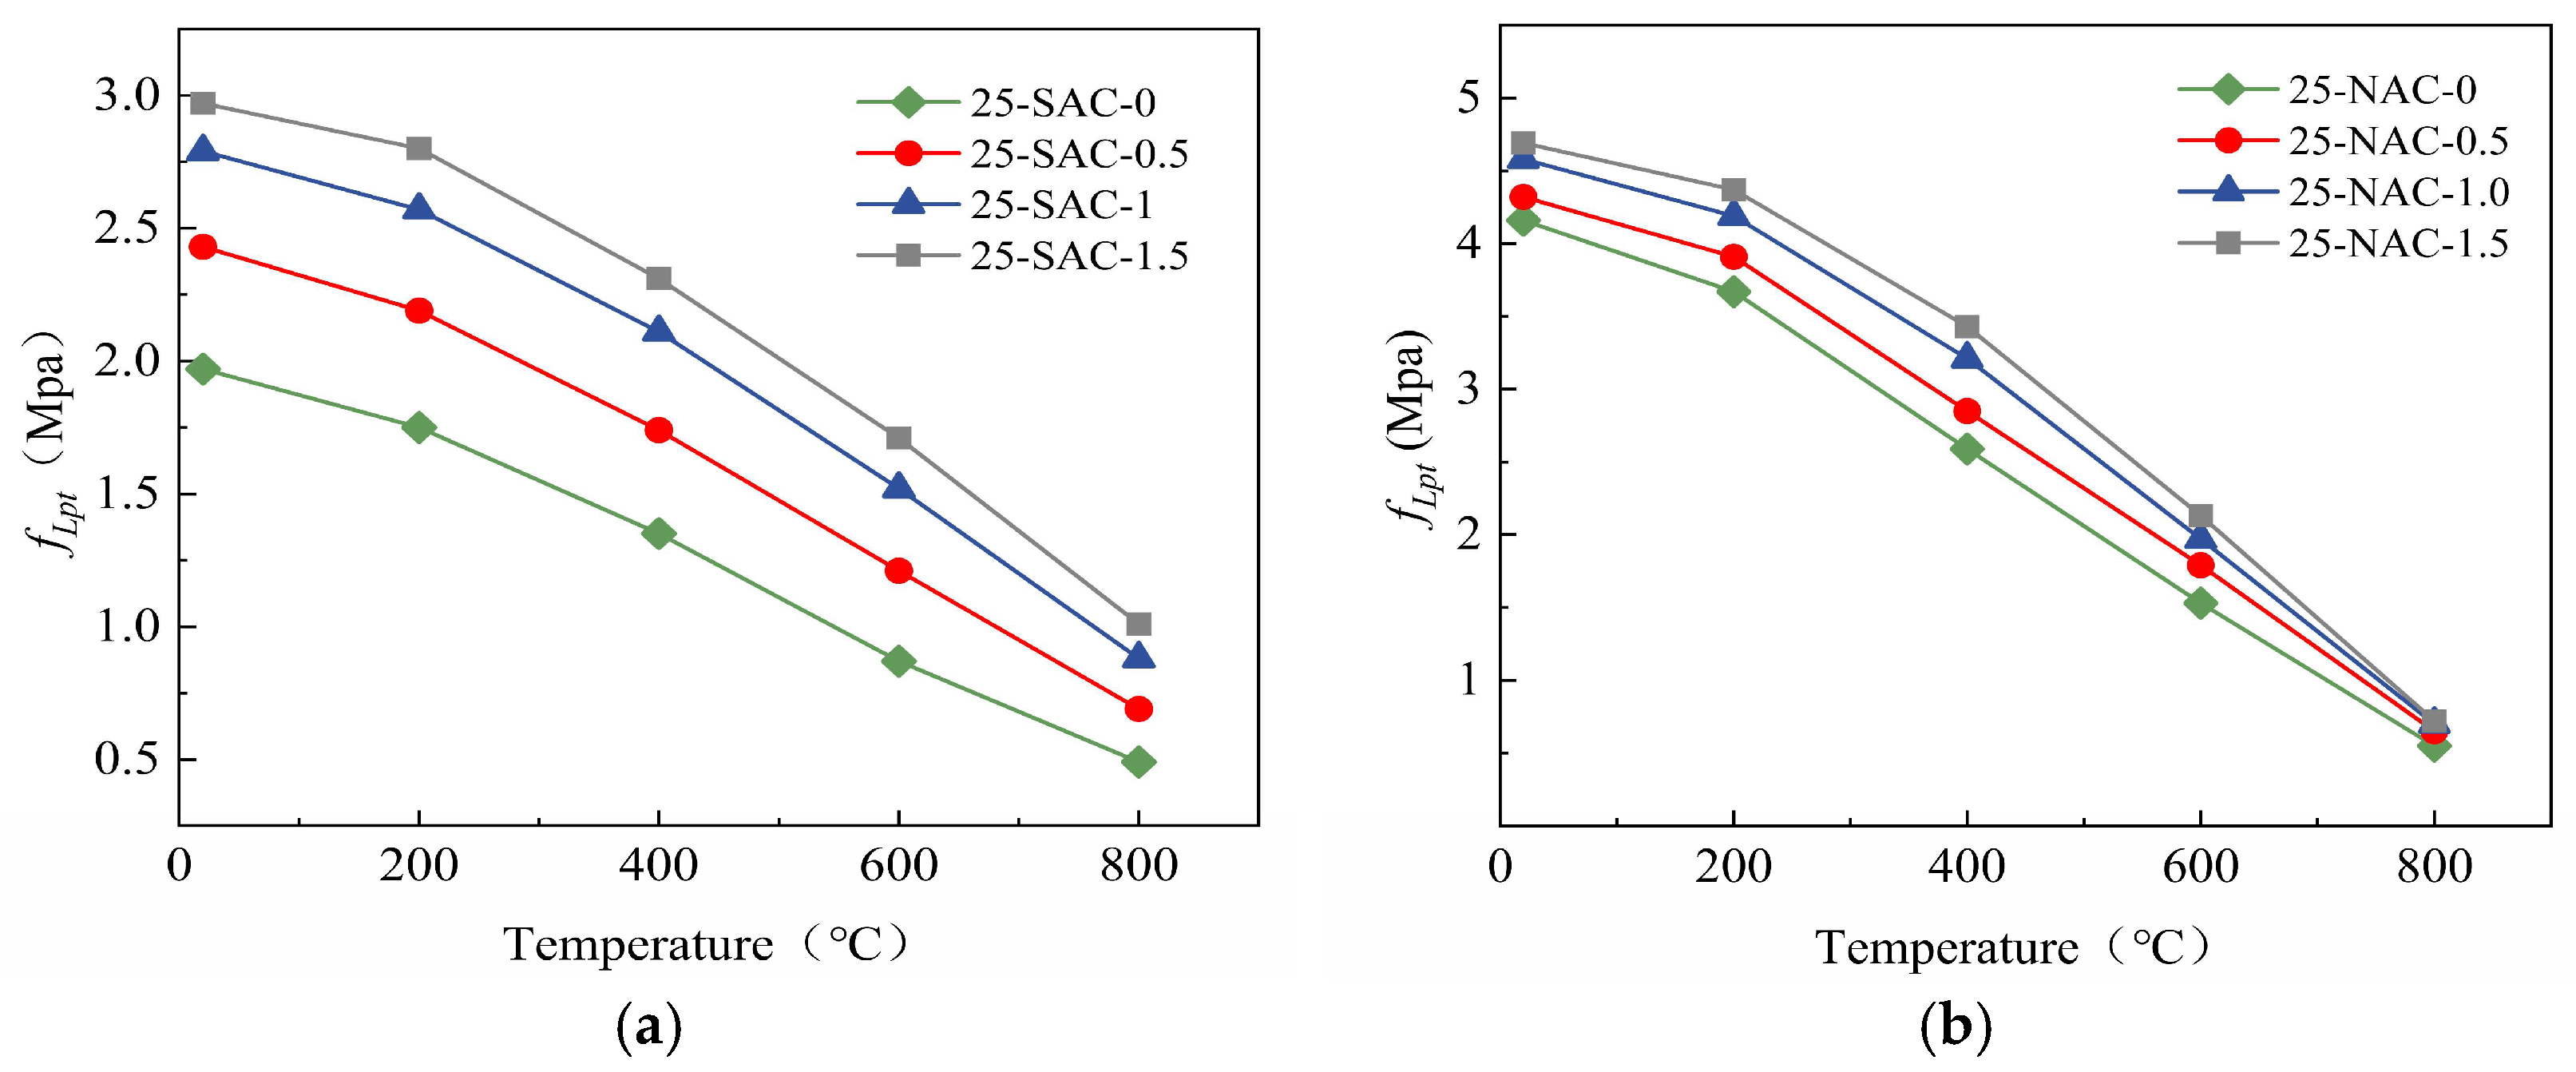
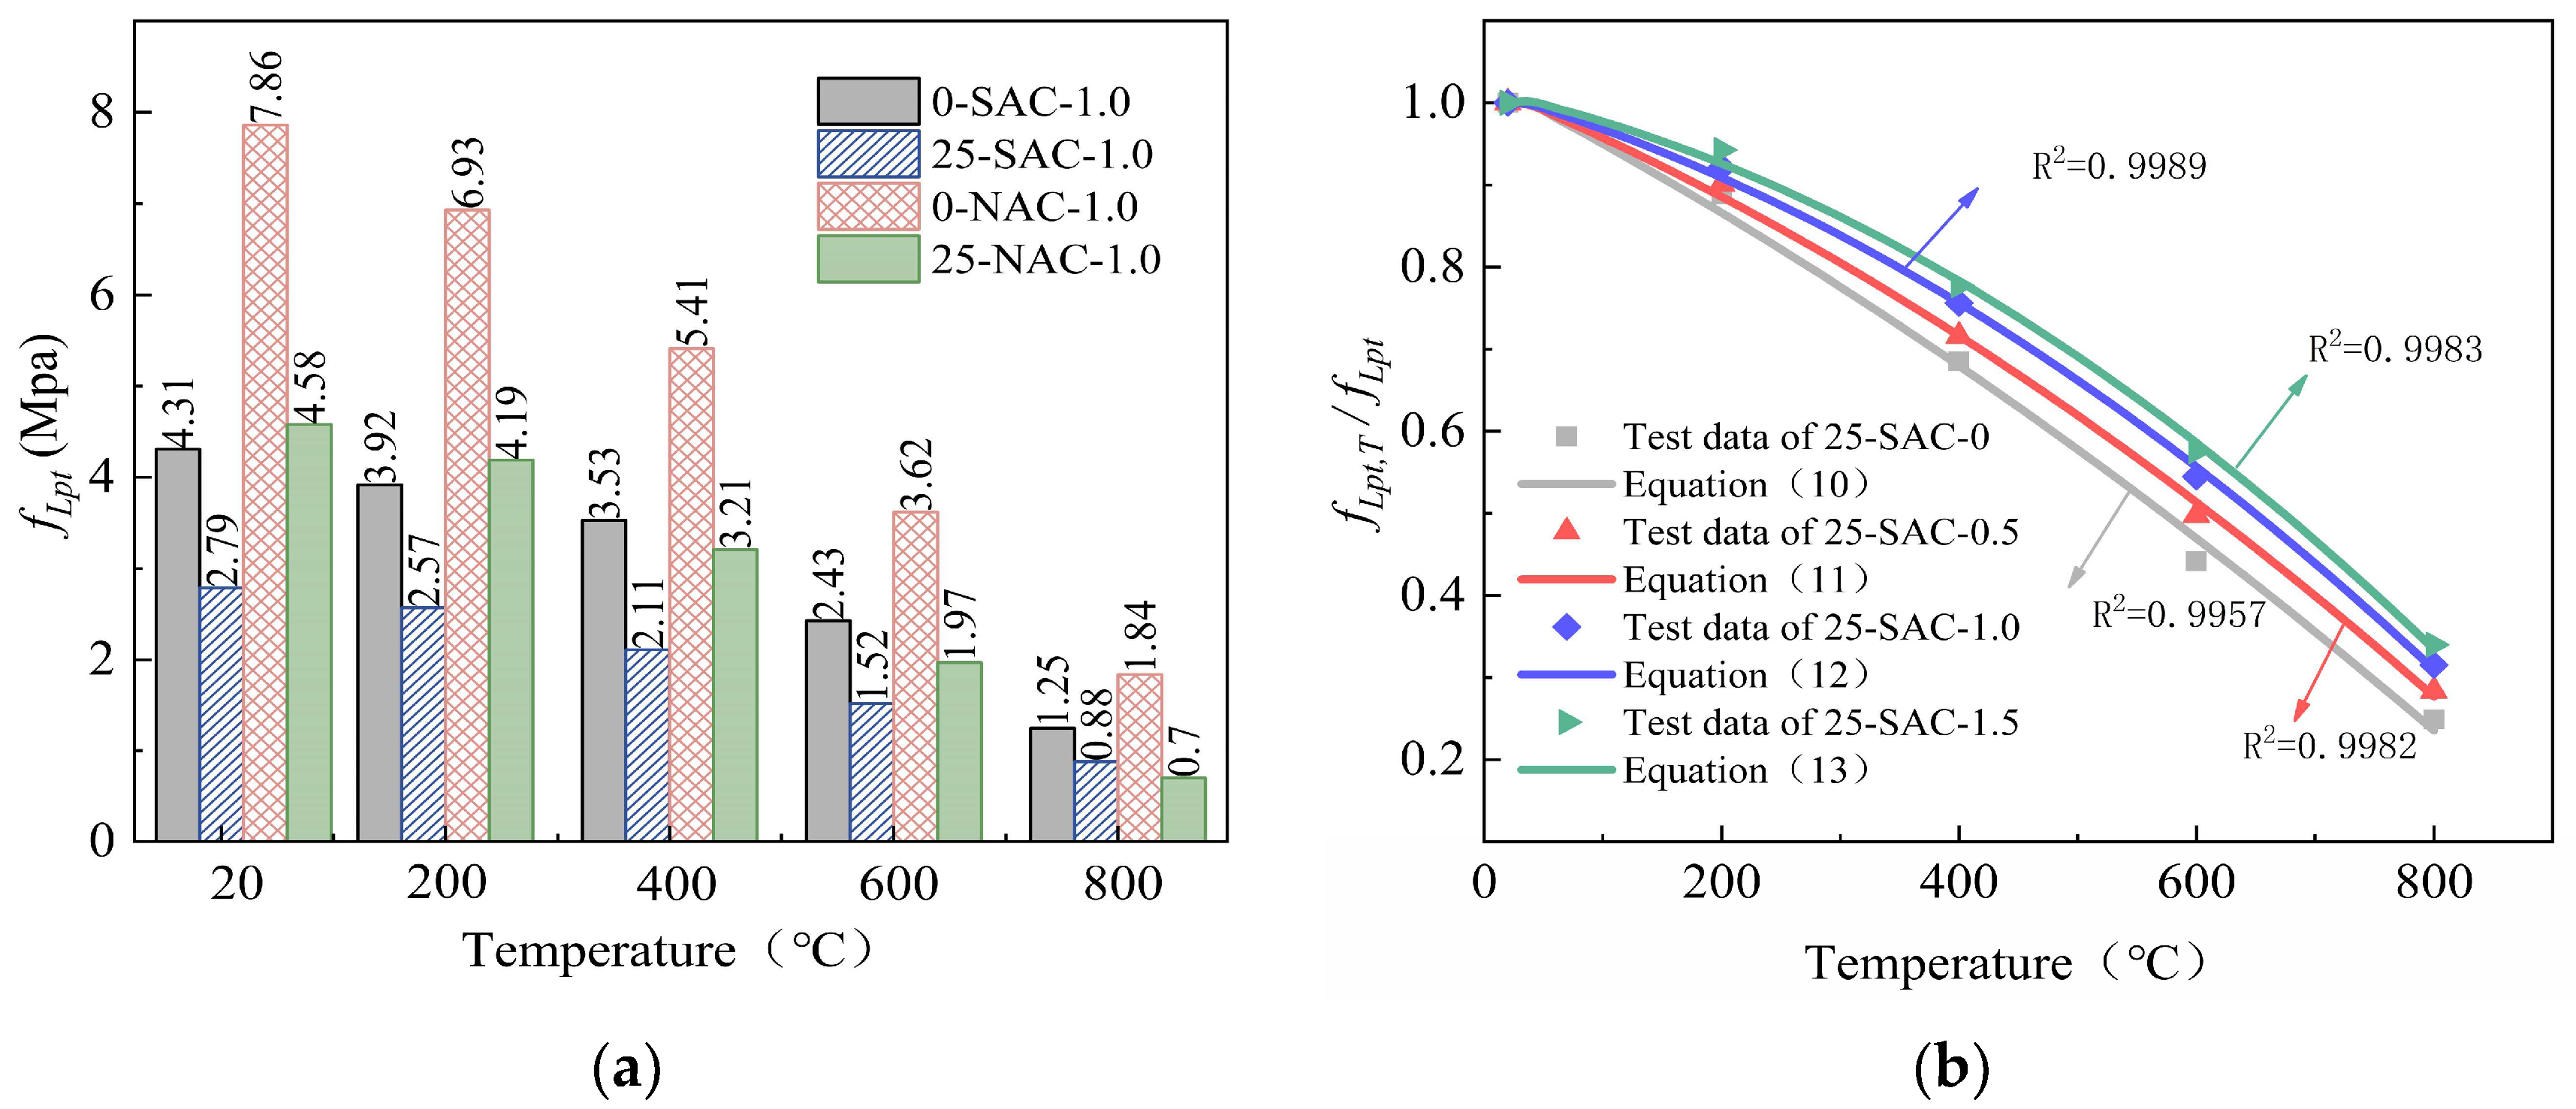
Fire 06 00119 g011
Figure 12. Cube splitting tensile strength of SFSAC and SFNAC after 25 freeze-thaw cycles and then high temperature. (a) Cube splitting tensile strength of SFSAC after 25 freeze-thaw cycles and then high temperature. (b) Cube splitting tensile strength of SFNAC after 25 freeze-thaw cycles and then high temperature.
Fire 06 00119 g012
Figure 13. Relative cube splitting tensile strength of SFSAC and SFNAC after 25 freeze-thaw cycles and then high temperature. (a) Relative cube splitting tensile strength of SFSAC after 25 freeze-thaw cycles and then high temperature. (b) Relative cube splitting tensile strength of SFNAC after 25 freeze-thaw cycles and then high temperature.
Fire 06 00119 g013
Figure 14. (a) Cube splitting tensile strength of SAC-1.0 and NAC-1.0 before and after freeze-thaw cycle. (b) Fitting and test results of SFSAC splitting tensile strength after freeze-thaw cycles and then elevated-temperature exposure.
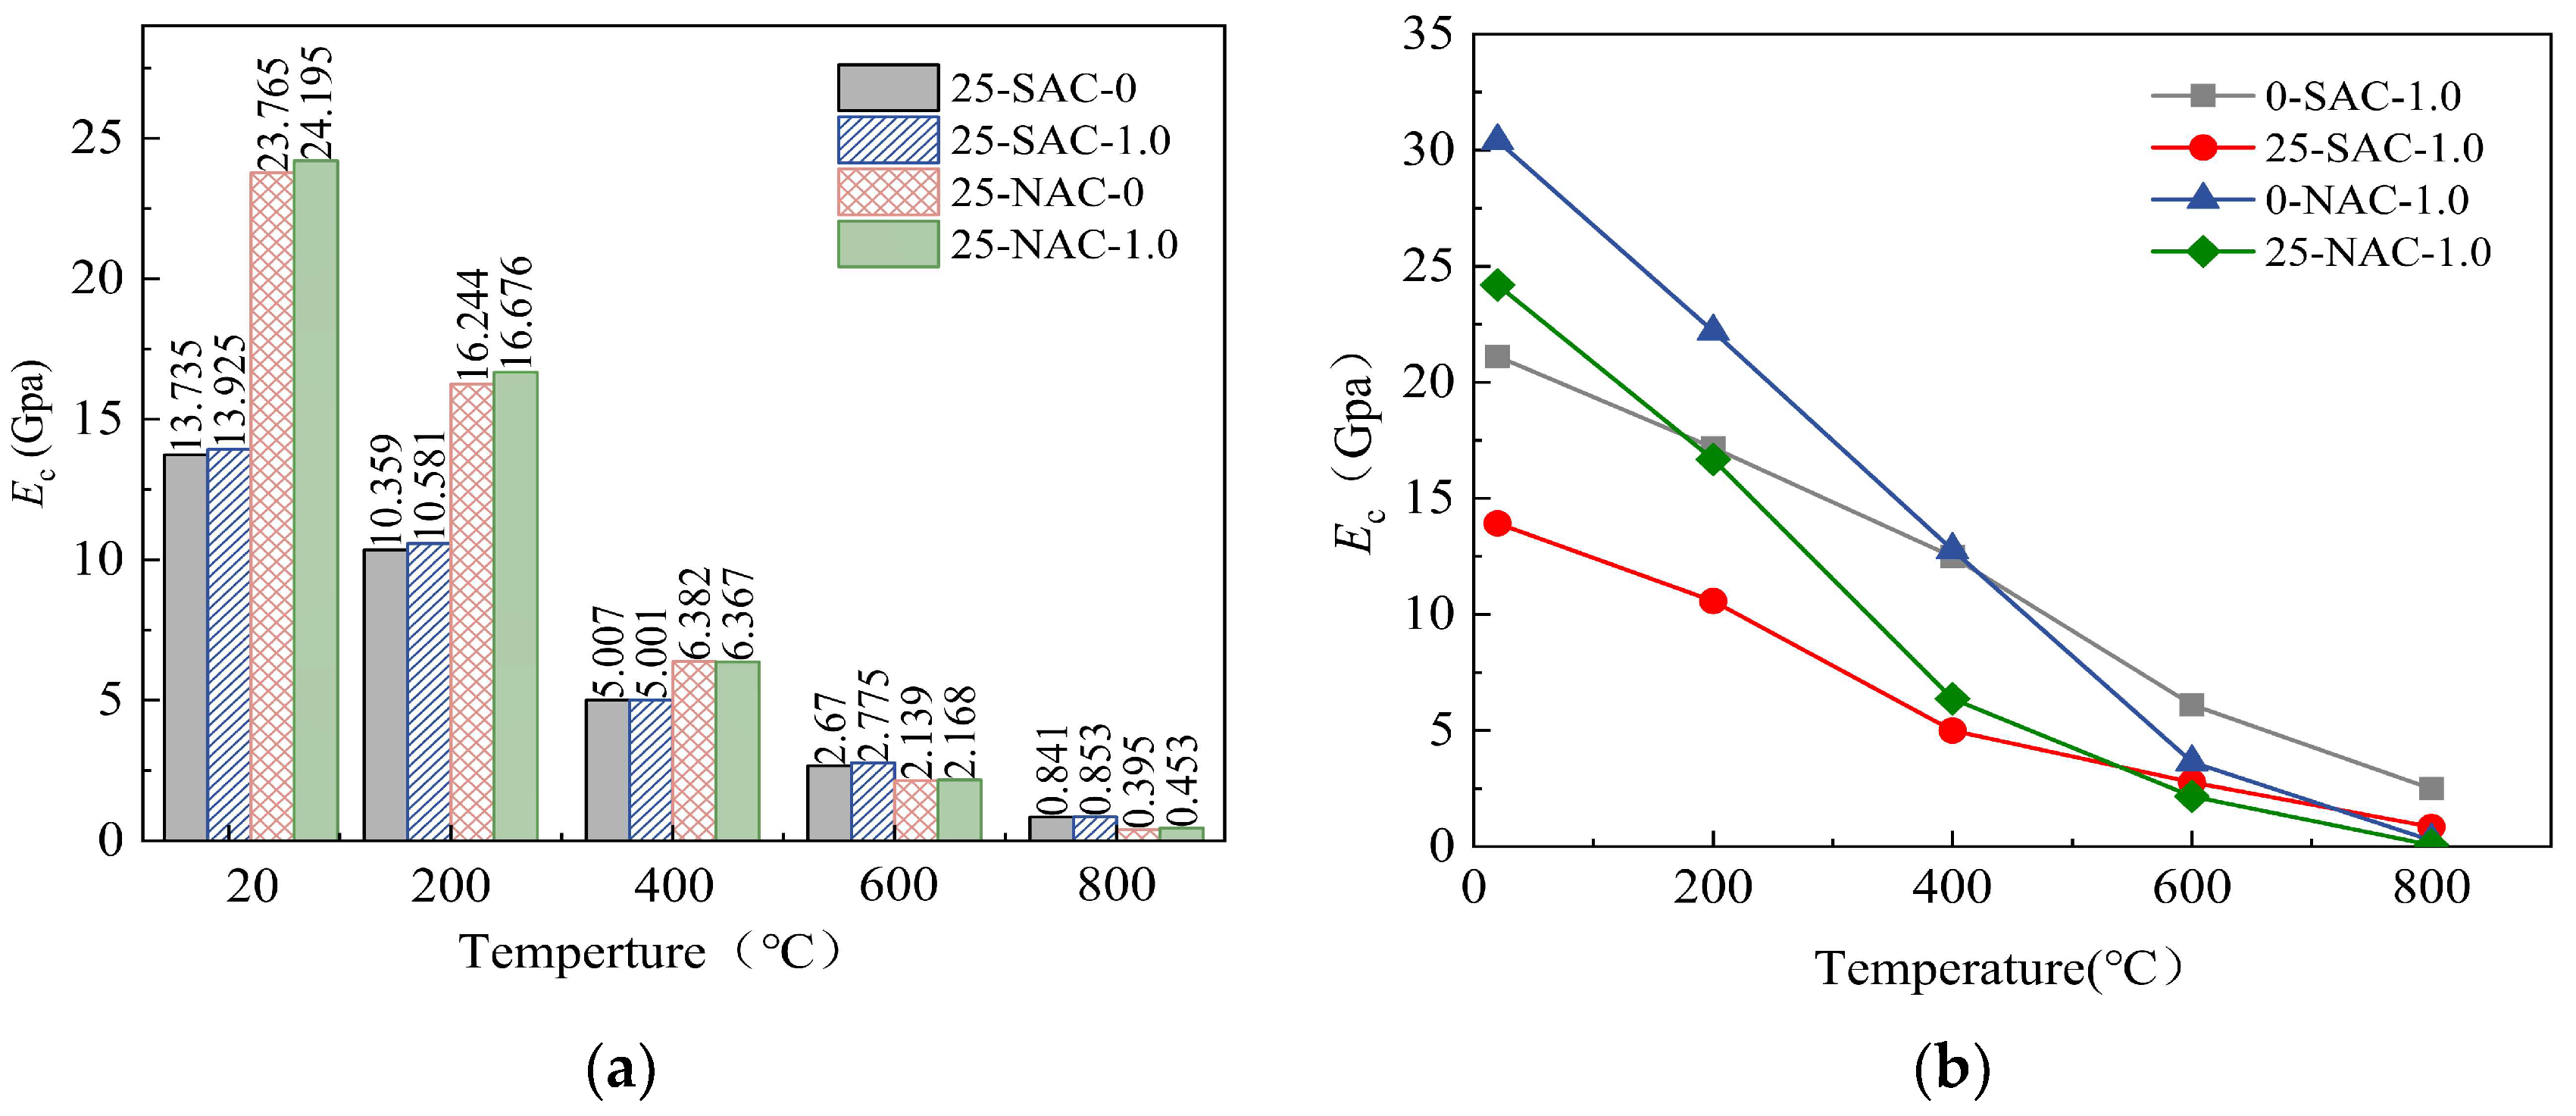
Fire 06 00119 g014
Figure 15. (a) Elastic modulus of SFSAC and SFNAC after freeze-thaw cycle and then elevated-temperature exposure. (b) Elastic modulus of SAC-1.0 and NAC-1.0 before and then after freeze-thaw cycle.
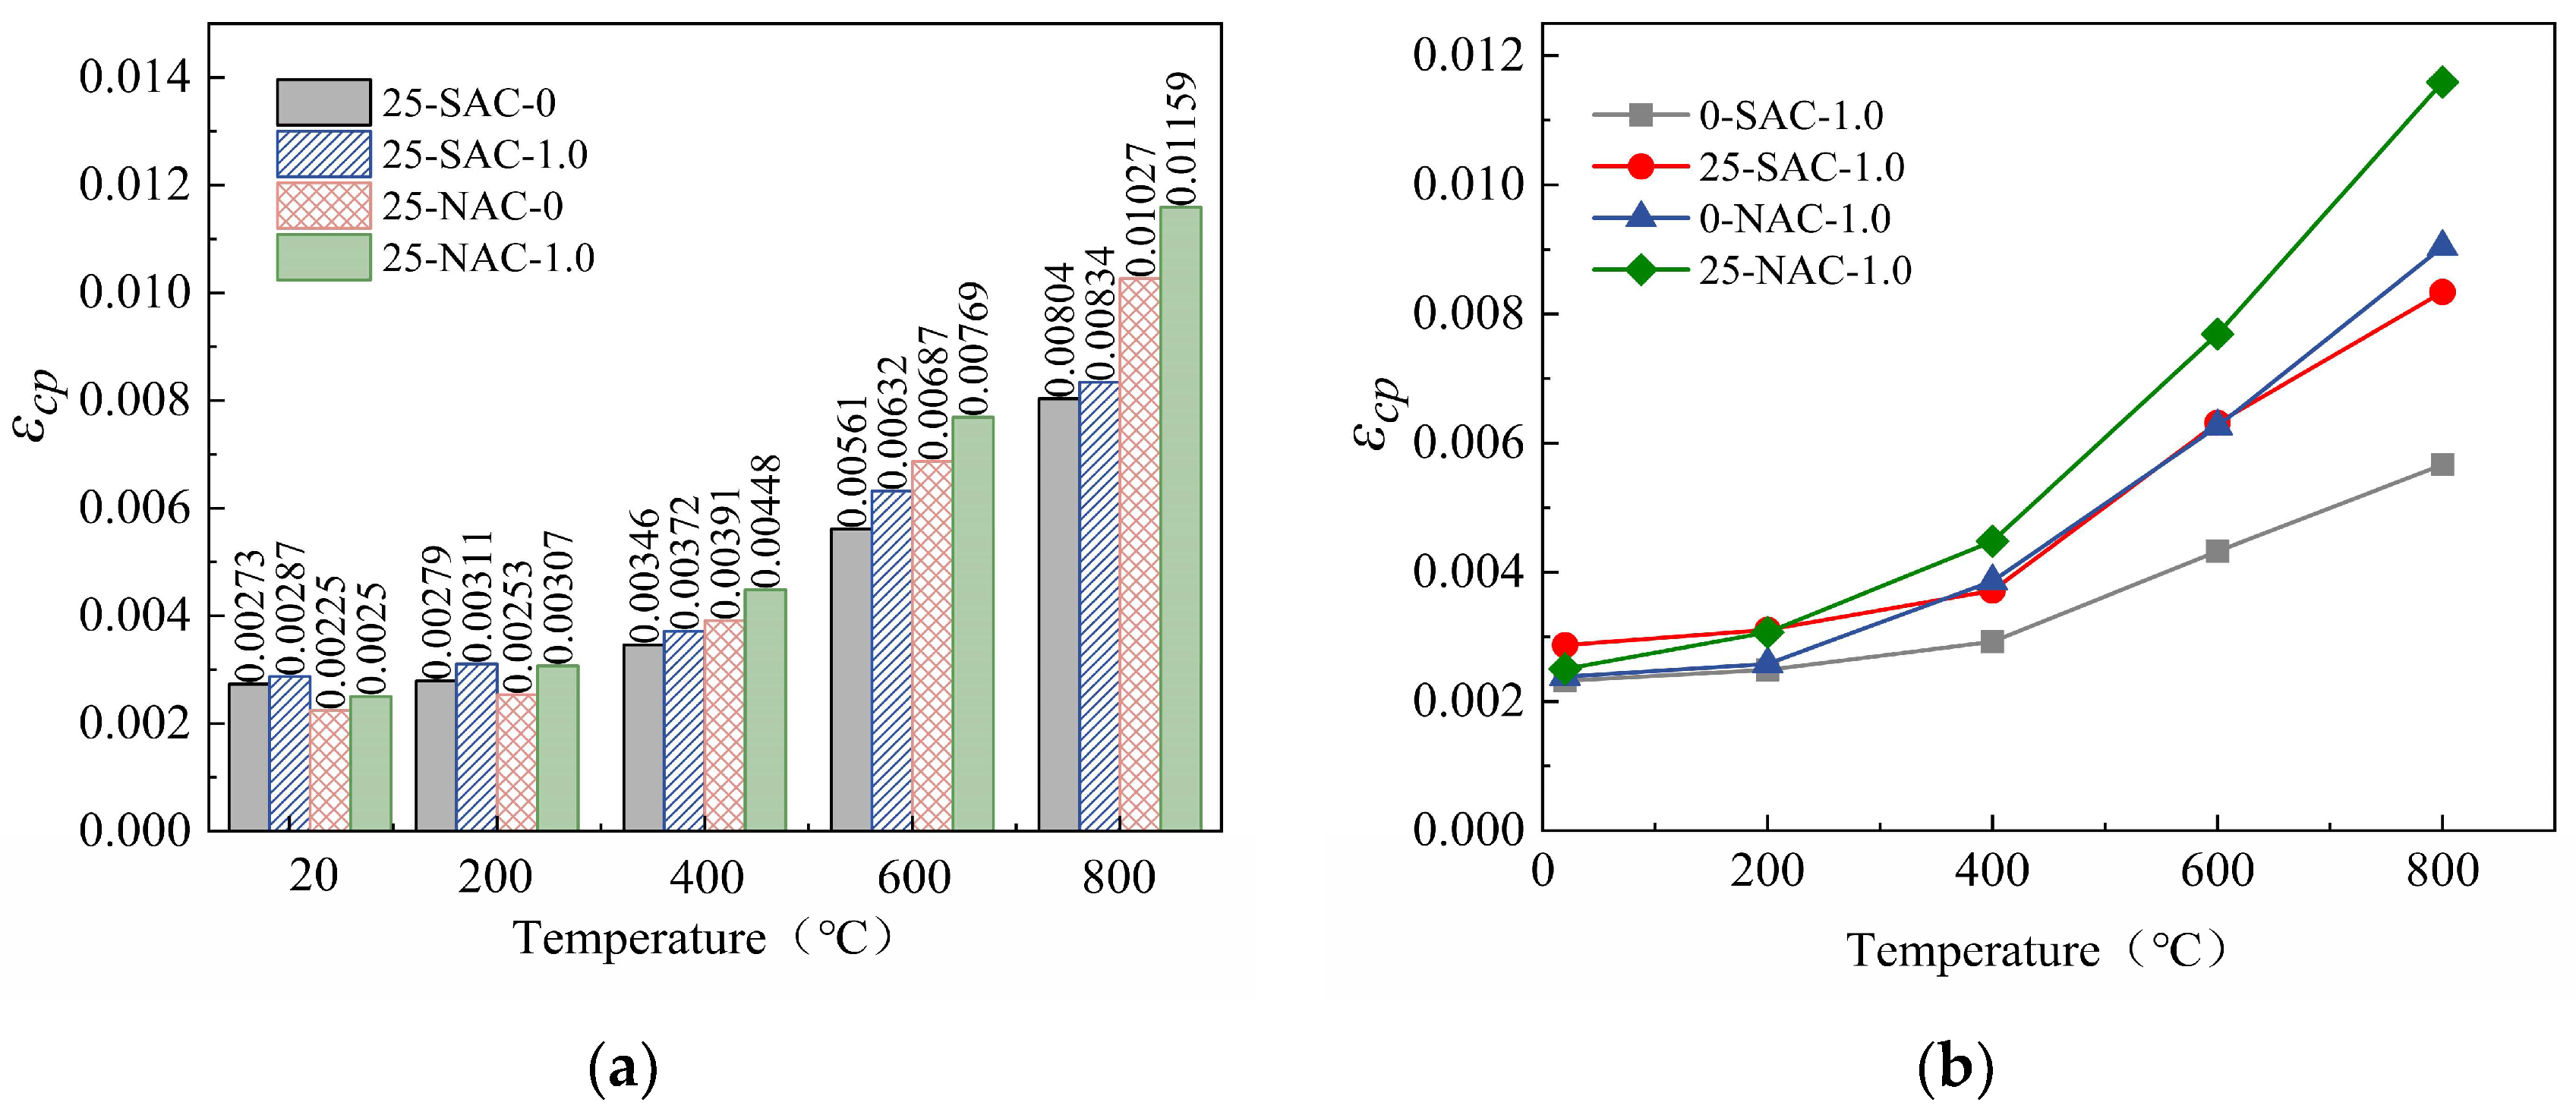
Fire 06 00119 g015
Figure 16. (a) Peak strain of SFSAC and SFNAC after freeze-thaw cycle and then elevated-temperature exposure. (b) Peak strain of SAC-1.0 and NAC-1.0 before and after freeze-thaw cycle.
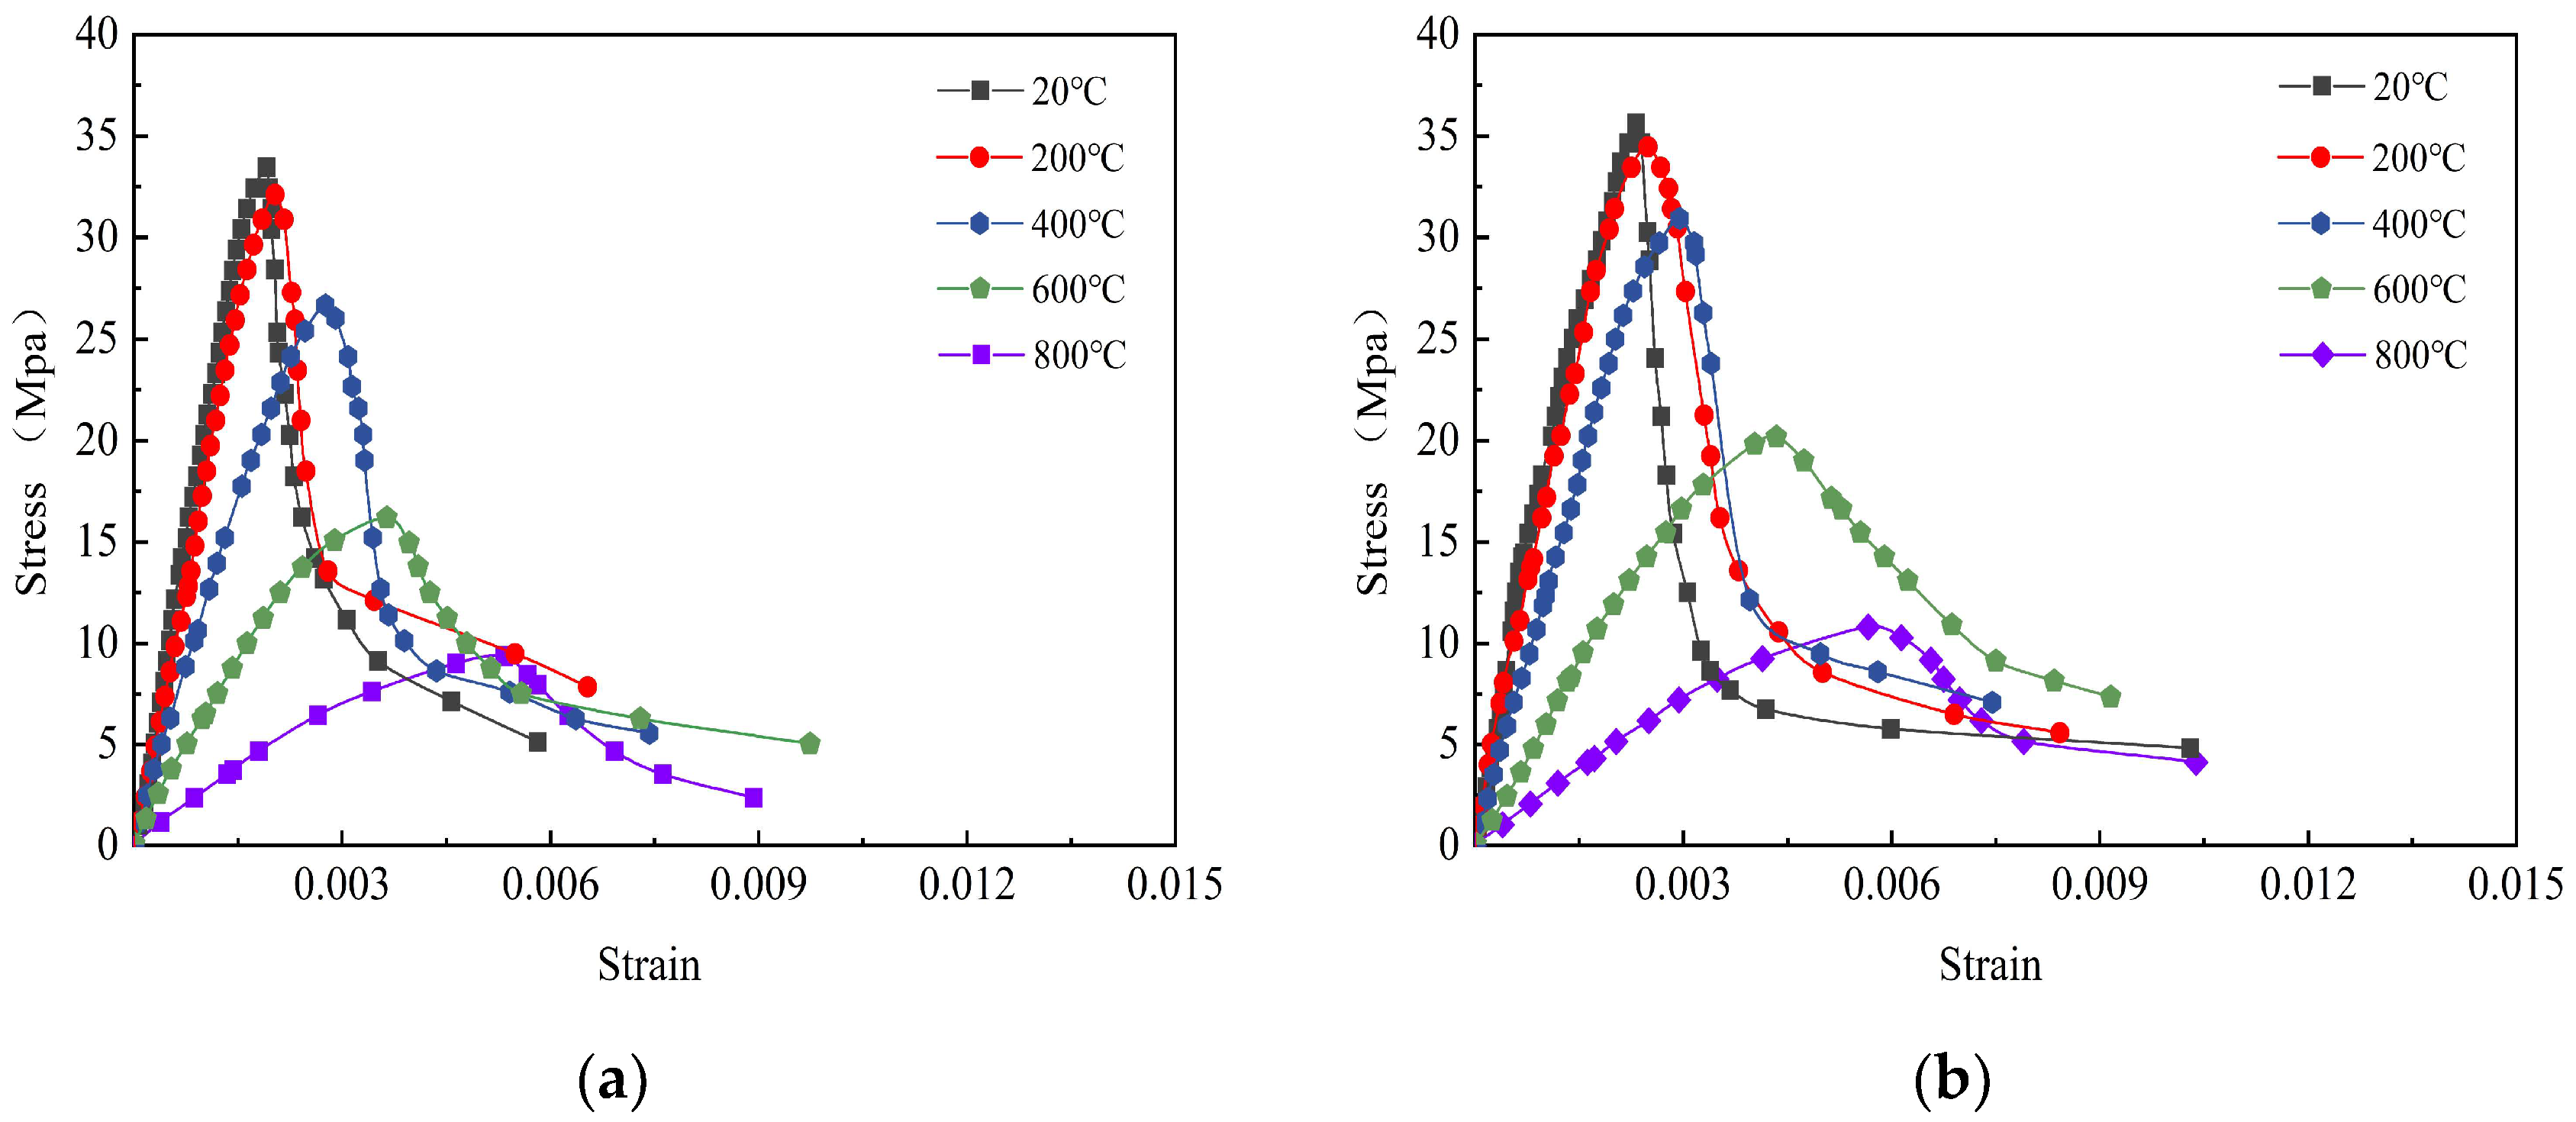
Fire 06 00119 g016
Figure 17. The stress–strain curves of SFSAC with steel fiber contents of 0% and 1% after elevated-temperature exposure. (a) 0-SAC-0. (b) 0-SAC-1.0.
Fire 06 00119 g017
Figure 18. Stress–strain curve of SFSAC with steel fiber contents of 0% and 1% after freeze-thaw cycle and then high temperature. (a) 25-SAC-0. (b) 25-SAC-1.0.
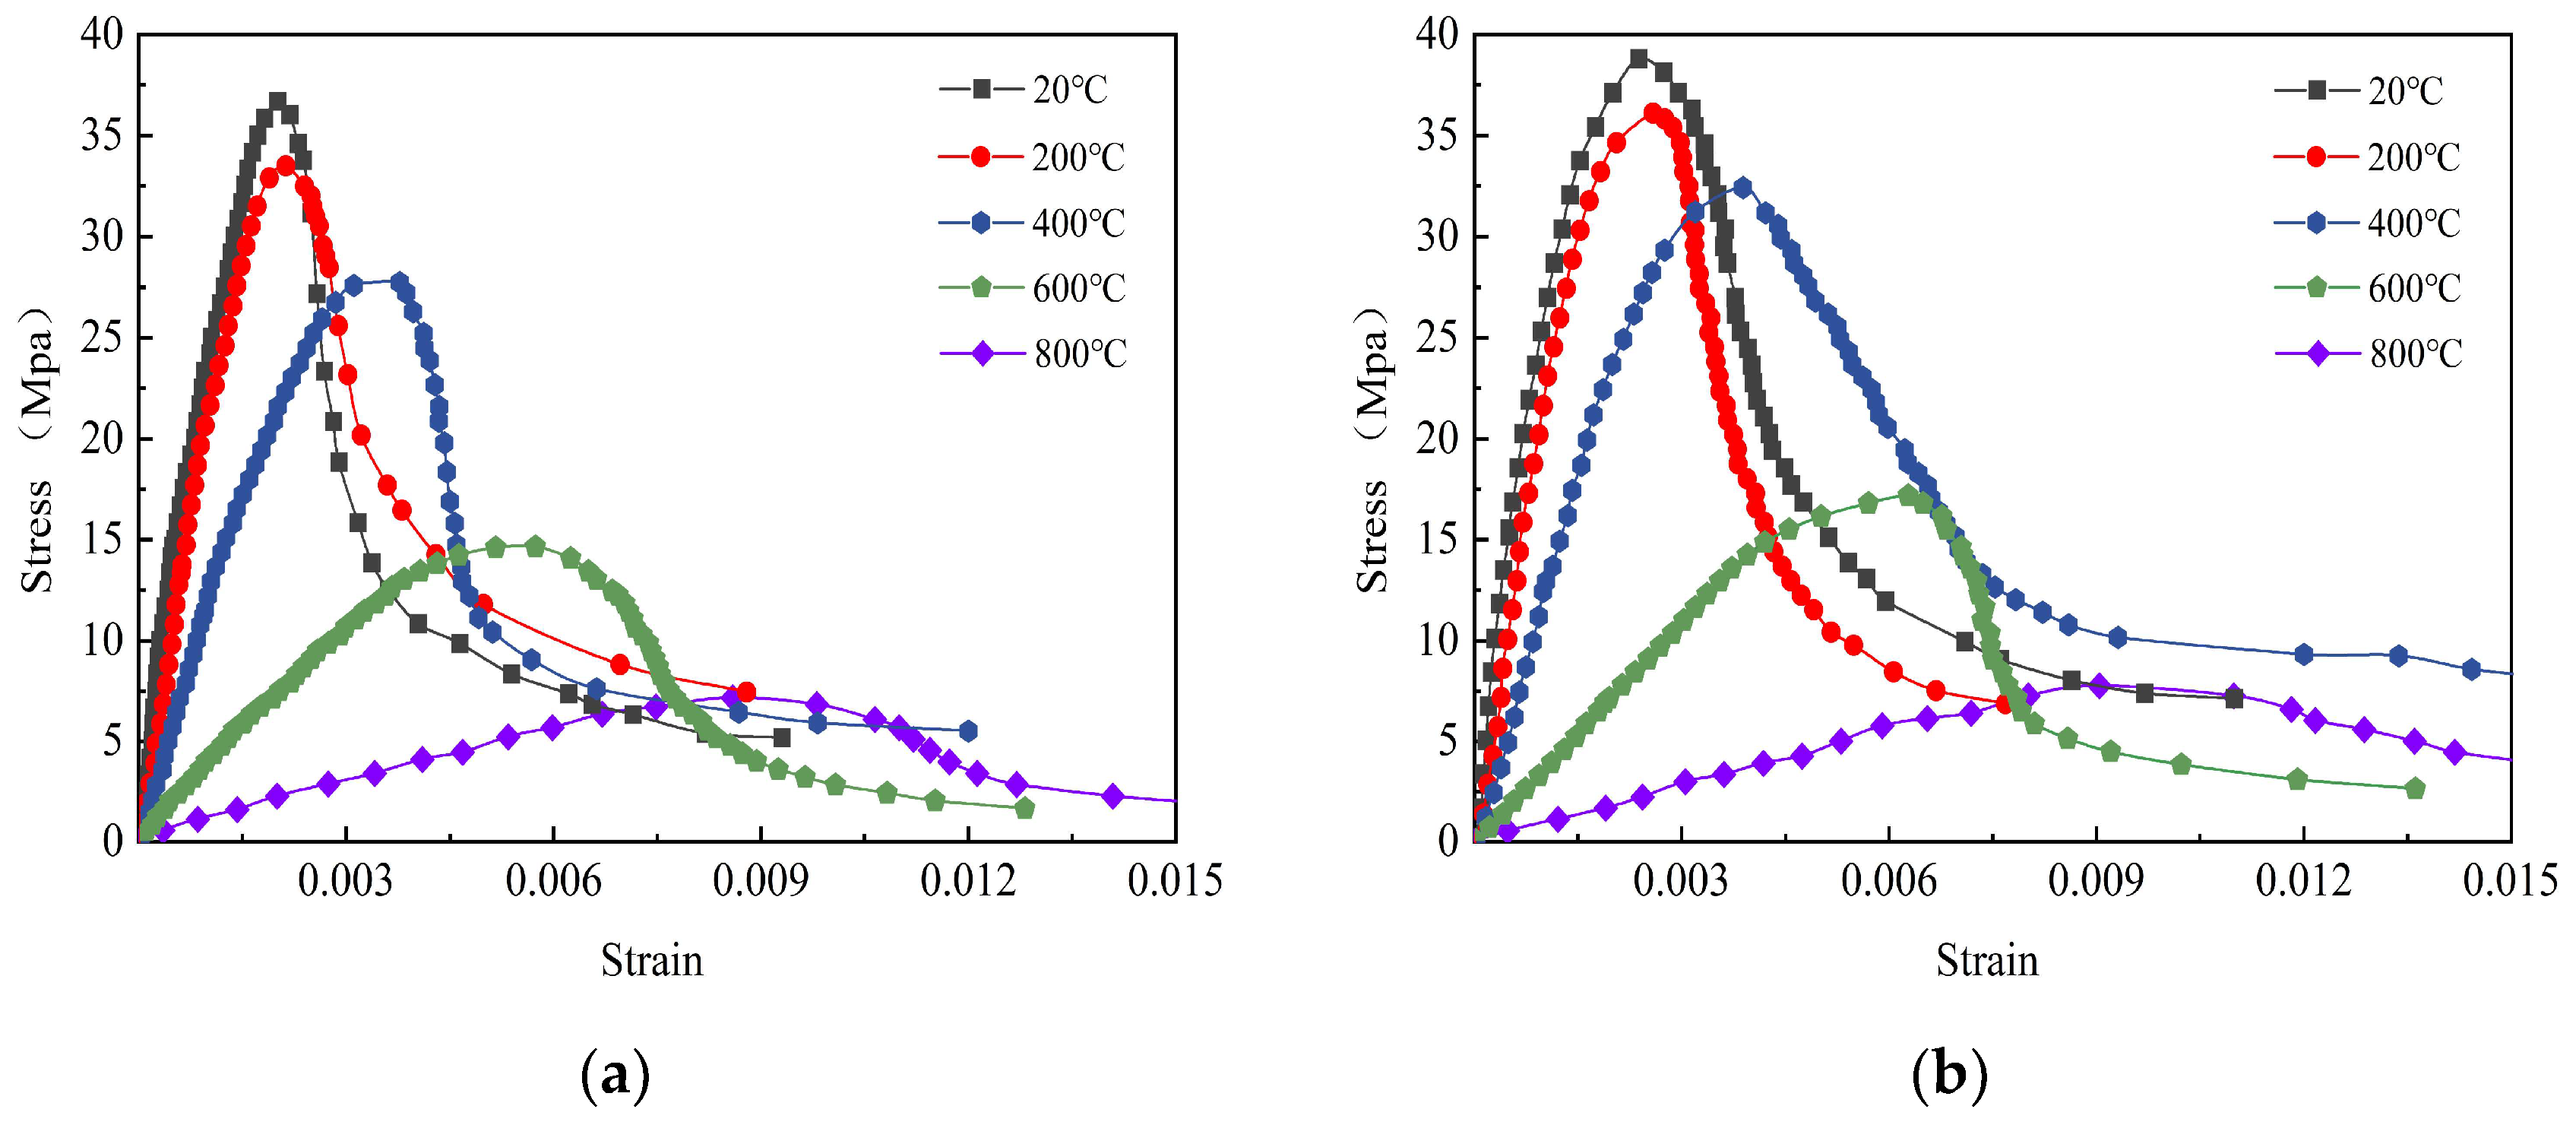
Fire 06 00119 g018
Figure 19. Stress–strain curve of SFNAC with steel fiber contents of 0% and 1% after elevated-temperature exposure. (a) 0-NAC-0. (b) 0-NAC-1.0.
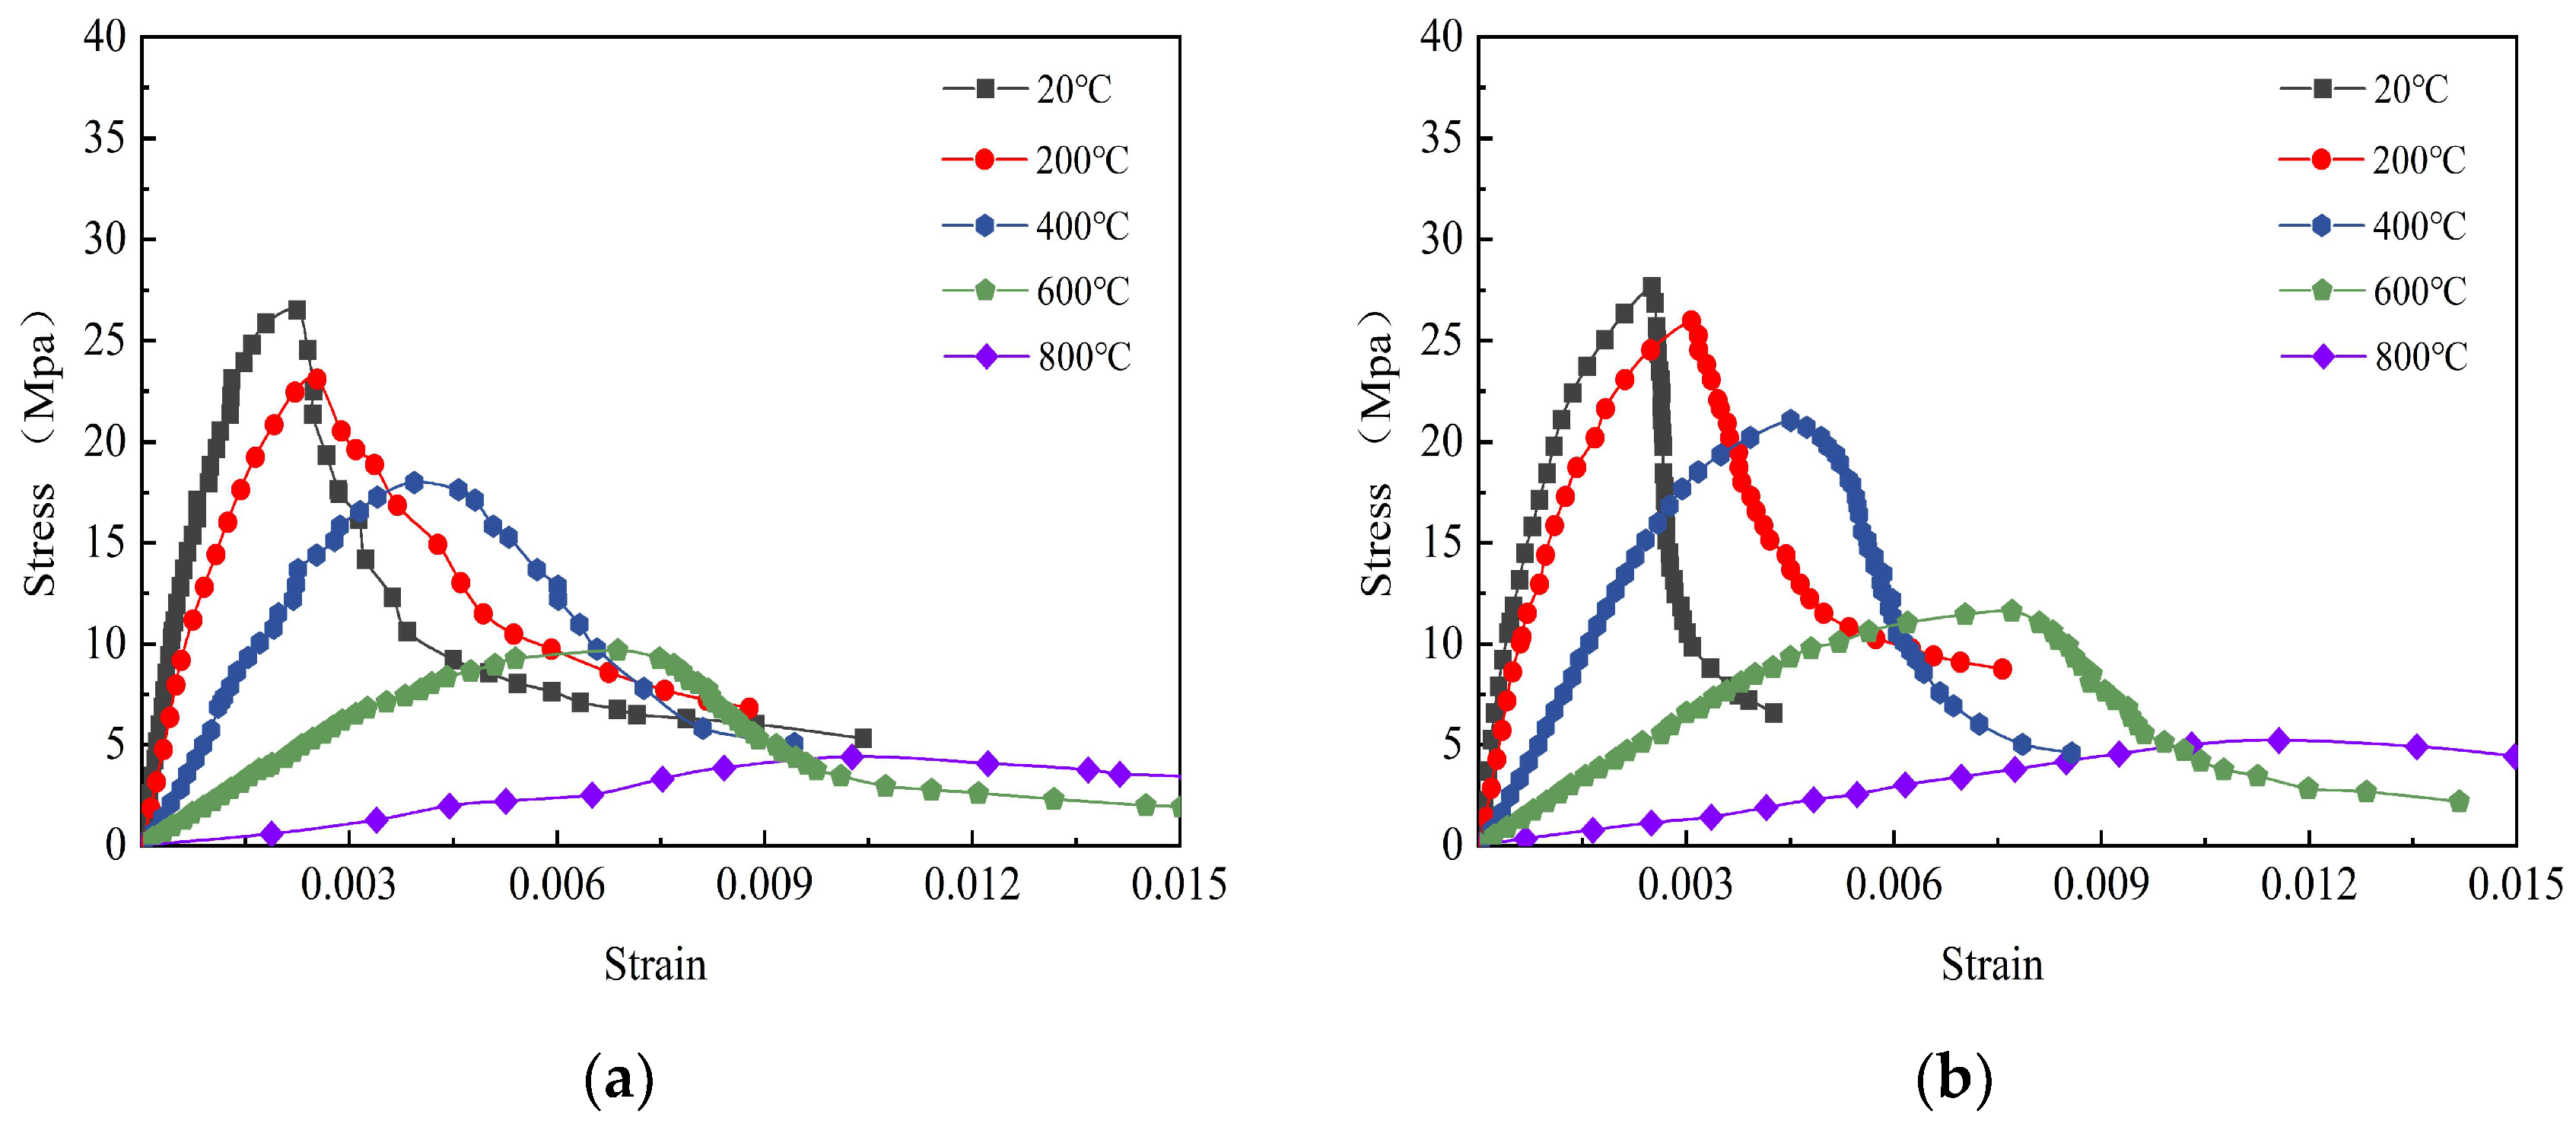
Fire 06 00119 g019
Figure 20. Stress–strain curve of SFNAC with steel fiber contents of 0% and 1% after freeze-thaw cycle and then high temperature. (a) 25-NAC-0. (b) 25-NAC-1.0.
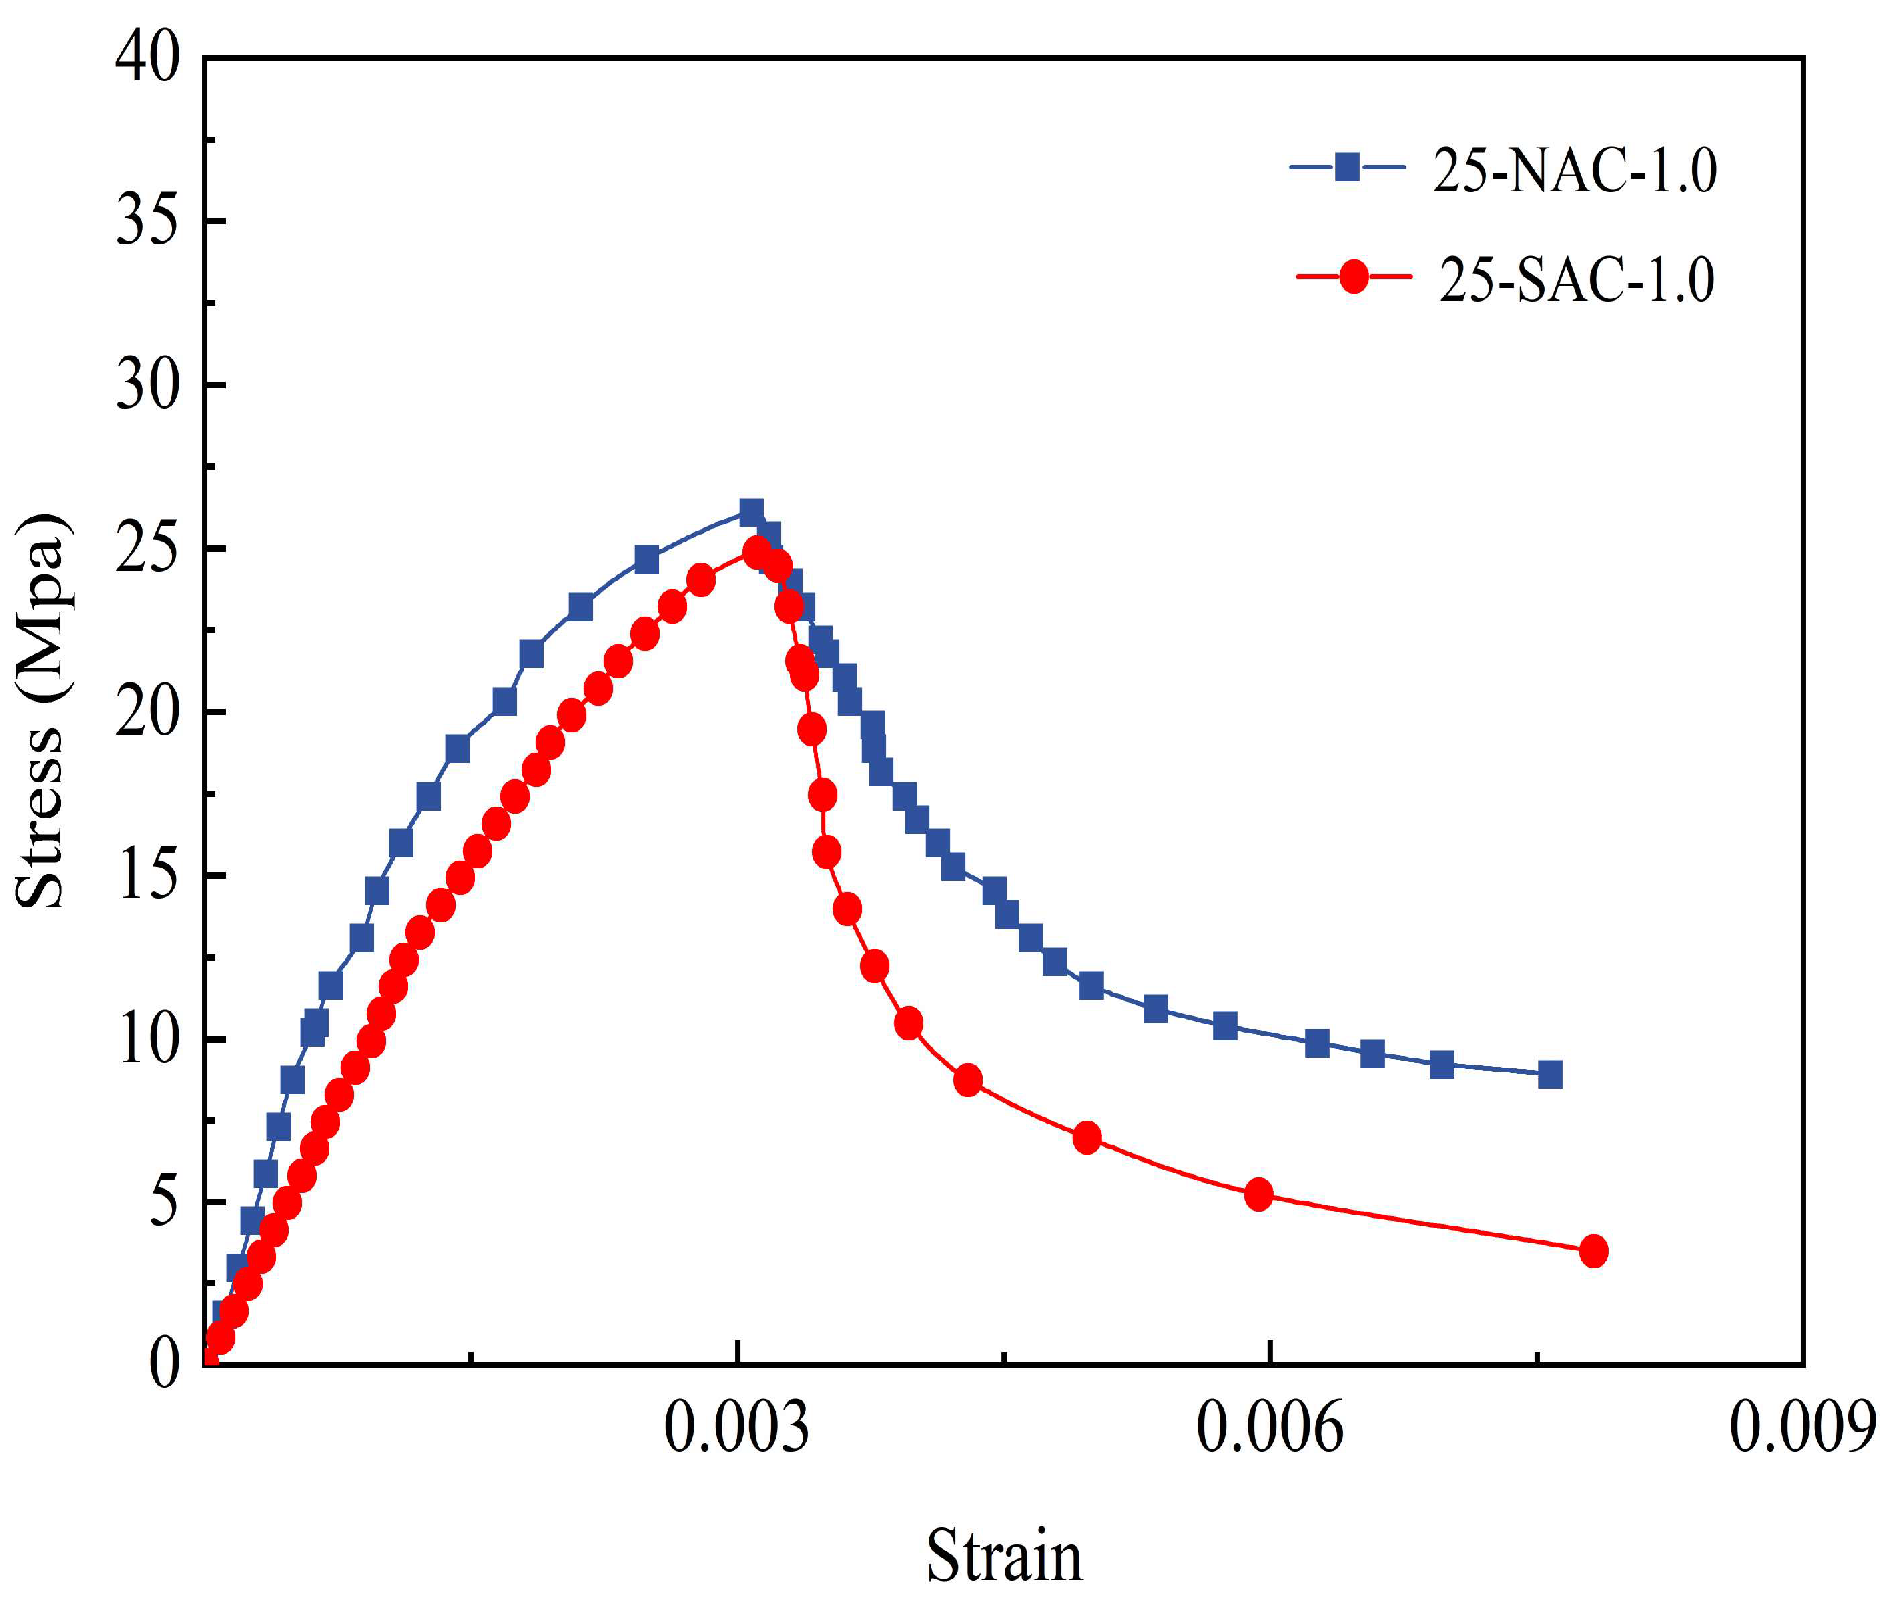
Fire 06 00119 g020
Figure 21. Comparison of stress–strain curves of 25-NAC-1.0-200 °C and 25-SAC-1.0-200 °C.
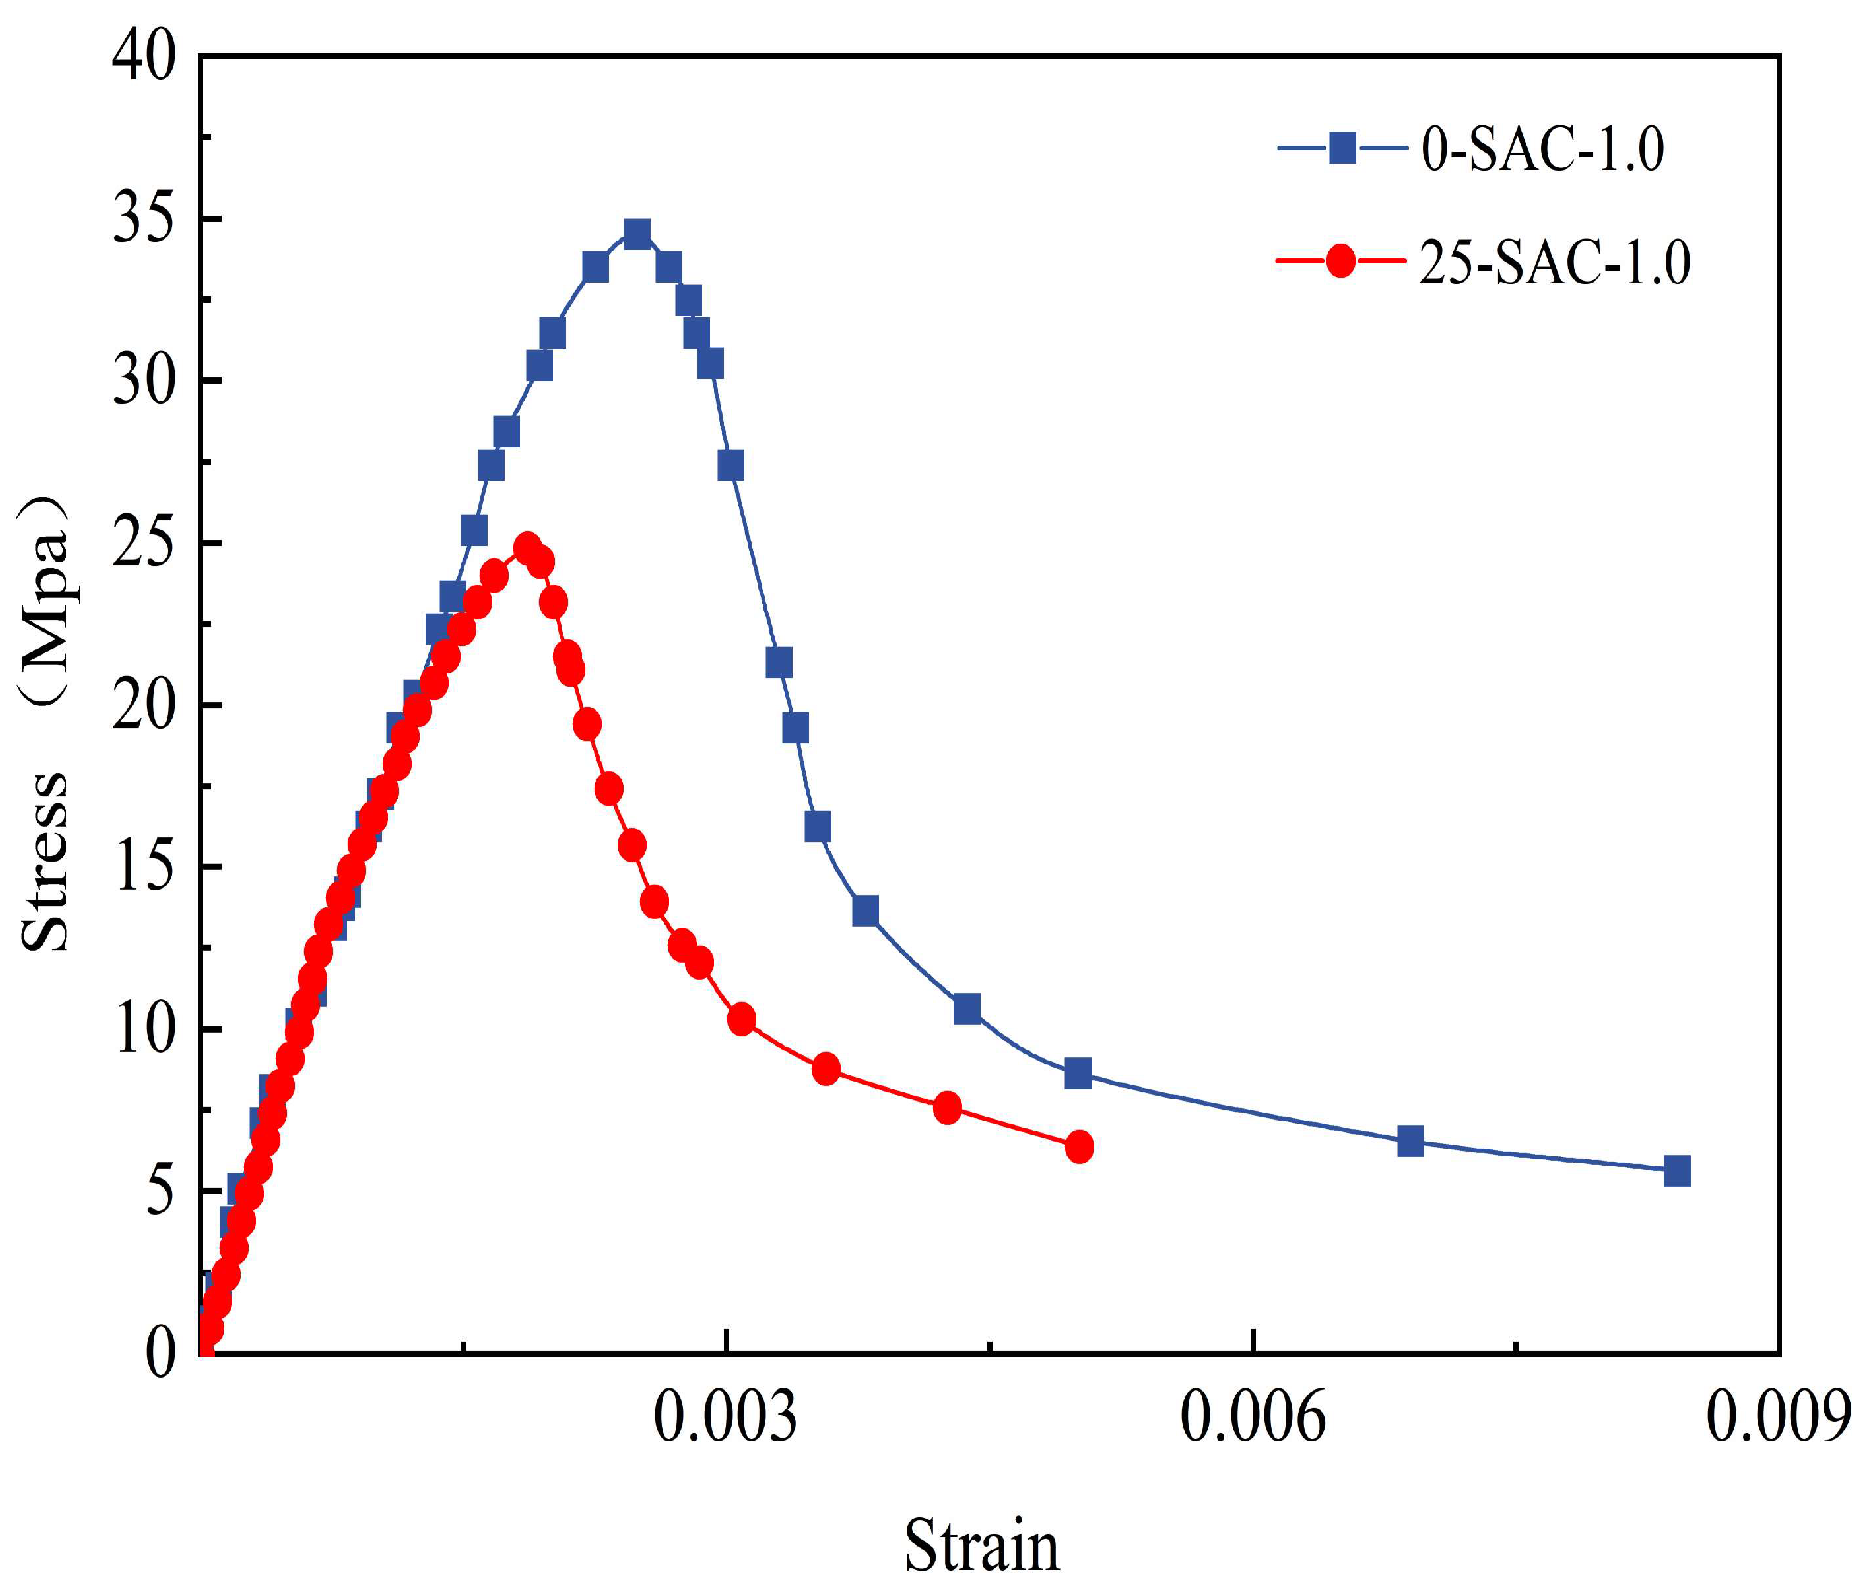
Fire 06 00119 g021
Figure 22. Comparison of stress–strain curves of 0-SAC-1.0-200 °C and 25-SAC-1.0-200 °C.
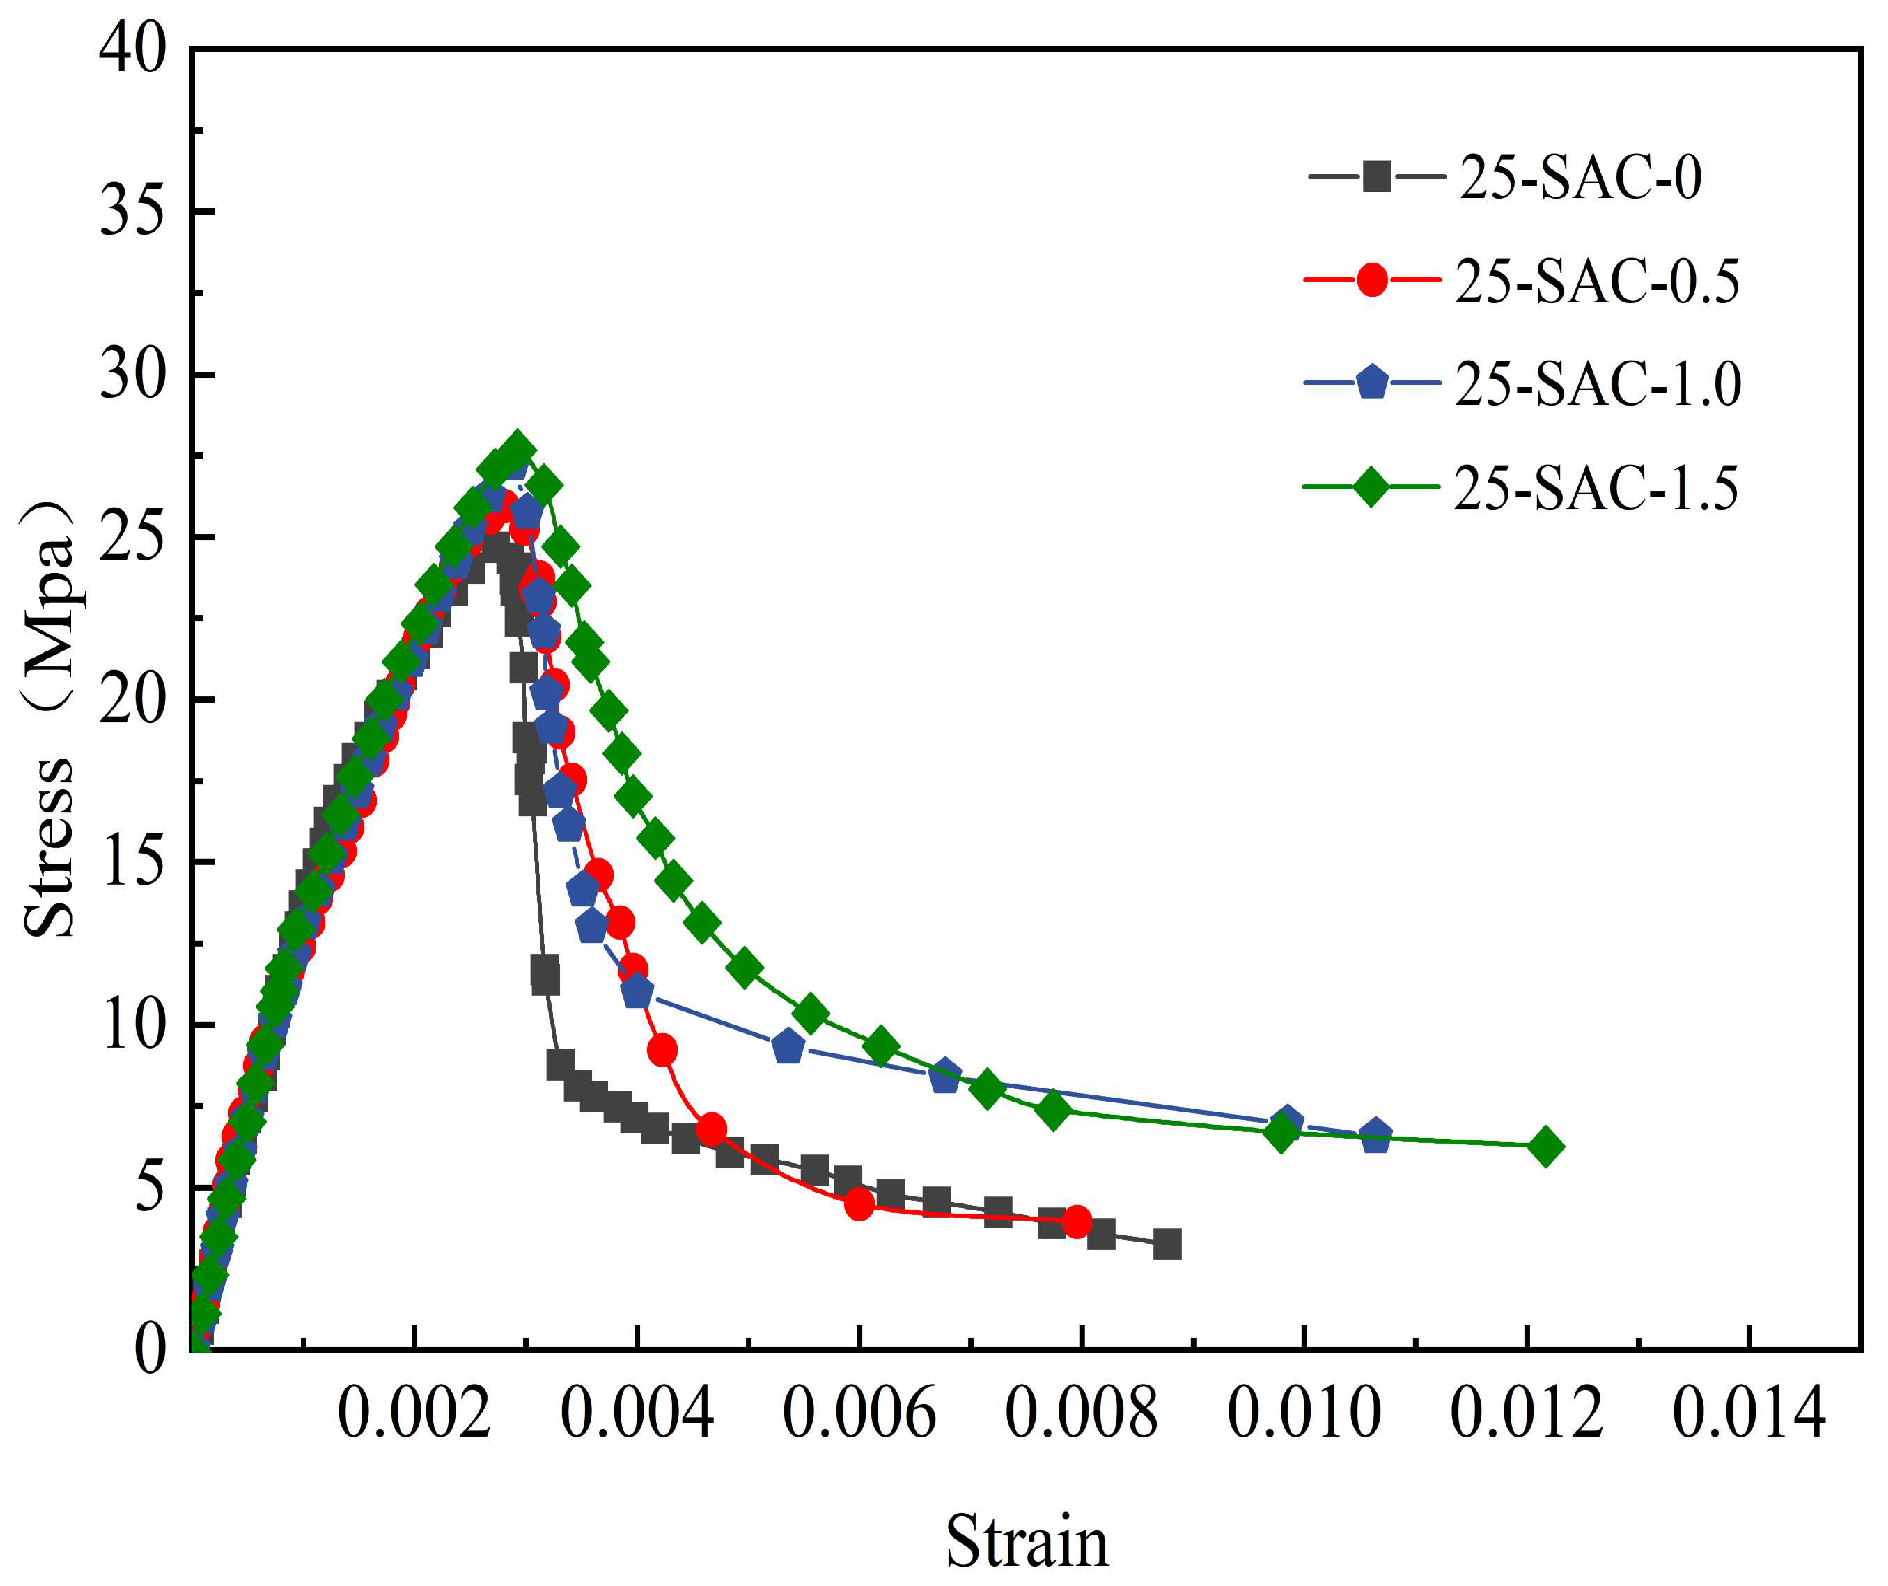
Fire 06 00119 g022
Figure 23. Stress–strain curves of SFSAC with various steel fiber contents after 25 freeze-thaw cycles.
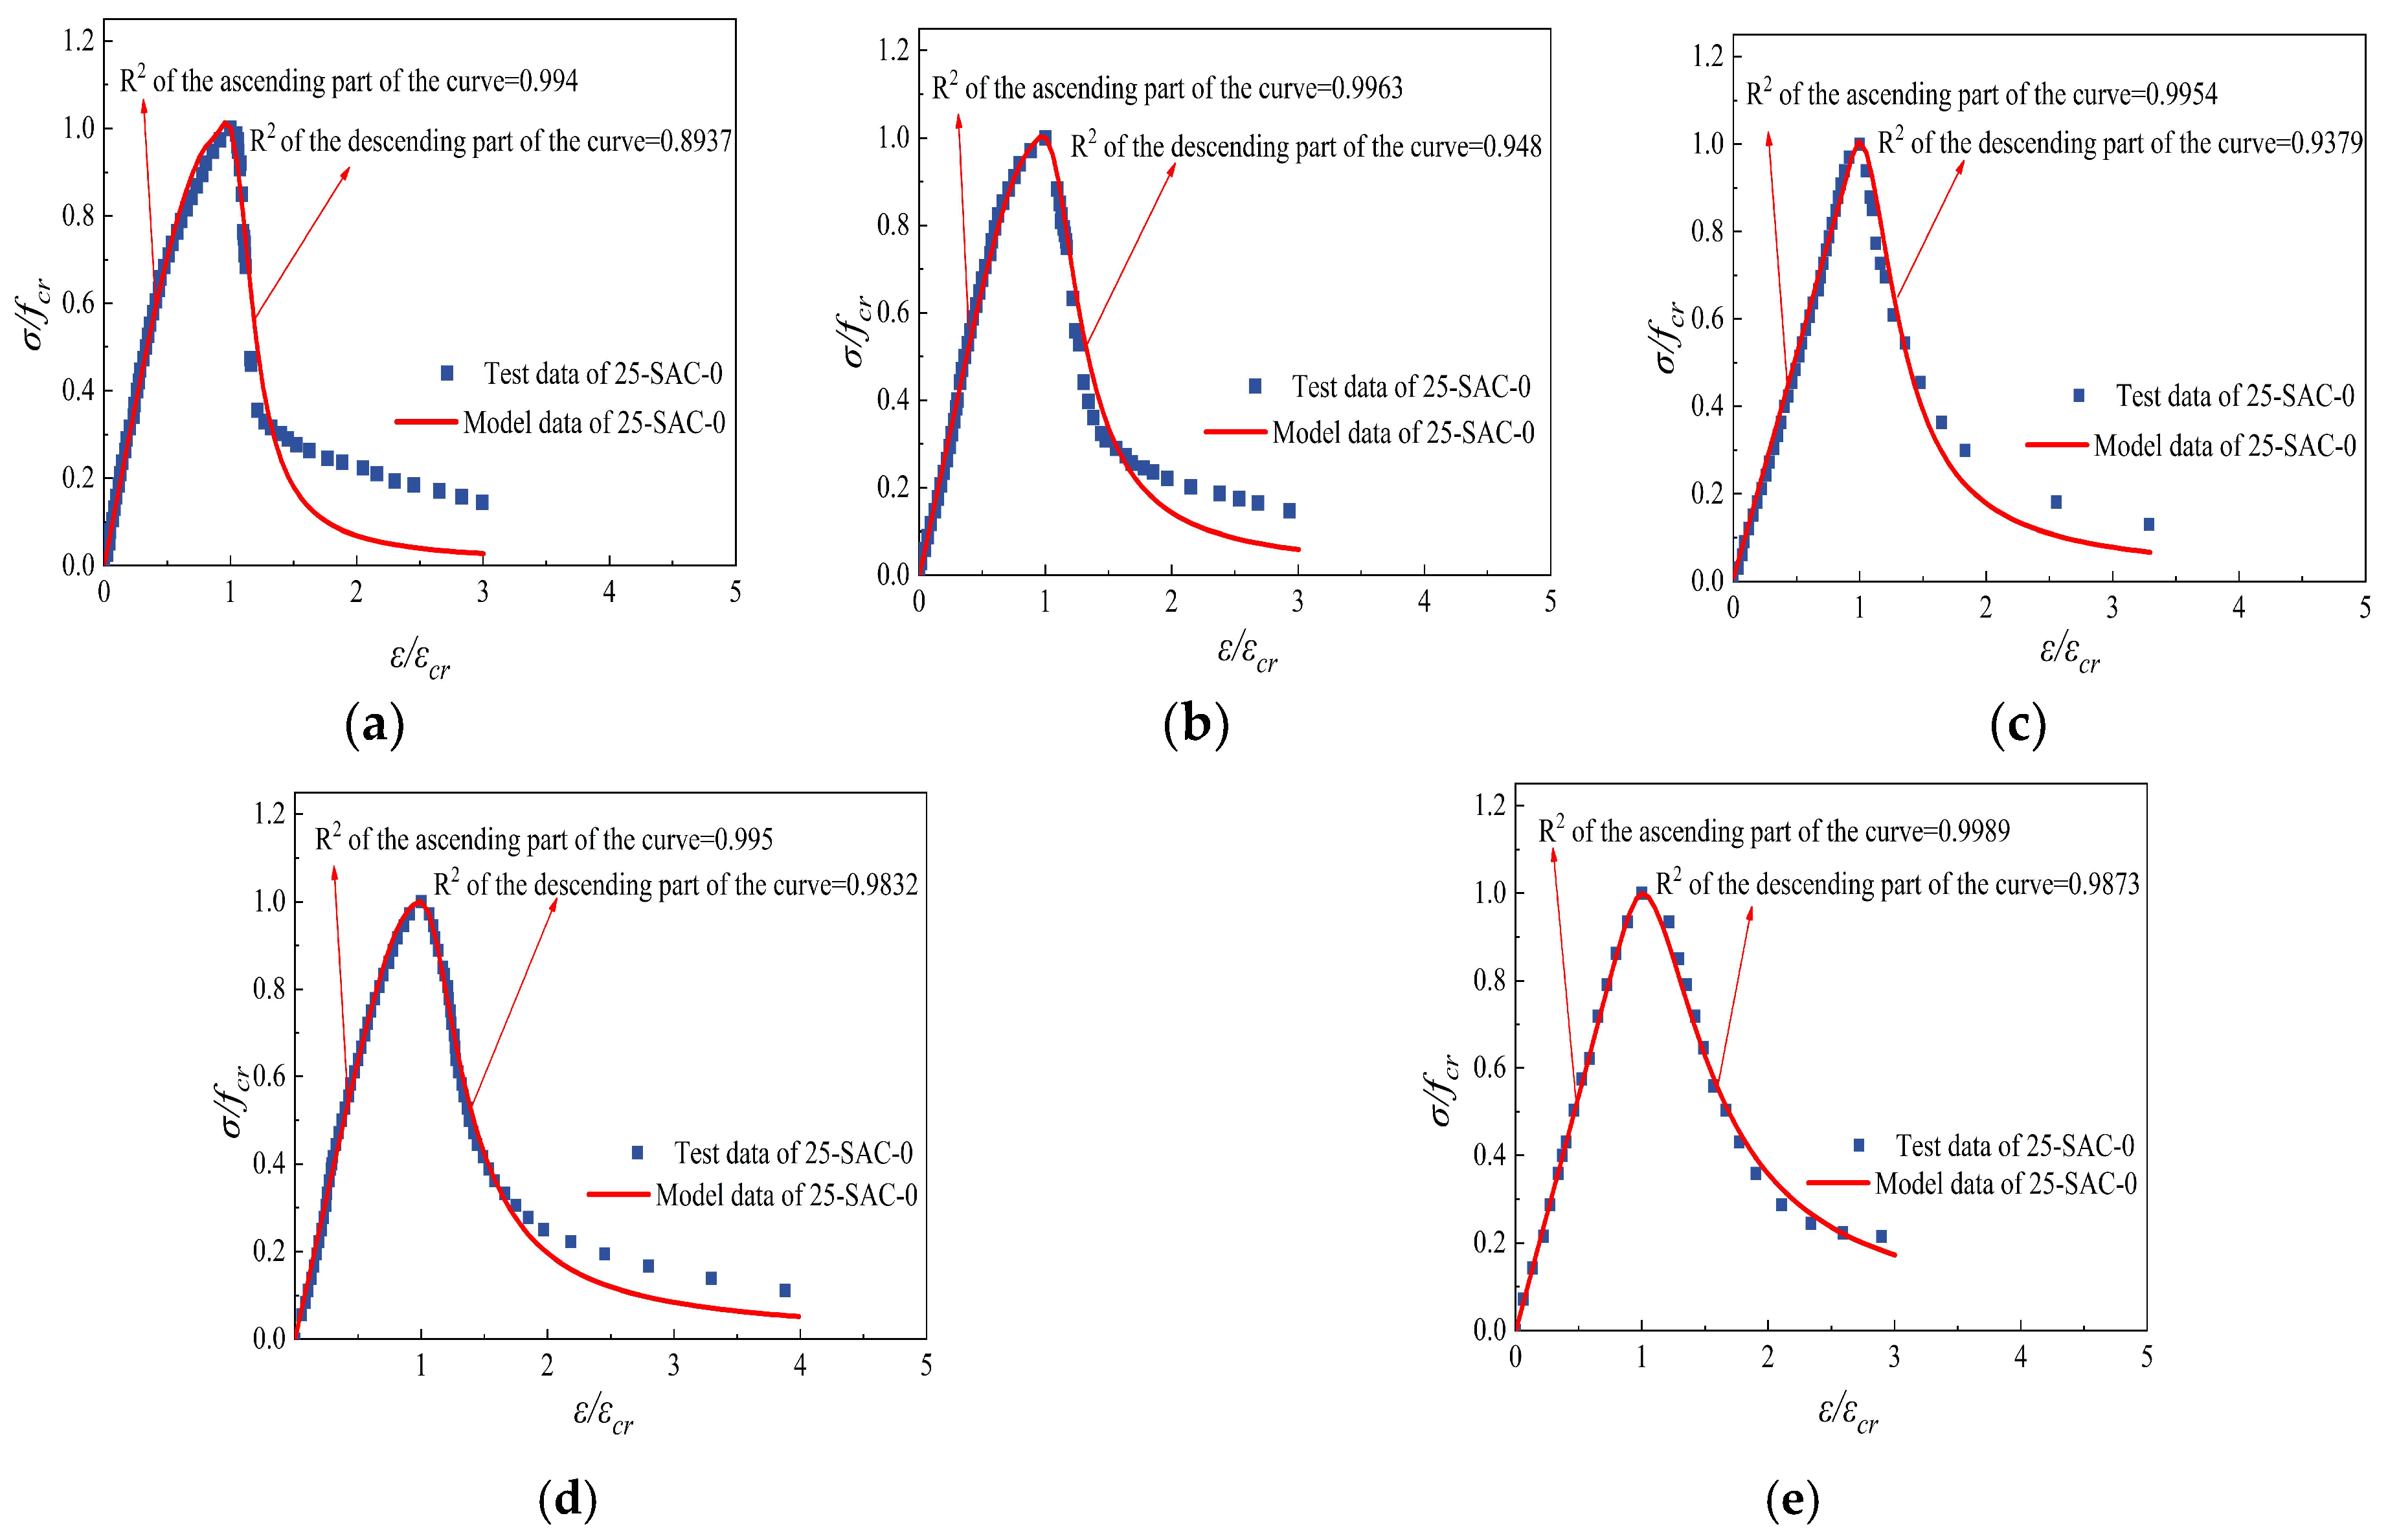
Fire 06 00119 g023
Figure 24. Comparison of constitutive curves tested and fitted of 25-SAC-0 after freeze-thaw cycle and then high temperature. (a) 25-SAC-0-20 °C (b) 25-SAC-0-200 °C (c) 25-SAC-0-400 °C (d) 25-SAC-0-600 °C (e) 25-SAC-0-800 °C.
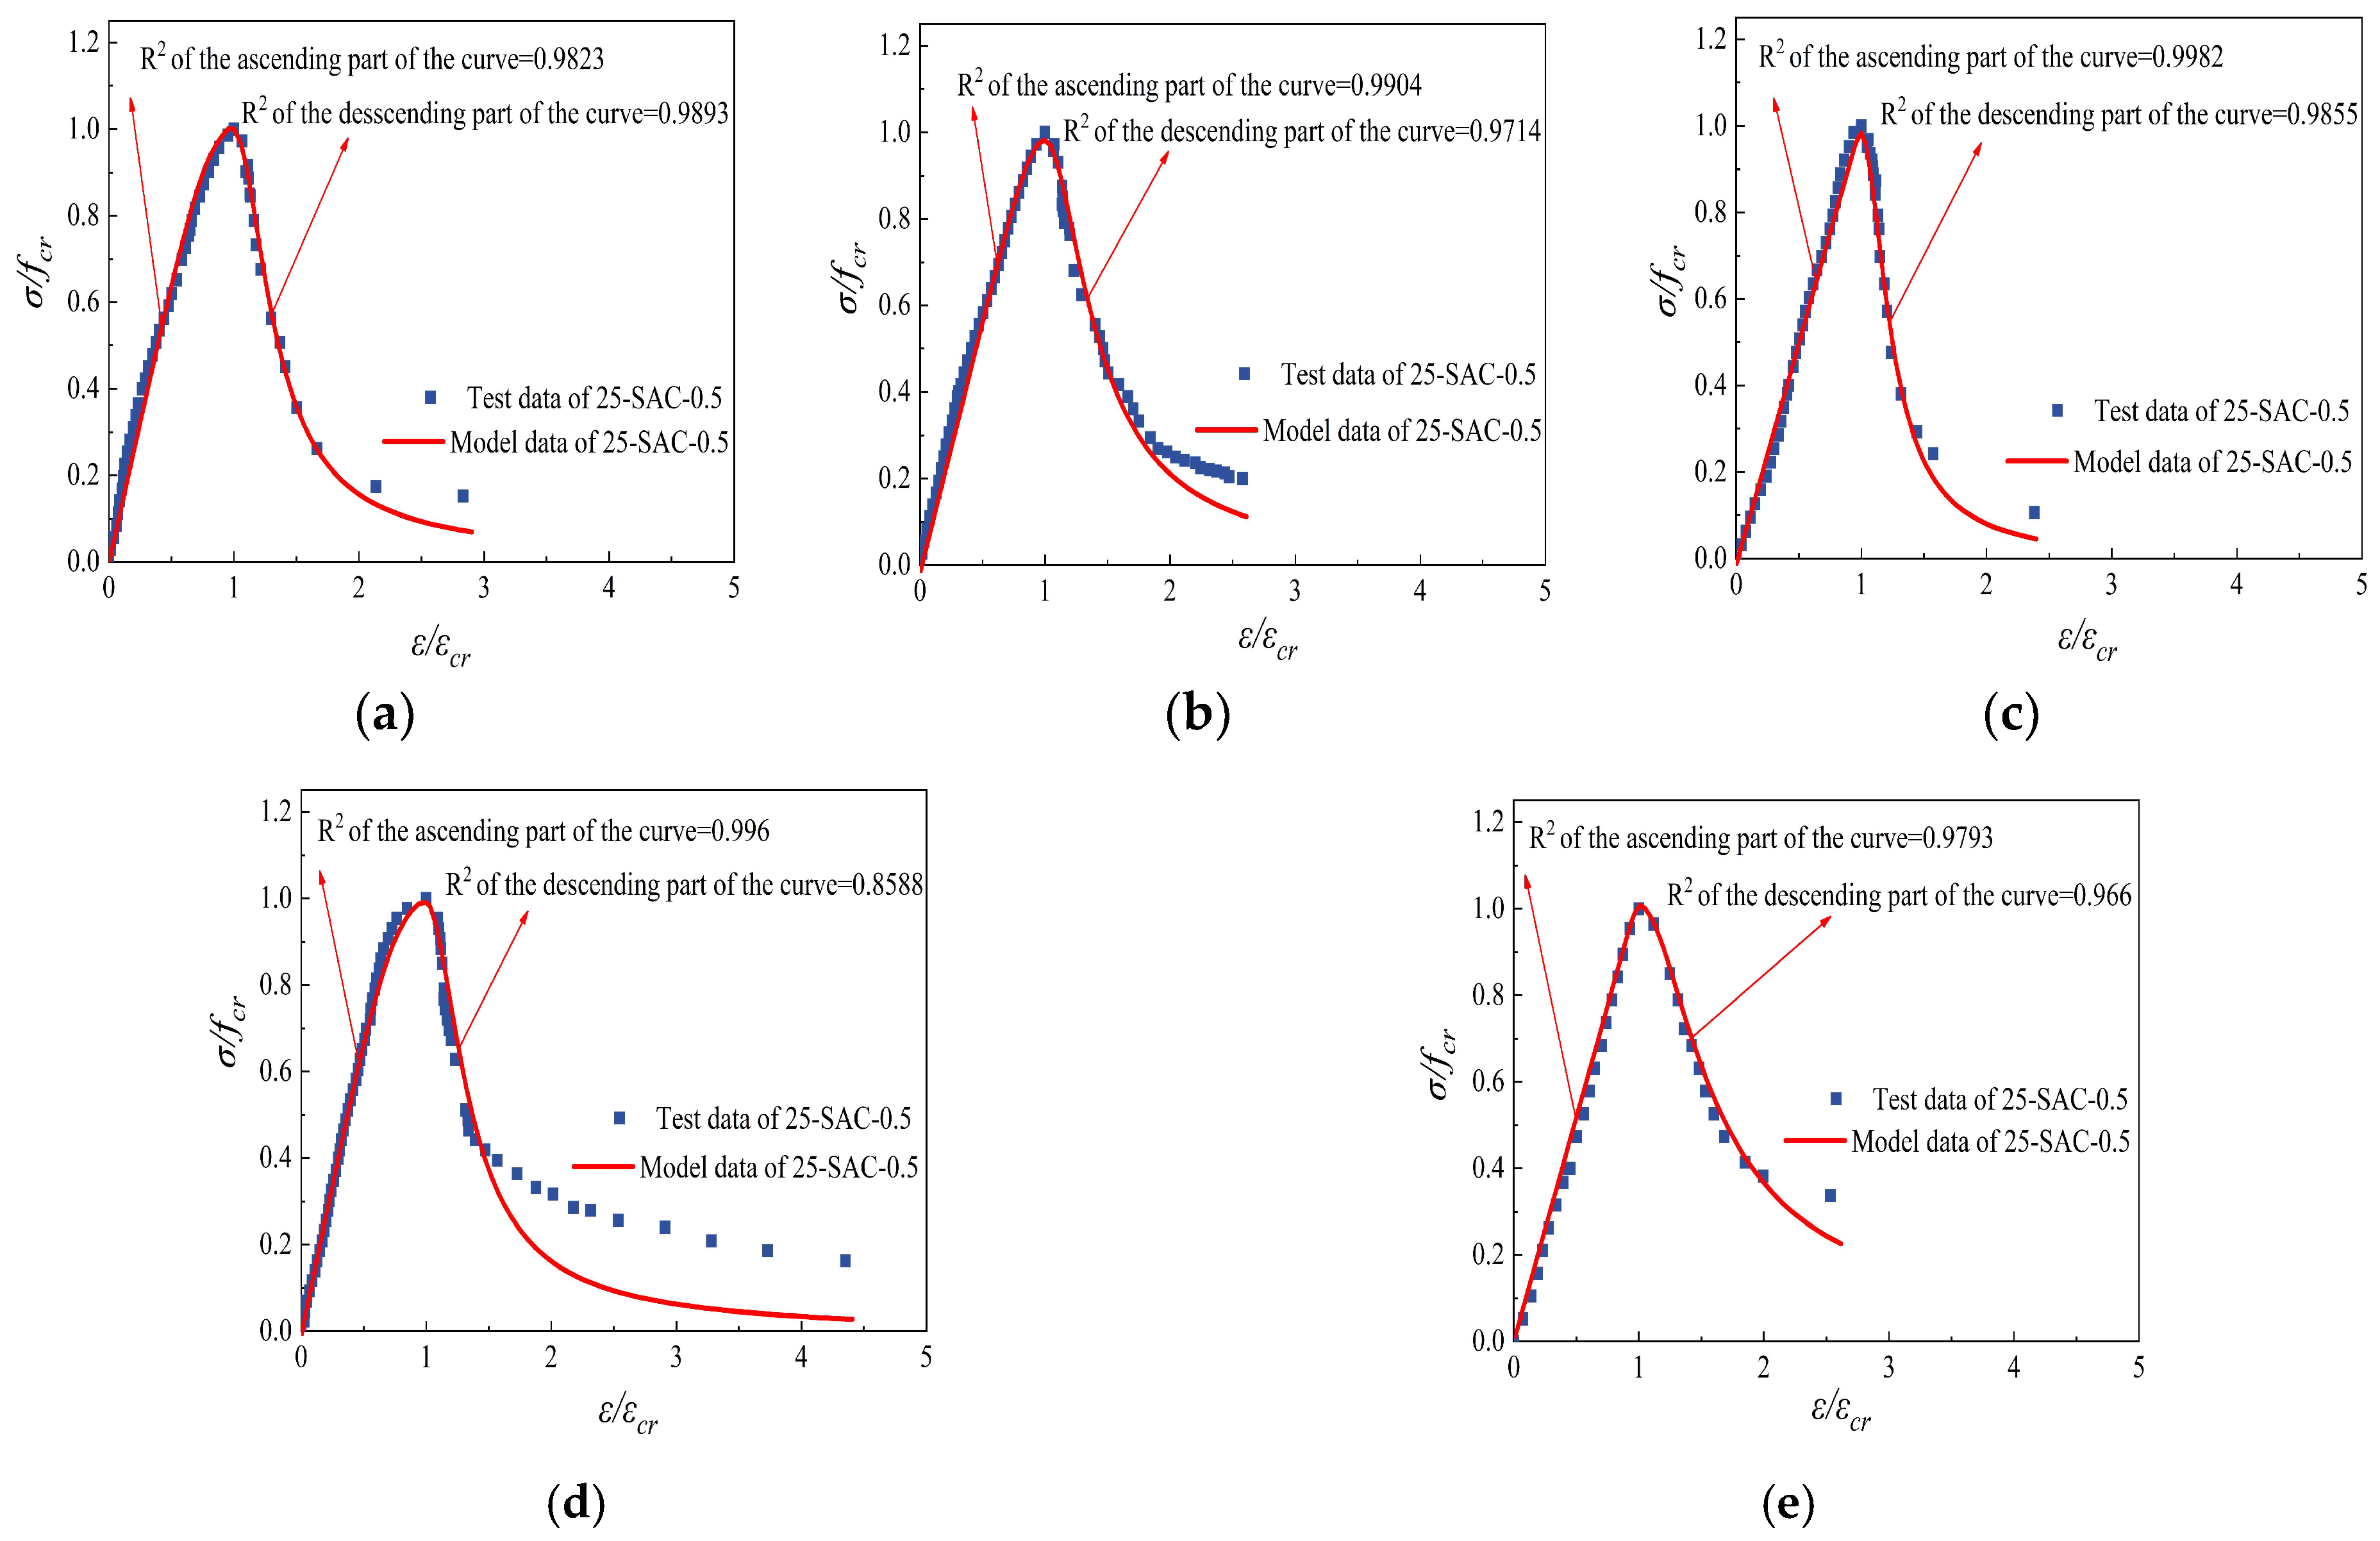
Fire 06 00119 g024
Figure 25. Comparison of constitutive curves tested and fitted of 25-SAC-0.5 after freeze-thaw cycle and then high temperature. (a) 25-SAC-0.5-20 °C (b) 25-SAC-0.5-200 °C (c) 25-SAC-0.5-400 °C (d) 25-SAC-0.5-600 °C (e) 25-SAC-0.5-800 °C.
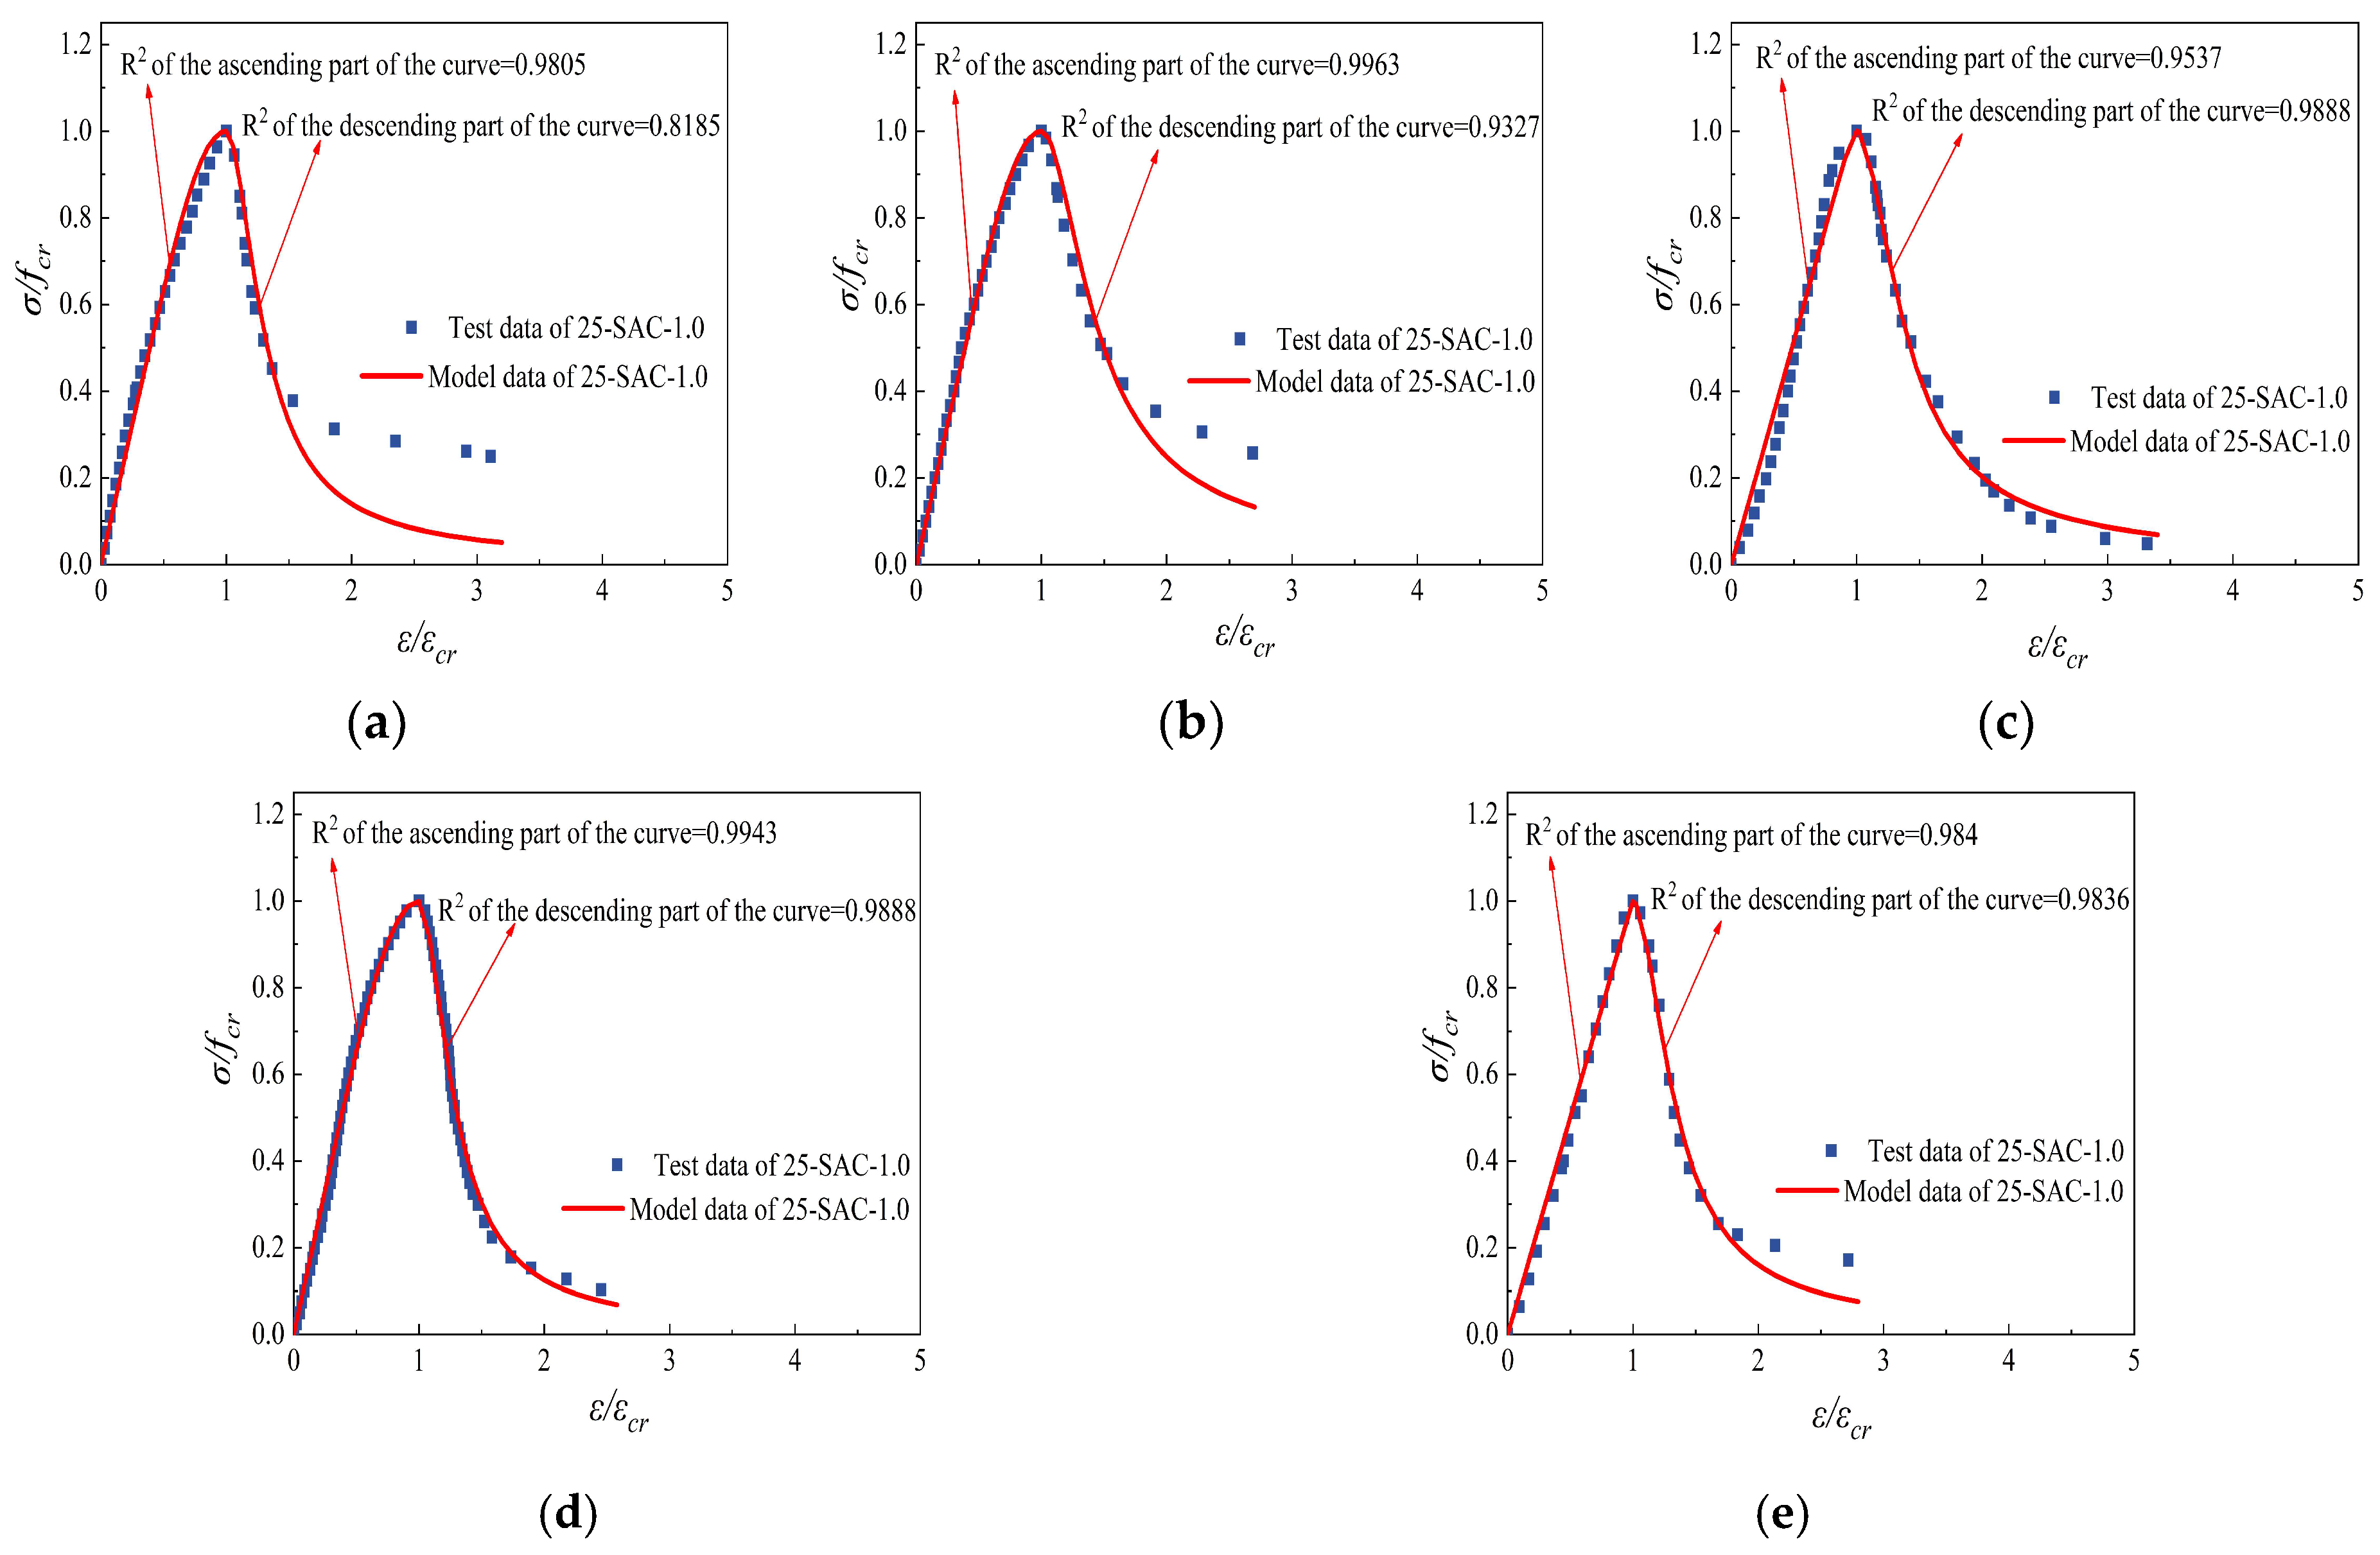
Fire 06 00119 g025
Figure 26. Comparison of constitutive curves tested and fitted of 25-SAC-1.0 after freeze-thaw cycle and then high temperature. (a) 25-SAC-1.0-20 °C (b) 25-SAC-1.0-200 °C (c) 25-SAC-1.0-400 °C (d) 25-SAC-1.0-600 °C (e) 25-SAC-1.0-800 °C.
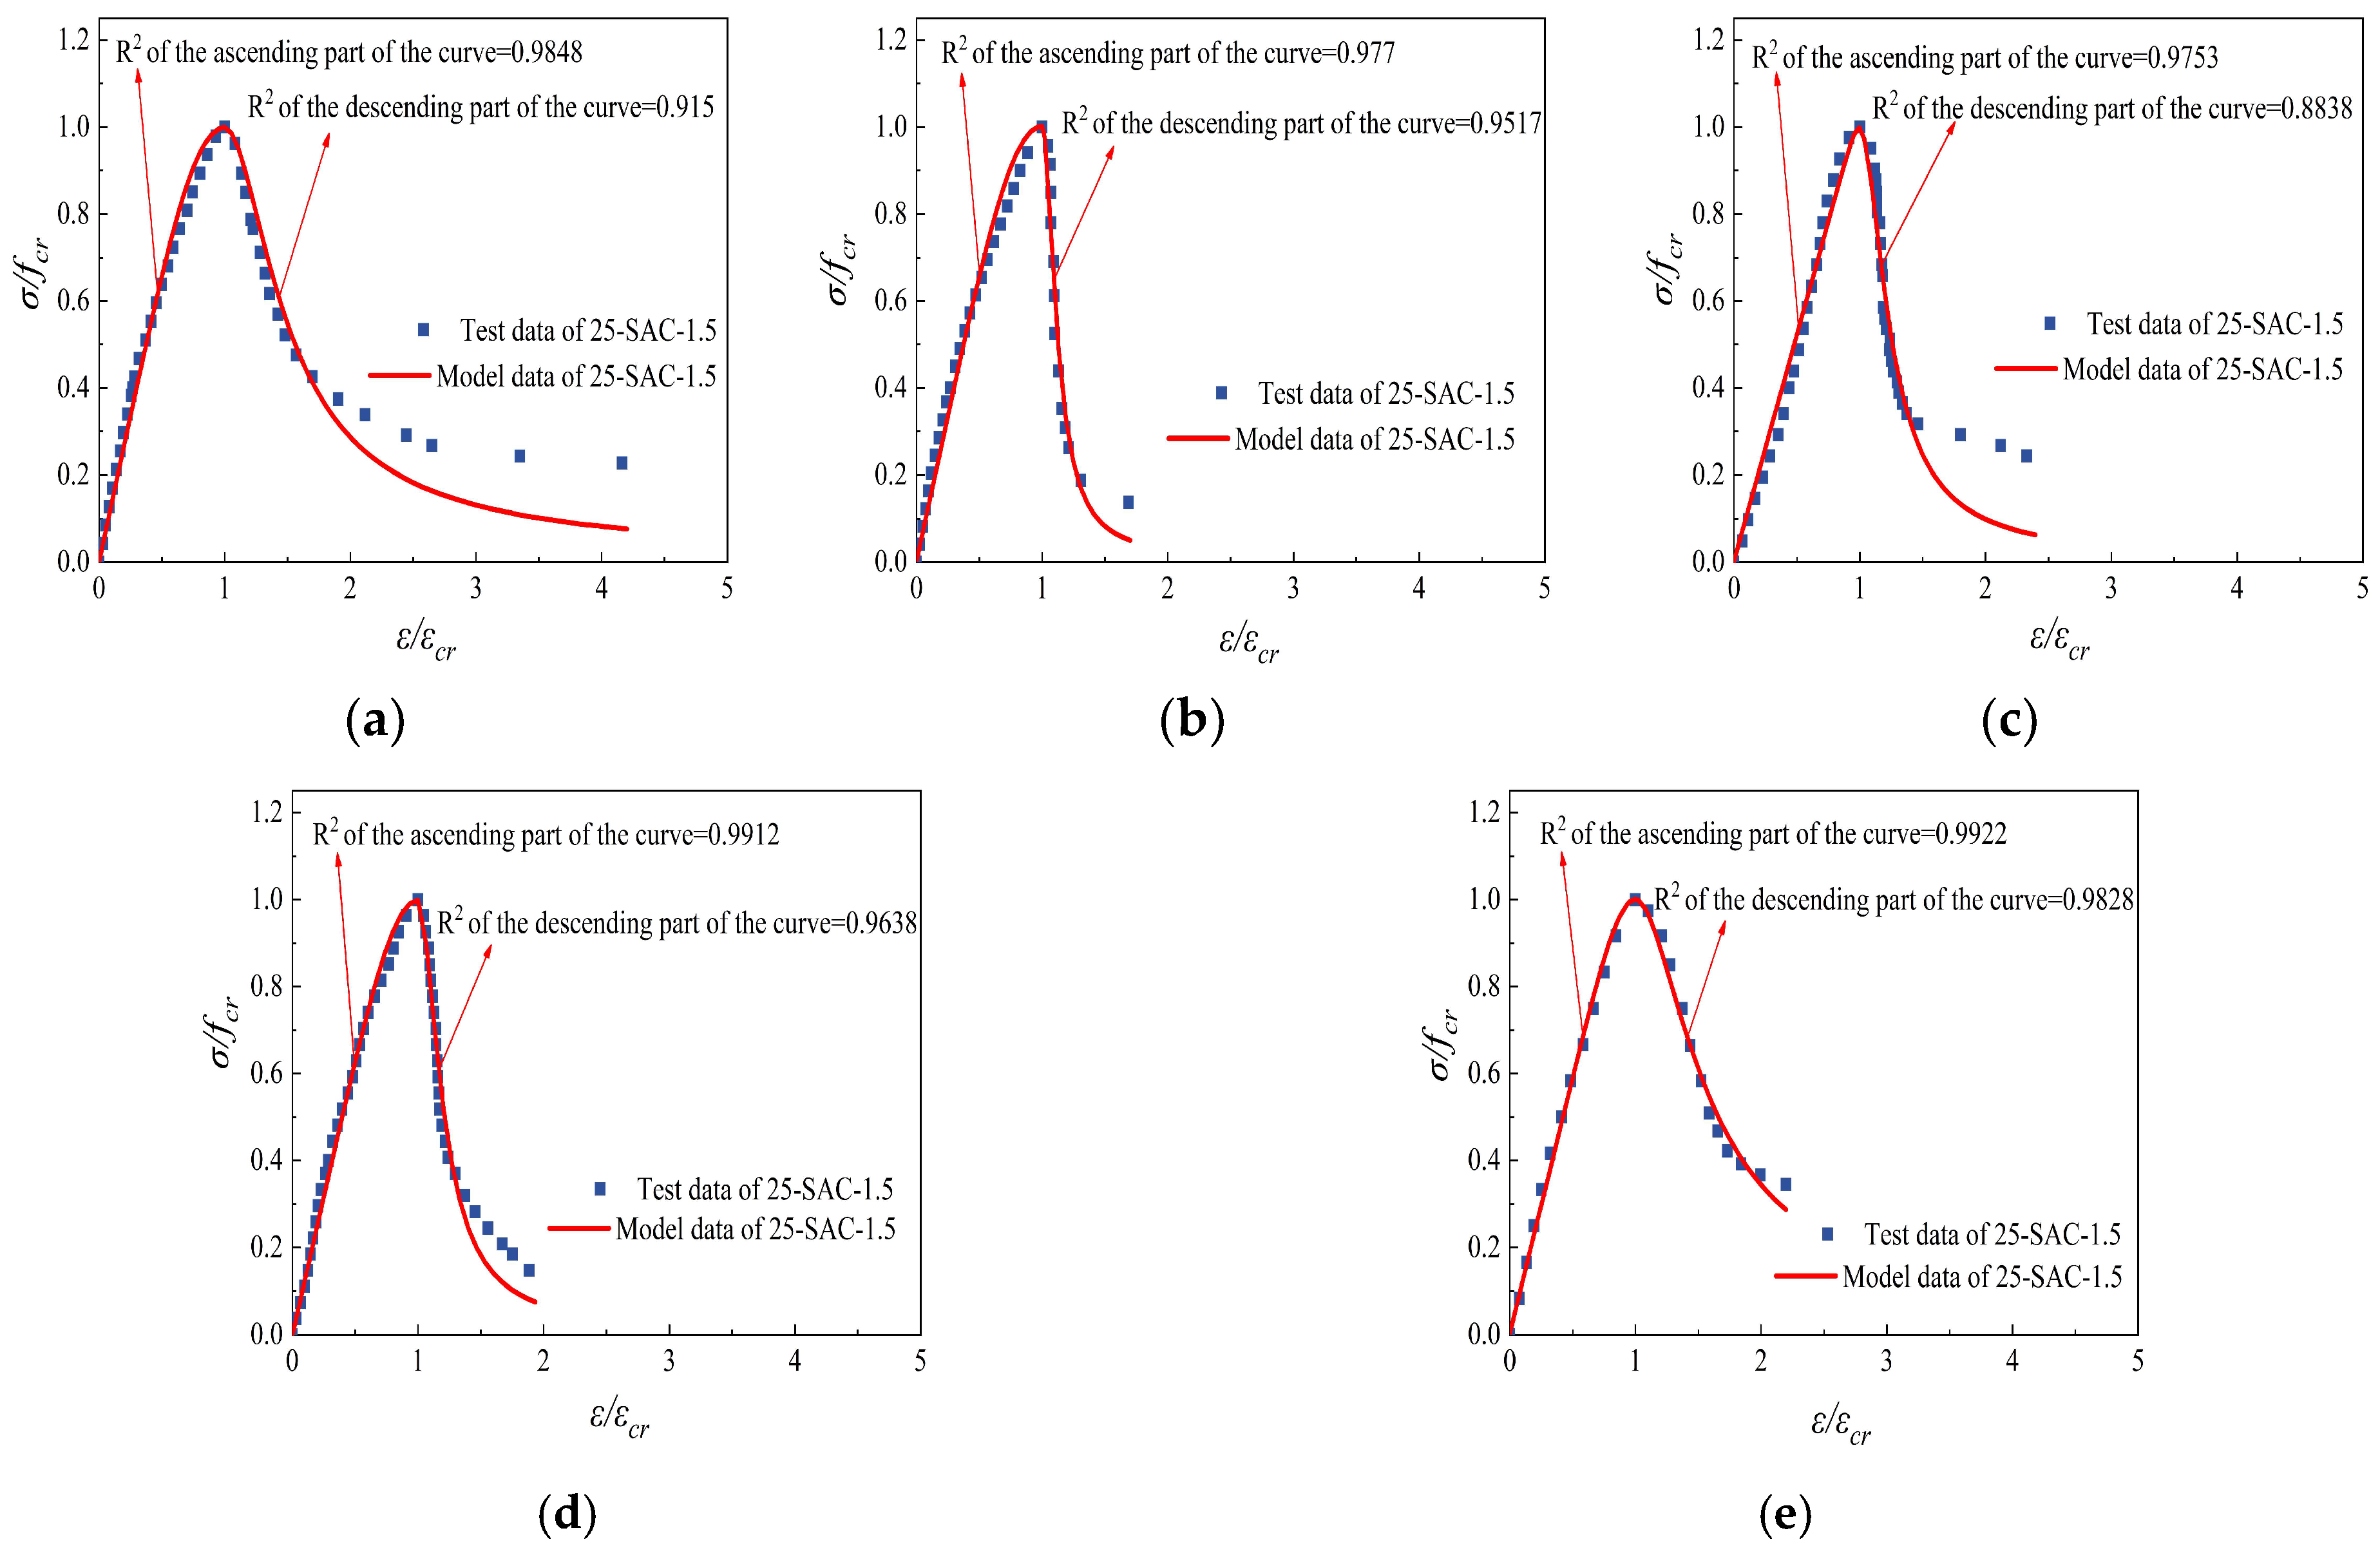
Fire 06 00119 g026
Figure 27. Comparison of constitutive curves tested and fitted of 25-SAC-1.5 after freeze-thaw cycle and then high temperature. (a) 25-SAC-1.5-20 °C (b) 25-SAC-1.5-200 °C (c) 25-SAC-1.5-400 °C (d) 25-SAC-1.5-600 °C (e) 25-SAC-1.5-800 °C.
Fire 06 00119 g027
Table 1. Materials for experimental.
MaterialsInformation
CementP.O42.5 ordinary Portland cement of Jilin Yatai Cement Co., Ltd., Changchun, China.
SandRiver sand; the fineness modulus: 2.7; the bulk density: 1260 kg/m3
StoneOrdinary gravel; size gradation: 16–35 mm; the bulk density: 1480 kg/m3
ScoriaSize gradation: 5–25 mm; the bulk density: 750 kg/m3; 1 h water absorption: 35.6%; crushing index: 21%
Fly ashI grade fly ash of Changchun FAW Group; the bulk density: 2560 kg/m3
SFWave type; density: 7900 kg/m3; tensile strength: 1300 MPa; elastic modulus: 3.75 GPa; crack elongation: 3.2%; aspect ratio: 52
WaterOrdinary tap water
Table 2. Chemical composition of volcanic scoria.
Chemical CompositionSiO2Al2O3TFe2O3CaOMgOK2ONa2OTiO2P2O5MnOLOI
Content (%)67.8514.503.552.240.852.592.560.510.100.095.04
Table 3. Mineral composition of volcanic scoria.
Mineral CompositionPlagioclasePyroxeneAmorphous Material
Content (%)302050
Table 4. Mix ratio of fiber reinforced scoria aggregate concrete.
GroupsCementWaterFly AshSandGravelScoriaVSF
NAC-038221085564112700
NAC-0.538221085564112700.5
NAC-1.038221085564112701.0
NAC-1.538221085564112701.5
SAC-0382210855646762580
SAC-0.5382210855646762580.5
SAC-1.0382210855646762581.0
SAC-1.5382210855646762581.5
Note: VSF represents the SF volume contents; The units of other materials are all kg/m3.
Table 5. Cube compressive strength of all test blocks (MPa).
Number of Freezing and ThawingGroupsTemperature (°C)
20 °C200 °C400 °C600 °C800 °C
0SAC-041.440.933.420.711.8
0SAC-0.543.342.935.923.512.2
0SAC-1.044.043.738.226.013.9
0SAC-1.544.244.139.127.314.0
0NAC-046.042.834.617.99.0
0NAC-0.546.643.536.319.29.7
0NAC-1.048.645.839.821.110.0
0NAC-1.549.147.040.921.910.1
25SAC-031.828.422.714.08.0
25SAC-0.534.030.025.315.99.1
25SAC-1.034.832.027.117.810.2
25SAC-1.535.032.827.818.711.0
25NAC-033.929.423.311.85.6
25NAC-0.534.730.524.713.06.1
25NAC-136.032.927.114.36.8
25NAC-1.536.033.528.015.06.9
Note: The content of volcanic scoria and steel fiber in the table is volumetric contents.
Table 6. The fitting formulas for the cube compressive strengths of SFSAC.
Steel Fiber ContentCompressive Strength Fitting FormulaR2
VSF = 0% f cu,T f cu = 1.025 0.06593 T 100 0.004124 T 100 2 (5)0.9932
VSF = 0.5% f cu,T f cu = 1.018 0.05377 T 100 0.005229 T 100 2 (6)0.9932
VSF = 1.0% f cu,T f cu = 1.015 0.03001 T 100 0.007433 T 100 2 (7)0.9943
VSF = 1.5% f cu,T f cu = 1.015 0.03658 T 100 0.006901 T 100 2 (8)0.9931
Note: fcu,T is the cube compressive strength (Mpa) of SFSAC after high temperature. fcu is the cube compressive strength (Mpa) of SFSAC at normal temperature.
Table 7. Cube splitting tensile strength of all test blocks (MPa).
Number of Freezing and ThawingGroupsTemperature (°C)
20 °C200 °C400 °C600 °C800 °C
0SAC-03.132.802.411.570.92
0SAC-0.53.753.393.011.991.06
0SAC-1.04.313.923.532.431.25
0SAC-1.54.484.234.112.511.27
0NAC-07.186.174.632.941.53
0NAC-0.57.426.465.083.331.72
0NAC-1.07.866.935.413.621.84
0NAC-1.58.047.135.733.911.87
25SAC-01.971.751.350.870.49
25SAC-0.52.432.191.741.210.69
25SAC-1.02.792.572.111.520.88
25SAC-1.52.972.802.311.711.01
25NAC-04.163.672.591.530.55
25NAC-0.54.323.912.851.790.65
25NAC-1.04.584.193.211.970.70
25NAC-1.54.694.373.432.130.72
Note: The content of volcanic scoria and steel fiber in the table is volumetric contents.
Table 8. The fitting formulas for the cube splitting tensile strength of SFSAC.
Steel Fiber ContentSplit Tensile Strength Fitting FormulaR2
VSF = 0% f Lpt,T f Lpt = 1.028 0.07508 T 100 0.002996 T 100 2 (10)0.9957
VSF = 0.5% f Lpt,T f Lpt = 1.021 0.05930 T 100 0.004214 T 100 2 (11)0.9982
VSF = 1.0% f Lpt,T f Lpt = 1.015 0.04128 T 100 0.005860 T 100 2 (12)0.9989
VSF = 1.5% f Lpt,T f Lpt = 1.015 0.03107 T 100 0.006746 T 100 2 (13)0.9983
Note: fLpt,T is the cube splitting tensile strength (Mpa) of SFSAC after high temperature. fLpt is the cube splitting strength (Mpa) of SFSAC at normal temperature.
Table 9. Elastic modulus after freeze-thaw and then high temperature for each group of test blocks (GPa).
Characteristic
Index
Number of Freezing and ThawingGroupsTemperature (°C)
20200400600800
Ec (Gpa)0SAC-020.35816.39311.8806.3032.598
0SAC-0.520.82816.52111.9906.3972.667
0SAC-1.021.11617.17912.4866.1062.491
0SAC-1.520.76817.16112.0336.1712.475
0NAC-029.89821.82212.3703.9080.228
0NAC-0.530.77722.75812.7833.9500.289
0NAC-1.030.40022.19612.7883.6480.264
0NAC-1.530.79922.58612.9874.0510.250
25SAC-013.73510.3595.0072.6700.841
25SAC-0.513.86310.2885.1342.7910.769
25SAC-1.013.92510.5815.0012.7750.853
25SAC-1.514.17010.7185.1742.8500.809
25NAC-023.76516.2446.3822.1390.095
25NAC-0.524.50617.0206.6242.3360.046
25NAC-1.024.19516.6766.3672.1680.065
25NAC-1.524.29017.0826.5982.1950.071
Note: The results reported in the table are the average of the three measurements.
Table 10. Peak strain after freeze-thaw and then high temperature for each group of test blocks.
Characteristic
Index
Number of Freezing and ThawingGroupsTemperature (°C)
20200400600800
εcp0SAC-019112013273136305343
0SAC-0.521342267281937435473
0SAC-1.023202491292443275667
0SAC-1.524393127328147926191
0NAC-020132127357357278591
0NAC-0.522382395376959528863
0NAC-1.023852581386362629040
0NAC-1.525193312410466189365
25SAC-027312793346156128035
25SAC-0.528142982363759128173
25SAC-1.028733110371663158341
25SAC-1.529233536384270598917
25NAC-0224525313913686610,265
25NAC-0.5235328334285712011,263
25NAC-1.0250430714483769111,559
25NAC-1.5263234734694837112,007
Note: The results reported in the table are the average of the three measurements; the content of scoria and steel fiber in the table is volume content. The peak strain value is the median value in table ×10−6.
Table 11. Results of fitting of stress–strain curve parameters.
GroupsTemperature (°C)Shape Parameters
nR2αR2
SAC-0202.9810.994027.740.8937
SAC-02003.7990.996312.000.9480
SAC-040040.080.99549.5040.9379
SAC-06004.4520.99508.1780.9832
SAC-080013.330.99893.5770.9873
SAC-0.5204.3130.982310.810.9893
SAC-0.52007.3660.99046.7470.9714
SAC-0.540048.530.988218.720.9855
SAC-0.56003.5600.99609.6450.8588
SAC-0.580030.000.97933.6030.9660
SAC-1.0204.5080.980512.200.8185
SAC-1.02004.3120.99636.0380.9327
SAC-1.040029.340.95377.8760.9957
SAC-1.06003.9930.994313.660.9888
SAC-1.0800319.70.984010.310.9836
SAC-1.5203.9040.98484.9580.9150
SAC-1.52003.9410.977068.740.9517
SAC-1.540025.950.975318.000.8838
SAC-1.56004.6850.991226.680.9638
SAC-1.58006.6380.99223.8090.9828
Disclaimer/Publisher’s Note: The statements, opinions and data contained in all publications are solely those of the individual author(s) and contributor(s) and not of MDPI and/or the editor(s). MDPI and/or the editor(s) disclaim responsibility for any injury to people or property resulting from any ideas, methods, instructions or products referred to in the content.

